Association Veterinarian Workforce · Veterinarian Workforce ... Student commencements and ... The...
56
The Australian Veterinary Association Report on Projection Modelling for the Veterinarian Workforce Final Draft 12 December 2014
Transcript of Association Veterinarian Workforce · Veterinarian Workforce ... Student commencements and ... The...

The Australian Veterinary Association
Report on Projection Modelling for the Veterinarian Workforce
Final Draft
12 December 2014
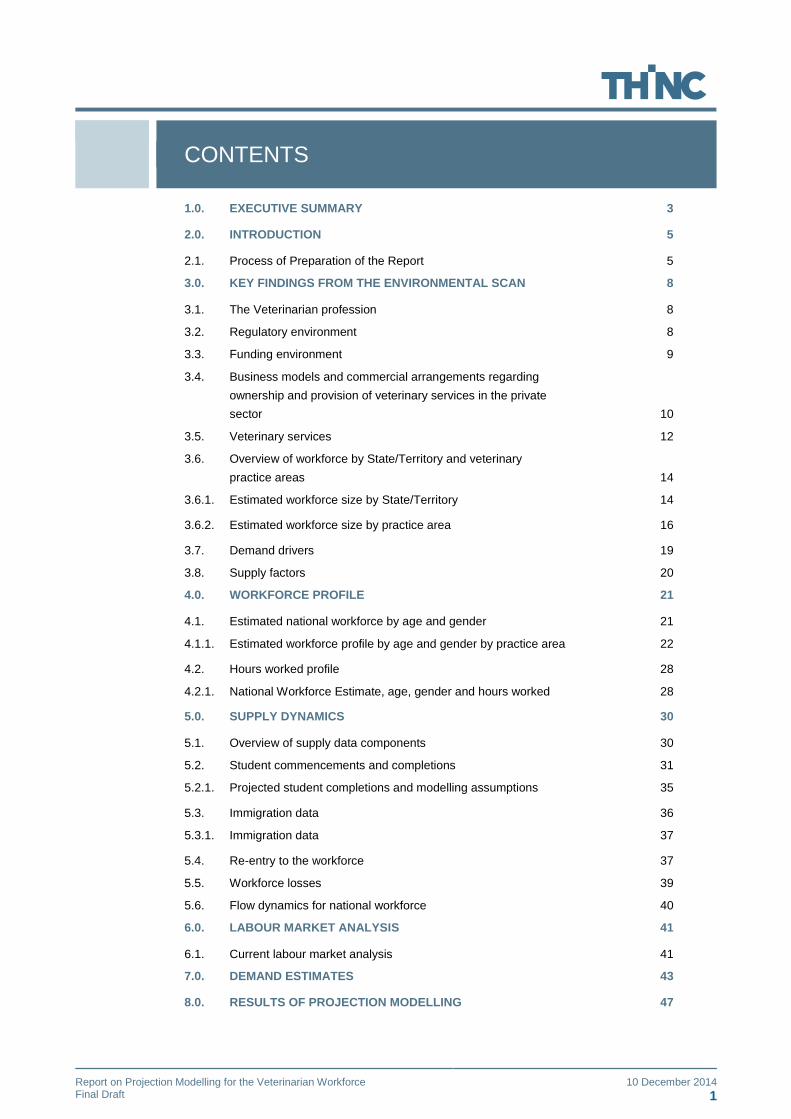
CONTENTS
Report on Projection Modelling for the Veterinarian Workforce 10 December 2014 Final Draft 1
1.0. EXECUTIVE SUMMARY 3
2.0. INTRODUCTION 5
2.1. Process of Preparation of the Report 5
3.0. KEY FINDINGS FROM THE ENVIRONMENTAL SCAN 8
3.1. The Veterinarian profession 8
3.2. Regulatory environment 8
3.3. Funding environment 9
3.4. Business models and commercial arrangements regarding
ownership and provision of veterinary services in the private
sector 10
3.5. Veterinary services 12
3.6. Overview of workforce by State/Territory and veterinary
practice areas 14
3.6.1. Estimated workforce size by State/Territory 14
3.6.2. Estimated workforce size by practice area 16
3.7. Demand drivers 19
3.8. Supply factors 20
4.0. WORKFORCE PROFILE 21
4.1. Estimated national workforce by age and gender 21
4.1.1. Estimated workforce profile by age and gender by practice area 22
4.2. Hours worked profile 28
4.2.1. National Workforce Estimate, age, gender and hours worked 28
5.0. SUPPLY DYNAMICS 30
5.1. Overview of supply data components 30
5.2. Student commencements and completions 31
5.2.1. Projected student completions and modelling assumptions 35
5.3. Immigration data 36
5.3.1. Immigration data 37
5.4. Re-entry to the workforce 37
5.5. Workforce losses 39
5.6. Flow dynamics for national workforce 40
6.0. LABOUR MARKET ANALYSIS 41
6.1. Current labour market analysis 41
7.0. DEMAND ESTIMATES 43
8.0. RESULTS OF PROJECTION MODELLING 47
CONTENTS
Report on Projection Modelling for the Veterinarian Workforce 10 December 2014 Final Draft 2
8.1. Results of national model 49
8.2. Output screens 49
8.2.1. Low scenario 49
8.2.2. Medium scenario 49
8.2.3. Medium scenario – average hours worked 50
8.2.4. High scenario 50
8.3. Output data 51
8.3.1. Low scenario 51
8.3.2. Medium scenario 52
8.3.3. High scenario 53
8.4. Summary of findings 54
8.5. Further data requirements 54

WORKFORCE PROFILE
Report on Projection Modelling for the Veterinarian Workforce 10 December 2014 Final Draft 3
1.0. Executive Summary
The Australian Veterinary Association Ltd (the “Association”, or AVA) commissioned Thinc Health for the development of
a projection modelling strategy and to undertake the projection modelling for the organisation. The future size and
structure of the workforce of registered vets, especially those in clinical practice, has emerged as a major issue of
concern for the profession (Porritt, D., 2013, p. 3). 1
The report includes the summary of the findings of an Environmental Scan which was a systematic approach to
collecting and analysing information relating to the workforce’s internal and external environment influencing the role and
practice of the veterinary profession. This process involved a literature review and conduct of telephone interviews with
key stakeholders. The report also provides a summary of the Technical Paper which was prepared to provide more
detailed analysis of current and historic supply and demand data, document assumptions supporting the projection
modelling and report on findings from the projection modelling including scenario projections.
One major finding from the study is that the workforce is estimated to have grown from 9,033 to 10,207 headcount from
2009 to 2013, a growth overall of 3.2% per annum on average, or 1,173 veterinarians. The calculation of workforce size
was based on minor adjustments to the primary registrations by States and Territory to account for workforce
participation rates. The largest workforce is in NSW in 2013 with an estimated 2,735 veterinarians (26.8% of national
workforce), followed closely by Victoria with 25.2% (2,573 headcount workforce) and Queensland with 23.8% (2,434
headcount workforce). The smallest workforce number are in the Northern Territory (121 headcount) and Tasmania (219
headcount).
The projection modelling was based on low, medium and high demand scenarios. The findings clearly show that the
national veterinarian workforce will be in major oversupply between 2012 and 2025 even if the demand level rises to as
high as 1.8% per annum, consistent with projected population and household growth. Supply exceeds demand by over
50% in all cases for the national workforce. The results of the projection modelling for future supply and requirements are
shown in the table below.
The definitions used are:
Large over supply: supply exceeds demand by greater than 50%
Over supply: supply exceeds demand by between 1 and 50%
Under supply: supply is less than demand by between 1 and 50%.
The only practice area where there is large oversupply for all three scenarios is for equine practice, although mixed
practice is in large over supply for low and medium demand scenarios, and in over supply for the high demand scenario.
1 Porritt,D., (2013) Australian Veterinary Workforce review report. Taverner Research & The Australian Veterinary Association Ltd.

WORKFORCE PROFILE
Report on Projection Modelling for the Veterinarian Workforce 10 December 2014 Final Draft 4
There are two practice areas where there is under supply in all demand scenarios; government services and other
services. Teach/research is in over supply in low and medium demand scenarios, but moves to under supply in the high
demand scenario where demand is assumed to occur at 3% per annum to allow for additional University courses. All of
the demand estimates are below the current rate of growth of the workforce, which is estimated at 3.2% per annum on
average between 2009 and 2013.
Two sensitivity scenarios were also undertaken for supply and workforce size. The first scenario was for a higher
wastage from the workforce than was estimated based on historical data. The second scenario covered the situation
where the workforce includes veterinarians who are not registered due to their role not requiring registration.
For the first sensitivity scenario, national workforce projections show that even with a doubling of wastage the workforce
is only under supplied until 2017 and then an oversupply occurs from 2018 onwards. Given that there is no anecdotal
evidence to support an under supply at present it is very unlikely that wastage has increased to this level and supply
would be sufficient by 2018 to account for a large increase in wastage (if it did occur) between 2014 and 2018.
The sensitivity analysis for the larger workforce size (a five percent increase) shows that the workforce will still be in an
oversupply with existing supply dynamics.
The projections show that for the majority of practice areas over supply will continue until 2025. The areas where there
may be opportunities for employment are government and other practice areas.
Scenario Low demand Medium demand High demand
National Large over supply Large over supply Large oversupply
National high wastage Undersupply to 2017,
oversupply 2018 to
2025
National larger
workforce
Large oversupply
Small animal Large over supply Over supply Over supply
Large
animal/production
Large over supply Over supply Over supply
Mixed practice Large over supply Large over supply Over supply
Equine Large over supply Large over supply Large over supply
Government Under supply Under supply Under supply
Teaching/research Over supply Over supply Under supply
Industry Over supply Over supply Over supply
Other Under supply Under supply Under supply
WORKFORCE PROFILE
Report on Projection Modelling for the Veterinarian Workforce 10 December 2014 Final Draft 5
2.0. Introduction
Thinc Health has been appointed by The Australian Veterinary Association Ltd (the “Association”, or AVA), for the
development of a projection modelling strategy and to undertake the projection modelling for the organisation. The future
size and structure of the workforce of registered vets, especially those in clinical practice, has emerged as a major issue
of concern for the profession (Porritt, D., 2013, p. 3). 2
2.1. Process of Preparation of the Report
The report has two supporting documents:
Environmental Scan
Technical Paper with Appendix of Projection Modelling Results
The process has included quantitative and qualitative data collection and analysis. The consultation process involved a
meeting with the Board members of The AVA and telephone interviews with key stakeholders. The list of key
stakeholders is included in Appendix 1.
The development of the Environmental Scan of the veterinary profession and its services has involved a systematic
approach to collecting and analysing information relating to the workforce or profession’s internal and external operating
environment or the internal and external environment that influences the role and practice of a workforce or profession.
The steps in developing the Environmental Scan included:
Knowledge and understanding of the external environment (Government policies and funding arrangements, the
regulatory environment);
Business models and commercial arrangements regarding ownership and provision of veterinary services in the
private sector;
Types of veterinary services;
Government and research organisations and their roles and responsibilities;
Educational authorities and the courses offered;
Demand drivers for the workforce;
Current workforce characteristics;
Analysis of current workforce data & relevant data sources; and
Potential sources of risk in undertaking modelling and relevant to analysing the findings.
For planning purposes, it is important to determine whether the present workforce is adequately meeting population and
service requirements (as defined by health needs of the animal population and areas of unmet need) or whether a
shortage or excess or maldistribution situation applies. This evaluation is then incorporated into the workforce modelling
2 Porritt,D., (2013) Australian Veterinary Workforce review report. Taverner Research & The Australian Veterinary Association Ltd.

WORKFORCE PROFILE
Report on Projection Modelling for the Veterinarian Workforce 10 December 2014 Final Draft 6
process. Assessing current workforce requirements means identifying whether a profession or workforce is operating
effectively to meet service needs and where problems or areas for improvement are already known. This assessment
provides a basis for considering what the profession will be doing in the future and what skills will be needed.
Therefore the environmental scan was designed to address these questions and determine the environmental issues that
are currently driving the supply of and demand for veterinarians and to what extent they will play that role in the future.
The Environmental Scan was prepared to be one component of the documentation that supported the workforce
planning process for the profession including the development of workforce projections and scenarios for balancing
supply and demand.
Another paper, the “Technical Workforce Modelling Paper for the Veterinary Workforce” was prepared to provide more
detailed analysis of current and historic supply and demand data, document assumptions supporting the projection
modelling and report on findings from the projection modelling including scenario projections.
Appendix 1 of the Technical Paper provides comprehensive diagrams of the results of the modelling for the period 2012
to 2025 on baseline supply and demand, demand assumptions, average hours worked, age and sex profile, graduate
numbers, workforce profile, migration and re-entry to the workforce and wastage from the workforce. The diagrams for
the national model have been included in this report.
2.2. Definitions of Workforce Planning
The most common definition of workforce planning is:
“having the right people, in the right place, with the right capabilities at the right time”.(WHO, 2004).
The process can be described as follows:
“Workforce planning typically examines the current state, the desired future state and identifies ways of dealing
with gaps that emerge between the two” (Mercer College, 2009, p.16)3.
The Mercer College Guide provides a workforce planning framework which describes the steps in the process as shown
below.
3 Mercer College (2009). Workforce Planning– Facilitator’s Guide. Department of Premier and Cabinet, New South Wales Government.
Retrieved 28 August from the World Wide Web:
http://www.dpc.nsw.gov.au/__data/assets/pdf_file/0005/54716/Workforce_planning_training_-_Facilitators_Guide.pdf

WORKFORCE PROFILE
Report on Projection Modelling for the Veterinarian Workforce 10 December 2014 Final Draft 7
Diagram 1: Workforce Planning Framework
The definition of the components of modelling future supply and demand are as follows:
“Supply forecasting is the process of calculating the likely future supply of current employees with a particular skills set “. (Mercer College, p.18)
“Demand forecasting is the process of calculating the future demand for employees with a particular skills set, to meet future service delivery requirements”. (Mercer College, p.19)

WORKFORCE PROFILE
Report on Projection Modelling for the Veterinarian Workforce 10 December 2014 Final Draft 8
3.0. Key findings from the Environmental Scan
3.1. The Veterinarian profession
The Higher Education Base Funding Review (CVDANZ, n.d.) 4 reports that “veterinary science is the application of
medical, diagnostic, prophylactic and therapeutic principles to companion, domestic, exotic, wildlife, and production
animals. Veterinary science is vital to the study and protection of animal production, provision of herd health and
monitoring and preventing the spread of disease. It requires the acquisition and application of scientific knowledge in
multiple disciplines and uses technical skills to manage disease prevention in both domestic and wild animals” (p.8)
The review by the Council of Veterinary Deans of Australia and New Zealand (CVDANZ) identifies the importance of the
veterinary role in ensuring human health through treatment and prevention of disease in animals. The role of
veterinarians in Australian society often covers multiple sectors and responsibilities including practice and care for the
health, wellbeing and welfare of pets and production animals, roles in in academia and also in industry as biomedical
scientists investigating basic and applied aspects of human and animal disease. Veterinarians have a significant role in
public service, “Many veterinarians enter public service to secure the safety and wholesomeness of human food and
safeguard animal industries by preventing incursions of exotic diseases, or work to prevent the spread of diseases from
animals to humans”. (p. 4)
The Australian Workforce and Productivity Agency has nominated veterinarians as one of the ‘specialised occupations’
that should be the focus of national planning. Veterinarians are on the Specialised Occupations List in recognition of their
high value to Australian economy and community and because their skills take a long time to develop and acquire. As
the labour market is not able to adjust quickly there is a potential for market failure.
3.2. Regulatory environment
The veterinary workforce is regulated by eight Veterinary Boards in Australian States and Territories whose major roles
are to:
Register appropriately qualified persons as veterinarians and veterinary specialists and provide a public roll
recording those persons;
Ensure that the interests of the public and the welfare of animals in each jurisdiction are protected;
Conduct inquiries as required to ensure that professional standards of practice are maintained; and
Provide advice to government agencies and interest groups.
Health professions are regulated by the Australian Health Practitioner Regulation Agency (AHPRA). AHPRA's operations
are governed by the Health Practitioner Regulation National Law, as in force in each state and territory (the National
Law), which came into effect on 1 July 2010. This law means that fourteen health professions are now regulated by
4 Council of Veterinary Deans of Australia and New Zealand (n.d.). Higher Education Base Funding Review. Unpublished document.
WORKFORCE PROFILE
Report on Projection Modelling for the Veterinarian Workforce 10 December 2014 Final Draft 9
nationally consistent legislation under the National Registration and Accreditation Scheme. AHPRA also conducts
national annual workforce surveys for each of the registered health professions.
While these changes have not occurred for the regulation of the veterinary profession, there have been developments to
standardise the roles and functions of each of the jurisdictional Boards. An initial review of annual reports from the States
and Territories identified major differences in the level of reporting of registration data and workforce survey data.
3.3. Funding environment
In 2001 the Australian Bureau of Statistics reported that the veterinary industry contributed $549 million to gross
domestic product (GDP) and by 2007 this had increased to $681 million. (NAB Health, 2009, p.5)5 Animal Health Alliance
(2013) report that the pet care industry is estimated to be worth $8.0 billion annually (p. 12). Veterinary services were
estimated to account for 21% or $1,650 million of that expenditure in 2012-13. (p. 40) 6
The provision of insurance to fund the provision of private veterinary services is discretionary, based on a user-pays
system and not supported by government funding. Therefore income to practices is dependent on the performance of the
broader economy and capacity to pay for the services. Therefore the concept of demand should be interpreted as
“economic demand”, which reflects consumers’ willingness to pay for veterinary services given the price of services.
There is evidence from the recent report by the Animal Health Alliance of Australia (2013) that the popularity of pet
insurance is increasing, but varies by generation within the population.7
While there are views that “need” should be based on expert clinical judgement of the care required, animal owners may
not be willing to pay for such services at prevailing prices or may be unaware of the need for such services. This results
in unmet demand. An example of this lack of translation into effective demand is the provision of preventative services
such as vaccinations and medications to prevent parasitic infestation. (American Veterinary Medical Association, 2013,
p. 3)8
Baguley, J. (2011) has analysed the demand for and revenue from companion animal veterinary services between 1996
and 2026 and shown that revenue growth has been much stronger than demand growth. Therefore pet ownership trends
are the most important factor in determining the potential demand for and revenue from companion animal veterinary
services (p. 352). 9 Baguley concluded that the market for companion animal veterinary services in Australia is mature
5 National Australia Bank Health (2009). The changing face of the healthcare industry; a special report on the veterinary sector by NAB
Health. 6 Animal Health Alliance (2013). Pet Ownership in Australia. 7 Ibid. (p. 12). 8 American Veterinary Medical Association (AVMA) (2013). 2013 U.S. Veterinary Workforce Study: Modelling Capacity Utilisation. The
Centre for Health Workforce Studies, School of Public Health, University of Albany, N.Y. 9 Baguley, J. (2011). An analysis of the demand for and revenue from companion veterinary services in Australia between 1996 and
2026 using industry revenue data and household census and pet ownership data and forecasts. Australian Veterinary Journal, Vol.89, No. 9., September.
WORKFORCE PROFILE
Report on Projection Modelling for the Veterinarian Workforce 10 December 2014 Final Draft 10
and that growth in demand is expected to remain low over the forecast period to 2026. As a result, for most veterinary
practices within this environment, growth in revenue will be a function of growth in average client fees.
NAB Health also reported that there was a 41% increase in average income for vets between 1996 and 2006, increasing
to $61,464 by 2006. Male vets earned on average $71,552 and females $50,908. Access Economics examined ten
medical professions (dentists, pharmacists, veterinarians, general practitioners and six medical specialties) and rated
vets the fourth highest paid, after general practitioners, dentists and pharmacists (as quoted in NAB Health, p. 7).
The variation in income levels by gender is attributable to employee status (where the large majority of female
veterinarians are employees; the fact that females are more likely to work part time (38% compared to 15% of male vets)
and the fact that men are much more likely to own a veterinary practice than women (78% for males and 36% for
females (NAB Health, p. 7). These figures also vary by length of time since graduation and city versus country location of
practice.
There is evidence from the Australian Veterinary Association (2013) to suggest that the veterinary starting salary has
fallen significantly against other professions (from 6th rank in 1996 to 20th rank in 2012). (Source: Graduate Careers
Australia, starting salary for graduates less than 25 years and in first full time employment)10 . The Skilled Occupation
List data in the annual review indicated that median annual university graduate earnings for veterinarians four months
after completion were $45,000 compared to $56,000 for university graduates working full time as professionals. (Source:
Graduate Careers Australia, 2011 as quoted in Skilled Occupation List, No. 2347))11
There are multiple studies which also report that the number of veterinarians working in the government or public sector
is decreasing in areas such as disease surveillance and field veterinarians monitoring and responding to livestock
diseases (Heath, 2008, AVA, 2013). This suggests decreased funding for these services, although this analysis is not
based on an analysis of actual government expenditure figures.
3.4. Business models and commercial arrangements regarding ownership and provision of veterinary
services in the private sector
Baguley (2011) reports that veterinary services that provide services to companion animals contribute approximately
83% of total veterinary service industry revenue (Australian Bureau of Statistics, 2001, as cited in Baguley, J. (2011), p.
352). His analysis also reveals that any significant growth in industry profitability in Australia will be based on increased
pet ownership, increased fees and/or decreased costs rather than organic growth. His view is that profitability is of
particular concern to the Australian industry, because of poor returns to veterinary practice owners and the comparatively
low veterinary graduate starting salaries (p. 358).
10 Australian Veterinary Association (2013) Review of the demand-driven funding system, Submission from the AVA Ltd.
Graduate earnings as retrieved from World Wide Web: http://www.graduatecareers.com.au/ 11 Graduate Careers Australia (2011) .Australian Graduate Survey.

WORKFORCE PROFILE
Report on Projection Modelling for the Veterinarian Workforce 10 December 2014 Final Draft 11
Baguley also discusses market sensitivity to pricing levels. The author argues that increases in fees will result in
increased revenue from some pet-owning segments (defined as price inelastic) and decreased revenue from other pet
owning segments (price elastic). He foresees the potential for a shift in market segmentation with fewer households but
more willingness to pay for new, highly priced services and products created by technological innovations.
Animal Health Alliance in their report on Pet Ownership in Australia (2013) provided information to support the view that
despite periods of weak consumer confidence, pet owners have not been prepared to economise on pet care, and
therefore expenditure has a level of resilience in the market place. The reports indicates that prioritisation of pets has
also led to the growth of new and emerging products and services in the pet care sector. This includes pet insurance,
alternative healthcare, hotels catering for pets and spas and pet massage (p. 26).
However international studies such as the one undertaken by the American Veterinary Medical Association (AMVA)
indicate that there is excess national capacity for veterinary services in private clinical practice, with their analysis
indicating 17% excess capacity under certain assumptions. This was estimated to be highest for equine practice (23%
excess capacity) followed by small animal (18%), food animal (15% and mixed practices (13%). These estimates allowed
for the fact that 42% of veterinarians who reported on the capacity status of their practice reported that their practice was
already working at full capacity. 12
In terms of ownership arrangements, there have been changes made to ownership arrangements which Baguley (2011)
reports may facilitate industry consolidation (p. 359). His argument is that industry consolidation has the potential to
achieve cost efficiencies through economies of scale. There are direct parallels with the market for medical general
practice in Australia where the number of practices has continued to decline nationally over an extended period.
(Note: The Summary Data Report of the 2011-2012 Annual Survey of Divisions of General Practice (Carne, 2013)13 is
the most recent source of information on general practices and the most recent comprehensive estimate of general
practices was 7,035 practices in 2010/11 (p. 7). The report documents the longitudinal declining trend in the total number
of practices nationally from 2000- 01 to2010-11 (from 8,309 practices to 7,035 practices), while there has been growth in
the number of general practitioners overall. (p. 7)
12 Op. cit. p. 14. 13 Carne, A. (2013). Summary Data Report of the 2011-2012 Annual Survey of Divisions of General Practice. Adelaide: Primary Health
Care Research and Information Service and Australian Government Department of Health and Ageing.

WORKFORCE PROFILE
Report on Projection Modelling for the Veterinarian Workforce 10 December 2014 Final Draft 12
3.5. Veterinary services
There has been a comprehensive review of employment patterns of veterinary graduates by Heath, T. J. (2005a, 2005b)
14 15and number, distribution and concentration of Australian veterinarians between 1981 and 2006 (Heath, 2008).16
The two studies published in 2005 were based on the results of surveys sent to about 100 veterinarians who graduated
in or about each of the decades from 1950 to 2000. The response rate was 68% (420 out of 615 mailed questionnaires).
Overall, Heath found that over the last five decades from 1950 to 2000 that the average recent graduate has had
progressively more opportunity for support and advice from other veterinarians, to work more sociable hours, and to work
with a narrower range of species, especially dogs and cats (2005a, p. 626). There is an increasing dependence on cats
and dogs by recently-graduated veterinarians. (2005b, p. 750)
Heath’s analysis of employment trends has shown the following changes over the period:
There was a different employment pattern for graduates of 1950 and 1960, where about half of graduates were
employed in their first position in government service, with financial support provided by Departments of Agriculture
(or equivalent) in the home state as cadetships. With the phasing out of cadetships the number entering government
service decreased to 27% in 1970, and to only two percent in 1980 and later years. Almost half of those who started
in government departments then moved to mixed practice in the main over the following decade;
From 1970 and more recently there has been an increasing proportion of graduates employed in small animal
practice, followed by mixed practice. Almost all graduates were initially in private practice, with about half in mixed
practices, and the majority of those working as employees;
Accompanying this shift in employment following graduation, there has been a major decline in the proportion of
graduates seeing cattle. Some 39% of graduates from 1970 saw cattle as part of their caseload compared to an
average of 19% for the 1990 graduates. By the tenth year of work for the 1990 graduates only eight percent included
cattle in their caseload. By 2000 only one-tenth of the work of the 1990 cohort was made up of production animals,
with about eighty precent seeing dogs and cats;
The proportion of the 2000 graduate cohort in mixed practice declined from 59% to 36% within three years. Heath
believes that continuation of this trend will result in further difficulties for principals seeking to retain veterinarians,
especially those with experience, for their rural practices;
There were significant differences between genders in the percentages working in mixed practice, small animal
practice, government service and other career paths immediately after graduation and ten years later. There were
higher percentages of males in mixed practice and higher percentages of females in small animal practice, in each
of the ten years after graduation;
14 Heath, T.J. (2005a) Recent veterinary graduates over the last five decades: initial career experiences. Australian Veterinary Journal. Vol 83, No. 10, October. p. 626-632. 15 Heath, T.J. (2005b) Recent veterinary graduates over the last five decades: the first ten years. Australian Veterinary Journal. Vol 83,
No. 12, December. p. 746-750. 16 Heath, T.J. (2008) Number, distribution, and concentration of Australian veterinarians in 2006, compared with 1981, 1991 and 2001. Australian Veterinary Journal. Vol. 86, No. 7. July. p. 283-289..

WORKFORCE PROFILE
Report on Projection Modelling for the Veterinarian Workforce 10 December 2014 Final Draft 13
Ownership of practices changed over the period with all 1950 graduates in private practice after ten years being sole
owners (62%) or part owners (38%). Fewer than half of those who graduated in 1990 were sole (17%) or part (30%)
owners of their practices, with many employed or working as practice associates. Some eight percent of these 1990
graduates were employed to manage practices. This trend is also influenced by gender, with males twice as likely to
be sole (52%) or part owners (32%) ten years after graduation (totally 84%) compared to females at 40% (16% sole,
24% part-owners);
There have also been major changes in the career pathways by location of work over the decades. For each of the
cohorts of 1950, 1970, and 1990 there has been a pattern of movement from location in towns at the
commencement of the decade to higher proportions in cities by the end of the decade. The major change has been
the percentages remaining in country towns after ten years (46% for 1950 graduates, 26% for 1990 graduates) (see
Figure 1 below).
Graph 1: Percentage of graduates of 1950, 1970 and 1990 who were working in towns of <10,000 people in each
of the first ten years after graduation
Source: As reproduced from Health, 2005b: Figure 4, p. 748
Heath has shown that there have been changes in the caseload associated with horses; from ten percent of the
caseload for 1950 graduates in both the first and tenth years to 14% for 1990 graduates halving to seven percent by
the tenth year. Heath indicates that relevant factors may include that there has been a decrease in the amount of
horse work generally in mixed practices, an increase in female veterinarians who on average work more with small
animals and less with horses (and production animals) than males, the exodus from mixed practice, the economic
climate affecting horse owners and the increasing role of non-veterinarians into equine veterinary practice.
Heath has also documented changes in the role and function of veterinarians together with the decline in the
proportion seeing production animals; including increases in parvovirus and kennel/canine cough, increases in skin
WORKFORCE PROFILE
Report on Projection Modelling for the Veterinarian Workforce 10 December 2014 Final Draft 14
conditions for canines, decreases in trauma for canines related to motor vehicle accidents, increases in the removal
of lumps and repair of lacerations for canines; and changes in anaesthetic procedures (Heath, 2005a).
3.6. Overview of workforce by State/Territory and veterinary practice areas
The AVMA study (2013) in developing their Veterinary Workforce Model, prepared forecasts for pet ownership and food
animal populations, demand for veterinary services, and the derived demand for veterinarians through to 2025 by
employment sector. The demand projections were developed at State level for the small animal, equine and food animal
sectors, but calculated at the national level for industry, academia, government, and the “other” employment due to lack
of state-level data and the regional nature of these employment sectors (p. 37).
This study has developed the concept of practice areas within veterinary services delivered by veterinarians and practice
areas are defined as the area of veterinary practice where veterinarians work the majority of their time for most practice
areas, with further specific definitions in section 3.6.2.
The most important sources of data on the headcount workforce size, gender, age, hours worked and range of practice
areas where veterinarians work, including:
annual Veterinary Registration Board survey data collected by some States and Territories;
Registration Board data on registrations, renewals, new registrations and deletions from the register as well as
primary registrations and secondary registrations;
results of the 2012 workforce survey conducted by the AVA; and
ABS 2011 Census data.
3.6.1. Estimated workforce size by State/Territory
The following table and graph shows the estimated workforce size by year and State/Territory. The estimates show a
growth overall of 3.2% per annum on average between 2009 and 2013, from 9,033 to 10,207; or 1,173 veterinarians.
These estimates show an estimated growth for every State Territory over the period, with the highest growth of 7.2% per
annum in Tasmania, and the lowest of 1.3% in Queensland. The workforce for the four States/Territories where the
workforce could be calculated from Board surveys is estimated to be 65% of the total in 2009 and 64.9% in 2013.
The largest workforce is in NSW in 2013 with an estimated 2,735 veterinarians (26.8% of national workforce), followed
closely by Victoria with 25.2% (2,573 headcount workforce) and Queensland with 23.8% (2,434 headcount workforce).
The smallest workforce number are in the Northern Territory (121 headcount) and Tasmania (219 headcount).

WORKFORCE PROFILE
Report on Projection Modelling for the Veterinarian Workforce 10 December 2014 Final Draft 15
Table 1: Estimated veterinarian workforce by State/Territory, 2009 to 2013
Estimates of workforce size Trends 2009 to 2013 Percentage by State
2009 2010 2011 2012 2013 Var. % Var. % Var. p.a.
% of national workforce 2009
% of national workforce 2013
NSW 2379 2447 2517 2642 2735 356 15.0% 3.7% 26.3% 26.8% VIC 2233 2401 2371 2395 2573 340 15.2% 3.8% 24.7% 25.2% WA 1089 1121 1141 1215 1258 169 15.5% 3.9% 12.1% 12.3% TAS 170 184 176 214 219 49 28.8% 7.2% 1.9% 2.1%
Sub Total 4 States 5871 6153 6205 6466 6785 914 15.6% 3.9% 65.0% 66.5%
QLD 2313 2391 2545 2426 2434 121 5.2% 1.3% 25.6% 23.8% SA 514 549 585 603 616 102 19.9% 5.0% 5.7% 6.0% ACT 231 267 252 251 251 20 8.5% 2.1% 2.6% 2.5% NT 104 113 115 115 121 17 16.0% 4.0% 1.2% 1.2%
Sub Total other States 3162 3321 3497 3394 3422 260 8.2% 2.1% 35.0% 33.5%
National total 9033 9473 9701 9860 10207 1173 13.0% 3.2% 100.0% 100.0%
Graph 2: Estimated veterinarian workforce by State/Territory, 2005 to 2014
NSW VIC WA TAS QLD SA ACT NT
2009 2379 2233 1089 170 2313 514 231 104
2010 2447 2401 1121 184 2391 549 267 113
2011 2517 2371 1141 176 2545 585 252 115
2012 2642 2395 1215 214 2426 603 251 115
2013 2735 2573 1258 219 2434 616 251 121
0
500
1000
1500
2000
2500
3000
Esti
mat
ed
wo
rkfo
rce
siz
e b
y St
ate
/Te
rrit
ory

WORKFORCE PROFILE
Report on Projection Modelling for the Veterinarian Workforce 10 December 2014 Final Draft 16
3.6.2. Estimated workforce size by practice area
The definition of each practice area based on the categories developed for the AVA 2012 survey was as follows:
Small animals included the categories of companion animals and reptiles/ pocket animals
Veterinarians working in the equine industry were allocated to the category “equine” if they worked 90% or more of
their total hours in the equine area;
Large/production animals included beef, camelids, dairy, deer, goats, sheep, pigs and goats where more than fifty
percent of total hours worked were with one or more of those large animals, as well as > 50% to 89% of time with
horses;
Mixed practice included less than 50% of hours worked with large animals, as well as small animals
Industry included industry and pharmaceuticals;
Government included government roles and meat inspection based on 50% and over of time in those areas, and
was cross checked with current primary employment and current role to ensure the allocation was consistent with
those selections;
Teaching and research were combined based on 50% and over of time in those areas, and cross checked with
current primary employment and current role to ensure the allocation was consistent with those selections; and
“Other” included areas such as aquaculture, animal welfare, avian, pathology, poultry, reproduction, wildlife, hobby
farms, consultancy practice and practice management where more than fifty percent of time was spent in those roles
as values were small for individual responses from the survey. This category also included “various” and “other”.
The following table shows the data from the States where data was available from the Annual Surveys conducted by the
Veterinary Registration Boards. By 2013, this represents virtually two thirds or 66.5% of the total national workforce. Two
options were developed for the national profile by practice area:
Option 1 using the AVA survey data by practice area extrapolated to the national workforce size;
Option 2 using the 66.5% known practice area data, extrapolated to the national workforce size (unknown equals
known).
Option 1 resulted in estimates of mixed practice and large animal practice which were too low based on the analysis.
Option 2 was the preferred method as it is based on known responses of two thirds of the estimated workforce. However
there could be a level of error in the allocation if the States/Territories without data have a significantly different profile by
practice area.
The trends in the table below show that the total workforce for those four States grew by 3.9%, higher than the estimated
growth of the national workforce of 3.2%. Largest growth for those four states was for small animal practice, with an
annual average growth of 6.1%, followed by teaching /research with 5.2%. Equine practice showed a minor contraction
with an average annual change of -0.6% per annum.
WORKFORCE PROFILE
Report on Projection Modelling for the Veterinarian Workforce 10 December 2014 Final Draft 17
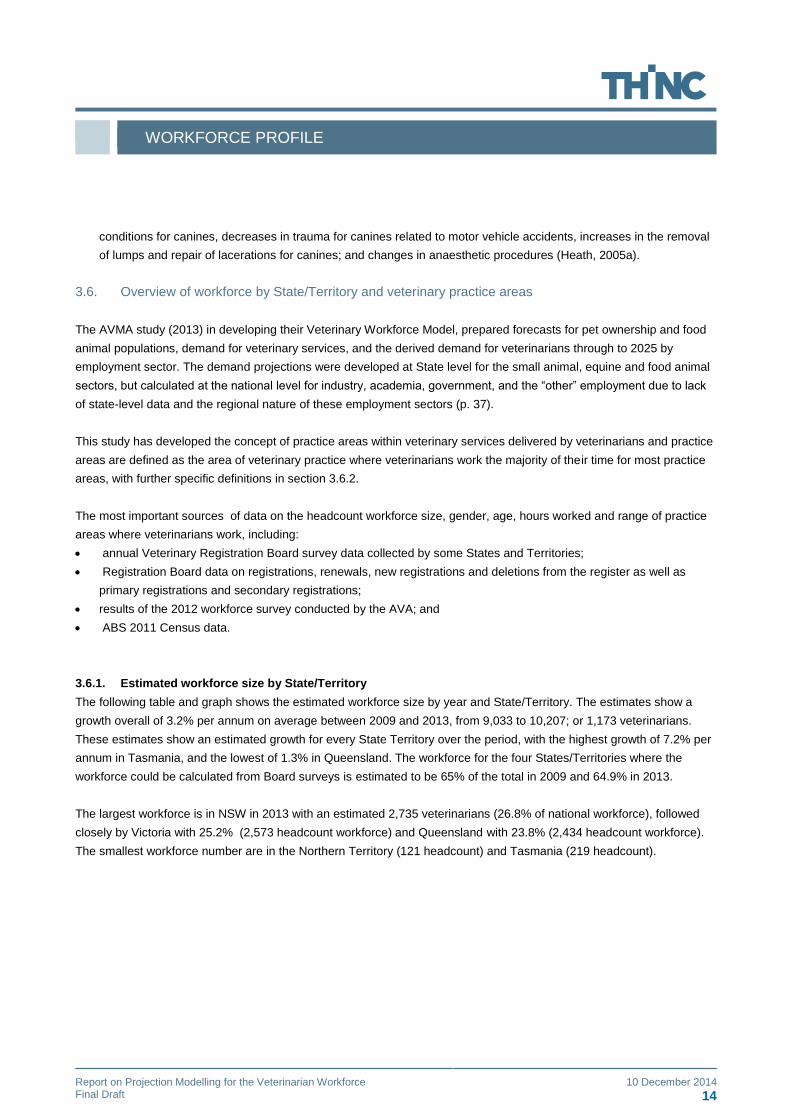
Table 2: Workforce by practice area, Veterinary Registration Board survey data, States/Territories, 2009 to 2013
Practice area, Victoria, NSW, Tasmania & WA
2009 2010 2011 2012 2013
Var. % Var. % Var. p.a.
Small animal practice 2844 3027 3102 3199 3532 688 24.2% 6.1%
Large animal practice 221 241 212 233 234 13 6.0% 1.5%
mixed practice 1327 1370 1381 1396 1418 91 6.9% 1.7%
equine practice 322 344 319 327 314 -8 -2.4% -0.6%
sub total private practice 4714 4981 5014 5155 5499 785 16.7% 4.2%
State & Commonwealth Gov't 284 272 301 291 324 40 14.2% 3.5%
Teaching/research 349 365 358 384 422 73 20.9% 5.2%
Industry 143 148 150 168 168 24 17.1% 4.3%
Other 381 385 381 468 372 -9 -2.4% -0.6%
Total 5871 6153 6205 6466 6785 914 15.6% 3.9%
Estimated national workforce 9033 9473 9701 9860 10207 1173 13.0% 3.2%
% of national workforce 65.0% 64.9% 64.0% 65.6% 66.5%
Source: Veterinary Registration Board Survey data, Annual Reports
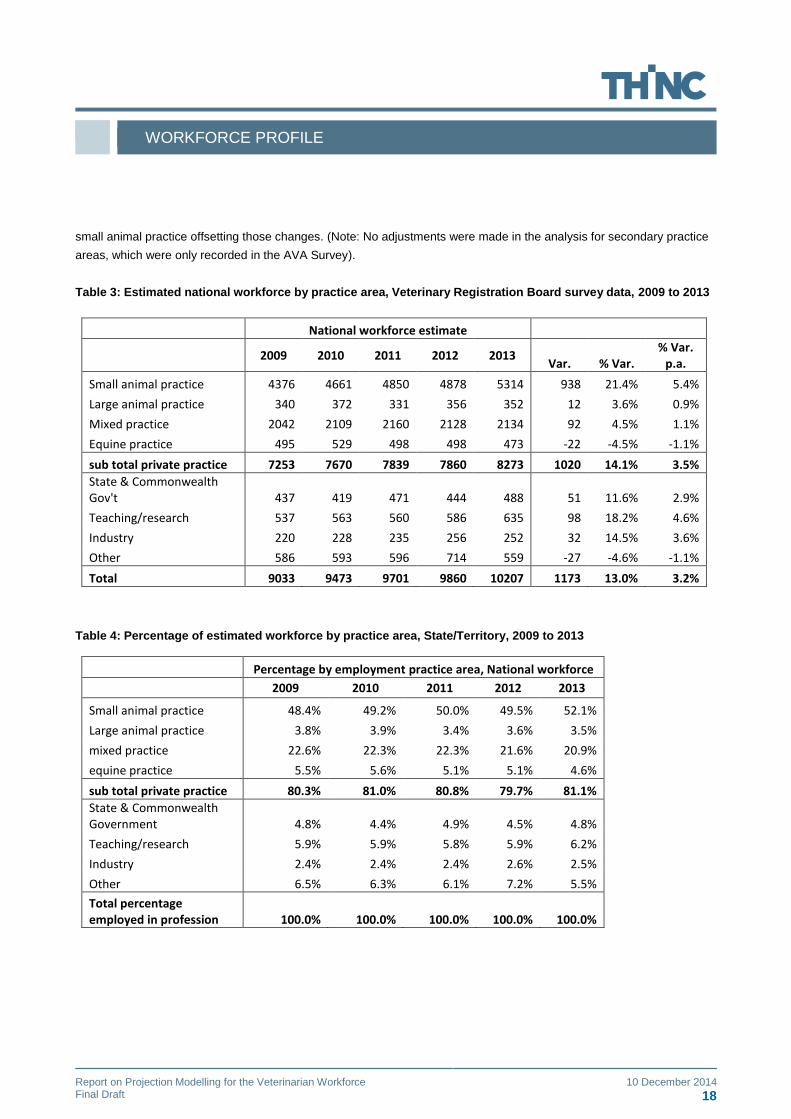
The following two tables and graph show the estimated distribution of the national workforce by practice area based on
Option 2, with small animal practice accounting for 5,314 veterinarians or 52.1% of the workforce by 2013. Mixed
practice accounted for 2,134 veterinarians or 20.9% of the workforce. The smallest practice area is industry, accounting
for an estimated 252 veterinarians or 2.5% by 2013.
The trend data shows that small animal practice grew at the highest rate, of 5.4% on average per annum. This is
followed by teaching/research, where the workforce grew by 4.6% on average per annum. This is consistent with the
opening of additional University courses over the period. Equine practice shows a decrease of 1.1% per annum, as does
the “other” areas of practice. Private practice is estimated to be growing at the rate of 3.5% per annum in total, with large
animal practice and mixed practice showing lower rates of growth (0.9% and 1.1%) than small animal practice.
As a result of these changes over the period, small animal practice accounts for over half of the workforce by 2013
(52.1%), followed by one in five working in mixed practice (20.9%), two areas with just over five percent each (teaching/
research with 6.2%, other with 5.5%), State and Commonwealth government and equine practice between four and five
percent each (4.8% and 4.6% respectively) and then other areas between two and four percent (large animal practice at
3.5% and industry at 2.5%).
Private practice accounts for over four in five of the workforce by 2013 at 81.1% by 2013. However there is a decline in
the proportion of large animal practice, mixed practice and equine practice between 2009 and 2013, with the growth in
WORKFORCE PROFILE
Report on Projection Modelling for the Veterinarian Workforce 10 December 2014 Final Draft 18
small animal practice offsetting those changes. (Note: No adjustments were made in the analysis for secondary practice
areas, which were only recorded in the AVA Survey).
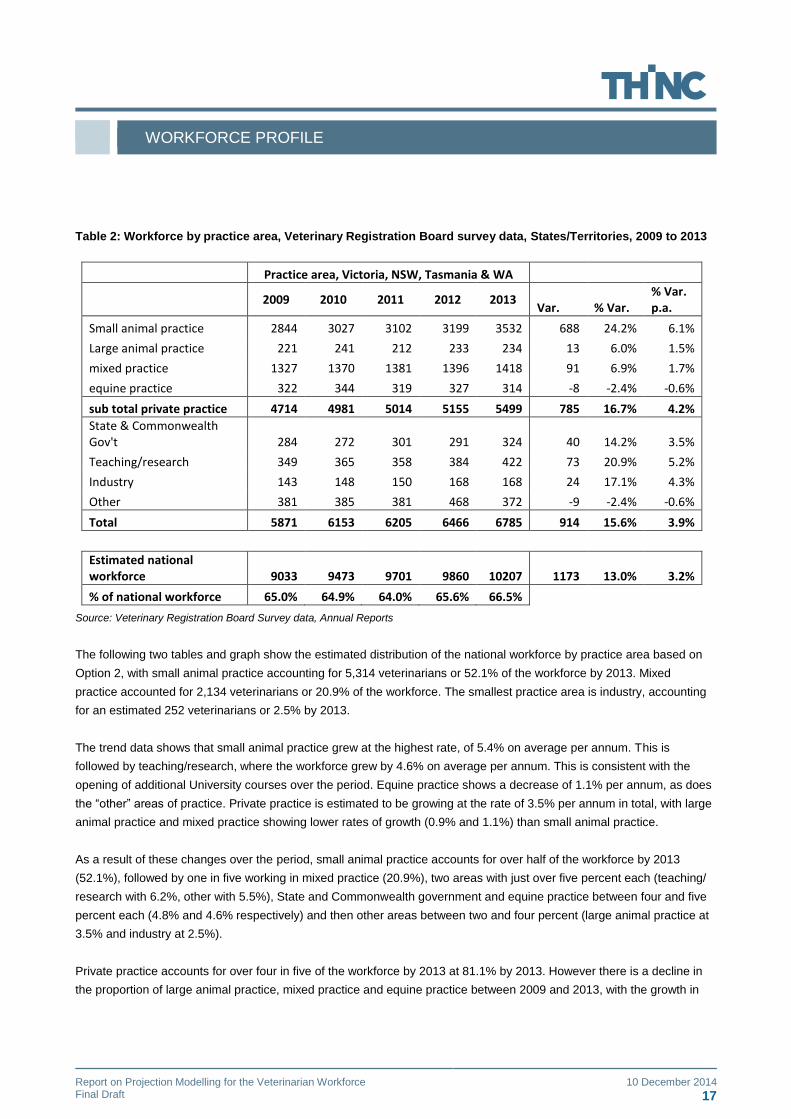
Table 3: Estimated national workforce by practice area, Veterinary Registration Board survey data, 2009 to 2013
National workforce estimate
2009 2010 2011 2012 2013
Var. % Var. % Var.
p.a.
Small animal practice 4376 4661 4850 4878 5314 938 21.4% 5.4%
Large animal practice 340 372 331 356 352 12 3.6% 0.9%
Mixed practice 2042 2109 2160 2128 2134 92 4.5% 1.1%
Equine practice 495 529 498 498 473 -22 -4.5% -1.1%
sub total private practice 7253 7670 7839 7860 8273 1020 14.1% 3.5%
State & Commonwealth Gov't 437 419 471 444 488 51 11.6% 2.9%
Teaching/research 537 563 560 586 635 98 18.2% 4.6%
Industry 220 228 235 256 252 32 14.5% 3.6%
Other 586 593 596 714 559 -27 -4.6% -1.1%
Total 9033 9473 9701 9860 10207 1173 13.0% 3.2%
Table 4: Percentage of estimated workforce by practice area, State/Territory, 2009 to 2013
Percentage by employment practice area, National workforce
2009 2010 2011 2012 2013
Small animal practice 48.4% 49.2% 50.0% 49.5% 52.1%
Large animal practice 3.8% 3.9% 3.4% 3.6% 3.5%
mixed practice 22.6% 22.3% 22.3% 21.6% 20.9%
equine practice 5.5% 5.6% 5.1% 5.1% 4.6%
sub total private practice 80.3% 81.0% 80.8% 79.7% 81.1%
State & Commonwealth Government 4.8% 4.4% 4.9% 4.5% 4.8%
Teaching/research 5.9% 5.9% 5.8% 5.9% 6.2%
Industry 2.4% 2.4% 2.4% 2.6% 2.5%
Other 6.5% 6.3% 6.1% 7.2% 5.5%
Total percentage employed in profession 100.0% 100.0% 100.0% 100.0% 100.0%
WORKFORCE PROFILE
Report on Projection Modelling for the Veterinarian Workforce 10 December 2014 Final Draft 19
Graph 3: Estimated workforce by practice area, State/Territory, 2009 to 2013
3.7. Demand drivers
The overview of the veterinarian profession and key demand issues has identified the complexity of the veterinary
workforce for the purposes of workforce modelling. The Environmental Scan indicates that there have been major
changes in the funding and organisational arrangements for veterinary services, including the composition of the types of
veterinary practice, business models and commercial arrangements regarding ownership of private practices and the
government funding and delivery of government services. There are major changes occurring in key demand factors
such as levels of pet ownership, the provision of rural services and services to the equine industry, as well as changes in
the roles performed by veterinarians, together with increasing roles for paraprofessionals.
The study conducted by Baguley ( 2011)17 was the most definitive study reviewed for the Environmental Scan regarding
projected demand for the veterinarian profession, and this study was limited to the demand for and revenue from
companion animal veterinary services in Australia. Baguley concluded that the market for companion animal veterinary
services is a mature market and that growth in demand is expected to remain low over the forecast period from 1996 to
2026. 18 His conclusion is that the companion animal industry in Australia is likely to grow in real terms by around 1.2%
over the next 10-15 years (p. 359). However he also highlights demand factors which could limit the translation of this
demand growth into similar growth in demand for veterinarians, which includes factors such as a change in the skills mix
17 Baguley, J. (2011). An analysis of the demand for and revenue from companion veterinary services in Australia between 1996 and
2026 using industry revenue data and household census and pet ownership data and forecasts. Australian Veterinary Journal, Vol.89, No. 9., September. 18 . Ibid. p. 352.
0
1000
2000
3000
4000
5000
6000
No
. of
wo
rkin
g ve
teri
nar
ian
s, A
ust
ralia
2009 2010 2011 2012 2013

WORKFORCE PROFILE
Report on Projection Modelling for the Veterinarian Workforce 10 December 2014 Final Draft 20
of the workforce to a greater proportion of paraprofessional staff, as well as consolidation of practices resulting in more
economies of scale.
Baguley’s study used industry data on pet population estimates from the time series 1994 to 1997 and then from a
separate data set in 1998 (p. 357). The analysis has provided some key conclusions including that the model forecasts
an increase in dog and cat populations during the period under analysis, despite decreases in the percentage of
households owning dogs and cats. This is related to the more than proportionate growth in household numbers over the
same period.
The international experience during the global financial crisis however indicates that the role of pets in households is
increasingly important, and that both pet ownership and related expenditure is relatively resilient to broader economic
downturn. However Baguley also argues that there is mixed data on the level to which expenditure is price inelastic (the
extent to which increases in fees will result in increased revenue) and therefore the market has multiple segments which
will respond differentially to changes in fee levels. Purchasing behaviour may decrease as fees increase, but there will be
a segment of the market that is willing and able to pay for new, higher priced services and products created by
technological innovation.
The drivers for demand for other sectors of the veterinary workforce are also complex in that there are significant
challenges for growth in the rural sector with increasing reliance on companion animal services to support rural practice
viability. The level of government services provided by veterinarians has fallen substantially but there is minimal evidence
of the extent to which the concept of an enhanced role for private practices to contract those essential services back to
producers and government agencies has actually occurred.
There is also increasing specialisation in the market, particularly in areas such as surgery for small animals and equine
services. There is also increasing emphasis being placed on biosecurity services to replace the more traditional
quarantine services. However it is unclear to the extent to which these changes will consolidate and strengthen the role
of veterinarians as there are changes occurring in the skills mix in practices with the use of paraprofessionals as well as
increasing competition from non-veterinary providers in niche markets which will challenge future growth in the
workforce.
3.8. Supply factors
The key data on the supply indicators to date show:
An increasing number of university courses, together with increasing student commencements and completions. The
student completions are yet to increase further as increased commencements flow through to completions;
A major variation in the gender mix of the workforce with a majority of females in the workforce (55.8%), very high
proportions of females in the younger age groups up to 44 years, after which there are more male veterinarians by
age group. Females make up 82.1% of the workforce aged up to 24 years, and the proportion of females then
declines by age cohort. This trend is apparent across every State and Territory within Australia;
A high modal range for hours worked, with the largest number of veterinarians working 49 hours and over per week;
Emerging oversupply with an increasing proportion of graduates seeking work at four months after graduation from
2004 onwards; together with a reduction in parity with overall graduate wages, particularly since 2009.

WORKFORCE PROFILE
Report on Projection Modelling for the Veterinarian Workforce 10 December 2014 Final Draft 21
4.0. Workforce Profile
The following section shows the results of the analysis of the various data sources for age, gender and hours worked.
The three data sources analysed were:
annual Veterinary Registration Board survey data collected by some States and Territories;
results of the 2012 workforce survey conducted by the AVA; and
ABS 2011 Census of Population and Housing data.
Following initial analysis documented in full in the Technical Paper it was decided to limit the projection modelling to a
national model and a model by practice area at national level. This decision was supported by additional analysis using
tests of significance which is reported in detail in the Technical Paper.
4.1. Estimated national workforce by age and gender
The following table and graph show the estimated workforce by age and gender. The Census data on age and gender
was applied to the estimated workforce size by State/Territory to derive this profile. Females are 55.9% of the national
workforce and males 44.1%.
The data shows that the model age range for the female national workforce is 25 to 29 years, for males is 55 to 59 years,
and in total is 30 to 34 years. Males are a larger number of the workforce for each age cohort from 45 years and older.
There are 117 or 2.1% of the female workforce who are 60 years and older, while there are 789 or 18.1% of the male
workforce who are 60 years and older. In total, this accounts for 906 or 9.2% of the national workforce who will retire
within the next ten years.
Table 5: Estimated national workforce by age and gender, 2012
2012 Headcount Percentage by age
Age Female Male Total Female Male Total
20-24 460 101 561 8.3% 2.3% 5.7%
25-29 1150 276 1426 20.9% 6.4% 14.5%
30-34 1113 412 1525 20.2% 9.5% 15.5%
35-39 872 532 1404 15.8% 12.2% 14.2%
40-44 678 537 1215 12.3% 12.4% 12.3%
45-49 559 571 1130 10.1% 13.1% 11.5%
50-54 381 555 935 6.9% 12.8% 9.5%
55-59 182 575 757 3.3% 13.2% 7.7%
60-64 89 460 549 1.6% 10.6% 5.6%
65-69 24 234 259 0.4% 5.4gender 2.6%
70+ 4 94 98 0.1% 2.2% 1.0%
Total 5513 4346 9860 100.0% 100.0% 100.0%
% by gender 55.9% 44.1% 100.0%

WORKFORCE PROFILE
Report on Projection Modelling for the Veterinarian Workforce 10 December 2014 Final Draft 22
Graph 4: National workforce headcount by age and gender, 2012
4.1.1. Estimated workforce profile by age and gender by practice area
Several methods were used to calculate the age and gender profile of the workforce by practice area. However, as the
AVA survey was the only data for the age and gender profile by practice area, the proportion of each practice area
workforce by age and gender using AVA sample data was applied to the totals by gender using the national estimates by
practice area. The results are reported below by practice area, together with a graph showing average age by practice
area.
The total average age of the national workforce for 2012 by practice area is estimated to be 41.3 years, very similar to
the average age of the national workforce of 41.2 years. The graph below shows that the average age by gender is 36.4
years for females, and 47.2 years for males, similar to the average age calculated from the Census data. The average
age of the female workforce is younger in every practice area; women working in government have the oldest average
age at 39.9 years. Males working in equine practice are on average 57.1 years, with the youngest age group on average
in mixed practice at 45.0 years.
0
200
400
600
800
1000
1200
1400
20-24 25-29 30-34 35-39 40-44 45-49 50-54 55-59 60-64 65-69 70+
Wo
rkfo
rce
he
adco
un
t
Female Male

WORKFORCE PROFILE
Report on Projection Modelling for the Veterinarian Workforce 10 December 2014 Final Draft 23
Graph 6: Estimated average age by gender and practice area, 2012
36.534.5 34.9 34.7
39.9 38.535.2
37.7 36.4 36.5
45.9
51.5
45.0
57.1
49.846.3 46.3
49.1 47.2 47.1
0.0
10.0
20.0
30.0
40.0
50.0
60.0
Ave
rage
age
Female
Male

WORKFORCE PROFILE
Report on Projection Modelling for the Veterinarian Workforce 10 December 2014 Final Draft 24
Graph 7: Estimated national small animal workforce by age and gender, 2012
Graph 8: Estimated national large animal workforce by age and gender, 2012
20-24 25-29 30-34 35-39 40-44 45-49 50-54 55-59 60-64 65-69 70+
F Small Animal 256 621 603 471 367 302 210 101 48 12 0
M Small Animal 33 145 207 279 256 269 219 216 178 91 10
0
100
200
300
400
500
600
700
Hae
dco
un
t b
y ag
e a
nd
ge
nd
er
20-24 25-29 30-34 35-39 40-44 45-49 50-54 55-59 60-64 65-69 70+
F Large Animal 10 32 30 24 9 5 4 2 1 0 3
M Large Animal 13 16 26 30 24 24 24 25 29 17 26
0
5
10
15
20
25
30
35
He
adco
un
t b
y ag
e a
nd
ge
nd
er
WORKFORCE PROFILE
Report on Projection Modelling for the Veterinarian Workforce 10 December 2014 Final Draft 25
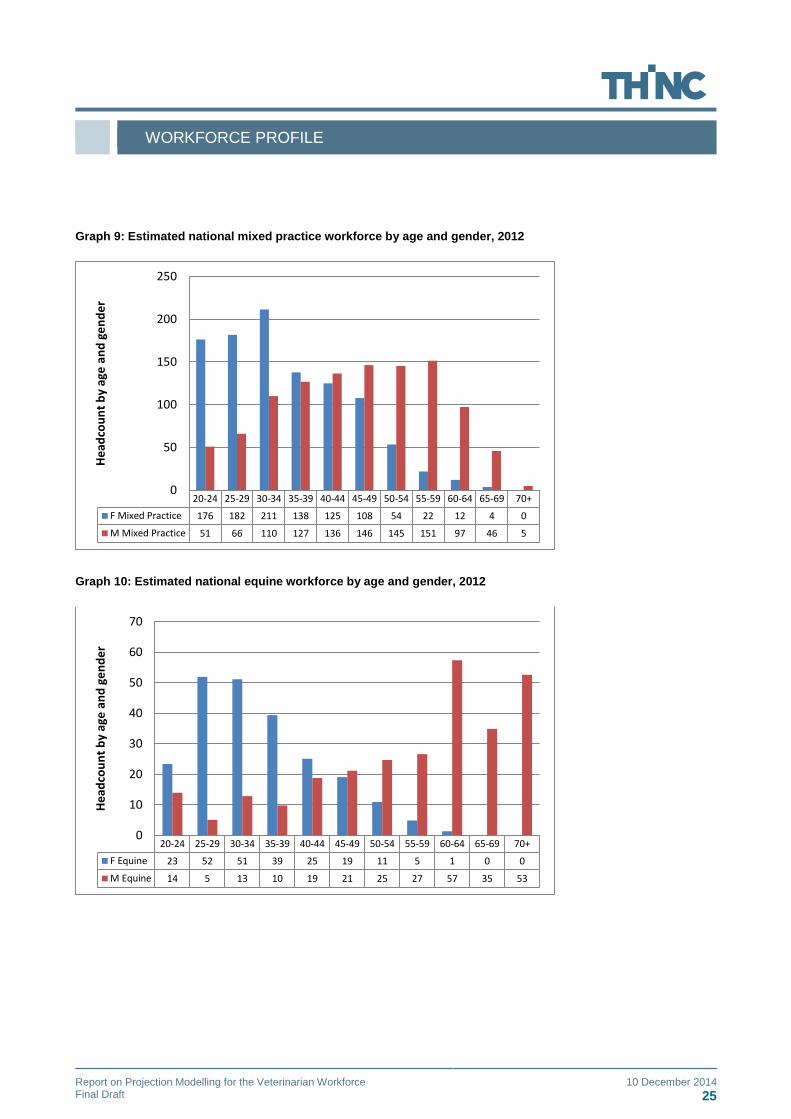
Graph 9: Estimated national mixed practice workforce by age and gender, 2012
Graph 10: Estimated national equine workforce by age and gender, 2012
20-24 25-29 30-34 35-39 40-44 45-49 50-54 55-59 60-64 65-69 70+
F Mixed Practice 176 182 211 138 125 108 54 22 12 4 0
M Mixed Practice 51 66 110 127 136 146 145 151 97 46 5
0
50
100
150
200
250
He
adco
un
t b
y ag
e a
nd
ge
nd
er
20-24 25-29 30-34 35-39 40-44 45-49 50-54 55-59 60-64 65-69 70+
F Equine 23 52 51 39 25 19 11 5 1 0 0
M Equine 14 5 13 10 19 21 25 27 57 35 53
0
10
20
30
40
50
60
70
He
adco
un
t b
y ag
e a
nd
ge
nd
er
WORKFORCE PROFILE
Report on Projection Modelling for the Veterinarian Workforce 10 December 2014 Final Draft 26
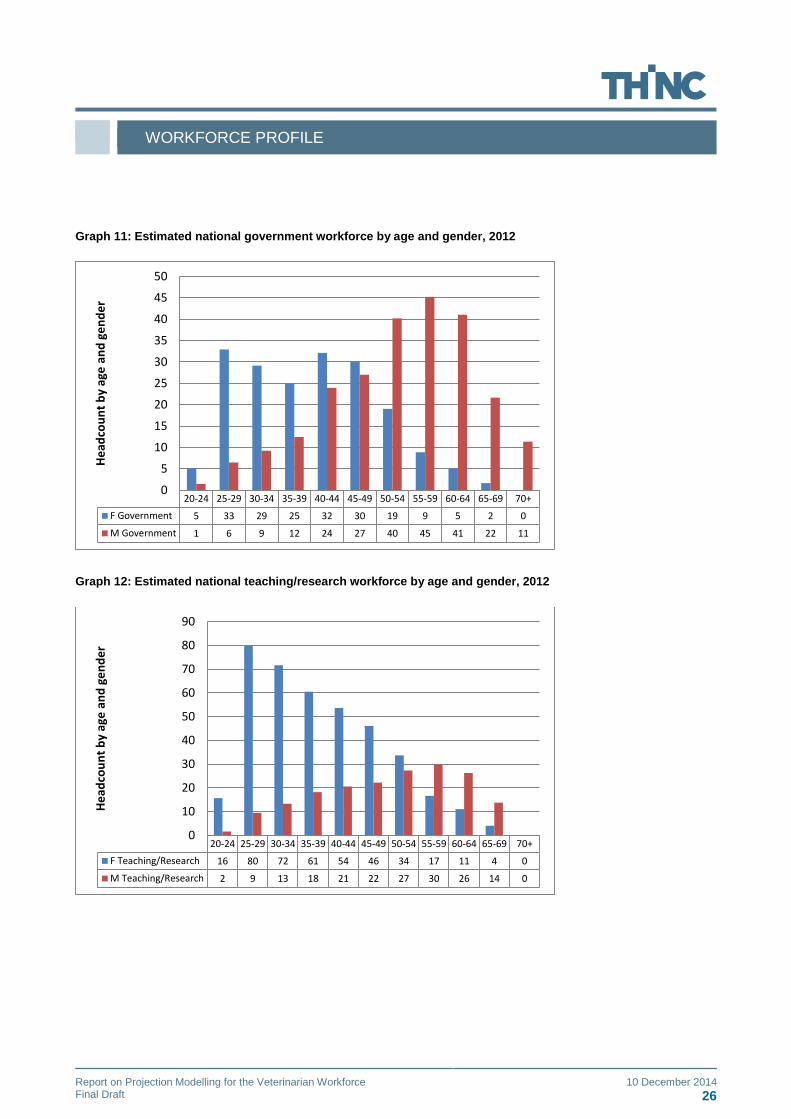
Graph 11: Estimated national government workforce by age and gender, 2012
Graph 12: Estimated national teaching/research workforce by age and gender, 2012
20-24 25-29 30-34 35-39 40-44 45-49 50-54 55-59 60-64 65-69 70+
F Government 5 33 29 25 32 30 19 9 5 2 0
M Government 1 6 9 12 24 27 40 45 41 22 11
0
5
10
15
20
25
30
35
40
45
50
He
adco
un
t b
y ag
e a
nd
ge
nd
er
20-24 25-29 30-34 35-39 40-44 45-49 50-54 55-59 60-64 65-69 70+
F Teaching/Research 16 80 72 61 54 46 34 17 11 4 0
M Teaching/Research 2 9 13 18 21 22 27 30 26 14 0
0
10
20
30
40
50
60
70
80
90
He
adco
un
t b
y ag
e a
nd
ge
nd
er

WORKFORCE PROFILE
Report on Projection Modelling for the Veterinarian Workforce 10 December 2014 Final Draft 27
Graph 13: Estimated national industry/pharmaceutical workforce by age and gender, 2012
Graph 14: Estimated national “other” workforce by age and gender, 2012
20-24 25-29 30-34 35-39 40-44 45-49 50-54 55-59 60-64 65-69 70+
F Industry 2 39 33 29 16 12 3 1 2 1 0
M Industry 3 10 15 20 15 15 18 19 7 2 0
0
5
10
15
20
25
30
35
40
45
He
adco
un
t b
y ag
e a
nd
ge
nd
er
20-24 25-29 30-34 35-39 40-44 45-49 50-54 55-59 60-64 65-69 70+
F Other 12 74 65 56 35 26 34 19 5 0 0
M Other 0 16 22 31 49 54 69 75 40 17 9
0
10
20
30
40
50
60
70
80
He
adco
un
t b
y ag
e a
nd
ge
nd
er

WORKFORCE PROFILE
Report on Projection Modelling for the Veterinarian Workforce 10 December 2014 Final Draft 28
4.2. Hours worked profile
4.2.1. National Workforce Estimate, age, gender and hours worked
The following table and graph show the national workforce estimate by age, gender and hours worked. The data shows
that the average hours per week worked per week is 42.9 hours, with 39.3 hours worked per average per week by
females and 47.5 hours worked per week on average by males. This is on average 8.2 hours less per week worked by
females.
The total hours worked excludes on-call hours active on duty and on-call hours worked.
The major finding from the analysis is that females work on average less hours per week in every age group and in total.
The largest variations occur in the age groups of 35 to 49 years and again after 65 years where females work over ten
hours per week on average less than males. The modal range of hours worked per week for females is for 20 to 29 years
(average of 43.5 hours), for males is 55 to 59 years (average of 50.0 hours) and for the total workforce is for 55 to 59
years (average of 47.9 hours). This has implications for the productivity of the workforce as large numbers of females
move into the 30+ age group and both sexes move from the 55 to 59 year age group to over 60 years.
The age group working the least hours is for females and males and in total is for those aged over 70 years (10.0, 31.6,
and 30.7 hours respectively).
Table 6: Estimate of national workforce profile by age, gender and average hours worked
Headcount Average hours per week
Age Female Male Total Female Male Total
20-24 460 101 561 43.5 47.9 44.3
25-29 1150 276 1426 43.5 47.9 44.3
30-34 1113 412 1525 37.8 47.6 40.4
35-39 872 532 1404 36.8 47.5 40.9
40-44 678 537 1215 36.8 48.7 42.1
45-49 559 571 1130 36.8 48.9 42.9
50-54 381 555 935 40.0 49.8 45.8
55-59 182 575 757 41.3 50.0 47.9
60-64 89 460 549 36.2 43.9 42.6
65-69 24 234 259 29.6 42.0 40.9
70+ 4 94 98 10.0 31.6 30.7
Total 5513 4346 9860 39.3 47.5 42.9

WORKFORCE PROFILE
Report on Projection Modelling for the Veterinarian Workforce 10 December 2014 Final Draft 29
Graph 15: Estimate of national workforce profile, average hours worked per week by age and gender
0.0
10.0
20.0
30.0
40.0
50.0
60.0
20
-24
25
-29
30
-34
35
-39
40
-44
45
-49
50
-54
55
-59
60
-64
65
-69
70
+
Ave
rage
ho
urs
pe
r w
ee
k
Age range
Female Male Total

WORKFORCE PROFILE
Report on Projection Modelling for the Veterinarian Workforce 10 December 2014 Final Draft 30
5.0. Supply Dynamics
5.1. Overview of supply data components
Health Workforce Australia (2012) 19 has developed the projection model that is used in this modelling project. The
model is described as follows:
“The principal method used to develop the projections of the medical, nursing and midwifery workforce numbers is
mathematical simulation modelling. The simulation model employed to generate the workforce supply projections is
referred to as a stock and flow model, where people entering and exiting the workforce (flows) periodically adjust the
initial number in the workforce (stock). The workforce is broken down into age and gender cohorts and different flow
rates are applied to each cohort. The model then takes these different flow rates into account by progressive ageing of
the workforce through iteration of the stock and flow process. This process is represented in Figure 1 (see below) “ (p.
40).
Source: HWA (2012). P. 40.
The following data has been included in the modelling:
19 Health Workforce Australia (2012). Health Workforce 2025 – Doctors, Nurses and Midwives – Volume 1.
WORKFORCE PROFILE
Report on Projection Modelling for the Veterinarian Workforce 10 December 2014 Final Draft 31
Flows in:
Student completions, actual data 2007 to 2013 by University, age and gender, domestic/international status;
Estimated graduate completions 2014 to 2028 (advice from Universities, collected by AVA);
Re-entries based on immigration data (OAD data – see below, based on long-term resident return for employment
purposes)
Restorations to the Register from Veterinary Boards data (sample from NSW, Victoria and South Australia)
Immigration data (OAD data – see below, based on long-term visitor and settler arrival)
Flows out:
Immigration data (OAD data – see below, based on long-term resident departure)
Retirements – based on assumptions of the proportion of retirements by age cohort.
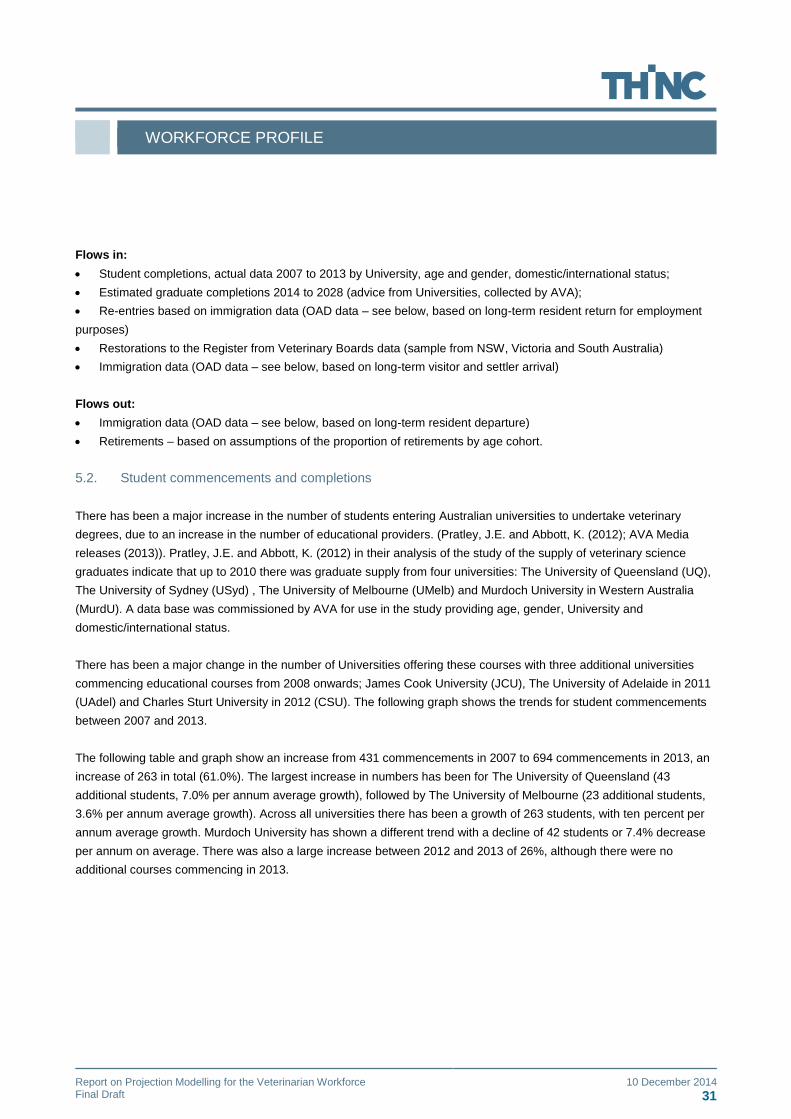
5.2. Student commencements and completions
There has been a major increase in the number of students entering Australian universities to undertake veterinary
degrees, due to an increase in the number of educational providers. (Pratley, J.E. and Abbott, K. (2012); AVA Media
releases (2013)). Pratley, J.E. and Abbott, K. (2012) in their analysis of the study of the supply of veterinary science
graduates indicate that up to 2010 there was graduate supply from four universities: The University of Queensland (UQ),
The University of Sydney (USyd) , The University of Melbourne (UMelb) and Murdoch University in Western Australia
(MurdU). A data base was commissioned by AVA for use in the study providing age, gender, University and
domestic/international status.
There has been a major change in the number of Universities offering these courses with three additional universities
commencing educational courses from 2008 onwards; James Cook University (JCU), The University of Adelaide in 2011
(UAdel) and Charles Sturt University in 2012 (CSU). The following graph shows the trends for student commencements
between 2007 and 2013.
The following table and graph show an increase from 431 commencements in 2007 to 694 commencements in 2013, an
increase of 263 in total (61.0%). The largest increase in numbers has been for The University of Queensland (43
additional students, 7.0% per annum average growth), followed by The University of Melbourne (23 additional students,
3.6% per annum average growth). Across all universities there has been a growth of 263 students, with ten percent per
annum average growth. Murdoch University has shown a different trend with a decline of 42 students or 7.4% decrease
per annum on average. There was also a large increase between 2012 and 2013 of 26%, although there were no
additional courses commencing in 2013.

WORKFORCE PROFILE
Report on Projection Modelling for the Veterinarian Workforce 10 December 2014 Final Draft 32
Table 7: University commencements by University by year, Veterinarian courses, 2007-2013
University 2007 2008 2009 2010 2011 2012 2013 Var. 1
% Annual Var. 1
% Var. 2007-2013
USyd 127 123 118 140 124 132 142 15 2.0%
UQ 103 135 117 124 118 123 146 43 7.0%
UMelb 106 120 120 125 88 74 129 23 3.6%
MurdU 95 43 30 39 36 34 53 -42 -7.4%
JCU 78 79 64 60 65 87 9 2.3%
UAdel 44 53 54 10 11.4%
CSU 70 83 13 18.6%
Total Commencements 431 499 464 492 470 551 694
Total change 263 10% 61.0%
Note: (1) Variation and Annual % Variation is calculated from the initial year the course commenced to 2013.
Source: http://highereducationstatistics.education.gov.au/
Graph 16: University commencements by year, Veterinarian courses, 2007-2013
Source: http://highereducationstatistics.education.gov.au/
431
499464
492 470
551
694
0
100
200
300
400
500
600
700
800
2007 2008 2009 2010 2011 2012 2013
No
. of
com
me
nci
ng
stu
de
nts
Total Commencements Linear (Total Commencements)

WORKFORCE PROFILE
Report on Projection Modelling for the Veterinarian Workforce 10 December 2014 Final Draft 33
Graph 17: University commencements by University by year, Veterinarian courses, 2007-2013
Source: http://highereducationstatistics.education.gov.au/
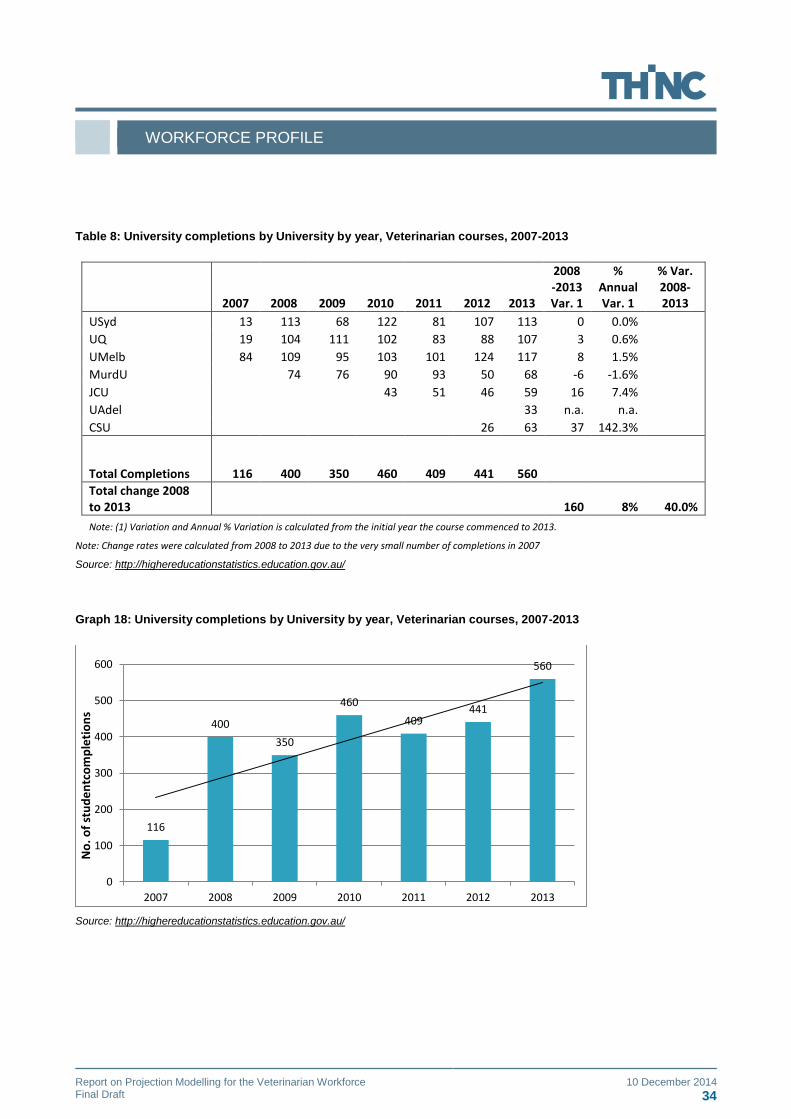
The following table and graphs show the trends for student completions between 2007 and 2013. The graph shows an
increase from 116 completions in 2007 to 560 commencements in 2013. Due to the very low numbers of completions in
2007, the change in completions between 2008 and 2013 was calculated (160 additional students, 40% growth, an
average of eight percent per annum growth on average). The linear trend line shows that 2013 completions are close to
the trend in growth between 2009 and 2013. However it is anticipated that after several years of projected growth based
on further recent commencement increases there will be a plateauing of completions.
This is supported by a survey of Universities where they were requested to provide data on the number of anticipated
completions from 2012 to 2028. These data have been used to update the estimated completions from 2014 to 2030.
0
20
40
60
80
100
120
140
160
2007 2008 2009 2010 2011 2012 2013
No
. of
stu
de
nt
com
me
nce
me
nts
Year of commencement
USyd UQ UMelb MurdU JCU UAdel CSU
WORKFORCE PROFILE
Report on Projection Modelling for the Veterinarian Workforce 10 December 2014 Final Draft 34
Table 8: University completions by University by year, Veterinarian courses, 2007-2013
2007 2008 2009 2010 2011 2012 2013
2008 -2013 Var. 1
% Annual Var. 1
% Var. 2008-2013
USyd 13 113 68 122 81 107 113 0 0.0%
UQ 19 104 111 102 83 88 107 3 0.6%
UMelb 84 109 95 103 101 124 117 8 1.5%
MurdU 74 76 90 93 50 68 -6 -1.6%
JCU 43 51 46 59 16 7.4%
UAdel 33 n.a. n.a.
CSU 26 63 37 142.3%
Total Completions 116 400 350 460 409 441 560
Total change 2008 to 2013 160 8% 40.0%
Note: (1) Variation and Annual % Variation is calculated from the initial year the course commenced to 2013.
Note: Change rates were calculated from 2008 to 2013 due to the very small number of completions in 2007
Source: http://highereducationstatistics.education.gov.au/
Graph 18: University completions by University by year, Veterinarian courses, 2007-2013
Source: http://highereducationstatistics.education.gov.au/
116
400
350
460
409441
560
0
100
200
300
400
500
600
2007 2008 2009 2010 2011 2012 2013
No
. of
stu
de
ntc
om
ple
tio
ns

WORKFORCE PROFILE
Report on Projection Modelling for the Veterinarian Workforce 10 December 2014 Final Draft 35
Graph 19: University completions by University by year, Veterinarian courses, 2007-2013
Source: http://highereducationstatistics.education.gov.au/
5.2.1. Projected student completions and modelling assumptions
The AVA conducted a survey of all Universities to determine actual graduate completions from 1995 to 2011 and
anticipated completions between 2012 and 2028. The following graph shows the completions by year, from 2013 to
2025, the final year of the projection model. Graduate completions show fluctuation by year until 2017, when from that
year onwards graduate numbers stabilise at 582 per annum. The graph also shows the number of graduates based on
90% moving into the workforce the following year. This is based on the analysis of the career paths of veterinary
graduates from the research conducted by Heath (2007, p.287). 20
Therefore the key assumptions relating to graduate completions and entry into the workforce are:
90% of completing graduates will enter the workforce the following year;
The course length on average is five years;
No differential participation rates from domestic/international students;
20 Heath, T.J. (2007). Longitudinal study of veterinary students and veterinarians: the first 20 years. Australian Veterinary Journal.
Vol. 85,No.7, July 2007.p.281-289.
.
0
20
40
60
80
100
120
140
2007 2008 2009 2010 2011 2012 2013
No
. of
stu
de
nt
com
ple
tio
ns
Year of completion
USyd UQ UMelb MurdU JCU UAdel CSU

WORKFORCE PROFILE
Report on Projection Modelling for the Veterinarian Workforce 10 December 2014 Final Draft 36
The age and gender profile for subsequent years is the same as the age and sex profile for 2012 graduates from the
Higher Education Statistics extract weighted to completion estimates.
Graph 20: Projected University completions by percentage completing, Veterinarian courses, 2013-2025
Source: AVA University survey, 2013 (unpublished material).
5.3. Immigration data
The Australian Government Department of Immigration and Border Protection (DIBP) collects data on Overseas arrivals
and departures (OAD) statistics. The main source data are incoming and outgoing passenger cards completed by
persons arriving in or departing from Australia. Data from passports and visa (entry permit) applications and approvals
are also provided from DIBP's Travel and Immigration Processing System (TRIPS). These three data sources are
collected, compiled and matched together by DIBP.
OAD data provides information on all recorded movements across Australia's borders, both in-bound and out-bound, by
category of movement and numerous other variables. The three main categories of movement are:
• permanent movements;
• long-term movements (one year or more); and
• short-term movements (less than one year).
The Overseas Arrivals and Departures, Australia (cat. no. 3401.0) publication provides the most comprehensive source
for statistics on OAD in Australia, particularly for short-term movements. Over the years OAD data have been released
via various outputs including .pdf, spreadsheets and data files. Currently, this publication is released as a monthly web
only release (e.g. Key Figures, Main Features, Explanatory Notes, etc.) with an associated 12 time series spreadsheets
(Excel format) available from the Downloads tab.
2013 2014 2015 2016 2017 2018 2019 2020 2021 2022 2023 2024 2025
100% completions 560 579 577 592 582 582 582 582 582 582 582 582 582
90% completions 504 521 519 533 524 524 524 524 524 524 524 524 524
460
480
500
520
540
560
580
600
No
. of
stu
de
nt
com
ple
tio
ns

WORKFORCE PROFILE
Report on Projection Modelling for the Veterinarian Workforce 10 December 2014 Final Draft 37
The data items able to be extracted included age, gender, ANZSCO Unit Group (2347- Veterinarians), main reason for
travel and financial year. The data for the 2012-13 financial year was extracted for the purposes of the modelling.
5.3.1. Immigration data
The two categories of international immigration data included in the analysis were long-term visitor and settler arrival in
the category of ANZSCO Unit Group 2347- Veterinarians. The criteria for selection were where main reason for visit was
employment, business, other. This resulted in 114 long-term visitor arrivals for employment purposes, 15 for business
and other purposes, and 53 settler arrivals in those categories. This totalled 182 arrivals. After adjustment for the age
and gender profile where there were small cell sizes under 5, the resulting overseas immigration totalled 180 persons,
The following table shows the age and gender profile.
Table 10: International immigration data, veterinary workforce, 2012-13
Age Group Female Male Total
20-24 years 11 4 15
25-29 years 43 26 69
30-34 years 34 14 48
35-39 years 15 9 24
40-44 years 6 3 10
45-49 years 2 5 6
50-54 years 1 3 4
55-59 years 1 1
65+ years 3 3
Total 113 67 180
Source: Overseas Arrivals and Departures (OAD), Australia, web-only data release, Australian Government Department of Immigration
and Border Protection (DIBP)
5.4. Re-entry to the workforce
The analysis for the projection modelling was based on two data sources for the purpose of re-entry to the workforce:
Resident re-entry to Australia using Immigration data (OAD data extraction of long-term resident return);
Restorations to the Registers in a three State sample from Veterinary Registration Board data. The data on the
number of restorations was available from Annual Reports from those States (NSW, Victoria and South Australia) as
shown in the table below.
The data for the long-term resident returns were assumed to represent Australian-trained veterinarian residents returning
to work in the industry. Therefore it was assumed that all of those in that category for 2012-13 would re-join the
workforce. The challenge with re-entry to the workforce data is that there is very little information available on the
restorations to the registers in each of the States and Territories and whether those individuals actually re-enter the
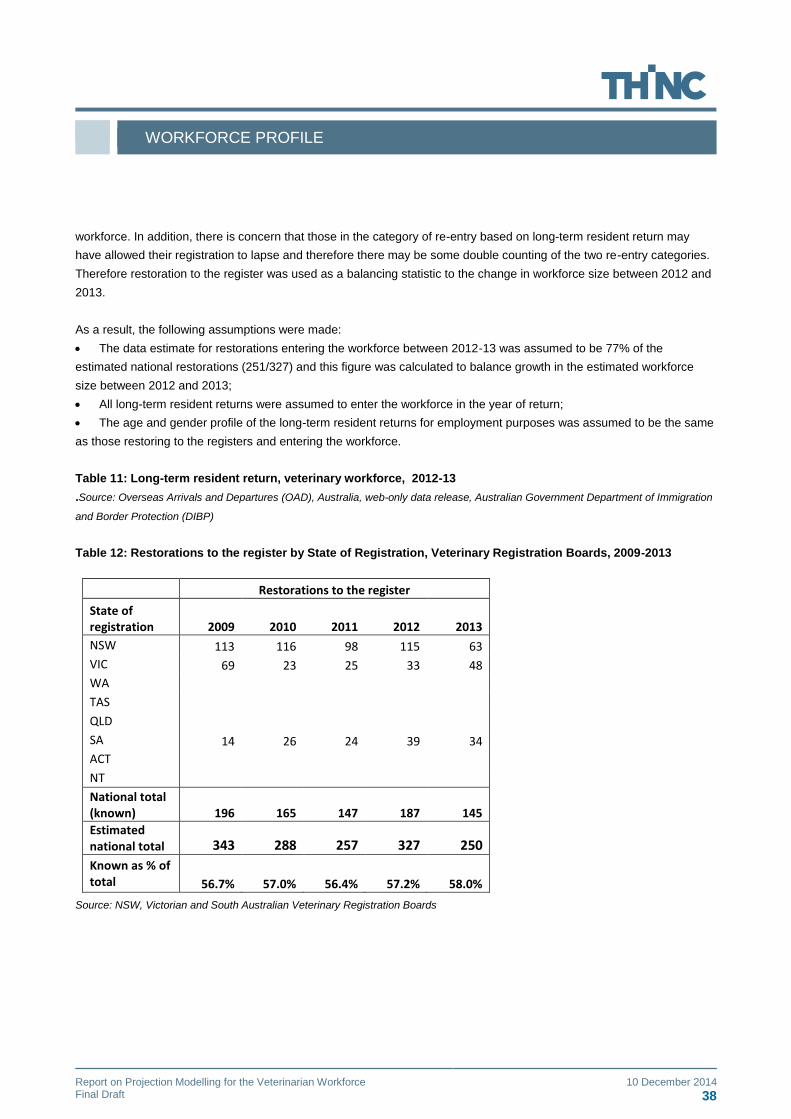
WORKFORCE PROFILE
Report on Projection Modelling for the Veterinarian Workforce 10 December 2014 Final Draft 38
workforce. In addition, there is concern that those in the category of re-entry based on long-term resident return may
have allowed their registration to lapse and therefore there may be some double counting of the two re-entry categories.
Therefore restoration to the register was used as a balancing statistic to the change in workforce size between 2012 and
2013.
As a result, the following assumptions were made:
The data estimate for restorations entering the workforce between 2012-13 was assumed to be 77% of the
estimated national restorations (251/327) and this figure was calculated to balance growth in the estimated workforce
size between 2012 and 2013;
All long-term resident returns were assumed to enter the workforce in the year of return;
The age and gender profile of the long-term resident returns for employment purposes was assumed to be the same
as those restoring to the registers and entering the workforce.
Table 11: Long-term resident return, veterinary workforce, 2012-13
.Source: Overseas Arrivals and Departures (OAD), Australia, web-only data release, Australian Government Department of Immigration
and Border Protection (DIBP)
Table 12: Restorations to the register by State of Registration, Veterinary Registration Boards, 2009-2013
Restorations to the register
State of registration 2009 2010 2011 2012 2013
NSW 113 116 98 115 63
VIC 69 23 25 33 48
WA
TAS
QLD
SA 14 26 24 39 34
ACT
NT
National total (known) 196 165 147 187 145
Estimated national total 343 288 257 327 250
Known as % of total 56.7% 57.0% 56.4% 57.2% 58.0%
Source: NSW, Victorian and South Australian Veterinary Registration Boards
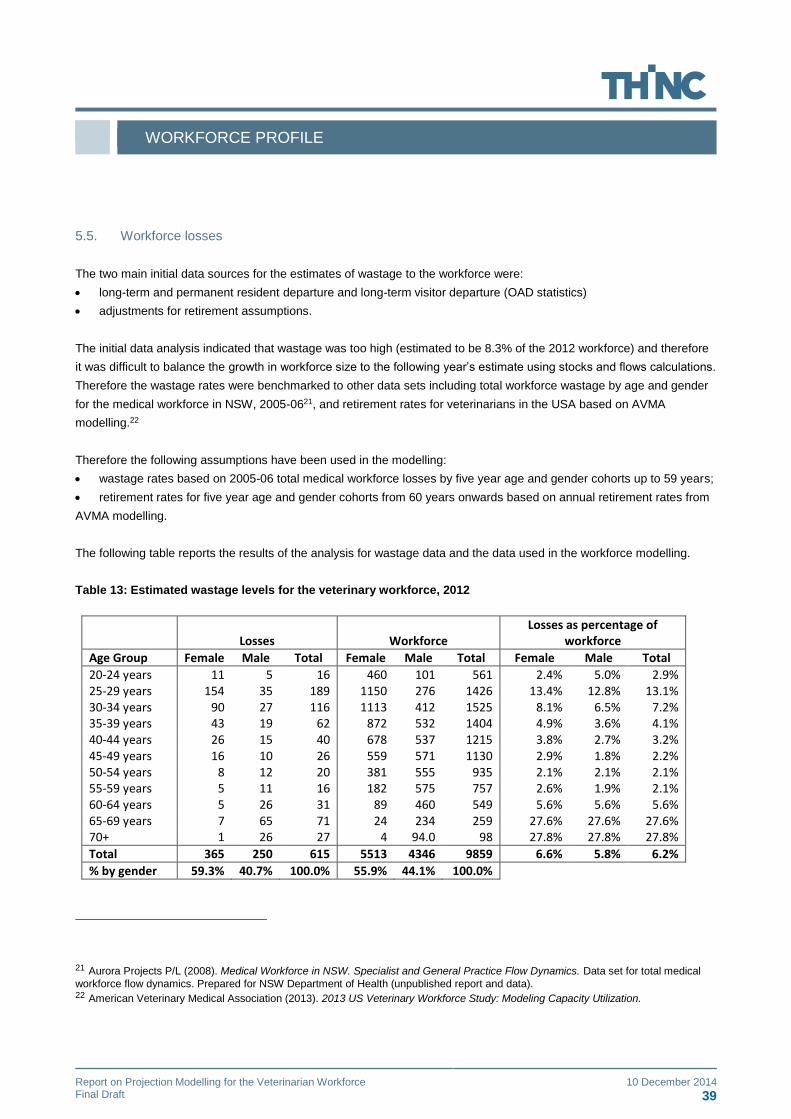
WORKFORCE PROFILE
Report on Projection Modelling for the Veterinarian Workforce 10 December 2014 Final Draft 39
5.5. Workforce losses
The two main initial data sources for the estimates of wastage to the workforce were:
long-term and permanent resident departure and long-term visitor departure (OAD statistics)
adjustments for retirement assumptions.
The initial data analysis indicated that wastage was too high (estimated to be 8.3% of the 2012 workforce) and therefore
it was difficult to balance the growth in workforce size to the following year’s estimate using stocks and flows calculations.
Therefore the wastage rates were benchmarked to other data sets including total workforce wastage by age and gender
for the medical workforce in NSW, 2005-0621, and retirement rates for veterinarians in the USA based on AVMA
modelling.22
Therefore the following assumptions have been used in the modelling:
wastage rates based on 2005-06 total medical workforce losses by five year age and gender cohorts up to 59 years;
retirement rates for five year age and gender cohorts from 60 years onwards based on annual retirement rates from
AVMA modelling.
The following table reports the results of the analysis for wastage data and the data used in the workforce modelling.
Table 13: Estimated wastage levels for the veterinary workforce, 2012
Losses Workforce Losses as percentage of
workforce
Age Group Female Male Total Female Male Total Female Male Total
20-24 years 11 5 16 460 101 561 2.4% 5.0% 2.9% 25-29 years 154 35 189 1150 276 1426 13.4% 12.8% 13.1% 30-34 years 90 27 116 1113 412 1525 8.1% 6.5% 7.2% 35-39 years 43 19 62 872 532 1404 4.9% 3.6% 4.1% 40-44 years 26 15 40 678 537 1215 3.8% 2.7% 3.2% 45-49 years 16 10 26 559 571 1130 2.9% 1.8% 2.2% 50-54 years 8 12 20 381 555 935 2.1% 2.1% 2.1% 55-59 years 5 11 16 182 575 757 2.6% 1.9% 2.1% 60-64 years 5 26 31 89 460 549 5.6% 5.6% 5.6% 65-69 years 7 65 71 24 234 259 27.6% 27.6% 27.6% 70+ 1 26 27 4 94.0 98 27.8% 27.8% 27.8%
Total 365 250 615 5513 4346 9859 6.6% 5.8% 6.2%
% by gender 59.3% 40.7% 100.0% 55.9% 44.1% 100.0%
21 Aurora Projects P/L (2008). Medical Workforce in NSW. Specialist and General Practice Flow Dynamics. Data set for total medical
workforce flow dynamics. Prepared for NSW Department of Health (unpublished report and data). 22 American Veterinary Medical Association (2013). 2013 US Veterinary Workforce Study: Modeling Capacity Utilization.
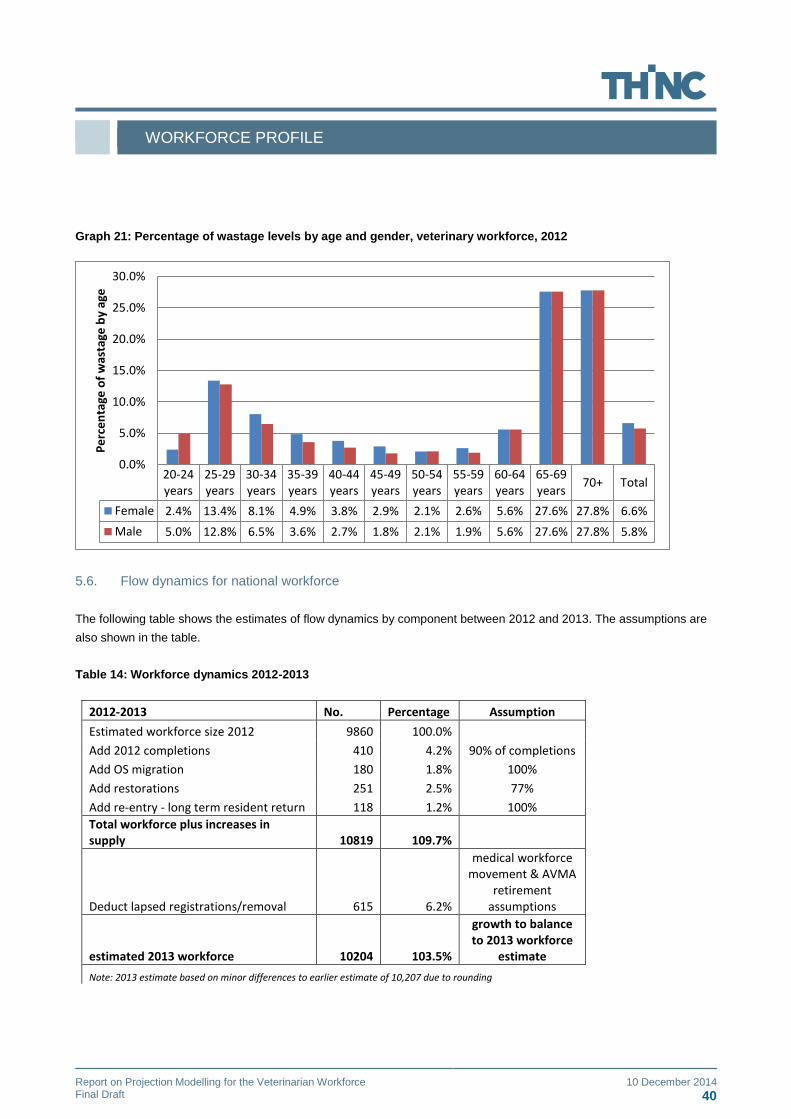
WORKFORCE PROFILE
Report on Projection Modelling for the Veterinarian Workforce 10 December 2014 Final Draft 40
Graph 21: Percentage of wastage levels by age and gender, veterinary workforce, 2012
5.6. Flow dynamics for national workforce
The following table shows the estimates of flow dynamics by component between 2012 and 2013. The assumptions are
also shown in the table.
Table 14: Workforce dynamics 2012-2013
2012-2013 No. Percentage Assumption
Estimated workforce size 2012 9860 100.0%
Add 2012 completions 410 4.2% 90% of completions
Add OS migration 180 1.8% 100%
Add restorations 251 2.5% 77%
Add re-entry - long term resident return 118 1.2% 100%
Total workforce plus increases in supply 10819 109.7%
Deduct lapsed registrations/removal 615 6.2%
medical workforce movement & AVMA
retirement assumptions
estimated 2013 workforce 10204 103.5%
growth to balance to 2013 workforce
estimate
Note: 2013 estimate based on minor differences to earlier estimate of 10,207 due to rounding
20-24years
25-29years
30-34years
35-39years
40-44years
45-49years
50-54years
55-59years
60-64years
65-69years
70+ Total
Female 2.4% 13.4% 8.1% 4.9% 3.8% 2.9% 2.1% 2.6% 5.6% 27.6% 27.8% 6.6%
Male 5.0% 12.8% 6.5% 3.6% 2.7% 1.8% 2.1% 1.9% 5.6% 27.6% 27.8% 5.8%
0.0%
5.0%
10.0%
15.0%
20.0%
25.0%
30.0%
Pe
rce
nta
ge o
f w
asta
ge b
y ag
e

NATIONAL MODEL
Report on Projection Modelling for the Veterinarian Workforce 10 December 2014 Final Draft 41
6.0. Labour market analysis
6.1. Current labour market analysis
Heath in 2008 reported that the data available for Australia indicate that the current number of veterinary graduates is
likely to be sufficient for the needs of animal owners of Australia over the years ahead. His view was that if shortages
occur in particular areas, this is likely to be related to poor distribution rather than an overall shortage (p.28).
Since then there have been major increases in university students commencing and completing university courses and
the AVA (2013)23 put forward the view that Australia is currently facing a likely oversupply in the veterinary workforce.
The AVA argues that veterinary science is one of the most expensive university courses to deliver, and it is
underfunded, poorly resourced and under strain. The AVA also reports that there are constraints on the capacity of the
industry to provide enough quality clinical placements.
Supporting evidence of an emerging oversupply comes from data from Graduate Careers Australia. This indicates that
that the starting salary for veterinary graduates has not kept pace with other graduate salaries between 2000 and 2013,
and has plateaued from 2009 onwards (see Graph 9). Graph 10 includes data on the graduates seeking employment
four months after graduation and in total the percentage of graduates has continued to increase since 2004, from less
than five percent to 20% of graduates. These data indicate a tightening of the labour market and increasing
unemployment for new graduates.
Graph 22: Median starting salaries in Australia, veterinary and all graduates, 2000 to 2013
Source: Graduate Careers Australia
23 Op. cit. p. 1
$-
$10,000.00
$20,000.00
$30,000.00
$40,000.00
$50,000.00
$60,000.00
20
00
20
01
20
02
20
03
20
04
20
05
20
06
20
07
20
08
20
09
20
10
20
11
20
12
20
13
Me
dia
n s
tart
ing
sala
ry
YearMedian starting salary vets Median starting salary all
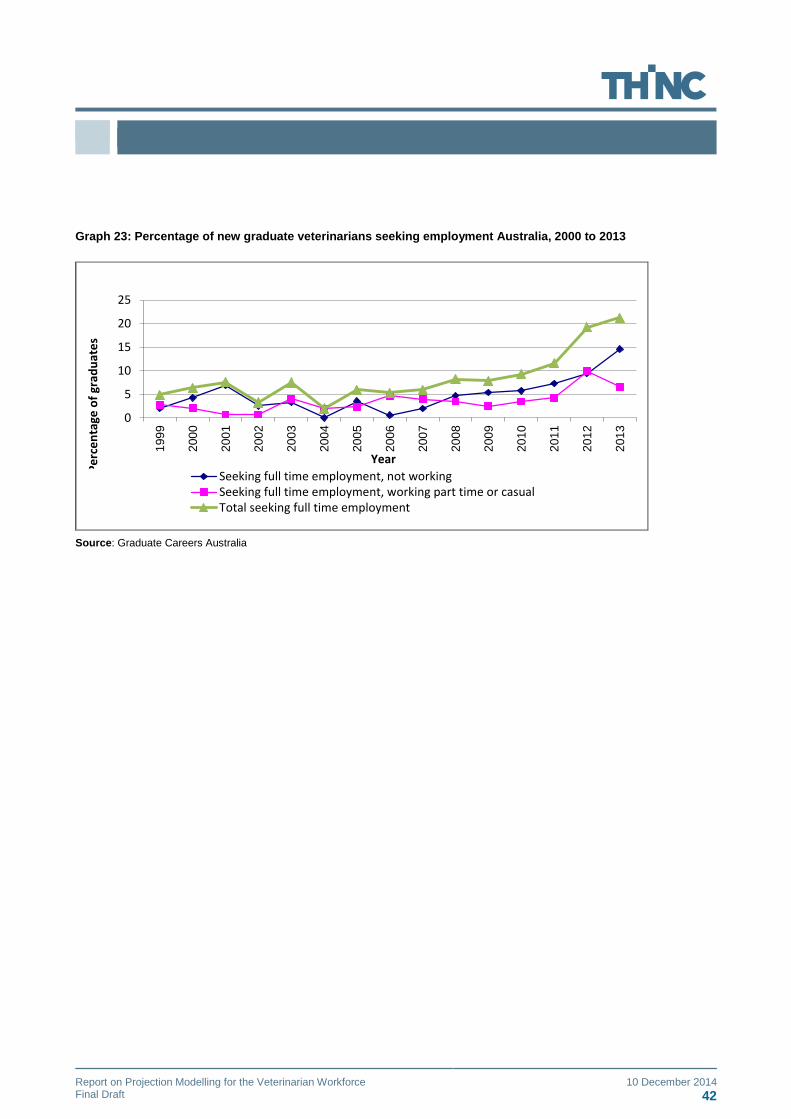
Report on Projection Modelling for the Veterinarian Workforce 10 December 2014 Final Draft 42
Graph 23: Percentage of new graduate veterinarians seeking employment Australia, 2000 to 2013
Source: Graduate Careers Australia
0
5
10
15
20
25
199
9
200
0
200
1
200
2
200
3
200
4
200
5
200
6
200
7
200
8
200
9
201
0
201
1
201
2
201
3
Pe
rce
nta
ge o
f gr
adu
ate
s
Year
Seeking full time employment, not workingSeeking full time employment, working part time or casualTotal seeking full time employment
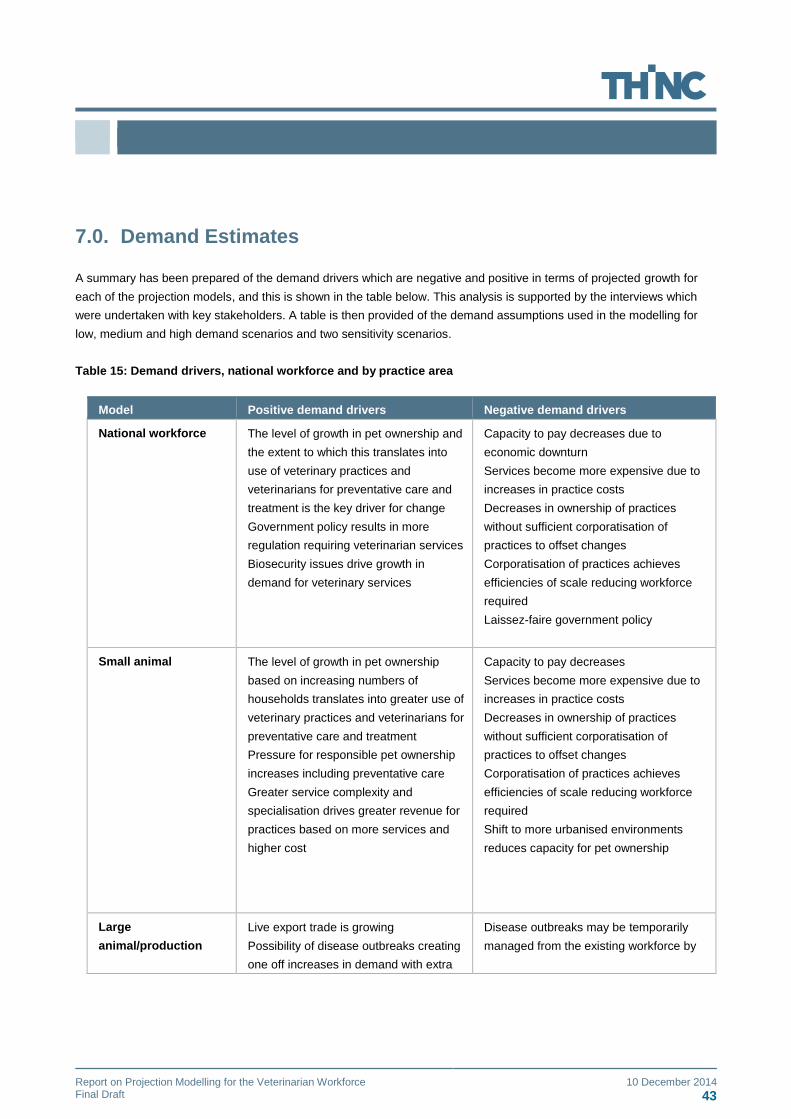
Report on Projection Modelling for the Veterinarian Workforce 10 December 2014 Final Draft 43
7.0. Demand Estimates
A summary has been prepared of the demand drivers which are negative and positive in terms of projected growth for
each of the projection models, and this is shown in the table below. This analysis is supported by the interviews which
were undertaken with key stakeholders. A table is then provided of the demand assumptions used in the modelling for
low, medium and high demand scenarios and two sensitivity scenarios.
Table 15: Demand drivers, national workforce and by practice area
Model Positive demand drivers Negative demand drivers
National workforce The level of growth in pet ownership and
the extent to which this translates into
use of veterinary practices and
veterinarians for preventative care and
treatment is the key driver for change
Government policy results in more
regulation requiring veterinarian services
Biosecurity issues drive growth in
demand for veterinary services
Capacity to pay decreases due to
economic downturn
Services become more expensive due to
increases in practice costs
Decreases in ownership of practices
without sufficient corporatisation of
practices to offset changes
Corporatisation of practices achieves
efficiencies of scale reducing workforce
required
Laissez-faire government policy
Small animal The level of growth in pet ownership
based on increasing numbers of
households translates into greater use of
veterinary practices and veterinarians for
preventative care and treatment
Pressure for responsible pet ownership
increases including preventative care
Greater service complexity and
specialisation drives greater revenue for
practices based on more services and
higher cost
Capacity to pay decreases
Services become more expensive due to
increases in practice costs
Decreases in ownership of practices
without sufficient corporatisation of
practices to offset changes
Corporatisation of practices achieves
efficiencies of scale reducing workforce
required
Shift to more urbanised environments
reduces capacity for pet ownership
Large
animal/production
Live export trade is growing
Possibility of disease outbreaks creating
one off increases in demand with extra
Disease outbreaks may be temporarily
managed from the existing workforce by

Report on Projection Modelling for the Veterinarian Workforce 10 December 2014 Final Draft 44
Model Positive demand drivers Negative demand drivers
demand subject to length and spread of
outbreak(s)
Contracting of stock management and
surveillance to private sector
decreasing numbers in each private
practice
A major risk is the stopping of the live
export trade
Farmers are providing their own care
where possible
Losing services to paraprofessionals
Mixed practice Growth is driven by same drivers as
small animal and large
animal/production practice areas
Growth is driven by same drivers as small
animal and large animal/production
practice areas
Changing career options for graduates
decreases demand for mixed practice
placements, particularly in rural areas
Equine High level of income continues to attract
specialised practice
High cost of horses creates owners
prepared to pay for services including
reproduction services
Reluctance to work with disease outbreak
associated with horses
Government Government policy results in more
regulation requiring veterinarian services
as occurred recently in the USA
Gaps in service provision due to
historical downsizing creates
opportunities for contracting services
Laissez-faire government policy
Teaching/research De-regulation of university funding by
government creates more demand and
therefore more university courses
Increasing overseas demand for
Australian courses
Increases in research funding
Fall out in universities offering courses
due to increasing costs
Cuts to research funding and local
Australian expertise as a result
Industry Steady growth linked to workforce
growth creating more sales
representatives, technical roles
Increases in industry due to increasing
de-regulation
Merging of pharmaceutical companies
resulting in less employment opportunities
Other Trends in specialisation continues Trends in specialisation decrease
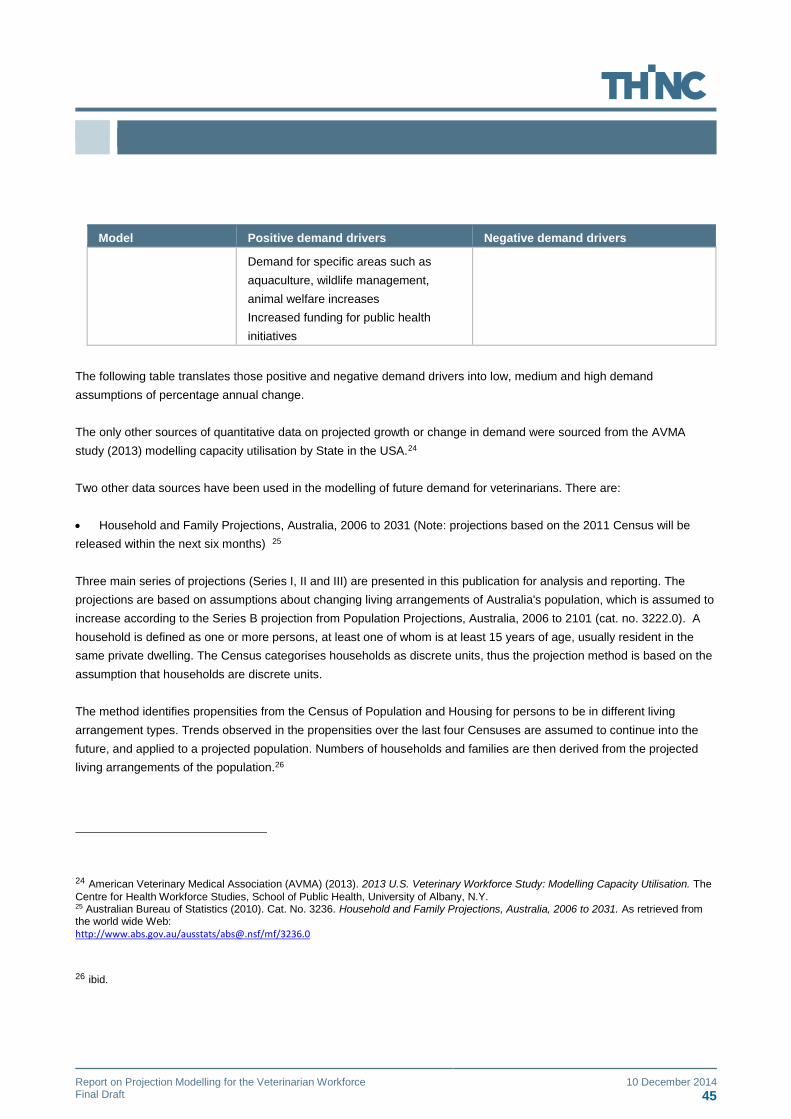
Report on Projection Modelling for the Veterinarian Workforce 10 December 2014 Final Draft 45
Model Positive demand drivers Negative demand drivers
Demand for specific areas such as
aquaculture, wildlife management,
animal welfare increases
Increased funding for public health
initiatives
The following table translates those positive and negative demand drivers into low, medium and high demand
assumptions of percentage annual change.
The only other sources of quantitative data on projected growth or change in demand were sourced from the AVMA
study (2013) modelling capacity utilisation by State in the USA.24
Two other data sources have been used in the modelling of future demand for veterinarians. There are:
Household and Family Projections, Australia, 2006 to 2031 (Note: projections based on the 2011 Census will be
released within the next six months) 25
Three main series of projections (Series I, II and III) are presented in this publication for analysis and reporting. The
projections are based on assumptions about changing living arrangements of Australia's population, which is assumed to
increase according to the Series B projection from Population Projections, Australia, 2006 to 2101 (cat. no. 3222.0). A
household is defined as one or more persons, at least one of whom is at least 15 years of age, usually resident in the
same private dwelling. The Census categorises households as discrete units, thus the projection method is based on the
assumption that households are discrete units.
The method identifies propensities from the Census of Population and Housing for persons to be in different living
arrangement types. Trends observed in the propensities over the last four Censuses are assumed to continue into the
future, and applied to a projected population. Numbers of households and families are then derived from the projected
living arrangements of the population.26
24 American Veterinary Medical Association (AVMA) (2013). 2013 U.S. Veterinary Workforce Study: Modelling Capacity Utilisation. The
Centre for Health Workforce Studies, School of Public Health, University of Albany, N.Y. 25 Australian Bureau of Statistics (2010). Cat. No. 3236. Household and Family Projections, Australia, 2006 to 2031. As retrieved from the world wide Web: http://www.abs.gov.au/ausstats/[email protected]/mf/3236.0
26 ibid.
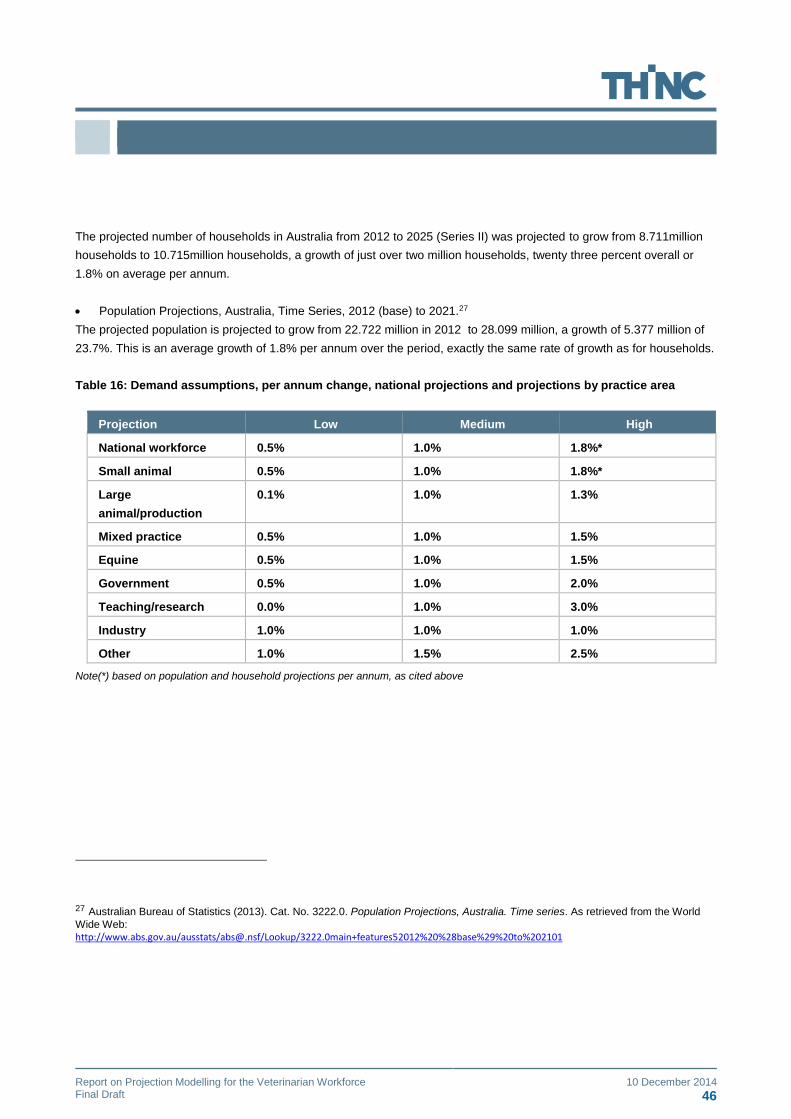
Report on Projection Modelling for the Veterinarian Workforce 10 December 2014 Final Draft 46
The projected number of households in Australia from 2012 to 2025 (Series II) was projected to grow from 8.711million
households to 10.715million households, a growth of just over two million households, twenty three percent overall or
1.8% on average per annum.
Population Projections, Australia, Time Series, 2012 (base) to 2021.27
The projected population is projected to grow from 22.722 million in 2012 to 28.099 million, a growth of 5.377 million of
23.7%. This is an average growth of 1.8% per annum over the period, exactly the same rate of growth as for households.
Table 16: Demand assumptions, per annum change, national projections and projections by practice area
Projection Low Medium High
National workforce 0.5% 1.0% 1.8%*
Small animal 0.5% 1.0% 1.8%*
Large
animal/production
0.1% 1.0% 1.3%
Mixed practice 0.5% 1.0% 1.5%
Equine 0.5% 1.0% 1.5%
Government 0.5% 1.0% 2.0%
Teaching/research 0.0% 1.0% 3.0%
Industry 1.0% 1.0% 1.0%
Other 1.0% 1.5% 2.5%
Note(*) based on population and household projections per annum, as cited above
27 Australian Bureau of Statistics (2013). Cat. No. 3222.0. Population Projections, Australia. Time series. As retrieved from the World
Wide Web: http://www.abs.gov.au/ausstats/[email protected]/Lookup/3222.0main+features52012%20%28base%29%20to%202101

Report on Projection Modelling for the Veterinarian Workforce 10 December 2014 Final Draft 47
8.0. Results of projection modelling
The following table summarises the results of the projection modelling for the national model, each of the practice area
models as well as two additional sensitivity scenarios. The assumptions supporting the sensitivity scenarios were based
on the national model and were:
High wastage scenario: this model assumed that wastage doubled in every age and sex cohort. Instead of
workforce leaving at 6.2% per annum or one in sixteen it doubles to 12.4% or one in eight.
Larger workforce size: this model assumed that the 2012 workforce increased by 5% to 10,353. This is based on
the assumption that that there are trained veterinarians working in the industry who are currently not registered. No
other supply dynamics were changed from the base workforce model.
The following table shows the findings for each scenario. The definitions used are:
Large over supply: supply exceeds demand by greater than 50%
Over supply: supply exceeds demand by between 1 and 50%
Under supply: supply is less than demand by between 1 and 50%.
Table 17: Results of projection modelling
Scenario Low demand Medium demand High demand
National Large over supply Large over supply Large oversupply
National high wastage Undersupply to 2017,
oversupply 2018 to 2025
National larger
workforce
Large oversupply
Small animal Large over supply Over supply Over supply
Large animal/production Large over supply Over supply Over supply
Mixed practice Large over supply Large over supply Over supply
Equine Large over supply Large over supply Large over supply
Government Under supply Under supply Under supply
Teaching/research Over supply Over supply Under supply

Report on Projection Modelling for the Veterinarian Workforce 10 December 2014 Final Draft 48
Industry Over supply Over supply Over supply
Other Under supply Under supply Under supply
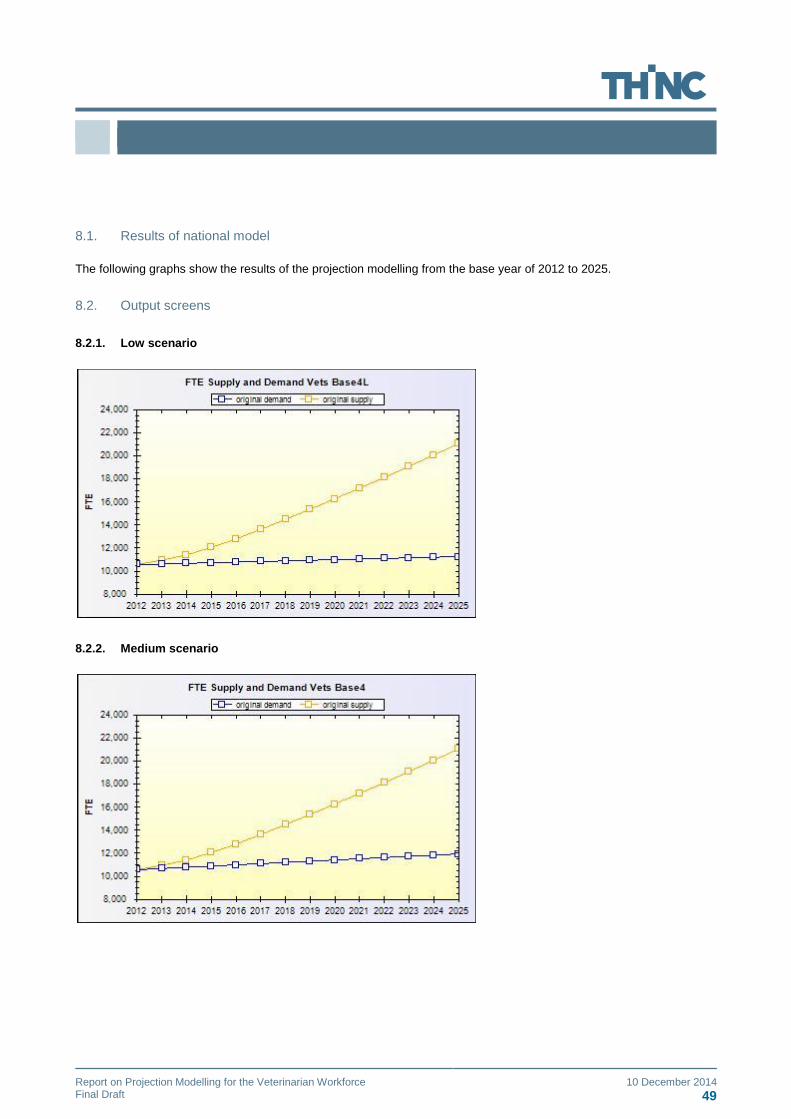
Report on Projection Modelling for the Veterinarian Workforce 10 December 2014 Final Draft 49
8.1. Results of national model
The following graphs show the results of the projection modelling from the base year of 2012 to 2025.
8.2. Output screens
8.2.1. Low scenario
8.2.2. Medium scenario
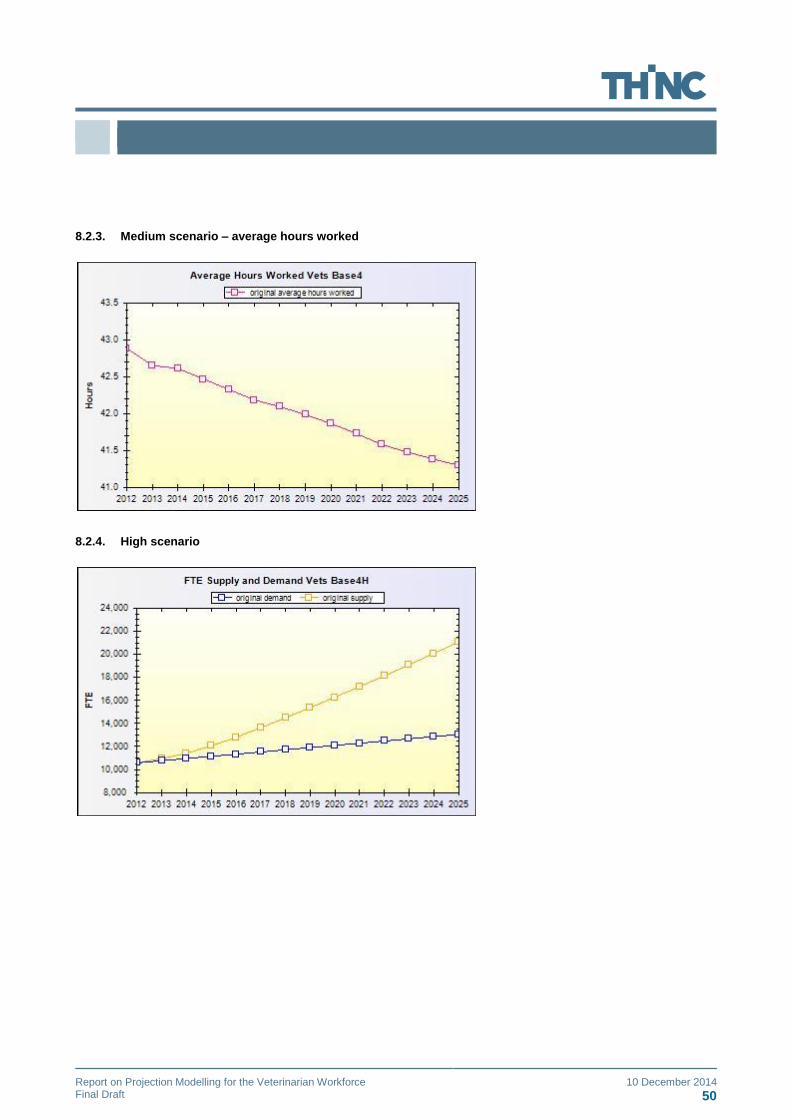
Report on Projection Modelling for the Veterinarian Workforce 10 December 2014 Final Draft 50
8.2.3. Medium scenario – average hours worked
8.2.4. High scenario
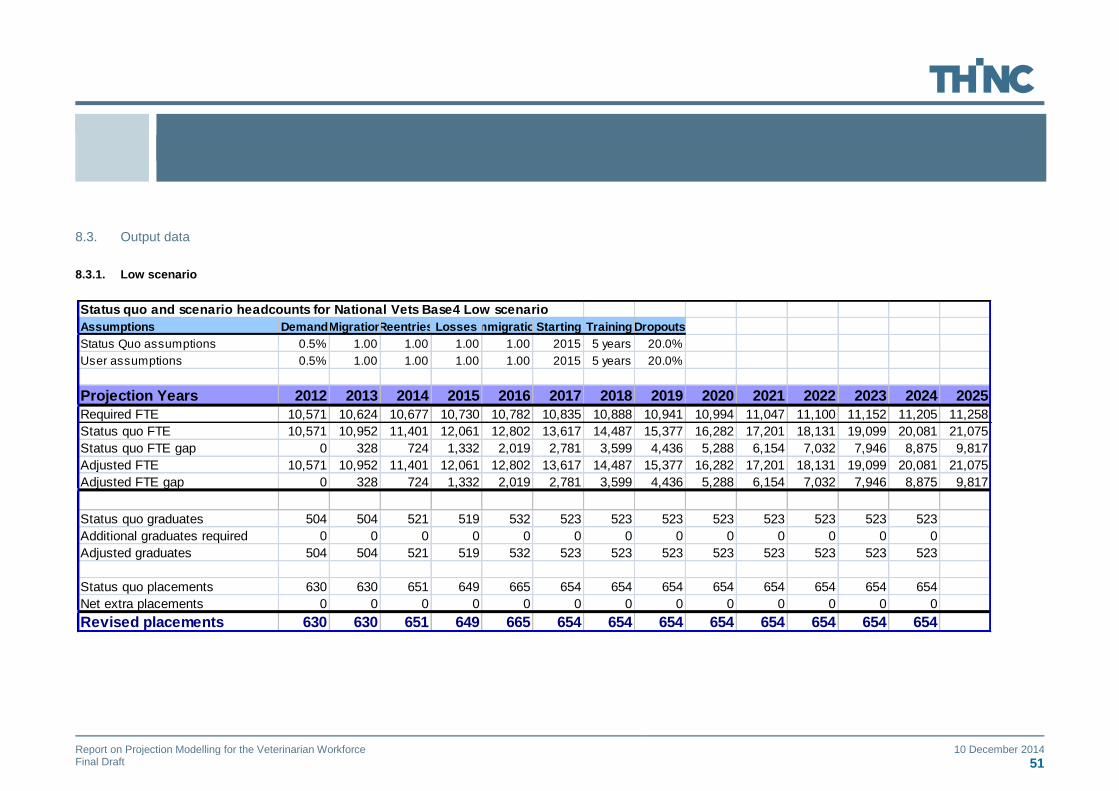
Report on Projection Modelling for the Veterinarian Workforce 10 December 2014 Final Draft 51
8.3. Output data
8.3.1. Low scenario
Status quo and scenario headcounts for National Vets Base4 Low scenario
Assumptions DemandMigrationReentries LossesImmigrationStarting Training Dropouts
Status Quo assumptions 0.5% 1.00 1.00 1.00 1.00 2015 5 years 20.0%
User assumptions 0.5% 1.00 1.00 1.00 1.00 2015 5 years 20.0%
Projection Years 2012 2013 2014 2015 2016 2017 2018 2019 2020 2021 2022 2023 2024 2025
Required FTE 10,571 10,624 10,677 10,730 10,782 10,835 10,888 10,941 10,994 11,047 11,100 11,152 11,205 11,258
Status quo FTE 10,571 10,952 11,401 12,061 12,802 13,617 14,487 15,377 16,282 17,201 18,131 19,099 20,081 21,075
Status quo FTE gap 0 328 724 1,332 2,019 2,781 3,599 4,436 5,288 6,154 7,032 7,946 8,875 9,817
Adjusted FTE 10,571 10,952 11,401 12,061 12,802 13,617 14,487 15,377 16,282 17,201 18,131 19,099 20,081 21,075
Adjusted FTE gap 0 328 724 1,332 2,019 2,781 3,599 4,436 5,288 6,154 7,032 7,946 8,875 9,817
Status quo graduates 504 504 521 519 532 523 523 523 523 523 523 523 523
Additional graduates required 0 0 0 0 0 0 0 0 0 0 0 0 0
Adjusted graduates 504 504 521 519 532 523 523 523 523 523 523 523 523
Status quo placements 630 630 651 649 665 654 654 654 654 654 654 654 654
Net extra placements 0 0 0 0 0 0 0 0 0 0 0 0 0
Revised placements 630 630 651 649 665 654 654 654 654 654 654 654 654
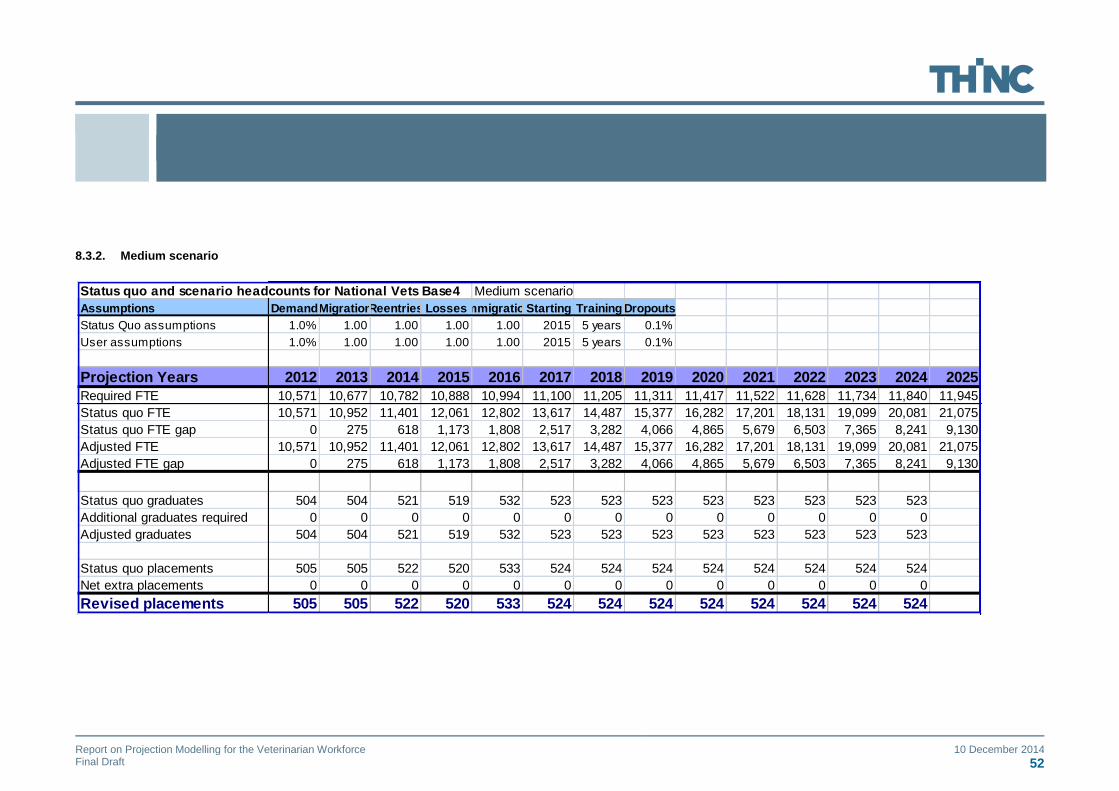
Report on Projection Modelling for the Veterinarian Workforce 10 December 2014 Final Draft 52
8.3.2. Medium scenario
Status quo and scenario headcounts for National Vets Base4 Medium scenario
Assumptions DemandMigrationReentries LossesImmigrationStarting Training Dropouts
Status Quo assumptions 1.0% 1.00 1.00 1.00 1.00 2015 5 years 0.1%
User assumptions 1.0% 1.00 1.00 1.00 1.00 2015 5 years 0.1%
Projection Years 2012 2013 2014 2015 2016 2017 2018 2019 2020 2021 2022 2023 2024 2025
Required FTE 10,571 10,677 10,782 10,888 10,994 11,100 11,205 11,311 11,417 11,522 11,628 11,734 11,840 11,945
Status quo FTE 10,571 10,952 11,401 12,061 12,802 13,617 14,487 15,377 16,282 17,201 18,131 19,099 20,081 21,075
Status quo FTE gap 0 275 618 1,173 1,808 2,517 3,282 4,066 4,865 5,679 6,503 7,365 8,241 9,130
Adjusted FTE 10,571 10,952 11,401 12,061 12,802 13,617 14,487 15,377 16,282 17,201 18,131 19,099 20,081 21,075
Adjusted FTE gap 0 275 618 1,173 1,808 2,517 3,282 4,066 4,865 5,679 6,503 7,365 8,241 9,130
Status quo graduates 504 504 521 519 532 523 523 523 523 523 523 523 523
Additional graduates required 0 0 0 0 0 0 0 0 0 0 0 0 0
Adjusted graduates 504 504 521 519 532 523 523 523 523 523 523 523 523
Status quo placements 505 505 522 520 533 524 524 524 524 524 524 524 524
Net extra placements 0 0 0 0 0 0 0 0 0 0 0 0 0
Revised placements 505 505 522 520 533 524 524 524 524 524 524 524 524

Report on Projection Modelling for the Veterinarian Workforce 10 December 2014 Final Draft 53
8.3.3. High scenario
Status quo and scenario headcounts for National Vets Base4H high scenario
Assumptions Demand MigrationReentries LossesImmigrationStarting Training Dropouts
Status Quo assumptions 1.8% 1.00 1.00 1.00 1.00 2015 5 years 0.1%
User assumptions 1.8% 1.00 1.00 1.00 1.00 2015 5 years 0.1%
Projection Years 2012 2013 2014 2015 2016 2017 2018 2019 2020 2021 2022 2023 2024 2025
Required FTE 10,571 10,761 10,952 11,142 11,332 11,522 11,713 11,903 12,093 12,284 12,474 12,664 12,854 13,045
Status quo FTE 10,571 10,952 11,401 12,061 12,802 13,617 14,487 15,377 16,282 17,201 18,131 19,099 20,081 21,075
Status quo FTE gap 0 191 449 919 1,470 2,094 2,775 3,474 4,189 4,917 5,657 6,435 7,226 8,031
Adjusted FTE 10,571 10,952 11,401 12,061 12,802 13,617 14,487 15,377 16,282 17,201 18,131 19,099 20,081 21,075
Adjusted FTE gap 0 191 449 919 1,470 2,094 2,775 3,474 4,189 4,917 5,657 6,435 7,226 8,031
Status quo graduates 504 504 521 519 532 523 523 523 523 523 523 523 523
Additional graduates required 0 0 0 0 0 0 0 0 0 0 0 0 0
Adjusted graduates 504 504 521 519 532 523 523 523 523 523 523 523 523
Status quo placements 505 505 522 520 533 524 524 524 524 524 524 524 524
Net extra placements 0 0 0 0 0 0 0 0 0 0 0 0 0
Revised placements 505 505 522 520 533 524 524 524 524 524 524 524 524
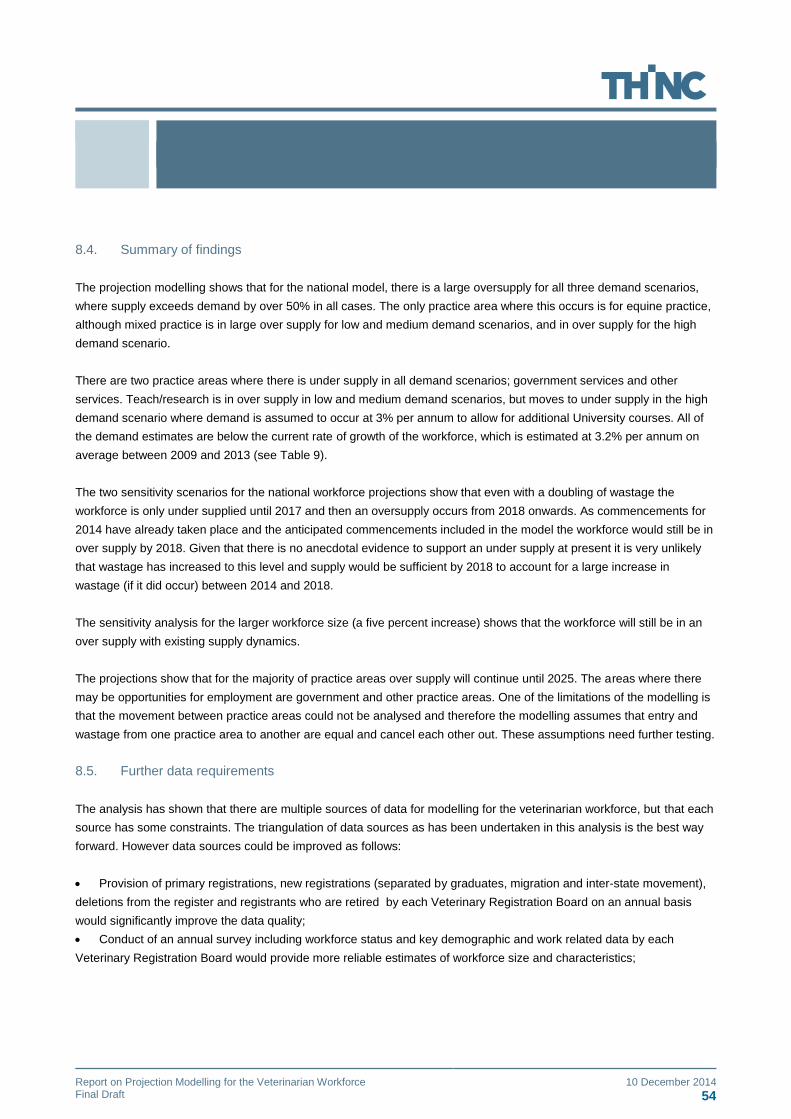
Report on Projection Modelling for the Veterinarian Workforce 10 December 2014 Final Draft 54
8.4. Summary of findings
The projection modelling shows that for the national model, there is a large oversupply for all three demand scenarios,
where supply exceeds demand by over 50% in all cases. The only practice area where this occurs is for equine practice,
although mixed practice is in large over supply for low and medium demand scenarios, and in over supply for the high
demand scenario.
There are two practice areas where there is under supply in all demand scenarios; government services and other
services. Teach/research is in over supply in low and medium demand scenarios, but moves to under supply in the high
demand scenario where demand is assumed to occur at 3% per annum to allow for additional University courses. All of
the demand estimates are below the current rate of growth of the workforce, which is estimated at 3.2% per annum on
average between 2009 and 2013 (see Table 9).
The two sensitivity scenarios for the national workforce projections show that even with a doubling of wastage the
workforce is only under supplied until 2017 and then an oversupply occurs from 2018 onwards. As commencements for
2014 have already taken place and the anticipated commencements included in the model the workforce would still be in
over supply by 2018. Given that there is no anecdotal evidence to support an under supply at present it is very unlikely
that wastage has increased to this level and supply would be sufficient by 2018 to account for a large increase in
wastage (if it did occur) between 2014 and 2018.
The sensitivity analysis for the larger workforce size (a five percent increase) shows that the workforce will still be in an
over supply with existing supply dynamics.
The projections show that for the majority of practice areas over supply will continue until 2025. The areas where there
may be opportunities for employment are government and other practice areas. One of the limitations of the modelling is
that the movement between practice areas could not be analysed and therefore the modelling assumes that entry and
wastage from one practice area to another are equal and cancel each other out. These assumptions need further testing.
8.5. Further data requirements
The analysis has shown that there are multiple sources of data for modelling for the veterinarian workforce, but that each
source has some constraints. The triangulation of data sources as has been undertaken in this analysis is the best way
forward. However data sources could be improved as follows:
Provision of primary registrations, new registrations (separated by graduates, migration and inter-state movement),
deletions from the register and registrants who are retired by each Veterinary Registration Board on an annual basis
would significantly improve the data quality;
Conduct of an annual survey including workforce status and key demographic and work related data by each
Veterinary Registration Board would provide more reliable estimates of workforce size and characteristics;
Report on Projection Modelling for the Veterinarian Workforce 10 December 2014 Final Draft 55
The development of transition matrices with the tracking of workforce status and practice area between two year
points would significantly enhance the calculation of flow dynamics;
The conduct of further research into demand assumptions including rates of pet ownership, levels of pet health
insurance and levels of usage of veterinary services by practice area should be undertaken and added to the available
pool of information;
Estimates of workforce size including adjustments for secondary practice areas should be undertaken to refine the
estimates;
Assumptions for the demand scenarios should be reviewed and updated as needed, particularly where there are
major shifts occurring due to government policy.