
Association of Plasma Lipids and Polar Metabolites with ......Diana Cabrera 1,2,*, Marlena Kruger...
18
International Journal of Environmental Research and Public Health Article Association of Plasma Lipids and Polar Metabolites with Low Bone Mineral Density in Singaporean-Chinese Menopausal Women: A Pilot Study Diana Cabrera 1,2, *, Marlena Kruger 1,3 ID , Frances M. Wolber 4 , Nicole C. Roy 2,3,5 , John J. Totman 6 , Christiani Jeyakumar Henry 7 ID , David Cameron-Smith 2,3,8 ID and Karl Fraser 2,3,5 ID 1 School of Food and Nutrition, Massey University, Tennent Drive, Palmerston North 4442, New Zealand; [email protected] 2 Food Nutrition & Health Team, Food & Bio-Based Products Group, AgResearch Grasslands, Palmerston North 4442, New Zealand; [email protected] (N.C.R.); [email protected] (D.C.-S.); [email protected] (K.F.) 3 Riddet Institute, Massey University, Palmerston North 4442, New Zealand 4 Centre for Metabolic Health Research, Massey University, Tennent Drive, Palmerston North 4442, New Zealand; [email protected] 5 High-Value Nutrition National Science Challenge, Auckland 1142, New Zealand 6 A*Star-NUS Clinical Imaging Research Centre, Singapore 117599, Singapore; [email protected] 7 A*Star-NUS Clinical Nutrition Research Centre, Singapore 117599, Singapore; [email protected] 8 The Liggins Institute, The University of Auckland, Auckland 1142, New Zealand * Correspondence: [email protected]; Tel.: +64-635-183-26 Received: 12 March 2018; Accepted: 19 May 2018; Published: 22 May 2018 Abstract: The diagnosis of osteoporosis is mainly based on clinical examination and bone mineral density assessments. The present pilot study compares the plasma lipid and polar metabolite profiles in blood plasma of 95 Singaporean-Chinese (SC) menopausal women with normal and low bone mineral density (BMD) using an untargeted metabolomic approach. The primary finding of this study was the association between lipids and femoral neck BMD in SC menopausal women. Twelve lipids were identified to be associated with low BMD by the orthogonal partial least squares (OPLS) model. Plasma concentrations of eight glycerophospholipid, glycerolipid, and sphingolipid species were significantly lower in menopausal women with low BMD but higher in two glycerophospholipid species (phosphatidylinositol and phosphatidic acid). Further, this study found no significant differences in plasma amino acid metabolites. However, trends for lower 4-aminobutyric acid, turanose, proline, aminopropionitrile, threonine, and methionine were found in women with low BMD. This pilot study identified associations between lipid metabolism and femoral neck BMD in SC women. Further studies are required on larger populations for evaluating the bone health effect of these compounds and their usefulness as clinical biomarkers for osteoporosis prediction in women. Keywords: metabolomics; lipidomics; osteoporosis; menopause; biomarkers 1. Introduction Menopausal women have a greater risk of bone loss and developing osteoporosis. Osteoporosis affects above 200 million people worldwide, and about 9 million osteoporotic fractures, of which 1.6 million are at the hip, are registered per year [1]. In Asian populations, hip fractures account for around 30% of those worldwide, and in Singapore, hip fracture rates have increased by 1.2% annually in Chinese women [2]. Int. J. Environ. Res. Public Health 2018, 15, 1045; doi:10.3390/ijerph15051045 www.mdpi.com/journal/ijerph
Transcript of Association of Plasma Lipids and Polar Metabolites with ......Diana Cabrera 1,2,*, Marlena Kruger...

International Journal of
Environmental Research
and Public Health
Article
Association of Plasma Lipids and Polar Metabolites withLow Bone Mineral Density in Singaporean-ChineseMenopausal Women: A Pilot Study
Diana Cabrera 1,2,*, Marlena Kruger 1,3 ID , Frances M. Wolber 4, Nicole C. Roy 2,3,5,John J. Totman 6, Christiani Jeyakumar Henry 7 ID , David Cameron-Smith 2,3,8 ID andKarl Fraser 2,3,5 ID
1 School of Food and Nutrition, Massey University, Tennent Drive, Palmerston North 4442, New Zealand;[email protected]
2 Food Nutrition & Health Team, Food & Bio-Based Products Group, AgResearch Grasslands,Palmerston North 4442, New Zealand; [email protected] (N.C.R.);[email protected] (D.C.-S.); [email protected] (K.F.)
3 Riddet Institute, Massey University, Palmerston North 4442, New Zealand4 Centre for Metabolic Health Research, Massey University, Tennent Drive, Palmerston North 4442,
New Zealand; [email protected] High-Value Nutrition National Science Challenge, Auckland 1142, New Zealand6 A*Star-NUS Clinical Imaging Research Centre, Singapore 117599, Singapore; [email protected] A*Star-NUS Clinical Nutrition Research Centre, Singapore 117599, Singapore; [email protected] The Liggins Institute, The University of Auckland, Auckland 1142, New Zealand* Correspondence: [email protected]; Tel.: +64-635-183-26
Received: 12 March 2018; Accepted: 19 May 2018; Published: 22 May 2018�����������������
Abstract: The diagnosis of osteoporosis is mainly based on clinical examination and bone mineraldensity assessments. The present pilot study compares the plasma lipid and polar metabolite profilesin blood plasma of 95 Singaporean-Chinese (SC) menopausal women with normal and low bonemineral density (BMD) using an untargeted metabolomic approach. The primary finding of this studywas the association between lipids and femoral neck BMD in SC menopausal women. Twelve lipidswere identified to be associated with low BMD by the orthogonal partial least squares (OPLS) model.Plasma concentrations of eight glycerophospholipid, glycerolipid, and sphingolipid species weresignificantly lower in menopausal women with low BMD but higher in two glycerophospholipidspecies (phosphatidylinositol and phosphatidic acid). Further, this study found no significantdifferences in plasma amino acid metabolites. However, trends for lower 4-aminobutyric acid,turanose, proline, aminopropionitrile, threonine, and methionine were found in women with lowBMD. This pilot study identified associations between lipid metabolism and femoral neck BMD in SCwomen. Further studies are required on larger populations for evaluating the bone health effect ofthese compounds and their usefulness as clinical biomarkers for osteoporosis prediction in women.
Keywords: metabolomics; lipidomics; osteoporosis; menopause; biomarkers
1. Introduction
Menopausal women have a greater risk of bone loss and developing osteoporosis. Osteoporosisaffects above 200 million people worldwide, and about 9 million osteoporotic fractures, of which1.6 million are at the hip, are registered per year [1]. In Asian populations, hip fractures account foraround 30% of those worldwide, and in Singapore, hip fracture rates have increased by 1.2% annuallyin Chinese women [2].
Int. J. Environ. Res. Public Health 2018, 15, 1045; doi:10.3390/ijerph15051045 www.mdpi.com/journal/ijerph

Int. J. Environ. Res. Public Health 2018, 15, 1045 2 of 18
In women, low oestrogen level is a risk factor for osteoporosis. Oestrogen withdrawal promotes theactivation of bone remodelling at the basic multicellular units (BMUs). Bone formation decreases becausethere is reduction of osteoblastic cell lifespan, and bone resorption increases as a result of increaseddifferentiation and lifespan of osteoclasts [3]. The impact of oestrogen loss in bone metabolism, includingseveral biochemical and physiological alterations, is characterized by high levels of oxidative stress,inflammation, and altered metabolism in the bone microenvironment [4,5]. Changes in lipid and polarmetabolites have been associated with oxidative stress and inflammation affecting bone metabolism.Previous studies demonstrated that oxidative stress, caused by mitochondrial alterations, inducesreactive oxygen species (ROS) generation, and leads to osteoblast cell death by increasing the oxidizedbone microenvironment [6,7]. In addition, oestrogen withdrawal upregulates bone microenvironmentpro-inflammatory cytokines like interleukin-1 (IL-1), interleukin-6 (IL-6), tumor necrosis factor-α(TNF-α), granulocyte macrophage colony-stimulating factor, macrophage colony-stimulating factor(M-CSF), and prostaglandin-E2 (PGE2), which regulate osteoclast differentiation and function andtherefore bone loss [8,9]. Osteoporosis may be present before diagnosis; despite current serumbiochemical analysis and radiological examination methods for screening of osteoporosis and fracturerisk in women [10], none of these methods are suitable for prediction of early bone loss in women.The elucidation of the cellular and biochemical events on bone metabolism after oestrogen withdrawalmay lead to a better understanding of the molecular mechanisms involved in osteoporosis and bonecell signalling pathways in women, and subsequently identify early predictors of bone loss that can beused as prognostic markers.
Metabolomics offers the potential for analyzing the biochemical changes in the pathology ofdiseases. Metabolomic studies are conducted by using several analytical platforms; however, nuclearmagnetic resonance (NMR) and mass spectrometry (MS) are the most widely reported techniques [11].A small number of plasma metabolomic studies have reported that the metabolite concentration shiftsunder menopausal conditions in ovariectomized (OVX) animals and humans [12–15], while numerousstudies on the relationship between bone loss and low oestrogen levels in both OVX animals andhumans have been reported [16–22].
Because of the limited information reported on the association between the plasma metabolomeand bone mineral density (BMD) in Singaporean-Chinese menopausal women (SC), research in this areais required to allow the identification of potential metabolites that can be used to understand the causalpathways involved in menopausal osteoporosis. We hypothesized that novel metabolomic markers willimprove the prediction of SC menopausal women at increased osteoporotic risk. Therefore, this studyaimed to analyze the lipid and polar metabolite profiles of blood plasma SC menopausal women usinga liquid chromatography–mass spectrometry (LC–MS) untargeted metabolomic approach. Moreover,to maximize the identification of biomarkers associated with bone loss in menopausal women, wealso performed statistical tests on a restricted subset of the SC women with either osteoporosis(T-score < −2.5) or normal BMD (T-score > −1). We hypothesized that lipids and polar metabolitesof women with osteoporosis differed from the whole population. Further, correlation analyses wereconducted between metabolites and femoral neck bone mineral density (BMD) in menopausal women.
2. Materials and Methods
2.1. Standards and Reagents
Formic acid, d2-tyrosine, sucrose, alanine, arginine, asparagine, aspartic acid, glutamic acid,glutamine, histidine, homoserine, isoleucine, leucine, lysine, phenylalanine, proline, serine, theanine,threonine, tyrosine, valine, amino acid standard mixture (physiological mixture), 16:0 d31-18:1 PE(phosphatidylethanolamine), and ammonium formate were purchased from Sigma–Aldrich ChemicalsCo. (St. Louis, MO, USA). Ultrapure water was obtained from a Milli-Q® system (Millipore, Bedford,MA, USA). Acetonitrile (ACN), methanol and isopropanol were optima LC–MS grade, chloroform

Int. J. Environ. Res. Public Health 2018, 15, 1045 3 of 18
was high-performance liquid chromatography (HPLC) grade, and all were purchased from ThermoFisher Scientific (Auckland, New Zealand).
2.2. Study Population, Inclusion and Exclusion Criteria
All subjects were informed about the objective of the study and gave their informed consent forthe participation in the present study. The study was approved by the Ethics Committee for ResearchInvolving Human Subjects, Singapore (Approval No. 2014/01066). The study was done in accordancewith the Declaration of Helsinki (2000) of the World Medical Association.
Ninety-seven SC menopausal women aged between 55 and 70 years were included in the study.The key inclusion criterion was women who were at least five years menopausal (based on a historyof cessation of menstruation). Exclusion criteria included prior diagnosis with osteoporosis, diabetesmellitus or any condition that affects bone and liver function, and to not be taking any medication thatwill affect the study.
2.3. Blood Collection
Blood samples were taken only once between 8 and 10 a.m., after an overnight fast (10–12 h).Blood was collected in ethylenediamine tetraacetic acid (EDTA) tubes (BD VacutainerTM K3E 15%,Becton, Dickinson and Company, Plymouth, UK) and plasma samples transferred into separate 1 mLtubes for extractions for metabolomics analysis; C-terminal telopeptide of type I collagen (CTx-1),parathyroid hormone (PTH) and 25(OH) vitamin D3 were stored frozen at −80 ◦C and thawed on theday of the analysis.
2.4. Analysis of Blood Parameters
Blood samples were taken to measure plasma markers of CTx-1 as well as PTH and 25(OH)vitamin D3. CTx-1 and PTH concentrations were analyzed by electrochemiluminescence immunoassayusing the Roche COBAS® e411 system (Roche Diagnostics, Indianapolis, IN, USA). Serum 25(OH)vitamin D3 concentration was analyzed using isotope-dilution liquid chromatography–tandem massspectrometry (IDLC–MS–MS) [23] by Canterbury Health Laboratories, Christchurch, New Zealand.
2.5. Bone Mineral Density
BMD was measured using dual X-ray absorptiometry (DXA). DXA scans of hip (femoral neck)were carried out using a Hologic QDR-Discovery A densitometer (Hologic Discovery QDR 4500Adensitometer, Hologic Inc., Bedford, MA, USA). BMD was determined and women were classifiedinto normal or low BMD according to the World Health Organization (WHO) classification. WHOprovides an operational definition of osteoporosis based on T-score, where the T-score is the numberof the standard deviation below of the mean peak BMD for young-adults. Women with a BMD 2.5standard deviations below are classified as osteoporotic. In this study, participants in the entire cohortwere classified into two groups according to bone status: (1) low BMD = women with a T-score < −1,and (2) normal BMD = women with a T-score > −1.0. Further, a selected subset of participants werealso classified into two groups: (1) osteoporosis = women with a T-score < −2.5, and (2) normal BMD:women with T-score > −0.1 [24].
2.6. Metabolomic Analysis
2.6.1. Sample Preparation
Lipids and polar metabolites were extracted from plasma using a biphasic solvent. Lipids wereanalyzed by reverse-phase liquid chromatography–mass spectrometry (RP LC–MS) with positive- andnegative-mode electrospray ionization. Polar metabolites were analyzed by hydrophilic interactionliquid chromatography–mass spectrometry (HILIC LC–MS) with only positive-mode electrosprayionization. Briefly, plasma samples were thawed in fridge at 4 ◦C. Then, the samples were vortexed

Int. J. Environ. Res. Public Health 2018, 15, 1045 4 of 18
for 1 min. 100 µL of plasma was transferred to a microcentrifuge tube and 800 µL of coldchloroform:methanol (1:1 v/v) were added to the tubes. The tubes were agitated by hand for 1 minand the samples were stored for 30 min at -20 ◦C. 400 µL of water were added to each sample andvortexed for 30 s. The samples were centrifuged for 15 min at 13,913 g at 4 ◦C. 200 µL of the lowerphase (organic phase) were taken for lipid analysis and transferred to a new microcentrifuge tube toevaporate to dryness under a stream of nitrogen. Two hundred and fifty µL of the upper phase (polaraqueous) were collected for polar metabolite analysis and transferred in to new microcentrifuge tubeto evaporate to dryness under stream of nitrogen. The lower-phase tubes were reconstituted in 100 µLof Folch solvent mixture (choroform:methanol 2:1 v/v) containing 16:0 d31-18:1-PE internal standard at10 µg/mL concentration. The upper-phase tubes were reconstituted in 300 µL of ACN:water (1:1 v/v)containing formic acid (0.1%). All the samples were vortexed for 1 min, centrifuged for 10 min 13,913 gat 4 ◦C and 100 µL were transferred to a vial containing an insert and stored at 4 ◦C for immediatepolar metabolite analysis. Polar metabolite quality control (QC) samples were prepared with 60 µL ofeach sample and placed in a tube to be pooled. The pooled QC samples were transferred into multiplepooled QC vials. Lipid QC samples were prepared with 20 µL of each sample. The pooled lipid QCsamples were aliquoted into multiple pooled quality control vials [25].
2.6.2. LC-MS Conditions and Metabolite Identification
Untargeted metabolomic approach was carried out on the Thermo LC–MS system (ThermoFisher Scientific, Waltham, MA, USA). This system consisted of an Accela 1250 quaternary pump,a Thermo-PAL auto-sampler fitted with a 15,000 psi injection valve (CTC Analytics AG., Zwingen,Switzerland).
Lipid chromatographic separation was conducted by using a C18 column (100 × 2.1 mm; 1.7 µmparticle size, Waters, Milford, MA, USA). The samples were separated with a gradient elution programand flow rate of 600 µL/min. The mobile phase was a mixture of 0.1% formic acid in ACN–isopropanol(50:50, v/v) (Solvent A), 0.1% formic acid in ACN-water (60:40 v/v) with 10 mM ammonium formate(Solvent B) and a mixture of 0.1% formic acid in isopropanol-ACN (90:10 v/v) with 10 mM ammoniumformate (Solvent C). The gradient elution was conducted starting with 85% solvent B (0–1 min),decreased at 70–18% (2–11 min) and held at 1% (11.50–14 min), returned to 85% (22–27 min), whilesolvent A was held at 100% (14.1–22 min) and allowed to equilibrate for 5 min prior to the next sampleinjection. Column effluent was connected to a 2 µL injection loop and a Q Exactive Orbitrap massspectrometer using positive and negative electrospray ionization. Data were collected in profile dataacquisition mode over a mass range of m/z 200–2000 at a mass resolution setting of 70,000 with amaximum trap fill time of 100 ms using the Xcalibur software package ver. 2.2 SP1.48 provided by themanufacturer (Thermo Fisher Scientific, San Jose, CA, USA). Lipid positive ion mode parameters wereas follows: spray voltage, 3.2 kV; capillary temperature, 275 ◦C; capillary voltage, −0.2 V, tube lens120 V. Negative ion mode parameters were as follows: spray voltage, −3.2 kV; capillary temperature,275 ◦C; capillary voltage, −0.1 V, tube lens −100 V.
Polar metabolites chromatographic separation was conducted by using a ZIC-pHILIC column(100 mm × 2.1 mm, 5 µm; Merck, Darmstadt, Germany). The samples were separated with a gradientelution program and a flow rate of 250 µL/min. The mobile phase was a mixture of ACN-formic acid(99.9:0.1, v/v) (solvent A) and water–ammonium formate (16 mM, pH 6.3) (solvent B). The gradientelution programme was: held at 97% A (0–1 min), 97–70% A (1–12 min), 70–10% A (12–14.5 min),held at 10% A (14.5–17 min), returned to 97% A (17–18.5 min) and allowed to equilibrate for a further5.5 min prior to the next injection. Column effluent was connected to a 20 µL injection loop and anExactive Orbitrap mass spectrometer using positive and negative electrospray ionization. Data werecollected in profile data acquisition mode over a mass range of m/z 55–1100 at a mass resolution settingof 25,000 with a maximum trap fill time of 100 ms using the Xcalibur software package provided bythe manufacturer. Samples were run in positive ionization mode. HILIC positive ion mode parameters
Int. J. Environ. Res. Public Health 2018, 15, 1045 5 of 18
were as follows: spray voltage, 2.7 kV; capillary temperature, 275 ◦C; capillary voltage, 29.1 V, tubelens 108.8 V.
2.6.3. Metabolite Identification and Processing
Raw LC–MS data were acquired using Xcalibur v2.1 software (Thermo Scientific, HemelHemstead, UK). The raw data for each sample analysis consisted LC-MS signals identified by m/z,retention time and ion signal intensity. The full datasets were imported and converted to .mzXML filesby MSconvert (ProteoWizard; Software Foundation, San Diego, CA, USA). Then, XCMS was used toextract the ions of the spectra (determines mass-to charge ratios m/z), detect chromatographic peaks(retention time), assign them to molecular ions or adducts, align peaks across samples and quantifytheir relative abundance, which is calculated based on peak area ratios from sample peaks. Finally,peak detection, grouping, and retention time correction were recorded into peak tables [26]. Data fromlipids and polar metabolites were unavailable for two participants. In total, the full datasets for 95participants were included in the analysis.
Peak intensities of each sample were corrected for run-order signal correction by using a locallyquadratic (loess) regression model to fit the QC values. Metabolites with a coefficient of variation oftheir QC values superior to 30% after run-order correction were removed from the peak table [27].Missing values in the peak tables were replaced by using k-nearest neighbour (KNN) method. Tentativeidentification of key metabolites was achieved by using an in-house library, as well as in the appropriatemetabolite databases: LipidSearch software (Thermo Scientific, San Jose, CA, USA), the HumanMetabolome data-base (HMDB) [28] and METLIN [29].
2.7. Statistical Analyses
2.7.1. Univariate Analysis
The characteristic of the study population was compared using t-test. Normality of the datawas tested using the Shapiro–Wilk normality test in. Age, BMI, CTx-1, PTH, vitamin D3, andBMD parameters were expressed as mean and standard deviation (SD). Analysis of covariancewas performed to adjust for possible confounders using age and BMI. In addition, our objectivewas to assess whether lipids and amino acids were associated to BMD. Age-adjusted correlationcoefficients were calculated for each lipid and polar metabolites. Age and BMI adjusted meanconcentrations of each lipid and polar metabolite were calculated in both groups. To assess whetherthose associations were independent, we evaluated the pairwise correlations between identified lipidsand polar metabolites. p values were calculated using Benjamini–Hochberg false discovery rate (FDR),where FDR p-value < 0.05 was considered as statistically significant. The fold changes in lipids andpolar metabolites between BMD groups were performed by parametric test using Metaboanalyst 4.0web server [30]. Statistical data analysis was performed using R (R 3.3.3, R Foundation for StatisticalComputing, Vienna, Austria).
2.7.2. Multivariate Analysis
Prior to multivariate analysis (MVA), different data sets were created (1) an entire cohortcontaining all samples (n = 95) and (2) a subset (n = 30), in which only 15 women with osteoporosis and15 women with normal BMD were included. Both the entire cohort and subset were used for modellingthe correlations between BMD and metabolites in SC menopausal women. For MVA, each variable wasmean centered and univariate scaled over all the samples and imported to SIMCA-P+ v14.1 software(Umetrics, Umea, Sweden). SIMCA was used to construct an orthogonal partial least squares (OPLS)regression model for analyzing BMD. The supervised method analyzes the linear relationship betweenBMD and metabolite profiles. In OPLS, the R2X, R2Y, and Q2 (cum) parameters were used for themodel evaluation, representing the explanation, fitness and prediction power respectively. R2X isthe percentage of all LC-MS response variables explained by the model. R2Y is the percentage of all

Int. J. Environ. Res. Public Health 2018, 15, 1045 6 of 18
sample variables explained by the model. Q2 is the percentage of all sample variables predicted bythe model [31]. Only one component was extracted to predict membership probability in each group.Then, from the coefficient score plot, a normal probability plot was created and 95% of features wereexcluded to fit a new model. The objective was to select the most relevant variables from the interactionbetween the metabolites and femoral neck BMD relative to bone status (step 1, OPLS methods) and toadd these variables into a new model to display the contribution of each metabolite to the modulationof osteoporosis (step 2).
3. Results
This study analyzed lipid and polar metabolites in blood plasma of SC menopausal women.Overall, after analyzing lipid and polar metabolites, two data sets were created for further multivariateanalysis. The correlations between those compounds and femoral neck BMD were investigated byusing univariate and OPLS regression statistical analyses. The lipid profiles revealed differences inplasma of women with normal BMD and lower BMD/ osteoporosis. Polar metabolites exhibited nodifferences; however, a trend was observed in several metabolites such as a peptide, amino acids,and amines.
3.1. Characteristics of the Menopausal Women Bone Status
Women with low BMD were older and had lower BMI when compared with women in thenormal group. PTH concentrations were lower in the menopausal groups with low BMD/osteoporosiscompared to normal BMD groups. (Table 1). Serum 25(OH) vitamin D3 concentrations were adequate(equal to or >50 nmol/L) for all the groups. Bone resorption marker (CTx-1) concentrations weresignificant higher in the menopausal group with low BMD/ osteoporosis compared to normalBMD groups.
Table 1. Characteristics of the SC menopausal women according to bone status, entire cohort (n = 95)and subset (n = 30) analyses.
Parameters
Entire Cohort (n = 95) Subset (n = 30)
Normal BMD(n = 23)
Low BMD(n = 72) p-Value Normal BMD
(n = 15)Osteoporosis
(n = 15) p-Value
Age (years) 59.4 (4.19) 61.3 (4.19) 0.06 58 (3.42) 61 (3.42) 0.02 *BMI (kg/m2) 23.8 (2.61) 22.5 (2.61) 0.04 * 23.8 (2.25) 20.7 (2.25) <0.001 *
PTH (pmol/L) 4.7 (1.35) 4.5 (1.32) 0.29 4.8 (1.59) 4.3 (1.59) 0.08CTx-1 (ug/L) 0.44 (0.21) 0.55 (0.20) 0.02 * 0.41 (0.26) 0.64 (0.26) 0.04 *
Vitamin D (nmol/L) 57.4 (15.24) 60.1 (14.87) 0.23 56.5 (16.84) 54.8 (16.84) 0.81Femoral neck BMD (g/cm2) 0.75 (0.05) 0.60 (0.05) <0.001 * 0.78 (0.04) 0.51 (0.04) <0.001 *
Data are presented as mean (SD). The resulting p-values obtained by ANOVA are given. * p < 0.05 was consideredas statistically significant.
3.1.1. Entire Cohort
Table 1 shows the population characteristics for the menopausal women. The mean ages for thesegroups were 59.4 and 61.3 for the normal and low BMD groups, respectively. Women with low BMDhad lower BMI than those with normal BMD (23.8 vs. 22.5 kg/m2, p = 0.04) There were no significantdifferences between the groups for PTH and 25(OH) vitamin D3 concentrations. Mean PTH was 4.7and 4.5 pmol/L (p = 0.29) and mean 25(OH) vitamin D3 concentrations were 57.4 and 60.1 nmol/L(p = 0.23) for the normal and low BMD groups, respectively. However, CTx-1 concentrations andfemoral neck BMD were significant different. Mean CTx-1 concentrations were 0.44 and 0.55 ug/L forthe normal versus low BMD group. Femoral neck BMD was 0.75 g/cm2 and 0.60 g/cm2 (p ≤ 0.001) forthe normal and low BMD groups, respectively.

Int. J. Environ. Res. Public Health 2018, 15, 1045 7 of 18
3.1.2. Subset
Women with osteoporosis were older than those with normal BMD (58 vs. 61, p = 0.02), and hadlower BMI (23.8 vs. 20.7 kg/m2, p = 0.008). Similarly, there were no significant differences between thegroups for PTH, CTx-1, and 25(OH) vitamin D3 concentrations. Mean PTH was 4.8 and 4.3 pmol/L(p = 0.08) and mean 25(OH) vitamin D3 concentrations were 56.1 and 54.8 nmol/L (p = 0.81) for thenormal BMD and osteoporosis groups, respectively. Serum CTx-1 concentrations were 0.41 and0.64 ug/L (p = 0.04) and femoral neck BMD was 0.78 g/cm2 and 0.51 g/cm2 (p < 0.001) for the normalBMD and osteoporosis groups, respectively.
3.2. Untargeted Analysis Metabolomic Approach
3.2.1. Lipids
Entire Cohort
Overall, 7082 features (positive and negative ionization) were detected by lipidomics and afterfiltration and removal of noise and unstable compounds, the remaining 1662 lipid features were fittedwithin the OPLS model. The OPLS model was fitted and the cumulative R2Y and Q2 values were 0.302and 0.042, respectively (Table 2). However, the predictive ability for the model Q2 was low, whichindicated that it was not a good model. Therefore, the OPLS model with 1662 features was not able toexplain the association of the explanatory variables and femoral neck BMD.
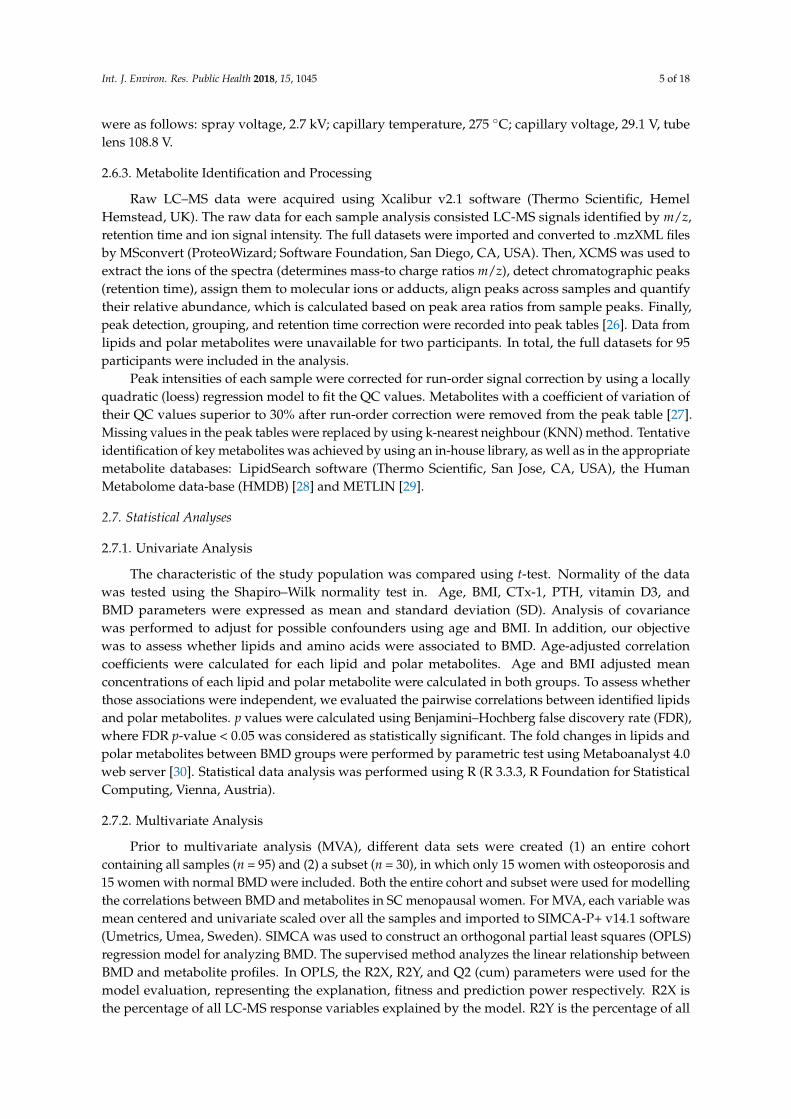
Subsequently, a new model was created by selecting those features based on the exclusionof un-correlated lipid features on the normal probability coefficient score plot (between >0.05 and<0.95%), from model 1 resulting in 98 lipids being selected. The new model yielded R2Y and Q2values of 0.469 and 0.233, respectively (Table 2). The new OPLS model parameters for fitness and thepredictive capability Q2 were better than in the previous model (step 1) and significant based on thecross-validated analysis of variance (CV-ANOVA) (p ≤ 0.001). Figure 1a shows the OPLS predictivemodel for femoral neck BMD of the lipidomic plasma extracts from normal and low BMD menopausalwomen. A lineal clustering of the low BMD menopausal women occurred on the left hand of the plot,while normal BMD were clustered on the right top hand side. The results indicated that lipids changelinearly with femoral neck BMD (R2Y = 0.469). Further, positive correlations values (upper portion ofthe plot) indicated increased serum lipid concentrations in normal BMD versus low BMD.
Table 2. Parameters of orthogonal partial least-squares regression models based on the data from lipidsseparation for the entire cohort and the selected subset of SC menopausal women.
Dataset Step Component R2X R2Y Q2
Entire cohort (n = 95) 1 1P and O1 0.395 0.302 0.042Entire cohort (n = 95) 2 1P and O2 0.678 0.469 0.233
Subset (n = 30) 1 1P and O1 0.434 0.601 0.209Subset (n = 30) 2 1P and O1 0.540 0.773 0.540
P predictive. O orthogonal in X. Component: number of significant component calculated by cross validation. R2Xvalue is the predictive and orthogonal variation in model samples (X) explained by the model. R2Y value is theamount of variation in X which is correlated to Y (response matrix). Q2 value describes the predictive ability ofthe model.
We found negative associations between femoral neck BMD and the lipids of menopausalwomen. Based on univariate analysis, the top 50 features were significant by t-tests. However,only 5 features resulted to be known lipids and these were associated to femoral neck BMD(Table 3). The 5 known lipids include 3 phosphatidylserine (PS), 1 diacylglycerol (DG) and 1plasmenylphosphatidylethanolamine (plasmenyl-PE). The PS species detected comprised 36:1, 33:6and 29:6, where a decreasing common trend was observed in low BMD group. A correlation matrixrevealed negative correlations among the five lipids and femoral neck BMD, PS 36:1 (r = −0.027),PS 33:6 (−0.070), PS 29:6(−0.086), DG 42:4 (r = −0.075), and plasmenyl-PE 38:4 (r = −0.01).
Int. J. Environ. Res. Public Health 2018, 15, 1045 8 of 18Int. J. Environ. Res. Public Health 2018, 15, x 8 of 18
Figure 1. Orthogonal partial least squares (OPLS). OPLS scatter plot of SC menopausal women with normal (green circles) and low BMD and osteoporosis (red circles) values based on orthogonally filtered partial square (OPLS) regression model 2. Graph (a): 98 lipids among 95 women, entire cohort. Graph (b): 149 lipids among 30 women, subset. t[1]/u[1] correlation plot; t1 refers to scores of the first component in independent variables; u1 refers to scores of the first component in responses.
Table 3. Means and 95% confidence interval of lipids associated to the entire cohort of SC menopausal women (n = 95) with normal and low femoral neck BMD in univariate and multivariate approaches.
Lipid Normal BMD a (n = 23)
Low BMD a
(n = 72) p-Value log2 (FC) Correlation b
PS 31:6; [M + H]+ 0.893
(0.427–1.871) 0.867
(0.675–1.114) 0.939 −0.455 −0.027
PS 33:6; [M + H]+ 0.857
(0.408–1.800) 0.876
(0.681–1.127) 0.955 −0.373 −0.070
PS 29:6; [M + H]+ 0.906
(0.428–1.918) 0.921
(0.714–1.188) 0.967 −0.296 −0.086
DG 42:4; [M + NH4]+ 0.850
(0.395–1.828) 0.947
(0.725–1.219) 0.804 −0.176 −0.075
Plasmenyl-PE 38:4; [M + H]+ 0.745
(0.353–1.571) 0.841
(0.653–1.083) 0.760 −0.174 −0.01
Lipids are expressed as mean and 95% confidence interval (CI). ANOVA was used to compare lipid mean concentrations. a Covariates: age and BMI; b Age-adjusted correlation coefficient. Statistical p-value calculated using Benjamini–Hochberg false discovery rate (FDR). p-value < 0.05 was considered as statistically significant. Fold of change (FC) expressed as the relation between the lipid mean of the normal BMD group to the lipid mean of the low BMD group. + Adducts in positive ionisation. –
Adducts in negative ionisation. PS (phosphatidylserine), DG (diacylglycerol), plasmenyl-PE (plasmenylphosphatidylethanolamines).
Subset
Similarly, an additional OPLS regression model was fitted to the subset of samples (n = 30) with the 1662 lipids to analyze the relationship of femoral neck BMD and lipids.
This OPLS model showed the relationship between the predictive values equals to the observed responses and this was described by high values of R2Y and Q2, 0.601 and 0.209 (Table 2). After excluding 95% of the lipids, a new OPLS model (step 2) was fitted with 149 lipids. The scatter plot for this statistical analysis showed a straight line indicating a relationship between the predictive values equal to the observed responses (Figure 1b). This new model showed higher values of R2Y and Q2 0.773 and 0.54 and was significant based on the CV-ANOVA (p ≤ 0.001), and also showed a strong linear correlation of R2Y = 0.772. Lipids that were highly associated to the normal and osteoporosis groups through both approaches are listed in Table 4. Twelve known lipids were significant and
Figure 1. Orthogonal partial least squares (OPLS). OPLS scatter plot of SC menopausal women withnormal (green circles) and low BMD and osteoporosis (red circles) values based on orthogonally filteredpartial square (OPLS) regression model 2. Graph (a): 98 lipids among 95 women, entire cohort. Graph(b): 149 lipids among 30 women, subset. t[1]/u[1] correlation plot; t1 refers to scores of the firstcomponent in independent variables; u1 refers to scores of the first component in responses.
Table 3. Means and 95% confidence interval of lipids associated to the entire cohort of SC menopausalwomen (n = 95) with normal and low femoral neck BMD in univariate and multivariate approaches.
Lipid Normal BMD a
(n = 23)Low BMD a
(n = 72) p-Value log2 (FC) Correlation b
PS 31:6; [M + H]+ 0.893(0.427–1.871)
0.867(0.675–1.114) 0.939 −0.455 −0.027
PS 33:6; [M + H]+ 0.857(0.408–1.800)
0.876(0.681–1.127) 0.955 −0.373 −0.070
PS 29:6; [M + H]+ 0.906(0.428–1.918)
0.921(0.714–1.188) 0.967 −0.296 −0.086
DG 42:4; [M + NH4]+ 0.850(0.395–1.828)
0.947(0.725–1.219) 0.804 −0.176 −0.075
Plasmenyl-PE 38:4; [M + H]+ 0.745(0.353–1.571)
0.841(0.653–1.083) 0.760 −0.174 −0.01
Lipids are expressed as mean and 95% confidence interval (CI). ANOVA was used to compare lipid meanconcentrations. a Covariates: age and BMI; b Age-adjusted correlation coefficient. Statistical p-value calculatedusing Benjamini–Hochberg false discovery rate (FDR). p-value < 0.05 was considered as statistically significant. Foldof change (FC) expressed as the relation between the lipid mean of the normal BMD group to the lipid mean of thelow BMD group. + Adducts in positive ionisation. – Adducts in negative ionisation. PS (phosphatidylserine), DG(diacylglycerol), plasmenyl-PE (plasmenylphosphatidylethanolamines).
Subset
Similarly, an additional OPLS regression model was fitted to the subset of samples (n = 30) withthe 1662 lipids to analyze the relationship of femoral neck BMD and lipids.
This OPLS model showed the relationship between the predictive values equals to the observedresponses and this was described by high values of R2Y and Q2, 0.601 and 0.209 (Table 2). Afterexcluding 95% of the lipids, a new OPLS model (step 2) was fitted with 149 lipids. The scatter plot forthis statistical analysis showed a straight line indicating a relationship between the predictive valuesequal to the observed responses (Figure 1b). This new model showed higher values of R2Y and Q20.773 and 0.54 and was significant based on the CV-ANOVA (p ≤ 0.001), and also showed a stronglinear correlation of R2Y = 0.772. Lipids that were highly associated to the normal and osteoporosisgroups through both approaches are listed in Table 4. Twelve known lipids were significant andincluded 1 phosphatidic acid (PA), 2 ceramide-1phosphates (CerP), 4 phosphatidylserine (PS) species,
Int. J. Environ. Res. Public Health 2018, 15, 1045 9 of 18
3 diacylglycerol (DG) species, 1 phosphatidylethanolamine (PE), and 1 phosphatidylinositol (PI)(Table 4). A correlation matrix revealed negative correlations among eight lipids and femoral neckBMD, while a positive correlation was observed with PS (20:4), PI, CerP (24:0), and PE (Table 4).
Table 4. Means and 95% confidence intervals of lipids associated to the subset of selectedSC menopausal women (n = 30) with normal BMD and osteoporosis in univariate andmultivariate approaches.
Lipid Normal BMD a
(n = 15)Osteoporosis a
(n = 15) p-Value log2 (FC) Correlation b
PA 34:4; [M − H]− 0.531(0.321–0.878)
1.617(0.822–3.182) 0.005 * 0.412 −0.403
CerP 38:1; [M + H]+ 1.871(1.196–2.927)
0.605(0.3319–1.105) 0.002 * −0.637 −0.384
PS 20:4; [M − H]− 0.547(0.330–0.906)
1.585(0.804–3.124) 0.008 * 0.395 0.274
DG 40:0; [M + NH4]+ 1.545(0.907–2.630)
0.425(0.207–0.870) 0.0029 * 0.729 −0.270
PS 33:6; [M + H]+ 1.435(0.908–2.267)
0.504(0.277–0.933) 0.0046 * −0.560 −0.363
PS 31:6; [M + H]+ 1.423(0.886–2.286)
0.506(0.267–0.958) 0.0065 * −0.656 −0.377
PS 32:6; [M + H]+ 1.414(0.885–2.259)
0.515(0.274–0.967) 0.007 * −0.573 −0.359
PI 14:0; [M − H]− 0.608(0.357–1.036)
1.572(0.767–3.220) 0.022 * 0.327 0.165
DG 42:4; [M + NH4]+ 1.510(0.976–2.336)
0.574(0.319–1.033) 0.005 * −0.327 −0.374
CerP 24:0; [M − H]− 1.254(0.728–2.160)
0.418(0.201–0.869) 0.010 * −0.265 0.008
DG 47:5; [M + NH4]+ 1.670(0.920–3.032)
0.854(0.382–1.905) 0.135 −0.351 −0.014
PE 42:1; [M − H]− 0.592(0.346–1.013)
1.246(0.605–2.568) 0.069 0.585 0.034
Lipids are expressed as mean and 95% confidence interval (CI). ANOVA was used to compare lipid meanconcentrations. a Covariates: age and BMI; b Age-adjusted correlation coefficient; Statistical p-value calculated usingBenjamini–Hochberg false discovery rate (FDR). * p-value < 0.05 was considered as statistically significant. Fold ofchange (FC) expressed as the relation between the lipid mean of the normal BMD group to the lipid mean of theosteoporosis group. + Adducts in positive ionisation. − Adducts in negative ionisation. PS (phosphatidylserine),PA (phosphatidic acid), DG (diacylglycerol), PE (phosphatidylethanolamine), CerP (ceramide-1-phosphate), PE(phosphatidylethanolamine), and PI (phosphatidylinositol).
3.2.2. Polar Metabolites
Entire Cohort
574 features (positive ionisation) were detected by metabolomics. After filtration and removal ofunwanted background and unstable compounds, the remaining 127 polar metabolites were fitted in anOPLS regression model. However, cumulative R2Y and Q2 values were 0.223 and −0.371, respectively(Table 5), and the predictive ability for the model Q2 was very low, which indicated that it was not asuitable model.
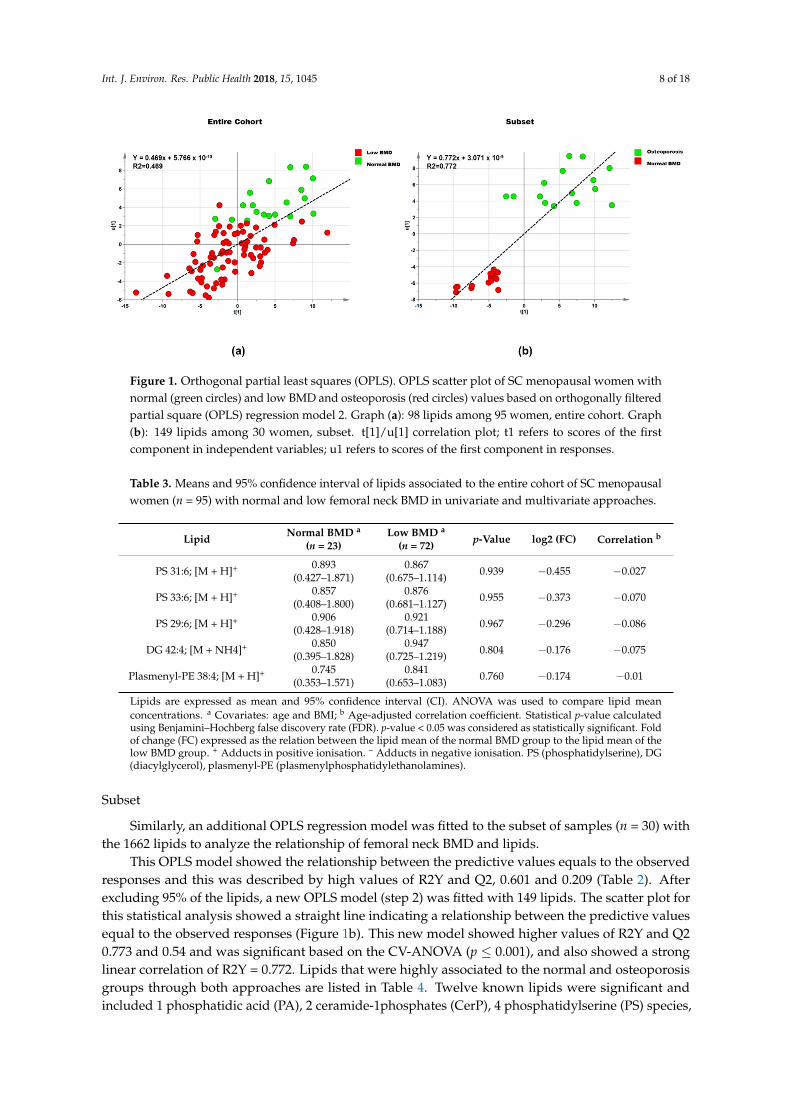
Features scoring between >0.05 and <0.95% on the normal probability coefficient score plot weretaken out to fit a new model (step 2), which had only 12 polar metabolites. Values of cumulative R2Yand Q2 values of for this OPLS model were 0.205 and 0.035, respectively (Figure 2a). Both step 1 andstep 2 for polar metabolites showed little prediction for the two OPLS regression models. Therefore, theOPLS model with 127 features was not able to explain the association of the explanatory variables andfemoral neck BMD. However, this analysis provided evidence for the association between four polarmetabolites and femoral neck BMD (Table 6), 4 aminobutyric acid (r = −0.013), threonine (r = −0.172),a tripeptide formed by asparagine-glycine-cystine (asn-gly-cys) (r = −0.059), and turanose (r = −0.039).

Int. J. Environ. Res. Public Health 2018, 15, 1045 10 of 18
Table 5. Parameters of orthogonal partial least squares regression models based on the data from polarmetabolites separation for the entire cohort and the selected subset of SC menopausal women.
Dataset Step Component R2X R2Y Q2
Entire cohort (n = 95) 1 1P and O1 0.483 0.223 −0.371Entire cohort (n = 95) 2 1P and O1 0.512 0.205 0.035
Subset (n = 30) 1 1P and O1 0.437 0.749 −0.399Subset (n = 30) 2 1P and O1 0.514 0.526 0.247
P: predictive. O: orthogonal in X. Component: number of significant component calculated by cross-validation. R2Xvalue is the predictive and orthogonal variation in model samples (X) explained by the model. R2Y value is theamount of variation in X which is correlated to Y (response matrix). Q2 value describes the predictive ability ofthe model.
Int. J. Environ. Res. Public Health 2018, 15, x 10 of 18
Features scoring between >0.05 and <0.95% on the normal probability coefficient score plot were taken out to fit a new model (step 2), which had only 12 polar metabolites. Values of cumulative R2Y and Q2 values of for this OPLS model were 0.205 and 0.035, respectively (Figure 2a). Both step 1 and step 2 for polar metabolites showed little prediction for the two OPLS regression models. Therefore, the OPLS model with 127 features was not able to explain the association of the explanatory variables and femoral neck BMD. However, this analysis provided evidence for the association between four polar metabolites and femoral neck BMD (Table 6), 4 aminobutyric acid (r = −0.013), threonine (r = −0.172), a tripeptide formed by asparagine-glycine-cystine (asn-gly-cys) (r = −0.059), and turanose (r = −0.039).
Table 5. Parameters of orthogonal partial least squares regression models based on the data from polar metabolites separation for the entire cohort and the selected subset of SC menopausal women.
Dataset Step Component R2X R2Y Q2 Entire cohort (n = 95) 1 1P and O1 0.483 0.223 −0.371 Entire cohort (n = 95) 2 1P and O1 0.512 0.205 0.035
Subset (n = 30) 1 1P and O1 0.437 0.749 −0.399 Subset (n = 30) 2 1P and O1 0.514 0.526 0.247
P: predictive. O: orthogonal in X. Component: number of significant component calculated by cross-validation. R2X value is the predictive and orthogonal variation in model samples (X) explained by the model. R2Y value is the amount of variation in X which is correlated to Y (response matrix). Q2 value describes the predictive ability of the model.
Figure 2. Orthogonal partial least squares (OPLS) scatter plot of polar metabolites, showing relationship between polar metabolites and femoral neck BMD in SC menopausal women with normal (green circles) and low BMD and osteoporosis (red circles) values based on orthogonally filtered partial square (OPLS) regression model 2 with 12 polar metabolites among 95 women, entire cohort (a) and 30 women, subset (b). t[1]/u[1] correlation plot; t1 refers to scores of the first component in independent variables; u1 refers to scores of the first component in responses.
Figure 2. Orthogonal partial least squares (OPLS) scatter plot of polar metabolites, showing relationshipbetween polar metabolites and femoral neck BMD in SC menopausal women with normal (green circles)and low BMD and osteoporosis (red circles) values based on orthogonally filtered partial square (OPLS)regression model 2 with 12 polar metabolites among 95 women, entire cohort (a) and 30 women,subset (b). t[1]/u[1] correlation plot; t1 refers to scores of the first component in independent variables;u1 refers to scores of the first component in responses.
Table 6. Means and 95% confidence intervals of polar metabolites associated to the entire cohortof SC menopausal women (n = 95) with normal and low femoral neck BMD in univariate andmultivariate approaches.
Polar Metabolite Normal BMD a
(n = 23)Low BMD a
(n = 72) p-Value Log2 (FC) Correlation b
4-Aminobutyric acid 1.400(0.909–2.155)
0.874(0.679–1.125) 0.062 −0.185 −0.013
Threonine 1.315(0.806–2.011)
0.843(0.658–1.081) 0.073 −0.159 −0.172
Asn–Gly–Cys 0.794(0.512–1.230)
1.014(0.512–1.230) 0.337 0.058 0.059
Turanose 1.319(0.858–2.028)
0.845(0.657–1.087) 0.076 −0.174 −0.039
Polar metabolites are expressed as mean and 95% confidence interval (CI). ANOVA was used to compare polarmetabolites mean concentrations. a Covariates: age and BMI; b Age-adjusted correlation coefficient. Statisticalp-value calculated using Benjamini–Hochberg false discovery rate (FDR). p-value < 0.05 was considered asstatistically significant. Fold change expressed as the relation between the metabolite mean of the normal BMDgroup to the metabolite mean of the low BMD group.
Subset
In addition, the OPLS regression (step 1) was fitted to the subset of samples (n = 30) with the127 polar metabolites to analyze the relationship of femoral neck BMD and polar metabolites but this
Int. J. Environ. Res. Public Health 2018, 15, 1045 11 of 18
model did not show prediction Q2 = −0.399 (Figure 2b). After filtering using coefficient selectionsection (as described above) the OPLS model 2 showed a higher cross validation value Q2 = 0.247 whencompared with the model from step 1 (Table 5). The correlation matrix revealed negative correlationsamong lipids and femoral neck BMD, proline (r = −0.295), aminopropionitrile (r = −0.315), threonine(r = −0.170), and asn-gly-cys (r = −0.038); while positive correlation was observed with methionine(r = −0.494) (Table 7).
Table 7. Means and 95% confidence intervals of polar metabolites associated to a subset ofselected SC menopausal women (n = 30) with normal BMD and osteoporosis in univariate andmultivariate approaches.
Polar Metabolite Normal BMD a
(n = 15)Osteoporosis a
(n = 15) p-Value Log2 (FC) Correlation b
Proline 1.581(0.928–2.692)
0.786(0.384–1.609) 0.084 −0.234 −0.295
Aminopropionitrile 0.729(0.418–1.272)
1.848(0.875–3.905) 0.03 * −0.270 −0.315
Threonine 1.561(0.911–2.674)
0.765(0.371–1.579) 0.081 −0.219 −0.170
Methionine 1.534(0.894–2.632)
0.758(0.366–1.567) 0.085 0.141 0.494
Asn-Gly-Cys 1.428(0.782–2.607)
0.593(0.264–1.334) 0.056 0.142 −0.038
Polar metabolites are expressed as mean and 95% confidence interval (CI). ANOVA was used to compare polarmetabolites mean concentrations. a Covariates: age and BMI; b Age-adjusted correlation. Statistical p-valuecalculated using Benjamini–Hochberg false discovery rate (FDR). * p-value < 0.05 was considered as statisticallysignificant. Fold change expressed as the relation between the metabolite mean of the normal BMD group to themetabolite mean of the osteoporosis group.
4. Discussion
The potential of metabolomics was explored for the discovery of molecules associated withBMD loss in SC menopausal women. It is well established that bone loss is linked to age and lowlevels of oestrogen in women in both Caucasian and Asian populations. After menopause, there areseveral molecular changes affecting bone metabolism, where those alterations result in an increasedbone resorption and a declined BMD [32,33]. Thus, the identification of novel potential biomarkersmay be useful for understanding the connections of the lipids and polar metabolites associated withosteoporosis and their capacity to predict bone loss in SC menopausal women.
In order to optimize the prediction of biomarkers for bone loss, we created a second data set(subset) to analyze the relationship between the plasma metabolome of SC women with osteoporosis(T-score < −2.5) and normal BMD (T score > −1). Therefore, in this study, we presented results fromunivariate and multivariate analysis using two different datasets: the entire cohort and a selectedsubset of samples. The findings were similar in both datasets; however, with the subset analysis, morelipids were identified as being of significance. This statistical filtering using OPLS regression modellingfacilitated the removal of un-correlated lipid features and allowed several lipids to be detected aspredictors of menopausal osteoporosis in women.
4.1. Lipids
In this study, we compared changes of the lipid profiles in SC menopausal womenand the relationship of those lipids with femoral neck BMD. Glycerophospholipid species PS(20:4/29:6/31:36/32:6/33:6), PE (42:1), PA (34:4), and PI (14:0) were found to be different betweennormal BMD and osteoporosis groups.
Lipid metabolism disorders have been linked to pathological conditions including obesity,metabolic syndrome, cardiovascular diseases, and bone loss, where cells and signaling pathwaysmay be affected [34]. Adipocytes and osteoblasts are derived from the mesenchymal stem cells (MSC)and the balance of osteoblast versus adipocyte requires interactions between extracellular signalingstimuli. Changes in any of those factors enhances fat bone deposition and promote bone loss [35].

Int. J. Environ. Res. Public Health 2018, 15, 1045 12 of 18
Oestrogens plays a key role on the cell fate of MSCs to differentiate into either osteoblasts or adipocytes;oestrogen also regulates inflammation [36,37]. Further, peroxisome proliferator-activated receptor(PPARy) transcription factor is essential for adipogenesis. Thus, altered lipid metabolism causesoxidative stress and increased expression of PPARy, which reduces osteoblast number in the skeleton,and oestrogren contributes to the regulation of this PPARy signaling pathway [38,39].
Oestrogen deficiency induces bone loss and changes in lipid profiles, BMD and cytokines; however,little information exists on the application of plasma lipidomics for studying menopausal osteoporosis.In vivo and in vitro studies have reported that lipid metabolism disorders promote bone loss byinhibiting osteoblast differentiation and promoting adipogenic differentiation through MSCs stimuli.Phosphatidylinositol (PI) metabolism is essential for signaling by receptor activator of nuclear factor κB(RANK), a local regulator of osteoclastogenesis and bone resorption [40,41]. Our study showed elevatedconcentrations of PI species (14:0) in SC women with low BMD/ osteoporosis compared with normalBMD group, suggesting that PI species may lead to chronic inflammatory processes and this mightinduce bone loss in menopausal osteoporosis. Circulating levels of several lipid classes also have beenassociated with physiological processes including the regulation of inflammation. In an in vitro study,lipid metabolism of PE, PS, and LysoPC changed during MSCs activation due to pro-inflammatorystimuli with TNF-α and IFN-γ [42]. This suggests that changes in lipid profiles promote production ofcytokines and differentiation of osteoclasts and may be attributed to oestrogen withdrawal.
Diacylglycerols (DG) are cellular mediators released from membrane lipids that play a key role inthe regulation of inflammation and diseases [43]. Our study showed a decrease in the concentrationsof glycerolipid species identified as DG (40:0/42:4) in the osteoporosis group compared to the normalBMD menopausal group. While it is not clear whether DG levels are associated with bone massthere is evidence suggesting a relationship between circulating DG profiles and oestrogen loss.A previous study reported plasma DG (33:2) decreased with ageing [44]. Additionally, an animalstudy reported serum monoacylglycerol and triacylglycerol concentrations decreased in OVX ratsas a model of oestrogen deficiency [45], suggesting that lipid profiles and oestrogen loss upregulatebone-proinflammatory cytokines, which control osteoclast differentiation and promote bone loss.
However, information on the association between plasma lipids and femoral neck BMD inmenopausal women is limited. Previous studies in menopausal women have reported conflictingassociations between triacylglycerol and hip BMD [34,46,47]. Our findings showed a positiveassociation between DG species and hip femoral neck BMD. This result indicates that lipidprofile changes may be involved in MSCs functional, anti-inflammatory activities and cytokineproduction as a result of oestrogen withdrawal, which enhances MSC signaling and inhibits osteoblastdifferentiation [48–50]. However, further studies are needed to clarify the links between plasma lipidconcentrations and femoral neck bone loss in menopausal women.
Sphingolipids also play a structural role in cellular membranes and act as bioactive signallingmolecules. Ceramide is one of the simple sphingolipids and is involved in the control of manycellular processes including proliferation, differentiation, and apoptosis [51,52]. It has shown thatphosphorylated ceramide (ceramide 1-phosphate) stimulates cell survival and proliferation in bonemarrow-derived macrophages through molecules such as NF-κB, RANK, and its ligand RANKL [53,54].However, in our study two sphingolipid species, CerP (24:0/38:1), were significantly reduced in theosteoporosis group compared with the normal BMD group. Our results contradict a previous animalstudy of oestrogen loss, where CerP concentrations were upregulated in OVX rats [45]. Furthermore,in a human study, Lee et al. [55] found that higher sphingosine-1-phosphate (S1P) concentrationswere associated with low BMD in menopausal women. This suggests that the increased levels ofCerP promotes differentiation of bone marrow-derived macrophages with biological effects on bonemetabolism and could be attributed to oestrogen deficiency.
Taken together, our findings suggest that altered lipid metabolism could be a regulator of bone celldifferentiation and bone loss in SC menopausal women. Further studies are required to investigate thepotential role of these lipids as biomarkers for early diagnosis of bone loss in SC menopausal women.
Int. J. Environ. Res. Public Health 2018, 15, 1045 13 of 18
4.2. Polar Metabolites
This approach enabled the identification of amino acids, amines, and other polar metabolites.Our study found no significant associations between polar metabolites and femoral neck BMD in SCmenopausal groups based on OPLS analysis. However, proline, threonine, and aminopropinitrileconcentrations were found to be lower in SC menopausal women with low BMD and osteoporosisbased on univariate analysis.
Amino acids play a key role in bone health and are involved in bone remodeling. Duringosteoporosis, alterations in amino acids may affect bone mass, suggesting that lower levels of circulatingamino acids are associated with low BMD. Previous metabolomic studies in menopausal women havereported tryptophan, lysine, homoserine, and 3-hydroxy-L-proline concentrations decreased in theosteoporosis group compared with pre/menopausal women with normal BMD using GC-MS [56].Miyamoto et al. [20] reported serum concentrations of a dipeptide formed with glycine and glycine(Gly-Gly) and cysteine were lower and hydroxyproline concentrations were higher in low BMDmenopausal women using capillary electrophoresis/mass spectrometry (CE-MS). You et al. [22] foundhigher glutamine concentrations and lower lactate and acetone concentrations associated with lowBMD in Taiwanese women using 1H NMR Spectroscopy.
Amino acids modulate bone marrow stem cell (BMSC) function, signalling, proliferation, anddifferentiation in the bone marrow. Arginine is the precursor for the synthesis of many molecules includingurea, nitric oxide, proline, and glutamate [57]. Disorders in arginine metabolism are suggested to causedecalcification, disturbance in calcium absorption, and osteomalcia. Growth hormone and insulin-likegrowth factor-I, both bone-forming growth factors, are stimulated by arginine and a disorder in thesefactors cause an increase in inflammatory cytokines and osteoporosis [58]. Proline and its metabolitehydroxyproline are the major amino acids components in collagen, and serum hydroxyproline canbe used as bone collagen degradation marker [16,59]. Homocysteine is a metabolite in methioninemetabolism and at high levels it interferes with collagen cross-linking, suggesting that increasedhomocysteine levels can lead to increased fracture risk in ageing [60]. Further, aminopropinitrilehas been reported in in vitro studies as a collagen cross-linking inhibitor and, with homocysteine,caused decreased bone strength [61]. The mechanistic implications of altered metabolites and theirassociation to bone remodeling and the link to BMD are not clear, but both BMSC differentiation andcollagen formation are critical factors that influence BMD, suggesting that perturbations of amino acidsunder menopausal osteoporosis may partly contribute to bone loss in elderly women. Informationon the association between polar metabolites and SC menopausal women is scarce and needs to becorroborated with further work. As we were unable to test for a possible relationship between polarmetabolites and femoral neck BMD due to our small study groups and the high variability amongparticipants, our findings need to be kept in perspective.
The limitations of our study include the small number of participants and higher variabilityamong them such as genetic, age, environment, diet and lifestyle, and body composition. However,this was addressed when we analyzed two different datasets, and both the entire cohort and subsetfindings were consistent as the subset study showed similar compounds to those already detected in theentire cohort. Supporting these findings is the fact the same compounds were associated with BMD inboth datasets’ analyses for the pathology of osteoporosis. Overall, future studies on larger populationsare needed to confirm these findings and enable more reliable results for assessing the associationbetween metabolome and femoral neck BMD for prognosis of osteoporosis in SC menopausal women.
5. Conclusions
This pilot study suggested that plasma lipids and polar metabolites differed between women ofnormal versus low BMD, and these are involved in several metabolic pathways such as sphingolipidmetabolism, phospholipid metabolism, and fatty acid β-oxidation. Moreover, this study demonstratesthat lipidomic and polar metabolic profiling are promising tools for finding novel biomarkers for boneloss in SC women. Further, prospective studies on larger populations are needed to corroborate these

Int. J. Environ. Res. Public Health 2018, 15, 1045 14 of 18
findings and elucidate their key roles in osteoporosis development and progression in SC menopausalwomen. Thus, understanding the cellular responses to molecular changes in bone metabolism andhow these are associated with bone loss in menopausal women may offer the potential of discoveringnew biomarkers for prognosis of bone loss in elderly women.
Author Contributions: M.K., F.M.W., N.C.R., J.J.T., C.J.H., D.C.-S. and K.F.: conceived of study. C.J.H.: supervisedpatient recruitment. D.C., M.K. F.M.W., N.C.R., and K.F.: contributed to the study execution, analysis, andinterpretation of data. D.C. and K.F.: performed data analysis and interpretation. D.C.: wrote the manuscript.M.K., F.M.W., N.C.R., J.J.T., C.J.H., D.C.-S. and K.F.: reviewed manuscript. D.C., M.K, F.M.W., N.C.R., J.J.T., C.J.H.,D.C.-S. and K.F.: contributed to draft, edit and approve the final version of this paper for submission.
Acknowledgments: The authors would like to thank to Nan Xin Wang and Huann Rong Koh who contributed toparticipant recruitment, blood collection, and BMD measurements. This work was funded by Agency for Science,Technology and Research (A*STAR), Singapore; Singapore-New Zealand Foods for Health Grant (BMRC grant14/1/16/24/008), Ministry of Business, Innovation and Employment, New Zealand; Singapore-New ZealandFoods for Health Grant (MAUX1309), AgResearch Core funding (contract #A21072) and The Mexican NationalCouncil for Science and Technology (Scholarship No. 383233).
Conflicts of Interest: The authors declare no conflict of interest.
Abbreviations
The following abbreviations are used in this manuscript:
ACN AcetonitrileBMD Bone mineral densityBMI Body mass indexBMUs Basic multicellular unitsCTx-1 c-terminal telopeptide of type I collagenDG DiacylglycerolDXA Dual X-ray absorptiometryEDTA Ethylenediamine tetraacetic acidHILIC LC-MS Hydrophilic interaction chromatography liquid chromatography mass spectrometryIL-1 Interleukin-1IK-6 Interleukin-6CerP Ceramide-1-phosphateS1P Sphingosine-1-phosphateM-CSF Macrophage colony-stimulating factorMSCs Mesenchymal stem cellsOPLS Orthogonal partial least squaresOVX OvariectomizedPA Phosphatidic acidPI PhosphatidylinositolPlasmenyl-PE PlasmenylphosphatidylethanolaminePE PhosphatidylethanolaminePPARy Peroxisome proliferator-activated receptorPS PhosphatidylserinePTH parathyroid hormoneROS Reactive oxygen speciesRP (LC-MS) Reverse-phase liquid chromatography mass spectrometrySC Singaporean-ChineseTNF-α Tumor necrosis factor-αQC Quality controlWHO World Health Organization
Int. J. Environ. Res. Public Health 2018, 15, 1045 15 of 18
References
1. Aaseth, J.; Boivin, G.; Andersen, O. Osteoporosis and trace elements—An overview. J. Trace Elem. Med. Biol.2012, 26, 149–152. [CrossRef] [PubMed]
2. Cooper, C.; Cole, Z.A.; Holroyd, C.R.; Earl, S.C.; Harvey, N.C.; Dennison, E.M.; Melton, L.J.; Cummings, S.R.;Kanis, J.A. Secular trends in the incidence of hip and other osteoporotic fractures. Osteoporos. Int. 2011, 22,1277. [CrossRef] [PubMed]
3. Weitzmann, M.N.; Pacifici, R. Estrogen deficiency and bone loss: An inflammatory tale. J. Clin. Investig. 2006,116, 1186–1194. [CrossRef] [PubMed]
4. Manolagas, S.C. From Estrogen-Centric to Aging and Oxidative Stress: A Revised Perspective of thePathogenesis of Osteoporosis. Endocr. Rev. 2010, 31, 266–300. [CrossRef] [PubMed]
5. Redlich, K.; Smolen, J.S. Inflammatory bone loss: Pathogenesis and therapeutic intervention. Nat. Rev.Drug Discov. 2012, 11, 234. [CrossRef] [PubMed]
6. Maggio, D.; Barabani, M.; Pierandrei, M.; Polidori, M.C.; Catani, M.; Mecocci, P.; Senin, U.; Pacifici, R.;Cherubini, A. Marked Decrease in Plasma Antioxidants in Aged Osteoporotic Women: Results of aCross-Sectional Study. J. Clin. Endocrinol. Metab. 2003, 88, 1523–1527. [CrossRef] [PubMed]
7. Mody, N.; Parhami, F.; Sarafian, T.A.; Demer, L.L. Oxidative stress modulates osteoblastic differentiation ofvascular and bone cells. Free Radic. Biol. Med. 2001, 31, 509–519. [CrossRef]
8. Riggs, B.L. The mechanisms of estrogen regulation of bone resorption. J. Clin. Investig. 2000, 106, 1203–1204.[CrossRef] [PubMed]
9. Jilka, R.L.; Hangoc, G.; Girasole, G.; Passeri, G.; Williams, D.C.; Abrams, J.S.; Boyce, B.; Broxmeyer, H.;Manolagas, S.C. Increased osteoclast development after estrogen loss: Mediation by interleukin-6. Science1992, 257, 88. [CrossRef] [PubMed]
10. Kanis, J.A. Diagnosis of osteoporosis and assessment of fracture risk. Lancet 2002, 359, 1929–1936. [CrossRef]11. Patti, G.J.; Yanes, O.; Siuzdak, G. Metabolomics: The apogee of the omics trilogy. Nat. Rev. Mol. Cell Biol.
2012, 13, 263. [CrossRef] [PubMed]12. Liu, Y.-R.; Huang, R.-Q.; Xiao, B.-K.; Yang, J.-Y.; Dong, J.-X. 1H NMR metabolic profiling analysis offers
evaluation of Nilestriol treatment in ovariectomised rats. Mol. Cell. Endocrinol. 2014, 387, 19–34. [CrossRef][PubMed]
13. Liu, Y.-R.; Xiao, B.-K.; Yang, J.-Y.; Guo, C.-H.; Shen, S.-J.; Tang, Z.-S.; Dong, J.-X.; Huang, R.-Q. 1H-NMR andHPLC–MS/MS-based global/targeted metabolomic evaluation of Hypericum perforatum L. intervention formenopause. J. Funct. Foods 2015, 17, 722–741. [CrossRef]
14. Iida, M.; Harada, S.; Kurihara, A.; Fukai, K.; Kuwabara, K.; Sugiyama, D.; Takeuchi, A.; Okamura, T.;Akiyama, M.; Nishiwaki, Y.; et al. Profiling of plasma metabolites in postmenopausal women with metabolicsyndrome. Menopause 2016, 23, 749–758. [CrossRef] [PubMed]
15. Ke, C.; Hou, Y.; Zhang, H.; Yang, K.; Wang, J.; Guo, B.; Zhang, F.; Li, H.; Zhou, X.; Li, Y.; et al. PlasmaMetabolic Profiles in Women are Menopause Dependent. PLoS ONE 2015, 10, e0141743. [CrossRef] [PubMed]
16. Ma, B.; Liu, J.; Zhang, Q.; Ying, H.; Jiye, A.; Sun, J.; Wu, D.; Wang, Y.; Li, J.; Liu, Y. Metabolomic profilesdelineate signature metabolic shifts during estrogen deficiency-induced bone loss in rat by GC-TOF/MS.PLoS ONE 2013, 8, e54965. [CrossRef] [PubMed]
17. Lee, M.Y.; Kim, H.Y.; Singh, D.; Yeo, S.H.; Baek, S.Y.; Park, Y.K.; Lee, C.H. Metabolite profiling reveals theeffect of dietary Rubus coreanus vinegar on ovariectomy-induced osteoporosis in a rat model. Molecules2016, 21, 149. [CrossRef] [PubMed]
18. Xue, L.; Wang, Y.; Liu, L.; Zhao, L.; Han, T.; Zhang, Q.; Qin, L. A 1HNMR-Based Metabonomics Study ofPostmenopausal Osteoporosis and Intervention Effects of Er-Xian Decoction in Ovariectomized Rats. Int. J.Mol. Sci. 2011, 12, 7635–7651. [CrossRef] [PubMed]
19. Long, W.-F.; Li, L.; Chen, H.-Q.; Tang, Y.; He, X.-L.; Jing, R.-Z. 1H-NMR-based metabonomics analysis ofplasma from osteoporotic rats induced by ovariectomy. J. Sichuan Univ. Med. Sci. Ed. 2009, 40, 843–847.
20. Miyamoto, T.; Hirayama, A.; Sato, Y.; Koboyashi, T.; Katsuyama, E.; Kanagawa, H.; Miyamoto, H.; Mori, T.;Yoshida, S.; Fujie, A.; et al. A serum metabolomics-based profile in low bone mineral density postmenopausalwomen. Bone 2017, 95, 1–4. [CrossRef] [PubMed]
Int. J. Environ. Res. Public Health 2018, 15, 1045 16 of 18
21. Liu, X.; Zhang, S.; Lu, X.; Zheng, S.; Li, F.; Xiong, Z. Metabonomic study on the anti-osteoporosis effect ofRhizoma Drynariae and its action mechanism using ultra-performance liquid chromatography–tandemmass spectrometry. J. Ethnopharmacol. 2012, 139, 311–317. [CrossRef] [PubMed]
22. You, Y.-S.; Lin, C.-Y.; Liang, H.-J.; Lee, S.-H.; Tsai, K.-S.; Chiou, J.-M.; Chen, Y.-C.; Tsao, C.-K.; Chen, J.-H.Association Between the Metabolome and Low Bone Mineral Density in Taiwanese Women Determined by1H NMR Spectroscopy. J. Bone Miner. Res. 2014, 29, 212–222. [CrossRef] [PubMed]
23. Maunsell, Z.; Wright, D.J.; Rainbow, S.J. Routine isotopedilution liquid chromatography-tandem massspectrometry assay for simultaneous measurement of the 25-hydroxy metabolites of vitamins D2 and D3.Clin. Chem. 2005, 51, 1683–1690. [CrossRef] [PubMed]
24. Organization, W.H. Assessment of Fracture Risk and Its Application to Screening for Postmenopausal Osteoporosis:Report of a WHO Study Group [Meeting Held in Rome from 22 to 25 June 1992]; WHO: Geneva, Switzerland, 1994.
25. Xu, J.; Begley, P.; Church, S.J.; Patassini, S.; Hollywood, K.A.; Jüllig, M.; Curtis, M.A.; Waldvogel, H.J.;Faull, R.L.M.; Unwin, R.D.; et al. Graded perturbations of metabolism in multiple regions of human brainin Alzheimer’s disease: Snapshot of a pervasive metabolic disorder. Biochim. Biophys. Acta 2016, 1862,1084–1092. [CrossRef] [PubMed]
26. Smith, C.A.; Want, E.J.; O’Maille, G.; Abagyan, R.; Siuzdak, G. XCMS: Processing Mass Spectrometry Datafor Metabolite Profiling Using Nonlinear Peak Alignment, Matching, and Identification. Anal. Chem. 2006,78, 779–787. [CrossRef] [PubMed]
27. Zelena, E.; Dunn, W.B.; Broadhurst, D.; Francis-McIntyre, S.; Carroll, K.M.; Begley, P.; O’Hagan, S.;Knowles, J.D.; Halsall, A.; Wilson, I.D.; et al. Development of a Robust and Repeatable UPLC−MS Methodfor the Long-Term Metabolomic Study of Human Serum. Anal. Chem. 2009, 81, 1357–1364. [CrossRef][PubMed]
28. Wishart, D.S.; Jewison, T.; Guo, A.C.; Wilson, M.; Knox, C.; Liu, Y.; Djoumbou, Y.; Mandal, R.; Aziat, F.;Dong, E.; et al. HMDB 3.0—The Human Metabolome Database in 2013. Nucleic Acids Res. 2013, 41,D801–D807. [CrossRef] [PubMed]
29. Smith, C.A.; Maille, G.O.; Want, E.J.; Qin, C.; Trauger, S.A.; Brandon, T.R.; Custodio, D.E.; Abagyan, R.;Siuzdak, G. METLIN: A Metabolite Mass Spectral Database. Ther. Drug Monit. 2005, 27, 747–751. [CrossRef][PubMed]
30. Chong, J.; Soufan, O.; Li, C.; Caraus, I.; Li, S.; Bourque, G.; Wishart, D.S.; Xia, J. MetaboAnalyst 4.0: Towardsmore transparent and integrative metabolomics analysis. Nucleic Acids Res. 2018. [CrossRef] [PubMed]
31. Liland, K.H. Multivariate methods in metabolomics—From pre-processing to dimension reduction andstatistical analysis. TrAC Trends Anal. Chem. 2011, 30, 827–841. [CrossRef]
32. Manolagas, S.C.; Parfitt, A.M. What old means to bone. Trends Endocrinol. Metab. 2010, 21, 369–374.[CrossRef] [PubMed]
33. Feng, X.; McDonald, J.M. Disorders of Bone Remodeling. Ann. Rev. Pathol. Mech. Dis. 2011, 6, 121–145.[CrossRef] [PubMed]
34. Cui, L.-H.; Shin, M.-H.; Chung, E.-K.; Lee, Y.-H.; Kweon, S.-S.; Park, K.-S.; Choi, J.-S. Association betweenbone mineral densities and serum lipid profiles of pre- and post-menopausal rural women in South Korea.Osteoporos. Int. 2005, 16, 1975–1981. [CrossRef] [PubMed]
35. Almeida, M.; O’Brien, C.A. Basic Biology of Skeletal Aging: Role of Stress Response Pathways. J. Gerontol.Ser. A 2013, 68, 1197–1208. [CrossRef] [PubMed]
36. Muruganandan, S.; Roman, A.A.; Sinal, C.J. Adipocyte differentiation of bone marrow-derived mesenchymalstem cells: Cross talk with the osteoblastogenic program. Cell. Mol. Life Sci. 2009, 66, 236–253. [CrossRef][PubMed]
37. Zhao, J.-W.; Gao, Z.-L.; Wang, Y.; Mei, H.; Li, Y.-L. Differentiation of Human Mesenchymal Stem Cells:The Potential Mechanism for Estrogen-Induced Preferential Osteoblast Versus Adipocyte Differentiation.Am. J. Med. Sci. 2011, 341, 460–468. [CrossRef] [PubMed]
38. Almeida, M.; Ambrogini, E.; Han, L.; Manolagas, S.C.; Jilka, R.L. Increased Lipid Oxidation Causes OxidativeStress, Increased Peroxisome Proliferator-activated Receptor-γ Expression, and Diminished Pro-osteogenicWnt Signaling in the Skeleton. J. Biol. Chem. 2009, 284, 27438–27448. [CrossRef] [PubMed]
Int. J. Environ. Res. Public Health 2018, 15, 1045 17 of 18
39. Dieudonne, M.N.; Pecquery, R.; Leneveu, M.C.; Giudicelli, Y. Opposite Effects of Androgens and Estrogens onAdipogenesis in Rat Preadipocytes: Evidence for Sex and Site-Related Specificities and Possible Involvementof Insulin-Like Growth Factor 1 Receptor and Peroxisome Proliferator-Activated Receptorγ 21. Endocrinology2000, 141, 649–656. [CrossRef] [PubMed]
40. Takeshita, S.; Namba, N.; Zhao, J.J.; Jiang, Y.; Genant, H.K.; Silva, M.J.; Brodt, M.D.; Helgason, C.D.;Kalesnikoff, J.; Rauh, M.J.; et al. SHIP-deficient mice are severely osteoporotic due to increased numbers ofhyper-resorptive osteoclasts. Nat. Med. 2002, 8, 943. [CrossRef] [PubMed]
41. Wada, T.; Nakashima, T.; Hiroshi, N.; Penninger, J.M. RANKL–RANK signaling in osteoclastogenesis andbone disease. Trends Mol. Med. 2006, 12, 17–25. [CrossRef] [PubMed]
42. Campos, A.M.; Maciel, E.; Moreira, A.S.P.; Sousa, B.; Melo, T.; Domingues, P.; Curado, L.; Antunes, B.;Domingues, M.R.M.; Santos, F. Lipidomics of Mesenchymal Stromal Cells: Understanding the Adaptationof Phospholipid Profile in Response to Pro-Inflammatory Cytokines. J. Cell. Physiol. 2016, 231, 1024–1032.[CrossRef] [PubMed]
43. Kilpinen, L.; Tigistu-Sahle, F.; Oja, S.; Greco, D.; Parmar, A.; Saavalainen, P.; Nikkilä, J.; Korhonen, M.;Lehenkari, P.; Käkelä, R.; et al. Aging bone marrow mesenchymal stromal cells have altered membraneglycerophospholipid composition and functionality. J. Lipid Res. 2013, 54, 622–635. [CrossRef] [PubMed]
44. Jové, M.; Maté, I.; Naudí, A.; Mota-Martorell, N.; Portero-Otín, M.; de la Fuente, M.; Pamplona, R. HumanAging Is a Metabolome-related Matter of Gender. J. Gerontol. Ser. A 2016, 71, 578–585. [CrossRef] [PubMed]
45. Vinayavekhin, N.; Sueajai, J.; Chaihad, N.; Panrak, R.; Chokchaisiri, R.; Sangvanich, P.; Suksamrarn, A.;Piyachaturawat, P. Serum lipidomics analysis of ovariectomized rats under Curcuma comosa treatment.J. Ethnopharmacol. 2016, 192, 273–282. [CrossRef] [PubMed]
46. Brownbill, R.A.; Ilich, J.Z. Lipid Profile and Bone Paradox: Higher Serum Lipids Are Associated with HigherBone Mineral Density in Postmenopausal Women. J. Women’s Health 2006, 15, 261–270. [CrossRef] [PubMed]
47. Makovey, J.; Chen, J.S.; Hayward, C.; Williams, F.M.K.; Sambrook, P.N. Association between serumcholesterol and bone mineral density. Bone 2009, 44, 208–213. [CrossRef] [PubMed]
48. Pacifici, R.; Brown, C.; Puscheck, E.; Friedrich, E.; Slatopolsky, E.; Maggio, D.; McCracken, R.; Avioli, L.V.Effect of surgical menopause and estrogen replacement on cytokine release from human blood mononuclearcells. Proc. Natl. Acad. Sci. USA 1991, 88, 5134. [CrossRef] [PubMed]
49. Zhou, S.; Zilberman, Y.; Wassermann, K.; Bain, S.D.; Sadovsky, Y.; Gazit, D. Estrogen modulates estrogenreceptor α and β expression, osteogenic activity, and apoptosis in mesenchymal stem cells (MSCs) ofosteoporotic mice. J. Cell. Biochem. 2001, 81, 144–155. [CrossRef]
50. Zheng, S.X.; Vrindts, Y.; Lopez, M.; de Groote, D.; Zangerle, P.F.; Collette, J.; Franchimont, N.; Geenen, V.;Albert, A.; Reginster, J.Y. Increase in cytokine production (IL-1β, IL-6, TNF-α but not IFN-γ, GM-CSF or LIF)by stimulated whole blood cells in postmenopausal osteoporosis. Maturitas 1997, 26, 63–71. [CrossRef]
51. Arana, L.; Gangoiti, P.; Ouro, A.; Trueba, M.; Gómez-Muñoz, A. Ceramide and ceramide 1-phosphate inhealth and disease. Lipids Health Dis. 2010, 9, 15. [CrossRef] [PubMed]
52. Gómez-Muñoz, A. Ceramide-1-phosphate: A novel regulator of cell activation. FEBS Lett. 2004, 562, 5–10.[CrossRef]
53. Gangoiti, P.; Granado, M.H.; Wang, S.W.; Kong, J.Y.; Steinbrecher, U.P.; Gómez-Muñoz, A. Ceramide1-phosphate stimulates macrophage proliferation through activation of the PI3-kinase/PKB, JNK andERK1/2 pathways. Cell. Signal. 2008, 20, 726–736. [CrossRef] [PubMed]
54. Gómez-Muñoz, A.; Kong, J.Y.; Salh, B.; Steinbrecher, U.P. Ceramide-1-phosphate blocks apoptosis throughinhibition of acid sphingomyelinase in macrophages. J. Lipid Res. 2004, 45, 99–105. [CrossRef] [PubMed]
55. Lee, S.H.; Lee, S.-Y.; Lee, Y.-S.; Kim, B.-J.; Lim, K.-H.; Cho, E.-H.; Kim, S.-W.; Koh, J.-M.; Kim, G.S. HigherCirculating Sphingosine 1-Phosphate Levels Are Associated with Lower Bone Mineral Density and HigherBone Resorption Marker in Humans. J. Clin. Endocrinol. Metab. 2012, 97, E1421–E1428. [CrossRef] [PubMed]
56. Qi, H.; Bao, J.; An, G.; Ouyang, G.; Zhang, P.; Wang, C.; Ying, H.; Ouyang, P.; Ma, B.; Zhang, Q. Associationbetween the metabolome and bone mineral density in pre- and post-menopausal Chinese women usingGC-MS. Mol. BioSyst. 2016, 12, 2265–2275. [CrossRef] [PubMed]
57. Morris, J.S.M. Arginine: Beyond protein1–4. Am. J. Clin. Nutr. 2006, 83, 508S–512S. [CrossRef] [PubMed]58. Chevalley, T.; Rizzoli, R.; Manen, D.; Caverzasio, J.; Bonjour, J.P. Arginine increases insulin-like growth
factor-I production and collagen synthesis in osteoblast-like cells. Bone 1998, 23, 103–109. [CrossRef]

Int. J. Environ. Res. Public Health 2018, 15, 1045 18 of 18
59. Wood, S.L.; Westbrook, J.A.; Brown, J.E. Omic-profiling in breast cancer metastasis to bone: Implications formechanisms, biomarkers and treatment. Cancer Treat. Rev. 2014, 40, 139–152. [CrossRef] [PubMed]
60. Van Meurs, J.B.J.; Dhonukshe-Rutten, R.A.M.; Pluijm, S.M.F.; van der Klift, M.; de Jonge, R.; Lindemans, J.;de Groot, L.C.P.G.M.; Hofman, A.; Witteman, J.C.M.; van Leeuwen, J.P.T.M.; et al. Homocysteine Levels andthe Risk of Osteoporotic Fracture. N. Engl. J. Med. 2004, 350, 2033–2041. [CrossRef] [PubMed]
61. Turecek, C.; Fratzl-Zelman, N.; Rumpler, M.; Buchinger, B.; Spitzer, S.; Zoehrer, R.; Durchschlag, E.;Klaushofer, K.; Paschalis, E.P. Collagen Cross-Linking Influences Osteoblastic Differentiation. Calcif. Tissue Int.2008, 82, 392–400. [CrossRef] [PubMed]
© 2018 by the authors. Licensee MDPI, Basel, Switzerland. This article is an open accessarticle distributed under the terms and conditions of the Creative Commons Attribution(CC BY) license (http://creativecommons.org/licenses/by/4.0/).

![Molecular Formula H C CH - jubl.com 2,3,5-Collidine [695-98-7] 2,3,5-Trimethylpyridine C8H11N Omeprazole; Esomeprazole Commercial - Regular Production ... Molecular Formula](https://static.fdocuments.in/doc/165x107/5aa0e20d7f8b9a8e178ea119/molecular-formula-h-c-ch-jubl-235-collidine-695-98-7-235-trimethylpyridine.jpg)


![[PPT]Ugljovodonici - Prirodno - matematički fakultet u Nišu · Web view... 2,4,9-trimetildekan 4-etil-2,3,5-trimetilheptan 2,2,5-trimetilheksan 3,3-dietil-4-metil-5-(1-metilpropil)](https://static.fdocuments.in/doc/165x107/5acacbd07f8b9acb7c8e7352/pptugljovodonici-prirodno-matematicki-fakultet-u-nisu-view-249-trimetildekan.jpg)
![Multi-Camera Activity Correlation Analysistxiang/publications/... · views [2,3,5–7,14] and global activity analysis [9,18,21]. Previous multi-camera activity analysis methods [6,12,](https://static.fdocuments.in/doc/165x107/60174b48f69e61236d7c16db/multi-camera-activity-correlation-txiangpublications-views-235a714.jpg)


