Association of Legal Writing Directors Legal Writing Institute - ALWD
142
Report of the Annual Legal Writing Survey 2011 Association of Legal Writing Directors Legal Writing Institute Survey Committee: John Mollenkamp (co-chair) Marci Rosenthal (co-chair) Amy Flanary-Smith Andrea Funk Karen Koch Allison Kort David Krech Rosario Lozada Schrier Judy Rosenbaum Jean Rosenbluth Technical Assistance: Catherine Seppanen Cicada Consulting ALWD/LWI 2011 Survey Report For More Information Contact: John Mollenkamp Clinical Professor Cornell Law School 321 Myron Taylor Hall Ithaca, NY 14853-4901 (607) 255-0146 [email protected] Marci A. Rosenthal Director and Associate Professor, Legal Skills and Values Program Florida International University College of Law Rafael Diaz-Balart Hall, Room 2052 Modesto Maidique Campus Miami, FL 33199 (305) 348-8350 [email protected] Photo © 2006 Mark Mollenkamp
Transcript of Association of Legal Writing Directors Legal Writing Institute - ALWD
R
ep
ort
of
the A
nn
ual
Lega
l W
riti
ng S
urv
ey
20
11
Ass
oci
ati
on
of
Le
ga
l W
riti
ng
Dir
ect
ors
L
eg
al
Wri
tin
g I
nst
itu
te
Survey Committee:
John Mollenkamp (co-chair)
Marci Rosenthal (co-chair)
Amy Flanary-Smith
Andrea Funk
Karen Koch
Allison Kort
David Krech
Rosario Lozada Schrier
Judy Rosenbaum
Jean Rosenbluth
Technical Assistance:
Catherine Seppanen
Cicada Consulting
ALWD/LWI 2011 Survey Report For More Information Contact:
John Mollenkamp
Clinical Professor
Cornell Law School
321 Myron Taylor Hall
Ithaca, NY 14853-4901
(607) 255-0146
Marci A. Rosenthal
Director and Associate Professor,
Legal Skills and Values Program
Florida International University College of Law
Rafael Diaz-Balart Hall, Room 2052
Modesto Maidique Campus
Miami, FL 33199
(305) 348-8350
Photo © 2006 Mark Mollenkamp

201
1 N
atio
nal S
urv
ey R
esu
lts i
2011 National Survey Results Association of Legal Writing Directors/
Legal Writing Institute
This report of the results of the 2011 ALWD/LWI national survey of legal writing
programs includes data about the operation of legal research and writing programs during
the 2010-2011 academic year from 188 North American law schools (187 from the United
States and 1 from Canada), representing approximately 94.5% of the law schools solicited to
complete the survey—the second-highest response rate in the history of the survey.
As in past years, this report is admittedly a somewhat inexact composite picture of
many varied, complex, and unique programs. Nevertheless, the survey results show
common practices and trends and provide other valuable information about the current
state of legal writing education in American law schools.
The survey report also includes data from the 2008, 2009, and 2010 surveys for
comparison purposes. Please be aware that some year-to-year variations show real changes
in legal writing programs, while others merely reflect changes in the respondent group.
Please also be aware that the report includes some recomputation of prior years’ reported
average values. Finally, please note that this year’s report again includes median values for
most of the salary data. We have chosen to include median values to more accurately reflect
salaries in various categories, because median values are less susceptible to skew based on
a few extraordinarily high or low salaries in a category.
Once again, we thank all who participated in this year’s survey. Your time and effort
are valuable to all of us.
John Mollenkamp and Marci Rosenthal
Survey Committee Co-Chairs

201
1 N
atio
nal S
urv
ey R
esu
lts ii
2011 National Survey Results ........................................................................................ i
2011 ALWD/LWI Survey Highlights ........................................................................... iii
Submitter Profile: Who Answered? ................................................................... 1
School Profile: Which Schools Answered? ......................................................... 3
Staffing Model: Status Questions ...................................................................... 5
Curriculum: Credits and Coursework ............................................................... 7
Upper-Level Writing Courses ........................................................................... 24
Technology ......................................................................................................... 32
Directors ............................................................................................................ 35
Full-time Legal Writing Faculty Members ...................................................... 61
Adjunct Legal Writing Faculty ......................................................................... 82
Teaching Assistants .......................................................................................... 87
Survey Use ........................................................................................................ 91
Hot Topics .......................................................................................................... 91
Appendix A ................................................................................................................. A-1
Appendix B ................................................................................................................. B-1
Appendix C ................................................................................................................. C-1

201
1 A
LW
D/L
WI S
urv
ey H
igh
ligh
ts iii
2011 ALWD/LWI Survey Highlights
Prepared by Marci A. Rosenthal
Associate Professor of Legal Skills & Values
and Director of the Legal Skills & Values Program
Florida International University College of Law
The 2011 Survey
2011 Respondents: This year’s pool of solicited schools was the same as that for the
2010 survey (representing U.S. AALS Member law schools and AALS Non-Member Fee-
Paying schools, as well as the University of Windsor in Ontario, Canada, the host of the
2003 ALWD conference). Thanks to the cooperation of program directors and legal writing
faculty, the 2011 survey enjoyed the second-highest response rate in the thirteen-year
history of the ALWD/LWI survey, with 188, or 94.5%, of the solicited schools providing
responses.
Survey Use (Question 100): For the seventh consecutive year, more respondents
than ever before reported that they have used the survey data in various ways. One
hundred twenty-six respondents used it to improve their programs, 78 to improve their
status, 80 to improve their salary, and 31 for other purposes.
Program Structure and Content
Staffing Models (Question 10): For the 2010-2011 academic year, as in past years,
most programs continued to use full-time non-tenure-track teachers (79 programs, or 42%
of respondents), or a hybrid staffing model (69 programs, or 36.7%). Nineteen programs
(10.1%) reported using solely adjuncts, and 13 programs (6.9%) used tenured or tenure-
track teachers hired specifically to teach legal writing (Question 10a). Another 17
programs (9%) use such tenured or tenure-track teachers in hybrid models (Question 11a).
Assistant Directors (Question 46): The number of programs that reported having
assistant directors was the same (37 programs) in 2011 as it was in 2010. For comparison,
31 programs reported having assistant directors in 2009, 39 reported having assistant
directors in 2008, and 36 reported having assistant directors in 2007. The average 2011
salary reported for an assistant director was $86,991, up from $84,266 in 2010.
Staffing Diversity (Questions 71a and 71b): The majority of new full-time LRW
faculty teaching in 2010-2011 for the first time at the responding law school were
Caucasian (122, or 88%, of the new faculty identified in response to the request for race
information). The majority of these new faculty were female (93, or 63% of the new faculty
identified in response to the request for gender information). For the schools that reported
on racial diversity for all current full-time faculty, 830 (or 88.6%) were Caucasian. The
responses included 56 (or 6%) African-American faculty, 14 (or 1.5%) Hispanic faculty, 20
(or 2.1%) Asian-American faculty, 5 (or .53%) Native American faculty, 6 (or .64%) multi-

201
1 A
LW
D/L
WI S
urv
ey H
igh
ligh
ts iv
racial faculty, and 6 (or .64%) who indicated ―other.‖ For those schools that reported on
gender diversity for all current full-time faculty, 739 faculty members (71%) were female
and 302 (29%) were male.
Curriculum (Questions 12-26, 28)
Program Length (Question 12): In the 2010-2011 academic year, virtually all
writing programs had required courses in both the first and second semester of the first
year of law school. The average number of credit hours in Fall 2010 was 2.38 (down from
an average of 2.41 credit hours in fall of the 2009-2010 academic year); the average in
Spring 2011 was 2.31 credit hours (up minimally from an average of 2.30 credit hours in the
spring of the 2009-2010 academic year). Forty-eight programs have required classes,
averaging 2.08 credit hours, in the fall of the second year. Fifteen programs have required
classes, averaging 2.20 credit hours, in the spring of the second year. Eight programs have
required classes, averaging 2.62 credit hours, in the fall of the third year, and six programs
have required classes, averaging 2.17 credit hours, in the spring of the third year.
Grading (Questions 15, 17, 23): Most LRW courses (163 programs, or 87% of
respondents) are graded, with grades included in student GPAs (Question 15). Sixty
percent of respondents (113 programs) grade at least some assignments anonymously, but
74 programs (40%) do not use any anonymous assignments (Question 17). Ninety-two
percent of respondents (173 programs) require rewrites on at least some major
assignments, with 55 of those requiring rewrites on all major assignments; 83 grade all
drafts and rewrites; 83 grade only rewrites; and 7 grade only drafts (Question 23).
Teaching Research (Question 18): The majority of programs integrate research and
writing instruction (157 programs). At 77 schools, LRW faculty teach research. At 75
schools, both LRW faculty and librarians teach legal research, and at 27 schools, teaching
assistants and other students also teach research. (Note: Respondents could select more
than one option for this question.)
Collaboration on Legal Writing Assignments Between LRW Faculty and Doctrinal
Faculty (Question 22): In 140 programs (74% of respondents), legal writing faculty do not
collaboratively coordinate legal writing assignments with doctrinal faculty. In 43 programs
(23%), the topics of the assignments are coordinated, but the teaching is not. Only five
programs (2.6%) coordinate assignment topics with doctrinal teaching.
Writing Specialists and Academic Support (Question 28): Fifty-nine law schools
employed a full-time or part-time writing specialist in 2011 (compared with 58 in 2010, 50
in 2009, and 43 in 2008). One hundred and sixty-one schools offer an academic support
program (compared with 156 in 2010, 142 in 2009, and 151 in 2008).
Common Practices (Questions 20-27, 40-43)
Assignments (Question 20): The most commonly reported writing assignments
continue to be office memoranda (188), appellate briefs (150), pretrial briefs (111), and

201
1 A
LW
D/L
WI S
urv
ey H
igh
ligh
ts v
client letters (103). Additionally, 117 programs report using ―other writing assignments.‖
The most common oral exercises were appellate arguments (138), in-class presentations
(83), pretrial motion arguments (83), and oral reports to supervising attorneys (71).
Variability Among Sections Within Programs (Question 26): The degree of
uniformity reported across sections approximates that reported in 2010. Uniformity across
sections is greatest in assigned citation text (158 programs are uniform, 13 are generally
consistent) and number of major assignments (139 programs are uniform, 47 are generally
consistent). Additionally, a significant number of programs report being uniform or
generally consistent in syllabus coverage (172 combined ―uniform‖ and ―generally
consistent‖ responses), due dates and length of most assignments (168 combined responses),
and grading (162 combined responses). Variety among sections is greatest in the areas of
number of minor assignments (44 programs report uniformity, 72 state that sections are
generally consistent, and 71 report variation among sections), required textbook (90
uniform, 21 generally consistent, 75 vary among sections), and content of class
lectures/exercises (11 uniform, 62 generally consistent, 115 vary among sections).
Commenting (Question 24): The most commonly reported methods of commenting
on papers remain comments written on the paper itself (187) and comments during
conferences (179). Short comments at the end of the paper (168) were again the third most
common choice, followed by a general feedback memo to all students (159).
Teaching Activities (Question 21): The most commonly reported teaching activities
(and the average amount of time spent in each activity) were lecture (180 programs; 31.67%
of teaching time), questions and answers and class discussion (179; 23.27% of teaching
time), group in-class exercises (174; 16.64% of teaching time), demonstrations (167; 11.08%
of teaching time), individual in-class exercises (164; 10.49% of teaching time), and in-class
writing (155; 8.65% of teaching time).
Use of Technology (Questions 40-43)
Web Pages (Question 42): Program and faculty web page use in 2011 was
comparable to that in 2010; 72 programs had web pages (compared with 69 programs in
2010), and in 42 programs (the same number as in 2010) at least one faculty member had a
web page. Seventy-four programs reported having no web page (compared with 76
programs in 2010).
Utility of Specific Technology (Question 43): E-mail listservs and web course utility
products (TWEN, Blackboard, etc.) were again the most popular technology. In 127
programs, all faculty used e-mail listservs, and in 48 programs most or all faculty used
them; the average effectiveness rating for the listservs was 4.48 out of a possible 5. In 113
programs, all faculty used web course utility products, and in 67 programs, all or most
faculty used them; the average effectiveness rating for web course utility products was 4.29.

201
1 A
LW
D/L
WI S
urv
ey H
igh
ligh
ts vi
Citation Manual (Question 27)
The shift from the use of the ALWD Citation Manual to the Bluebook continued
again this year. At the time of the survey, 27 programs (14.4% of respondents) planned to
teach only the ALWD Citation Manual (compared with 29 in 2010, 31 in 2009, and 40 in
2008). One hundred thirty-one programs (69.7%) planned to teach only the Bluebook
(compared with 124 in 2010, 104 in 2009, and 108 in 2008). Twelve programs planned to
teach both the ALWD Citation Manual and the Bluebook, and 11 programs planned to
leave the choice up to each teacher.
Terms and Conditions of Employment
Salary Highlights
Directors’ Salaries (averages, questions 3, 4, 5, 49): The average director’s salary in
2011 was $108,319, which was an increase from $103,540 in 2010. This continues an
upward trend since 2001 (Question 49). The average experience of directors in 2011
increased very slightly this year, with the average director having graduated from law
school 22.9 years ago (compared with 22.6 in 2010), taught in law school for 14.8 years
(compared with 14.1 in 2010), and directed at his or her current law school for 9.1 years
(compared with 9.0 in 2010) (Questions 3, 4, 5).
Regional Differences for Directors (chart following Question 49): The average salary
of directors in 2011 was highest in the New York City & Long Island region ($160,420 – 5
schools). Following New York City & Long Island, five regions had average director
salaries within a close range: Far West (average salary of $113,538 – 24 schools), Mid
Atlantic ($112,662 – 25 schools), Northeastern excluding New York City & Long Island
($110,154 – 13 schools), Northwest & Great Plains ($109,417 – 4 schools), and Great
Lakes/Upper Midwest ($108,273 – 25 schools). The average salary of directors in the
Southwest/South Central region was $98,681 (23 schools), and $94,497 for directors in the
18 schools in the Southeast region.
The average director’s salary increased by both greatest percentage and greatest
dollar amount in the Northwest & Great Plains region (an increase of $11,972, or 12.2%,
from 2010). Two regions saw a decrease in the average salary, with the Northeastern
region (excluding New York City & Long Island) decreasing by $1,685 (1.5%), and the Far
West decreasing by $456 (.4%).
LRW Faculty Full-Time Salaries (averages, excluding directors; Question 75): The
overall average LRW faculty salary increased in 2011, continuing the trend since 2001.
2011: From an average low of $64,301 to an average high of $81,245, with an
overall average of $73,773.
2010: From an average low of $64,642 to an average high of $77,945, with an overall
average of $71,294.

201
1 A
LW
D/L
WI S
urv
ey H
igh
ligh
ts vii
2009: From an average low of $63,275 to an average high of $78,040, with an overall
average of $70,657.
2008: From an average low of $60,140 to an average high of $72,465, with an overall
average of $66,302.
2007: From an average low of $57,420 to an average high of $70,862, with an overall
average of $63,313.
2006: From an average low of $54,015 to an average high of $65,321, with an overall
average of $59,668.
2005: From an average low of $51,587 to an average high of $61,641, with an overall
average of $56,579.
2004: From an average low of $49,419 to an average high of $59,395, with an overall
average of $53,752.
2003: From an average low of $48,931 to an average high of $60,198.
2002: From an average low of $47,741 to an average high of $54,316.
2001: From an average low of $44,011 to an average high of $53,012.
In addition to regular salaries, LRW faculty at 61% of schools responding were also
eligible for summer research grants in an average amount of $8,968 (Question 76).
Regional Differences for Salaries for LRW Faculty (excluding directors; chart
following Question 75): The Far West region had the highest average LRW faculty salary
($75,772 – 23 schools), followed closely by the Northwest & Great Plains ($75,500 – 2
schools), the Southeast ($74,828 – 16 schools), the Mid-Atlantic ($74,455 – 19 schools), the
Great Lakes/Upper Midwest ($74,244 – 27 schools), the Northeastern region excluding New
York City & Long Island ($72,563 – 8 schools), and the Southwest & South Central region
($71,201 – 18 schools). New York City & Long Island (2 schools) had the lowest average
regional salary for LRW faculty, at $57,500. One region saw an increase of over $5000 in
the average LRW faculty salary for 2011 (Great Lakes/Upper Midwest – $5488, or an
increase of 7.98%).
Other Variables Related to Salaries
Directors – Years Since Earning a JD and Years Teaching (Questions 3 and 4, and
tables following Question 49): Salaries for directors increase as the directors have more
experience, with an average salary of $86,810 for the seven directors who earned their JDs
6-10 years ago, to an average of $116,564 for the 51 directors who earned their JDs more
than 26 years ago. The average director’s salary for those with 0-5 years of teaching
experience was $93,905, while the average for those with more than 26 years of teaching
experience was $138,933.
LRW Faculty – Teaching Experience (Question 74): Entry-level salaries for LRW
faculty increase with teaching experience, and continued to increase for faculty at all levels.
In 2011, the average entry-level salary was $64,186 for LRW faculty with no teaching
experience (compared with $60,145 in 2010), and $67,772 for LRW faculty with 1-3 years of
teaching experience (compared with $64,378 in 2010). For faculty with more than three
years of teaching experience, the average salary in 2011 was $70,928 (compared with
$67,256 in 2010).

201
1 A
LW
D/L
WI S
urv
ey H
igh
ligh
ts viii
Setting (Questions 7, 49, and 75, and tables following Questions 49 and 75): In
2011, directors in urban areas had the highest average salary ($112,690), and directors in
suburban areas had the lowest average salary ($98,844). Conversely, LRW faculty average
salaries in urban areas were lowest, at $73,295. Faculty average salaries in suburban and
rural areas were almost identical to each other: the suburban average was $74,713, while
the rural average was $74,726.
Institution Type (Questions 8, 49, and 75, and tables following Questions 49 and 75):
In 2011, directors at private law schools had a higher average salary ($112,593) than
directors at public law schools ($103,104). Similarly, LRW faculty at private institutions
had a higher salary ($74,695) than LRW faculty at public institutions ($72,691).
Staffing Models (Questions 10, 49, and 75, and tables following Questions 49 and
75): In 2011, directors in the 15 programs staffed by adjunct teachers had the highest
average salary, at $117,478. This was a change from 2010, when directors of adjunct
programs had the median (third out of five staffing models) average salary. Directors of the
54 complex hybrid staffing models had the second-highest average salary in 2011, at
$116,106, followed by directors of the 8 programs using tenured or tenure-track LRW
faculty ($113,000), 2 programs using part-time faculty ($105,125), and 53 programs using
full-time, non-tenure-track faculty ($98,242).
For LRW faculty, the average salary was highest for those who were tenured or
tenure-track ($90,488 in 12 programs) and lowest in programs staffed with full-time non-
tenure-track faculty ($66,082 in 53 programs).
Director Type (Questions 45, 49, and 75, and tables following Questions 49 and 75):
The highest average salary ($133,379) was for directors who were tenured, with LRW as
their primary responsibility (28 programs). The second-highest average salary ($120,000)
was for the one director who was an administrator or faculty member, but whose primary
responsibility was not LRW. Following next were directors in the ―other‖ status category
($111,857 – 14 programs), clinical tenure or clinical tenure track ($105,847 – 20 programs),
administrator with primary responsibility for LRW ($104,920 – 3 programs), untenured
tenure-track with primary LRW responsibility ($103,082 – 16 programs), and non-tenure-
track with primary LRW responsibility ($96,767 – 51 programs).
For LRW faculty, the highest salary ($97,500) was for the one program directed by
an administrator or faculty member whose primary responsibility was not LRW. After
that, the highest average salary ($80,889) was for faculty in programs directed by
untenured tenure-track faculty with primary LRW responsibility (9 programs), followed by
programs directed by tenured faculty members with primary LRW responsibility (average
salary of $79,679 – 21 programs), programs whose director was reported as ―other‖ ($78,815
– 17 programs), programs whose director has clinical tenure or is on a clinical tenure track
($70,762 – 13 programs), programs with a non-tenure-track director who had primary LRW
responsibility ($65,866 – 36 programs), and programs directed by an administrator with
primary LRW responsibility ($59,450 – 2 programs).

201
1 A
LW
D/L
WI S
urv
ey H
igh
ligh
ts ix
Job Security, Contract Terms, and Workload
Directors’ Status – Tenure (Questions 44, 45): The number of tenured directors with
primary responsibility for directing the LRW program increased slightly in 2011, to 34
(from 31 in 2010), as did the number of directors with clinical tenure or on a clinical tenure
track (21 in 2011, from 19 in 2010). The number of untenured, tenure-track directors with
primary responsibility for directing the LRW program stayed relatively constant (19 in
2011, 18 in 2010), as did the number of non-tenure-track directors whose primary
responsibility was directing the LRW program (58 in 2011, 59 in 2010). Thus, in 2011, a
total of 74 directors were tenured or tenure-track faculty, including clinical faculty,
compared with 68 in 2010. The number of programs without directors remained constant
(35 in both 2011 and 2010).
LRW Faculty Status (Questions 65, 66): LRW faculty in most programs are on
short-term contracts (138 responses), but the number of 405(c), 405(c)-track, and tenured or
tenure-track programs has increased: in 2010, the number of programs reporting tenure or
405(c) status was 107, while in 2011 the number increased to 117. More specifically, 61
programs reported having 1-year contracts in 2011, 17 programs reported having 2-year
contracts, and 60 programs reported having contracts of three years or more. Forty-four
programs reported having full-time faculty that were tenured or on the tenure track, 54
programs reported faculty with 405(c) status, and 19 reported faculty on the ABA Standard
405(c) track. The vast majority of those on contract are not limited in the number of years
that they may teach at the law school; in other words, they have no ―cap‖ (144 out of 153
respondents to this question, or 94%).
Title (Questions 48, 68): Program directors at 123 responding schools have some
form of ―Professor‖ in their title, and 81 schools use the title of ―Director‖ (Question 48).
For LRW faculty, most schools use some form of ―Professor‖ to describe LRW faculty in
official publications (131 responding schools). Twenty-three schools use ―Instructor,‖ 22 use
―Lecturer‖ or ―Senior Lecturer,‖ and 4 use ―Assistant Dean‖ or ―Associate Dean.‖ Thirty-
two schools use another title (Question 68).
Directors’ Workload (Questions 53, 54)
Teaching Load: During the fall semester of the 2010-2011 academic year, each
director taught an average of 36.18 entry-level students, which was the lowest number
since 2005. (For comparison, in 2009-2010 each director taught an average of 39.61
students during the fall semester.) The number of in-class teaching hours per week also fell
during the 2010-2011 fall semester, to 3.16 hours from 3.27 hours in the 2009-2010
academic year. Numbers of both major and minor assignments increased (an average of
3.21 major assignments and 3.81 minor ones in Fall 2010, compared with an average of
3.14 major assignments and 3.64 minor ones in Fall 2009).
During the spring semester of the 2010-2011 academic year, each director taught an
average of 34.30 students, which was the lowest number since 2004. (In the spring
semester of 2009-2010, each director taught an average of 37.77 students.) The number of

201
1 A
LW
D/L
WI S
urv
ey H
igh
ligh
ts x
in-class teaching hours also dropped during the spring semester (to an average of 2.94
weekly hours, from an average of 3.01 weekly hours in Spring 2010). The average number
of major assignments slightly dropped (to 2.74 from 2.85 in Spring 2010), but the number of
minor assignments increased to 3.24 assignments, from 3.16 in Spring 2010.
Preparation Time: In the fall, directors spent slightly fewer hours preparing major
research and writing assignments (46.36 hours) than they had in the fall of 2009-2010
(47.33 hours), but they spent more time preparing for class (54.16 hours) than they had in
Fall 2009-2010 (52.02 hours). During the spring semester, preparation hours for both
major assignments (50.07 hours) and class (51.28 hours) increased from what they had been
in Spring 2010 (48.71 assignment preparation hours and 48.12 class preparation hours in
Spring 2010).
Time Distribution: The directors’ time distribution percentages that were reported
in answer to Question 53 totaled more than 100%, and are converted to a 100 base in the
chart visually representing responses to this question.
LRW Faculty Workload (Question 82)
Teaching Load: In the fall, LRW faculty members each taught an average of 41.33
entry-level students (versus 40.83 in Fall 2009), taught 3.83 in-class hours per week, used
3.29 major assignments and 3.5 minor assignments, read 1,556 pages of student work, and
held 50.35 hours of required or strongly recommended conferences. With the exception of
number of pages of student work read (1,565 pages), the spring semester workload was
somewhat lower (40.17 students, 3.54 in-class hours per week, 2.66 major assignments and
2.7 minor assignments, 46.4 conference hours).
Preparation Time: In the fall, LRW faculty spent an average of 35.33 hours
preparing major research and writing assignments (compared with 34.98 hours in Fall
2009-2010) and 71.44 hours preparing for class (compared with 72.84 hours in Fall 2009-
2010). In the spring, LRW faculty spent slightly less time preparing major assignments
(33.87 hours) and preparing for class (67.67 hours).
Other Responsibilities of Directors and LRW Faculty
*See also “Hot Topics” Question 1.
Upper-Level Teaching (Questions 55, 56, 85): Many directors taught courses other
than the required writing courses (88 of 157 responses, or 56%) (Question 55). In 87
programs, directors taught an average of 1.87 such courses; of these courses, more (63
courses) were non-LRW courses than were writing or drafting courses (44 courses)
(Question 56). Most LRW faculty also teach other courses (143 of 168 responses, or 85%),
including both upper-level writing courses (93) and non-LRW courses (121), either during
the regular academic year (125) or during separate summer sessions (99) (Question 85).

201
1 A
LW
D/L
WI S
urv
ey H
igh
ligh
ts xi
Faculty Committees (Questions 59, 83): The vast majority (142 of 150 respondents,
or 94.67%) of directors serve on faculty committees as voting members (Question 59). LRW
faculty serve on committees as voting members in 130 of 141 responding programs (92.2%)
(Question 83).
Faculty Meetings (Questions 60, 84): Most directors who are not on a tenure track
may attend faculty meetings (100 of 127, or 78.7%, of responses were ―yes‖; 5 responses
were ―no‖; 25 responses were ―n/a or don’t know‖). Of the 100 non-tenure-track directors
who may attend faculty meetings, 17 may vote on all matters, and 61 may vote on all
matters except hiring, tenure, or promotion; these numbers are almost identical to the
numbers during 2009-2010 (Question 60). In 168 programs (89.29% of those responding),
LRW faculty may attend faculty meetings; of those who can attend, faculty members in 43
programs may vote on all matters, while faculty in 72 programs may vote on all matters
except hiring, tenure, and promotion. Faculty members in 35 programs may attend
meetings but may not vote. Thirteen programs do not allow LRW faculty members to
attend faculty meetings, and 5 respondents reported that they do not know whether LRW
faculty members are permitted to attend faculty meetings.
Scholarship (Questions 62, 81): Directors are obligated to produce written
scholarship in 58 of 163 responding programs (35.58%). Sixty responding programs expect
directors to produce scholarship, and 88 responding programs encourage it (programs were
permitted to select more than one response) (Question 62). LRW faculty are obligated to
produce scholarship in 41 of 168 responding programs (24.4%). Fifty-two responding
programs expect LRW faculty to produce scholarship, and 111 responding programs
encourage it.
Evaluation Standards for LRW Faculty (Question 70): The number of programs
with written evaluation standards for LRW faculty increased in 2010-2011. Of the 170
respondents to this question, 126 (74.12%) reported written evaluation standards for LRW
faculty (compared with 121, or 72%, in 2009-2010). An additional 14 programs had
standards in development, and 30 programs had no written standards.
Additional Support for LRW Faculty
Summer Grants (Questions 76, 78b): The number of schools reporting that their
LRW faculty are eligible for summer grants dropped slightly in 2010-2011 (102 of 167
responding schools, or 61%, compared with 103 of 163, or 63%, in 2009-2010). The average
grant amount was $8,968, an increase over the 2009-2010 grant amount of $8,586. Forty-
three schools reported that LRW faculty are not eligible for summer grants, and at 8
schools summer grants generally are not provided to any faculty. For those schools
reporting that their faculty are eligible, 60 reported that their LRW faculty are just as
likely to receive grants as doctrinal faculty (compared with 58 in 2009-2010), 17 reported
that LRW faculty are less likely or much less likely to receive summer grants than doctrinal
faculty (down from 18 in 2009-2010), and 3 reported that LRW faculty have never received
summer grants (down from 5 in 2009-2010) (Question 78b).

201
1 A
LW
D/L
WI S
urv
ey H
igh
ligh
ts xii
Professional Development Funding (Question 79): Of the 161 programs responding
to this question, 150 answered either ―yes‖ or ―yes, sufficient funding for all reasonable
requests‖ with an average funding level of $2,478 (up slightly from the 2009-2010 average
of $2,418).
Research Assistants (Question 80): Of the 166 programs responding to this
question, 144 (86.75%) provide LRW faculty with funding to hire research assistants, at an
average amount of $2,007 (comparable to the 2009-2010 average of $2,048).
Hot Topics Summary
The Survey Committee solicited ideas for ―Hot Topics‖ questions from the ALWD
and LWI membership, using the listservs of both organizations to publicize the request.
After receiving suggestions, the Committee agreed on seven ―Hot Topics‖ for the 2010-2011
survey.
Faculty Voting Rights: The greatest number of respondents indicated that LRW
faculty have voting rights in issues and topics that arise in faculty committees (116
respondents), dean selection (114 respondents), and curriculum development (109
respondents). Seventy-nine respondents indicated that LRW faculty vote on
promotion/retention/hiring of non-tenure-track faculty, while 38 programs allow LRW
faculty to vote on promotion/tenure/hiring of tenure-track faculty.
LWI Job Postings as Support for Salary Increases: Of 160 respondents, 73 (46%)
stated that they have used information from LWI job postings to obtain increased salaries
for LRW faculty. Eight-seven (54%) stated that they had not used LWI job postings for this
purpose.
Geography of LRW Hiring: For LRW faculty that have been hired in the past five
years, 106 respondents stated that new hires already lived within commuting distance of
the school at the time that they were hired. Twenty-two respondents stated that new hires
did not live locally prior to being hired, but that they moved to the area for a spouse or
partner’s job. Seventy-two respondents stated that newly hired faculty members moved to
the school’s area specifically for the LRW job.
Electronic Research: Other than traditional Westlaw and LEXIS, the electronic
research source that the highest number of respondents include in their curriculum is
Westlaw Next (96 respondents). Google Scholar was the second most popular (59
respondents), followed by ―other electronic resources‖ (33 responses) and Fastcase (11
responses). Twenty-two respondents stated that they do not include electronic sources
other than traditional Westlaw and LEXIS in their curriculum.
Recording Class: Of 156 respondents, 83 (53%) do not allow regular recording of
their classes. An additional 52 respondents stated that they do not allow students to record
their classes, but that the faculty member may audio- or video-record a class through the
law school’s audio-visual department and provide the link to students. Sixteen respondents

201
1 A
LW
D/L
WI S
urv
ey H
igh
ligh
ts xiii
allow audio recording only, and two respondents allow video recording only; three
respondents allow both audio and video recording.
Outcomes and Assessments: Of the programs that use outcomes and assessment
tools, the tools most frequently used were quizzes or tests (65 responses) and student self-
assessment (63 responses). Additional reported tools included ―test‖ issues on writing itself
(22 responses) and pretest and posttests (14 responses). (Respondents were permitted to
select more than one response.)
Curriculum modification: Of 158 respondents, 108 (68%) reported that they have
not made any curricular or assignment-specific modifications in response to administrative
pressure. An additional 23 respondents (14.56%) have made changes to a specific
assignment or assignments, but have not made broad curricular changes in response to
administrative pressure. Fourteen respondents (9%) have changed their curriculum in
response to administrative pressure.

Su
bm
itter P
rofile
: Wh
o A
nsw
ere
d?
1
Submitter Profile: Who Answered? This section briefly describes the survey respondents.
1. Are you:
2011 2010 2009 2008
a. Director of the required legal writing program?
(―Director‖ means the person charged with lead
responsibility for the program.) (73.4%) 138 136 119 134
b. Associate director, assistant director, or co-director of
the required legal writing program? (5.3%) 10 15 12 14
c. Director of the upper-level appellate advocacy
program, drafting program or other upper-level
program? (0%) 0 0 0 0
d. A teacher in a program without a director? (If so,
please have one individual fill out the survey and give
a response that, to the extent possible, is
representative of all teachers in the program.) (15.4%)
29 28 25 24
e. None of the above. (5.9%) 11 12 10 9
2. Please state your gender and race.
2011 2010 2009 2008
a. Total Responses (Gender) 188 191 166 181
Female (78.7%) 148 146 130 137
Male (21.3%) 40 45 36 44
b. Total Responses (Race) 186 188 161 181
White (93.5%) 174 172 151 150
African-American (2.7%) 5 7 5 6
Hispanic (2.2%) 4 3 2 2
Asian-American (1.0%) 2 2 1 0
Native American (0.0%) 0 0 0 0
Multiracial (0.0%) 0 1 1 1
Other (0.5%) 1 3 1 2

Su
bm
itter P
rofile
: Wh
o A
nsw
ere
d?
2
3. How many years have passed since the director earned a J.D.
degree?
2011 2010 2009 2008
Total Responses 163 162 143 159
Years Average 22.9 22.6 21.8 21.7
Years Minimum 3 6 5 5
Years Maximum 42 41 40 39
4. How many years has the director been teaching in law school on a
full-time basis?
2011 2010 2009 2008
Total Responses 163 162 141 158
Years Average 14.8 14.1 13.9 13.6
Years Minimum 0 0 0 0
Years Maximum 36 33 32 31
5. How many years has the director directed the writing program at
the present law school?
2011 2010 2009 2008
Total Responses 158 157 137 152
Years Average 9.1 9.0 8.5 8.6
Years Minimum 1 1 0 0
Years Maximum 31 30 29 27

Sch
ool P
rofile
: Wh
ich S
chools A
nsw
ere
d?
3
School Profile: Which Schools Answered?
6. Following (and slightly modifying) the model developed by the
Society of American Law Teachers, we have divided the country
into eight regions. Please identify the region where your law
school is located. (Note: 1 of the 188 responses is from Canada.)
2011 2010 2009 2008
a. Region I: Far West –AZ, CA, HI, NV, OR, UT, WA 31 30 30 31
b. Region II: Northwest & Great Plains –ID, MT, NE,
ND, SD, WY 5 7 6 7
c. Region III: Southwest & South Central –AR, CO, KS,
LA, MO, NM, OK, TX 24 27 25 25
d. Region IV: Great Lakes/Upper Midwest –IL, IN, IA,
MI, MN, OH, WI 34 34 33 33
e. Region V: Southeast –AL, FL, GA, KY, MS, TN, WV 28 27 20 23
f. Region VI: Mid-Atlantic –DC, DE, MD, NJ, NC, PA,
SC, VA 35 34 28 31
g. Region VII: Northeastern –CT, MA, ME, NH, NY
(excluding New York City and Long Island), RI, VT 20 22 16 20
h. Region VIII: New York City and Long Island 10 9 7 10
2011 Responses: 187 US
1 Canada
Region III: 24 Region V: 28
Region VI: 35
Region VII: 20
Region VIII: 10
Region II: 5 Region IV: 34
Region I: 31

Sch
ool P
rofile
: Wh
ich S
chools A
nsw
ere
d?
4
7. What is the setting of your law school?
2011 2010 2009 2008
a. Urban (66.5%) 125 127 112 123
b. Suburban (26.6%) 50 51 42 45
c. Rural (6.9%) 13 13 12 13
d. No response 0 0 0 0
8. What type of institution is your law school?
2011 2010 2009 2008
a. Public (40.4%) 76 80 73 74
b. Private (59.6%) 112 111 93 107
9. What was the size of your first-year JD class for the current
academic year?
2011 2010 2009 2008
a. 100 or fewer students (2.1%) 4 6 7 7
b. 101 to 150 students (12.2%) 23 27 25 20
c. 151 to 200 students (23.9%) 45 44 39 52
d. 201 to 250 students (25.5%) 48 49 39 38
e. 251 to 300 students (11.2%) 21 21 19 19
f. 301 or more students (25.0%) 47 44 37 45

Sta
ffing M
od
el: S
tatu
s Qu
estio
ns
5
Staffing Model: Status Questions
10. Following the model used by the authors of the Source Book on
Legal Writing Programs, we have identified eight basic staffing
models for first-year writing programs. Please identify the model
that most closely resembles the format that your school uses. Do
not consider the director’s status if that differs from the status of
other LRW teachers.
2011 2010 2009 2008
a. Tenured or tenure-track teachers hired specifically to
teach legal writing 13 12 11 9
b. Tenured or tenure-track teachers hired to teach legal
writing and other courses 4 3 3 3
c. Tenured or tenure-track teachers who teach legal
writing as part of their first-year doctrinal courses 1 0 0 0
d. Many tenured or tenure-track teachers teaching legal
writing to small groups of students where the teacher
has no other responsibilities with respect to legal
writing and where the teacher’s primary
responsibilities lie with teaching other courses
1 1 1 0
e. Full-time nontenure-track teachers with long-term
contracts or short-term contracts 79 79 73 86
f. Part-time faculty 2 2 3 4
g. Adjuncts 19 20 17 17
h. Graduate students 0 0 0 0
i. Students (only if these are upper-level students who
provide a substantial portion of individualized
feedback on papers or have substantial responsibility
for classroom teaching)
0 0 0 0
j. A complex hybrid of the above models or some other
model 69 71 58 62
k. Not answered 0 3 0 0

Sta
ffing M
od
el: S
tatu
s Qu
estio
ns
6
11. If you checked answer j. (hybrid model) in the preceding question,
which of the following elements are part of your program? Please
mark all that apply.
2011 2010 2009 2008
a. Tenured or tenure-track teachers hired specifically to
teach legal writing 17 17 11 15
b. Tenured or tenure-track teachers hired to teach legal
writing and other courses 18 20 18 21
c. Tenured or tenure-track teachers who teach legal
writing as part of their first-year doctrinal courses 4 5 4 5
d. Many tenured or tenure-track teachers teaching legal
writing to small groups of students where the teacher
has no other responsibilities with respect to legal
writing and where the teacher’s primary
responsibilities lie with teaching other courses
2 4 4 3
e. Full-time nontenure-track teachers with long-term
contracts or short-term contracts 55 56 47 50
f. Part-time faculty 12 13 8 10
g. Adjuncts 48 51 42 43
h. Graduate students 4 3 1 2
i. Students (only if these are upper-level students who
provide a substantial portion of individualized
feedback on papers or have substantial responsibility
for classroom teaching)
9 12 11 15
Total Number of Schools with Hybrid Models 69 71 58 62

Cu
rriculu
m: C
red
its an
d C
ou
rsew
ork
7
Curriculum: Credits and Coursework Note: To collect and report comparable data, we asked respondents to report all credit hours
in semester hours and report all grades on a scale assuming 4.0 equals an A.
12. How many credit hours are awarded each semester of the required
program? (Responses of zero were excluded from the averages and
totals.)
1L 2L 3L
Fall Spring Fall Spring Fall Spring
Total Schools Responding
2011
1 credit (no. of schools) 12 12 5 2 0 1
2 credits (no. of schools) 92 104 34 9 4 4
3 credits (no. of schools) 75 67 9 3 3 0
4 credits (no. of schools) 3 1 0 1 1 1
2011 (average credits) 2.38 2.31 2.08 2.20 2.62 2.17
2010 (average credits) 2.41 2.30 2.08 2.25 2.57 1.80
2009 (average credits) 2.40 2.26 2.02 2.19 2.33 2.00
2008 (average credits) 2.36 2.24 2.04 2.18 2.20 2.40
0
20
40
60
80
100
120
1 credit (no. ofschools)
2 credits (no. ofschools)
3 credits (no. ofschools)
4 credits (no. ofschools)
Fall 1L
Spring 1L

Cu
rriculu
m: C
red
its an
d C
ou
rsew
ork
8
13. When is the first required advocacy course taught (typically an
introductory appellate advocacy course taught in the spring of the
first year), and how many credits are awarded for it? Please
indicate the semester in which it is taught by writing the number
of credit hours in the appropriate space. If necessary, estimate the
number of credit hours. (Responses of zero were excluded from the
averages and totals.)
1L 2L 3L
Fall Spring Fall Spring Fall Spring
Total Schools Responding
2011
1 credit (No. of schools) 0 14 1 0 0 0
2 credits (No. of schools) 2 78 19 7 0 0
3 credits (No. of schools) 2 50 7 2 0 0
4 credits (No. of schools) 0 1 0 0 1 1
2011 (average credits) 2.50 2.27 2.22 2.22 4.00 4.00
2010 (average credits) 2.86 2.27 2.21 2.11 0 0
2009 (average credits) 2.60 2.23 2.11 1.86 0 0
2008 (average credits) 2.50 2.23 2.16 1.80 0 0
4
143
27
9
1 1
Semester of First Advocacy Course
Fall 1L
Spring 1L
Fall 2L
Spring 2L
Fall 3L
Spring 3L

Cu
rriculu
m: C
red
its an
d C
ou
rsew
ork
9
14. Does the number of credit hours awarded for the required
program each semester equal the number of hours of in-class
teaching each week?
2011 2010 2009 2008
a. Yes. 143 144 129 138
b. No, we teach more classroom hours each week as
compared to number of credit hours, on average. 19 17 16 20
Average hours more in-classroom teaching 1.19 1.23 1.08 1.22
Minimum hours more in-classroom teaching 0.25 0.25 0.25 0.5
Maximum hours more in-classroom teaching 3 3 2 2
c. No, we teach fewer classroom hours each week as
compared to number of credit hours, on average. 24 23 21 22
Average hours less in-classroom teaching 0.75 0.84 0.82 0.84
Minimum hours less in-classroom teaching 0.25 0.25 0.25 0.25
Maximum hours less in-classroom teaching 2 2 2 2
15. How is your required course graded?
2011 2010 2009 2008
a. Grades that are included in the students’ GPAs 163 159 145 158
b. Grades that are not included in the students’ GPAs 1 1 1 1
c. Honors, pass, fail (or some equivalent) 9 10 8 11
d. Purely pass/fail 3 4 4 4
e. Other method* 11 11 8 7
f. Not Answered 1 6 0 0
* Responses of “other” generally reflected combinations of these methods

Cu
rriculu
m: C
red
its an
d C
ou
rsew
ork
1
0
16. Is the required program graded the same way as other first-year
courses, on a special curve or mean for LRW, or on some other
curve or mean? Please convert your mean grade to a 4.0 scale.1
2011 2010 2009 2008
a. Graded the same way as all first-year courses. 112 107 100 106
Average required mean 2.96 2.94 3.01 2.91
Minimum required mean 2 2 2 2
Maximum required mean 3.75 3.5 3.5 3.6
b. Graded on a curve or mean specifically for LRW. 45 46 39 43
Average required mean 3.02 2.97 2.98 2.95
Minimum required mean 2.5 2.5 2.5 2.5
Maximum required mean 3.7 3.7 3.7 3.7
c. Graded on some other curve or mean. 7 8 6 7
Average required mean 3.02 3.02 2.98 3.08
Minimum required mean 2.5 2.5 2.5 2.5
Maximum required mean 3.4 3.4 3.4 3.4
d. None of the above 23 25 21 25
1 A Note about the Data: In reporting their curves, some schools gave ranges rather than
single numbers. In calculating the averages for this chart, we included those responses at
the mid-point of the range. Thus, a school reporting a range of 3.1-3.3 was included as
having reported 3.2.
112 45
7 23
On Which Curve?
Same as All 1-LCourses
LRW Specific
Other Curve
None of the above

Cu
rriculu
m: C
red
its an
d C
ou
rsew
ork
1
1
17. Are the major writing assignments in the required program
graded anonymously? A major writing assignment is one in which
the final product is equal to or greater than 5 pages.
2011 2010 2009 2008
a. Yes, all major writing assignments 63 62 59 67
b. Yes, over approximately 75% of major assignments 19 20 14 15
c. Yes, over approximately 50% of major assignments 17 16 14 15
d. Yes, over approximately 25% of major assignments 14 12 11 9
e. No 74 76 68 73
18. How do you teach legal research in your program (choose a. or b.),
and who teaches legal research (choose c. through g.)?2
2011 2010 2009 2008
a. Integrated with writing 157 154 139 151
b. Separate from writing 65 65 54 56
c. LRW Faculty 77 77 73 74
d. Librarians 54 56 46 52
e. Both LRW faculty and librarians 75 68 56 66
f. Teaching assistants or other students 27 29 25 24
g. Other 25 21 16 18
2 A Note about the Data: Schools were invited to select all that apply on these questions, so
the total of ―integrated‖ plus ―separate‖ is more than the number of schools responding, for
example, as a result of several schools doing both.

Cu
rriculu
m: C
red
its an
d C
ou
rsew
ork
1
2
19. What assignments are covered in the required LRW program?
Please mark all that apply.
Research
integrated w/
writing
Research
taught
separately
a. Research exercises unrelated to writing
assignments
2011 131 21
2010 119 22
2009 106 18
2008 113 21
b. All closed universe writing
assignments with no research
2011 16 4
2010 11 4
2009 9 3
2008 14 4
c. All open library research for writing
assignments
2011 34 4
2010 30 4
2009 33 4
2008 40 4
d. Combination of closed and open library
research assignments
2011 142 31
2010 139 34
2009 120 25
2008 128 25
e. Legislative history research 2011 76 15
2010 73 16
2009 61 11
2008 68 13
f. Administrative law research 2011 74 13
2010 73 14
2009 61 11
2008 63 11
g. Limited Westlaw/Lexis training in the
first semester
2011 55 12
2010 60 12
2009 56 11
2008 65 14
h. Unlimited Westlaw/Lexis training in
the first semester
2011 105 16
2010 96 19
2009 85 14
2008 87 10
i. Unlimited Westlaw/Lexis training in
the second semester
2011 121 16
2010 113 17
2009 101 12
2008 110 13
j. Other 2011 26 1
2010 26 3
2009 23 1
2008 20 2

Cu
rriculu
m: C
red
its an
d C
ou
rsew
ork
1
3
20. What writing assignments are assigned (choose a. through i.) and
what speaking skills are taught (choose j. through o.) in the
required LRW program? Please mark all that apply.
2011 2010 2009 2008
a. Office memoranda 188 187 166 176
b. Client letters 103 99 88 90
c. Pretrial briefs 111 105 93 93
d. Trial briefs 63 65 51 54
e. Appellate briefs 150 149 133 137
f. Law review articles 3 4 5 6
g. Drafting documents 64 64 46 49
h. Drafting legislation 13 10 8 8
i. Other writing assignment 117 114 92 90
j. Pretrial motion argument 83 78 67 67
k. Trial motion argument 40 41 33 33
l. Appellate brief argument 138 138 122 124
m. In-class presentation 83 85 72 73
n. Oral report to senior partner 71 67 55 53
o. Other speaking skills 61 51 43 47
020406080
100120140160180200
Number of Schools Assigning Number of schools

Cu
rriculu
m: C
red
its an
d C
ou
rsew
ork
1
4
21. What percentage of time is spent on the following classroom
teaching activities? Please mark all that apply. Responses of zero
are included in totals and averages. See charts on next page.
2011 2010 2009 2008
a. Lecture 180 176 158 172
Average time spent 31.67% 31.65% 31.77% 31.80%
Minimum time spent 0% 5% 5% 5%
Maximum time spent 80% 80% 85% 100%
b. Demonstrations 167 162 144 157
Average time spent 11.08% 11.30% 10.86% 10.70%
Minimum time spent 0% 0% 0% 0%
Maximum time spent 30% 35% 35% 35%
c. Individual in-class exercises 164 162 142 156
Average time spent 10.49% 10.31% 9.82% 9.74%
Minimum time spent 0% 0% 0% 0%
Maximum time spent 40% 40% 25% 25%
d. Group in-class exercises 174 172 153 170
Average time spent 16.64% 16.63% 16.76% 16.68%
Minimum time spent 0% 0% 0 0%
Maximum time spent 40% 40% 35% 40%
e. In-class writing 155 153 131 143
Average time spent 8.65% 8.56% 8.24% 8.36%
Minimum time spent 0% 0% 0% 0%
Maximum time spent 50% 50% 25% 25%
f. Q & A and class discussion 179 175 156 171
Average time spent 23.27% 23.40% 23.88% 23.39%
Minimum time spent 0% 0% 5% 5%
Maximum time spent 60% 60% 60% 30%
g. Other activities 99 91 74 76
Average time spent 7.93% 8.02% 7.57% 6.84%
Minimum time spent 0% 0% 0% 0%
Maximum time spent 30% 30% 30% 30%

Cu
rriculu
m: C
red
its an
d C
ou
rsew
ork
1
5
28.9%
10.1%
9.6% 15.2%
7.9%
21.2%
7.2%
Teaching Activities--adjusted to base 100
Lecture
Demonstrations
Individual in-class exercises
Group in-class exercises
In-class writing
Q & A and discussion
Other
020406080
100120140160180200
Teaching Activities (number reporting at least 5% time spent)
Schools Reporting Each Activity

Cu
rriculu
m: C
red
its an
d C
ou
rsew
ork
1
6
22. Are any legal writing assignments coordinated collaboratively by
the LRW faculty and doctrinal faculty with reading or writing
assignments in other first-year courses?
2011 2010 2009 2008
a. Yes. The assignment topics and teaching are
coordinated. 5 6 5 5
b. Somewhat. The topics of the assignments are
coordinated but not the teaching. 43 36 35 35
c. No. 140 145 125 141
23. Do you require rewrites of major writing assignments in the
required program, and if so, are the rewrites graded? Note: A
major writing assignment is one in which the final product is equal
to or greater than 5 pages.
2011 2010 2009 2008
a. Yes, all major assignments require at least one
rewrite. 55 54 52 57
b. Yes, but not all require rewrites. 118 115 100 108
Average % of assignments requiring rewrites 53.2% 53.5% 53% 50.7%
Minimum % 10% 10% 10% 10%
Maximum % 100% 90% 100% 90%
c. No. 15 18 14 16
d. All drafts and rewrites are graded. 83 86 71 73
e. Only drafts are graded, after which rewrites are
required. 7 8 5 6
f. Only rewrites are graded. 83 78 76 80

Cu
rriculu
m: C
red
its an
d C
ou
rsew
ork
1
7
24. For those major writing assignments on which LRW faculty
comment, what is the extent of the comments? Please mark all
that apply. This applies to comments written in pen or pencil on
paper or to feedback provided in a similar fashion via a computer.
2011 2010 2009 2008
a. Comments written on the paper itself and in the
margins 187 186 166 180
b. General feedback memo addressed to all students 159 156 139 146
c. Feedback memo written specifically for the individual
student 132 129 107 119
d. Short comments written at the end of the paper 168 169 151 159
e. Comments in person during conference 179 175 156 165
f. Grading grids or score sheets 135 135 122 138
g. Other* 41 40 37 35
* Examples of “other” answers: oral feedback; general feedback in class; audio
comments; peer review; checklists
25. What percentage of major writing assignments in the required
course are graded? Note: A major writing assignment is one that
requires a final product equal to or greater than 5 pages. Graded
assignments do not include those evaluated with a check, check+,
check-, or similar method.
2011 2010 2009 2008
a. 0-25% 9 7 6 7
b. 26-50% 15 12 11 12
c. 51-75% 31 33 28 30
d. 76-100% 133 134 121 132

Cu
rriculu
m: C
red
its an
d C
ou
rsew
ork
1
8
26. What aspects of your program are consistent among the sections?
Uniform
Generally
Consistent
Varies among
sections
a. Syllabus coverage
2011 87 85 15
2010 85 87 14
2009 76 75 14
2008 83 80 12
b. Number of major
assignments
2011 139 47 1
2010 139 46 1
2009 121 40 4
2008 131 40 4
c. Due dates and length of
most assignments
2011 97 71 18
2010 99 69 17
2009 81 68 16
2008 92 67 16
d. Number of minor
assignments
2011 44 72 71
2010 43 72 69
2009 41 63 60
2008 52 65 57
e. Required textbook
2011 90 21 75
2010 93 25 67
2009 81 22 61
2008 91 25 58
f. Citation text (ALWD,
Bluebook)
2011 158 13 16
2010 156 16 14
2009 138 13 13
2008 150 20 5
g. Content of class
lectures/exercises
2011 11 61 115
2010 9 69 108
2009 9 60 96
2008 8 72 93
h. Grading
2011 53 109 24
2010 53 108 22
2009 45 94 22
2008 55 94 25

Cu
rriculu
m: C
red
its an
d C
ou
rsew
ork
1
9
27. Which citation method do you plan to teach for the next academic
year? Please note: This is the only question relating to the next
academic year instead of the current academic year.
2011 2010 2009 2008
a. ALWD Citation Manual only (14.4%) 27 29 31 40
b. Bluebook only (69.7%) 131 124 104 108
c. Both ALWD Citation Manual and Bluebook (6.4%) 12 13 16 17
d. Either ALWD Citation Manual or Bluebook, at each
teacher’s option. (5.9%) 11 12 9 7
e. Other (3.7%) 7 9 6 9
28. Which of these services does your law school provide for first-year
students? Please mark as many as apply.
2011 2010 2009 2008
a. Writing Specialist, full-time 19 17 14 10
b. Writing Specialist, part-time 40 41 36 33
c. Tutorial 39 37 32 38
d. Student teaching assistants helping students 131 126 111 119
e. Academic Support Program 161 156 142 151
f. Other* 28 30 24 20
* Examples of “other” answers: study skills workshops; summer introductory program;
student-staffed writing center; mentors/tutors

Cu
rriculu
m: C
red
its an
d C
ou
rsew
ork
2
0
29. If your law school employs a writing specialist, what is that
person’s status, training, and gender? (Salary data on next page.)
Writing Specialist #1 Writing Specialist #2
Sta
tus
a. Full-time
2011 21 2
2010 21 2
2009 17 0
2008 13 0
b. Part-time
2011 42 6
2010 38 5
2009 35 6
2008 30 4
c. Tenured
2011 2 0
2010 2 0
2009 3 0
2008 4 0
d. Long-term
contract
2011 13 2
2010 12 1
2009 10 0
2008 08 0
e. Short-term
contract
2011 37 5
2010 33 5
2009 28 6
2008 20 4
Tra
inin
g
f. J.D.
2011 29 5
2010 26 5
2009 25 4
2008 19 3
g. Ph.D. in English
2011 17 1
2010 18 0
2009 14 0
2008 12 0
h. Other relevant
advanced degree
2011 15 1
2010 14 1
2009 12 1
2008 09 0
i. Other
2011 2 1
2010 3 1
2009 3 2
2008 4 2
Gen
der j. Female
2011 44 5
2010 41 5
2009 39 4
2008 33 3
k. Male
2011 19 3
2010 18 2
2009 13 3
2008 09 2

Cu
rriculu
m: C
red
its an
d C
ou
rsew
ork
2
1
2011 2010 2009 2008 W
riti
ng S
peci
ali
st #
1
Full-time paid by semester (number) 0 0 0 0
Full-time paid by year (number) 17 17 15 11
Average salary $71,560 $65,077 $65,803 $63,333
Median salary $70,000 $66,000 $70,000 $65,000
Minimum salary $48,000 $40,000 $40,000 $40,000
Maximum salary $99,300 $90,000 $90,000 $90,000
Part-time paid by semester
(number) 19 17 13 12
Average salary $11,600 $12,333 $7,600 $7,700
Median salary $7,500 $5,000 $7,500 $7,500
Minimum salary $2,000 $2,000 $2,000 $2,000
Maximum salary $30,000 $30,000 $13,500 $13,800
Part-time paid by year (number) 24 23 20 19
Average salary $14,600 $13,667 $7,333 $24,500
Median salary $18,000 $17,000 $8,000 $15,000
Minimum salary $4,000 $4,000 $5,000 $8,000
Maximum salary $20,000 $20,000 $9,000 $60,000
Wri
tin
g S
peci
ali
st #
2
Full-time paid by semester (number) 0 0 0 0
Full-time paid by year (number) 1--NSR 1--NSR 1--NSR 1--NSR
Part-time paid by semester
(number) 3 3 3 2
Average salary ** ** ** **
Median salary ** ** ** **
Minimum salary $14,000 $14,000 $10,000 $10,000
Maximum salary $30,000 $20,000 $14,000 $14,000
Part-time paid by year (number) 3 2 2 2
Average salary ** $21,000 $21,000 $21,000
Median salary ** * * *
Minimum salary $10,000 * * *
Maximum salary $21,000 * * *
* Only one response with values
** Only two responses with values
NSR=No salary responses

Cu
rriculu
m: C
red
its an
d C
ou
rsew
ork
2
2
30. If your law school employs a writing specialist, what
responsibilities does that person have, and approximately what
percentage of time is allocated to each responsibility? Please mark
all that apply.
2011 2010 2009 2008
a. Holding student conferences 59 57 49 41
Average % of time 63.1% 60.8% 62.3% 60%
Minimum % 5% 0% 5% 5%
Maximum % 100% 100% 100% 100%
b. Training LRW faculty 37 37 29 23
Average % of time 2.7% 3.5% 3.6% 4.8%
Minimum % 0% 0% 0% 0%
Maximum % 25% 25% 25% 25%
c. Providing workshops 49 48 42 37
Average % of time 18.8% 21.8% 22.0% 23.9%
Minimum % 0% 0% 0% 0%
Maximum % 80% 80% 80% 80%
d. Training L. REV. and Adv. Moot Court students 36 36 30 22
Average % of time 3.9% 5% 6% 5.0%
Minimum % 0% 0% 0% 0%
Maximum % 40% 50% 50% 50%
e. Teaching upper-level writing courses 38 37 29 21
Average % of time 8.7% 8.2% 10.5% 12.9%
Minimum % 0% 0% 0% 0%
Maximum % 75% 75% 90% 90%
f. Reviewing upper-level seminar papers 42 42 35 24
Average % of time 11.5% 11.0% 11.4% 10.0%
Minimum % 0% 0% 0% 0%
Maximum % 80% 80% 80% 80%
g. Publishing scholarly articles and books 32 34 26 19
Average % of time 2.8% 2.8% 3.5% 3.2%
Minimum % 0% 0% 0% 0%
Maximum % 20% 20% 20% 25%

Cu
rriculu
m: C
red
its an
d C
ou
rsew
ork
2
3
31. Do you have a formal writing center in your law school for your
program? Please mark all that apply.
2011 2010 2009 2008
a. Yes 31 38 33 31
Average years 10.33 9.46 9.25 9.66
Minimum years 1 1 1 1
Maximum years 32 32 31 30
b. Yes, staffed by professionals 31 34 33 33
Average number of professionals 2.14 2.13 2.47 2.63
Minimum number of professionals .5 0.5 0.5 0.5
Maximum number of professionals 7 9 9 17
c. Yes, staffed by teaching assistants 24 26 24 27
Average number of teaching assistants 10.17 10.13 8.88 9.24
Minimum number of teaching assistants 1 1 1 1
Maximum number of teaching assistants 40 40 34 36
d. Other 11 11 10 7
e. No, but the university writing center is available to
law students 81 77 68 70
f. No 70 66 57 72

Up
per-L
evel W
riting C
ou
rses
24
Upper-Level Writing Courses
32. Does your law school offer elective legal writing courses? Elective
course means a course that is not part of the required sequence that
all entering law students must take, such as legal research, legal
writing, or appellate advocacy/moot court.
2011 2010 2009 2008
a. No, no elective courses are offered 10 10 8 12
b. Yes, elective courses taught by non-writing faculty 37 37 33 44
c. Yes, elective courses taught by legal writing faculty
(including the director and LRW adjuncts) 16 20 16 18
d. Yes, elective courses taught by either non-writing or
by legal writing faculty 121 115 106 102
e. Other 4 5 3 5
5%
20%
9%
64%
2%
Electives Offered
No elective courses
Elective courses taught by non-writing faculty
Elective courses taught by legalwriting faculty (including thedirector and LRW adjuncts)
Elective courses taught by eithernon-writing or by legal writingfaculty
Other

Up
per-L
evel W
riting C
ou
rses
25
33. Must students satisfy an upper-level writing requirement, beyond
the required program, for graduation? Please mark all courses that
are required or count toward the requirement.
2011 2010 2009 2008
No 12 16 12 15
Yes 176 171 154 165
2011 2010 2009 2008
Required
Not
required
but counts
toward
requirement Total Total Total Total
a. Advanced legal writing –
general writing 8 70 78 73 59 61
b. Advanced legal writing –
survey course 2 31 33 31 25 24
c. Drafting, general 9 66 75 68 60 62
d. Drafting, litigation 7 73 80 71 63 62
e. Drafting, legislation 4 45 49 45 41 41
f. Drafting, transactional 8 76 84 79 72 72
g. Advanced advocacy
(excluding student-run
moot court programs) 8 92 100 101 91 90
h. Scholarly writing 80 93 173 169 150 161
i. Judicial opinion writing 0 34 34 30 29 24
j. Advanced research 8 59 67 59 47 50
k. Other 5 44 49 46 41 43

Up
per-L
evel W
riting C
ou
rses
26
34. Does your law school train students who are required to produce
scholarly writing/seminar papers? Please mark all that apply.
2011 2010 2009 2008
a. No, not at all or seldom 26 25 23 31
b. The faculty or most faculty do so within the courses for
which the paper is written 142 136 124 125
c. Yes, in writing workshops that are not law school
courses 24 25 16 14
d. Yes, in a separate course taught by non-writing
faculty 13 14 15 15
e. Yes, in a separate course taught by LRW faculty or
director 18 14 12 15
f. Other 25 26 19 20
0
20
40
60
80
100
120
140
160
Not at all orseldom
Within thecourses for
which the paperis written
In writingworkshops that
are not lawschool courses
In a separatecourse taught by
non-writingfaculty
In a separatecourse taught byLRW faculty or
director
Other
Training for Scholarly Writing

Up
per-L
evel W
riting C
ou
rses
27
35. What courses are taught in the elective writing curriculum and who teaches those courses?
Please mark all that apply. Totals do not represent the number of schools responding because
each school could check more than one instructor type for each course.
LRW
Director
LRW Full-
time
Faculty
LRW
Adjuncts
Non-LRW
Full-time
Faculty
Non-
LRW
Adjuncts
Librarians Other Total
a. Advanced legal
writing –
general writing
2011 24 57 19 31 28 3 6 168
2010 24 51 23 30 23 3 4 158
2009 21 47 22 28 17 2 4 141
2008 23 49 18 28 21 1 3 143
b. Advanced legal
writing –
survey course
2011 10 22 6 8 6 0 1 53
2010 11 21 6 8 3 0 1 50
2009 11 20 4 5 2 0 1 43
2008 14 23 5 6 4 0 0 52
c. Drafting,
general
2011 6 40 17 44 53 0 1 161
2010 6 39 16 38 48 0 1 148
2009 5 37 15 33 44 0 0 134
2008 6 39 16 38 44 0 0 143
d. Drafting,
litigation
2011 7 46 13 51 69 0 2 188
2010 8 41 16 46 64 0 0 175
2009 4 34 13 42 55 0 0 148
2008 5 33 13 47 56 0 1 155
e. Drafting,
legislation
2011 2 5 5 44 32 1 1 90
2010 4 5 5 40 29 0 1 84
2009 6 7 3 37 22 0 1 76
2008 6 9 3 37 25 0 1 81

Up
per-L
evel W
riting C
ou
rses
28
LRW
Director
LRW Full-
time
Faculty
LRW
Adjuncts
Non-LRW
Full-time
Faculty
Non-
LRW
Adjuncts
Librarians Other Total
f. Drafting,
transactional
2011 9 46 16 69 66 1 1 207
2010 9 42 16 63 62 1 1 194
2009 6 34 13 56 49 1 1 160
2008 6 34 12 58 51 1 0 162
g. Advanced
advocacy
(excluding
student-run
moot court
programs)
2011 19 50 25 70 65 0 2 231
2010 20 50 28 66 69 0 3 236
2009 17 48 25 58 59 0 2 209
2008 18 44 21 67 64 0 2 216
h. Scholarly
writing
2011 11 30 6 94 21 3 5 170
2010 10 32 8 92 19 1 4 166
2009 9 30 5 79 14 2 3 142
2008 10 32 4 81 16 2 5 150
i. Judicial
opinion writing
2011 8 14 4 19 13 1 4 63
2010 7 14 3 17 14 0 5 60
2009 7 12 3 14 13 0 2 51
2008 7 8 3 15 9 0 4 46
j. Advanced
research
2011 5 13 3 21 7 137 2 188
2010 3 14 3 21 6 129 3 179
2009 2 14 3 17 5 115 1 157
2008 2 13 2 14 6 121 2 160
k. Other 2011 3 8 6 14 5 0 2 38
2010 5 8 6 13 4 0 3 39
2009 2 6 3 11 2 0 1 25
2008 3 5 4 10 3 0 1 26

Up
per-L
evel W
riting C
ou
rses
29
36. Approximately how many students enroll each year in the
following upper-level writing courses? Is the demand for each
upper-level course greater than its availability?
Number of students who
enroll
(Average/Min./Max.)
Number of schools
reporting demand greater
than availability
Total
offering
2011 2011 2010 2009 2008 2011 2010 2009 2008
a. Advanced
legal writing
– general
39.30 44.42 33.40 31.63
43 39 42 43 80 10 10 10 4
350 350* 180 180
b. Advanced
legal writing
– survey
26.90 35.00 39.74 45.81
13 12 13 18 21 10 10 11 12
80 200 200 200
c. Drafting,
general
42.48 43.57 45.20 51.59
26 22 25 27 61 5 5 5 5
250 250 250 300
d. Drafting,
litigation
39.90 39.83 41.18 40.56
38 33 32 31 93 6 6 6 6
120 130 160 160
e. Drafting,
legislation
29.73 27.41 25.52 20.00
14 15 16 16 45 6 6 6 6
250 250 250 70
f. Drafting,
transactional
39.33 43.99 38.81 39.52
42 35 31 32 92 6 6 6 6
150 350 300 300
g. Advanced
advocacy
56.03 53.10 46.27 49.85
34 28 29 29 109 9 6 6 6
340 340 275 340
h. Scholarly
writing
94.34 92.22 80.31 80.72
6 9 11 10 65 5 3 3 5
422 422 300 300
i. Judicial
opinion
writing
18.80 17.29 16.39 18.63
11 11 12 9 30 5 5 5 5
60 50 50 50
j. Advanced
research
40.61 41.55 39.90 37.67
37 34 35 32 119 5 5 3 3
400 350 350 350
k. Other 62.81 67.14 63.36 59.25
6 5 3 6 16 5 5 5 5
275 275 275 275
* Answers in excess of 500 excluded

Up
per-L
evel W
riting C
ou
rses
30
37. Do any upper-level doctrinal courses taught by full-time faculty
include a writing assignment? Please note: Doctrinal course means
a course other than a clinic, seminar, or advanced writing course.
Writing assignment means an assignment other than a traditional
written in-class or take-home examination.
2011 2010 2009 2008
a. Yes, all doctrinal courses include a writing
component 2 2 2 2
b. Yes, some doctrinal courses include a writing
component 178 174 156 170
Average % with writing component 23.45% 24.01% 23.39% 23.23%
Minimum % with writing component 5% 5% 3% 3%
Maximum % with writing component 80% 80% 80% 80%
c. No doctrinal courses include a writing
component 8 11 8 9
38. If you answered (a) or (b) in the prior question, what types of
assignments do the doctrinal courses include? Please mark all that
apply.
2011 2010 2009 2008
a. Drafting—general 88 85 73 82
b. Drafting—litigation 97 96 90 96
c. Drafting—legislation 70 65 53 56
d. Drafting—transactional 112 108 98 97
e. Advanced advocacy 71 64 59 62
f. Memoranda or essays 120 112 103 111
g. Client/Opinion letters 71 64 50 52
h. Judicial opinions 54 51 43 45
i. Scholarly papers 144 139 127 146
j. Other 36 33 28 27

Up
per-L
evel W
riting C
ou
rses
31
39. How much written feedback do students generally receive on
assignments in doctrinal courses?
2011 2010 2009 2008
a. More feedback than in the required writing program 1 0 0 0
b. About the same amount of feedback as in the required
writing program 3 3 2 3
c. Somewhat less feedback than in the required writing
program 30 32 29 34
d. Considerably less feedback than in the required
writing program 74 75 68 68
e. Don’t know 78 75 64 73

Tech
nolo
gy
32
Technology
40. Does the law school provide legal writing faculty with
technological resources such as Westlaw, LexisNexis, access to the
Internet, and word processing?
2011 2010 2009 2008
a. Yes 188 186 165 181
b. No 0 1 1 0
41. If the law school does provide legal writing faculty with computer
technology, how do the resources compare with those of other
faculty?
2011 2010 2009 2008
a. The resources are better than those of other faculty 5 5 3 6
b. The resources are comparable to those of other faculty 179 174 159 170
c. The resources are less than those of other faculty 3 6 3 5
42. Does the LRW program have a web page?
2011 2010 2009 2008
a. Yes, the LRW program has a web page 72 69 61 61
b. Yes, at least one member of the LRW faculty has a
web page 42 42 39 44
c. No web pages 74 76 66 76

Tech
nolo
gy
33
43. Which of the following technologies do you and your LRW faculty
use in your program, and how effective is each technology, rated on
a scale of 1 to 5, with 1 being not effective and 5 being very
effective? Answers of “0” were not included in averages. Top
answer for 2010 highlighted. Ratings on next page
All faculty
use
Most
use
Some
use
No
faculty
use
a. E-mail listserv for
students (total schools
responding)
2011 127 29 19 10
2010 121 32 18 11
2009 105 31 16 9
2008 115 32 17 11
b. Smart classroom 2011 62 39 53 15
2010 54 36 53 22
2009 49 31 50 16
2008 51 29 55 25
c. On-line edits 2011 17 25 107 26
2010 16 22 104 30
2009 14 17 93 26
2008 13 17 103 32
d. Course web page 2011 30 15 41 59
2010 30 18 39 60
2009 28 16 37 46
2008 36 15 38 55
e. Web course utility product
(e.g. TWEN, WebCT,
Blackboard, etc.)
2011 113 33 34 4
2010 103 37 39 5
2009 84 38 38 3
2008 84 34 53 6

Tech
nolo
gy
34
2011 Effectiveness Rating
(Total schools responding)
1
(least)
2 3 4 5
(most)
Average
Rating
a. E-mail listserv for students
(total schools responding) 4 4 11 39 113
2011: 4.48
2010: 4.48
2009: 4.50
2008: 4.47
b. Smart classroom
0 5 27 48 65
2011: 4.19
2010: 4.12
2009: 4.13
2008: 4.04
c. On-line edits
3 6 28 46 51
2011: 4.01
2010: 4.02
2009: 4.06
2008: 4.03
d. Course web page
1 3 16 20 30
2011: 4.07
2010: 3.96
2009: 4.02
2008: 3.97
e. Web course utility product
(e.g. TWEN, WebCT,
Blackboard, etc.) 4 4 15 66 85
2011: 4.29
2010: 4.24
2009: 4.24
2008: 4.16

Dire
ctors
35
Directors
44. Does your program have a director (a person with direct
responsibility for the design, implementation, and supervision of
your law school’s writing program)?
2011 2010 2009 2008
a. Yes 153 151 134 154
b. No 35 35 32 27
c. No answer 0 5 0 0
45. If your program has a director, which of these choices best
describes the director?
2011 2010 2009 2008
a. A tenured faculty member whose primary
responsibility is directing the legal writing program 34 31 29 33
b. An untenured faculty member on a tenure track whose
primary responsibility is directing the legal writing
program 19 18 16 18
c. A faculty member not on a tenure track whose
primary responsibility is directing the legal writing
program 58 59 55 60
d. A faculty member or administrator whose primary
responsibility is not the first-year legal writing
program 4 8 4 5
e. An administrator whose primary responsibility is
directing the legal writing program 3 4 4 5
f. A faculty member with clinical tenure or on clinical
tenure track 21 19 14 13
g. Other 25 25 23 26

Dire
ctors
36
46. Does your program have an associate or assistant director? If so,
please give the salary.
2011 2010 2009 2008
a. Yes 37 37 31 39
Average annual salary $86,991 $84,266 $83,259 $82,168
Median annual salary $87,500 $81,000 $80,000 $80,000
Minimum annual salary $40,000 $40,000 $60,000 $50,000
Maximum annual salary $146,000 $138,000 $110,000 $180,000
b. No 132 132 118 125
47. If the director is not tenured or tenure track, how long is the term
of the director’s contract?
2011 2010 2009 2008
a. Number of years
1 year 19 20 16 17
2 years 4 5 3 4
3 years 10 12 15 17
>3 years 49 48 37 44
b. The contractual terms have never been specifically set
out 10 7 6 4
c. Not applicable or unknown 47 44 44 46
$0
$20,000
$40,000
$60,000
$80,000
$100,000
$120,000
$140,000
$160,000
$180,000
$200,000
2011 2010 2009 2008
Average Annual Salary
Median Annual Salary
Minimum Annual Salary
Maximum Annual Salary
Associate/Assistant Director Salary Data

Dire
ctors
37
48. What faculty title does the director have in official law school
materials (publications, catalogues, signs, etc.)? Please mark all
that apply.
2011 2010 2009 2008
a. Professor, associate professor, or assistant professor 70 72 66 72
b. Professor, associate professor, or assistant professor of
legal writing 29 24 22 18
c. Visiting professor or visiting professor of legal writing 1 0 0 2
d. Clinical professor, clinical associate professor, or
clinical assistant professor 23 22 18 23
e. Lecturer or senior lecturer 8 7 6 9
f. Instructor 3 5 2 4
g. Director 81 83 74 74
h. Assistant or associate dean 6 5 4 4
i. Other 23 22 18 17
0
10
20
30
40
50
60
70
80
90
Director Job Titles

Dire
ctors
38
49. What is the current annual base salary of the director? Note: Base
salary is the salary for the current academic year, including any
additional stipend for the administrative workload but excluding
payments for other work such as summer teaching, academic
support, moot court coaching.
2011 2010 2009 2008
a. Salary based on a 12-month calendar
contract period (not a 12-month
payment period) 78 65 58 57
Average salary $108,319 $103,540 $102,116 $97,091
Median salary $104,000 $100,000 $96,500 $95,000
Minimum salary $50,000 $60,000 $60,000 $60,000
Maximum salary $220,000 $187,000 $165,000 $151,500
b. Salary based on a 9- or 10-month period 76 64 75 80
Average salary $108,918 $107,990 $105,580 $100,157
Median salary $103,500 $100,000 $100,000 $97,000
Minimum salary $64,000 $61,000 $59,000 $55,000
Maximum salary $208,000 $199,716 $200,000 $186,300
c. Number of combined 12-month & <12-
month salaries 133 129 133 137
Average salary $108,699 $105,749 $104,100 $98,817
Median salary $104,000 $100,000 $98,000 $95,000
Minimum salary $50,000 $60,000 $59,000 $55,000
Maximum salary $220,000 $199,716 $200,000 $186,300
d. N/A or Don’t know 9 15 11 1

Dire
ctors
39
0
5
10
15
20
25
Salaries of Directors by Range
Number ofDirectors

Dire
ctors
40
Director Salary by Region
2011 2010 2009 2008
N
Average/
Median Min. Max.
Average/
Median
Average/
Median
Average/
Median
New York City & Long Island
Average 5
$160,420 $120,000 $208,000
$154,443 $151,200 $143,825
Median $162,000 $152,500 $144,500 $134,500
Northeastern (excluding New York City and Long Island)
Average 13
$110,154 $50,000 $172,000
$111,839 $110,360 $107,421
Median $110,000 $105,000 $107,500 $107,500
Mid Atlantic
Average 25
$112,662 $68,000 $220,000
$104,106 $100,667 $101,173
Median $108,150 $100,000 $98,000 $95,500
Great Lakes/Upper Midwest
Average 25
$108,273 $75,000 $206,000
$108,116 $104,069 $98,879
Median $102,000 $99,500 $97,000 $95,000
Southwest & South Central
Average 23
$98,681 $64,000 $136,000
$93,800 $92,150 $86,590
Median $95,000 $88,500 $87,500 $80,000
Southeast
Average 18
$94,497 $60,000 $140,000
$92,763 $97,477 $85,906
Median $95,500 $87,250 $100,000 $82,750
Northwest & Great Plains
Average 4
$109,417 $86,667 $136,000
$97,445 $101,733 $90,100
Median $107,500 $89,334 $86,667 $78,500
Far West
Average 24
$113,538 $65,000 $165,000
$113,994 $112,791 $105,288
Median $107,000 $106,500 $116,000 $100,000
Question 6 by Question 49
N=number of salary responses for 2011 in each category

Dire
ctors
41
Director Salary by Geographical Setting
2011 2010 2009 2008
N
Average/
Median Min. Max.
Average/
Median
Average/
Median
Average/
Median
Urban
Average 90
$112,690 $50,000 $220,000
$109,847 $107,511 $101,234
Median $107,575 $100,000 $100,000 $96,100
Suburban
Average 37
$98,844 $65,000 $140,000
$96,043 $96,844 $94,413
Median $98,000 $94,500 $95,000 $94,000
Rural
Average 6
$108,945 $86,667 $136,000
$105,333 $97,778 $88,525
Median $107,500 $99,000 $95,500 $89,500
Question 7 by Question 49
N=number of salary responses for 2011 in each category
Director Salary by Institution Type
2011 2010 2009 2008
N
Average/
Median Min. Max.
Average/
Median
Average/
Median
Average/
Median
Public
Average 55
$103,104 $50,000 $206,000
$101,916 $101,464 $94,402
Median $96,000 $93,000 $93,000 $90,000
Private
Average 78
$112,593 $64,000 $220,000
$108,949 $106,970 $103,017
Median $107,575 $104,000 $104,000 $99,000
Question 8 by Question 49
N=number of salary responses for 2011 in each category

Dire
ctors
42
Director Salary by First-year Class Size
2011 2010 2009 2008
N
Average/
Median Min. Max.
Average/
Median
Average/
Median
Average/
Median
<100 Students
Average 4
$101,667 $86,667 $136,000
$97,733 $92,945 $87,100
Median $92,000 $89,000 $85,834 $81,500
101-150 Students
Average 15
$110,233 $81,500 $160,000
$103,034 $100,206 $96,964
Median $104,000 $99,000 $96,000 $91,000
151-200 Students
Average 32
$99,847 $50,000 $142,099
$95,380 $97,481 $94,536
Median $99,000 $90,700 $95,000 $91,700
201-250 Students
Average 32
$104,554 $70,000 $172,000
$106,156 $107,283 $98,422
Median $101,250 $106,600 $110,190 $99,000
251-300 Students
Average 16
$95,813 $75,000 $129,500
$97,813 $91,918 $94,285
Median $94,000 $88,900 $88,000 $90,000
>300 Students
Average 34
$127,029 $60,000 $220,000
$123,047 $118,405 $109,004
Median $123,000 $125,000 $114,000 $107,000
Question 9 by Question 49
N=number of salary responses for 2011 in each category
Dire
ctors
43
Director Salary by Years Since J.D.
2011 2010 2009 2008
N
Average/
Median Min. Max.
Average/
Median
Average/
Median
Average/
Median
0-5 Years*
Average 0
* * *
* * $76,000
Median * * * $76,000
6-10 Years
Average 7
$86,810 $72,000 $112,000
$82,167 $84,317 $80,143
Median $84,000 $84,500 $84,084 $70,000
11-15 Years
Average 20
$96,881 $64,000 $140,000
$95,752 $93,373 $86,615
Median $97,500 $94,500 $95,000 $85,000
16-20 Years
Average 26
$105,625 $75,000 $175,000
$96,938 $100,626 $99,018
Median $103,000 $92,500 $100,000 $96,000
21-25 Years
Average 27
$107,433 $72,000 $147,000
$104,325 $100,870 $93,092
Median $104,000 $100,600 $98,000 $93,500
26+ Years
Average 51
$116,564 $50,000 $208,000
$122,137 $120,105 $115,401
Median $110,000 $120,000 $120,000 $120,000
Question 3 by Question 49
N=number of salary responses for 2011 in each category
* No responses with salary date in the 0-5 category for 2009, 2010, or 2011

Dire
ctors
44
Director Salary by Years of Law School Teaching
2011 2010 2009 2008
N
Average/
Median Min. Max.
Average/
Median
Average/
Median
Average/
Median
0-5 Years
Average 14
$93,905 $65,000 $120,000
$87,885 $92,333 $88,714
Median $96,000 $88,334 $95,000 $90,000
6-10 Years
Average 36
$95,339 $50,000 $140,000
$94,920 $89,186 $86,951
Median $96,250 $94,375 $85,539 $85,500
11-15 Years
Average 26
$109,753 $72,000 $206,000
$101,247 $106,317 $99,544
Median $97,250 $92,000 $100,000 $98,600
16-20 Years
Average 16
$112,169 $79,000 $160,000
$110,039 $107,209 $102,832
Median $115,000 $115,000 $112,000 $100,000
21-25 Years
Average 19
$117,518 $60,000 $172,000
$128,609 $123,773 $115,445
Median $114,245 $123,000 $122,000 $122,000
26+ Years
Average 15
$138,933 $70,000 $220,000
$137,647 $136,840 $133,101
Median $130,500 $132,000 $129,750 $130,000
Question 4 by Question 49
N=number of salary responses for 2011 in each category

Dire
ctors
45
Director Salary by Years Directing Current Program
2011 2010 2009 2008
N
Average/
Median Min. Max.
Average/
Median
Average/
Median
Average/
Median
0-5 Years
Average 60
$101,189 $50,000 $220,000
$95,765 $97,155 $92,492
Median $96,000 $93,875 $95,000 $90,000
6-10 Years
Average 28
$106,587 $72,000 $147,000
$106,163 $103,260 $97,267
Median $104,500 $100,000 $102,000 $94,500
11-15 Years
Average 14
$117,229 $80,500 $150,000
$107,487 $109,638 $109,328
Median $115,000 $101,200 $120,000 $115,000
16+ Years
Average 29
$123,621 $60,000 $208,000
$125,152 $120,888 $109,288
Median $125,000 $123,500 $118,000 $107,500
Question 5 by Question 49
N=number of salary responses for 2011 in each category

Dire
ctors
46
Director Salary by Staffing Model
2011 2010 2009 2008
N
Average/
Median Min. Max.
Average/
Median
Average/
Median
Average/
Median
Tenured or tenure-track for LRW faculty (answers a and b)
Average 8
$113,000 $92,000 $160,000
$101,925 $101,843 $92,971
Median $103,500 $92,000 $95,000 $91,400
Full-time nontenure-track
Average 53
$98,242 $50,000 $206,000
$101,194 $99,452 $92,560
Median $96,000 $95,750 $95,000 $90,000
Part-time
Average 2
$105,125 $100,000 $110,250
$109,000 $100,500 $95,333
Median $105,125 $109,000 $95,000 $83,000
Adjuncts
Average 15
$117,478 $72,000 $208,000
$107,955 $115,004 $109,443
Median $110,000 $104,000 $118,000 $109,700
Complex Hybrid
Average 54
$116,106 $75,000 $220,000
$110,985 $107,638 $104,179
Median $109,075 $100,570 $100,000 $100,000
Question 10 by Question 49
N=number of salary responses for 2011 in each category
$85,000
$90,000
$95,000
$100,000
$105,000
$110,000
$115,000
$120,000
Average Director Salary 2011

Dire
ctors
47
Director Salary by Director Type
2011 2010 2009 2008
N
Average/
Median Min. Max.
Average/
Median
Average/
Median
Average/
Median
Tenured, primary responsibility is LRW
Average 28
$133,379 $84,000 $220,000
$127,771 $124,156 $118,686
Median $132,500 $126,000 $125,000 $121,000
Untenured tenure track, primary responsibility is LRW
Average 16
$103,082 $86,667 $130,000
$100,890 $97,411 $95,700
Median $99,000 $95,000 $95,000 $95,000
Nontenure-track, primary responsibility is LRW
Average 51
$96,767 $60,000 $162,000
$96,180 $91,789 $86,523
Median $95,000 $93,000 $88,500 $84,500
Administrator or faculty, primary responsibility not LRW
Average 1
$120,000 $120,000 $120,000
$131,667 $134,667 $113,733
Median $120,000 $125,000 $140,000 $120,000
Administrator, primary responsibility is LRW
Average 3
$104,920 $79,000 $140,000
$99,750 $99,500 $89,500
Median $112,000 $92,000 $91,500 $89,000
Clinical tenure or clinical tenure track
Average 20
$105,847 $80,500 $150,000
$101,332 $101,698 $101,018
Median $103,100 $100,000 $100,000 $93,500
Other
Average 14
$111,857 $50,000 $206,000
$108,512 $122,464 $106,541
Median $95,000 $111,500 $123,000 $120,000
Question 45 by Question 49
N=number of salary responses for 2011 in each category

Dire
ctors
48
50. What personnel benefits does the director receive?
2011 2010 2009 2008
a. The same benefits as tenure-track faculty 119 118 103 117
b. The same benefits as nontenure-track faculty 33 30 26 24
If the answer is not a or b, please mark all of the benefits below that the director
receives.
c. Health insurance and related benefits 18 19 16 24
d. Life insurance 17 19 16 24
e. Contributions to retirement 19 21 18 24
f. Other 5 4 4 5
g. None 0 0 0 0
51. Past surveys have found a discrepancy between salaries paid
tenure-track faculty and LRW directors. You may wish to inquire
to determine the situation at your law school. Please provide us
with your best estimate of the difference between the current
annual base salary of the director and the annual base salary of an
entry-level tenure-track faculty member at your law school.
2011 2010 2009 2008
a. The director earns _____ more than the new
tenure-track faculty member 55 58 53 54
Average difference $28,519 $28,101 $27,046 $26,664
Median difference $26,500 $28,000 $28,000 22,500
Minimum difference $5,000 $2,000 $2,000 $5,000
Maximum difference $60,000 $60,000 $75,000 $64,000
b. The director earns roughly the same as the
new tenure-track faculty member 22 22 16 22
c. The director earns ______ less than the new
tenure-track faculty member 55 49 47 55
Average difference $26,145 $24,132 $22,597 $19,988
Median difference $25,000 $21,250 $20,000 $20,000
Minimum difference $2,000 $2,000 $2,000 $2,000
Maximum difference $60,000 $60,000 $60,000 $50,000
d. Don’t know 32 34 29 28
e. N/A 0 0 0 0

Dire
ctors
49
52. What is your best estimate of the difference between the annual
base salary of the director and the annual base salary of an entry-
level clinician at your law school?
2011 2010 2009 2008
a. The director earns _____ more than the new
clinician 65 63 62 68
Average difference $29,321 $28,881 $29,987 $28,683
Median difference $28,500 $25,000 $30,000 $27,500
Minimum difference $2,000 $5,000 $6,400 $5,000
Maximum difference $70,000 $70,000 $90,000 $75,000
b. The director earns roughly the same as the
new clinician 11 9 8 5
c. The director earns ______ less than the new
clinician 11 11 11 10
Average difference $21,111 $15,500 $13,833 $12,438
Median difference $20,000 $15,000 $15,000 $12,500
Minimum difference $5,000 $5,000 $5,000 $5,000
Maximum difference $50,000 $30,000 $20,000 $20,000
d. Clinicians are paid tenure-track salaries 13 12 14 15
e. No clinicians at my school 8 7 5 7
f. Don’t know 53 57 45 56
Dire
ctors
50
53. For the current academic year, please indicate the percentage of
time the director devoted to the following activities. Entries of zero
are excluded from averages; first line is # of responses.
2011 2010 2009 2008
a. Directorship duties, such as administering,
training LRW faculty members 156 151 133 139
Average time spent 29.3% 28.9% 28.7% 28.3%
Minimum time spent 5% 5% 5% 5%
Maximum time spent 90% 75% 80% 100%
b. Teaching students in the required program 136 136 119 134
Average time spent 39.6% 39.5% 40.1% 33.9%
Minimum time spent 10% 10% 5% 0%
Maximum time spent 80% 80% 80% 80%
c. Teaching outside the required program 82 80 71 104
Average time spent 22.4% 22.2% 24.2% 19.5%
Minimum time spent 5% 5% 5% 0%
Maximum time spent 90% 65% 90% 80%
d. Service to the law school 146 140 127 131
Average time spent 13.4% 12.9% 12.3% 12.8%
Minimum time spent 5% 5% 5% 5%
Maximum time spent 65% 30% 30% 30%
e. Academic Support 30 29 26 69
Average time spent 9.5% 9.0% 9.6% 4.5%
Minimum time spent 5% 5% 5% 0%
Maximum time spent 30% 30% 30% 35%
f. Scholarship 86 84 72 95
Average time spent 12.0% 11.5% 11.7% 10.0%
Minimum time spent 5% 5% 5% 0%
Maximum time spent 40% 40% 40% 55%
g. Other activities 50 55 40 60
Average time spent 13.3% 12.8% 11.5% 7.6%
Minimum time spent 5% 5% 5% 0%
Maximum time spent 65% 65% 55% 65%

Dire
ctors
51
21%
28%
16%
10%
7%
9%
9%
Directors' Workload (adjusted to base 100)
Directorship duties
Teaching in the required program
Teaching outside the requiredprogram
Service
Academic Support
Scholarship
Other

Dire
ctors
52
54. During the current academic year, please indicate the director’s
workload in the required program by filling in the chart below.
Averages do not include responses of “zero.” See chart next page.
Fall Semester Spring Semester
2011 2010 2009 2008 2011 2010 2009 2008
a. # of students taught at
least weekly in the
required program.
Avg. 36.18 39.61 38.54 38.96 34.30 37.77 36.84 37.71
Min. 2 2 10 10 8 8 10 10
Max. 300 300 200 220 300 300 195 195
b. In-class hours of
teaching each week
Avg. 3.16 3.27 3.19 3.27 2.94 3.01 2.97 2.99
Min. 1 1 1 1 1 1 1 1
Max. 7 8 7 15 6 7 10 10
c. # of major assignments
(> 5 pages)
Avg. 3.21 3.14 3.10 3.27 2.74 2.85 2.80 2.82
Min. 1 1 1 1 1 1 1 1
Max. 10 8 8 8 9 9 9 15
d. # of minor assignments
( < 5 pages)
Avg. 3.81 3.64 3.79 4.10 3.24 3.16 3 3.48
Min. 1 1 1 1 1 1 1 1
Max. 18 18 20 20 18 18 18 20
e. Total # of pages of
student work read per
term
Avg. 1153 1189 1170 1189 1196 1272 1282 1143
Min. 200 150 160 30 50 40 276 30
Max. 4015 8370 8370 7600 5000 8100 8100 4261***
f. Total hours in
conference required or
strongly recommended
Avg. 36.89 38.84 37.70 40.54 34.82 37.86 35.82 37.65
Min. 6.5 2 2 2 7 6 5 5
Max. 150 150 150 220** 200 200 200 220**
g. Total hours preparing
major research and
writing assignments
Avg. 46.36 47.33 49.68 50.00 50.07 48.71 48.82 47.3
Min. 2 2 5 5 10 8 5 2
Max. 200 300 300 300 192 250 250 250
h. Total hours preparing
for class (excluding
hours reported above in
g)
Avg. 54.16 52.02 51.24 65.01 51.28 48.12 50.10 50.25
Min. 2 2 1 1 2 2 1 1
Max. 300 180 180 180** 300 150 150 168**
**Answer if excess of 300 excluded; ***Answer in excess of 10,000 excluded

Dire
ctors
53
55. Did the director teach courses other than required writing courses
in the current academic year?
2011 2010 2009 2008
a. Yes, only academic support 2 4 4 4
b. Yes, courses other than academic support 88 87 77 94
c. No 67 65 55 54
d. N/A 7 8 9 8
31
32
33
34
35
36
37
38
39
40
41
2007 2008 2009 2010 2011
# Students Taught FallSemester
# Students Taught SpringSemester
Average Number Students Taught by Directors (by semester)

Dire
ctors
54
56. If the director taught courses in the current academic year other
than required writing courses:
2011 2010 2009 2008
a. How many courses did the director teach?
Total responses 87 88 80 97
Average number of courses 1.87 1.84 1.90 1.92
Minimum number of courses 1 1 1 1
Maximum number of courses 5 5 6 5
b. How many of those courses were on legal writing, drafting, or advanced advocacy?
Total responses 44 45 41 45
Average number of courses 1.52 1.62 1.41 1.58
Minimum number of courses 1 1 1 1
Maximum number of courses 4 5 5 7
c. How many of those courses were courses on subjects other than legal writing,
drafting or oral advocacy?
Total responses 63 60 54 74
Average number of courses 1.56 1.43 1.73 1.72
Minimum number of courses 1 1 1 1
Maximum number of courses 5 5 5 7
d. What were the subject areas of the non-
writing courses? various various various various
e. How many total credit hours for other than entry-level courses?
Total responses 84 79 77 93
Average number of hours 4.61 4.66 4.62 5.04
Minimum number of hours 1 1 1 1
Maximum number of hours 15 15 15 13
f. Did the director receive additional compensation?
Total responses 130 130 115 123
Yes 24 22 19 23
No 106 108 96 100
g. How much additional compensation?
Total responses 17 17 14 16
Average compensation $10,706 $8,988 $12,107 $9,456
Median compensation $10,000 $8,000 $11,500 $7,800
Minimum compensation $2,000 $2,500 $4,400 $3,000
Maximum compensation $32,000 $18,000 $24,000 $25,000

55
57. How many people does the director supervise and what are their genders? ―Full-time
professionals” includes LRW faculty, writing specialists, academic support personnel, etc.
Full-time professionals
Part-time professionals
not enrolled in the law
school
Adjuncts Law School Graduate
Students
Teaching or Research
Assistants
2011 2010 2009 2008 2011 2010 2009 2008 2011 2010 2009 2008 2011 2010 2009 2008 2011 2010 2009 2008
Total
Schools
Responding
(Female):
131 125 109 125 23 21 18* 23 77 79 65 65 8 8 6 6 92 86 76 91
Females
Supervised 521 485 433 465 40 42 40 52 644 623 510 591 43 47 38 42 770 782 548 696
Average
number of
females
4.0 3.9 4.0 3.7 1.7 2.0 2.2 2.3 8.4 7.9 7.9 9.1 5.4 5.9 4.5 7.0 8.4 9.1 4.5 7.6
% female
in category 71% 71% 72% 69% 74% 75% 85% 81% 54% 54% 54% 54% 62% 60% 62% 63% 55% 55% 53% 58%
Total
Schools
Responding
(Male):
98 92 80 97 12 12 7 9 66 65 54 56 4 4 2 4 79 83 74 75
Males
Supervised 208 201 168 207 14 14 7 12 549 521 429 510 26 31 23 25** 622 650 483 497
Average
number of
males
2.1 2.2 2.1 2.1 1.2 1.2 1 1.3 8.32 8.0 7.9 9.1 6.5 7.8 11.5 6.3 7.9 7.8 3 6.6
% male in
category 29% 29% 28% 31% 26% 25% 15% 19% 46% 46% 46% 46% 38% 40% 38% 37% 45% 45% 47% 42%
Total faculty
members in
category
729 686 601 672 54 56 47 64 1193 1144 939 1101 69 78 61 67 1392 1432 1031 1193
* Erroneous data from 2009 report corrected; **answers of 1,000 or greater excluded

Dire
ctors
56
58. Does the director participate in the following activities either as
part of core job responsibilities or as an additional activity with
additional compensation? Please mark all that apply and fill in the
approximate amount of additional compensation.
Activity 2011 2010 2009 2008
a. Coach in-
house moot
court
teams
Core Job Responsibility 14 12 13 16
Additional Activity 26 27 20 20
N/A or No response 107 106 74 101
Additional Compensation
$3,677 avg.
(2 responses:
$3,854 and
$3,500)
$3,677 avg.
(2 responses:
$3,854 and
$3,500)
No
responses
No
responses
b. Coach
outside
moot court
teams
Core Job Responsibility 11 11 10 11
Additional Activity 17 17 16 22
N/A or No response 117 114 78 104
Additional Compensation
$2,000
average
(2 responses
included, 1 of
$1,000 and 1
of $3,000)1
$1,667 avg.
(3 responses,
2 of $1,000
and 1 of
$3,000)
$1,667
avg.
(3 responses,
2 of $1,000
and 1 of
$3,000)
$1,000
avg.
(2 responses,
both $1,000)
c. Coach
outside
negotiation
&
counseling
teams
Core Job Responsibility 1 1 2 5
Additional Activity 10 11 6 7
N/A or No response 126 122 88 117
Additional Compensation $3,000
(1 response)
$3,000
(1 response)
$3,000
(1 response)
$2,000
(1 response)
d. Faculty
advisor to
students
Core Job Responsibility 68 60 56 64
Additional Activity 37 42 34 41
N/A or No response 48 50 30 41
Additional Compensation No
responses
No
responses
No
responses
No
responses
e. First-year
orientation
Core Job Responsibility 83 81 71 82
Additional Activity 30 30 29 35
N/A or No response 48 50 22 38
Additional Compensation
$2,367
(min. $500,
max. $4,200)
(5 responses)2
$2,340 avg.
(min. $500,
max. $4,200)
(5 responses)
$1,375
avg.
(min $500,
max. $3,000)
(4 responses)
$1,600
avg.
(min. $500,
max. $3,000)
(5 responses)
1 A response of $45 was excluded as likely erroneous OR an hourly wage not converted into
an annual amount. 2 A response of $5 was excluded as likely erroneous.

Dire
ctors
57
Activity 2011 2010 2009 2008
f. Academic
Support
Core Job Responsibility 14 14 9 15
Additional Activity 28 25 21 30
N/A or No response 104 103 74 76
Additional Compensation
$11,167 avg.
(3 responses,
$500, $3,000,
and $30,000)
$3,833 avg.
(3 responses,
$500, $3,000,
and $8,000)
$5,500
avg.
(2 responses,
$500 and
$10,500)
$500
(1 response)
g. Law
Review
advisor
Core Job Responsibility 10 10 10 7
Additional Activity 16 13 14 23
N/A or No response 115 114 77 104
Additional Compensation No
responses
No
responses
No
responses
No
responses
h. Writing
center
Core Job Responsibility 10 14 10 9
Additional Activity 4 3 4 6
N/A or No response 123 118 82 112
Additional Compensation No
responses
No
responses
No
responses
No
responses
i. Other
activities
Core Job Responsibility 37 39 28 28
Additional Activity 39 30 28 27
N/A or No response 66 72 45 73
Additional Compensation
$6,450 avg.
(min. $500,
max. $12,000)
(8 responses)
$10,014
avg.
(min. $500,
max $30,000)
(7 responses)
$7,560
avg.
(min. $500,
max $30,000)
(10
responses)
$5,511
avg.
(min. $500,
max.
$18,000)
(9 responses)

Dire
ctors
58
59. Does the director serve on faculty committees?
2011 2010 2009 2008
a. Yes, as a voting member 142 138 125 136
b. Yes, as a non-voting member 8 8 5 9
Which Committees? (Please mark all that apply.)
Admissions Committee 32 39 33 36
Appointments Committee 25 26 18 25
Clerkship Committee 10 10 11 11
Curriculum Committee 62 63 57 53
Moot Court Committee 20 19 20 20
Library Committee 17 19 22 24
LRW Committee 39 37 30 34
Technology Committee 19 14 15 14
Other 106 95 82 91
c. No 7 10 7 9
d. N/A or Don’t know 7 8 8 6
32
25 10
62
20 17
39
19
106
Committee Service by Directors Number of Schools Reporting Types of Service
Admissions Committee
Appointments Committee
Clerkship Committee
Curriculum Committee
Moot Court Committee
Library Committee
LRW Committee
Technology Committee
Other
Dire
ctors
59
60. If the director is not on tenure track, may the director attend
faculty meetings?
2011 2010 2009 2008
a. Yes, as a voting member on all matters 17 16 15 18
b. Yes, as a voting member on all matters except hiring, promotion or tenure 61 61 51 54
c. Yes, as a non-voting member 22 23 23 25
d. No 5 4 2 5
e. N/A or Don’t know 22 22 21 26
61. May a clinician who is not on tenure track attend faculty
meetings?
2011 2010 2009 2008
a. Yes, as a voting member on all matters 17 17 16 16
b. Yes, as a voting member on all matters except
hiring, promotion or tenure 78 79 68 72
c. Yes, as a non-voting member 30 34 30 33
d. No 5 6 3 5
e. N/A or Don’t know 25 21 21 26
0102030405060708090
Yes, voting on allmatters
Yes, voting excepthiring, promotion,
and tenure
Yes, non-voting No Don't know
Non Tenure-Track Legal Writing
Non Tenure-track Clinician
Comparison of Legal Writing and Clinical Faculty Meeting Attendance

Dire
ctors
60
62. Does the director have an obligation to produce written
scholarship?
a. Is
the
director
on
tenure
track?
b. Is the director . . . c. Is the
scholarship of
the same quality
and quantity as
tenure-track
faculty?
Yes No
required to
produce
scholarship?
expected to
produce
scholarship?
encouraged
to produce
scholarship?
Yes No Not
specified
2011 61 102 58 60 88 63 20 28
2010 62 102 56 60 87 62 20 27
2009 57 88 49 50 75 50 14 27
2008 64 96 42 47 72 48 13 23
Question reworded for 2008 and following years
63. Is the hiring process for the director the same as the process for
tenure-track faculty?
2011 2010 2009 2008
a. Yes, because the director is tenure track 54 57 53 60
b. No, although the director is tenure track 6 4 2 2
c. Yes, although the director is not tenure track 30 29 25 29
d. No, there is a different process 61 60 52 56
e. Other 12 13 13 13
64. Is the director eligible for leave? Please mark all that apply.
2011 2010 2009 2008
a. Paid sabbaticals 69 66 62 63
b. Unpaid sabbaticals 24 30 34 29
c. Leave 60 60 60 56
d. Reduced load 59 59 52 49
e. Other 23 19 13 16

Fu
ll-time L
ega
l Writin
g F
acu
lty M
em
bers
61
Full-time Legal Writing Faculty Members This section describes those full-time legal writing faculty who are not also directors.
65. What is the employment status of the full-time faculty members in
your program? Please mark all that apply.
2011 2010 2009 2008
a. Tenured or tenure-track 44 38 33 35
b. ABA Standard 405(c) 54 51 43 40
c. Contracts of 3 years in length or more 60 58 52 56
d. Contracts of 2 years in length 17 21 21 19
e. Contracts of 1 year in length 61 64 55 59
f. ABA Standard 405(c) track 19 18 15 13
66. If the LRW faculty members are on contracts, is there a limit to
the total number of years they may teach at the law school? (Is the
position ―capped‖?)
2011 2010 2009 2008
a. No, there is no limit 144 139 127 130
b. Yes, there is a limit 9 10 7 13
Average (years) 3.38 3.25 2.50 3.23
Minimum (years) 2 2 2 1
Maximum (years) 10 10 3 7
0
10
20
30
40
50
60
70
a. Tenured ortenure-track
b. ABA Standard405(c)
c. Contracts of 3years in length or
more
d. Contracts of 2years in length
e. Contracts of 1year in length
f. ABA Standard405(c) track
No. of Schools Reporting Job Status of Full-time LRW Faculty

Fu
ll-time L
ega
l Writin
g F
acu
lty M
em
bers
62
67. If your program is ―uncapped,‖ what are the lengths of typical
contract terms?
First
term
Second
term
Third
term
Fourth
term
2011 Total Responses 122 117 110 106
Average 1.57 2.15 3.00 3.56
Minimum 1 1 1 1
Maximum 5 7 7 7
2010 Total Responses 117 112 106 97
Average 1.51 2.08 2.88 3.46
Minimum 1 1 1 1
Maximum 5 7 7 7
2009 Total Responses 107 104 98 92
Average 1.39 1.98 2.80 3.37
Minimum 1 1 1 1
Maximum 3 7 7 7
2008 Total Responses 112 109 104 94
Average 1.43 1.88 2.63 3.33
Minimum 1 1 1 1
Maximum 5 7 7 7
68. What faculty title do the LRW faculty members have in official
materials (publications, catalogues, signs, etc.) at your law school?
Please mark all that apply.
2011 2010 2009 2008
a. Professor, associate professor, or assistant professor 45 45 39 40
b. Professor, associate professor, or assistant professor of
legal writing 56 54 47 47
c. Visiting professor or visiting professor of legal writing 13 14 9 7
d. Clinical professor, clinical associate professor, or
clinical assistant professor 17 18 16 17
e. Lecturer or senior lecturer 22 19 17 18
f. Instructor 23 25 21 25
g. Assistant or associate dean 4 2 2 1
h. Other 32 29 26 24

Fu
ll-time L
ega
l Writin
g F
acu
lty M
em
bers
63
69. What is the size and location of LRW offices? Please mark all that
apply.
2011 2010 2009 2008
a. Comparable to most non-writing faculty offices 124 120 109 104
b. Smaller than most non-writing faculty offices 39 40 39 44
c. More desirable location than most non-writing faculty
offices 8 6 2 3
d. Less desirable location than most non-writing faculty
offices 36 37 34 40
e. Offices are integrated among most non-writing faculty
offices 75 72 70 65
f. Offices are segregated from most non-writing faculty
offices 45 45 37 42
70. Are there written standards or criteria for evaluating LRW faculty
for retention and promotion and, if so, who does the evaluation?
2011 2010 2009 2008
a. Yes, the same standards as for all faculty 26 28 24 24
b. Yes, specific standards for LRW faculty, but they are
very similar to those for tenure-track faculty. 41 38 31 29
c. Yes, specific standards for LRW faculty only,
substantially different from those for tenure-track
faculty 59 55 52 56
d. Standards are in development 14 17 19 20
e. No 30 30 25 30
f. Evaluation is done by the director alone 9 9 11 10
g. Evaluation is done by the director and a committee 55 54 47 47
h. Evaluation is done by the director and a dean 37 40 36 41
i. Evaluation is done by a committee or dean, excluding
the director 34 31 28 31
j. Another method is used 26 24 27 24

Fu
ll-time L
ega
l Writin
g F
acu
lty M
em
bers
64
71. a) Please indicate the number, gender, and race of new full-time
LRW faculty teaching for the first time at your law school during
the current academic year (2010-2011).
Note: This question was re-worded in 2007 and again in 2008.
This table reports data collected, but inadvertently not reported,
in 2008 and 2009.
2010-2011 2009-2010 2008-2009 2007-2008
Female 93 95 105 100
Male 54 54 48 67
Caucasian 122 116 119 129
African-American 4 8 14 14
Hispanic 1 3 5 3
Asian-American 4 5 2 3
Native American 1 0 0 0
Multi-racial 3 0 0 2
Other 3 1 1 1
71. b) Please indicate the number, gender, and race of all full-time
LRW faculty teaching at your law school during the current
academic year (2010-2011)
Note: This question was new in 2008. This table reports data
collected, but inadvertently not reported, in 2008 and 2009.
2010-2011 2009-2010 2008-2009 2007-2008
Female 739 697 621 539
Male 302 281 224 229
Caucasian 830 763 660 587
African-American 56 55 39 43
Hispanic 14 18 13 7
Asian-American 20 21 16 11
Native American 5 3 3 0
Multi-racial 6 4 2 5
Other 6 5 6 4

Fu
ll-time L
ega
l Writin
g F
acu
lty M
em
bers
65
72. If you hired new full-time LRW faculty in the current academic
year, what forms of advertising did you use? Please mark all forms
that apply.
2011 2010 2009 2008
a. Legal Writing or Dircon listservs 57 56 54 58
b. AALS registry 35 33 38 38
c. Chronicle of Higher Education 19 19 18 12
d. Periodicals with national circulation 17 17 16 16
e. Periodicals with local circulation 34 34 41 44
f. Law school placement office 25 23 21 23
g. Other 30 33 26 30
0
10
20
30
40
50
60
a. LWI orDircon listervs
b. AALSregistry
c. Chronicleof Higher Ed.
d. NationalPeriodicals
e. LocalPeriodicals
f. Placementoffice
g. Other
Form of Advertising for Full-Time LRW Faculty
Nu
mb
er o
f Sc
ho
ols

Fu
ll-time L
ega
l Writin
g F
acu
lty M
em
bers
66
73. Who has formal, primary responsibility for hiring members of the
legal writing faculty?
2011 2010 2009 2008
a. A dean 8 10 9 8
b. A dean upon the recommendation of the legal
writing director 21 20 22 23
c. A dean upon the recommendation of a faculty
committee composed entirely or almost entirely of
members of the non-writing faculty 23 24 20 22
d. A dean upon the recommendation of a faculty
committee composed entirely or almost entirely of
members of the legal writing faculty 10 12 13 14
e. A faculty committee composed entirely or almost
entirely of members of the non-writing faculty 5 3 2 3
f. The faculty as a whole 27 25 23 24
g. The legal writing director 10 9 6 9
h. A committee composed entirely or almost entirely
of members of the legal writing faculty 2 1 2 1
i. The faculty as a whole upon the recommendation of
the dean 2 2 1 1
j. The faculty as a whole upon the recommendation of
a faculty committee composed entirely or almost
entirely of members of the non-writing faculty 30 34 32 26
k. The faculty as a whole upon the recommendation of
the legal writing director 2 2 1 1
l. The faculty as a whole upon the recommendation of
a committee composed entirely or almost entirely of
members of the writing faculty 4 3 2 1
m. Other 25 20 18 25
Fu
ll-time L
ega
l Writin
g F
acu
lty M
em
bers
67
74. For the current academic year, what would your entry-level
annual salary be for a newly hired LRW faculty member?3
2011 2010 2009 2008
a. We would not hire a person
without teaching experience. 34 35 27 22
b. For a person without prior
teaching experience (number of
responses) 94 92 90 98
Average salary $64,186 $60,145 $59,653 $56,380
Median salary $60,000 $58,000 $57,750 $55,000
Minimum salary $40,000 $20,000 $40,000 $30,000
Maximum salary $140,000 $97,000 $95,000 $90,000
c. For a person with 1-3 years prior
teaching experience (number of
responses) 90 92 87 94
Average salary $67,772 $64,378 $63,371 $60,712
Median salary $65,750 $61,000 $60,000 $60,000
Minimum salary $40,000 $20,000 $26,000 $30,000
Maximum salary $150,000 $110,000 $110,000 $90,000
d. For a person with > 3 years prior
teaching experience (number of
responses) 76 80 74 81
Average salary $70,928 $67,256 $67,919 $64,085
Median salary $70,000 $65,000 $68,500 $65,000
Minimum salary $43,500 $20,000 $28,000 $30,000
Maximum salary $110,000 $110,000 $110,000 $100,000
3 A Note about the Data: Non-numeric responses to questions like this are ignored in
generating the averages. Thus, responses of ―negotiable,‖ ―sensitive information,‖ or
―depends on experience‖ cannot factor into the calculations. For numeric responses that
give a range, the mid-point of the range is used for generating this table. Thus, a response
of $60,000-$70,000 is averaged as if the person entered $65,000. Numeric responses with
approximations or qualifiers are entered without the qualifier. Thus, ―approximately
$60,000,‖ ―low $60,000s,‖ ―at least $60,000,‖ and ―$60,000+‖ are all treated as $60,000.
Further, salaries of adjuncts and part-time professors were excluded from this chart for
2011.

Fu
ll-time L
ega
l Writin
g F
acu
lty M
em
bers
68
75. What is the base salary range (excluding summer support,
overload teaching, etc.) for current full-time LRW faculty members
(excluding the director) in your program and how are salary
increases determined?
2011 2010 2009 2008
a. Number of responses for base salary
range 113 114 100 114
Lowest salary
Average lowest salary $64,301 $64,642 $63,275 $60,140
Median lowest salary $65,000 $60,000 $60,000 $59,500
Minimum lowest salary $40,000 $42,000 $40,000 $30,000
Maximum lowest salary $122,000 $120,000 $105,000 $105,000
Highest salary
Average highest salary $81,245 $77,945 $78,040 $72,465
Median highest salary $75,000 $70,000 $73,000 $68,450
Minimum highest salary $45,000 $45,000 $45,000 $40,000
Maximum highest salary $175,000 $157,000 $157,000 $157,000
Average salary
Average salary $73,773 $71,294 $70,657 $66,302
Median salary $70,500 $68,000 $66,750 $63,000
b. Don’t know how salary increases are
determined (or no answer) 49 37 36 50
c. Salary increases are based on a
uniform annual amount or percentage
of salary 87 86 82 81
d. Salary increases are based on teaching
performance 30 31 28 29
e. Salary increases are based on merit,
including factors other than teaching 88 90 82 82

Fu
ll-time L
ega
l Writin
g F
acu
lty M
em
bers
69
0
5
10
15
20
25
30
35LRW Faculty Salaries
Nu
mb
er o
f Sc
ho
ols

Fu
ll-time L
ega
l Writin
g F
acu
lty M
em
bers
70
LRW Faculty Average Salary by Region
2011 2010 2009 2008
N
Average/
Median Min. Max.
Average/
Median
Average/
Median
Average/
Median
New York City & Long Island
Average 2
$57,500 $55,000 $60,000
$55,000 $55,000 $57,500
Median $57,500 $55,000 $55,000 $57,500
Northeastern (excluding New York City and Long Island)
Average 8
$72,563 $56,500 $126,000
$67,732 $64,175 $61,650
Median $63,250 $60,000 $62,750 $61,000
Mid Atlantic
Average 19
$74,455 $47,500 $120,000
$74,062 $72,803 $67,833
Median $70,000 $68,500 $69,000 $68,450
Great Lakes/Upper Midwest
Average 27
$74,244 $48,750 $130,500
$68,756 $69,310 $63,674
Median $70,000 $67,000 $67,500 $59,500
Southwest & South Central
Average 18
$71,201 $43,750 $103,550
$69,545 $64,448 $63,614
Median $67,500 $65,000 $58,500 $58,500
Southeast
Average 16
$74,828 $47,500 $110,000
$75,092 $80,400 $72,696
Median $72,500 $70,000 $76,250 $65,500
Northwest & Great Plains
Average 2
$75,500 $56,000 $95,000
$73,167 $64,375 $63,750
Median $75,500 $72,000 $58,750 $57,500
Far West
Average 23
$75,772 $46,000 $97,500
$77,290 $74,310 $66,668
Median $80,000 $78,750 $75,000 $65,500
Question 6 by Question 75
N=number of salary responses for 2011 in each category

Fu
ll-time L
ega
l Writin
g F
acu
lty M
em
bers
71
Average LRW Faculty Salary by Region:
2011
Region III: $71,201 Region V: $74,828
Region VI: $74,455
Region VII: $72,563
Region VIII: $57,500
Region II: $75,500 Region IV: $74,244
Region I: $75,772

Fu
ll-time L
ega
l Writin
g F
acu
lty M
em
bers
72
LRW Faculty Average Salary by Geographical Setting
2011 2010 2009 2008
N
Average/
Median Min. Max.
Average/
Median
Average/
Median
Average/
Median
Urban
Average 75
$73,295 $43,750 $130,500
$71,091 $70,113 $65,028
Median $70,000 $68,550 $67,500 $65,000
Suburban
Average 30
$74,713 $46,000 $126,000
$71,454 $72,363 $70,196
Median $72,500 $67,000 $68,575 $68,500
Rural
Average 8
$74,726 $49,000 $99,500
$72,368 $69,931 $65,035
Median $74,155 $70,500 $69,750 $63,500
Question 7 by Question 75
N=number of salary responses for 2011 in each category
LRW Faculty Average Salary by Institution Type
2011 2010 2009 2008
N
Average/
Median Min. Max.
Average/
Median
Average/
Median
Average/
Median
Public
Average 52
$72,691 $46,000 $121,000
$70,040 $69,362 $61,028
Median $68,750 $67,538 $67,500 $57,500
Private
Average 61
$74,695 $43,750 $130,500
$72,422 $72,118 $64,000
Median $73,000 $68,000 $68,000 $60,000
Question 8 by Question 75
N=number of salary responses for 2011 in each category

Fu
ll-time L
ega
l Writin
g F
acu
lty M
em
bers
73
LRW Faculty Average Salary by Staffing Model
2011 2010 2009 2008
N
Average/
Median Min. Max.
Average/
Median
Average/
Median
Average/
Median
Tenured or tenure-track for LRW faculty (answers a and b)
Average 12
$90,488 $71,500 $110,000
$88,596 $84,836 $81,034
Median $92,500 $91,700 $81,405 $75,310
Full-time nontenure track (answer e)
Average 53
$66,082 $43,750 $105,000
$64,253 $65,469 $61,649
Median $62,500 $60,000 $60,375 $59,500
Complex Hybrid (answer j)
Average 40
$77,591 $47,500 $130,500
$76,051 $74,014 $71,047
Median $75,500 $71,250 $71,250 $67,750
Question 10 by Question 75
N=number of salary responses for 2011 in each category

Fu
ll-time L
ega
l Writin
g F
acu
lty M
em
bers
74
LRW Faculty Average Salary by Faculty Status
2011 2010 2009 2008
N
Average/
Median Min. Max.
Average/
Median
Average/
Median
Average/
Median
Tenured or tenure-track
Average 30
$92,020 $60,000 $130,500
$92,850 $90,143 $82,373
Median $89,000 $94,500 $92,500 $81,250
ABA Standard 405(c)
Average 30
$73,411 $52,500 $103,000
$71,135 $70,310 $66,837
Median $70,579 $68,550 $68,550 $65,750
ABA Standard 405(c) track
Average 2
$68,500 $67,000 $70,000
$61,000 $59,000 $59,300
Median $68,500 $60,000 $59,000 $60,000
Contracts of 3 years or more
Average 28
$67,616 $47,500 $105,000
$65,958 $68,854 $61,680
Median $68,250 $65,750 $67,500 $58,605
Contracts of 2 years
Average 4
$71,438 $60,000 $75,750
$72,250 $66,250 $62,600
Median $75,000 $68,000 $66,500 $60,000
Contracts of 1 year
Average 19
$55,653 $43,750 $67,500
$55,194 $57,263 $57,563
Median $57,500 $56,000 $53,250 $54,750
Question 65 by Question 75
N=number of salary responses for 2011 in each category
$0$10,000$20,000$30,000$40,000$50,000$60,000$70,000$80,000$90,000
$100,000
Tenured ABA Standard405(c)
ABA Standard405(c) track
3-yearContract
2-yearContract
1-yearContract
LRW Faculty Salary By LRW Faculty Status

Fu
ll-time L
ega
l Writin
g F
acu
lty M
em
bers
75
LRW Faculty Average Salary by Director Type
2011 2010 2009 2008
N
Average/
Median Min. Max.
Average/
Median
Average/
Median
Average/
Median
Tenured, primary responsibility is LRW
Average 21
$79,679 $47,500 $126,000
$76,958 $77,234 $73,500
Median $75,750 $73,625 $73,125 $69,500
Untenured tenure track, primary responsibility is LRW
Average 9
$80,889 $54,500 $98,500
$77,770 $68,950 $65,768
Median $83,500 $75,750 $67,500 $65,000
Nontenure-track, primary responsibility is LRW
Average 36
$65,866 $43,750 $103,000
$63,785 $65,245 $61,802
Median $64,500 $60,375 $43,500 $57,605
Administrator or faculty, primary responsibility not LRW
Average 1
$97,500 $97,500 $97,500
$66,875 $54,500 $53,250
Median $97,500 $65,000 $54,500 $53,250
Administrator, primary responsibility is LRW
Average 2
$59,450 $58,900 $60,000
$56,997 $51,000 $62,980
Median $59,450 $58,490 $51,000 $60,000
Clinical tenure or clinical tenure track
Average 13
$70,762 $60,000 $87,250
$67,635 $65,330 $65,365
Median $66,500 $66,025 $66,500 $64,500
Other
Average 17
$78,815 $50,000 $130,500
$81,491 $81,508 $66,628
Median $70,000 $75,155 $78,905 $63,250
Question 45 by Question 75
N=number of salary responses for 2011 in each category
$0$20,000$40,000$60,000$80,000
$100,000$120,000
LRW Faculty Salary by Director Status

Fu
ll-time L
ega
l Writin
g F
acu
lty M
em
bers
76
76. Is the LRW faculty member eligible for summer research grants?
2011 2010 2009 2008
a. Yes, if so, how much is the typical grant? 102 103 94 100
Average amount $8,968 $8,586 $8,492 $8,084
Median amount $9000 $8,500 $9,000 $8,000
Minimum amount $1,000 $1,000 $2,000 $1,000
Maximum amount $17,000 $16,000 $16,000 $16,000
b. No 43 41 38 39
c. Our school does not generally provide
summer research grants to faculty 8 7 6 9
d. Do not know 14 12 12 9
77. If you answered ―Yes‖ to the prior question, what method does
your school use to determine amounts of summer research grants.
2011 2010 2009 2008
a. Flat amount 84 82 75 74
b. Percentage of school-year salary 5 4 4 3
c. Other 16 18 17 19
78. If you answered ―Yes‖ to Question 76, how do the summer
research grants to LRW faculty compare in dollars to summer
grants awarded to doctrinal faculty?
2011 2010 2009 2008
a. Research grants are equal 68 71 67 66
b. Research grants are greater 0 0 1 2
c. Research grants are less 22 17 15 18
d. Don’t know 34 28 24 22

Fu
ll-time L
ega
l Writin
g F
acu
lty M
em
bers
77
78b. If you answered ―Yes‖ to Question 76, how often are summer
research grants awarded to LRW faculty who apply for such
grants, as compared to doctrinal faculty? (New question for 2008)
2011 2010 2009 2008
a. Research grants are awarded as often to LRW
faculty as to doctrinal faculty. 60 58 57 50
b. Research grants are awarded somewhat less often
to LRW faculty as compared to doctrinal faculty. 7 5 4 5
c. Research grants are awarded much less often to
LRW faculty as compared to doctrinal faculty. 10 13 9 11
d. Research grants have never been awarded to LRW
faculty. 3 5 8 5
e. Don’t know 38 29 19 15
79. Is the LRW faculty member eligible to receive developmental
funding in the current academic year (to attend conferences, buy
books, etc.)
2011 2010 2009 2008
a. Yes 150 142 118 103
Average amount $2,478 $2,418 $2,393 $2,405
Minimum amount $500 $500 $1,000 $500
Maximum amount $7,500 $7,500 $7,500 $7,500
b. No 7 6 7 5
c. N/A 4 3 2 3
Fu
ll-time L
ega
l Writin
g F
acu
lty M
em
bers
78
80. Does the LRW faculty member receive funding to hire student
research assistants (exclusive of student teaching assistants)?
2011 2010 2009 2008
a. Yes, sufficient funding for all reasonable
requests 116 116 107 109
b. Yes, annually about _________ 28 24 21 21
Average amount $2,007 $2,048 $2,138 $3,255
Median amount $1,000 $1,500 $2,000 $2,000
Minimum amount $500 $500 $500 $500
Maximum amount $5,000 $5,000 $6,000 $11,111
c. No 22 21 20 25
81. Do the LRW faculty have the obligation to produce written
scholarship?
a. Is the
LRW
faculty
on tenure
track?
b. Is the LRW faculty . . . c. Is the
scholarship of the
same quality and
quantity as
tenure-track
faculty?
Yes No
required to
produce
scholarship
expected to
produce
scholarship
encouraged
to produce
scholarship
Yes No Not
Specified
2011 36 132 41 52 111 37 31 52
2010 35 130 39 51 103 41 27 49
2009 31 117 34 39 91 36 19 49
2008 28 127 26 34 86 32 18 43
Question reworded for 2008 and following years
Fu
ll-time L
ega
l Writin
g F
acu
lty M
em
bers
79
82. During the current academic year, what was the LRW faculty
member’s workload in the required program?
Fall Semester Spring Semester
2011 2010 2009 2008 2011 2010 2009 2008
a. # of students
taught at least
weekly in the
required
program.
Avg. 41.33 40.83 42.09 41.65 40.17 39.70 41.40 41.09
Min. 12 12 12 13 12 12 12 13
Max. 150 120 195 120* 150 120 190 120*
b. In-class
hours of
teaching each
week
Avg. 3.83*** 3.80*** 3.70 3.75 3.54 3.52 3.47 3.49
Min. 1 1 1 1 1 1 1 1
Max. 12 12 7 9 8 8 7 9
c. No. of major
assignments (> 5
pages)
Avg. 3.29 3.23 3.26 3.14 2.66 2.60 2.60 2.59
Min. 1 1 1 1 1 1 1 1
Max. 11 11 11 8 12 8 8 9
d. No. of minor
assignments ( <
5 pages)
Avg. 3.50 3.49 3.66 3.72 2.70 2.90 2.87 2.83
Min. 0 1 1 0 0 1 1 0
Max. 12 12 12 20 10 10 10 15
e. Total No. of
pages of student
work read per
term
Avg. 1,556 1,489 1,528 1,483 1,565 1,520 1,497 1,524
Min. 175 175 175 160 60 280 325 325
Max. 5500 7320 7,500 4,380 5,000 6,720 6,720 5,000
f. Total hours
in conference
required or
strongly
recommended
Avg. 50.35 49.13 48.44** 49.00 46.40 45.05 42.88 45.31
Min. 8 7 8 4 0 8 5 4
Max. 200 200 200 300 360 168 180 300
g. Total hours
preparing major
research and
writing
assignments
Avg. 35.33 34.98 35.92 35.16 33.87 34.38 36.62 35.00
Min. 0 5 5 0 0 2 2 0
Max. 160 125 150 150 160 200 200 250
h. Total hours
preparing for
class (excluding
hours reported
above in g)
Avg. 71.44 72.84**** 71.22 69.17 67.67 67.28**** 66.30 65.39
Min. 2 6 2.50 2.50 2.5 6 4 2.50
Max. 500 500 500 500 500 500 500 500
*Answer of 180 excluded; **Answer of 1000 excluded; ***Answer of 42 excluded; ****Answers of 5 hours
excluded as likely being per week, rather than total.

Fu
ll-time L
ega
l Writin
g F
acu
lty M
em
bers
80
83. Does the LRW faculty member serve on faculty committees?
2011 2010 2009 2008
a. Yes, as a voting member 130 123 111 121
b. Yes, as a non-voting member 11 7 7 5
Which Committees? (Please mark all that apply.)
Admissions Committee 91 81 71 73
Appointments Committee 45 37 36 34
Clerkship Committee 48 44 39 40
Curriculum Committee 96 93 81 83
Moot Court Committee 52 43 39 39
Library Committee 65 57 55 53
LRW Committee 40 38 35 35
Technology Committee 66 56 48 53
Other 95 92 77 79
c. No 24 31 28 30
d. Don’t know 3 3 3 1
84. May the LRW faculty member attend faculty meetings?
2011 2010 2009 2008
a. Yes, as a voting member on all matters 43 41 36 34
b. Yes, as a voting member on all matters except
hiring, promotions, or tenure 72 71 59 61
c. Yes, as a non-voting member 35 34 42 48
d. No 13 14 9 12
e. Don’t know 5 4 3 1

Fu
ll-time L
ega
l Writin
g F
acu
lty M
em
bers
81
85. Do the LRW faculty teach other courses?
2011 2010 2009 2008
a. No 25 30 29 34
b. Yes 143 134 120 124
When Type of Course Compensation
During
regular
academic
year
During
separate
summer
session
only
Upper-
level
LRW
courses
Non-
LRW
courses
Same
rate as
faculty
overload
Same
rate as
adjuncts
Other
No
add’l
comp.
2011 125 99 93 121 53 20 49 36
2010 118 92 85 116 47 24 32 47
2009 108 81 79 101 39 24 31 41
2008 103 88 79 108 51 26 39 25
143
25
Teach Other Courses?
Yes
No

Ad
jun
ct Lega
l Writin
g F
acu
lty
82
Adjunct Legal Writing Faculty
86. Do you use adjunct faculty in your required program? (The %
below is based on % of students taught.)
2011 2010 2009 2008
a. Exclusively 14 15 13 14
b. Substantially (75%) 20 22 15 17
c. Significantly (50%) 18 16 18 20
d. Somewhat (25%) 28 32 24 21
e. Rarely (<25%) 29 23 23 27
f. No 78 78 73 81
7% 11%
10%
15%
15%
42%
Adjunct Use
a. Exclusively
b. Substantially (75%)
c. Significantly (50%)
d. Somewhat (25%)
e. Rarely (<25%)
f. No

Ad
jun
ct Lega
l Writin
g F
acu
lty
83
87. How many adjunct faculty did you use in the required program
during the current academic year for teaching, and what are their
genders? (*Answers in excess of 75 excluded.)
Objective
legal
writing
Advocacy
or moot
court
Both objective
writing &
advocacy
Research
only Other Totals
Fem
ale
Ad
jun
cts
Schools
Responding
2011 17 37 57 5 15 94
2010 21 30 57 4 11 91
2009 21 26 47 1 8 76
2008 19 32 52 2 8 87
No. of
Females:
2011 107 163 301 24 104 699
2010 87 142 306 23 79 613
2009 98 166 269 2 52 587
2008 107 156* 318 3 55 639
Average: 2011 6.29 4.40 5.28 4.80 6.93 5.54
2010 4.14 5.13 5.37 5.75 7.18 5.52
2009 4.67 6.38 5.72 2 6.5 5.70
2008 5.63 4.88 6.12 1.5 6.88 3.55
Minimum 2011 1 1 1 1 2 1
2010 1 1 1 2 2 1
2009 1 1 1 2 2 1
2008 1 1 1 1 2 1
Maximum 2011 35 16 22 17 22 35
2010 15 16 22 17 22 22
2009 30 28 22 2 17 36
2008 30 28 22 2 14 36
Ma
le A
dju
nct
s
Schools
Responding
2011 16 34 32 3 15 77
2010 17 30 40 3 11 76
2009 15 26 36 2 8 64
2008 15 24 40 3 8 68
No. of
Males:
2011 77 171 226 18 95 587
2010 50 174 210 18 66 518
2009 65 162 188 2 50 467
2008 83 151 267 4 51 556
Average: 2011 4.81 5.03 5.38 6 6.33 5.51
2010 2.94 5.80 5.25 6.00 6.00 5.19
2009 4.33 6.23 5.22 1.00 6.25 5.37
2008 5.53 6.29 6.68 1.33 6.38 3.09
Minimum 2011 1 1 1 1 1 1
2010 1 1 1 1 1 1
2009 1 1 1 1 1 1
2008 1 1 1 1 1 1
Maximum 2011 29 25 23 16 20* 29
2010 10 25 21 16 20* 25
2009 30 32 21 1 19 34
2008 30 32* 35 2 20 36

Ad
jun
ct Lega
l Writin
g F
acu
lty
84
88. What is the salary for adjunct faculty in your required program?
2011 2010 2009 2008
a. Total Responses (per credit hour) 51 55 47 47
Average amount per credit hour $2,234 $2,159 $2,048 $2,049
Median amount per credit hour $1,875 $1,875 $1,875 $1,600
Minimum amount per credit hour $675 $675 $850 $500
Maximum amount per credit hour $10,000 $10,000 $10,000 $10,000
b. Total responses (per term) 56 61 50 57
Average amount per term $8,439 $7,245 $6,609 $6,695
Median amount per term $4,500 $4,500 $4,500 $4,500
Minimum amount per term $1,000 $1,000 $500 $500
Maximum amount per term $50,000 $30,000 $27,500 $27,500
89. How many students on average does each adjunct teach?
2011 2010 2009 2008
a. Total Responses (students per section) 103 103 90 92
Average students per section 18.09 17.00 17.33 17.42*
Median students per section 17.5 17.00 16.75 16
Minimum students per section 8 8 8 8
Maximum students per section 41 41 42.5 42.5
b. Total responses (total students) 84 89 77 74
Average total students 20.83 20.00 19.53 19.17
Minimum total students 10 8 8 8
Maximum total students 60** 48** 42.5** 42.5**
* Answers <5 excluded; **Answers >100 excluded
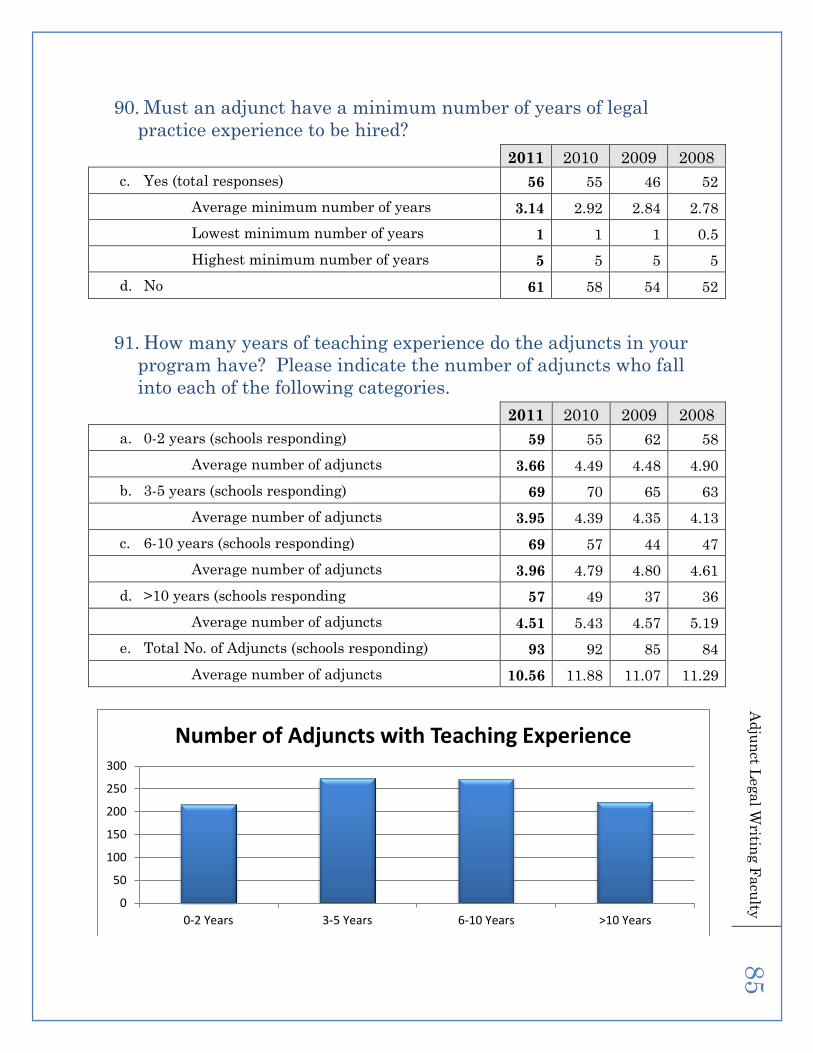
Ad
jun
ct Lega
l Writin
g F
acu
lty
85
90. Must an adjunct have a minimum number of years of legal
practice experience to be hired?
2011 2010 2009 2008
c. Yes (total responses) 56 55 46 52
Average minimum number of years 3.14 2.92 2.84 2.78
Lowest minimum number of years 1 1 1 0.5
Highest minimum number of years 5 5 5 5
d. No 61 58 54 52
91. How many years of teaching experience do the adjuncts in your
program have? Please indicate the number of adjuncts who fall
into each of the following categories.
2011 2010 2009 2008
a. 0-2 years (schools responding) 59 55 62 58
Average number of adjuncts 3.66 4.49 4.48 4.90
b. 3-5 years (schools responding) 69 70 65 63
Average number of adjuncts 3.95 4.39 4.35 4.13
c. 6-10 years (schools responding) 69 57 44 47
Average number of adjuncts 3.96 4.79 4.80 4.61
d. >10 years (schools responding 57 49 37 36
Average number of adjuncts 4.51 5.43 4.57 5.19
e. Total No. of Adjuncts (schools responding) 93 92 85 84
Average number of adjuncts 10.56 11.88 11.07 11.29
0
50
100
150
200
250
300
0-2 Years 3-5 Years 6-10 Years >10 Years
Number of Adjuncts with Teaching Experience

Ad
jun
ct Lega
l Writin
g F
acu
lty
86
92. Who creates the major writing assignments used by the adjuncts
in your program? (Do not indicate who determines how many
assignments or other curricular requirements.)
2011 2010 2009 2008
a. The director and full-time LRW faculty exclusively 51 49 42 47
b. The director and full-time LRW faculty primarily 30 33 32 30
c. The adjunct primarily 17 13 9 13
d. The adjunct exclusively 8 8 6 6
e. Other 22 21 21 20
40%
24%
13%
6%
17%
Who Creates Assignments for Adjuncts?
Exclusively Director/Full-Timefaculty
Primarily Director/Full-time Faculty
Primarily Adjuncts
Exclusively Adjuncts
Other

Tea
chin
g A
ssistan
ts 8
7
Teaching Assistants
93. Do you use teaching assistants in your required program? (The %
is based on the % of the classroom teaching hours.)
2011 2010 2009 2008
Total Schools Responding 186 186 165 168
a. Exclusively 0 0 0 1
b. Substantially (75%) 4 3 1 1
c. Significantly (50%) 10 11 9 1
d. Somewhat (25%) 66 61 55 60
e. Rarely (<25%) 40 42 39 38
f. No 66 69 61 68
94. How many teaching assistants participate in your program to
teach or to help teach and what do they teach? Please mark all
that apply.
2011 2010 2009 2008
Total number of schools responding 110 109 99 109
a. Total number of teaching assistants
Average number 18.31 17.95 17.07 17.50
Median number 13.5 13 12 12
Minimum 1 2 2 1
Maximum 85 85 100 100
b. Subjects taught
Objective legal writing 49 49 40 42
Advocacy or moot court 55 48 42 50
Research 67 66 56 62
Citation 90 87 74 83
Other 41 38 38 43
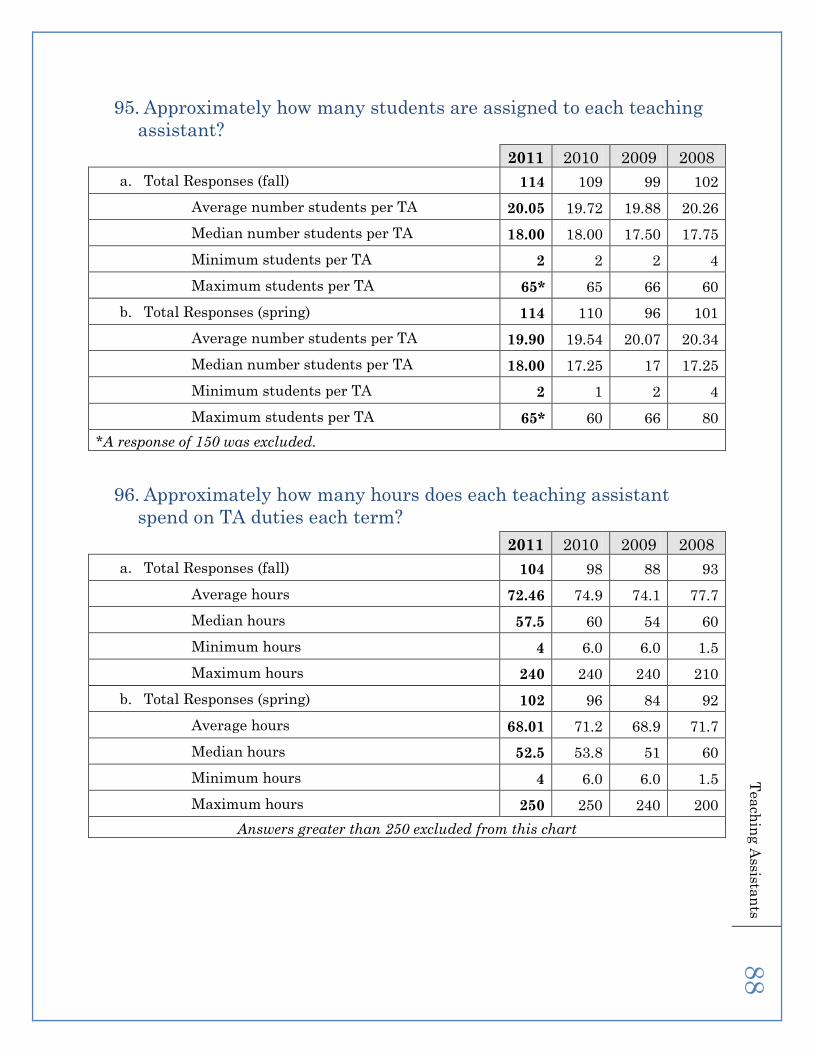
Tea
chin
g A
ssistan
ts 8
8
95. Approximately how many students are assigned to each teaching
assistant?
2011 2010 2009 2008
a. Total Responses (fall) 114 109 99 102
Average number students per TA 20.05 19.72 19.88 20.26
Median number students per TA 18.00 18.00 17.50 17.75
Minimum students per TA 2 2 2 4
Maximum students per TA 65* 65 66 60
b. Total Responses (spring) 114 110 96 101
Average number students per TA 19.90 19.54 20.07 20.34
Median number students per TA 18.00 17.25 17 17.25
Minimum students per TA 2 1 2 4
Maximum students per TA 65* 60 66 80
*A response of 150 was excluded.
96. Approximately how many hours does each teaching assistant
spend on TA duties each term?
2011 2010 2009 2008
a. Total Responses (fall) 104 98 88 93
Average hours 72.46 74.9 74.1 77.7
Median hours 57.5 60 54 60
Minimum hours 4 6.0 6.0 1.5
Maximum hours 240 240 240 210
b. Total Responses (spring) 102 96 84 92
Average hours 68.01 71.2 68.9 71.7
Median hours 52.5 53.8 51 60
Minimum hours 4 6.0 6.0 1.5
Maximum hours 250 250 240 200
Answers greater than 250 excluded from this chart

Tea
chin
g A
ssistan
ts 8
9
97. Do TAs hold office hours? If so, what do they answer questions
about? Please mark all that apply.
2011 2010 2009 2008
a. No 21 21 20 21
b. Yes 113 113 98 104
c. Subjects covered
Research 98 92 84 90
Writing, generally 92 89 81 86
Writing assignments before they are graded 90 89 79 83
Other law school questions (such as exams) 71 72 63 68
Citation 106 100 88 96
0
20
40
60
80
100
120
Research Writing, generally Writingassignments before
they are graded
Other law schoolquestions (such as
exams)
Citation
Subjects Covered in TA Office Hours
Nu
mb
er o
f Sc
ho
ols

Tea
chin
g A
ssistan
ts 9
0
98. How are the teaching assistants compensated? Please mark all
that apply
2011 2010 2009 2008
a. Course credit and grades (no. of schools) 18 18 17 17
b. Course credit (no. of schools) 34 32 30 32
Average credits (Fall) 1.82 1.88 1.87 2.01
Minimum credits (Fall) 1 1 1 1
Maximum credits (Fall) 4 4 4 4
Average credits (Spring) 1.71 1.81 1.77 1.92
Minimum credits (Spring) 1 1 1 1
Maximum credits (Spring) 3 3 3 3
c. Offset against tuition (no. of schools) 10 11 10 9
Average offset $2,014 $2,286 $2,383 $2,600
Minimum offset $900 $800 $600 $600
Maximum offset $4000 $4,000 $4,000 $4,000
d. Payment per term (no. of schools) 29 29 23 30
Average payment $1,310 $1,315 $1,205 $1,394
Minimum payment $100 $100 $100 $100
Maximum payment $4,000 $4,000 $4,000 $4,000*
e. Payment per hour worked (no. of schools) 44 41 39 39
Average payment $10.73 $10.86 $10.61 $10.11
Minimum payment $6.50 $6.50 $6.5 $5.50
Maximum payment $15.00 $15.00 $15 $15.00
f. Other (no. of schools) 12 13 10 9
* Answer of $52,788 excluded as apparently erroneous.

Su
rvey U
se
91
99. Approximately how many hours of training are provided for each
teaching assistant each term?
2011 2010 2009 2008
Schools responding 102 101 88 93
Average hours 10.85 11.44 10.8 10.6
Minimum hours 1 1 1 1
Maximum hours 60 60 60 50
Survey Use
100. Have you used ALWD/LWI survey data to . . . Please mark all
that apply.
2011 2010 2009 2008
a. Improve your program 126 125 113 114
b. Improve your status 78 78 78 75
c. Improve your salary 80 75 73 70
d. Other 31 31 30 29
e. No 33 32 25 33
Hot Topics
1. For which of the following faculty governance matters do your legal
writing faculty members have voting rights?
2011
a. Dean selection 114
b. Promotion/tenure/hiring (of tenure-track faculty) 38
c. Promotion/retention/hiring (of non-tenure-track faculty) 79
d. Curriculum development 109
e. Issues/topics in faculty committees 116
f. None of the above 0

Hot T
op
ics 9
2
2. Have you ever used information from LWI job postings to obtain
increased salaries for your legal writing faculty?
2011
a. Yes 73
b. No 87
3. For legal writing faculty members that you have hired in the past
five years, from how far away (geographical distance) have they
come?
2011
a. Local—i.e., already lived within commuting distance of the school 106
b. Not local, but moved to the area for a spouse’s or partner’s job 22
c. Not local, but moved to the area for the legal writing job 72
4. Other than traditional Westlaw and LEXIS, which electronic
research sources do you include in your curriculum?
2011
a. WestlawNext 96
b. Fastcase 11
c. Google Scholar 59
d. Other electronic resources (various responses) 33
e. No additional electronic research sources 22
5. Do you allow students to record your classes on a regular basis?
2011
f. Yes, audio recording only 16
g. Yes, audio or video recording 3
h. Yes, video recording only 2
i. No, I do not allow regular recording of my classes 83
j. No, but I may audio- or video-record a class through the law
school’s audio-visual department and provide the link to students. 52

Hot T
op
ics 9
3
6. If your LRW program utilizes learning outcomes and assessment
tools, what kinds of tools does it use?
2011
a. Pretests and posttests 14
b. Quizzes or tests 65
c. ―Test‖ issues on writing itself 22
d. Student self-assessment 63
e. Other 25
f. Our LRW program does not use formal outcomes and assessment
tools. 61
7. Have you modified your curriculum or any specific assignments
in response to administrative pressure?
2011
a. No, I have not made any curricular or assignment-specific
modifications in response to administrative pressure. 108
b. I have made changes to specific assignment or assignments, but
have not made broad curricular changes in response to
administrative pressure. 23
c. I have changed my curriculum in response to administrative
pressure. 14
d. Other 13

Ap
pen
dix
A
A-1
Appendix A
Comparisons of Responses from Female and Male Directors
Prepared by:
John Mollenkamp
Clinical Professor and Director of Academic Support
Cornell Law School
Responses to the survey: Female—148 (78.7%); Male—40 (21.3%)
Responses of Directors*: Female—116 (78.4%); Male—32 (21.6%)
*Note: For this statistic, ―Director‖ includes only directors and associate directors, not
faculty members teaching in directorless programs. As used in the remainder of this
Appendix, ―Director‖ means the person overseeing the Legal Writing program or who
responded to the ALWD/LWI survey.
Question 45 (with gender breakdown): If your program has a
director, which of these choices best describes the director?
2011 2010 2009 2008
Female Male Female Male Female Male Female Male
n % n % n % n % n % n % n % n %
Tenured 25 19% 9 26% 24 19% 7 18% 21 19% 8 24% 26 21% 7 18%
Tenure-
track 14 11% 5 15% 14 11% 4 10% 12 11% 4 12% 11 9% 7 18%
Contract 50 38% 8 24% 46 37% 13 33% 43 38% 12 36% 46 38% 14 36%
Admin.
Primary
Resp. LRW
2 2% 1 3% 2 2% 6 15% 1 1% 3 9% 4 3% 1 3%
Admin.
Primary
Resp. not
LRW
1 1% 3 9% 2 2% 2 5% 2 2% 2 6% 2 1% 3 8%
Clinical
Tenure or
Track
18 14% 3 9% 17 14% 2 5% 12 11% 2 6% 11 9% 2 5%
Other 20 15% 5 15% 19 15% 6 15% 21 19% 2 6% 21 17% 5 13%

Ap
pen
dix
A
A-2
Question 48 (with gender breakdown): What title does the director
have in official law school materials?
2010 2010 2009 2008
Female Male Female Male Female Male Female Male
n % n % n % n % n % n % n % n %
Professor 52 42% 18 53% 50 43% 22 56% 47 46% 19 58% 53 31% 19 37%
Professor of
Legal
Writing
24 20% 5 15% 20 17% 4 10% 17 17% 5 15% 13 8% 5 10%
Visiting
Professor 1 1% 0 0% 0 0% 0 0% 0 0% 0 0% 2 1% 0 0%
Clinical
Professor 18 15% 5 15% 17 15% 5 13% 14 14% 4 12% 17 10% 6 12%
Lecturer 5 4% 3 9% 7 6% 2 5% 4 4% 2 6% 6 4% 3 6%
Instructor 3 2% 0 0% 3 3% 2 5% 2 2% 0 0% 4 2% 0 0%
Asst./Assoc.
Dean 5 4% 1 3% 4 3% 1 3% 3 3% 1 3% 4 2% 0 0%
Director 64 52% 17 50% 65 57% 18 46% 56 54% 18 55% 58 34% 16 31%
Other 19 15% 3 9% 18 16% 4 10% 17 17% 1 3% 14 8% 3 6%
Respondents could select more than one title, so the totals are greater than the number of
respondents.
Question 49 (with gender breakdown): What is the annual base
salary of the director? Twelve-month salaries
Female Directors Male Directors
2011 Avg. 12-month salary $108,503 101% of male avg. $107,265
2010 Avg. 12-month salary $103,907 102% of male avg. $102,207
2009 Avg. 12-month salary $102,743 103% of male avg. $99,610
2008 Avg. 12-month salary $96,972 99% of male avg. $97,533
2007 Avg. 12-month salary $93,986 96% of male avg. $98,333
2006 Avg. 12-month salary $90,837 98% of male avg. $92,844
2005 Avg. 12-month salary $91,101 104% of male avg. $87,500
2004 Avg. 12-month salary $90,382 96% of male avg. $94,500
2011 Lowest $220,000 $206,000
2011 Highest $50,000 $60,000
2011 Total Responses 57 10
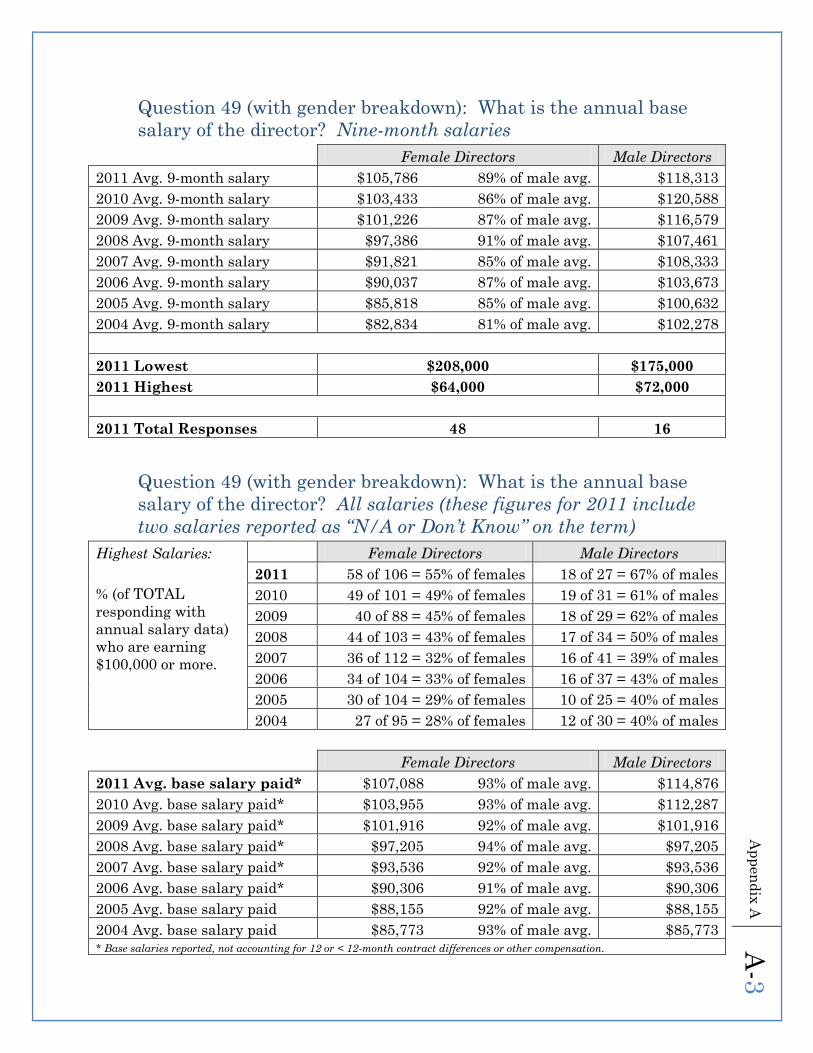
Ap
pen
dix
A
A-3
Question 49 (with gender breakdown): What is the annual base
salary of the director? Nine-month salaries
Female Directors Male Directors
2011 Avg. 9-month salary $105,786 89% of male avg. $118,313
2010 Avg. 9-month salary $103,433 86% of male avg. $120,588
2009 Avg. 9-month salary $101,226 87% of male avg. $116,579
2008 Avg. 9-month salary $97,386 91% of male avg. $107,461
2007 Avg. 9-month salary $91,821 85% of male avg. $108,333
2006 Avg. 9-month salary $90,037 87% of male avg. $103,673
2005 Avg. 9-month salary $85,818 85% of male avg. $100,632
2004 Avg. 9-month salary $82,834 81% of male avg. $102,278
2011 Lowest $208,000 $175,000
2011 Highest $64,000 $72,000
2011 Total Responses 48 16
Question 49 (with gender breakdown): What is the annual base
salary of the director? All salaries (these figures for 2011 include
two salaries reported as “N/A or Don’t Know” on the term)
Highest Salaries:
% (of TOTAL
responding with
annual salary data)
who are earning
$100,000 or more.
Female Directors Male Directors
2011 58 of 106 = 55% of females 18 of 27 = 67% of males
2010 49 of 101 = 49% of females 19 of 31 = 61% of males
2009 40 of 88 = 45% of females 18 of 29 = 62% of males
2008 44 of 103 = 43% of females 17 of 34 = 50% of males
2007 36 of 112 = 32% of females 16 of 41 = 39% of males
2006 34 of 104 = 33% of females 16 of 37 = 43% of males
2005 30 of 104 = 29% of females 10 of 25 = 40% of males
2004 27 of 95 = 28% of females 12 of 30 = 40% of males
Female Directors Male Directors
2011 Avg. base salary paid* $107,088 93% of male avg. $114,876
2010 Avg. base salary paid* $103,955 93% of male avg. $112,287
2009 Avg. base salary paid* $101,916 92% of male avg. $101,916
2008 Avg. base salary paid* $97,205 94% of male avg. $97,205
2007 Avg. base salary paid* $93,536 92% of male avg. $93,536
2006 Avg. base salary paid* $90,306 91% of male avg. $90,306
2005 Avg. base salary paid $88,155 92% of male avg. $88,155
2004 Avg. base salary paid $85,773 93% of male avg. $85,773 * Base salaries reported, not accounting for 12 or < 12-month contract differences or other compensation.

Ap
pen
dix
A
A-4
Question 55 (with gender breakdown): Does the director teach
courses beyond the required writing course?
2011 2010 2009 2008
Female Male Female Male Female Male Female Male
n % n % n % n % n % n % n % n %
Yes,
other
than
academic
support
66 51% 22 65% 60 48% 27 68% 53 47% 24 73% 66 55% 28 72%
Yes, only
academic
support
2 2% 0 0% 4 3% 0 0% 4 4% 0 0% 4 3% 0 0%
No 55 42% 12 35% 53 43% 12 30% 46 41% 9 27% 44 36% 10 26%
N/A 7 5% 0 0% 7 6% 1 3% 9 8% 0 0% 7 6% 1 3%
Total 130 34 124 40 112 33 121 39
Question 56(with gender breakdown): How much additional
compensation does the director receive for teaching other than
required LRW courses? (Only three male responses in 2011)
2011 2010 2009 2008
Female Male Female Male Female Male Female Male
Average $9,107
50% of
male $18,167 $9,331 $7,875 $12,333 $10,750 $10,245 $7,720
Lowest $2,000
40% of
male $5,000 $2,500 $4,000 $4,400 $9,000 $3,000 $3,000
Highest $18,000
56% of
male $32,000 $18,000 $17,500 $24,000 $12,500 $25,000 $10,000
$0
$2,000
$4,000
$6,000
$8,000
$10,000
$12,000
$14,000
$16,000
$18,000
$20,000
2008 2009 2010 2011
Average Extra CompensationFemale
Average Extra CompensationMale

Ap
pen
dix
A
A-5
Question 57(with gender breakdown): How many LRW professionals
does the director supervise?
Avg. No. Supervised by Female
Directors
Avg. No. Supervised by Male
Directors
2011 20010 2009 2008 2011 2010 2009 2008
Female
professional FT
staff
3.89 3.91 3.86 3.70 4.35 3.80 4.36 3.22
Male professional
FT staff 2.05 2.19 2.08 2.13 2.35 2.17 2.16 2.20
Female
professional PT
staff
1.75 1.82 2.33 2.26 1.67 2.75 2.00 2.43
Male professional
PT staff 1.10 1.13 1.00 1.33 1.50 1.25 1.00 1.33
Female adjuncts 8.26 7.40 7.83 9.10 8.80 9.65 7.92 7.71
Male adjuncts 7.90 7.16 7.84 9.11 9.85 10.63 8.40 8.23
Total Resp. 118 114 100 109 34 39 32 38
Question 64 (with gender breakdown): Is the director eligible for
leave?
2011 2010 2009 2008
Female Male Female Male Female Male Female Male
n % n % n % n % n % n % n % n %
Sabbaticals:
paid 48 49% 21 88% 45 49% 21 81% 45 54% 17 77% 42 50% 21 72%
Sabbaticals:
unpaid 20 20% 4 17% 25 27% 5 19% 27 32% 17 77% 20 24% 9 31%
Leave 51 52% 9 38% 46 51% 14 54% 45 54% 15 68% 40 48% 16 55%
Reduced
load 50 51% 9 38% 47 52% 12 46% 42 50% 10 45% 37 44% 12 41%
Other 19 19% 3 13% 14 15% 5 19% 9 11% 3 14% 9 11% 5 17%
* Note: Respondents could select more than one type of leave, making the totals greater than
the number of respondents.

Ap
pen
dix
A
A-6
Question 75 (with gender breakdown): What is the base salary range
for LRW faculty members (excluding the director’s salary) from lowest
salary to highest salary paid at your school (range from $(low range)
to $(high range) paid)?
Low Range
Female Directors Male Directors
2011 Avg. low range $65,674 96% of male $68,757
2010 Avg. low range $63,410 92% of male $69,028
2009 Avg. low range $63,259 100% of male $63,333
2008 Avg. low range $59,752 97% of male $61,389
2007 Avg. low range $54,455 83% of male $65,800
2006 Avg. low range* $51,408 89% of male $57,736
2005 Avg. low range $49,652 91% of male $54,319
2004 Avg. low range $48,478 92% of male $52,616
2011 Lowest in low range $42,500 106% of male $40,000
2010 Lowest in low range $42,000 93% of male $45,000
2009 Lowest in low range $42,000 105% of male $40,000
2008 Lowest in low range $38,500 128% of male $30,000
2007 Lowest in low range $37,000 123% of male $30,000
2006 Lowest in low range* $30,000 83% of male $36,000
2005 Lowest in low range $25,840 74% of male $35,000
2004 Lowest in low range $30,000 97% of male $31,000
2011 Highest in low range $122,000 135% of male $90,000
2010 Highest in low range $120,000 126% of male $95,000
2009 Highest in low range $105,000 124% of male $85,000
2008 Highest in low range $105,000 111% of male $95,000
2007 Highest in low range $99,500 66% of male $150,000
2006 Highest in low range* $120,000 125% of male $96,225
2005 Highest in low range $87,000 102% of male $85,000
2004 Highest in low range $87,000 99% of male $88,050
* The 2006 Annual Survey Report erroneously reported the values in these rows; these values
have been corrected

Ap
pen
dix
A
A-7
Question 75 (cont.): High Range
Female Directors Male Directors
2011 Avg. high range $80,298 95% of male $84,952
2010 Avg. high range $76,499 92% of male $83,095
2009 Avg. high range $78,405 102% of male $76,667
2008 Avg. high range $72,207 99% of male $73,296
2007 Avg. high range $65,599 89% of male $73,481
2006 Avg. high range $63,417 88% of male $71,905
2005 Avg. high range $58,704 85% of male $68,829
2004 Avg. high range $58,287 91% of male $63,775
2011 Lowest in high range $45,000 98% of male $46,000
2010 Lowest in high range $45,000 98% of male $46,000
2009 Lowest in high range $45,000 100% of male $45,000
2008 Lowest in high range $45,000 128% of male $40,000
2007 Lowest in high range $37,000 97% of male $38,000
2006 Lowest in high range $35,000 88% of male $40,000
2005 Lowest in high range $35,000 100% of male $35,000
2004 Lowest in high range $30,000 81% of male $37,000
2011 Highest in high range $157,000 90% of male $175,000
2010 Highest in high range $157,000 108% of male $145,000
2009 Highest in high range $157,000 120% of male $131,000
2008 Highest in high range $157,000 111% of male $126,000
2007 Highest in high range $136,000 91% of male $150,000
2006 Highest in high range $150,000 107% of male $140,000
2005 Highest in high range $100,000 79% of male $126,000
2004 Highest in high range $123,000 88% of male $140,000

Ap
pen
dix
A
A-8
Question 5 AND Question 49 (by gender): How many years has the
director directed the writing program at the present law school? How
does this relate to salary?
2011 2010 2009 2008
Female Male Female Male Female Male Female Male
0-5 $97,345 85%
of
male
$115,088 $90,888 $112,833 $91,721 $113,071 $90,896 $97,396
6-
10
$107,809 109%
of
male
$99,250* $109,294 $88,000 $103,220 $103,500* $98,018 $94,844
11-
15
$112,291 83%
of
male
$135,333** $100,230 $122,000 $105,412 $116,400 $100,660 $137,500*
>15 $126,477 110%
of
male
$114,643 $127,756 $119,656 $125,830 $110,300 $109,148 $109,629
* Based on only four responses with values; ** Based on only three responses with values

Ap
pen
dix
B
B-1
Appendix B Additional Analysis of 2011 Survey Data prepared by John Mollenkamp
Analysis of the effect of first-year class size (Q. 9)
First-year Class Size by Services Provided
# of
1Ls Year
Total
No.
Schools
Writing
Specialist,
Full-time
Writing
Specialist,
Part-time
Tutorials
Student
TAs helping
students
Academic
Support
Program
Other
<1
00
2011 4 0 (0%) 0 (0%) 1 (25%) 4 (100%) 3 (75%) 0 (0%)
2010 6 0 (0%) 3 (50%) 2 (33%) 5 (83%) 5 (83%) 1 (17%)
2009 7 0 (0%) 0 (0%) 2 (29%) 7 (100%) 6 (86%) 0 (0%)
2008 7 0 (0%) 0 (0%) 2 (29%) 6 (86%) 6 (86%) 2 (29%)
101-1
50 2011 23 1 (4%) 4 (17%) 4 (17%) 14 (61%) 21 (91%) 4 (17%)
2010 27 1 (4%) 4 (15%) 5 (19%) 15 (56%) 26 (96%) 5 (19%)
2009 25 1 (4%) 4 (16%) 4 (16%) 12 (48%) 25 (100%) 6 (24%)
2008 20 1(5%) 3(15%) 3(15%) 12(60%) 20(100%) 3(15%)
151-2
00 2011 44 1 (2%) 9 (20%) 10 (23%) 32 (73%) 37 (84%) 6 (14%)
2010 42 2 (5%) 10 (24%) 10 (24%) 31 (74%) 31 (74%) 5 (12%)
2009 37 1 (3%) 9 (24%) 7 (19%) 28 (76%) 31 (84%) 6 (16%)
2008 50 1(2%) 6(12%) 8(16%) 33(66%) 42(84%) 7(14%)
201-2
50 2011 47 6 (13%) 14 (30%) 11 (23%) 37 (79%) 41 (87%) 6 (13%)
2010 46 2 (4%) 11 (24%) 9 (20%) 35 (76%) 40 (87%) 9 (20%)
2009 38 2 (5%) 11 (29%) 8 (21%) 28 (74%) 33 (87%) 6 (16%)
2008 37 2(5%) 9(24%) 8(22%) 24(65%) 30(81%) 4(11%)
251-3
00 2011 21 2 (10%) 2 (10%) 1 (5%) 16 (76%) 20 (95%) 3 (14%)
2010 21 3 (14%) 4 (19%) 2 (10%) 16 (76%) 19 (90%) 2 (10%)
2009 19 2 (11%) 4 (21%) 2 (11%) 15 (79%) 17 (89%) 2 (11%)
2008 19 0(0%) 5(26%) 4(21%) 17(89%) 17(89%) 1(5%)
>3
00
2011 47 9 (19%) 11 (23%) 12 (26%) 28 (60%) 39 (83%) 9 (19%)
2010 41 9 (22%) 9 (22%) 9 (22%) 24 (59%) 34 (83%) 8 (20%)
2009 34 8 (24%) 8 (24%) 9 (26%) 21 (62%) 30 (88%) 4 (12%)
2008 43 6(14%) 10(23%) 13(30%) 27(63%) 36(84%) 3(7%)
Tota
ls 2011 186 19 (10%) 40 (22%) 39 (21%) 131 (70%) 161 (87%) 28 (15%)
2010 183 17 (9%) 41 (22%) 37 (20%) 126 (69%) 155 (85%) 30 (16%)
2009 160 14 (9%) 36 (23%) 32 (20%) 111 (69%) 142 (89%) 24 (15%)
2008 176 10(6%) 33(19%) 38(22%) 119(68%) 151(86%) 20(11%)
Question 9 by Question 28

Ap
pen
dix
B
B-2
First-year Class Size by Staffing Model
No.
of
1Ls
Year
Total
No.
Schools
Tenure or
tenure-
track
Full-time
nontenure-
track
Part-time Adjuncts Complex
Hybrid
<1
00
2011 4 1 0 0 1 2
2010 6 2 0 0 2 2
2009 7 1 1 0 2 3
2008 7 2 0 0 0 5
101
-150 2011 21 2 8 1 3 7
2010 27 2 8 1 6 9
2009 25 4 8 1 2 10
2008 20 2 9 1 2 6
151-2
00 2011 45 4 19 1 3 18
2010 44 4 18 1 3 18
2009 39 4 17 2 5 11
2008 52 5 24 2 5 16
201-2
50 2011 48 4 22 0 4 18
2010 47 3 26 0 3 15
2009 39 2 23 0 2 12
2008 38 1 24 1 1 11
251-3
00 2011 21 2 11 0 3 5
2010 21 1 10 0 2 8
2009 19 1 9 0 2 7
2008 19 0 10 0 2 7
>3
00
2011 47 4 19 0 5 19
2010 43 3 17 0 4 19
2009 37 3 15 0 4 15
2008 45 2 19 0 7 17
Tota
ls
2011 186 17 79 2 19 69
2010 188 15 79 2 20 71
2009 166 15 73 3 17 58
2008 181 12 86 4 17 62
Question 9 by Question 10

Ap
pen
dix
B
B-3
First-year Class size by Assistant/Associate Directors
No.
of
1Ls
Year
Total
No.
Schools
Have
Assistant/Associate
Director
Average Salary
Do not have
Assistant/Associate
Director
<1
00
2011 4 0 No responses 4
2010 6 0 No responses 6
2009 7 0 No responses 6
2008 7 0 No responses 7
101
-150 2011 23 2 $82,500 18
2010 24 3 $87,667 21
2009 25 3 $88,333 20
2008 20 3 $81,000 15
151-2
00 2011 45 6 $77,000 33
2010 37 4 $82,667 33
2009 39 4 $78,750 30
2008 52 7 $81,836 39
201-2
50 2011 48 6 $68,000 37
2010 44 9 $71,429 35
2009 39 6 $79,500 30
2008 38 6 $72,400 30
251-3
00 2011 21 6 $79,000 14
2010 19 6 $74,000 13
2009 19 5 $71,250 11
2008 19 6 $68,000 9
>3
00
2011 47 17 $99,482 26
2010 39 15 $93,964 24
2009 37 13 $88,750 21
2008 45 17 $90,923 25
Question 9 by Question 46

Ap
pen
dix
B
B-4
First-year Class Size by Use of Adjunct Faculty
No.
of
1Ls Year
Total
No.
Schools
Use
Adjuncts
Exclusively
Use Adjuncts
Substantially
(75%)
Use Adjuncts
Significantly
(50%)
Use
Adjuncts
Somewhat
(25%)
Use
Adjuncts
Rarely
(<25%)
Do Not
use
Adjuncts
<1
00
2011 4 0 0 2 0 1 1
2010 6 1 0 0 2 1 2
2009 7 1 0 1 1 1 3
2008 7 0 0 2 1 1 3
101
-150 2011 23 2 2 1 4 6 8
2010 27 5 3 1 4 3 11
2009 25 2 2 1 6 3 11
2008 20 1 1 1 3 4 10
151-2
00 2011 45 3 6 4 11 4 17
2010 43 2 7 1 12 5 16
2009 39 3 6 3 7 5 15
2008 52 4 7 3 9 8 21
201-2
50 2011 48 2 6 3 6 9 22
2010 47 1 6 5 7 5 23
2009 39 1 3 4 4 6 21
2008 38 2 3 3 2 5 23
251-3
00 2011 21 2 1 1 2 3 12
2010 21 2 1 2 4 2 10
2009 19 2 1 3 3 3 7
2008 18 2 2 4 1 2 7
>3
00
2011 46 5 5 7 5 6 18
2010 42 4 5 7 3 7 16
2009 37 4 3 6 3 5 16
2008 45 5 4 7 5 7 17
Tota
ls
2011 187 14 20 18 28 29 78
2010 186 15 22 16 32 23 78
2009 166 13 15 18 24 23 73
2008 180 14 17 20 21 27 81
Question 9 by Question 86
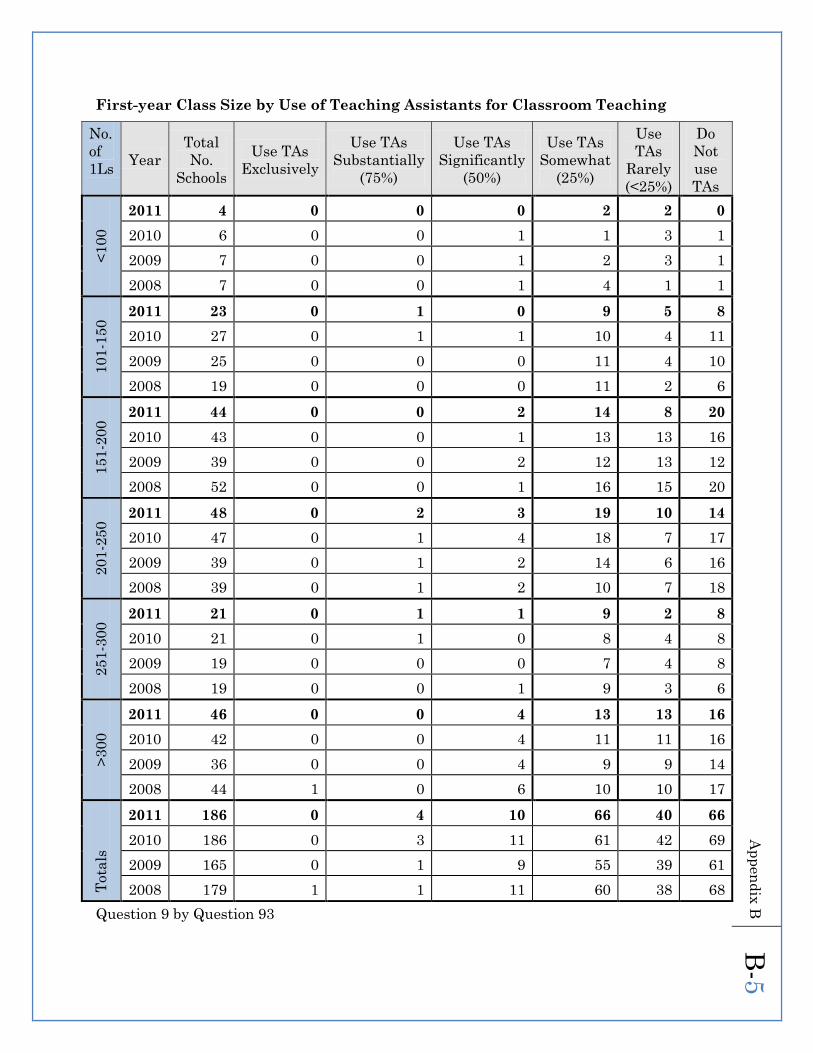
Ap
pen
dix
B
B-5
First-year Class Size by Use of Teaching Assistants for Classroom Teaching
No.
of
1Ls Year
Total
No.
Schools
Use TAs
Exclusively
Use TAs
Substantially
(75%)
Use TAs
Significantly
(50%)
Use TAs
Somewhat
(25%)
Use
TAs
Rarely
(<25%)
Do
Not
use
TAs
<1
00
2011 4 0 0 0 2 2 0
2010 6 0 0 1 1 3 1
2009 7 0 0 1 2 3 1
2008 7 0 0 1 4 1 1
101-1
50 2011 23 0 1 0 9 5 8
2010 27 0 1 1 10 4 11
2009 25 0 0 0 11 4 10
2008 19 0 0 0 11 2 6
151-2
00 2011 44 0 0 2 14 8 20
2010 43 0 0 1 13 13 16
2009 39 0 0 2 12 13 12
2008 52 0 0 1 16 15 20
201
-250 2011 48 0 2 3 19 10 14
2010 47 0 1 4 18 7 17
2009 39 0 1 2 14 6 16
2008 39 0 1 2 10 7 18
251-3
00 2011 21 0 1 1 9 2 8
2010 21 0 1 0 8 4 8
2009 19 0 0 0 7 4 8
2008 19 0 0 1 9 3 6
>3
00
2011 46 0 0 4 13 13 16
2010 42 0 0 4 11 11 16
2009 36 0 0 4 9 9 14
2008 44 1 0 6 10 10 17
Tota
ls
2011 186 0 4 10 66 40 66
2010 186 0 3 11 61 42 69
2009 165 0 1 9 55 39 61
2008 179 1 1 11 60 38 68
Question 9 by Question 93

Ap
pen
dix
B
B-6
Analysis of the effect of staffing model (Q. 10):
Staffing Model by Grading Model
Staffing Model
Year
Grades that
are included
in GPAs
Grades that are
not included in
GPAs
Honors,
pass, fail (or
equivalent)
Purely
pass/fail
Other
method
Tenured or
tenure-track
2011 15 0 0 1 1
2010 14 0 0 0 1
2009 12 0 0 1 1
2008 12 0 0 0 0
Doctrinal course
or professor
2011 2 0 0 0 0
2010 1 0 0 0 0
2009 1 0 0 0 0
2008 0 0 0 0 0
Full-time
nontenure-track
2011 67 1 7 1 3
2010 64 1 8 2 3
2009 60 1 7 2 3
2008 72 1 8 3 2
Part-time
2011 2 0 0 0 0
2010 2 0 0 0 0
2009 3 0 0 0 0
2008 4 0 0 0 0
Adjuncts
2011 17 0 1 0 1
2010 18 0 1 0 1
2009 16 0 0 0 1
2008 16 0 1 0 0
Students
2011 0 0 0 0 0
2010 0 0 0 0 0
2009 0 0 0 0 0
2008 0 0 0 0 0
Complex Hybrid
2011 60 0 1 1 6
2010 60 0 1 2 6
2009 53 0 1 1 3
2008 54 0 2 1 5
TOTALS
2011 163 1 9 3 11
2010 159 1 10 4 11
2009 145 1 8 4 8
2008 158 1 11 4 7
Question 10 by Question 15

Ap
pen
dix
B
B-7
Staffing Model by Research Teaching Model
Staffing
Model
Year
Research
Taught
Integrated
with
Writing
Research
Taught
Separately
from
Writing
Taught
by
LRW
Faculty
Taught by
Librarians
Taught by
both LRW
Faculty
and
Librarians
Taught by
Teaching
Assistants
or Other
Students
Tenured or
tenure-track
2011 14 6 11 3 5 2
2010 11 6 7 4 5 2
2009 11 4 7 2 5 1
2008 9 4 5 3 4 1
Doctrinal
course or
professor
2011 2 0 0 1 0 1
2010 1 0 0 1 0 0
2009 1 0 0 1 0 0
2008 0 0 0 0 0 0
Full-time
nontenure-
track
2011 71 18 39 16 32 9
2010 68 20 40 18 29 11
2009 65 16 41 16 21 8
2008 76 19 44 18 31 9
Part-time
2011 2 1 0 0 2 0
2010 2 1 0 0 2 0
2009 3 1 0 0 3 0
2008 4 1 0 1 3 0
Adjuncts
2011 14 10 3 11 8 3
2010 14 11 4 9 9 4
2009 12 9 4 6 7 4
2008 12 9 2 8 6 3
Students
2011 0 0 0 0 0 0
2010 0 0 0 0 0 0
2009 0 0 0 0 0 0
2008 0 0 0 0 0 0
Complex
Hybrid
2011 54 30 24 23 28 12
2010 58 27 26 24 23 12
2009 47 24 21 21 20 12
2008 50 23 23 22 22 10
TOTALS
2011 157 65 77 54 75 27
2010 154 65 77 56 68 29
2009 139 54 73 46 56 25
2008 151 56 74 52 66 23
Question 10 by Question 18

Ap
pen
dix
B
B-8
Staffing Model by No. of First-year Credits Awarded
Staffing
Model
Year Fall Semester Spring Semester
Total No. of
schools
responding
Average
credits
1 c
red
it
2 c
red
its
3 c
red
its
4 c
red
its
Total No. of
schools
responding
Average
credits
1 c
red
it
2 c
red
its
3 c
red
its
4 c
red
its
Tenured
or tenure-
track
2011 16 2.81 0 4 11 1 17 2.59 0 7 10 0
2010 14 2.79 0 4 9 1 15 2.73 0 5 9 1
2009 13 2.62 0 5 8 0 14 2.64 0 5 9 0
2008 12 2.50 0 6 6 0 12 2.50 1 4 7 0
Doctrinal
course or
professor
2011 2 2.00 0 2 0 0 2 2.50 0 1 1 0
2010 1 2.00 0 1 0 0 1 3.00 0 0 1 0
2009 1 2.00 0 1 0 0 1 3.00 0 0 1 0
2008 0 0 0 0 0 0 0 0 0 0 0 0
Full-time
nontenure
-track
2011 78 2.29 3 50 24 1 78 2.26 3 52 23 0
2010 77 2.31 3 49 23 2 77 2.27 4 49 23 1
2009 85 2.31 4 44 22 2 72 2.18 6 47 19 0
2008 85 2.33 3 53 27 2 85 2.26 5 53 27 0
Part-time
2011 2 2.50 0 1 1 0 2 2.00 0 2 0 0
2010 2 2.50 0 1 1 0 2 2.00 0 2 0 0
2009 3 2.33 0 2 1 0 3 2.33 0 2 1 0
2008 4 2.25 1 1 2 0 4 2.25 0 3 1 0
Adjuncts
2011 19 2.21 2 11 6 0 19 2.00 4 11 4 0
2010 19 2.37 1 10 8 0 20 2.05 4 11 5 0
2009 17 2.36 1 9 7 0 17 2.00 3 9 5 0
2008 17 2.24 1 11 5 0 17 2.00 5 7 5 0
Complex
Hybrid
2011 65 2.43 7 24 33 1 66 2.39 5 31 29 1
2010 68 2.46 8 24 33 3 69 2.30 8 33 27 1
2009 57 2.49 6 21 26 4 58 2.31 6 30 20 2
2008 61 2.43 9 21 27 4 61 2.23 9 31 19 2
Question 10 by Question 12

Ap
pen
dix
B
B-9
Staffing Model by Feedback Method for Papers
Staffing
Model
Year
Comments
written on
paper itself
General
feedback
memo to
all
students
Feedback
memo to
specific
student
Short
comments
at end of
paper
Comments
in person
during
conference
Grading
grids or
score
sheets
Tenured or
tenure-track
2011 17 17 11 15 16 12
2010 15 14 8 14 14 11
2009 14 14 7 12 13 10
2008 12 11 8 11 11 10
Doctrinal
course or
professor
2011 2 2 0 2 2 1
2010 1 1 0 1 1 1
2009 1 1 0 1 1 1
2008 0 0 0 0 0 0
Full-time
nontenure-
track
2011 79 64 58 70 77 61
2010 79 63 58 71 74 62
2009 73 59 48 66 69 56
2008 86 71 58 76 80 70
Part-time
2011 2 2 2 2 2 1
2010 2 2 2 2 2 1
2009 3 3 3 3 3 2
2008 4 4 3 4 4 3
Adjuncts
2011 19 15 13 16 17 11
2010 20 16 12 18 18 11
2009 17 12 10 15 15 10
2008 17 10 9 12 14 10
Students
2011 0 0 0 0 0 0
2010 0 0 0 0 0 0
2009 0 0 0 0 0 0
2008 0 0 0 0 0 0
Complex
Hybrid
2011 67 59 48 63 65 49
2010 69 60 49 63 66 49
2009 58 50 39 54 55 43
2008 61 50 41 56 56 45
TOTALS
2011 187 159 132 168 179 135
2010 186 156 129 169 175 135
2009 166 139 107 151 156 122
2008 180 146 119 159 165 138
Question 10 by Question 24

Ap
pen
dix
B
B-1
0
Staffing Model by Director’s Status
Staffing
Model Year
Tenured,
LRW
primary
Untenured,
tenure-
track, LRW
primary
Nontenure-
track, primary
responsibility
is LRW
Admin. or
faculty,
LRW not
primary
Admin.
LRW
primary
Clinical
tenure or
clinical
tenure track
Other
Tenured or
tenure-
track
2011 4 6 0 0 0 0 3
2010 3 6 0 0 0 0 2
2009 4 4 0 0 0 0 2
2008 2 4 0 0 0 0 1
Full-time
nontenure-
track
2011 8 3 32 1 1 12 10
2010 8 4 33 4 2 9 7
2009 7 3 33 2 2 7 9
2008 9 6 32 3 3 5 13
Part-time
2011 1 0 1 0 0 0 0
2010 1 0 1 0 0 0 0
2009 1 0 1 0 0 1 0
2008 1 0 2 0 0 1 0
Adjuncts
2011 4 4 6 1 0 3 1
2010 3 2 5 3 0 4 3
2009 6 2 5 1 0 2 1
2008 5 1 6 1 0 2 2
Students
2011 0 0 0 0 0 0 0
2010 0 0 0 0 0 0 0
2009 0 0 0 0 0 0 0
2008 0 0 0 0 0 0 0
Complex
Hybrid
2011 17 6 19 2 2 6 12
2010 16 5 20 1 2 6 12
2009 11 6 16 1 2 4 11
2008 16 7 20 1 2 5 8
TOTALS
2011 34 19 58 4 3 21 25
2010 31 18 59 8 4 19 24
2009 29 16 55 4 4 14 23
2008 33 18 60 5 5 13 24
Question 10 by Question 45

Ap
pen
dix
B
B-1
1
Staffing Model by Director’s Workload
Averages do not include responses of zero, so total percentages may exceed 100.
Staffing
Model Year
Director
Duties
Teaching
in the
Required
Program
Teaching
outside the
required
program
Service
to the
law
school
Academic
Support Scholarship Other
Tenured
or tenure-
track
2011 24.0 33.5 20.0 15.6 5.0 15.0 55.0
2010 21.1 31.7 21.0 17.5 5.0 16.4 30.0
2009 24.4 33.8 26.3 14.3 7.5 13.3 55.0
2008 20.0 41.4 23.8 18.6 5.0 13.8 0
Full-time
nontenure-
track
2011 25.0 44.4 23.6 13.9 11.9 11.7 13.8
2010 24.2 44.3 22.9 13.4 8.6 10.9 15.2
2009 24.7 44.0 28.1 11.8 10.7 11.5 11.3
2008 24.2 44.4 26.3 12.1 9.0 14.3 14.1
Part-time
2011 32.5 40.0 15.0 12.5 -- 5.0 5.0
2010 25.0 47.5 15.0 20.0 10.0 5.0 5.0
2009 21.7 43.3 20.0 15.0 7.5 5.0 5.0
2008 21.3 43.3 40.0 10.0 5.0 5.0 5.0
Adjuncts
2011 41.2 25.5 25.0 13.3 13.0 14.2 18.3
2010 43.9 28.2 28.8 13.5 12.0 12.9 8.6
2009 44.7 29.1 26.7 14.7 14.0 16.4 7.5
2008 48.4 21.3 27.0 15.0 15.0 21.0 7.5
Students
(No
responses
2008-11)
2011 -- -- -- -- -- -- --
2010 -- -- -- -- -- -- --
2009 -- -- -- -- -- -- --
2008 -- -- -- -- -- -- --
Complex
Hybrid
2011 31.1 38.5 20.9 12.5 7.5 11.5 9.1
2010 30.3 38.6 20.0 11.2 8.3 11.1 10.0
2009 29.0 39.3 18.4 11.6 7.5 11.1 10.3
2008 28.5 36.0 25.2 12.4 9.6 11.0 9.2
Question 10 by Question 53
Assistant/Associate Director by Staffing Model
Year
Tenured
or tenure-
track
Full-time
nontenure
-track
Part-
time Adjuncts Students
Complex
Hybrid
No. of Schools that
report having
Associate/Assistant
Directors
2011 1 8 0 7 0 22
2010 1 10 0 9 0 17
2009 1 8 0 7 0 15
2008 1 10 0 7 0 21
Question 46 by Question 10

Ap
pen
dix
B
B-1
2
Consistency in Program Elements by Staffing Model
Numeric responses are in this order:
(a. Uniform; b. Generally Consistent; c. Varies among sections)
Topic Year
Tenure
or
tenure-
track
Doctrinal
course or
Professor
Full-time
nontenure-
track
Part-
Time Adjuncts
Complex
Hybrid
Syllabus
Coverage
2011 6;7; 4 1; 0; 1 30; 46; 3 1; 1; 0 15; 4; 0 34; 27; 7
2010 4; 8; 3 1; 0; 0 33; 43; 3 1; 1; 0 16; 4; 0 30; 31; 8
2009 2; 8; 4 1; 0; 0 31; 37; 5 1; 1; 0 15; 2; 0 26; 26; 5
2008 2; 7; 3 0; 0; 0 34; 46; 5 2; 1; 0 16; 1; 0 28; 25; 4
No. of Major
Assignments
2011 10; 7; 0 1; 0; 1 60; 19; 0 2; 0; 0 18; 1; 0 48; 20; 0
2010 10; 5; 0 1; 0; 0 61; 18; 0 2; 0; 0 19; 1; 0 46; 22; 1
2009 7; 6; 1 1; 0; 0 53; 17; 3 2; 0; 0 17; 0; 0 41; 16; 0
2008 6; 5; 1 0; 0; 0 61; 21; 3 3; 0; 0 17; 0; 0 43; 14; 0
Due dates
and lengths
of most
assignments
2011 6; 8; 3 1; 0; 1 38; 34; 6 2; 0; 0 16; 3; 0 34; 26; 8
2010 6; 7 ; 2 1; 0; 0 38; 34; 6 2; 0; 0 18; 2; 0 34; 26; 9
2009 5; 7; 2 1; 0; 0 32; 33; 8 2; 0; 0 16; 1; 0 25; 27; 5
2008 4; 6; 2 0; 0; 0 39; 37; 9 3; 0; 0 17; 0; 0 28; 24; 5
No. of Minor
Assignments
2011 4; 7; 6 1; 0; 1 10; 35; 34 1; 0; 1 11; 4; 4 17; 36; 25
2010 3; 8; 4 1; 0; 0 12; 33; 34 0; 0; 1 11; 5; 4 16; 26; 26
2009 2; 9; 3 1; 0; 0 11; 29; 33 1; 0; 1 10; 5; 2 16; 20; 20
2008 4; 5; 3 0; 0; 0 15; 37;33 1; 1; 1 12; 4; 1 20; 17; 19
Required
Textbook
2011 6; 3; 8 1; 0; 1 29; 8; 41 2; 0; 0 18; 1; 0 34; 9; 25
2010 5; 4; 6 1; 0; 0 32; 9; 37 2; 0; 0 20; 0; 0 33; 12; 24
2009 4; 4; 6 1; 0; 0 26; 13; 33 2; 0; 0 17; 0; 0 31; 5; 21
2008 5; 2; 5 0; 0; 0 30; 15; 39 3; 0; 0 17; 0; 0 35; 8; 14
Citation Text
2011 13; 4; 0 1; 0; 1 68; 7; 4 2; 0; 0 18; 0; 1 56; 2; 10
2010 12; 3; 0 1; 0; 0 67; 8; 4 2; 0; 0 20; 0; 0 54; 5; 10
2009 11; 2; 0 1; 0; 0 60; 7; 6 2; 0; 0 17; 0; 0 47; 3; 7
2008 10; 2; 0 0; 0; 0 69; 12; 4 3; 0; 0 17; 0; 0 50; 6; 1
Content of
class
lectures and
exercises
2011 0; 6; 10 0; 1; 1 0; 19; 60 0; 0; 2 3; 11; 5 7; 24; 37
2010 0; 6; 9 0; 1; 0 1; 24; 54 0; 1; 1 2; 13; 5 6; 24; 39
2009 0; 5; 9 0; 1; 0 1; 22; 50 0; 1; 1 4; 9; 4 4; 22; 31
2008 0; 5; 7 0; 0; 0 1; 29; 55 0; 2; 1 2; 12; 2 5; 23; 28
Grading
2011 2; 10; 4 1; 1; 0 17; 51; 11 0; 2; 0 9; 8; 2 24; 37; 7
2010 1; 11; 2 1; 0; 0 17; 50; 11 0; 2; 0 8; 11; 0 26; 34; 9
2009 0; 10; 3 1; 0; 0 15; 44; 12 0; 2; 0 8; 8; 0 21; 30; 6
2008 1; 8; 3 0; 0; 0 19; 49; 15 1; 2; 0 11; 6; 0 23; 28; 7
Question 26 by Question 10

Ap
pen
dix
B
B-1
3
Staffing Model by Availability and Staffing of Elective Writing Courses
Staffing Model
Year
No elective
writing
courses
available
Elective
writing courses
taught by non-
writing faculty
Elective
writing
courses
taught by
LRW faculty
Elective writing
courses taught
by either non-
writing or LRW
faculty
Tenured or
tenure-track
2011 2 1 1 13
2010 1 1 1 12
2009 1 2 0 11
2008 0 0 2 10
Doctrinal
course or
professor
2011 1 0 0 1
2010 0 0 0 1
2009 0 0 0 1
2008 0 0 0 0
Full-time
nontenure-
track
2011 2 16 6 53
2010 3 17 9 48
2009 3 15 7 47
2008 4 20 7 53
Part-time
2011 0 1 0 1
2010 0 1 0 1
2009 0 2 0 1
2008 0 2 0 2
Adjuncts
2011 2 3 2 12
2010 2 2 5 11
2009 1 3 3 10
2008 2 4 3 8
Students
2011 0 0 0 0
2010 0 0 0 0
2009 0 0 0 0
2008 0 0 0 0
Complex
Hybrid
2011 3 16 7 41
2010 4 16 5 42
2009 3 11 6 36
2008 6 18 6 29
TOTALS
2011 10 37 16 121
2010 10 37 20 115
2009 8 33 16 106
2008 12 44 18 102
Question 10 by Question 32

B-14 Appendix B
Use of Technology by Staffing Model
Tenure or tenure-track Full-time nontenure-track Part-time Adjuncts Complex Hybrid
2011 2010 2009 2008 2011 2010 2009 2008 2011 2010 2009 2008 2011 2010 2009 2008 2011 2010 2009 2008
E-m
ail
lis
tserv
for
stu
den
ts All* 13 10 8 7 56 52 47 53 0 1 2 3 12 12 11 11 46 45 36 41
Most* 1 1 1 2 12 11 12 16 1 1 1 1 3 3 3 3 12 16 14 10
Some* 4 3 3 2 6 8 7 8 1 0 0 0 1 1 1 1 7 6 5 6
Never* 0 0 1 1 4 6 4 6 0 0 0 0 3 3 2 2 3 2 2 2
Avg. rating** 4.22 4.29 4.58 4.64 4.60 4.61 4.62 4.61 4.00 4.00 4.33 4.50 4.27 4.13 4.14 4.21 4.48 4.48 4.43 4.32
Sm
art
class
room
s
All* 8 5 4 2 25 22 20 25 1 1 2 2 6 6 2 2 22 19 20 20
Most* 5 4 3 4 18 14 16 15 1 1 1 2 1 1 1 1 14 16 10 7
Some* 4 3 4 4 18 21 19 24 0 0 0 0 8 7 7 7 23 22 20 20
Never* 1 2 2 2 8 9 7 15 0 0 0 0 2 5 4 3 4 6 3 5
Avg. rating** 4.25 4.18 4.20 4.00 4.34 4.28 4.29 4.24 4.50 4.50 4.67 4.75 4.17 4.09 3.71 3.56 4.02 3.93 3.98 3.82
On
lin
e e
dit
s
All* 0 0 0 0 8 8 7 8 1 0 0 0 2 1 2 1 6 7 5 4
Most* 3 2 2 1 13 11 8 7 0 1 1 1 1 1 0 0 8 7 6 8
Some* 12 9 7 9 38 42 41 48 1 1 1 2 14 12 10 12 42 39 33 32
Never* 3 3 4 1 14 13 10 19 0 0 0 0 2 4 3 2 7 10 9 10
Avg. rating** 3.93 4.00 4.25 4.11 4.29 4.20 4.13 4.17 5.00 5.00 5.00 5.00 3.87 4.00 4.09 4.17 3.76 3.82 3.87 3.72
Cou
rse W
eb
page
All* 2 0 1 1 12 14 12 17 1 1 1 2 2 1 2 4 13 14 12 12
Most* 1 2 3 2 8 8 8 8 0 0 0 0 0 0 0 0 6 8 5 5
Some* 6 5 3 3 14 13 16 16 1 1 0 0 6 5 4 4 14 15 14 15
Never* 6 4 5 5 26 27 21 30 0 0 0 0 11 10 7 8 16 18 12 12
Avg. rating** 3.71 4.00 4.50 4.50 4.25 4.00 4.13 4.26 4.50 4.50 4.00 4.50 3.40 3.40 3.20 2.86 4.07 3.97 3.96 3.79
TW
EN
,
Bla
ckboard
, etc
. All* 7 7 4 3 49 45 33 38 1 1 2 3 11 12 11 10 45 37 33 30
Most* 8 5 7 5 15 17 17 18 0 0 0 0 1 1 2 2 9 14 12 9
Some* 3 2 2 3 11 14 19 24 1 1 1 1 6 6 4 5 13 16 12 20
Never* 1 1 1 1 1 1 1 4 0 0 0 0 1 1 0 0 1 2 1 1
Avg. rating** 4.17 4.14 4.31 4.36 4.45 4.35 4.28 4.21 3.00 3.00 4.00 4.25 3.83 3.63 3.82 3.94 4.3 4.35 4.31 4.12
Question 43 by Question 10 (* value is number of schools; ** rating on a scale of 1-5)

Ap
pen
dix
B
B-1
5
Analysis of the effect of LRW Faculty Status (Q. 65)
Faculty Title by LRW Faculty Status
Question 65 by Question 68
LRW Faculty Status
Year
Tenure
or
tenure-
track
ABA
Standard
405(c)
(includes
405(c) track)
Contracts
of 3 years
or more
Contracts
of 2 years
Contracts
of 1 year
Fa
cult
y T
itle
Professor,
Assoc. Prof., or
Asst. Prof.
2011 27 6 4 0 2
2010 31 7 4 0 2
2009 25 6 3 1 4
2008 28 5 4 0 3
Professor,
Assoc. Prof., or
Asst. Prof. of
Legal Writing
2011 11 26 14 1 3
2010 6 25 15 3 3
2009 6 20 13 4 2
2008 5 20 12 4 5
Visiting
professor or
visiting prof. of
legal writing
2011 9 0 3 0 1
2010 9 0 2 0 2
2009 6 0 1 0 2
2008 4 0 1 1 1
Clinical prof.,
clinical assoc.
prof., or clinical
asst. prof.
2011 4 8 3 0 2
2010 4 8 3 0 3
2009 4 6 4 0 2
2008 4 8 4 0 1
Lecturer or
senior lecturer
2011 2 2 9 5 4
2010 2 2 8 3 4
2009 2 2 5 2 6
2008 1 1 7 3 6
Instructor 2011 4 3 6 1 9
2010 3 3 6 3 9
2009 2 3 6 0 9
2008 2 3 8 0 12
Other 2011 6 9 11 1 6
2010 3 8 12 1 3
2009 2 8 9 2 3
2008 3 5 9 1 4

Ap
pen
dix
B
B-1
6
LRW Faculty Status and Faculty Meeting Attendance and Voting Rights
Question 65 by Question 84
Year
Attend and
Vote on All
Matters
Attend and Vote on All
Matters Except Hiring,
Promotions, and Tenure
Attend
but Do
Not Vote
Do Not
Attend
or Vote
Tenure or
tenure-track
2011 30 11 1 0
2010 28 7 1 0
2009 25 6 1 0
2008 24 8 3 0
ABA Standard
405(c) and
405(c) track
2011 9 35 2 0
2010 9 36 2 0
2009 5 30 5 0
2008 4 31 1 1
Contracts of 3
years or more
2011 4 19 16 4
2010 3 20 16 6
2009 3 13 19 4
2008 3 12 23 5
Contracts of 2
years
2011 0 1 3 3
2010 0 3 2 3
2009 0 4 3 1
2008 0 3 3 1
Contracts of 1
year
2011 0 6 14 3
2010 1 5 13 2
2009 2 6 12 3
2008 3 6 16 3

Ap
pen
dix
B
B-1
7
LRW Faculty Status and Credit Awarded for LRW Courses
Status Year Fall Semester Spring Semester
Total No.
of schools
responding
Average
credits
1 c
red
it
2 c
red
its
3 c
red
its
4 c
red
its
Total No.
of schools
responding
Average
credits
1 c
red
it
2 c
red
its
3 c
red
its
4 c
red
its
Tenured
or tenure-
track
2011 42 2.67 2 12 26 2 44 2.52 2 13 23 1
2010 36 2.72 1 11 21 3 38 2.68 1 12 23 36
2009 31 2.61 2 10 17 2 33 2.64 1 11 20 1
2008 35 2.60 2 12 19 2 35 2.49 2 15 17 1
All other
types
2011 140 2.29 10 80 49 1 140 2.24 10 86 44 0
2010 120 2.34 8 65 45 2 120 2.23 9 75 35 1
2009 110 2.32 8 61 38 3 110 2.20 9 71 29 1
2008 115 2.32 8 64 41 2 115 2.23 9 71 35 0
Question 65 by Question 12
LRW Faculty Status by Funding for Summer Research
Question 65 by Question 76—N is the number answering yes, even if no amount reported.
Year
Eligible for summer
research grants Not Eligible for
summer research
grants
School does not generally
provide summer research
grants to faculty N Avg. amount
Tenure or
tenure-track
2011 30 $10,175 1 2
2010 30 $9,623 3 2
2009 33 $9,496 1 2
2008 30 $8,532 2 3
ABA
Standard
405(c) and
405(c) track
2011 33 $9,757 8 2
2010 35 $9,770 7 2
2009 40 $8,987 6 1
2008 30 $8,898 4 2
Contracts of
3 years or
more
2011 23 $7,7990 16 0
2010 22 $7,667 17 0
2009 39 $7,882 16 0
2008 24 $7,333 14 0
Contracts of
2 years
2011 1 $6,000 4 0
2010 3 $6,000 4 0
2009 8 $5,500 5 0
2008 2 $5,250 5 0
Contracts of
1 year
2011 11 $5,773 10 2
2010 12 $4,982 9 1
2009 24 $5,000 9 3
2008 11 $6,650 12 4

Ap
pen
dix
B
B-1
8
LRW Faculty Status by Funding for Research Assistants
Question 65 by Question 80--N is the number answering yes, even if no amount reported
Year
Receive sufficient
funding for all
reasonable
requests
Receive annual
average funding Do not receive funding
for research assistants
N Avg. amount
Tenure or
tenure-
track
2011 31 5 $3,500 1
2010 31 5 $3,875 1
2009 29 4 $2,667 0
2008 30 4 $3,000 1
ABA
Standard
405(c) and
405(c) track
2011 29 13 $1,950 3
2010 35 8 $1,813 3
2009 29 7 $2,200 3
2008 28 6 $2,233* 2
Contracts of
3 years or
more
2011 28 6 $1,250 8
2010 27 8 $1,750 8
2009 23 9 $2,100 7
2008 25 8 $1,500* 10
Contracts of
2 years
2011 4 2 $500 0
2010 3 2 $750 2
2009 5 1 $500 2
2008 4 2 $500 1
Contracts of
1 year
2011 14 2 $1,000 9
2010 15 1 $1,000 7
2009 16 0 n/a 8
2008 17 1 $500 11
* Responses of $10,000 and over excluded

Ap
pen
dix
B
B-1
9
LRW Faculty Status by Average Class Size and Workload
Question 65 by Question 82
LRW Faculty Status
Year
Tenure or
tenure-track
ABA
Standard
405(c)
(includes
405(c) track)
Contracts of
3 years or
more
Contracts of
2 years
Contracts of
1 year
Fall Spring Fall Spring Fall Spring Fall Spring Fall Spring
Average
Number of
students
taught
2011 41.76 39.86 41.01 39.73 41.73 40.39 39.20 39.00 40.98 41.30
2010 36.10 35.18 41.91 40.27 41.69 40.42 40.71 40.29 45.16 44.80
2009 35.84 34.70 44.84 44.41 42.68 41.29 43.19 44.56 44.67 44.59
2008 42.05 42.48 42.11 40.11 44.65 43.85 45.14 44.86 40.20 40.70
In-class
hours of
teaching each
week
2011 4.025 3.78 3.76 3.47 3.85 3.44 5.20 4.80 3.31 3.21
2010 3.82 3.62 3.77 3.65 3.74 3.35 5.33 4.33 3.52 3.33
2009 3.64 3.32 3.71 3.53 3.79 3.54 4.13 4.25 3.57 3.38
2008 3.98 3.62 3.61 3.41 3.65 3.42 5.00 4.67 3.54 3.31
Number of
major
assignments
(>=5 pages)
2011 3.48 2.85 3.30 2.78 3.20 2.51 3.00 2.00 3.21 2.52
2010 3.26 2.79 3.27 2.61 3.18 2.48 3.29 2.57 3.18 2.64
2009 3.25 2.74 3.51 2.77 3.28 2.44 2.75 2.75 3.05 2.45
2008 3.26 2.83 3.22 2.65 3.14 2.50 2.57 2.29 3.04 2.44
Number of
minor
assignments
2011 3.72 3.08 3.21 2.65 3.23 2.64 3.80 2.20 4.00 2.35
2010 3.42 2.73 3.68 3.16 3.11 2.88 3.67 3.20 3.76 2.61
2009 3.52 2.63 3.64 3.20 3.21 3.00 5.71 3.50 3.90 2.42
2008 3.83 2.75 3.77 3.31 3.27 2.74 3.86 2.57 4.26 2.57
Total number
of pages of
student work
per term
2011 1514 1484 1706 1695 1483 1571 1319 1042 1570 1592
2010 1450 1405 1685 1734 1397 1442 1634 1427 1381 1563
2009 1431 1333 1894 1719 1515 1490 1388 1460 1315 1519
2008 1445 1493 1533 1517 1531 1522 1473 1590 1393 1497
Total hours
in conference
2011 43.53 39.43 46.93 43.00 56.33 52.66 46.25 28.50 58.95 56.48
2010 43.21 39.51 47.81 44.28 53.66 48.62 51.07 37.61 52.81 52.20
2009 46.29 41.82 51.13 45.13 55.17 48.58 31.83 25.38 42.50 38.45
2008 49.69 45.18 45.64 42.78 51.67 45.06 32.71 34.89 52.56 52.17
Total hours
preparing
major
assignments
2011 35.47 32.41 27.65 26.52 39.33 39.11 24.75 19.00 42.00 41.59
2010 34.10 32.30 32.13 29.29 39.03 38.08 27.43 23.00 37.84 45.26
2009 35.26 33.11 37.33 34.91 38.59 40.60 18.20 20.30 36.00 43.06
2008 34.48 30.57 29.74 28.14 42.08 45.72 23.50 29.42 33.24 30.50
Total Hours
preparing for
class
2011 67.74 60.64 69.18 65.82 73.82 70.38 40.75 34.75 83.09 84.45
2010 70.97 63.68 74.78 73.00 72.76 67.32 56.29 47.00 79.55 75.50
2009 67.89 56.43 81.91 79.83 72.07 68.91 37.83 37.83 49.95 69.50
2008 63.78 56.91 70.48 71.71 75.20 69.65 40.00 38.57 69.29 65.81

Ap
pen
dix
B
B-2
0
Analysis of Faculty Salary
LRW Faculty Salary by Average Class Size (First Fall and First Spring Averaged)
Year
Total Salary
Responses Avg. Low Salary Avg. High Salary
Overall Avg.
Salary
20 o
r
Belo
w
2011 3 $85,000 $109,000 $97,000
2010 5 $73,900 $96,300 $85,100
2009 4 $78,125 $79,125 $78,625
2008 2 $74,500 $87,500 $81,000
21 t
o 3
0 2011 13 $67,577 $92,082 $79,829
2010 12 $68,542 $79,667 $74,104
2009 9 $65,222 $81,556 $73,389
2008 14 $64,286 $82,357 $73,321
31 t
o 3
5 2011 14 $72,071 $98,321 $85,196
2010 15 $65,000 $93,292 $79,146
2009 18 $62,833 $82,389 $72,611
2008 16 $64,938 $81,500 $73,219
36 t
o 4
0 2011 30 $65,903 $78,693 $72,298
2010 34 $65,241 $74,688 $69,965
2009 25 $66,448 $78,896 $72,672
2008 23 $58,013 $62,500 $60,256
41 t
o 4
5 2011 23 $64,130 $72,505 $68,318
2010 20 $64,325 $72,461 $68,393
2009 17 $56,912 $68,572 $62,742
2008 26 $58,423 $67,389 $62,906
46 t
o 5
0 2011 22 $61,065 $74,850 $67,957
2010 16 $58,422 $70,181 $64,301
2009 14 $61,536 $73,321 $67,429
2008 13 $54,527 $66,313 $60,420
51 t
o 5
5 2011 2 $47,000 $55,500 $51,250
2010 5 $54,556 $79,074 $66,815
2009 3 $57,593 $86,457 $72,025
2008 6 $55,817 $74,483 $65,150
56 t
o 6
0 2011 1 $45,000 $60,000 $52,500
2010 1 $65,000 $95,000 $80,000
2009 3 $58,000 $83,167 $70,583
2008 5 $57,380 $71,280 $64,330
61 o
r
above
2011 2 $87,500 $92,000 $89,750
2010 4 $65,000 $68,000 $66,500
2009 7 $65,714 $85,286 $75,500
2008 3 $69,000 $71,667 $70,330
Question 82 by Question 75

Ap
pen
dix
B
B-2
1
LRW Faculty Salary by Additional Courses Taught
Yes No
If yes, when? If yes, type of course?
During
regular
academic
year
During
separate
summer
session
only
Upper-
level LRW
courses
only
Non-LRW
courses
Number
of
Responses
2011 96 17 87 8 14 81
Overall
Average
Salary
2011 $74,812 $67,906 $75,933 $58,844 $68,250 $76,036
Average Low Salary
2011 $66,350 $66,024 $67,478 $54,375 $60,357 $67,526
2010 $64,617 $64,750 $65,703 $51,429 $57,318 $65,678
2009 $63,191 $63,654 $64,213 $54,283 $63,151 $63,553
2008 $60,601 $58,500 $60,923 $59,786 $57,550 $60,907
Average High Salary
2011 $83,274 $69,788 $84,388 $63,313 $76,143 $85,547
2010 $79,905 $69,749 $81,697 $58,143 $68,964 $81,659
2009 $79,178 $72,854 $80,763 $62,567 $80,199 $75,974
2008 $75,241 $62,580 $76,493 $68,500 $67,200 $75,756
* Schools indicating BOTH during the year and during the summer only were counted as
during the year for this chart.
Question 75 by Question 85

Ap
pen
dix
B
B-2
2
Faculty Salary by Scholarship Expectation
Required to
Produce
Scholarship
Expected to
Produce
Scholarship
Encouraged to
Produce
Scholarship *
Neither Required
Nor Expected to
Produce
Scholarship
N Avg. Salary N Avg. Salary N Avg. Salary N Avg. Salary
Overall
Average
Salary 2011
28
$87,215
35
$83,382
77
$75,921
*
*
Average Low
Salary 2011 $76,219 $72,777 $67,470 *
Average High
Salary 2011 $98,211 $93,986 $84,371 *
2010 avg. low 25
$76,578 34
$72,491 76
$66,193 *
*
2010 avg. high $98,873 $92,755 $81,652 *
2009 avg. low 21
$73,271 11
$72,473 66
$64,465 *
*
2009 avg. high $99,524 $94,502 $82,002 *
2008 avg. low 21
$67,643 10
$65,100 N/A
N/A 63
$55,876
2008 avg. high $85,458 $76,600 N/A $66,975
* Question reworded for 2008 and following years.
Faculty Salary by Committee Service
Serve as a voting
member
Serve as a non-voting
member
Do not serve
N Avg. Salary N Avg. Salary N Avg. Salary
Overall Average
Salary 2011
91
$76,195
8
$60,894
14
$65,393
Average Low
Salary 2011 $67,952 $58,050 $60,286
Average High
Salary 2011 $84,437 $63,738 $70,500
2010 avg. low 90
$66,436 4
$50,375 20
$59,425
2010 avg. high $81,614 $57,750 $65,474
2009 avg. low 80
$64,987 4
$53,875 16
$57,063
2009 avg. high $81,386 $63,525 $64,938
2008 avg. low 90
$61,373 3
$52,833 21
$55,900
2008 avg. high $75,729 $64,333 $60,924

Ap
pen
dix
C
C-1
Appendix C
Participation by School
Law Schools that responded in time for 2011 Survey Report (188
total)
Note: The first response was received February 28, 2011, and after
extensions of the original deadline for completing the survey, the final
response was received April 7, 2011.
1. Albany Law School
2. Appalachian School of Law
3. Atlanta’s John Marshall Law School
4. Ave Maria School of Law
5. Barry University School of Law
6. Baylor Law School
7. Benjamin N. Cardozo School of Law – Yeshiva University
8. Boston College Law School
9. Boston University School of Law
10. Boyd School of Law, UNLV
11. Brigham Young University Law School
12. Brooklyn Law School
13. California Western School of Law
14. Capital University Law School
15. Case Western Reserve University School of Law
16. Catholic University of America, Columbus School of Law
17. Chapman University School of Law
18. Charleston School of Law
19. Chicago-Kent College of Law, Illinois Institute of Technology
20. Cleveland-Marshall College of Law
21. Columbia Law School
22. Cornell University Law School
23. CUNY School of Law
24. DePaul University College of Law
25. Drake University Law School
26. Duke University School of Law
27. Duquesne University School of Law
28. Earle Mack School of Law at Drexel University
29. Elon University School of Law
30. Emory University School of Law
31. Faulkner University, Thomas Goode Jones School of Law
32. Florida A&M University College of Law
33. Florida Coastal School of Law

Ap
pen
dix
C
C-2
34. Florida International University College of Law
35. Florida State University College of Law
36. Fordham University School of Law
37. George Mason University School of Law
38. George Washington University Law School
39. Georgetown University Law Center
40. Georgia State University College of Law
41. Golden Gate University School of Law
42. Gonzaga University School of Law
43. Hamline University School of Law
44. Harvard Law School
45. Hofstra Law School
46. Howard University School of Law
47. Indiana University Maurer School of Law
48. Indiana University School of Law – Indianapolis
49. John Marshall Law School
50. Lewis and Clark Law School
51. Liberty University School of Law
52. Louisiana State University Law Center
53. Loyola Law School, Los Angeles
54. Loyola University Chicago School of Law
55. Loyola University New Orleans College of Law
56. Marquette University Law School
57. Massachusetts School of Law at Andover
58. Mercer University Walter F. George School of Law
59. Michigan State University College of Law
60. Mississippi College School of Law
61. New England School of Law
62. New York Law School
63. NKU Salmon P. Chase College of Law
64. Norman Adrian Wiggins School of Law at Campbell University
65. North Carolina Central University School of Law
66. Northeastern University School of Law
67. Northern Illinois University College of Law
68. Northwestern University School of Law
69. University of Notre Dame Law School
70. Nova Southeastern University Shepard Broad Law Center
71. New York University School of Law
72. Ohio State University Moritz College of Law
73. Oklahoma City University School of Law
74. Pace Law School
75. Pacific McGeorge School of Law
76. Penn State Dickinson School of Law
77. Pepperdine University School of Law
78. Phoenix School of Law
79. Quinnipiac University School of Law
80. Regent University School of Law
81. Roger Williams University School of Law
82. Rutgers School of Law – Camden

Ap
pen
dix
C
C-3
83. Rutgers School of Law – Newark
84. S.J. Quinney College of Law – University of Utah
85. Samford University – Cumberland School of Law
86. Sandra Day O’Connor College of Law, Arizona State University
87. Santa Clara Law
88. Seattle University School of Law
89. Seton Hall University School of Law
90. South Texas College of Law
91. Southern Illinois University School of Law
92. Southern University Law Center
93. Southwestern Law School
94. St. John’s University School of Law
95. St. Louis University School of Law
96. St. Mary’s University School of Law
97. St. Thomas University School of Law (Miami)
98. Stanford Law School
99. Stetson University College of Law
100. Suffolk University Law School
101. Syracuse University College of Law
102. Temple University Beasley School of Law
103. Texas Southern University Thurgood Marshall School of Law
104. Texas Tech University School of Law
105. Texas Wesleyan School of Law
106. Thomas M. Cooley Law School
107. Touro College Jacob D. Fuchsberg Law Center
108. Tulane University Law School
109. UCLA School of Law
110. University at Buffalo Law School (SUNY)
111. University of Akron
112. University of Alabama School of Law
113. University of Arizona James E. Rogers College of Law
114. University of Arkansas
115. University of Arkansas at Little Rock, William H. Bowen School of Law
116. University of Baltimore School of Law
117. University of California, Davis, School of Law
118. University of California, Berkeley School of Law
119. University of California, Hastings College of the Law
120. University of Chicago Law School
121. University of Cincinnati College of Law
122. University of Connecticut School of Law
123. University of Dayton School of Law
124. University of Denver Sturm College of Law
125. University of Detroit Mercy School of Law
126. University of Florida Levin College of Law
127. University of Georgia School of Law
128. University of Idaho College of Law
129. University of Illinois College of Law
130. University of Iowa College of Law
131. University of Kansas School of Law

Ap
pen
dix
C
C-4
132. University of Kentucky College of Law
133. University of La Verne College of Law
134. University of Louisville, Louis D. Brandeis School of Law
135. University of Maine School of Law
136. University of Maryland School of Law
137. University of Massachusetts School of Law – Dartmouth
138. University of Memphis Cecil C. Humphreys School of Law
139. University of Miami School of Law
140. University of Michigan Law School
141. University of Minnesota Law School
142. University of Mississippi School of Law
143. University of Missouri School of Law
144. University of Missouri – Kansas City School of Law
145. University of Nebraska College of Law
146. University of New Mexico School of Law
147. University of North Carolina School of Law
148. University of North Dakota School of Law
149. University of Oklahoma College of Law
150. University of Oregon School of Law
151. University of Pennsylvania Law School
152. University of Pittsburgh School of Law
153. University of Richmond School of Law
154. University of San Diego School of Law
155. University of San Francisco School of Law
156. University of South Carolina School of Law
157. University of South Dakota School of Law
158. University of Southern California Gould School of Law
159. University of St. Thomas School of Law – Minnesota
160. University of Tennessee College of Law
161. University of Texas School of Law
162. University of Toledo College of Law
163. University of Tulsa College of Law
164. University of Virginia School of Law
165. University of Washington School of Law
166. University of Windsor Law
167. University of Wisconsin Law School
168. University of Wyoming College of Law
169. Valparaiso University School of Law
170. Vanderbilt University Law School
171. Vermont Law School
172. Villanova University School of Law
173. Wake Forest University School of Law
174. Washburn University School of Law
175. Washington & Lee University School of Law
176. Washington College of Law, American University
177. Washington University in St. Louis School of Law
178. Wayne State University Law School
179. West Virginia University College of Law
180. Western New England College School of Law

C
-5
181. Western State University College of Law
182. Whittier Law School
183. Widener University School of Law, Harrisburg
184. Widener University School of Law, Wilmington
185. Willamette University College of Law
186. William & Mary Law School
187. William Mitchell College of Law
188. Yale Law School