
Associating the Value of Automation with Project Funding
25
Associating The Value of Automation With Project Funding Associating The Value of Automation With Project Funding Dave Woll Vice President ARC Advisory Group [email protected]
-
Upload
arc-advisory-group -
Category
Technology
-
view
385 -
download
0
Transcript of Associating the Value of Automation with Project Funding
Associating The Value of Automation With Project Funding
Associating The Value of Automation With Project Fundingj gj g
Dave WollVice President
ARC Advisory Groupy [email protected]
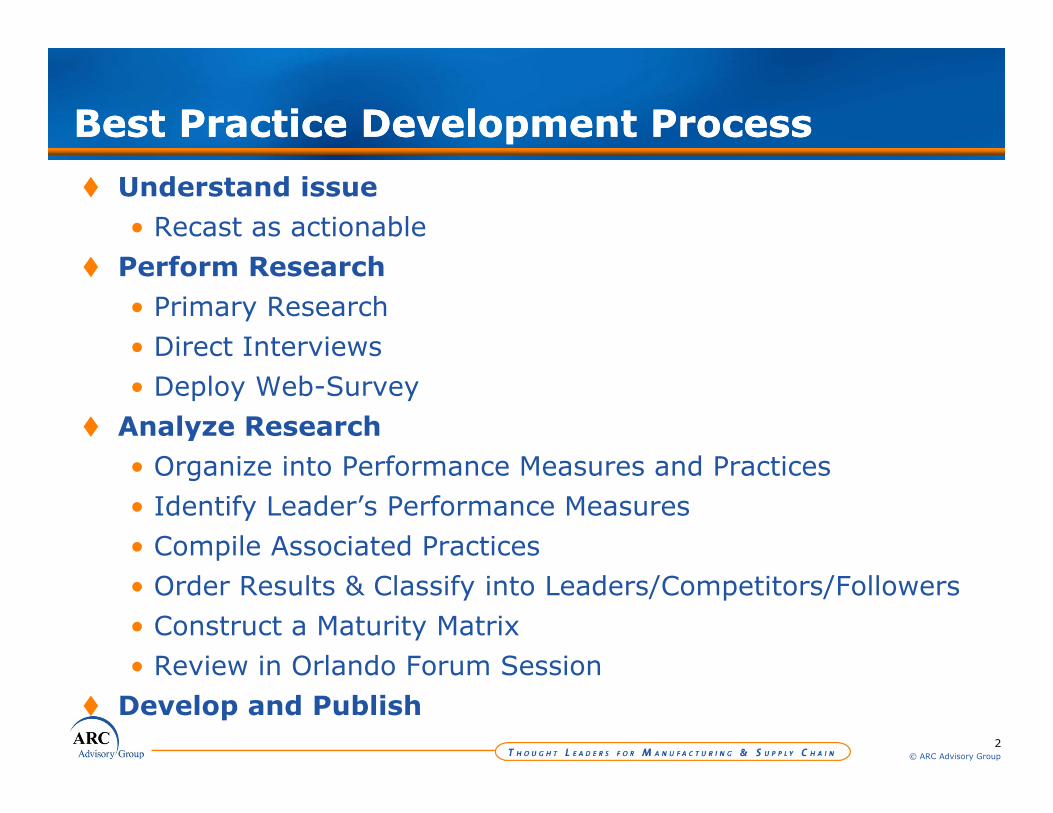
Best Practice Development ProcessBest Practice Development Process
Understand issue• Recast as actionable
Perform Research• Primary Research• Direct InterviewsDirect Interviews• Deploy Web-Survey
Analyze ResearchO i i t P f M d P ti• Organize into Performance Measures and Practices
• Identify Leader’s Performance Measures • Compile Associated Practicesp• Order Results & Classify into Leaders/Competitors/Followers• Construct a Maturity Matrix• Review in Orlando Forum Session
2© ARC Advisory Group
• Review in Orlando Forum SessionDevelop and Publish
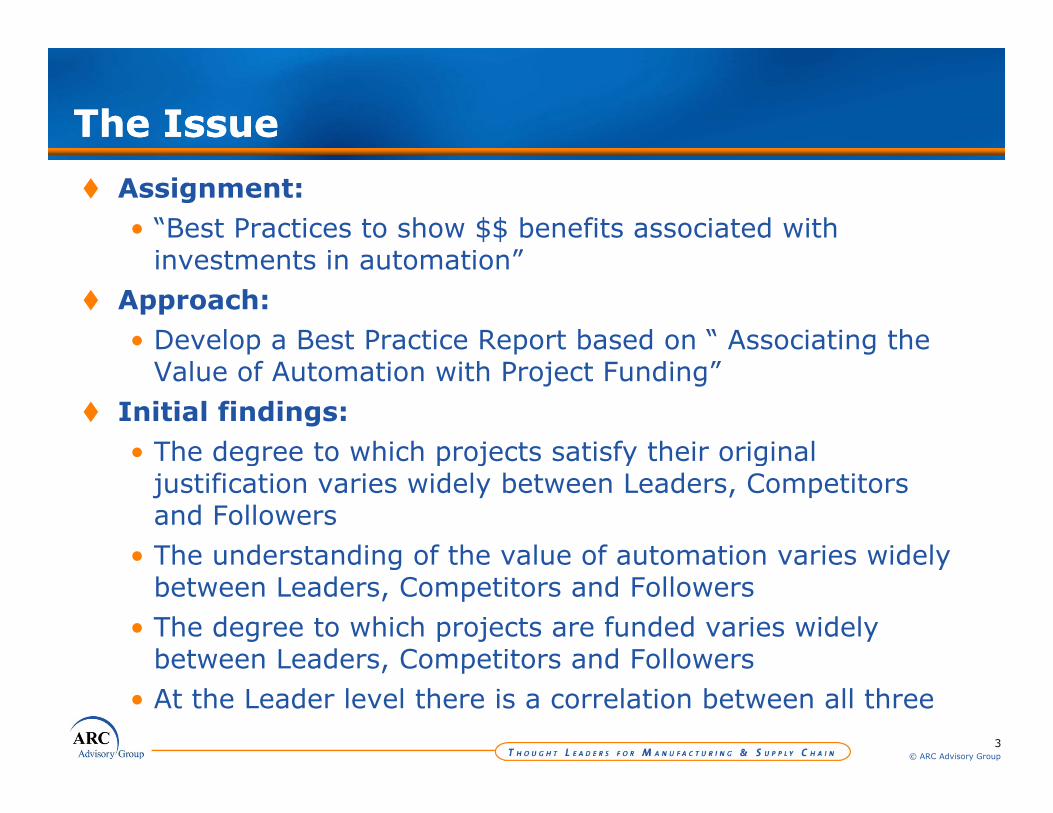
The IssueThe Issue
Assignment:• “Best Practices to show $$ benefits associated with
i t t i t ti ”investments in automation”Approach:• Develop a Best Practice Report based on “ Associating the
Value of Automation with Project Funding”Initial findings:• The degree to which projects satisfy their originalThe degree to which projects satisfy their original
justification varies widely between Leaders, Competitors and Followers
• The understanding of the value of automation varies widely• The understanding of the value of automation varies widely between Leaders, Competitors and Followers
• The degree to which projects are funded varies widely between Leaders Competitors and Followers
3© ARC Advisory Group
between Leaders, Competitors and Followers• At the Leader level there is a correlation between all three

Performance Analysis Projects Satisfying Initial JustificationPerformance Analysis Projects Satisfying Initial Justification
Leaders21% - 40%
41% - 60%Leaders are More Satisfied with Their Projects Competitors
61% - 80%
81% - 100%
Followers
0% 25 50 75 100
Followers
4© ARC Advisory Group
0% 25%
50%
75%
100%
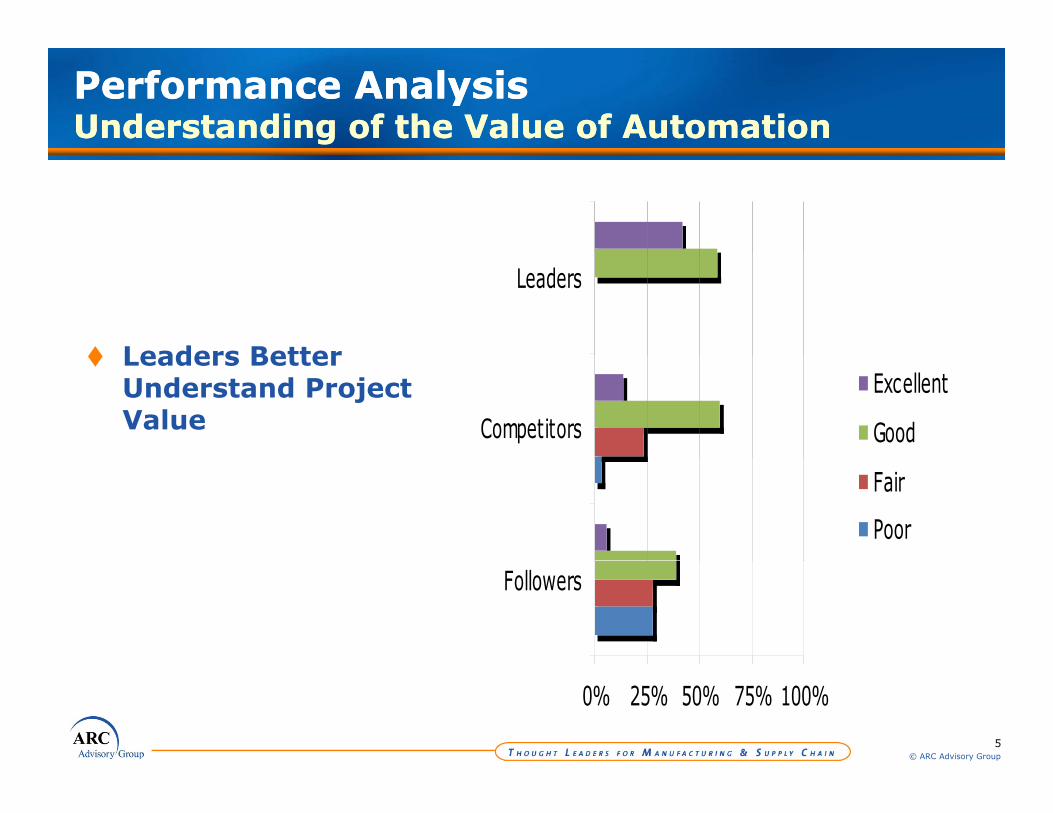
Performance Analysis Understanding of the Value of AutomationPerformance Analysis Understanding of the Value of Automation
Leaders Better
Leaders
Leaders Better Understand Project Value Competitors
Excellent
Good
Fair
Poor
Followers
5© ARC Advisory Group
0% 25% 50% 75% 100%

Performance Analysis Percentage of Projects FundedPerformance Analysis Percentage of Projects Funded
Leaders
0% - 20%
Leaders Get More Projects Funded
Competitors
0% - 20%
21% - 40%
41% - 60%
Followers
61% - 80%
81% - 100%
0% 25% 50% 75% 100
Followers
6© ARC Advisory Group
0% 25% 50% 75% 100%
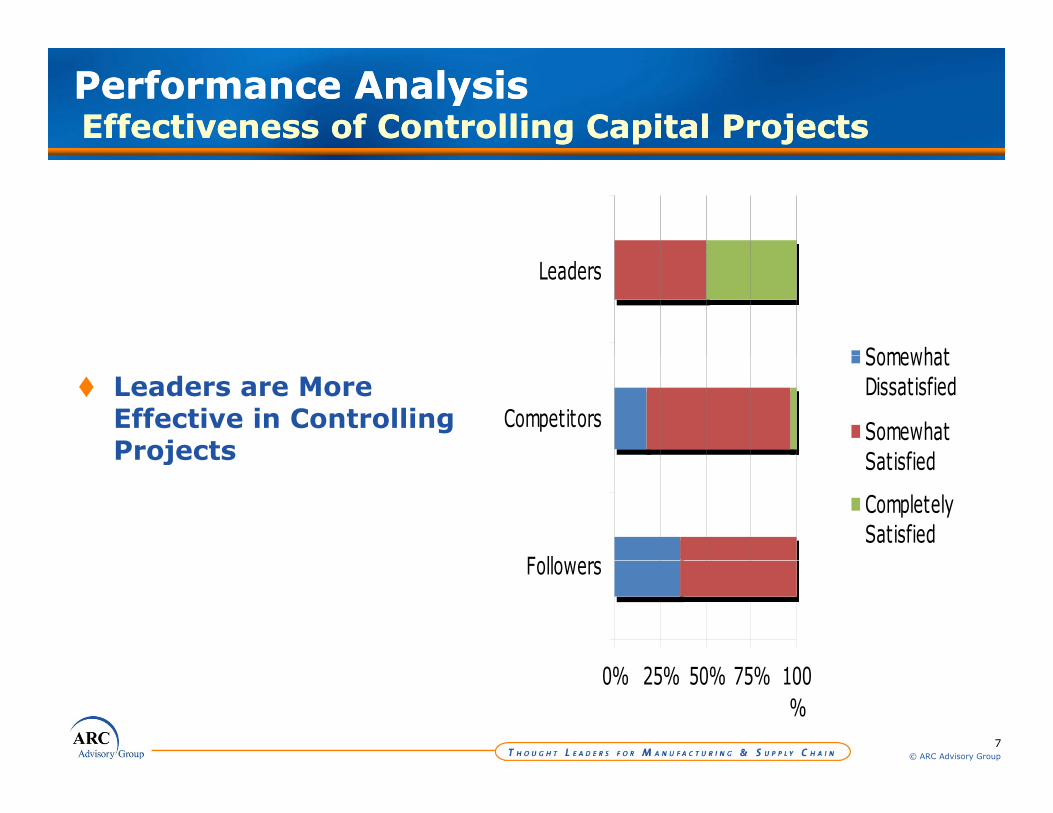
Performance Analysis Effectiveness of Controlling Capital ProjectsPerformance Analysis Effectiveness of Controlling Capital Projects
Leaders
SomewhatLeaders are More Effective in Controlling Projects
Competitors
SomewhatDissatisfied
SomewhatSatisfiedProjects
F ll
Satisfied
CompletelySatisfied
Followers
7© ARC Advisory Group
0% 25% 50% 75% 100%

Performance Analysis Predictability of Original Cost & SchedulePerformance Analysis Predictability of Original Cost & Schedule
d
Leaders are Better Able to Predict Project
Leaders
Able to Predict Project Costs & Schedule
Competitors
Excellent
Good
F ll
Fair
Poor
Followers
8© ARC Advisory Group
0% 25% 50% 75% 100%

Performance Analysis Safety RecordPerformance Analysis Safety Record
Leaders
Projects Following
Competitors Good
E ll t
j gLeaders’ Best Practices have a Superior Safety Record
Followers
Excellent
Followers
9© ARC Advisory Group
0% 25% 50% 75% 100%
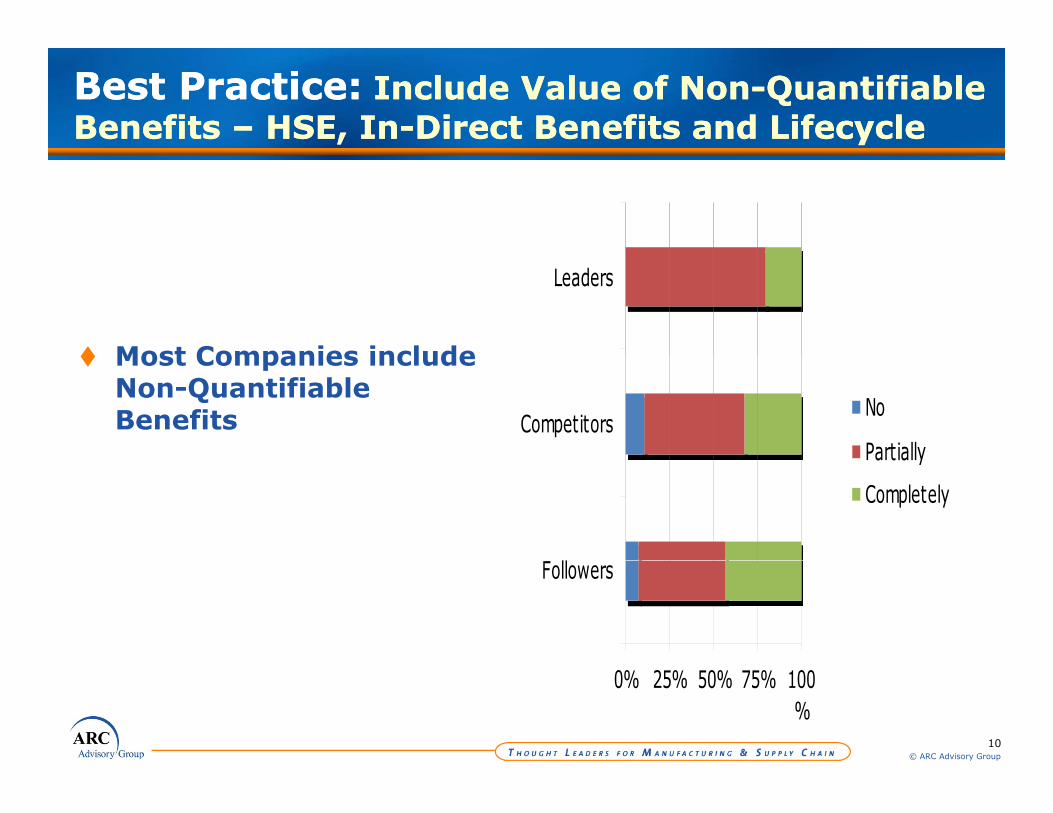
Best Practice: Include Value of Non-Quantifiable Benefits – HSE, In-Direct Benefits and LifecycleBest Practice: Include Value of Non-Quantifiable Benefits – HSE, In-Direct Benefits and Lifecycle
Most Companies include
Leaders
Most Companies include Non-Quantifiable Benefits Competitors
No
Partially
ll
Partially
Completely
Followers
10© ARC Advisory Group
0% 25% 50% 75% 100%

Best Practice: Include Lifecycle ValueBest Practice: Include Lifecycle Value
Leaders
Most Companies now include Lifecycle Value Competitors
Other
NoNo
Yes
Followers
11© ARC Advisory Group
0% 25% 50% 75% 100%
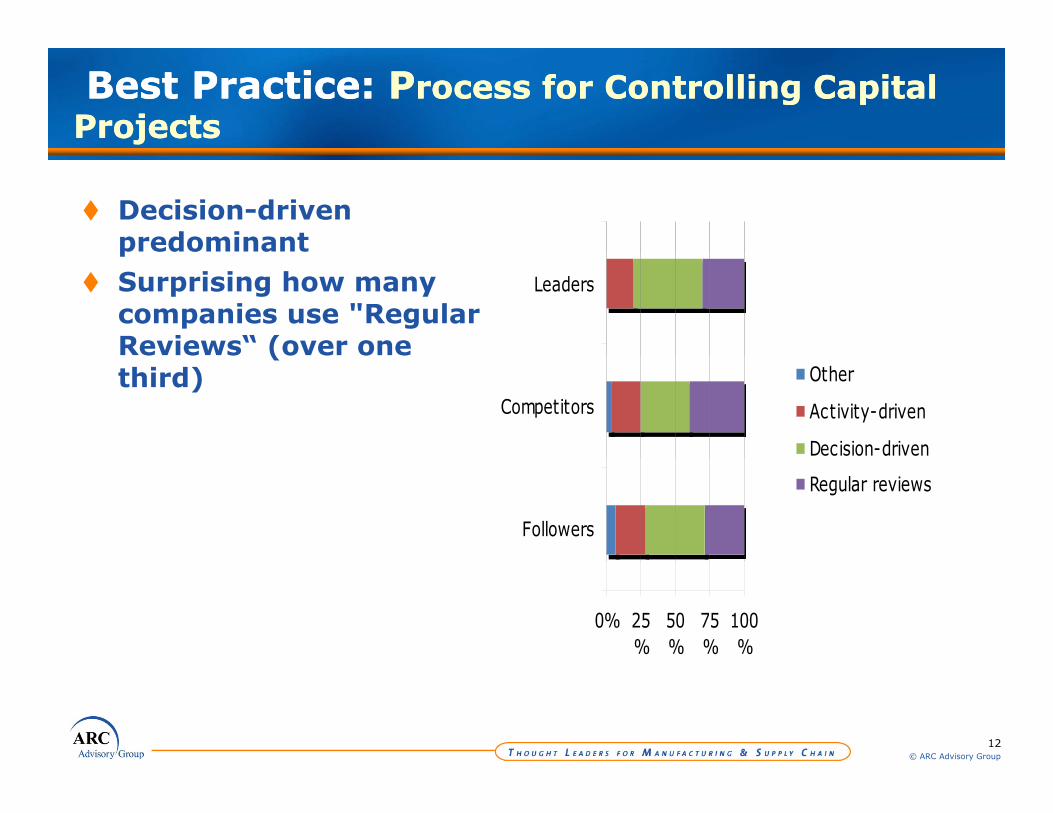
Best Practice: Process for Controlling Capital ProjectsBest Practice: Process for Controlling Capital
Projects
Decision-driven predominantpSurprising how many companies use "Regular Reviews“ (over one
Leaders
e e s (o e o ethird)
Competitors
Other
Activity-driven
Decision-driven
Followers
Regular reviews
0% 25%
50%
75%
100%
12© ARC Advisory Group
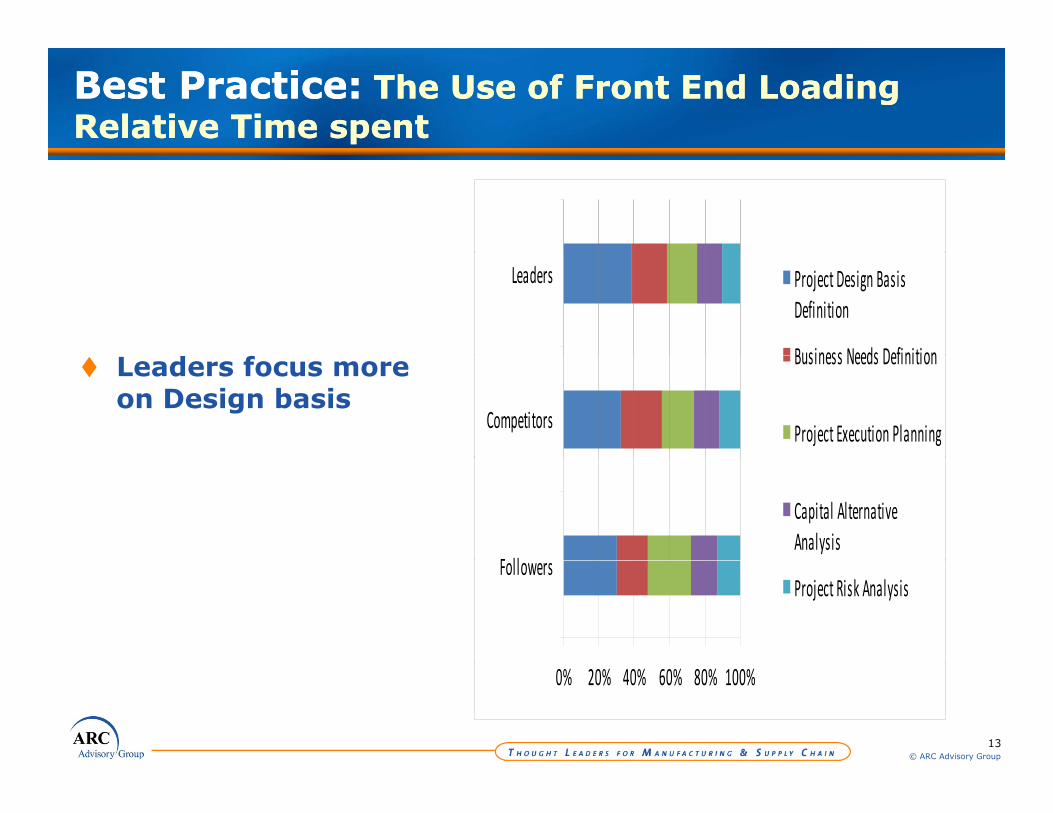
Best Practice: The Use of Front End Loading Relative Time spentBest Practice: The Use of Front End Loading Relative Time spent
Leaders Project Design BasisDefinition
Business Needs DefinitionLeaders focus more on Design basis
Competitors
Business Needs Definition
Project Execution Planning
F ll
Capital AlternativeAnalysis
FollowersProject Risk Analysis
13© ARC Advisory Group
0% 20% 40% 60% 80% 100%
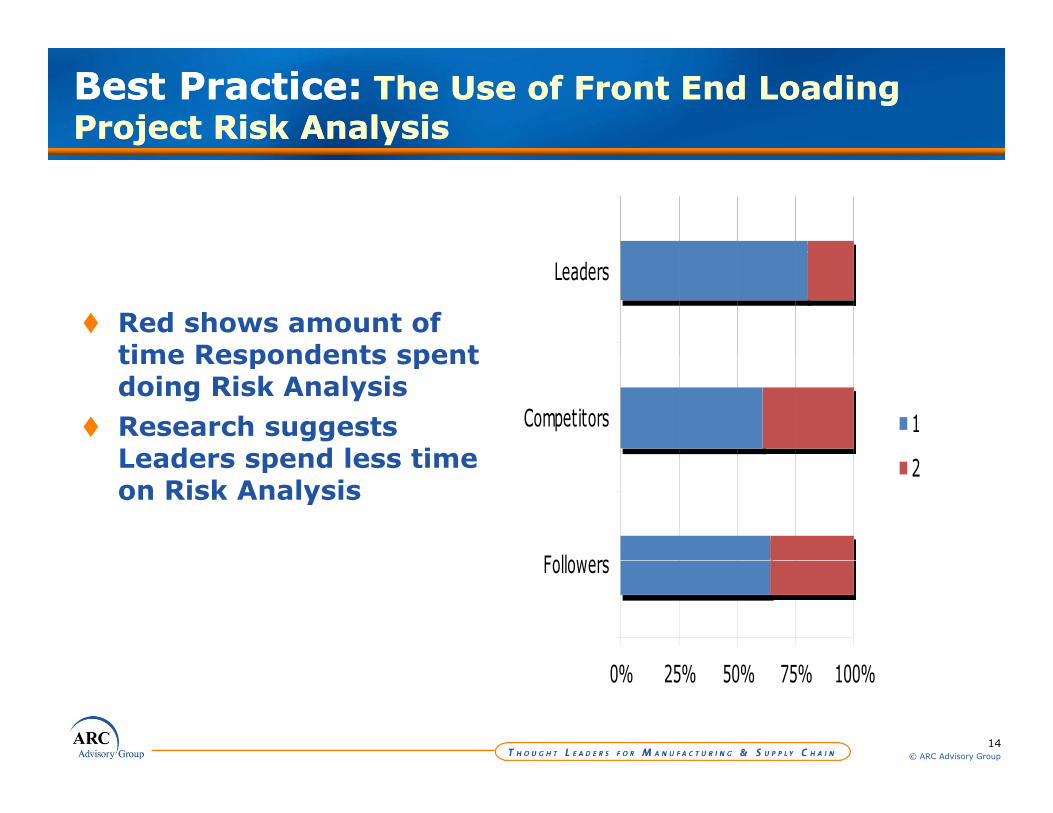
Best Practice: The Use of Front End Loading Project Risk AnalysisBest Practice: The Use of Front End Loading Project Risk Analysis
Red shows amount of time Respondents spent
Leaders
time Respondents spent doing Risk AnalysisResearch suggests Leaders spend less time
Competitors 1Leaders spend less time on Risk Analysis
Followers
2
Followers
14© ARC Advisory Group
0% 25% 50% 75% 100%
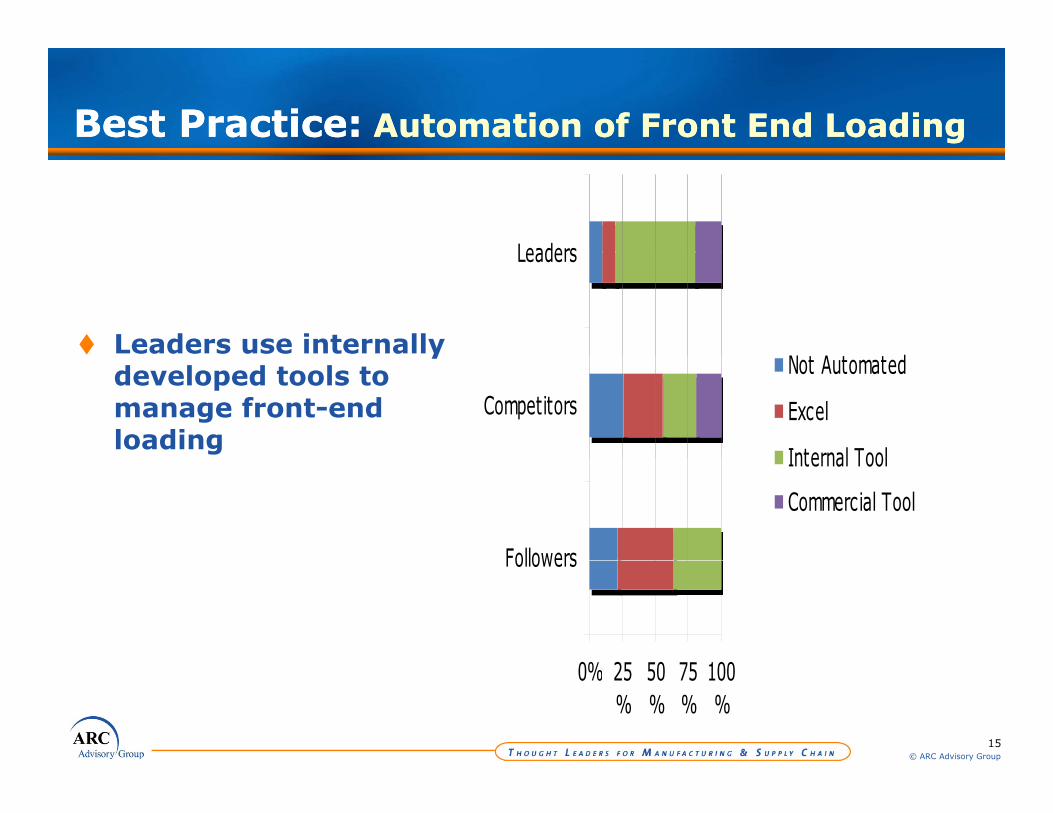
Best Practice: Automation of Front End LoadingBest Practice: Automation of Front End Loading
Leaders
Leaders use internally
Leaders
dy
developed tools to manage front-end loading
Competitors
Not Automated
Excel
Internal Tool
Followers
Internal Tool
Commercial Tool
0% 25 50 75 100
Followers
15© ARC Advisory Group
0% 25%
50%
75%
100%
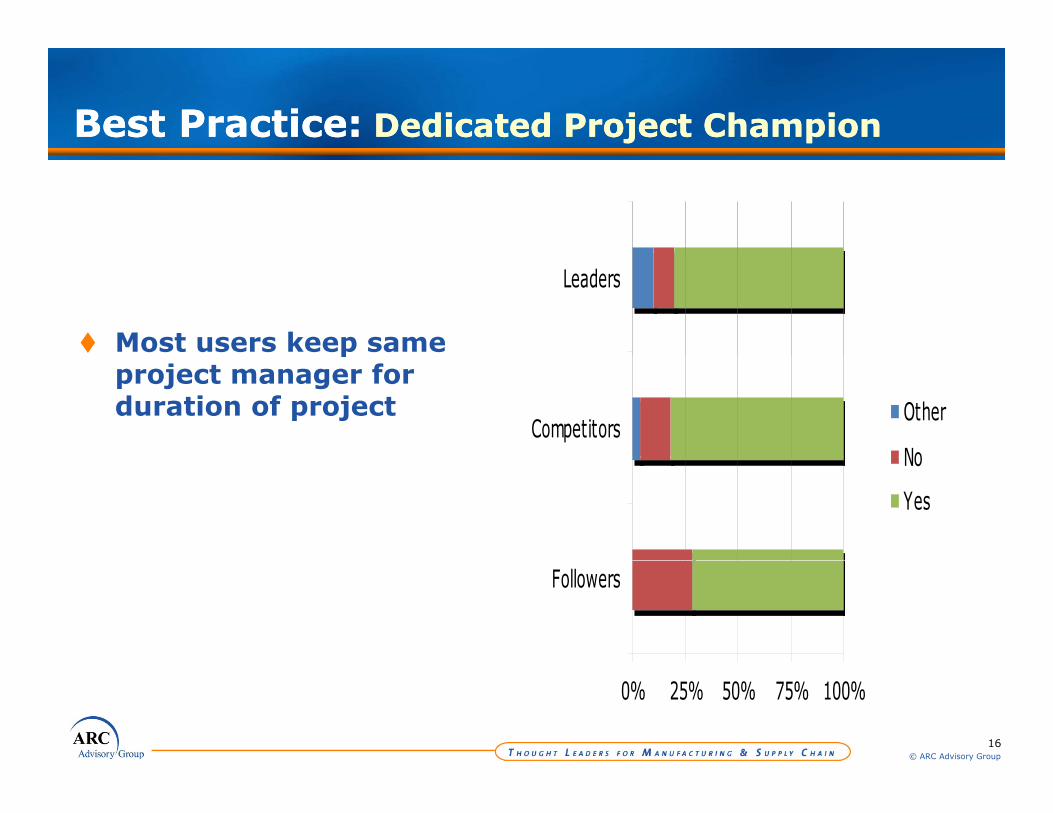
Best Practice: Dedicated Project ChampionBest Practice: Dedicated Project Champion
Most users keep same
Leaders
pproject manager for duration of project
CompetitorsOther
NoNo
Yes
Followers
16© ARC Advisory Group
0% 25% 50% 75% 100%
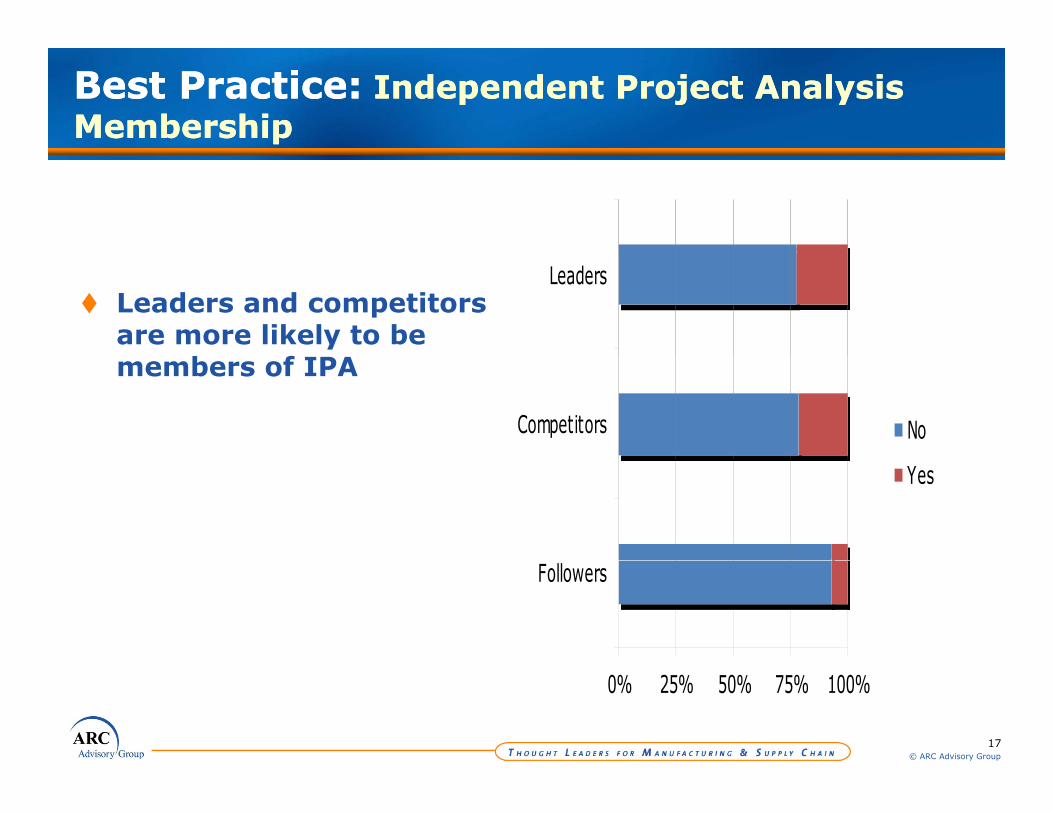
Best Practice: Independent Project Analysis MembershipBest Practice: Independent Project Analysis Membership
Leaders and competitors are more likely to be
Leaders
members of IPA
Competitors No
Yes
Followers
17© ARC Advisory Group
0% 25% 50% 75% 100%
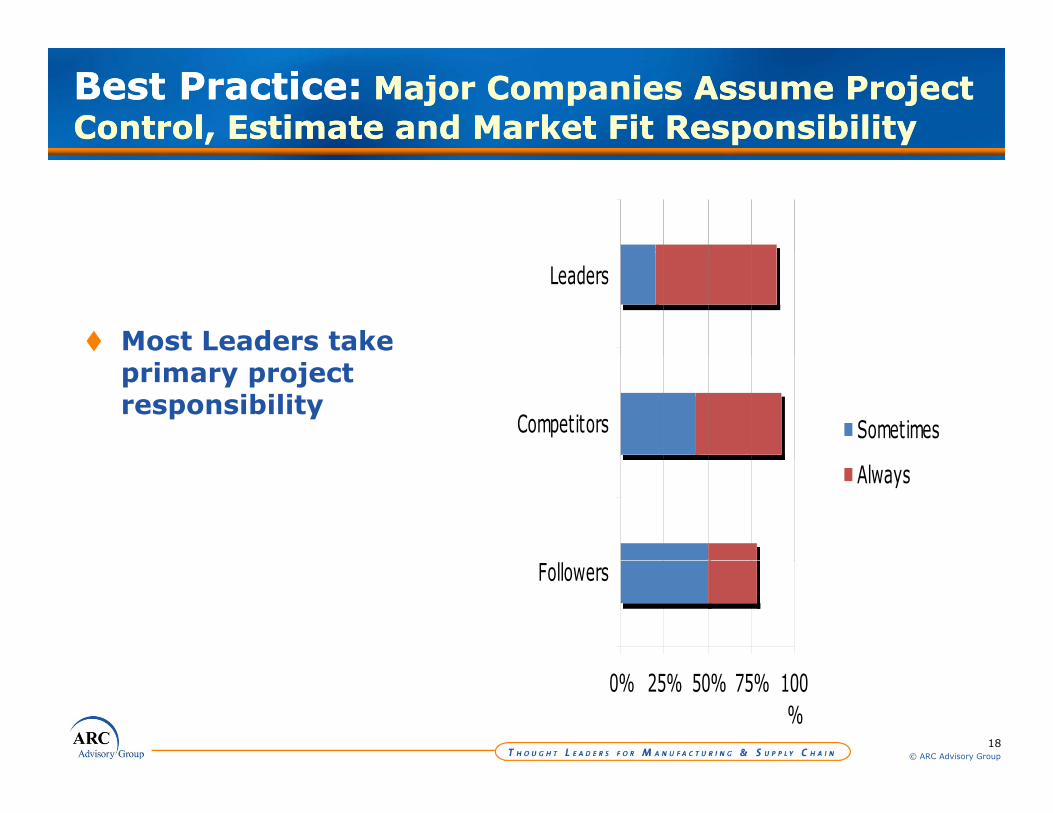
Best Practice: Major Companies Assume Project Control, Estimate and Market Fit ResponsibilityBest Practice: Major Companies Assume Project Control, Estimate and Market Fit Responsibility
Most Leaders take
Leaders
primary project responsibility
Competitors Sometimes
Always
Followers
18© ARC Advisory Group
0% 25% 50% 75% 100%
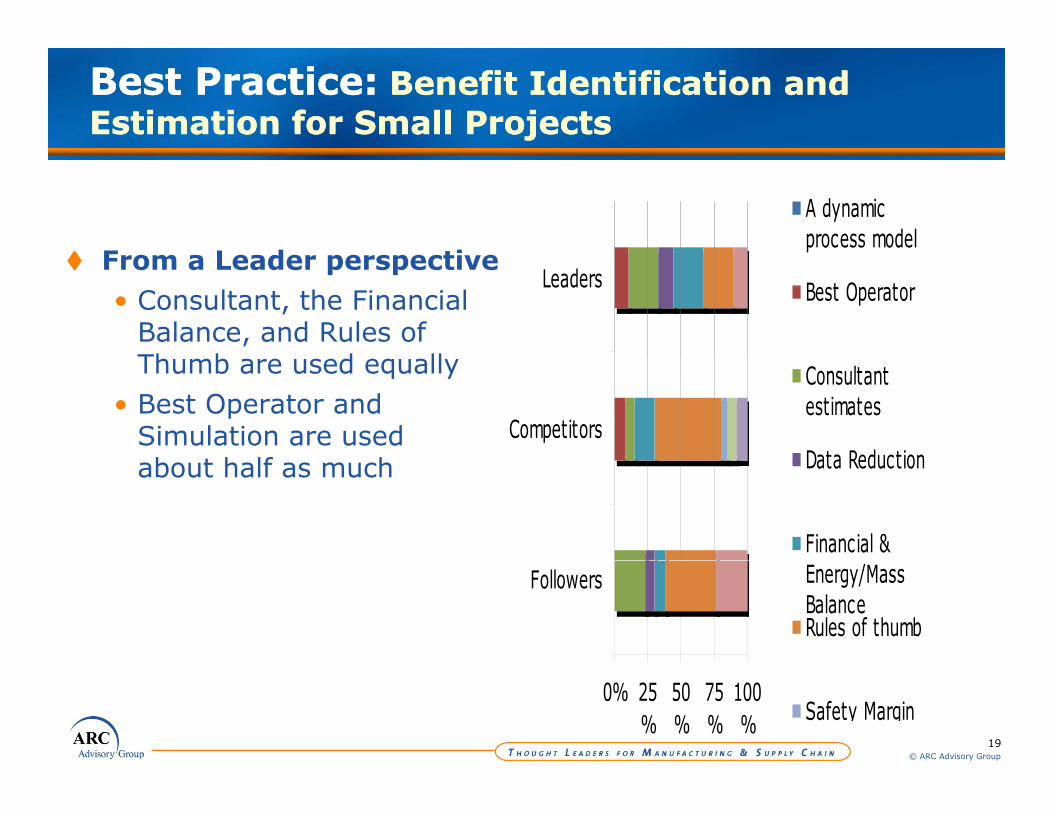
Best Practice: Benefit Identification and Estimation for Small ProjectsBest Practice: Benefit Identification and Estimation for Small Projects
F L d ti
A dynamicprocess model
From a Leader perspective• Consultant, the Financial
Balance, and Rules of Th b d ll
Leaders Best Operator
Thumb are used equally• Best Operator and
Simulation are used b h lf h
Competitors
Consultantestimates
Data Reductionabout half as much Data Reduction
Financial &Followers Energy/Mass
BalanceRules of thumb
19© ARC Advisory Group
0% 25%
50%
75%
100% Safety Margin

Best Practice: Benefit Identification and Estimation for Medium ProjectsBest Practice: Benefit Identification and Estimation for Medium Projects
A dynamicprocess model
From a Leader perspective:• Most use the Consultant
approach
Leaders
process model
Best Operator
approach• Rules of Thumb and
Simulation are used about one third as much
Competitors
Consultantestimates
Data Reductionone third as much
FollowersFinancial &Energy/Mass
0% 25 50 75 100
Followers gy/BalanceRules of thumb
20© ARC Advisory Group
0% 25%
50%
75%
100% Safety Margin
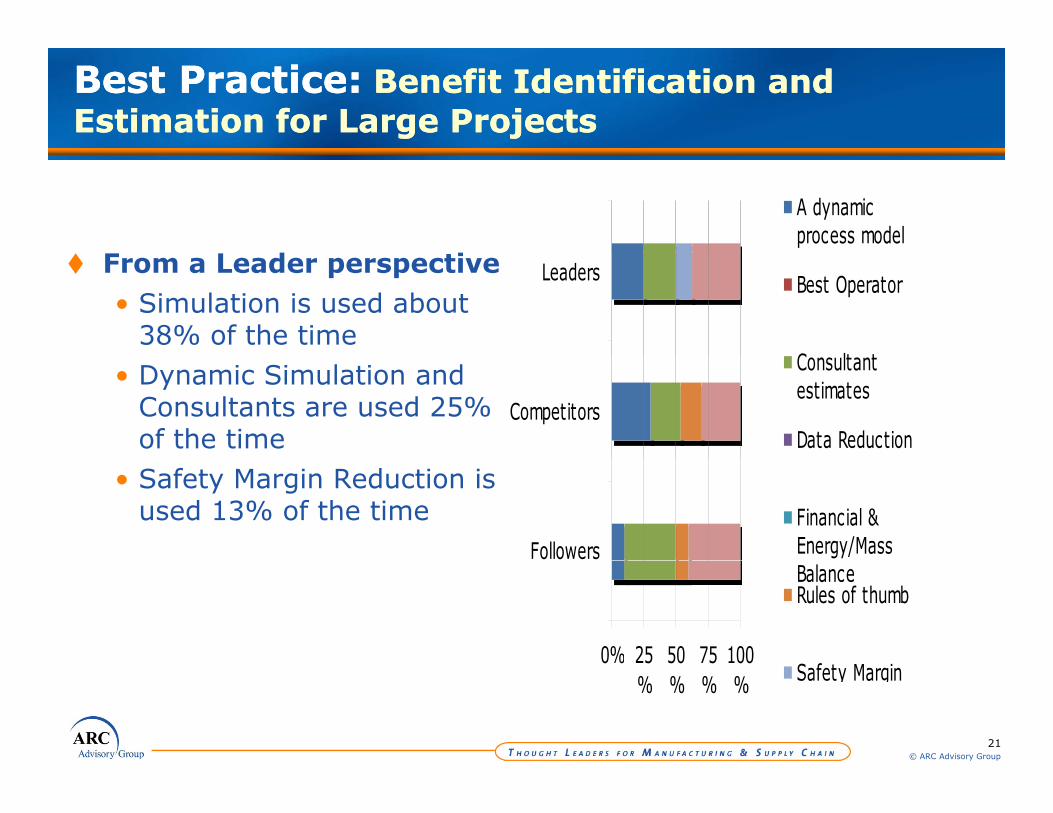
Best Practice: Benefit Identification and Estimation for Large ProjectsBest Practice: Benefit Identification and Estimation for Large Projects
d i
A dynamicprocess model
From a Leader perspective• Simulation is used about
38% of the time
Leaders Best Operator
C lt t• Dynamic Simulation and Consultants are used 25% of the time
Competitors
Consultantestimates
Data Reduction
• Safety Margin Reduction is used 13% of the time
FollowersFinancial &Energy/Mass
0% 25 50 75 100
BalanceRules of thumb
f
21© ARC Advisory Group
0% 5%
50%
5%
00% Safety Margin
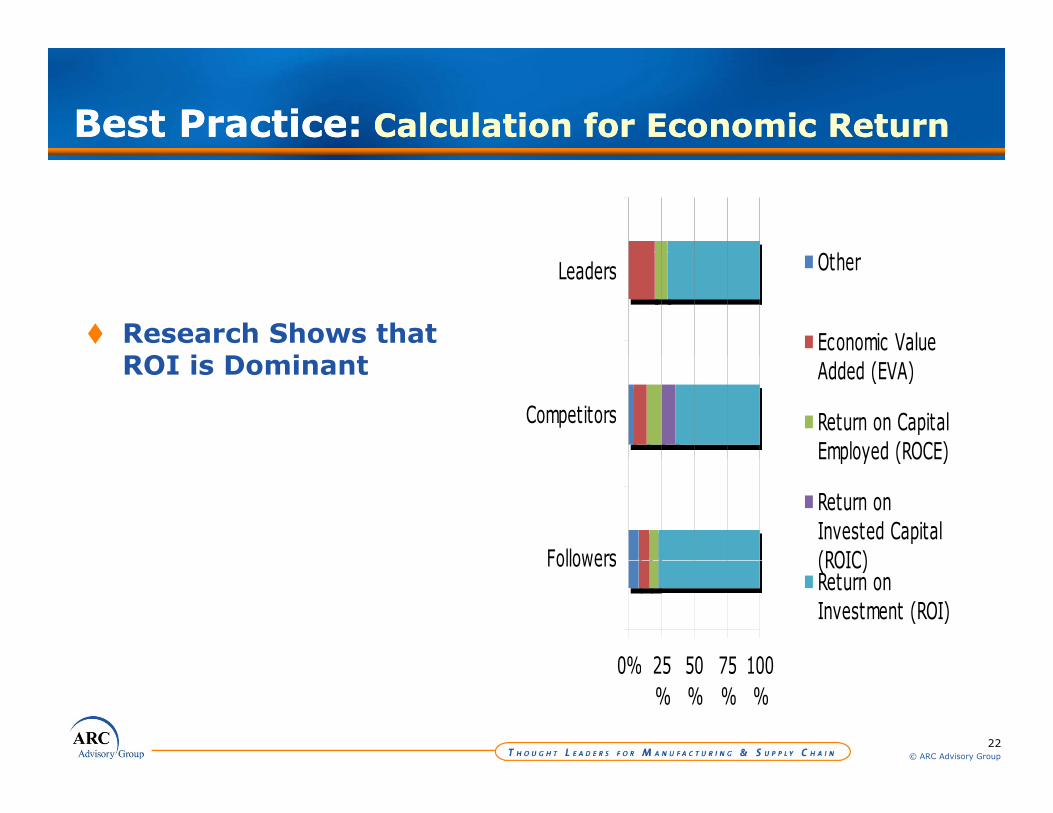
Best Practice: Calculation for Economic ReturnBest Practice: Calculation for Economic Return
O h
Research Shows that ROI i D i
Leaders Other
Economic ValueROI is Dominant
Competitors
Added (EVA)
Return on CapitalEmployed (ROCE)
Followers
Employed (ROCE)
Return onInvested Capital(ROIC)
0% 25 50 75 100
Followers (ROIC)Return onInvestment (ROI)
22© ARC Advisory Group
0% 25%
50%
75%
100%
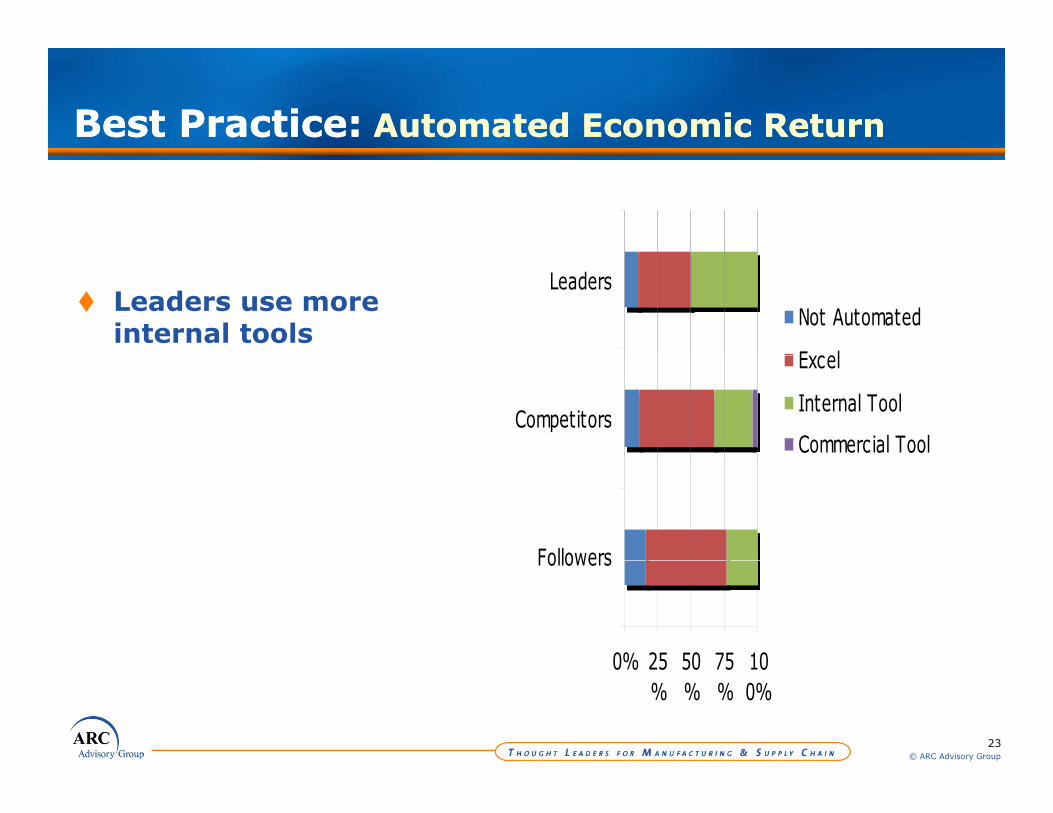
Best Practice: Automated Economic ReturnBest Practice: Automated Economic Return
Leaders use more internal tools
Leaders
Not Automated
E cel
Competitors
Excel
Internal Tool
Commercial Tool
Followers
0% 25 50 75 10
Followers
23© ARC Advisory Group
0% 25%
50%
75%
100%
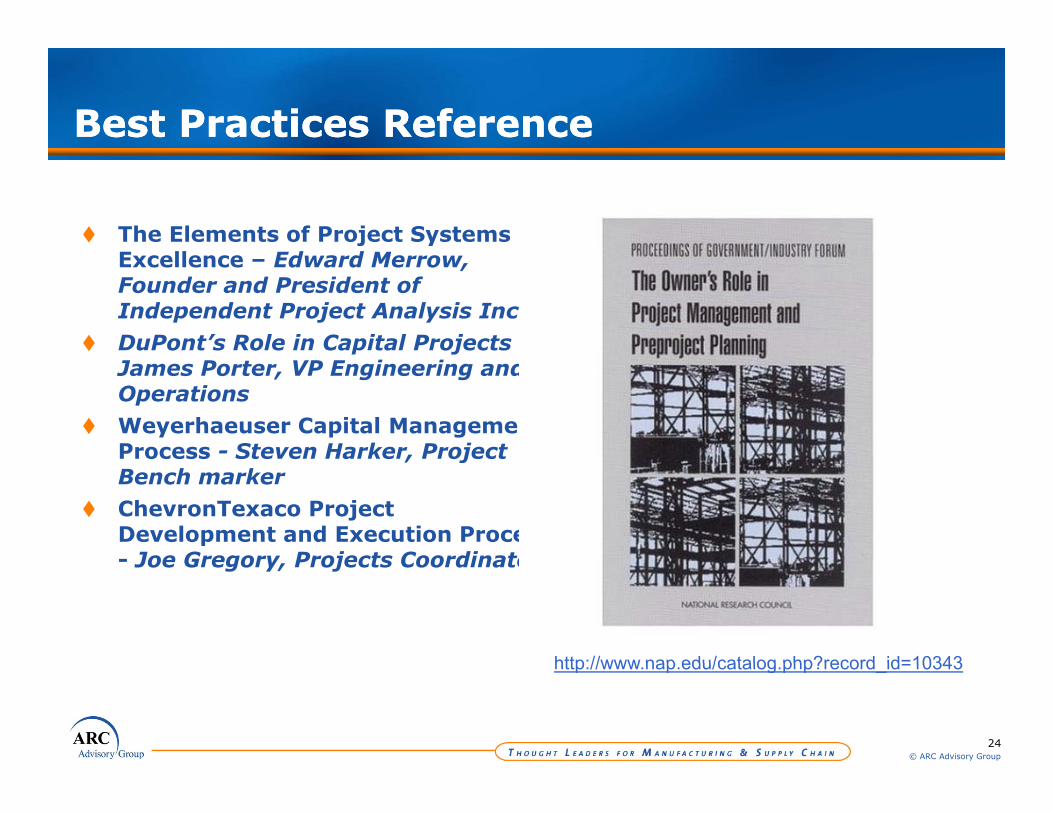
Best Practices ReferenceBest Practices Reference
The Elements of Project Systems E ll Ed d MExcellence – Edward Merrow, Founder and President of Independent Project Analysis Inc.DuPont’s Role in Capital Projects –James Porter, VP Engineering and OperationsWeyerhaeuser Capital Management Process - Steven Harker, ProjectProcess Steven Harker, Project Bench markerChevronTexaco Project Development and Execution Process - Joe Gregory Projects Coordinator- Joe Gregory, Projects Coordinator
http://www nap edu/catalog php?record id=10343
24© ARC Advisory Group
http://www.nap.edu/catalog.php?record_id=10343

Thank You.Thank You.For more information, contact the author at [email protected] or visit our web pages at
www arcweb com
25© ARC Advisory Group
www.arcweb.com