Assimilation of Satellite Derived Soil Moisture Profiles ...
20
Assimilation of Satellite Derived Soil Moisture Profiles Into a Crop Modeling System for Robust Yield Estimates Vikalp Mishra, W. Lee Ellenburg , James F. Cruise, John R. Mecikalski Drought Forum 2018
Transcript of Assimilation of Satellite Derived Soil Moisture Profiles ...
Assimilation of Satellite Derived Soil Moisture Profiles Into a Crop Modeling System for
Robust Yield Estimates
Vikalp Mishra, W. Lee Ellenburg, James F. Cruise, John R. Mecikalski
Drought Forum2018
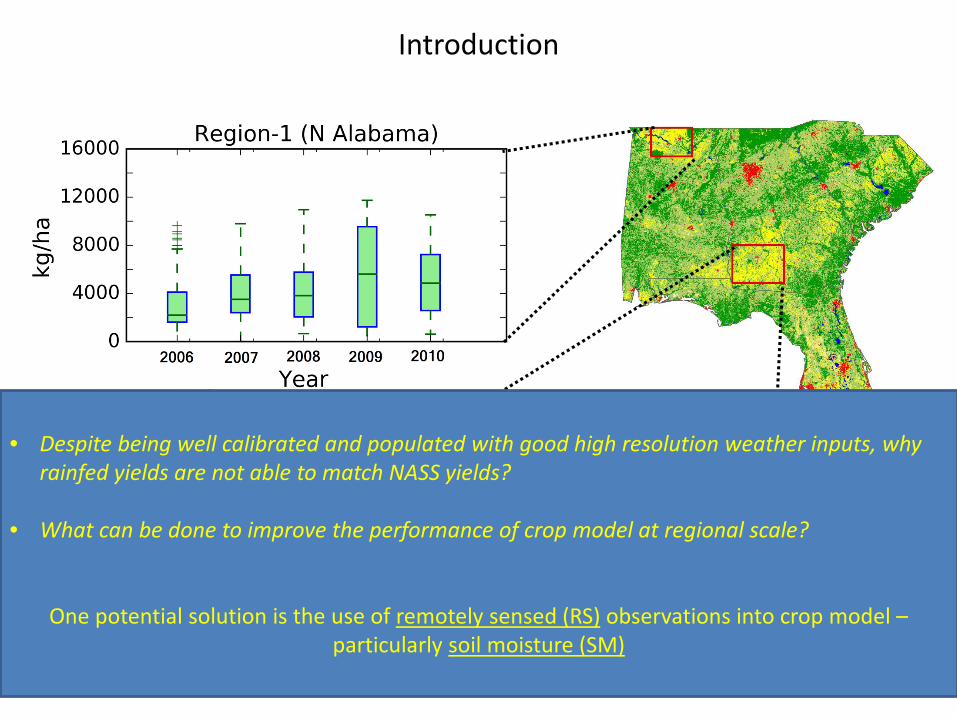
Introduction
NASSRainfed
Mean yield = 6767 kg/haMean yield = 3805 kg/ha
Mean yield = 10034 kg/haMean yield = 3899 kg/ha
Difference ≈ 44% (approx.)
Difference ≈ 61% (approx.) NASS – National Agricultural Statistics Services
• Despite being well calibrated and populated with good high resolution weather inputs, why rainfed yields are not able to match NASS yields?
• What can be done to improve the performance of crop model at regional scale?
One potential solution is the use of remotely sensed (RS) observations into crop model –particularly soil moisture (SM)
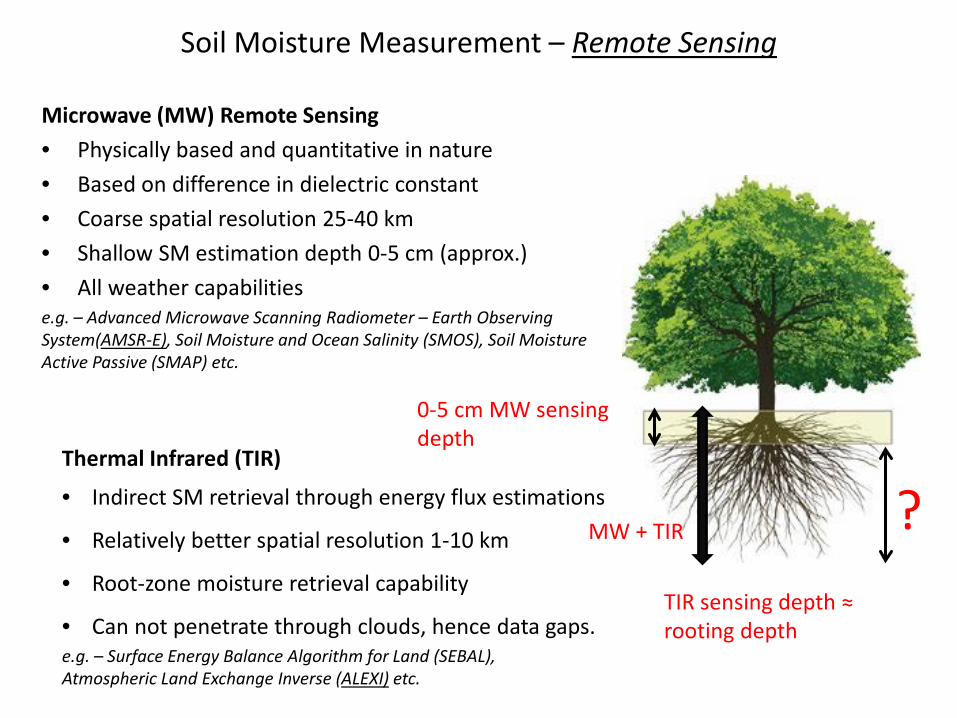
Soil Moisture Measurement – Remote Sensing
Microwave (MW) Remote Sensing• Physically based and quantitative in nature• Based on difference in dielectric constant• Coarse spatial resolution 25-40 km• Shallow SM estimation depth 0-5 cm (approx.)• All weather capabilitiese.g. – Advanced Microwave Scanning Radiometer – Earth Observing System(AMSR-E), Soil Moisture and Ocean Salinity (SMOS), Soil Moisture Active Passive (SMAP) etc.
0-5 cm MW sensingdepth
TIR sensing depth ≈ rooting depth
?Thermal Infrared (TIR)
• Indirect SM retrieval through energy flux estimations
• Relatively better spatial resolution 1-10 km
• Root-zone moisture retrieval capability
• Can not penetrate through clouds, hence data gaps. e.g. – Surface Energy Balance Algorithm for Land (SEBAL), Atmospheric Land Exchange Inverse (ALEXI) etc.
MW + TIR
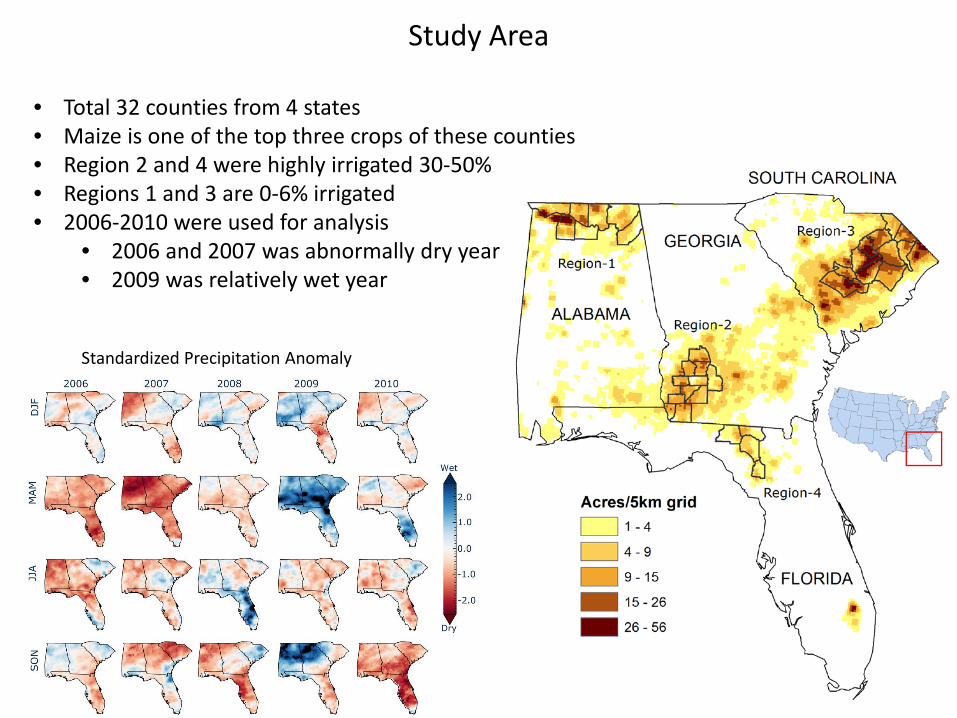
Study Area
• Total 32 counties from 4 states• Maize is one of the top three crops of these counties• Region 2 and 4 were highly irrigated 30-50% • Regions 1 and 3 are 0-6% irrigated • 2006-2010 were used for analysis
• 2006 and 2007 was abnormally dry year• 2009 was relatively wet year
Standardized Precipitation Anomaly
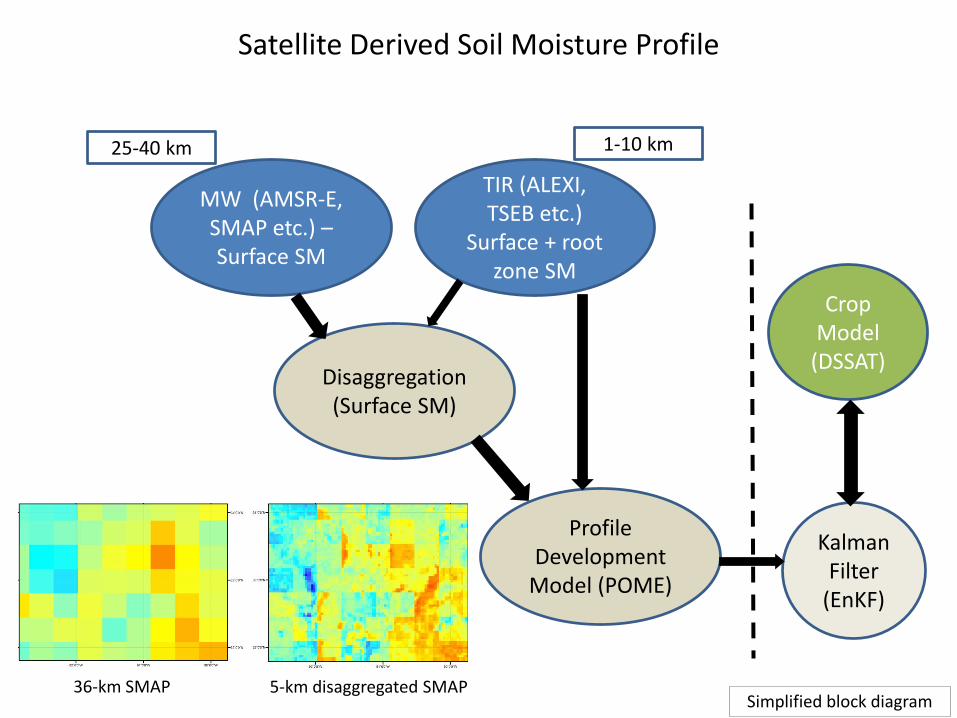
Satellite Derived Soil Moisture Profile
Disaggregation (Surface SM)
TIR (ALEXI, TSEB etc.)
Surface + root zone SM
MW (AMSR-E, SMAP etc.) –Surface SM
1-10 km25-40 km
Profile Development
Model (POME)
Crop Model
(DSSAT)
Kalman Filter
(EnKF)
Simplified block diagram36-km SMAP 5-km disaggregated SMAP
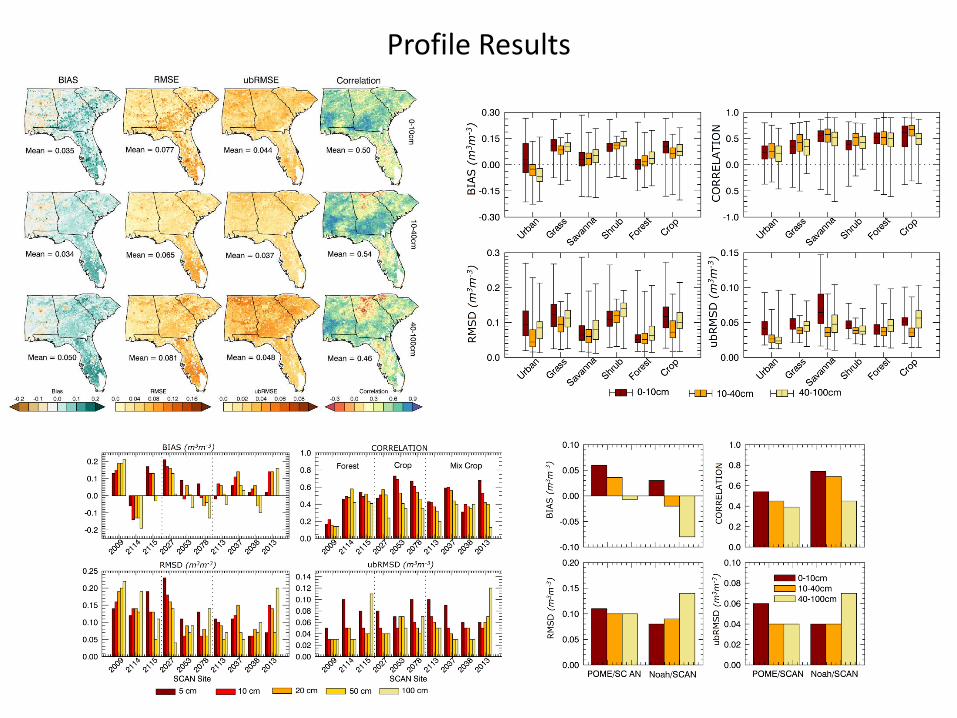
Profile Results
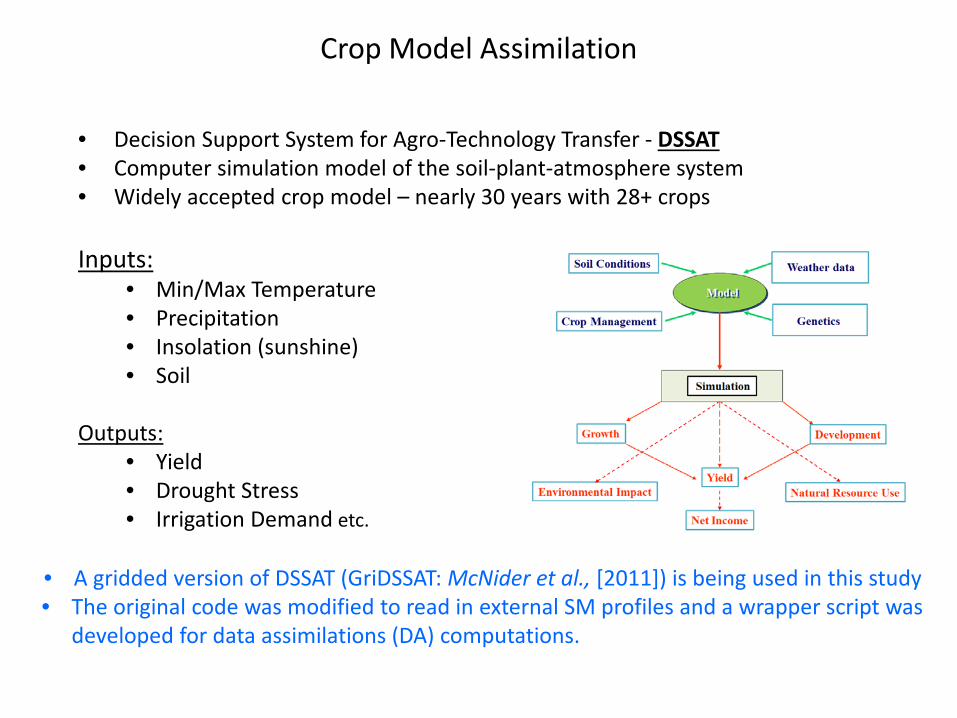
Crop Model Assimilation
• Decision Support System for Agro-Technology Transfer - DSSAT• Computer simulation model of the soil-plant-atmosphere system• Widely accepted crop model – nearly 30 years with 28+ crops
Inputs:• Min/Max Temperature• Precipitation• Insolation (sunshine)• Soil
Outputs:• Yield• Drought Stress• Irrigation Demand etc.
• A gridded version of DSSAT (GriDSSAT: McNider et al., [2011]) is being used in this study• The original code was modified to read in external SM profiles and a wrapper script was
developed for data assimilations (DA) computations.

GriDSSAT Simulations
Multiple GriDSSAT simulations will be made to assess the sensitivity of the satellite assisted model runs.
a) Model run with all the known inputs (the current official form of GriDSSAT from UAH) as test case - True Case (with optimal fertilization)
b) Simulations with rainfed and DA.
The yields will also be compared at the county level with National Agricultural Statistics services (NASS) reported yields.
RS SMProfiles
EnKF
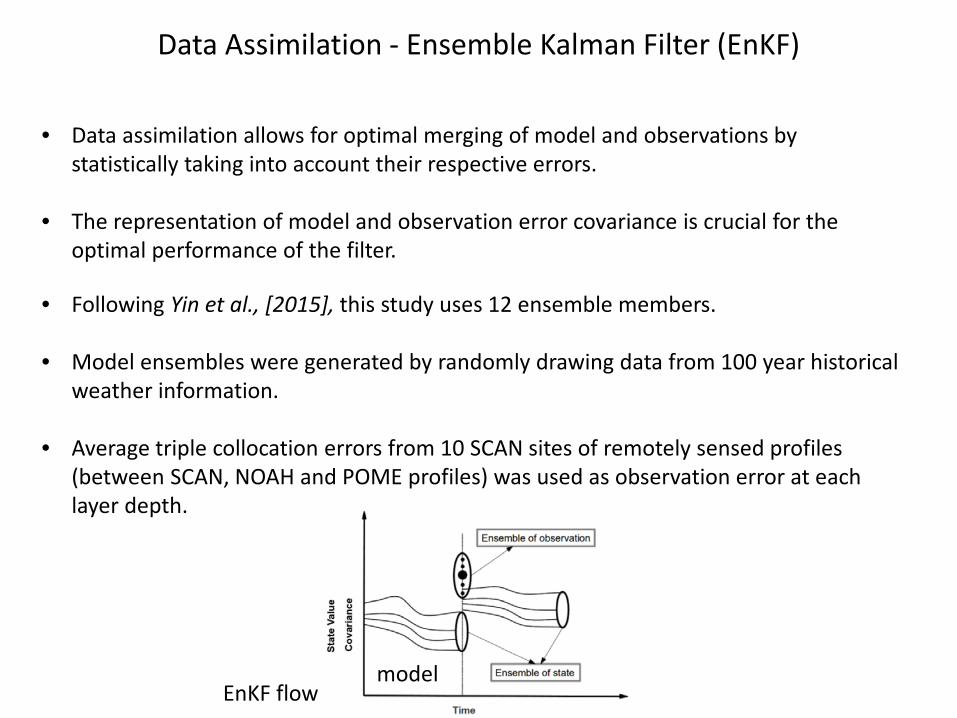
Data Assimilation - Ensemble Kalman Filter (EnKF)
• Data assimilation allows for optimal merging of model and observations by statistically taking into account their respective errors.
• The representation of model and observation error covariance is crucial for the optimal performance of the filter.
• Following Yin et al., [2015], this study uses 12 ensemble members.
• Model ensembles were generated by randomly drawing data from 100 year historical weather information.
• Average triple collocation errors from 10 SCAN sites of remotely sensed profiles (between SCAN, NOAH and POME profiles) was used as observation error at each layer depth.
modelEnKF flow
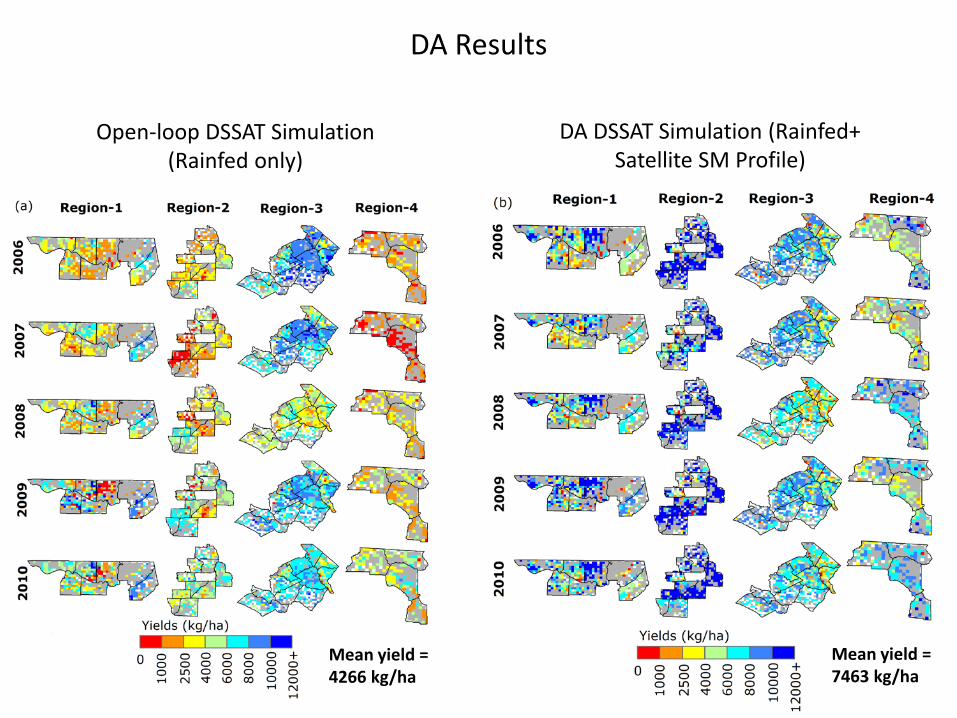
DA Results
Open-loop DSSAT Simulation (Rainfed only)
DA DSSAT Simulation (Rainfed+ Satellite SM Profile)
Mean yield = 4266 kg/ha
Mean yield = 7463 kg/ha
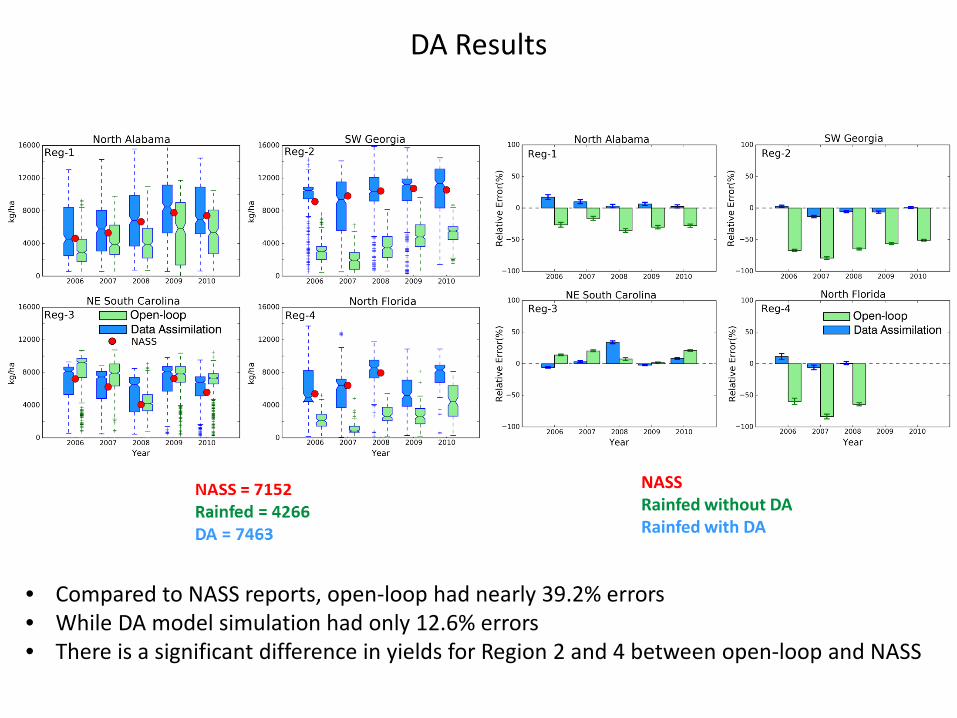
DA Results
• Compared to NASS reports, open-loop had nearly 39.2% errors• While DA model simulation had only 12.6% errors• There is a significant difference in yields for Region 2 and 4 between open-loop and NASS
NASS Rainfed without DA Rainfed with DA
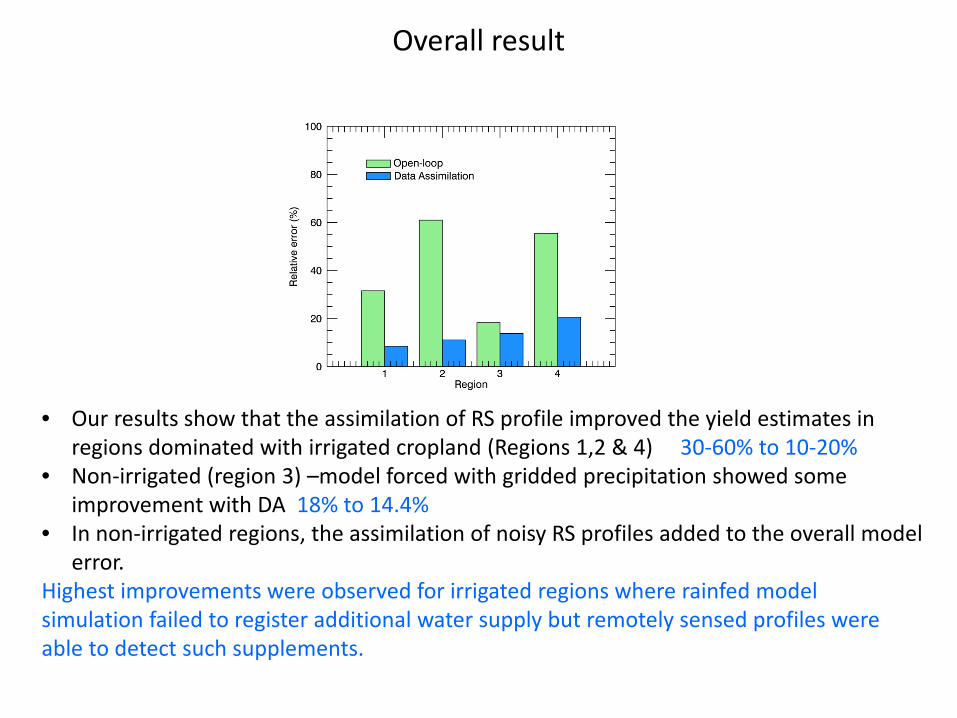
Overall result
• Our results show that the assimilation of RS profile improved the yield estimates in regions dominated with irrigated cropland (Regions 1,2 & 4) 30-60% to 10-20%
• Non-irrigated (region 3) –model forced with gridded precipitation showed some improvement with DA 18% to 14.4%
• In non-irrigated regions, the assimilation of noisy RS profiles added to the overall model error.
Highest improvements were observed for irrigated regions where rainfed model simulation failed to register additional water supply but remotely sensed profiles were able to detect such supplements.
• The open-loop simulation yields in comparison with the reported NASS yields showed an overall absolute relative error of nearly 39.2% whereas the data assimilation mode yields on the other hand had an absolute relative error of 12.6%.
• Assimilating satellite SM profiles into the crop model improved the yield estimation most in irrigated regions (2 and 4) with average relative errors (< 2%) whereas for the relatively non-irrigated regions (1 and 3) the mean relative error was nearly 8%.
• Overall, taking all regions together, the data assimilation yield errors were less than 1/4th of the open-loop yield errors.
• The results indicate that the assimilation of RDSMP data into the crop model was effective in improving yield estimates compared to open-loop (rain-fed only) simulations. The results also highlight the effectiveness of TIR-based SM estimates in sensing irrigation applications on a reginal scale.
• Further improvements can be made through modifying the application of the EnKF, where a variable error term can be applied to the remote sensing SM profiles taking into account the error in the sensors related to vegetation coverage.
Conclusion

Thank you
Questions ??

Extra Slides
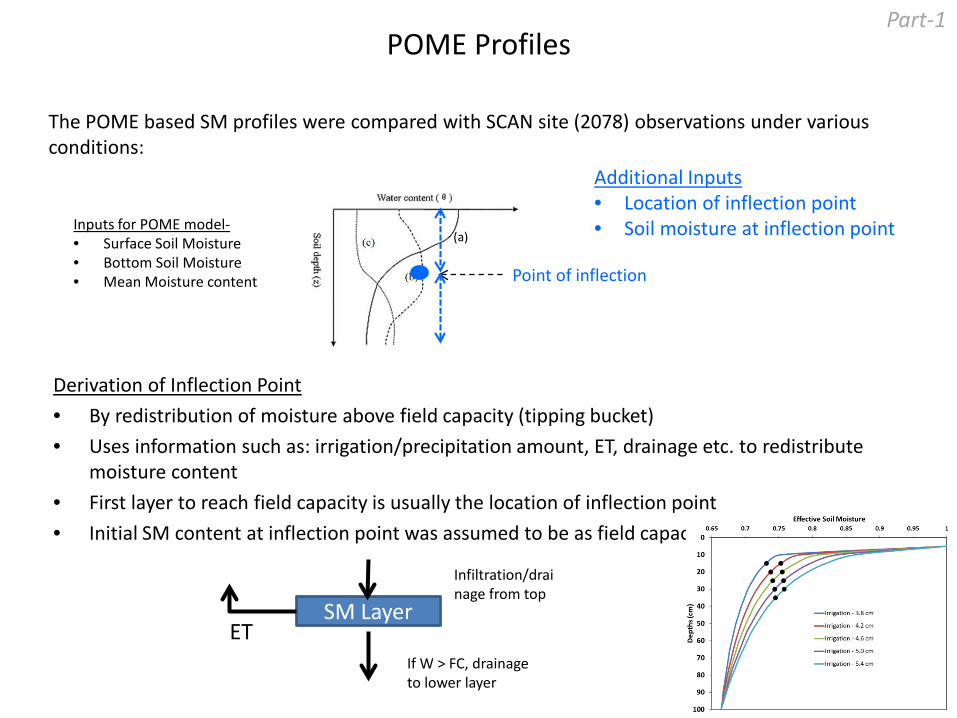
POME Profiles
Additional Inputs• Location of inflection point• Soil moisture at inflection point
Point of inflection
Inputs for POME model-• Surface Soil Moisture• Bottom Soil Moisture• Mean Moisture content
The POME based SM profiles were compared with SCAN site (2078) observations under various conditions:
Derivation of Inflection Point• By redistribution of moisture above field capacity (tipping bucket)• Uses information such as: irrigation/precipitation amount, ET, drainage etc. to redistribute
moisture content• First layer to reach field capacity is usually the location of inflection point • Initial SM content at inflection point was assumed to be as field capacity.
SM Layer
Infiltration/drainage from top
ETIf W > FC, drainage to lower layer
Part-1
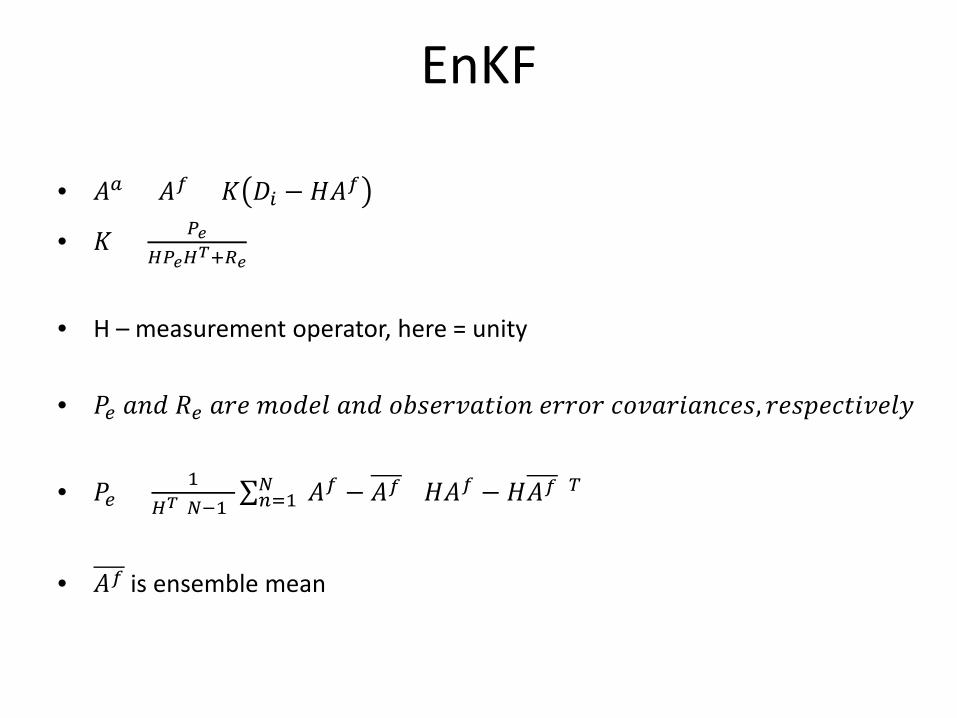
EnKF
• 𝐴𝐴𝑎𝑎 = 𝐴𝐴𝑓𝑓 + 𝐾𝐾 𝐷𝐷𝑖𝑖 − 𝐻𝐻𝐴𝐴𝑓𝑓
• 𝐾𝐾 = 𝑃𝑃𝑒𝑒𝐻𝐻𝑃𝑃𝑒𝑒𝐻𝐻𝑇𝑇+𝑅𝑅𝑒𝑒
• H – measurement operator, here = unity
• 𝑃𝑃𝑒𝑒 𝑎𝑎𝑎𝑎𝑎𝑎 𝑅𝑅𝑒𝑒 𝑎𝑎𝑎𝑎𝑎𝑎 𝑚𝑚𝑚𝑚𝑎𝑎𝑎𝑎𝑚𝑚 𝑎𝑎𝑎𝑎𝑎𝑎 𝑚𝑚𝑜𝑜𝑜𝑜𝑎𝑎𝑎𝑎𝑜𝑜𝑎𝑎𝑜𝑜𝑜𝑜𝑚𝑚𝑎𝑎 𝑎𝑎𝑎𝑎𝑎𝑎𝑚𝑚𝑎𝑎 𝑐𝑐𝑚𝑚𝑜𝑜𝑎𝑎𝑎𝑎𝑜𝑜𝑎𝑎𝑎𝑎𝑐𝑐𝑎𝑎𝑜𝑜, 𝑎𝑎𝑎𝑎𝑜𝑜𝑟𝑟𝑎𝑎𝑐𝑐𝑜𝑜𝑜𝑜𝑜𝑜𝑎𝑎𝑚𝑚𝑟𝑟
• 𝑃𝑃𝑒𝑒 = 1𝐻𝐻𝑇𝑇(𝑁𝑁−1)
∑𝑛𝑛=1𝑁𝑁 (𝐴𝐴𝑓𝑓 − 𝐴𝐴𝑓𝑓)(𝐻𝐻𝐴𝐴𝑓𝑓 − 𝐻𝐻𝐴𝐴𝑓𝑓)𝑇𝑇
• 𝐴𝐴𝑓𝑓 is ensemble mean

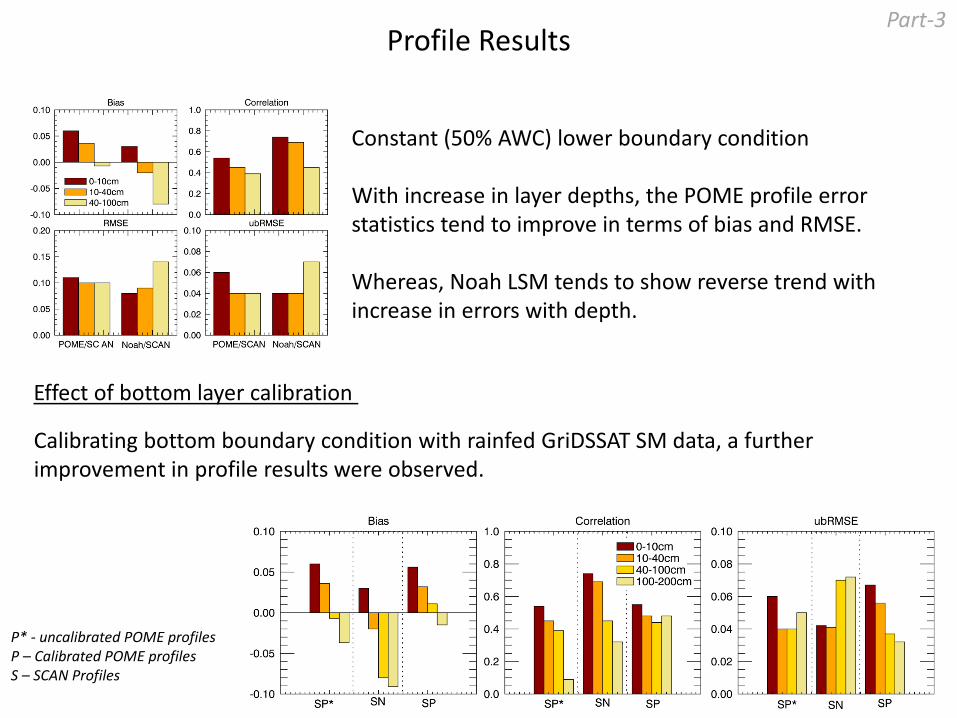
Profile ResultsPart-3
Constant (50% AWC) lower boundary condition
With increase in layer depths, the POME profile error statistics tend to improve in terms of bias and RMSE.
Whereas, Noah LSM tends to show reverse trend with increase in errors with depth.
Effect of bottom layer calibration
Calibrating bottom boundary condition with rainfed GriDSSAT SM data, a further improvement in profile results were observed.
P* - uncalibrated POME profilesP – Calibrated POME profilesS – SCAN Profiles
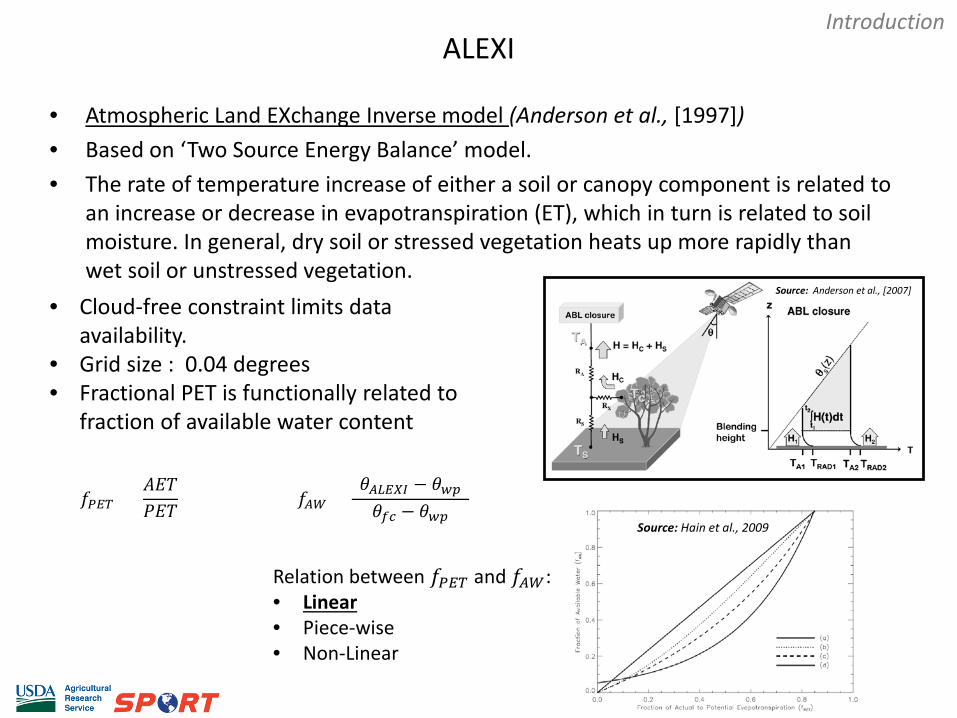
ALEXI
• Atmospheric Land EXchange Inverse model (Anderson et al., [1997])• Based on ‘Two Source Energy Balance’ model. • The rate of temperature increase of either a soil or canopy component is related to
an increase or decrease in evapotranspiration (ET), which in turn is related to soil moisture. In general, dry soil or stressed vegetation heats up more rapidly than wet soil or unstressed vegetation.
• Cloud-free constraint limits data availability.
• Grid size : 0.04 degrees• Fractional PET is functionally related to
fraction of available water content
Source: Anderson et al., [2007]
Introduction
𝑓𝑓𝑃𝑃𝑃𝑃𝑇𝑇 =𝐴𝐴𝐴𝐴𝐴𝐴𝑃𝑃𝐴𝐴𝐴𝐴 𝑓𝑓𝐴𝐴𝐴𝐴 =
(𝜃𝜃𝐴𝐴𝐴𝐴𝑃𝑃𝐴𝐴𝐴𝐴 − 𝜃𝜃𝑤𝑤𝑤𝑤)(𝜃𝜃𝑓𝑓𝑓𝑓 − 𝜃𝜃𝑤𝑤𝑤𝑤)
Relation between 𝑓𝑓𝑃𝑃𝑃𝑃𝑇𝑇 and 𝑓𝑓𝐴𝐴𝐴𝐴:• Linear• Piece-wise • Non-Linear
Source: Hain et al., 2009