AssetsMiner for FTTX - TeleConsult · © 2005 - 2015 by TeleConsult d.o.o.
54
AssetsMiner for FTTX © 2005 - 2015 by TeleConsult d.o.o. 1*2*3 Click to any Data
Transcript of AssetsMiner for FTTX - TeleConsult · © 2005 - 2015 by TeleConsult d.o.o.

AssetsMiner for FTTX
© 2005 - 2015 by TeleConsult d.o.o.
1*2*3 Click to any Data

AssetsMiner FTTX2
© 2005 - 2015 by TeleConsult d.o.o.
Table of Contents
Part I AssetsMiner Mission 3
Part II AssetsMiner for FTTX 4
................................................................................................................................... 41 Network Inventory and Planning Data
.......................................................................................................................................................... 5Spatial Database Basics
.......................................................................................................................................................... 6Geocoded Addresses
.......................................................................................................................................................... 8Geocoded Streets
.......................................................................................................................................................... 9Existing Telecom Infrastructure
......................................................................................................................................................... 10Duct Routes
......................................................................................................................................................... 11PSTN Exchange Locations
......................................................................................................................................................... 12PSTN Distribution Points
......................................................................................................................................................... 13Residential Customers
......................................................................................................................................................... 14Large Business (D.D.)
......................................................................................................................................................... 15Small Business (D.O.O.)
.......................................................................................................................................................... 15Zoning of the Service Areas
......................................................................................................................................................... 16Demand Specification
.......................................................................................................................................................... 17FTTX Planning Users Guide
......................................................................................................................................................... 17Customer Site Category
......................................................................................................................................................... 18Location Category
......................................................................................................................................................... 19Business Customer Sites Editor
......................................................................................................................................................... 21Demand per Planning Zone
......................................................................................................................................................... 24Demand per Access Cable Buffer
......................................................................................................................................................... 28Thematic View on Demand
Part III AssetsMiner FTTX Transmission 30
................................................................................................................................... 311 AssetsMiner for FTTX Operators
................................................................................................................................... 312 Key Challenges
................................................................................................................................... 323 Intelligent Network Inventory
................................................................................................................................... 324 AssetsMiner Transmission Users Guide
.......................................................................................................................................................... 33Network Inventory
.......................................................................................................................................................... 34AssetsMiner Transmission GUI
......................................................................................................................................................... 35City Selection
......................................................................................................................................................... 36Cable Selection
......................................................................................................................................................... 37Path Selection
.......................................................................................................................................................... 37Data Manipulation Routines
......................................................................................................................................................... 39Create New OE (Spojnica) Ports
......................................................................................................................................................... 39Create New ODF Ports
......................................................................................................................................................... 40Edit CrossConnections
......................................................................................................................................................... 41Create CrossConnection
......................................................................................................................................................... 42Remove CrossConnection
......................................................................................................................................................... 43Add New Segment to OE ( Kreiraj T-Spojnicu)
......................................................................................................................................................... 44Cable Segment Editor
......................................................................................................................................................... 46Import AMCAD Data
......................................................................................................................................................... 47Data Administration
.......................................................................................................................................................... 48Transmission Reports
......................................................................................................................................................... 48Cable Segment Status
......................................................................................................................................................... 49Browse Crossconnections
......................................................................................................................................................... 51Visualize CrossConnections
......................................................................................................................................................... 53End to End Path Trace
......................................................................................................................................................... 54FO Usage Drill Down

AssetsMiner Mission 3
© 2005 - 2015 by TeleConsult d.o.o.
1 AssetsMiner Mission
As network operators move towards new technology and new services, their need to understand theresources in the network and their utilization becomes critical in order to optimize network expansionand maximize return on investments. Telecom operators thus have to provide network and serviceresource management database as a foundation for various functions and business units within thecompany. AssetsMiner focus is on the operator’s transmission network business segment and coversthe complete network infrastructure; transmission, radio, switching and service layers of the operator’snetwork and provide the flexibility to support future services and technologies explosion. Unified NetworkImage serving as a central Information repository is a necessity for the integrated low Capex/OpexOperations and ensures that a single source of data is used.
Intelligent Inventory SolutionAssetsMiner provides a consolidated, cross technology, end-to-end view of telecommunicationsnetworks upon which services are delivered to customers. This comprehensive and integrated view of theentire network combines the fully connected inside and outside plant of the physical network with theconnectivity and circuits of the logical network.The planning and engineering of FTTX network infrastructure is supported by semi automated designtools and engineering workflow within the AssetsMiner Network Inventory application.A detailed physical network model supports the layout of the fiber trunk and access network up to theoptical termination points.Sales and marketing staff have access to the information in the AssetsMiner Network Inventory allowingthem to query customer and demographic data in context of the network rollout. This helps to determinethe highest potential take up of services and to assist sales and marketing campaigns. Operations staffalso has access to the same network information.
With the ability to document both inside and outside plant equipment, operators can generate end-to-endmodels of their entire network infrastructures and greatly facilitate network design. This one system managesphysical cable and equipment connections and attributes all the way down to the pair or port level.
Physical Network Inventory is built upon a powerful spatially enabled database that provides a completesuite of tools to manage business critical network information. Physical Network Inventory incorporates:
Complete network infrastructure layout and management in an seamless environment.Point and click feature selection and report generation.1*2*3 click to any data paradigm for fast data retrieval.Advanced Drill-Down reporting down to FO pair.Optimal usage of network design and data management techniques (Autodesk MAP 3D,Autodesk MapGuide, Microsoft SQL Server, IIS WEB server).Automatic import and consolidation of network design data via complex and secure DTS

AssetsMiner FTTX4
© 2005 - 2015 by TeleConsult d.o.o.
procedures.Secure data administration tasks.Integration of all relevant GIS layers with network topology for efficient network expansionplanning.
Recognize that investment in GIS is a long-term commitment. Executives often view GISinvestment as having a finite investment period, rather than a going-concern. Building an accurate andcomplete network inventory sufficient to support network infrastructure management activities and value-added functions such as full flow-through provisioning often takes years. It cannot be time-boxed.
2 AssetsMiner for FTTX
Networks are becoming extremely complex. Operators have to mix and manage more and moretechnologies, including Fiber To The X (FTTx), IP, and Passive Optical Networks (PONs), in order tosupport the rush of new services, such as Triple Play, Voice over IP (VoIP), IPTV, and Metro Ethernet.As a result, the need for a planning and engineering system that can support any network, anytechnology, and any type of equipment — right down to the individual glass fiber — is critical. It is thekey to knowing where customers are located, linking them to the network, and efficiently managing thequality of converged services.
In the network planning process, the operator plans each network by identifying the potential usergroups, plan a range of services for each type of user group, forecast the likely development over timeand basic service area of the number of users and of the required service intensity per service and peruser. The operator also investigates what kind of technical requirements all these services will put on thenetwork.
The planner can now continue the network planning process to design the appropriate network bysketching a future target network in form of access, transfer and other nodes, probably with the existingnodes and links as a base, but at first concentrating on the network functions needed to implement thevarious services. When this is more or less done, possible transport systems should be proposed so asto implement the network functions, fulfilling the technical requirements. Now, suitable node equipmentshould be considered. The nodes are dominated by units for switching and transport.
2.1 Network Inventory and Planning Data
As with most utilities, telcos traditionally create and maintain detailed paper maps of their systems(network and equipment). In the last decade these paper maps became increasingly generated andstored using CAD and rarely did these companies employ the software for tasks beyond simple drafting.In other words the CAD technology was merely used to create an image for the purpose of engineeringdocumentation, whilst maintaining key data in disparate spreadsheets and other databases to managetheir key assets.
With the tremendous pace at which the broadband infrastructure is being deployed and given the ever-growing consumer needs, the cable and broadband companies are at crossroads. Moreover thesesystems expand geographically and functionally every day. The realities of this new paradigm have madeobsolete, the manual, non-integrated approach to asset management, network monitoring and customercare that characterized the cable industry’s simpler past.
Planning of telecommunication services necessitates physical (visual) contact by the planner(forecaster) with the area for which telecommunication services are to be planned. In the course to goodnetwork development plan for urban area a thorough knowledge of the physical layout of the service areais of great importance. This work needs network planners with wide experience and knowledge ofmetropolitan area infrastructure relevant for network planning either because of their importance fornetwork development like; bridges, roads, railway paths etc. or represent obstacles to network entitieslike; rivers, lakes, cemeteries harbors, etc.

AssetsMiner for FTTX 5
© 2005 - 2015 by TeleConsult d.o.o.
Example of overlaid city and telecom (ducts) infrastructure.
2.1.1 Spatial Database Basics
GIS finds importance in not only giving asset management a new dimension with the ability to handlegeospatial data but also in revolutionizing the way in which such key assets are managed. In the recentyears the trend has been to integrate geospatial and asset management systems to provide the mostnatural and effective links in utility information management and this synergy has been quite evident.
Set of locations involved in the network or spatial properties of the network are basic information in thedatabase. They describe geographical structure of the network. At one extreme, consider each terminalas a location. Another extreme is to consolidate to the level of entire cities. Each of this alternatives, aswell as hybrid approach might be appropriate in specific situations, depending upon the overall size ofthe network, available computational resources and the level of detail required in the design. Theselection of the appropriate location set is critically important because so much other data depends onlocation data. The location set chosen affects the rest of the database.
Links or requirements are reported between nodes or locations and can only be reported in as muchdetail as the degree of fineness of the location set. Similarly, all links go between locations. By includingsites inside the same building as different locations (transmission nodes), we can keep track of linksbetween them.
Intelligent graphics and data binding between the graphical elements on a map and its correspondinginformation in a database is the essence of any GIS system and true to this, AssetsMiner is the set oftools and technologies that does this.

AssetsMiner FTTX6
© 2005 - 2015 by TeleConsult d.o.o.
High-level network w iew with main POP locations and core cable paths.
2.1.2 Geocoded Addresses
AssetsMiner database contains about 1.400.000 geocoded addresses for the whole country animportant input asset for network planning and design.Every address or building can be categorized to enable sound forecast of services.

AssetsMiner for FTTX 7
© 2005 - 2015 by TeleConsult d.o.o.
Quick zoom goto tool is used to locate each address

AssetsMiner FTTX8
© 2005 - 2015 by TeleConsult d.o.o.
2.1.3 Geocoded Streets
Every street in every major city is geocoded. Each street segment has exact length in meters assigned.Quick zoom goto tool is used to find all segments of a street.
AssetsMiner for FTTX 9
© 2005 - 2015 by TeleConsult d.o.o.
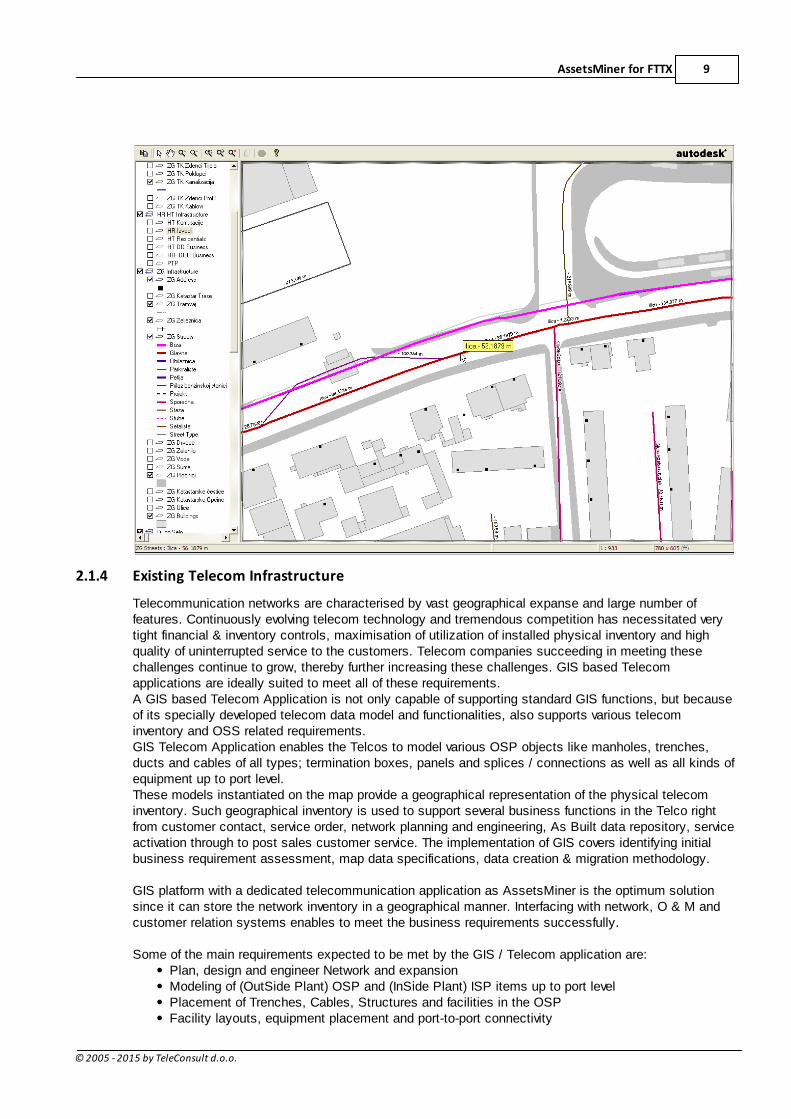
2.1.4 Existing Telecom Infrastructure
Telecommunication networks are characterised by vast geographical expanse and large number offeatures. Continuously evolving telecom technology and tremendous competition has necessitated verytight financial & inventory controls, maximisation of utilization of installed physical inventory and highquality of uninterrupted service to the customers. Telecom companies succeeding in meeting thesechallenges continue to grow, thereby further increasing these challenges. GIS based Telecomapplications are ideally suited to meet all of these requirements.A GIS based Telecom Application is not only capable of supporting standard GIS functions, but becauseof its specially developed telecom data model and functionalities, also supports various telecominventory and OSS related requirements.GIS Telecom Application enables the Telcos to model various OSP objects like manholes, trenches,ducts and cables of all types; termination boxes, panels and splices / connections as well as all kinds ofequipment up to port level.These models instantiated on the map provide a geographical representation of the physical telecominventory. Such geographical inventory is used to support several business functions in the Telco rightfrom customer contact, service order, network planning and engineering, As Built data repository, serviceactivation through to post sales customer service. The implementation of GIS covers identifying initialbusiness requirement assessment, map data specifications, data creation & migration methodology.
GIS platform with a dedicated telecommunication application as AssetsMiner is the optimum solutionsince it can store the network inventory in a geographical manner. Interfacing with network, O & M andcustomer relation systems enables to meet the business requirements successfully.
Some of the main requirements expected to be met by the GIS / Telecom application are: Plan, design and engineer Network and expansion Modeling of (OutSide Plant) OSP and (InSide Plant) ISP items up to port level Placement of Trenches, Cables, Structures and facilities in the OSP Facility layouts, equipment placement and port-to-port connectivity

AssetsMiner FTTX10
© 2005 - 2015 by TeleConsult d.o.o.
Inventory management including equipment assignment Repository of As Built and survey data Provide network data to OSS / BSS systems Answer service activation / provisioning queries Cable fault localisation Several Sales, Marketing and Service fulfillment related functions
Survey data with trench, man-hole details, number and alignment of ducts is migrated from all availabledata sources..
2.1.4.1 Duct Routes
Unlike the map and survey data, telecom network inventory and connectivity involves complicated logicalrelationships, which are difficult to capture on CAD platform. Migration of such data to GIS platform isalso very complex, error prone.

AssetsMiner for FTTX 11
© 2005 - 2015 by TeleConsult d.o.o.
Example of overlaid city and telecom (ducts) infrastructure. This is an essential prerequisite for outside plant
cable routing from POPs to customer premises (red dots).
2.1.4.2 PSTN Exchange Locations
Existing access network based on copper pairs have n-level star shape. Local PSTN exchanges andRemote Subscriber Units (RSU) are main hubs for the stars.They represent ideal points for equipment collocation.

AssetsMiner FTTX12
© 2005 - 2015 by TeleConsult d.o.o.
Our planning zones and existing PSTN exchange locations.
2.1.4.3 PSTN Distribution Points
Primary cables from PSTN exchanges or RSU terminate on cabinets, secondary cables terminate ondistribution points (DP), this is the classic double star access network topology.

AssetsMiner for FTTX 13
© 2005 - 2015 by TeleConsult d.o.o.
Overall city view with georeferenced. DP.
2.1.4.4 Residential Customers
Residential customers distribution over the service area together with appropriate zoning and existingservices should allow for sound traffic demand calculation

AssetsMiner FTTX14
© 2005 - 2015 by TeleConsult d.o.o.
2.1.4.5 Large Business (D.D.)
Large business (D.D.) customer locations are imported from external database or manually entered via Network Editor .19

AssetsMiner for FTTX 15
© 2005 - 2015 by TeleConsult d.o.o.
2.1.4.6 Small Business (D.O.O.)
Small business (D.O.O.) customer locations are imported from external database or manually enteredvia Network Editor .
2.1.5 Zoning of the Service Areas
Zoning of the service areaIrrespective of which method of forecasting is employed, the quality of the forecast will be directlydependent on the quality of the basic data.To establish a reliable forecasting database two-tired approach is required:
Macro level at which it is necessary to identify previous growth and historical data. Factors to be takeninto account include trends in population growth, economic outlook and the implications of commerce,trade and industry, trends in public expenditure etc.Local (micro) level for which it is necessary to consider local prospects for commerce, trade andindustry, numbers of households and the social status of their occupants, vacant space and buildingactivity, existing demand for service separated into categories residential/ business etc.
There are often large variations in areas within the same geographical region and the only method to getrelevant data is to perform zoning of the area, utilize all ready available data and perform on-site survey ofthe zone.
19

AssetsMiner FTTX16
© 2005 - 2015 by TeleConsult d.o.o.
2.1.5.1 Demand Specification
The optimal location of an hub is the point in the network corresponding to the least possible total cost.Again, it all is a matter of minimizing the defined cost function.A changed boundary affects the optimal location of hubs, and a changed location affects the optimalboundaries. This means that the process of optimizing both of them is a matter of iterative calculations –boundaries > locations > boundaries > locations, etc. The iterations go on until there is no furtherchange or a small enough change from previous iteration.In the following, basic cost functions will be given in order to give an understanding of what factors thatinfluence the optimal boundaries and locations. Derivations and deeper considerations are thus left out.
For larger networks it is obviously impractical to define the location of every subscriber individually.Although the locations of the existing subscribers are known, the forecasts, being made for the entirepopulation of a city, or for subsets of that population, would be meaningless for defining the location ofindividual subscribers.
The customer distribution can therefore be defined in one of the following ways:
1 Nodes
Here subscriber density is defined in discrete points, usually corresponding to terminal block. Thisapproach is often used for large customer sites or in the outskirts of metropolitan areas. Each node isdefined by its coordinates and by the subscriber forecasts for the points of time to be considered.
2 Arbitrary areas (zones)
Forecasts can be defined for arbitrary polygons, i.e. areas enclosed by a sequence of straight lines.These areas correspond usually to blocks of houses, industrial complexes, etc. Again, the customersare assumed to be evenly distributed within each such area.
Which of the above methods to choose depends on the type of network, and the data available; it is

AssetsMiner for FTTX 17
© 2005 - 2015 by TeleConsult d.o.o.
also possible to use a combination of these for any given network.
As regards the hub area boundaries, the way of defining the subscriber distribution has the followingeffects:
Nodes : each node is assigned to one exchange;
Areas : any area is assigned to one exchange.
Demand specification
2.1.6 FTTX Planning Users Guide
The Engineering department can plan before they dig up, as the network plant data is made availableoverlaid with appropriate GIS landbase layers in AssetsMiner. The engineers can locate any piece ofnetwork element like OE, ODF, TB, cables etc. The customer addresses can be clicked to getinformation like what type of cables run to it? Where is the nearest TB or which node is it connected to?How many houses are wired to the same network? Where are they? and so on.
The powerful reporting option could be used to quickly generate engineering inventory reports like thetotal bandwidth required per house or zone or arbitrary polygon.
The Marketing and Sales department can use AssetsMiner to locate their “Best Customers” based onspecific criteria and this could be for their proposed service area or could be within the existing ones.This can also be done to identify the “Best Business” location. AssetsMiner along with the businessrelated layers like the consumer concentration, their preferences etc. can be effectively used to identifyareas suitable for reference or direct advertisement.
2.1.6.1 Customer Site Category
Each customer site category is characterized with minimum and maximum bandwidth requirements.Each customer site is assigned appropriate site category.

AssetsMiner FTTX18
© 2005 - 2015 by TeleConsult d.o.o.
GIS planning tool is equipped with CalcDemand algorithm that calculates and summarize demandper arbitrary polygon or planning zone.
2.1.6.2 Location Category
The importance and size of customer location is essential input for network expansion planning.AssetsMiner has expandable list of location categories maintained by the administrator.
21

AssetsMiner for FTTX 19
© 2005 - 2015 by TeleConsult d.o.o.
2.1.6.3 Business Customer Sites Editor
Network planners make use of Graph Editor to specify business customer location, location category,customer category and priority.Incumbent operator data and quick zoom-to feature is extensively used to pinpoint customer locationsand edit data.
AssetsMiner interactive Web GIS editor provides functionality to insert new or edit an existing customersite.Each customer site is georeferenced in the node.

AssetsMiner FTTX20
© 2005 - 2015 by TeleConsult d.o.o.
Select the node where the customer is located.
Invoke the Customer Site Editor from the "Reports" Menu.

AssetsMiner for FTTX 21
© 2005 - 2015 by TeleConsult d.o.o.
Edit attributes as required.
2.1.6.4 Demand per Planning Zone
Following image depicts selection of planning zone using the select - within contextual menu.

AssetsMiner FTTX22
© 2005 - 2015 by TeleConsult d.o.o.
All customer sites w ithin the zone are selected.

AssetsMiner for FTTX 23
© 2005 - 2015 by TeleConsult d.o.o.
Invoke BW Calcullation Report
Lower w indow pane opens with the Demand BW report. Report lists all selected customer sites and total BW
demand calculated.

AssetsMiner FTTX24
© 2005 - 2015 by TeleConsult d.o.o.
2.1.6.5 Demand per Access Cable Buffer
Demand per cable buffer area, step by step procedure.
Select access cable and via contekt menu select View > Buffer.

AssetsMiner for FTTX 25
© 2005 - 2015 by TeleConsult d.o.o.
Choose buffer distance, e.g. 100 m, buffer layer and color.
Buffer zone created.

AssetsMiner FTTX26
© 2005 - 2015 by TeleConsult d.o.o.
All customer sites w ithin buffer zone selected via Select w ithin Customers menu.

AssetsMiner for FTTX 27
© 2005 - 2015 by TeleConsult d.o.o.
Apply CalcDemand report on selected customer sites.

AssetsMiner FTTX28
© 2005 - 2015 by TeleConsult d.o.o.
Report is generated in separate w indow.
2.1.6.6 Thematic View on Demand
If appropriate forecast per zone demand using heuristic procedures and algorithms, possibly hostedwithin popular Excel spreadsheet.AssetsMiner advanced import from heterogenous data sources feature provides simple import toAssetsMiner database as well as import of zone topology from Autodesk Map 3D.
AssetsMiner for FTTX 29
© 2005 - 2015 by TeleConsult d.o.o.
AssetsMiner FTTX30
© 2005 - 2015 by TeleConsult d.o.o.
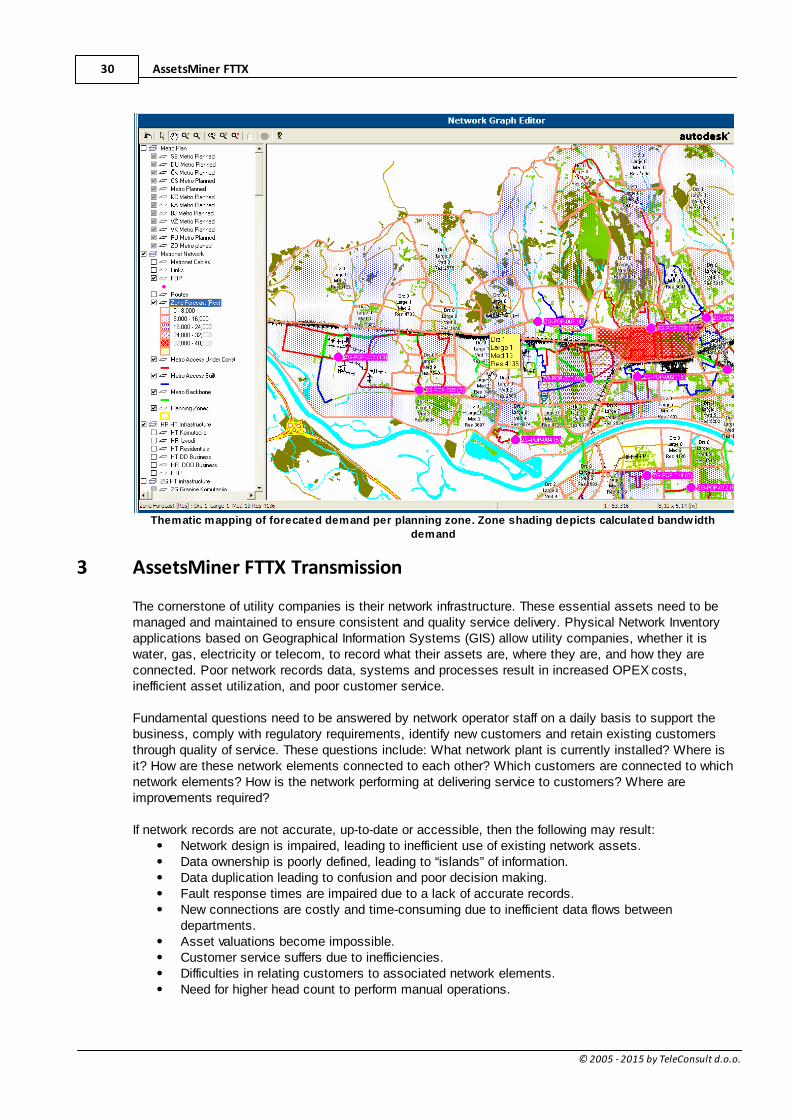
Thematic mapping of forecated demand per planning zone. Zone shading depicts calculated bandwidth
demand
3 AssetsMiner FTTX Transmission
The cornerstone of utility companies is their network infrastructure. These essential assets need to bemanaged and maintained to ensure consistent and quality service delivery. Physical Network Inventoryapplications based on Geographical Information Systems (GIS) allow utility companies, whether it iswater, gas, electricity or telecom, to record what their assets are, where they are, and how they areconnected. Poor network records data, systems and processes result in increased OPEX costs,inefficient asset utilization, and poor customer service.
Fundamental questions need to be answered by network operator staff on a daily basis to support thebusiness, comply with regulatory requirements, identify new customers and retain existing customersthrough quality of service. These questions include: What network plant is currently installed? Where isit? How are these network elements connected to each other? Which customers are connected to whichnetwork elements? How is the network performing at delivering service to customers? Where areimprovements required?
If network records are not accurate, up-to-date or accessible, then the following may result: Network design is impaired, leading to inefficient use of existing network assets. Data ownership is poorly defined, leading to “islands” of information.Data duplication leading to confusion and poor decision making. Fault response times are impaired due to a lack of accurate records. New connections are costly and time-consuming due to inefficient data flows betweendepartments. Asset valuations become impossible. Customer service suffers due to inefficiencies. Difficulties in relating customers to associated network elements. Need for higher head count to perform manual operations.

AssetsMiner FTTX Transmission 31
© 2005 - 2015 by TeleConsult d.o.o.
3.1 AssetsMiner for FTTX Operators
With the ability to document both inside and outside plant equipment, operators can generate end-to-endmodels of their entire network infrastructures and greatly facilitate network design. This one systemmanages physical cable and equipment connections and attributes all the way down to the strand, pair,or port level.The system’s outside plant management functions let users document, place, and edit connectednetwork inventory through the combined use of Autodesk Map 3D for design and Autodesk MapGuideWeb GIS for data distribution, and include network spans, transmission media fibers, and equipment. Allnetwork elements and related structures can be placed in connected networks of transmission media,which are recorded in Microsoft SQL Server database for utilization by construction personnel.Spatial data is much more than a pictorial representation of an enterprise’s infrastructure. Mostconventional Geospatial Information Systems (GIS) architectures allow spatial data to be stored andthen retrieved at a later date for display or printing. More advanced architectures support spatially-basedqueries and analysis, but even these often fail to fully exploit the real value of spatial data: its complexinterrelationships. These relationships can sometimes be inferred by close visual inspection of mapfeatures, but more often than not an invisible underworld exist that complements the geographic world bymodeling the complex logical network that supports many of the day-to-day business processes that arecritical to today’s enterprise. Many conventional GIS architectures do not support this kind of modeling(or do so in a cumbersome way), making them unsuitable for managing the kind of complex networkoperations demanded by enterprise GIS.
AssetsMiner Transmission
3.2 Key Challenges
As demands increase for a “triple play” service, the challenge for communications service providers is todeliver voice, video and data via the same connection. FTTX provides this capability but deploying itrequires new access network rollout. This takes careful network planning and design as severaltechnologies can be used for FTTX. The most cost effective is considered to be based on PassiveOptical Networks (PONs). Once the right technology has been selected, communications operators face

AssetsMiner FTTX32
© 2005 - 2015 by TeleConsult d.o.o.
the difficult prospect of rolling out the new physical infrastructure. They must also keep close control onthe capital and operational expenditure required to support this activity.Targeting FTTX rollout to achieve the highest returns also presents a challenge to communicationsservice providers. This requires knowledge of the potential customer base. The same applies to salesand marketing as attempts are made to focus campaigns towards potential subscribers.As customer orders are received, the next challenge is recording and managing customer connectionsand provisioning the services quickly and cost effectively. Inevitably, problems occur in the network thatwill impact customers. Communications service providers will be judged by their customers on howquickly these network problems are managed and resolved.
3.3 Intelligent Network Inventory
This intelligent inventory solution provides a consolidated, cross technology, end-to-end view oftelecommunications networks upon which services are delivered to customers. This comprehensive andintegrated view of the entire network combines the fully connected inside and outside plant of thephysical network with the connectivity and circuits of the logical network.The planning and engineering of FTTX network infrastructure is supported by semi automated designtools and engineering workflow within the AssetsMiner Network Inventory application.A detailed physical network model supports the layout of the fiber trunk and access network up to theoptical termination points.Sales and marketing staff have access to the information in the AssetsMiner Network Inventory allowingthem to query customer and demographic data in context of the network rollout. This helps to determinethe highest potential take up of services and to assist sales and marketing campaigns. Operations staffalso has access to the same network information.
Physical Network Inventory is built upon a powerful spatially enabled database that provides a completesuite of tools to manage business critical network information. Physical Network Inventory incorporates:
Complete network infrastructure layout and management in an seamless environment.Point and click feature selection and report generation.1*2*3 click to any data paradigm for fast data retrieval.Advanced Drill-Down reporting down to FO pair.Optimal usage of network design and data management techniques (Autodesk MAP 3D,Autodesk MapGuide, Microsoft SQL Server, IIS WEB server).Automatic import and consolidation of network design data via complex and secure DTSprocedures.Secure data administration tasks.Integration of all relevant GIS layers with network topology for efficient network expansionplanning.
3.4 AssetsMiner Transmission Users Guide
Business Requirement AssesmentGIS platform with a dedicated telecommunication application is the optimum solution since it can storethe network inventory in a geographical manner. Interfacing with network, O & M and customer facingsystems enables to meet the business requirements successfully. Some of the mainrequirements expected to be met by the GIS / Telecom application are:
Plan, design and engineer Network and expansionModeling of (OutSide Plant) OSP and (InSide Plant) ISP items up to port levelPlacement of Trenches, Cables, Structures and facilities in the OSPFacility layouts, equipment placement and port-to-port connectivityInventory management including equipment assignmentRepository of As Built and survey dataProvide network data to OSS / BSS systemsAnswer service activation / provisioning queries

AssetsMiner FTTX Transmission 33
© 2005 - 2015 by TeleConsult d.o.o.
Cable fault localisationSeveral Sales, Marketing and Service fulfillment related functions
Creation of Network InventoryUnlike the map and survey data, Telecom network inventory and connectivity involves complicated logicalrelationships, which are difficult to capture on CAD platform. Migration of such data to GIS platform isalso very complex, error prone and does not lead to cost, efforts or time reduction.Therefore, network inventory is created directly on selected GIS platform, using telecom application.
Telecom applications have specially designed data model, providing ability to build models of frequentlyused items like ports, cards, chassis, equipment, cables, structures etc. These models can beinstantiated directly or configured into frequently repeating combinations, which in turn can beinstantiated on the map. Building model libraries requires full understanding of the telco application anddetailed subject knowledge of telecom engineering, operations and maintenance. Integration of GIS /telecom application with OSS has a major bearing on modeling. Therefore, wherever OSS-GISintegration is involved, Telco applications having application having a flexible model builder is preferableover application with built-in model libraries.
The telecom application goes beyond the functionality provided by standard GIS platform. It serves theneeds of engineering, construction and projects monitoring by providing some out of the box functions.For example, ability to check continuity of cable from port to port required by network engineers isprovided by the Network Trace function.
Detailed network asset naming by mnemonic codes is typical to Telecom industry. The namingconventions differ in each organization, however, rigid parent child, 1-m or 1-1 relationships areembedded in the codes themselves. The number of assets up to card and port level runs in to millions.Customized application using the telco & GIS data model is developed to reduce the data-entry work toa fraction of the total work.
Business DriverGIS based telecom application requires large investment, manpower and time in data creation anddeployment. Full benefits of such systems can only be realised when the Telecom GIS system becomes anintegral part of the OSS / BSS solution and the organisational work processes are designed with GIS as anessential part of such integrated OSS / BSS solution. Based on automatic flow-through business processes,such integration provides maximum value addition in terms of:
Single point data entry and elimination of redundant databases,Minimal human intervention in data creation,Improved response to network events,Improved response to customers,
resulting in improved overall efficiency of the enterprise.
3.4.1 Network Inventory
Physical network inventory supports all aspects of the network, from the core transmission network tothe customer access network. The product’s modular structure and flexibility enables it to support avariety of telecommunications service providers.Main AssetsMiner Transmission attributes are:
Regions and Cities. Whole service area is subdivided into regions and cities. Nodes and cablesbelong to cities and regions. Nodes (locations). Every network element (NE) is located in node. More than one NE can be co-located in a node. Cable consists of cable segments. Cable is assigned a level, e.g.:
BackboneAggregationAccess
Cable segments are connecting nodes, Every segment have originating and terminating node.Cable segment, prefix is "S". Each cable segment is located in a city and assigned to acable.

AssetsMiner FTTX34
© 2005 - 2015 by TeleConsult d.o.o.
Network Elements (NE). Expandable list of passive NE includes and is not limited to:Optical Distribution Frame (ODF). ODF prefix is "SR" (Svjetlovodni Razdjelnik), ODFnumbering is relative to the city.Optical Enclosure (OE). OE prefix is "N" (Nastavak), OE numbering is relative to cablesegmentTerminal Block (TB). TB prefix is ZO (Završni Ormaric). TB numbering is relative to cable.
Coding PrinciplesDetailed network asset naming by mnemonic codes is typical to Telecom industry. The namingconventions differ in each organisation, however, rigid parent child, 1-m or 1-1 relationships areembedded in the codes themselves. AssetsMiner using the telco & GIS data model is developed toreduce the data-entry work to a fraction of the total work.
Every bit of information in AssetsMiner database must have unique ID allowing for fast data filtering andretrieval. Besides ID, every database network entity can have popular or common name assigned foreasier human oriented identification. Individual codes are concatenated with underscore ("_").
Region ID at the county level is coded sequentially starting with 01. (E.g. region Zagreb is "01"). City ID at the national level is also coded starting with 01. (E.g. Zagreb is "01" so complete codefor Zagreb in region Zagreb is "01_01"). Cable segments ID for a second segment in the cable in region 01 and city with code 01 and cableID 00003 is: "S_01_01_00003_02" (S for Segment, RegionID-01, CityID-01, CableID-00003, SegmentID-02).
OE ID for a OE in region 01, city 01 on cable segment 00001 is coded as: N_01_01_00001_01: (N for nastavak, RegionID, CityID, CableID, NodeID)ODF ID for ODF 014 in region 01, city 01 is coded as: SR_01_01_014.
3.4.2 AssetsMiner Transmission GUI
AssetsMiner transmission module allows for efficient data selection and visualization. For exampleprocedure to select core or access cable in certain city is only few clicks away.Having selected cable or cable segment it is easy to select and browse or edit all relevant data.

AssetsMiner FTTX Transmission 35
© 2005 - 2015 by TeleConsult d.o.o.
3.4.2.1 City Selection
The very first step is city selection. All background infrastructural layers and relevant transmissionfacilities are available at the click of a combo box.

AssetsMiner FTTX36
© 2005 - 2015 by TeleConsult d.o.o.
3.4.2.2 Cable Selection
Self-refreshing combo boxes allow for quick selection of city w ithin the region an then cable w ithin the city
as depicted below.
Select ZG-BBT-003 Cable in Zagreb.

AssetsMiner FTTX Transmission 37
© 2005 - 2015 by TeleConsult d.o.o.
Selected cable and relevant OE (Spojnice) and Reserves (Rezerve) are automatically selected and highlighted.
GIS window is zoomed to the selected cable.
3.4.2.3 Path Selection
Inspect end to end path trace that includes all cables from POP to customer terminal block.
3.4.3 Data Manipulation Routines
Attribute information allows essential business rules that affect the physical topology of the network tobe easily implemented. For example, a network topology defined purely in terms of its physicalconnections would have to be re-wired to reflect changes in state (for example, connecting a fiber pair inoptical enclosure (OE)). In AssetsMiner architecture this behavior can be implemented on the owningobject (for example, an OE) either by the inclusion of additional attributes (for example an status flag) orsupplemental code that can implement more complex business rules. Using this approach, the physical

AssetsMiner FTTX38
© 2005 - 2015 by TeleConsult d.o.o.
topology of the network can change on the-fly responding quickly to the often dynamic operational needsof today’s enterprise networks:
Following data manipulation routines are implemented:Import Network Topology from AMCADInsert/ update NodeInsert/ update NE (OE, ODF, TB)Create optical ports for OE “spojnica”Create connected OE (“ravna sponica”)Create optical ports for ODF Create New CrossConnection on OE/ ODFRemove CrossConnection on OE/ODFEdit CrossConnection on OE/ODFBrowse CrossConnection on OE/ODFInsert new segment to OE (“T-Spojnica”)Admin menu for administrators
The AssetsMiner topology engine manages much of this functionality. All network enabled spatial datais first processed using the topology engine before it is stored in the database. An example of this is inthe case where new network assets are first inputted into the system. Sophisticated procedures allowvertices of chains to snap to existing network features as they are entered or edited improving dataquality. Advanced core algorithms then process the new data automatically building up connectivityrelationships to maintain an optimized model of the network. All these features are typical of anintegrated approach to network modeling that extends from providing low level structures andfunctionality right though to the user interface.
All network elements must exists in the database as a prerequisite for all data manipulationroutines.Port status cannot be edited. It is exclusively assigned via data manipulation routines.Port status can be in one of the following states:
Working Reserved Planned Temporary Faulty Available Unknown Standby

AssetsMiner FTTX Transmission 39
© 2005 - 2015 by TeleConsult d.o.o.
Filtering rule once established i kept between all menu actions, e.g. (if OE (spojnica in certain city is selected
its interconnections are initially browsed an then it is easy to change action to edit mode or make new
interconnection or remove interconnection just navigating the menu).
3.4.3.1 Create New OE (Spojnica) Ports
Jump to this Action from the georeferenced map node. System Knows which segments terminate in thisnode.
Select cable segments A and B that are connected via this OE.Select checkbox to create connected OE (ravna spojnica) with fibers in Standby status.
Following successful generation screen is automatically reverted to BROWSE mode.
NOTE:When "Ravna spojnica" is created all A side ports are connected to the B side ports of the same index.Port status is automatically set to Standby.
When all relevant data is enterred press Insert button.
All ports for choosen OE type are generated and connected to appropriate cable segments.
3.4.3.2 Create New ODF Ports
Jump to this Action from the georeferenced map node. System Knows which segments terminate in thisnode.
Select cable segment that terminate on ODF Rack/ Panel for which ports will be generated.Select rack and panel number.Select panel size.

AssetsMiner FTTX40
© 2005 - 2015 by TeleConsult d.o.o.
When all relevant data is enterred press Insert button.
All ports for the choosen ODF/RACK/PANEL are generated and connected to appropriate cable segment.
Following successful generation screen is automatically reverted to BROWSE mode.
Note that 96 records are generated for the 48 port panel allowing for A and B side connections, e.g. cable and
equipment side.
3.4.3.3 Edit CrossConnections
This form is used to edit path and remark fields. It is not possible to change existing crossconnectionsor port status manually.Use data manipulations routines as create crossconnections or remove crossconnections to accomplish

AssetsMiner FTTX Transmission 41
© 2005 - 2015 by TeleConsult d.o.o.
your task and preserve data integrity.
Chenge data rows as required and press Submit.
3.4.3.4 Create CrossConnection
Jump to this Action from the georeferenced map node.Select NE (Spojnica or ODF) if required.Select Side from the combo box. System knows how many sides exists for the selected OE/ODF.Enter other filter parameters if appropriate.Select A side port row in the grid and the B side port from the combo box in the same row for eachport combination to be connected.Enter path name if available (very important for end to end tracing).Optionally enter Remark if necessary.
NOTE:Only ports with status Available are listed because only connection-free ports can be interconnected.

AssetsMiner FTTX42
© 2005 - 2015 by TeleConsult d.o.o.
Select A side port row in the grid and the B side port from the combo box in the same row for each port
combination to be connected.
3.4.3.5 Remove CrossConnection
Jump to this Action from the georeferenced map node.Select NE (Spojnica or ODF) if required.Select Status Working or Standby.Select Side from the combo box. System knows how many sides exists for the selected OE/ODF.Enter other filter parameters if appropriate.Check the check box of the crossconnection to be removed.

AssetsMiner FTTX Transmission 43
© 2005 - 2015 by TeleConsult d.o.o.
Check the check box for the interconnection to be removed, then Submit the form.
3.4.3.6 Add New Segment to OE ( Kreiraj T-Spojnicu)
It is often necessary to break certain fiber crossconnections of the "Ravna spojnica" apart and introducenew cable into OE to reroute certain fibers.
Use this transaction to add new cable segment to OE.Select OESelect incoming cable segment (system knows which cable segments terminate on this OE andoffers you with the list of segments via the combo box.Select cable type.Select the logical name for the segment, initially when "Ravna spojnica" is created it has A and Bside. System will offer you the list starting with the first available segment ID up to eight segmentwith ID H. Select segment ID C for the first new additional cable segment besides A and BPress the insert button.System will revert to Browse mode for the selected OE.New segment ports are in the Available status.

AssetsMiner FTTX44
© 2005 - 2015 by TeleConsult d.o.o.
Commonly following this action you will probably want to go to:Remove CrossConnections to free some ports that are in Standby mode for "Ravna spojnica" thengo toCreate CrossConnections to connect required ports from e.g. A side to C side.Check the results .
3.4.3.7 Cable Segment Editor
Within AssetsMiner Transmission point and click to select a cable segment.
Point and (Shift-click left mouse button for muliple selection) to select cable segment(s).
51

AssetsMiner FTTX Transmission 45
© 2005 - 2015 by TeleConsult d.o.o.
Select Segment Editor from the reports menu.
Segment list opens in new window. Click on segment ID to open segment editor.

AssetsMiner FTTX46
© 2005 - 2015 by TeleConsult d.o.o.
Edit cable segment values as popular or common name "IME KABELA", cable length, start and end point
reserves, etc.
3.4.3.8 Import AMCAD Data
AssetsMiner administrator imports data prepared with AMCAD using the Data Transformation Services(DTS) Remote Execution menu - Import from AMCAD.Import from AMCAD command invokes complex procedure that imports new nodes, network elementsand cable segments from Svijetlovodi.MDB prepared with AMCAD and consolidates them with existingdata in the database. For proper functioning DTS requires SQL Server 2000 Agent running.

AssetsMiner FTTX Transmission 47
© 2005 - 2015 by TeleConsult d.o.o.
3.4.3.9 Data Administration
AssetsMiner data administrator can change or append data in database dictionary tables:
According to strict security rules administrator has to additionaly authenticate himself.
Then Admin menu currently with following entries becomes available:NodeNodeTypeNENE TypeNe Type GroupCityRegionCrossCon Status

AssetsMiner FTTX48
© 2005 - 2015 by TeleConsult d.o.o.
Remove SpojnicaAMCAD DTS Data Import
3.4.4 Transmission Reports
Following AssetsMiner transmission reports are currently implemented:
Cable segment status.Browse crossconnections.Visualize crossconnections on OE with up to eight cable segments.End-to-end user path trace at the fiber levelFiber usage drill-down report at the city level.
3.4.4.1 Cable Segment Status
Select cable segments automatically with the combo boxes on the left or select them manually shift-clicking on their GUI representation.

AssetsMiner FTTX Transmission 49
© 2005 - 2015 by TeleConsult d.o.o.
While cable segments are selected choose Segments List report to print all cable attributes.
Report opens in separate w indow. Notice attributes as cable level, cable type, cable length, start / end point
reserve, topological lengt and start / end point IDs.
3.4.4.2 Browse Crossconnections
From the GUI select NE that supports crossconnections.

AssetsMiner FTTX50
© 2005 - 2015 by TeleConsult d.o.o.
Click on node with required OE (Spojnica) or TB or ODF and invoke Browse Crossconections report.

AssetsMiner FTTX Transmission 51
© 2005 - 2015 by TeleConsult d.o.o.
Use auto-refreshing combo boxes or GUI report (as depicted above) to navigate to the cross-connections
report for the selected OE, ODF or TB
3.4.4.3 Visualize CrossConnections
Open AssetsMiner Transmission, navigate to area of interest, select one SPOJNICA and choose reportsmenu -> Spojnica Shema Veza.

AssetsMiner FTTX52
© 2005 - 2015 by TeleConsult d.o.o.
Point and click on SPOJNICA icon, select Draw OE CrossCon report. Note SPOJNICE layer must be on.
Automaticcaly drawn SPOJNICA can be printed or copy-pasted to any office document for furtherprocessing.

AssetsMiner FTTX Transmission 53
© 2005 - 2015 by TeleConsult d.o.o.
OE crossconnections for selected SPOJNICA are automatically drawn using the data from the database.
Incomming and outgoing cable segments, OE ports and users data path are printed too.
3.4.4.4 End to End Path Trace
Operation and maintenance and network rearrangements requires end-to-end path tracing for eachcustomer. This can be done in GIS view or FO usage drill-down report down to the fiber andcrossconnection port on each passive device along the connection path. Of course during the CreateCrossConnections routines path must be specified .
Select named data path on the left.
54
41

AssetsMiner FTTX54
© 2005 - 2015 by TeleConsult d.o.o.
Inspect end to end path trace that includes all cables from POP to customer terminal block.
List cable segment details comprising the path.
3.4.4.5 FO Usage Drill Down
Network wide FO usage drill down report enables quick assessment of network resources from cablesdown to individual fibres and ports on passive equipment.User can trace how network resources are used by individual path or find out reserves on cablesegments and OEs, etc.
Inspect in this intuitive drilldown data cube report how transmission resources are used and which fibers
are available. E.g. select path name and instantly see which transmission resources are consumed, idel for
problem troubleshooting.