Asset & Wealth Management Market Intelligence …...planning. At the same time, institutional...
11
Asset & Wealth Management Market Intelligence Digest South Korea Asset & Wealth Management Market Research Centre Asia Pacific
Transcript of Asset & Wealth Management Market Intelligence …...planning. At the same time, institutional...
Asset & Wealth Management Market Intelligence DigestSouth Korea
Asset & Wealth Management Market Research CentreAsia Pacific

2 South Korea Sample | Summary table of contents
Public onshore fund distribution
Private fund distribution
Robo-advisory
Asia Region Funds Passport (ARFP)
Overview
Subadvisory partnerships
Direct offerings
Joint ventures
Executive summary
Retail investors
Institutional investors
Market landscape
South Korea strength snapshots
Macroeconomic overview
Investor profile - Overview
Household wealth
HNW and UHNW population
Pension funds - Government Employees Pension Service (GEPS)
Pension funds - Performance
Pension funds - OCIO model
Mutual Aid Associations (MAAs) / Credit Unions (CUs)
MAAs/CUs - Korea Teachers’ Credit Union (KTCU)
MAAs/CUs - Military Mutual Aid Association (MMAA)
MAAs/CUs - Public Officials Benefit Association (POBA)
Korea Post
Life insurance - Overview
Life insurance - Asset breakdown
Life insurance - Top life insurers by total assets
Life insurance - Variable life products
Institutional investors - Overview
Sovereign wealth fund - Korean Investment Corporation (KIC)
Pension funds - Overview
Pension funds - National Pension Service (NPS)
Pension funds - Employee Retirement Security Act (ERSA)
Pension funds - Korea Teachers Pension Fund (KTPF)
Overall fund landscape - Overview
Discretionary assets - Overview
Discretionary assets - Asset breakdown
Discretionary assets - Top asset managers by assets
Public onshore funds - Overview
Public onshore funds - Gross sales by investor types
Public onshore funds - Asset breakdown
Public onshore funds - Foreign exposure breakdown
Public onshore funds - Fund flows
Public onshore funds - Top asset managers by assets
Public onshore funds - Top foreign-owned asset managers by assets
Public onshore funds - Overseas investment funds
Public onshore funds - Fees
Public onshore ETFs
Public offshore funds - Overview
Private funds - Overview
Private funds - Gross sales by investor types
Private funds - Asset breakdown
Private funds - Foreign exposure breakdown
Private funds - Fund flows
Private funds - Top asset managers by assets
Private funds - Overseas investment funds
Onshore FoFs
Alternatives - Hedge funds
Alternatives - Private equities
Alternatives - Real estate
Alternatives - Private debt
1.1
1.2
3.1
3.2
3.3
4.7
4.8
4.9
4.10
4.11
4.12
4.13
4.14
4.15
4.16
4.17
4.18
4.1
4.2
4.3
4.4
4.5
4.6
2.1
2.2
2.3
2.4
2.5
2.6
2.7
2.8
2.9
2.10
2.11
2.12
2.13
2.14
2.15
2.16
2.17
2.18
2.19
2.20
2.21
2.22
2.23
2.24
2.25
2.26
2.27
Summary table of contents
Distributions
Market entry for foreign asset managers
6.1
6.2
6.3
6.4
5.1
5.2
5.3
5.4
Competitive analysis
Regulations
Costs
Asset managers by total fund assets
Mutual funds - Comparison by assets
Mutual funds - Comparison by flows
Case studies of selected asset managers
Regulatory bodies
Regulatory framework and key legislative texts
Foreign fund distribution
Taxes
Recent regulatory developments
Office costs
Salaries comparison
7.1
7.2
7.3
7.4
8.1
8.2
8.3
8.4
8.5
8.1
8.2

Key takeaways | South Korea Sample 3
• The private fund market in Korea is the fastest growing fund market. Its assets surpassed public onshore fund assets for the first time in 2016.
• The growth was attributed to the growing and younger HNW population that seek for more customised wealth management planning. At the same time, institutional investors continued to favour such products over mutual funds, as it offered more investment flexibility.
Rise of subadvisory partnership agreements
Key takeaways
Investors seek more overseas exposure
Institutional investors are key for global managers
Strong asset boost in private fund market
• Investors are seeking more diversified portfolios, especially in overseas through OIF (Overseas Investment Fund) products. In the first half of 2017, OIF assets grew by 7.8% to $27.3 billion from $25.3 billion.
• On top of that, tax exemption on all returns from locally domiciled equity funds and ETFs that invest more than 60% in foreign equities, may potentially attract more OIF products launch in the near future.
• The institutional space continues to provide opportunities for global asset managers, given that the pension funds and mutual aid associations are among the most active mandate issuers in the market.
• In particular, they are seeking more alternative investments managers via funds and mandates. In 2017, a total of 23 mandates were issued, totalling $2.9 billion. Of the mandates that were handed out, the majority (29.6%) of the mandates issued were in private debt.
• In recent years, there are increasing number of foreign managers entering the market, amid the positive regulatory change and investors shifting their assets into overseas investments.
• Most of these managers choose to enter the market via subadvisory arrangements, where local managers tap on the foreign managers’ investment capabilities through OIFs or invest directly into the latter’s funds through feeder/FoF structure.
1 2
3 4

4 South Korea Sample | Market landscape
All segments saw growth in the first half of 2017
The Korean asset management market – made up of discretionary, public and private fund assets – nearly reached $800 billion mark in 2017. In the last half of 2017, total assets grew by 8.0%, surpassing the year-on-year growth of 7.8% in 2016. Notably, private funds saw the largest growth in assets, at 12.6%.
Across all three segments, the discretionary segment has been growing rapidly accounting for bulk of the total asset management market’ assets since 2011. The proportion from discretionary segment had increased 4.4 percentage points from 43.8% in 2011 to 48.2% in 2017. On the other hand, proportion of public fund assets declined 11.9 percentage points from 35.4% to 23.6% within the same period.
Market landscape Total Asset Management Market in Korea (USD Bn), 2008 – 2017
2008
Discretionary Private Fund Assets Public Fund Assets
2009 2010 2011 2012 2013 2014 2015 2016 2017
0%
100%
200%
300%
400%
500%
600%
700%
800%
181.0 188.8 169.8
94.8
158.7
175.8 181.5
183.8177.9
187.3
92.7
111.6
177.6
132.9 151.8
165.1199.1
224.1
86.1 97.2196.3
247.8 275.6 272.3333.6 358.4 328.8
Market landscape | South Korea Sample 5
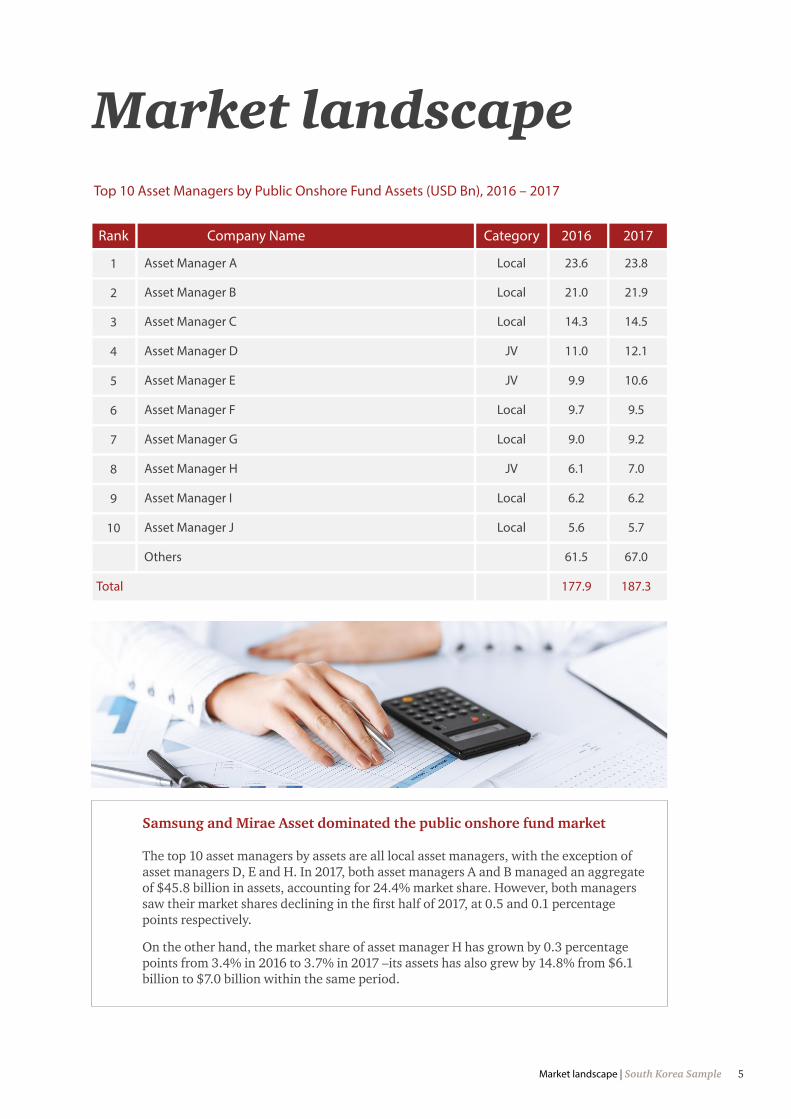
Samsung and Mirae Asset dominated the public onshore fund market
The top 10 asset managers by assets are all local asset managers, with the exception of asset managers D, E and H. In 2017, both asset managers A and B managed an aggregate of $45.8 billion in assets, accounting for 24.4% market share. However, both managers saw their market shares declining in the first half of 2017, at 0.5 and 0.1 percentage points respectively.
On the other hand, the market share of asset manager H has grown by 0.3 percentage points from 3.4% in 2016 to 3.7% in 2017 –its assets has also grew by 14.8% from $6.1 billion to $7.0 billion within the same period.
Market landscapeTop 10 Asset Managers by Public Onshore Fund Assets (USD Bn), 2016 – 2017
Rank
1
2
3
4
5
6
7
8
9
10
Asset Manager A
Asset Manager B
Asset Manager C
Asset Manager D
Asset Manager E
Asset Manager F
Asset Manager G
Asset Manager H
Asset Manager I
Asset Manager J
Others
Total
Local
Local
Local
JV
JV
Local
Local
JV
Local
Local
23.6
21.0
14.3
11.0
9.9
9.7
9.0
6.1
6.2
5.6
61.5
177.9
23.8
21.9
14.5
12.1
10.6
9.5
9.2
7.0
6.2
5.7
67.0
187.3
Company Name Category 2016 2017

6 South Korea Sample | Institutional investors
Pension funds
Insurance companies
Sovereign wealth funds
Mutual aid associations
• There are a total of four Korean pension funds which are known to outsource assets to asset managers via funds or mandates. Their combined investable assets saw year-on-year growth of 7.7% from $559.9 billion in 2015 to $603.0 billion in 2016.
• Of which, the state-run pension fund, National Pension Service (NPS), is the most active in terms of outsourcing assets to external managers – 140 managers for domestic investments and 191 managers for overseas investments. As of end-2016, its outsourced investments stood at 37.4% of its total assets.
• In 2017, there were 25 life insurance players with a total of $558.6 billion in assets. Domestic insurers continued to dominate the life insurance market, with a market share of 86.8%.
• Korean life insurers have been actively investing in foreign securities. Between 2012 and 2017, the proportion of foreign securities grew by 8.7 percentage points from 4.6% to 13.3%. In absolute terms, assets from foreign securities nearly quadrupled from $19.4 billion to $74.2 billion during the same period.
• The KIC is ranked 6th in Asia, accounting for $110.8 billion in assets as of end-2016. Of which, alternative investments saw the largest growth in assets, aggregating a 4-year CAGR of 44.5%.
• In absolute terms, assets coming from alternative investments has more than quadrupled from $3.5 billion in 2012 to $15.1 billion in 2016. In particular, KIC has been aggressively allocating its assets into real estate, infrastructure and private equity.
• As of end-2016, there were 76 mutual aid associations in Korea. These associations were established to offer financial, welfare, and other social security services to particular segments of the private sectors.
• Taking into consideration the six key associations that outsource assets to asset managers, their combined investable assets stood at $46.0 billion as of 2016. Most of these associations allocated at least 45% of their asset in alternative investments.
Institutional investors
1
2
3
4

Institutional investors | South Korea Sample 7
Institutional investorsPension funds - National Pension Service (NPS)
NPS Portfolio (USD Bn), 2012 - 2016
0.5 0.5
0
0%
50
10%
100
20%
150
30%
200
40%
250
50%
300
60%
350
70%
450
90%
400
80%
500
100%
NPS Investment Assets* by Type (%), 2012 - 2016
Bond
Domestic
Equity
Overseas
Alternative Investments Others
2012
2012
2013
2013
2014
2014
2015
2015
2016
2016
128.1
42.5
257.2
140.5
46.5
249.1
Foreign alternative investments drive bulk of the asset growth
Across all asset classes, assets invested in foreign alternative investments saw largest year-on-year growth, at 25.8% to hit $52.8 billion in end-2016. In fact, the asset class has achieved consistent double-digit growth since 2012, aggregating a 4-year CAGR of 26.0%. This resulted in its market share to rise by 3.7 percentage points from 3.7% in 2012 to 7.5% in 2016.
NPS’s allocation in overseas investments was the highest across all pension funds, at 27.0% as of end-2016. The assets grew more than doubled from $60.0 billion in 2012 to $125.2 billion in 2016. Of which, foreign equity investments accounted for bulk of the market share, at 56.8%. This was followed by alternative investments, at 27.7%, and the remaining 15.5% share went to foreign bond investments.
98.1
30.9
0.4
238.0
0.5
122.1
38.4
245.3
0.5
156.2
52.8
254.3
16.4%
83.6%
19.4%
80.6%
21.9%
78.1%
24.3%
75.7%
27.0%
73.0%

8 South Korea Sample | Public onshore fund distribution
Public onshore fund distributionPublic Onshore Fund Distribution in Korea* (%), 2012 – 2017
43.7%
2.5% 2.9% 3.4% 2.6% 2.6% 2.8%3.9% 3.6% 3.2% 3.0% 2.7%2.8%
50.0%
Securities Firms Banks Others Insurance
0%
10%
20%
30%
40%
50%
60%
70%
90%
80%
100%
2012 2013 2014 2015 2016 2017
45.3%
48.2%
41.7%
51.7%
42.5%
52.0
42.9% 41.1%
51.6% 53.4%
Securities firms and banks are key in distribution
In Korea, public onshore fund distribution is largely dominated by securities firms, with banks following closely behind. This is not surprising given that all the top 10 asset managers have an affiliated bank or securities firm to help with fund distribution in the country.
Between 2012 and 2017, their combined market share of public onshore fund distribution has increased by 0.9 percentage points from 93.6% to 94.5%. This was largely due to securities firms, where the market share increased by 3.4 percentage points to 53.4% within the same period. This can be attributed to the shift of securities firms from brokerage-driven revenue model to wealth management service model.
Online platforms, including robo advisors, remain a small avenue of distribution, but are gradually gaining more traction as the government has been actively pushing for fintech initiatives since 2016. Korea’s first online fund supermarket, Fund Online Korea, was officially launched in March 2014, with the aim to break the dominant share of securities firms and banks. However, its fund sales only accounted for 0.4% of the total public fund distribution in 2017.
* Includes fund of funds. Based on a proxy of total gross sales.
Asia Pacific Market Intelligence Digest | South Korea Sample 9
Asia Pacific Market Intelligence DigestOur structured, research-based analysis sheds light on the multiple factors affecting your asset & wealth management business.
Each market intelligence digest report provides you with insight on:
• The state of the asset & wealth management industry
• The key trends shaping the future of the industry
• Products that are in demand
• Your competitors
• Various types of investors and their asset allocations
• Fund selectors and the asset classes that interest them
• The distribution channels and how they are evolving
• High level regulatory information to get you started or access the market place
• Prevailing market strategies
(These are non-standardised reports that will be customised to your business needs by focusing on any specific aspect of the market place to suit your market-entry need.)
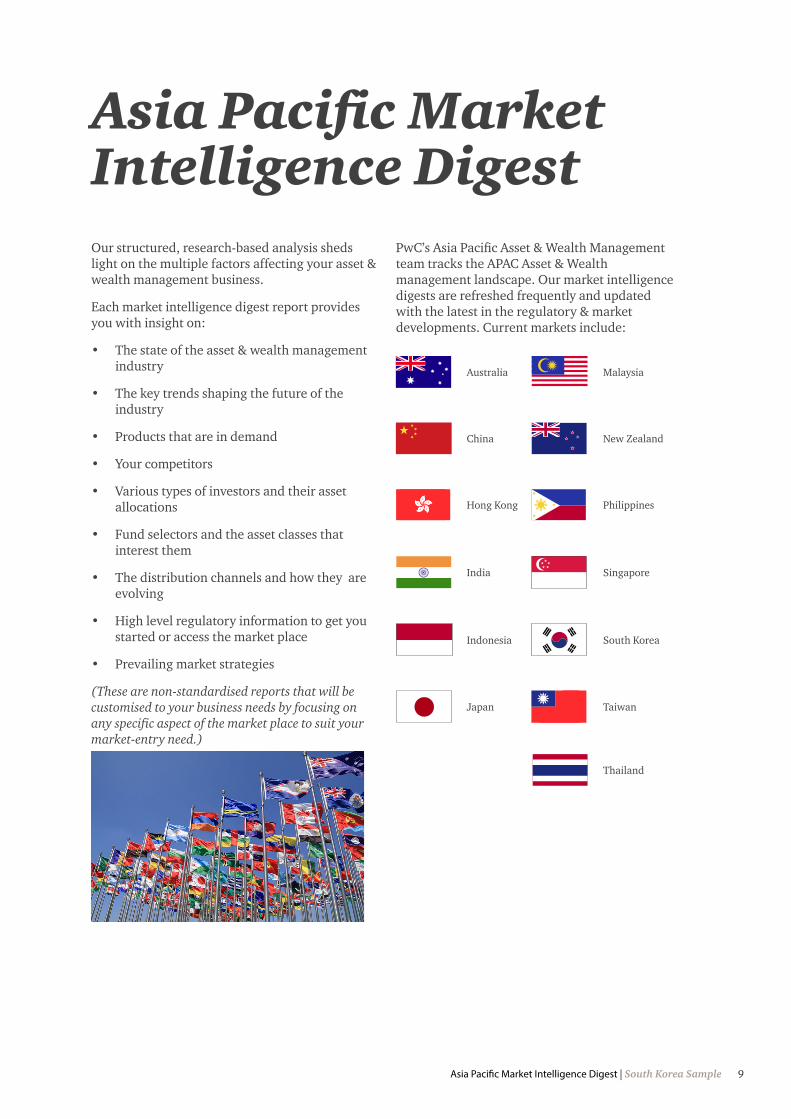
PwC’s Asia Pacific Asset & Wealth Management team tracks the APAC Asset & Wealth management landscape. Our market intelligence digests are refreshed frequently and updated with the latest in the regulatory & market developments. Current markets include:
Australia Malaysia
China New Zealand
Hong Kong Philippines
India Singapore
Indonesia South Korea
Japan Taiwan
Thailand
10 South Korea Sample | Asian Investment Fund Centre
Operational & Investment due diligence on asset managers
Fund structuring
ESG/SRI for investment funds
Distribution strategy
Market publications
Country reports
Market entry
Asian Fund Passport readiness
Fund distribution & registration
Jurisdiction analysis
Investment fund fees analysis
Market Intelligence and Newsflash
The Asian Investment Fund Centre, headquartered in Singapore, is part of PwC’s network of Asset & Wealth Management industry specialists in Asia Pacific that delivers to its client a one-stop-shop cross border service offering.
Armin ChokseyPartner, Asian Investment Fund Centre andAsia Pacific Market Research Centre LeaderPwC Singapore
T: + 65 6236 [email protected]
Asian Investment Fund Centre

© 2018 PricewaterhouseCoopers LLP. All rights reserved. “PricewaterhouseCoopers” and “PwC” refer to the network of member firms of PricewaterhouseCoopers International Limited (PwCIL), or, as the context requires, individual member firms of the PwC network. Each member firm is a separate legal entity and does not act as an agent of PwCIL or any other member firm.
www.pwc.com/sg