Asset Performance Evaluation - nihe.gov.uk · The 30-year net present value ... is in asset groups...
63
Prepared For: DSD Lighthouse Building 1 Cromac Place Gasworks Business Park Ormeau Road Belfast BT7 2JB Prepared By: Savills (UK) Limited 33 Margaret Street London W1G 0JD DSD/NIHE Asset Performance Evaluation Model Position Report 2014/15 May 2015
Transcript of Asset Performance Evaluation - nihe.gov.uk · The 30-year net present value ... is in asset groups...

Prepared For:
DSD
Lighthouse Building
1 Cromac Place
Gasworks Business Park
Ormeau Road
Belfast
BT7 2JB
Prepared By:
Savills (UK) Limited
33 Margaret Street
London
W1G 0JD
DSD/NIHE Asset Performance Evaluation Model Position Report 2014/15
May 2015

DSD/NIHE Asset Performance Evaluation Model Position Report 2014/15
Contents
DSD/NIHE
Asset Performance Evaluation Model Position Report
2014/15
Contents
1.0 EXECUTIVE SUMMARY .............................................................................................................. 1
2.0 PROJECT OVERVIEW ................................................................................................................ 5
Stage 1: Financial Model: Model Structure And Asset Groups ............................................. 6
Stage 2: Financial Model: Information Collected .................................................................... 9
Stage 3: Financial Model: Cash flow Modelling ....................................................................19
3.0 DATA INPUTS AND LIMITATIONS ..........................................................................................20
4.0 FINANCIAL MODELLING RESULTS ........................................................................................21
5.0 SUSTAINABILITY ......................................................................................................................35
6.0 CONCLUSION AND APPLICATION OF RESULTS .................................................................41
Appendices
Appendix 1 – Asset Groups
Appendix 2 – Asset Group Performance Maps
DSD/NIHE Asset Performance Evaluation Model Position Report 2014/15
Page 1
1.0 EXECUTIVE SUMMARY
1.1 This report sets out the findings from the asset modelling that has been carried out on the
tenanted housing stock of the Northern Ireland Housing Executive (NIHE). It has been
prepared for the Department for Social Development (DSD) as part of the 2014 Asset
Commission under client requirement 5.
1.2 The modelling is intended to inform an investment strategy based on an active asset
management approach where NIHE seeks to make investment decisions based on the
financial performance of the stock, in a way that strengthens the operating cash flows
associated with landlord assets and contributes to meeting NIHE and DSD social housing
policy objectives.
1.3 The analysis focuses on 87,219 tenanted units the majority of which are general needs
tenancies, with one sheltered housing block. For the purposes of analysis, the stock is broken
down into 509 asset groups, each containing properties with similar characteristics, in a similar
location.
1.4 The asset performance evaluation (APE) model produces the following key results:
The 30-year net present value (NPV) of the income and expenditure associated with a
tenanted housing stock of 87,219 units stands at £11.2m, equivalent to an average of
£128 per unit. This reflects a range of NPV levels across stock and is relatively evenly
distributed across the different regions of NIHE’s landlord stock.
Just under 44% of the stock (37,974 units) is in asset groups with an average NPV per
unit which is negative.
A large proportion of the negative NPV (73%) is concentrated in 12,186 units in asset
groups with an average NPV below minus £7,500 per unit.

DSD/NIHE Asset Performance Evaluation Model Position Report 2014/15
Page 2
Just over 56% of the stock (49,245 units) is in asset groups that have a positive NPV.
Within the positive NPVs there is just over 20% of the stock (17,842) units with marginal
cash flows with an average NPV of below £5,000.
1.5 Overall performance is weak when compared with similar large landlords in other jurisdictions.
It represents a decline in performance when compared with the results from earlier analysis by
Savills in 2009 which showed an average NPV of £2,500. Performance has declined, as
predicted in 2009, as income has been, and is forecast to continue to be, insufficient to meet
revenue and capital costs.
1.6 The initial analysis is based on investment needs identified in Savills stock condition survey
that formed part of the same asset commission. Costs for day to day management and
maintenance are based on an analysis of NIHE budgets. Rents are based on NIHE’s current
rent levels and the base line position reflects a projected rent increase of CPI + 1% (3%) in
line with average increases over the last ten years.
1.7 DSD is currently consulting on a revised rent policy for Northern Ireland and if adopted this
would significantly improve the financial position of the assets, increasing average NPVs by
between £8,000 - £10,000 per unit. This would lift large proportions of the stock from negative
to positive performance. However, fundamental issues of low demand and high investment
need in particular locations and property types would remain, in particular with Tower Blocks,
a proportion of the non traditional homes and smaller properties with low rents and high
investment needs.
1.8 NPV results have been correlated with open market values provided by NIHE in order to
explore the extent to which NIHE could maximise the latent value in its assets and to inform
options appraisals for poorer performing asset groups.

DSD/NIHE Asset Performance Evaluation Model Position Report 2014/15
Page 3
1.9 Social sustainability modelling has identified the socio economic context of each asset group.
The analysis used publicly available data for example from the Indices of Multiple Deprivation
(IMD) and Northern Ireland Neighbourhood Information Service (NINIS) alongside a range of
internal data from NIHE covering measures linked to key objectives of better services, better
homes and vibrant communities.
1.10 14% of the stock (11,861 units) shows poor sustainability from both a financial and non
financial basis. This stock represents priorities for options appraisals to explore how
performance can be improved.
1.11 The results from this asset and sustainability analysis is being used by NIHE to develop an
asset management strategy including:
The adoption of an active asset management approach to delivering investment. This
will mean making investment in the key areas of need identified via the survey in those
properties identified through this performance evaluation as having a long term life.
The production of a 5 year investment plan incorporating the principles set out in the
asset management strategy.
A programme of option appraisal for those other properties identified via the appraisal
process as requiring careful thought prior to making significant investment.
Working with partners to deliver physical, social, community and economic outcomes to
sustain neighbourhoods and communities.
A programme of small scale voluntary transfers (SSVT) using an estate based approach
in order to rationalise local estate management, maximise value and involve local
communities.

DSD/NIHE Asset Performance Evaluation Model Position Report 2014/15
Page 4
1.12 The results can also be used by DSD in its oversight role and to support the Social Housing
Reform Project including:
The establishment of a baseline of current asset management performance against
which future performance can be monitored and managed.
Demonstration of value for money in investment decisions and investment delivery.
Ensuring resources are targeted effectively to deliver DSD’s housing strategy.
Providing a link between housing, community planning and regeneration.
Informing the appraisal of landlord options as part of SHRP, demonstrating the scale of
asset management challenge to be faced by any future landlord of the stock.
Informing the offer to residents.
Informing SSVT and mixed model appraisals.

DSD/NIHE Asset Performance Evaluation Model Position Report 2014/15
Page 5
2.0 PROJECT OVERVIEW
2.1 This report sets out our findings in respect of the financial performance of NIHE’s housing
stock. This report provides the evidence base on which stock investment and other strategic
decisions can be taken and enables NIHE to demonstrate financial and social return from
those investment decisions.
2.2 The objective of the financial exercise is to produce income and expenditure projections for
each asset group over a defined investment period and to evaluate the socio economic
performance of the neighbourhoods in which the assets are located. From this it is possible to
identify the stronger and weaker performing assets within the stock from both a financial and
social sustainability perspective. The results of this work can advise on where best to target
investment and other initiatives, such as disposals or re-development as well as community
planning and regeneration.
2.3 The properties covered in this report include 87,219 units which form part of NIHE’s residential
housing stock. It excludes other tenures (e.g. travellers’ sites and shared equity) and also
excludes properties where decisions have already been taken to dispose or demolish. In total
some 500 properties are excluded for these reasons. We have excluded from this report all
other elements of stock, for example, non dwelling assets (e.g. garages).
2.4 The following paragraphs set out the key stages of works associated with the financial
modelling process.

DSD/NIHE Asset Performance Evaluation Model Position Report 2014/15
Page 6
Stage 1: Financial Model: Model Structure And Asset
Groups
2.5 For the purposes of financial analysis, we have broken down the tenanted housing stock
(comprising 87,219 units) into 509 ‘asset groups’. The groupings are by:
Region
Area
Property archetype (property type, age and construction)
2.6 The model is built up at an individual property level and the assets are then grouped for
analysis. This means that the groupings can be changed subsequently depending on NIHE
requirements in future.
2.7 The asset groups chosen are of varying sizes. However the breakdown is designed to ensure
that the assets comprising the groups perform similarly from a financial perspective and can
be identified easily to aid further detailed analysis. The stock breakdown by asset group is
shown in Appendix 1.
2.8 In order to keep the size of each model manageable within the limits of excel, and in order to
address requirements for early reporting of some aspects, the stock has been split across 8
models as follows:
Tower Blocks – model developed for early stage strategy development and updated
with final survey results.
SSVT areas originally identified (971 units).

DSD/NIHE Asset Performance Evaluation Model Position Report 2014/15
Page 7
Remaining stock split by Regions/Area across 6 models as illustrated below.
Figure 1 Model structure

DSD/NIHE Asset Performance Evaluation Model Position Report 2014/15
Page 8
Model Unit nos
Tower Blocks 1,629
SSVT 971
Model 1 - Belfast Lisburn & Castlereagh + South & East 16,489
Model 2 - Belfast West + North 13,817
Model 3 - North Causeway + West + whole NORTH RURAL COTTAGE AG 15,795
Model 4 - North East & South Antrim - without NORTH RURAL COTTAGE AG 11,201
Model 5 - South Mid Ulster + South West + South - without SOUTH RURAL COTTAGE
15,376
Model 6 - South North Down & Ards + South Down + whole SOUTH RURAL COTTAGE
11,941
87,219
Table 1 – Model structure and unit numbers

DSD/NIHE Asset Performance Evaluation Model Position Report 2014/15
Page 9
Stage 2: Financial Model: Information Collected
Data Sources and Key Assumptions
2.9 The financial model has drawn upon data from the stock condition survey carried out by
Savills and other data supplied by NIHE. The information we have collected for our financial
model can be broken down as follows:
Stock data (including addresses, dwelling types, age, house types, use) from NIHE’s
Housing Management System (HMS) extract dated 18/8/2014.
2014/15 rent levels for each dwelling from HMS extract dated 18/8/2014 uplifted at
4.85% to reflect agreed rent increases to 2015/16.
Historic void periods (over slightly more than three financial years, setting out rent loss
days) for the tenanted stock based on data provided by NIHE on “voiddata as of
101014.xls”.
Day to day repair including planned/cyclical, response and void maintenance from NIHE
2014/15 budgets provided on “property related spend & income.xls” for repairs, uplifted
by RPI @ 2.3% to bring them to 2015/16 price base.
Management costs are taken from the Overview of the Housing Executive’s
management costs prepared by the Housing Executive and PwC dated 4th December
2014 and termed the approximation model.
Data from the Savills stock condition survey reported March 2015 which provides a 30-
year cost profile for future major investment and external painting.

DSD/NIHE Asset Performance Evaluation Model Position Report 2014/15
Page 10
Data on open market value based on values provided by NIHE on “Tenanted Houses
OMV Valuations @ 310314.xls”.
All major investment work is subject to a 10% addition for the technical administration of
the programme.
No VAT is assumed to be payable based on the current VAT position of NIHE.
Base future RPI Inflation has been assumed at 2.5%, and future CPI at 2%.
Major investment costs are assumed to rise annually at a rate of 2.5% (RPI / CPI plus
0.5%), including an initial uplift of half the September 2014 RPI rate (1.15% of 2.3%) to
bring the cost estimates to a mid 2015/16 price base for year one of the model.
Day to day repair and management costs are assumed to rise with inflation at RPI
(2.5%).
Rents are assumed to increase in line with the average rent increase over the last 10
years of RPI + 0.5% (3%).

DSD/NIHE Asset Performance Evaluation Model Position Report 2014/15
Page 11
Stock Condition Data
The asset model looks at the cost of works to tenanted properties only based on the outputs of the
stock condition survey at the Commonly Adopted Standard. Costs which can be recovered from
leaseholders and costs associated with related assets, environmental improvement works and
disabled aids and adaptations are excluded from the asset model. The impact of the costs of these
works not included will need to be considered as part of the overall business plan, but will not impact
on an assessment of the relative performance of tenanted assets.
2.11 The total 30 year works cost from the stock condition survey included in the asset model is
£4.3bn (£49,305 per unit) before the addition of the provision for technical administration and
inflation.
2.12 The treatment of costs from survey report to APE model is illustrated below.
Description Total from Stock Condition Survey Commonly Adopted Standard
Total included in APE model
Difference Comments
Programmed Renewals £3,698,752,594 £3,682,359,956 £16,392,638 Excluding costs relating to property not in APE model
Tower Block Structural £37,547,145 £34,772,479 £2,774,666 Minimum structural work recharged to leaseholders pro rata. Difference between minimum structural work and overcladding assumed to be unrecoverable from leaseholders
Tower Block M & E £13,566,000 £11,593,260 £1,972,740 M&E repairs recharged to leaseholders pro rata.
Related Assets £54,837,230 £34,528,851 £20,308,379 Excluded = garages, commercial. Excludes 12 hostel units not in model. Other costs pro rata from 87439 – 87219
DSD/NIHE Asset Performance Evaluation Model Position Report 2014/15
Page 12
Description Total from Stock Condition Survey Commonly Adopted Standard
Total included in APE model
Difference Comments
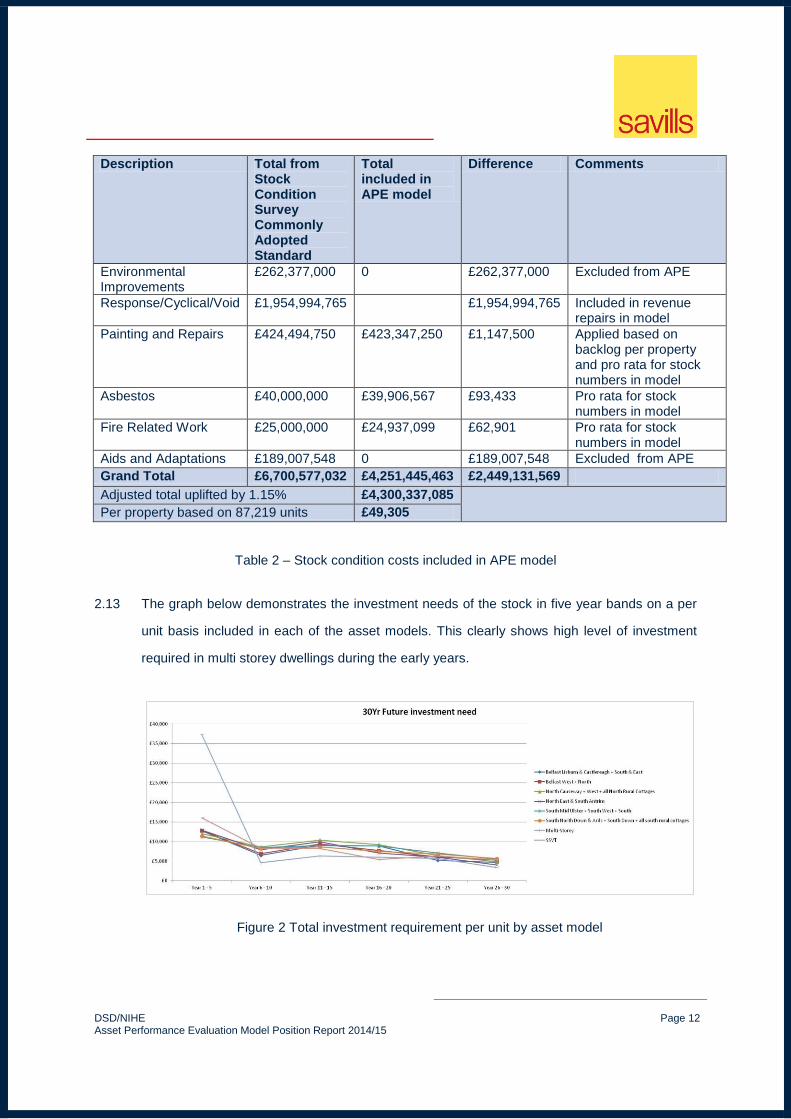
Environmental Improvements
£262,377,000 0 £262,377,000 Excluded from APE
Response/Cyclical/Void £1,954,994,765 £1,954,994,765 Included in revenue repairs in model
Painting and Repairs £424,494,750 £423,347,250 £1,147,500 Applied based on backlog per property and pro rata for stock numbers in model
Asbestos £40,000,000 £39,906,567 £93,433 Pro rata for stock numbers in model
Fire Related Work £25,000,000 £24,937,099 £62,901 Pro rata for stock numbers in model
Aids and Adaptations £189,007,548 0 £189,007,548 Excluded from APE
Grand Total £6,700,577,032 £4,251,445,463 £2,449,131,569
Adjusted total uplifted by 1.15% £4,300,337,085
Per property based on 87,219 units £49,305
Table 2 – Stock condition costs included in APE model
2.13 The graph below demonstrates the investment needs of the stock in five year bands on a per
unit basis included in each of the asset models. This clearly shows high level of investment
required in multi storey dwellings during the early years.
Figure 2 Total investment requirement per unit by asset model

DSD/NIHE Asset Performance Evaluation Model Position Report 2014/15
Page 13
2.14 The asset model draws expenditure requirements from the survey data in order to provide a
true assessment of need. It is not adjusted for affordability as may be the case within the
landlord’s business plan or decisions about programming of works. The asset model can then
be used to determine how the smoothing of the investment profile is implemented across
different asset groups if this is required for investment or business planning purposes.
Maintenance Costs
2.15 Costs for responsive void and cyclical repairs have been taken from 2014/15 budgets uplifted
by RPI at 2.3% to bring costs to a 2015/16 cost base.
2.16 The Housing Executive maintenance budgets for 2014/15 and the outturn from the previous
four years were reviewed. The costs fall mainly within budget codes RX4, RX5 and RX8
which total annual expenditure of £164.3m for 2014/15. In consultation with NIHE finance,
elements from these budgets which relate to responsive, void and cyclical works were
identified. Costs in the budgets relating to major works were excluded to avoid double
counting with survey costs above. Relatively small costs in the budgets relating to
management and non-landlord functions were excluded. Income from leaseholders was netted
off costs.
2.17 The result of these adjustments was to reduce the £164.3m expenditure to a figure of £65.2m
relating to responsive, void and cyclical repairs expenditure. This represents an average cost
per unit of £742.84 per dwelling at 14/15 prices. The cyclical element of expenditure was
varied based on costs that apply to different property types (e.g. multi storey and other flats).
The net results were a cost per unit as set out below.
£ p.u.p.a
Total unit rate - houses/bungalows 722.84
Total unit rate – multis 1,287.09
Total unit rate - other flats 771.64
Average total 742.84
Table 3 – Responsive, void and Cyclical per unit per annum by property type

DSD/NIHE Asset Performance Evaluation Model Position Report 2014/15
Page 14
2.18 The responsive element of these costs (£294.49 per unit per annum) was further varied based
on an analysis of historic responsive repair history with those properties with a higher average
cost of the last three years taking a weighted average of +5% and +2.5% and those properties
with a lower average cost over the last three years taking a weighted average of -5% and -
2.5%. The result is a range of unit costs from £724.40 to £1,332 per unit per annum, including
an uplift of 2.3% that was applied to bring costs up to a 2015/16 cost base.
External Cyclical Maintenance
2.19 Further provision has been added to current Housing Executive repair budgets in the stock
survey estimates for external painting. The allowance is £150 per year for all homes.
Alongside investment to the CAS standard this is considered sufficient to provide for a 5 year
cycle of “painting and repair” representing an average cost over 30 years of £4,500 for all
properties. We have been provided with a list of properties which have not had any external
cyclical maintenance in the previous 8 years (41,149 properties). An additional allowance of
£150 per year for the first five years has been included for these properties to allow for an
accelerated programme to address the backlog of painting and prior to paint repairs.
2.20 The budgets show total costs for responsive and void repairs of £18.8m (including £1.3m for
repairs management). This cost varies across the stock with a weighted average applied
based on an analysis of levels of historic repair expenditure.
Management Costs
2.21 Management costs have been taken from the NIHE approximation model which splits costs
between landlord and regional. This shows total landlord costs of £86.952 million. DLO costs
of approximately £15 million were then excluded (as these are included within the repairs
costs). Other minor adjustments were made to ensure no double counting with other
elements of costs picked up in repairs costs, and to ensure all elements had been included
DSD/NIHE Asset Performance Evaluation Model Position Report 2014/15
Page 15
either in repairs or management. The total management costs in 2014/15 were estimated at
£61.566 million. This equates to an average cost per home of £701.80.
2.22 Further analysis was carried out to identify those elements of management costs that relate
only to Tower Blocks. These are costs relating to concierge and caretaking costs as set out
below:
£2.3m for concierge services to 929 tenants
£226K for caretaking services to 700 tenants
2.23 When these costs are removed from the general management costs, this reduces the average
for the general management service to £673.04 per unit per annum.
2.24 When the additional costs of concierge and caretaking services in Tower Blocks is added to
the adjusted average of £673.04 for other management services, the results is management
costs for tenanted units in multi storey properties as follows:
Tower block with concierge £3,144.74 per unit per annum
Tower block with caretaker £996.31 per unit per annum
2.25 The average concierge cost of £3,144.74 per unit is varied between different blocks based on
the level of concierge service provided. This variation was driven by information provided by
NIHE and ranges from just over £2,000 p.u.p.a to over £4,000 p.u.p.a.
2.26 All costs were then increased by 1% (as advised by NIHE) to bring them up to 2015/16 values
for year one of the model.

DSD/NIHE Asset Performance Evaluation Model Position Report 2014/15
Page 16
Rents and Rent Loss from Voids and Bad Debts
2.27 Rents were based on data from HMS for 2014/15, uplifted by 4.85% to reflect the rent
increase that applied in April 2015. The average starting rent is £66.64 per week on a 52
week basis. The rents do not vary significantly at a regional level but do vary by property type,
with rents for tower blocks being lower on average than for the general stock as illustrated
below.
Figure 3 Average weekly rent 2015/16 by region and model
2.28 Historic data on void occurrences and timescales has been analysed in order to consider a
reasonable forward projection of rent loss from voids. This has been analysed by asset group.
The average annual % of void days for the entire portfolio included in the models is 1.39%
although this varies across the portfolio by geography and property type, with increasing
pockets of high voids concentrated in particular local areas. Adjustments to the historic
average rate was agreed with NIHE in the case of asset groups that have had no recent void
history and asset groups where voids had been higher due, for example, to management
reasons that would not be expected to reoccur in the next 30 years.
2.29 The range of rent loss from voids across the regions is illustrated below showing original void
rate based on 3 years historic data, and the adjusted void rate agreed with NIHE.

DSD/NIHE Asset Performance Evaluation Model Position Report 2014/15
Page 17
Figure 4 Average void loss by region and model
2.30 An allowance for bad debts and rent not collected was added at 2% across all the stock.
2.31 Following agreed adjustments to void history the average rent loss from voids and bad debts
for the entire portfolio is 3.25% which ranges from 2% to almost 26% across different asset
groups.
2.32 There are a total of 4,637 properties in asset groups with an average rent loss from voids and
bad debts above 5%. These are shown below.

DSD/NIHE Asset Performance Evaluation Model Position Report 2014/15
Page 18
Table 4 – Asset groups with void/bad debts above 5%
Asset group
Avg. %
Void &
Bad
debts
Loss Belfast South & East Belfast Inner East Belfast HOUSE Pre 1945 6.47%
Belfast South & East Belfast FLAT/MAIS 1961-1980 6.19%
Belfast Lisburn & Castlereagh Castlereagh Urban & Rural FLAT/MAIS 1961-1980 6.09%
Belfast South & East Belfast FLAT/MAIS Pre 1945 12.00%
Belfast Lisburn & Castlereagh HOUSE Pre 1945 5.15%
Belfast North Belfast FLAT/MAIS 1945-1960 & Pre 1945 7.01%
Belfast North Belfast Outer North Belfast HOUSE Pre 1945 5.18%
Belfast North Belfast FLAT/MAIS 1961-1980 7.36%
Belfast West Belfast NTrad-NO FINES FLAT/MAIS 5.63%
Belfast North Belfast NTrad-NO FINES FLAT/MAIS 6.60%
Belfast West Belfast Moyard Hostel 7.89%
North West HOUSE Pre 1945 6.81%
North West NTrad-NO FINES BUNGALOW 5.23%
North West Strabane Rural HOUSE POST 1980 5.27%
North West NTrad-TIMBER FRAMED FLAT/MAIS 6.22%
North East Larne Urban Bungalow 1961-1980 6.28%
North East Ballymena Urban HOUSE 1961-1980 5.60%
North East Ballymena Urban FLAT/MAIS 1961-1980 6.52%
North East Carrickfergus Rural FLAT/MAIS 1961-1980 5.20%
South South Armagh Rural FLAT/MAIS 1961-1980 6.00%
South South Armagh Urban FLAT/MAIS 1961-1980 8.21%
South South HOUSE Pre 1945 6.15%
South South Banbridge Rural FLAT/MAIS 1961-1980 25.86%
South Mid Ulster NTrad-TIMBER FRAMED FLAT/MAIS 17.73%
South South Down Down Urban FLAT/MAIS 1961-1980 5.50%
Belfast Lisburn & Castlereagh CREGAGH KILBRONEY HOUSE FLAT/MAIS & BEDSIT MULTI-STOREY 8.47%
North South Antrim MID RATHCOOLE ABBOTSCOOLE HOUSE FLAT/MAIS MULTI-STOREY 12.00%
North South Antrim MID RATHCOOLE Carncoole House FLAT/MAIS MULTI-STOREY 12.00%
North South Antrim MID RATHCOOLE Glencoole House FLAT/MAIS MULTI-STOREY 12.00%
North South Antrim MID RATHCOOLE MONKSCOOLE HOUSE FLAT/MAIS & BEDSIT MULTI-STOREY 12.00%

DSD/NIHE Asset Performance Evaluation Model Position Report 2014/15
Page 19
Stage 3: Financial Model: Cash flow Modelling
2.33 All the data identified above, both current and historic, is allocated to individual property
Unique Property Reference Numbers (UPRNs) and the corresponding asset groups.
2.34 The data is input at individual property level into the asset model. The asset model is run to
produce a 30 year cash flow projection with an annual surplus/deficit for each asset group and
to calculate the Net Present Value of the cash flows. A 6.5% real discount factor is used to
reflect borrowing costs and risk profile. The model also calculates an NPV perpetuity in order
to provide a parallel to the funders’ valuation methodology although it should be noted that the
values do not represent a formal valuation.
2.35 The outputs are then collected and analysed to identify strengths, weaknesses and trends
within the stock, in order to show the relative financial performance of different asset groups.
Key Financial Modelling Issues
2.36 The asset performance evaluation model focuses exclusively on the income and expenditure
associated directly with properties, the operating cash flow. The model does not account for
NIHE capital structure and therefore the additional costs of debt servicing. Nor does the
model take additional subsidies into consideration, such as any external funding, or the
historic cost of the properties in the accounts (Net Book Value).
Results of Asset Performance Evaluation
2.37 The results can be used for assessing the profile of stock performance and identifying the
correlations between financial inputs and outputs. Strong performers can be confirmed and
weaker performing stock identified for further review and option appraisals. Analysis of the
different input factors can help to understand the drivers of poor performance and inform an
options appraisal to consider how performance can be improved.
DSD/NIHE Asset Performance Evaluation Model Position Report 2014/15
Page 20
3.0 DATA INPUTS AND LIMITATIONS
3.1 There are a number of limitations associated with the inputs used within the modelling
exercise.
Asset Groups and Statistical Significance
3.2 The range of the number of properties in the asset groups varies from 1 unit to 1,071 units. 21
asset groups have less than 10 dwellings.
3.3 Where an asset group contains large numbers of properties, data is effectively ‘smoothed’
across the assets, which may mask specific issues (e.g. exceptionally high or low costs for
some properties within the group).
3.4 Where an asset group contains very small numbers of properties, any input assumptions may
not reflect an accurate picture at a very local level. This is particularly relevant in the context
of stock condition (or major repair) costs, which have been derived on the basis of a sample
survey across the stock. Although the sample selected for the survey will have been structured
to provide a statistically reliable picture across the whole stock, it may still be the case that
smaller asset groups may be allocated costs which contain a level of cloned data which may
not be fully representative at a very local level. The survey data associated with the smaller
asset groups must therefore be treated with caution. A ‘sense-check’ will need to be made of
the results as the asset management strategy develops.

DSD/NIHE Asset Performance Evaluation Model Position Report 2014/15
Page 21
4.0 FINANCIAL MODELLING RESULTS
4.1 This section sets out the results of the modelling process.
Financial performance – net present value
4.2 The 30-year NPV of NIHE’s tenanted housing stock of 87,219 units stands at £11.2m,
equivalent to an average of £128 per unit.
4.3 The results reflect a range of NPV levels across the stock. This is demonstrated in the graph
below, with asset groups (represented as blue columns) ordered according to their average
value per property. The lower average NPVs are to the bottom increasing gradually to the
highest average NPVs at the top.
Figure 5 – NPV per unit
4.4 The NPV range varies across the portfolio and we have illustrated the range of performance
bands below.

DSD/NIHE Asset Performance Evaluation Model Position Report 2014/15
Page 22
Table 5 – NPV performance bands
4.5 This shows a total of 49,245 units in asset groups with a positive average NPV, representing
just over 56% of the stock. The total positive NPV is £305.1m. This is balanced by a negative
NPV of £293.9m associated with 37,974 units, representing just under 44% of the stock.
4.6 The difference in average NPVs between different parts of the portfolio is driven by a range of
factors including:
Lower rents across high rise and some flatted stock.
Higher management and day to day maintenance costs of high rise properties.
Pockets of continued high voids and bad debts in some areas, particularly in high rise
stock.
Higher stock condition costs associated with some property types – particularly high rise
and properties of non traditional construction.
DSD/NIHE Asset Performance Evaluation Model Position Report 2014/15
Page 23
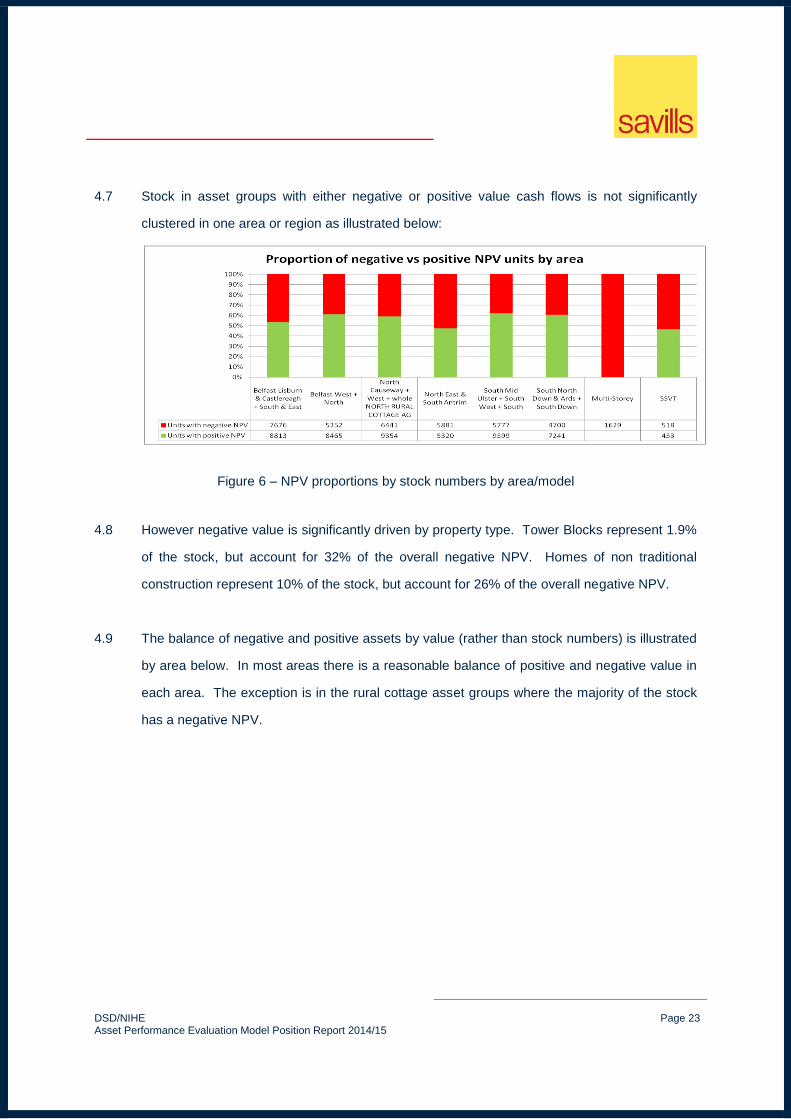
4.7 Stock in asset groups with either negative or positive value cash flows is not significantly
clustered in one area or region as illustrated below:
Figure 6 – NPV proportions by stock numbers by area/model
4.8 However negative value is significantly driven by property type. Tower Blocks represent 1.9%
of the stock, but account for 32% of the overall negative NPV. Homes of non traditional
construction represent 10% of the stock, but account for 26% of the overall negative NPV.
4.9 The balance of negative and positive assets by value (rather than stock numbers) is illustrated
by area below. In most areas there is a reasonable balance of positive and negative value in
each area. The exception is in the rural cottage asset groups where the majority of the stock
has a negative NPV.

DSD/NIHE Asset Performance Evaluation Model Position Report 2014/15
Page 24
Figure 7 – NPV proportions by value by area
4.10 We have compared the results with the outputs from a similar exercise carried out in 2009.
The 2009 assessment showed an average NPV of £2,500 per unit but forecast that average
NPV would decline over time as income was forecast to be insufficient to mitigate the impact
of revenue and capital expenditure needs. This decline forecast in 2009 has happened, more
or less as predicted, but with slightly higher than anticipated rent increases between 2009 and
2014 keeping the average NPV of the stock at a marginally positive position, compared with
marginally negative that was predicted at the time. This is illustrated below:
Figure 8 – NPV projection 2009

DSD/NIHE Asset Performance Evaluation Model Position Report 2014/15
Page 25
4.11 This decline represents a loss of worth to the business plan of £214m. It illustrates a picture of
decline with currently 17,579 units in groups with average NPV below minus £5,000 per unit,
including all Tower Blocks and 60% of homes of non traditional construction. This compares
with only 14,271 in 2009. The difference in performance bands is illustrated below:
Figure 9 – NPV performance bands 2009 v 2015
4.12 Tower Blocks account for a disproportionate amount of the negative NPV. Together they have
a negative NPV of £93.5m when taking into account the costs of an overcladding solution to
improve thermal efficiency. They are all concentrated in the lowest performance band, with a
range of average NPV from minus £90,000 per unit at Maeve, Eithne and Finn Houses to
minus £35,000 per unit at Latharna and Coolmoyne Houses. This is illustrated below:
DSD/NIHE Asset Performance Evaluation Model Position Report 2014/15
Page 26
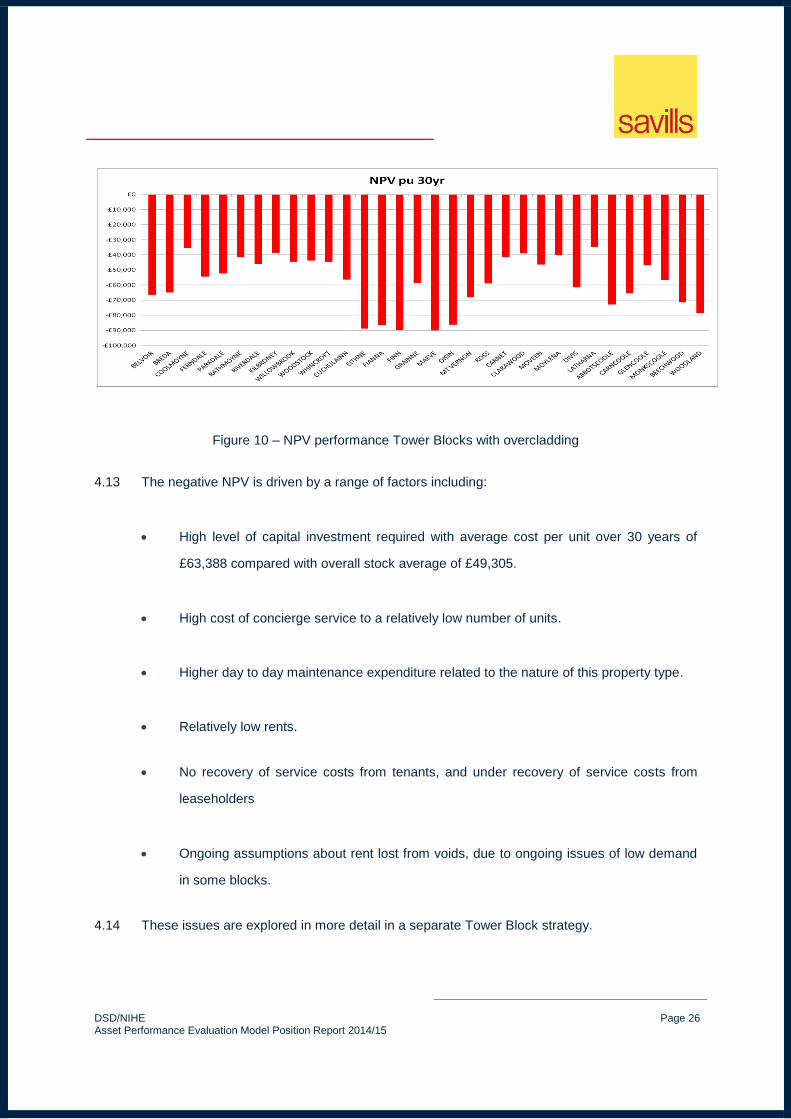
Figure 10 – NPV performance Tower Blocks with overcladding
4.13 The negative NPV is driven by a range of factors including:
High level of capital investment required with average cost per unit over 30 years of
£63,388 compared with overall stock average of £49,305.
High cost of concierge service to a relatively low number of units.
Higher day to day maintenance expenditure related to the nature of this property type.
Relatively low rents.
No recovery of service costs from tenants, and under recovery of service costs from
leaseholders
Ongoing assumptions about rent lost from voids, due to ongoing issues of low demand
in some blocks.
4.14 These issues are explored in more detail in a separate Tower Block strategy.
DSD/NIHE Asset Performance Evaluation Model Position Report 2014/15
Page 27
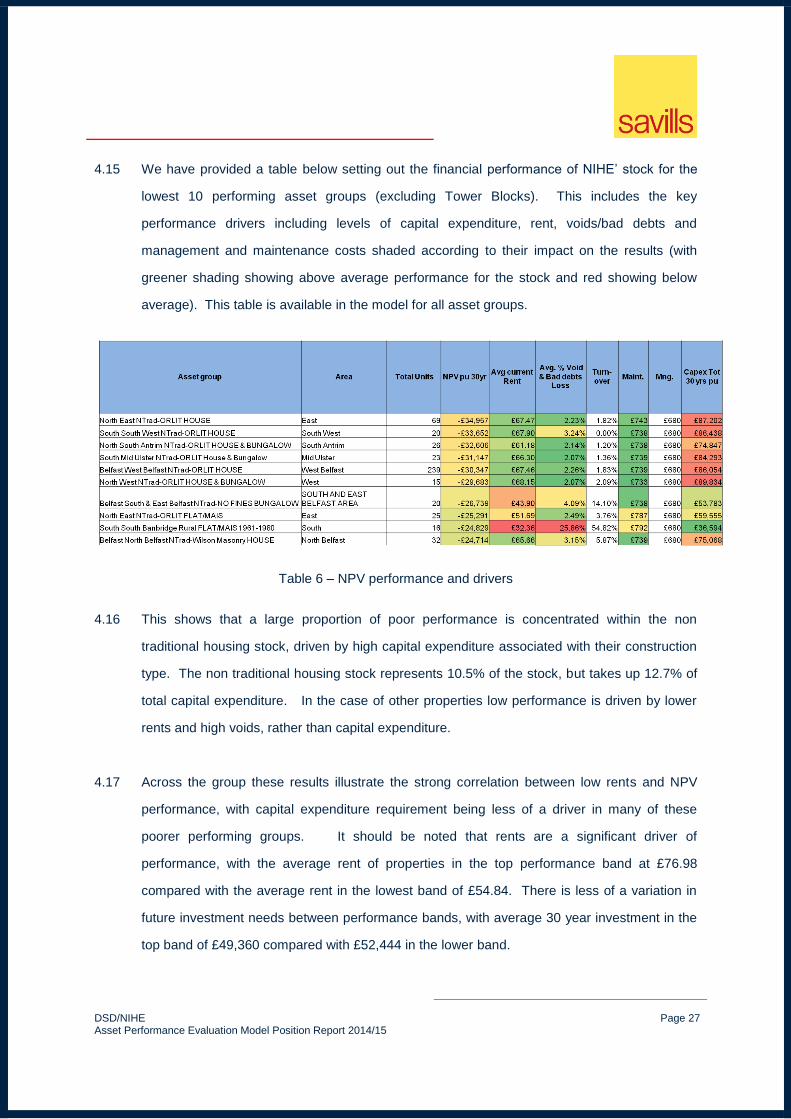
4.15 We have provided a table below setting out the financial performance of NIHE’ stock for the
lowest 10 performing asset groups (excluding Tower Blocks). This includes the key
performance drivers including levels of capital expenditure, rent, voids/bad debts and
management and maintenance costs shaded according to their impact on the results (with
greener shading showing above average performance for the stock and red showing below
average). This table is available in the model for all asset groups.
Table 6 – NPV performance and drivers
4.16 This shows that a large proportion of poor performance is concentrated within the non
traditional housing stock, driven by high capital expenditure associated with their construction
type. The non traditional housing stock represents 10.5% of the stock, but takes up 12.7% of
total capital expenditure. In the case of other properties low performance is driven by lower
rents and high voids, rather than capital expenditure.
4.17 Across the group these results illustrate the strong correlation between low rents and NPV
performance, with capital expenditure requirement being less of a driver in many of these
poorer performing groups. It should be noted that rents are a significant driver of
performance, with the average rent of properties in the top performance band at £76.98
compared with the average rent in the lowest band of £54.84. There is less of a variation in
future investment needs between performance bands, with average 30 year investment in the
top band of £49,360 compared with £52,444 in the lower band.

DSD/NIHE Asset Performance Evaluation Model Position Report 2014/15
Page 28
4.18 We have compared these results with benchmarks from 35 other landlords in England with a
total of just over 350,000 homes, where Savills has carried out similar exercises in the last 3
years. We have looked particularly at comparisons in the North East of England where there
is a similar position in terms of lower rents and low demand. In general the NPVs of NIHE
stock are below benchmarks, an outcome driven principally by lower rents and higher stock
condition costs. Costs for day to day management and maintenance, and void levels are
broadly in line with regional benchmarks.
NPV and Market Value – use of capital
4.19 In order to expand the analysis further we have produced a comparison of NPVs with open
market values for the properties to inform future strategies to release latent value and
maximise return on investment and rental yields.
4.20 The properties produce a range of rental yields (measured by annual rent (net of service
charges) / vacant possession value). This is illustrated below with the green bars indicating
the yield value, and the red bars showing the number of properties at each yield value. The
average yield across the portfolio is 6.3% with the vast majority (69%) showing a gross yield of
between 5% and 7%. Yields are relatively high compared with other social landlords in other
parts of the UK due to relatively low market values of the properties.
Figure 11 – Yield analysis

DSD/NIHE Asset Performance Evaluation Model Position Report 2014/15
Page 29
4.21 A comparison of NPV with market values can highlight where high value properties are
currently achieving relatively low values in existing use. The graph below shows average NPV
by asset group of existing cashflows (in red) and the average vacant possession value of the
homes in the asset group (in blue). At NIHE this shows relatively little alignment between
capital values and the worth of properties to the business plan, with higher value properties
generating a range of different value cashflows in the plan. If NIHE plan a strategy of
disposals to generate resources for new development it can use this analysis to identify those
properties which are relatively high value but with poorer performance in the business plan,
thereby removing liabilities at the same time as generating resources.
Figure 12 – Comparison of net present value of current cashflows with vacant possession values1
1 Blue dots with zero value represent asset groups for which open market values are not available

DSD/NIHE Asset Performance Evaluation Model Position Report 2014/15
Page 30
Cashflow – Net Income
4.22 In order to understand NPV, it is important to understand the future cash flow profiles for each
asset group in terms of surpluses and deficits. Deficits in some asset groups in the early
years may be capable of being sustained by surpluses made elsewhere in the stock if there
are longer term surpluses in those asset groups to be generated further down the line. Figure
13 below shows the overall asset cash flow position over 30 years. This is an operating cash
flow of the existing stock before any corporate liabilities such as debt financing are taken into
consideration.
Figure 13 - Total Annual Net Cash flow, All Tenanted Stock
4.23 The chart below shows the total investment requirement of the tenanted stock, compared with
its capacity to generate income from rents.
Figure 14 - Total annual investment v rent, All Tenanted Stock
-£100,000,000
-£50,000,000
£0
£50,000,000
£100,000,000
£150,000,000
£200,000,000
£250,000,000
1 2 3 4 5 6 7 8 9 10 11 12 13 14 15 16 17 18 19 20 21 22 23 24 25 26 27 28 29 30
Net operational cashflow

DSD/NIHE Asset Performance Evaluation Model Position Report 2014/15
Page 31
4.24 The graphs show a position of early years deficits, followed by a relatively tight cashflow in the
medium terms, followed by longer term increases in surplus over time which reflects the fact
that rents are assumed to rise at a rate that is 0.5% above the rate at which costs rise.
4.25 The asset management strategy will need to consider how this position can be managed to
produce a balanced cash flow throughout the business plan period and manage short term
deficits. It needs to be recognised that within the overall picture there will be cash flows for
asset groups which show a deficit over 30 years and appraisals of alternative options for these
assets could enable limited resources to be targeted more effectively.
4.26 The cash flow position can be analysed at individual asset group level in order to highlight
those asset groups whose cash flow is more marginal or negative over the 30 years.
Combined with an analysis of NPV, these can be used to prioritise candidate lists for further
analysis and options appraisal, ensuring appraisals are carried out before major periods of
investment are due. An example is set out in figure 15 below reflecting groups of assets with
cashflow pinch points at different time periods within the overall business plan. In some
cases, early years’ deficits lead to strong longer term cash flows. In other cases, the costs of
future renewals results in mid and longer term pinch points which threaten long term viability.
Figure 15 - Total annual net cash flow selected housing asset groups

DSD/NIHE Asset Performance Evaluation Model Position Report 2014/15
Page 32
Future NPVs
4.27 Part of the results database measures the projected future NPVs of the asset groups based on
the investment assumptions contained within the model. The following graph demonstrates
that the NIHE stock is forecast to become increasingly valuable through time. The rise in value
is dependent on future costs being contained within inflation and income rising at 0.5% above
inflation. It also relies on delivery of the early years' investment need which at this stage is not
forecast to be possible and therefore the value growth would not be realisable. The rates of
growth will vary across different asset groups. This variation can be used as an additional
factor to identify stock that will perform poorly in future and to take action in good time to
maintain business plan value.
Figure 16 Estimates of Future NPV per unit per year for all Housing Stock
4.28 This picture is different to the decline in value forecast in 2009 shown in Figure 8. This is due
to differences in assumptions about the rate of rental growth versus cost growth. It is also
very driven by the profile of stock condition costs. The 2015 survey shows a peak of major
investment in the early years. The 2009 survey showed this peak in the medium term and
therefore NPVs were assumed to decline as this period of expenditure need became closer.
DSD/NIHE Asset Performance Evaluation Model Position Report 2014/15
Page 33
Options for Poorly Performing Assets
4.29 There are a number of potential policy instruments to address the problems associated with
poor asset performance. These range from the improvement of an existing asset to its
disposal on the open market. Prior to any decisions on any of NIHE units, it is necessary to
appraise each property or groups of properties to determine what potential option should be
implemented.
4.30 The model includes output tables that provide data to inform detailed local options appraisals,
and comparison tables to identify potential for conversion to higher rent or disposal as part of
an overall strategic asset management approach.
4.31 Improvement in business plan capacity could be delivered through a range of strategies
arising from options appraisals including:
Investment in potentially viable properties to improve sustainability and mitigate risk of
reducing demand.
Investment in environmental improvements to increase demand/reduce turnover.
Management initiatives – for example, efficiencies in management costs or reductions in
underlying maintenance or repair expenditure, reduction of voids, increases in income
subject to agreed policies on rents and service charges.
Change of use to sub-market renting and potentially market renting and shared
ownership (subject to regulatory constraints).
Demolition of stock with consideration also given to the need, if any, for replacement
new build housing.
DSD/NIHE Asset Performance Evaluation Model Position Report 2014/15
Page 34
Transfer to a better placed housing provider to ensure continued use as affordable
housing and to deliver new homes within a comprehensive regeneration solution.
Disposal of properties that do not meet social need to release latent value for
investment in affordable housing that will better meet the needs of customers.
Decommissioning and disposal for redevelopment, again to release latent value for
reinvestment and/or to reduce liabilities within NIHE’s business plan.
Community asset transfer in line with DSD policy for dealing with under-utilised or
surplus property assets.
4.32 The financial impact of the above options can be modelled on an asset group by asset group
basis. The key underlying assumption within the appraisal is that the low NPV associated with
the asset group represents a Base Case which can be improved on. The appraisal enables
NIHE to compare the extent to which the alternative options could improve the NPV
associated with the asset group.

DSD/NIHE Asset Performance Evaluation Model Position Report 2014/15
Page 35
5.0 SUSTAINABILITY
5.1 We have supplemented the financial performance data by undertaking a sustainability
analysis which takes into account the socio economic performance of the neighbourhoods in
which the associated asset groups are located.
5.2 In order to identify measures that reflect NIHE and DSD social housing objectives we have
worked with officers across both organisations. The following measures have been identified
and indicators agreed against which each measure can be scored and ranked.
Table 7 – Social sustainability measures and indicators
5.3 Data was collected from a range of internal and external sources including the Northern
Ireland Indices of Multiple Deprivation (IMD), Northern Ireland Neighbourhood Information
Service (NINIS), data from the stock condition survey and NIHE internal data.

DSD/NIHE Asset Performance Evaluation Model Position Report 2014/15
Page 36
5.4 The scores against each indicator were combined to produce a single score that enables a
comparison of social sustainability across the stock. A weighting was applied based on the
relative priority of social housing objectives as agreed with NIHE and DSD. In particular it was
felt that demand was a major factor in terms of future sustainability and therefore has the
highest weighting.
5.5 The differences in scores between the asset groups with highest and lowest social
sustainability is indicated below
Table 8 – Social sustainability scores (highest and lowest)
5.6 Asset groups in areas of weaker sustainability are characterised by poor demand, high
turnover, high rent arrears and fuel poverty - factors which feed directly into priorities for action
in the asset management strategy.
5.7 Sustainability scores can differ within areas. This is in part due to the fact that some indicators
rely on data at individual property level, and others at district level. It also reflects the fact that
within some high demand areas, there are particular property types (e.g. non traditional
properties and tower blocks) with high levels of fuel poverty.
5.8 A sustainability index has been prepared providing scores for each asset group and showing
the relative position of each of the three indicators, as well as the combined score.
Asset Group
Total
units
Total
service
impact score
Total better
homes
score
Total vibrant
communities
score
Combined
sustainability
score
South South Down Glebe Town Drive Hostel & FLAT/MAIS 6 10.0 8.8 5.9 8.1
North East HOUSE POST 1980 167 6.8 9.5 5.5 7.7
North South Antrim Antrim Urban HOUSE 1945-1960 19 9.0 7.8 6.7 7.7
Belfast Lisburn & Castlereagh Lisburn Rural HOUSE POST 1980 23 8.3 8.0 6.7 7.6
South North Down & Ards North Down Rural Bungalow POST 1980 10 8.5 7.8 6.8 7.6
Belfast West Belfast Inner Shankill HOUSE Pre 1945 69 3.8 1.5 5.1 3.0
Belfast South & East Belfast CLARAWOOD HOUSE FLAT/MAIS MULTI-STOREY 56 1.3 2.8 4.6 3.0
Belfast North Belfast MOUNT VERNON ROSS HOUSE FLAT/MAIS MULTI-STOREY75 2.0 1.5 6.1 3.0
Belfast South & East Belfast FLAT/MAIS Pre 1945 22 3.0 2.3 4.0 2.9
Belfast West Belfast DIVIS TOWER FLAT/MAIS & BEDSIT MULTI-STOREY 91 4.3 1.8 3.9 2.9
South South Banbridge Rural FLAT/MAIS 1961-1980 16 3.3 1.3 5.2 2.8
Belfast South & East Belfast Inner East Belfast HOUSE Pre 1945 275 2.0 2.3 3.9 2.7

DSD/NIHE Asset Performance Evaluation Model Position Report 2014/15
Page 37
Combining the Financial and Sustainability Analysis
5.9 The combination of the sustainability analysis and financial assessment is useful as a
comprehensive assessment of overall performance. Priority in terms of action will differ
depending on whether stock that performs poorly on a financial basis is located within a
relatively sustainable or unsustainable location.
5.10 The table below shows the overall results of the exercise combining financial and non financial
sustainability. The financial performance is measured by positive or negative NPV. The non
financial sustainability is scored by measuring the extent to which the sustainability score for
the asset group differs from the average across the whole stock.
Financial and Social sustainability Units Proportion
Positive NPV, High sustainability 29458 33.8%
Positive NPV, Low sustainability 19787 22.7%
Negative NPV, High sustainability 26113 29.9%
Negative NPV, Low sustainability 11861 13.6%
Total 87219 100.0%
Table 9 – Financial and Social sustainability
5.11 This shows that 34% of the stock shows strong financial and social sustainability, where
investment needs to be targeted to maintain value and sustainability. 14% of the stock shows
poor sustainability on both a financial and non financial basis. These will be priority
candidates for options appraisals in order to understand the options for improving performance
on both a financial and non financial basis.
5.12 Consideration will be given to the nature of intervention that could improve performance in
other areas. Intervention would generally vary depending on the relative position. For
example
DSD/NIHE Asset Performance Evaluation Model Position Report 2014/15
Page 38
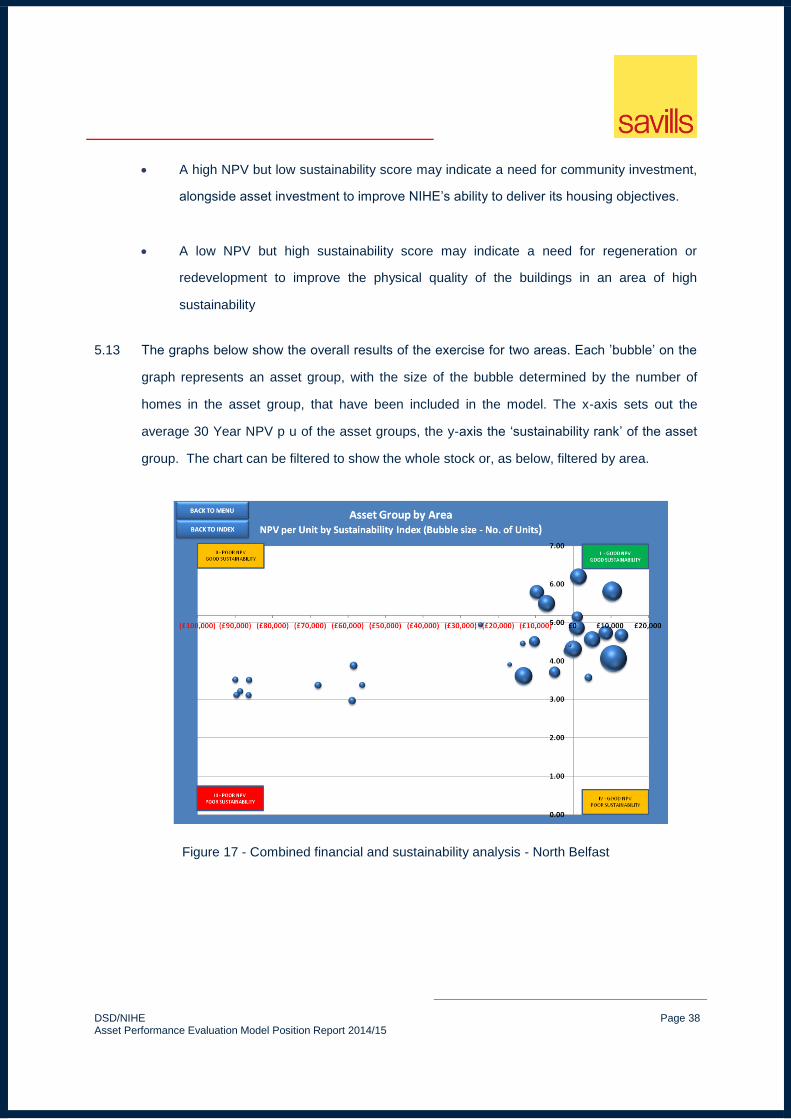
A high NPV but low sustainability score may indicate a need for community investment,
alongside asset investment to improve NIHE’s ability to deliver its housing objectives.
A low NPV but high sustainability score may indicate a need for regeneration or
redevelopment to improve the physical quality of the buildings in an area of high
sustainability
5.13 The graphs below show the overall results of the exercise for two areas. Each ’bubble’ on the
graph represents an asset group, with the size of the bubble determined by the number of
homes in the asset group, that have been included in the model. The x-axis sets out the
average 30 Year NPV p u of the asset groups, the y-axis the ‘sustainability rank’ of the asset
group. The chart can be filtered to show the whole stock or, as below, filtered by area.
Figure 17 - Combined financial and sustainability analysis - North Belfast
DSD/NIHE Asset Performance Evaluation Model Position Report 2014/15
Page 39
7
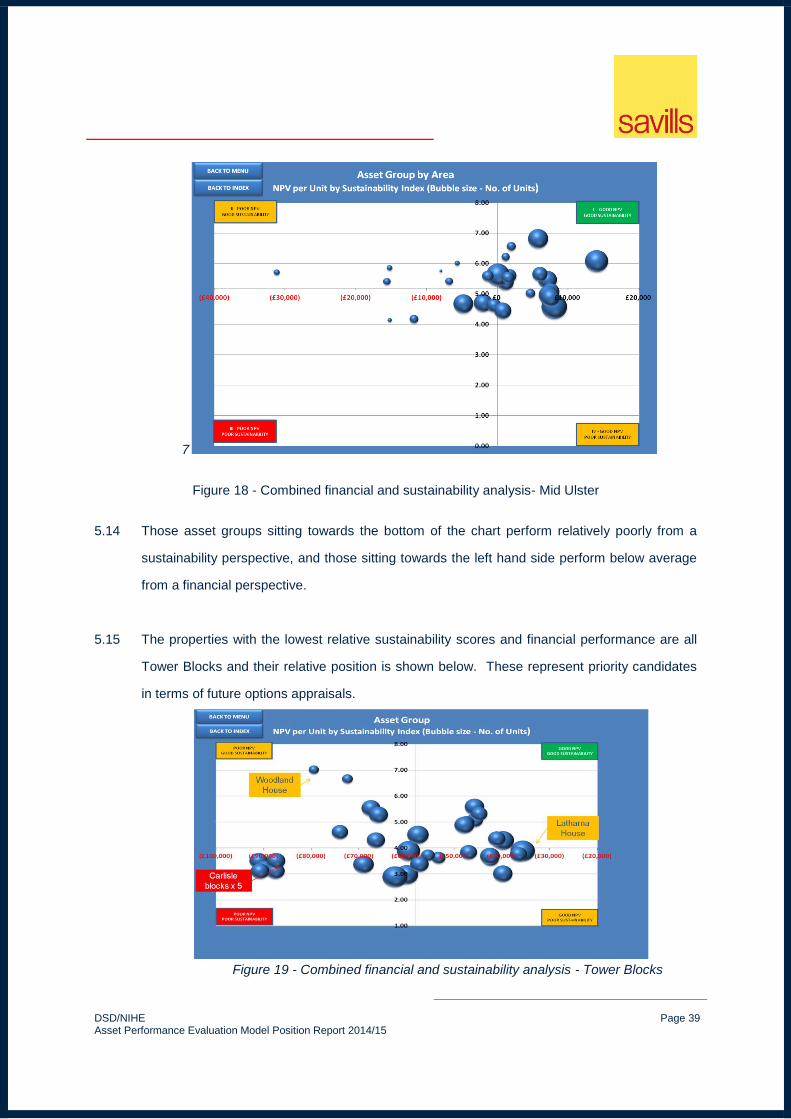
Figure 18 - Combined financial and sustainability analysis- Mid Ulster
5.14 Those asset groups sitting towards the bottom of the chart perform relatively poorly from a
sustainability perspective, and those sitting towards the left hand side perform below average
from a financial perspective.
5.15 The properties with the lowest relative sustainability scores and financial performance are all
Tower Blocks and their relative position is shown below. These represent priority candidates
in terms of future options appraisals.
Figure 19 - Combined financial and sustainability analysis - Tower Blocks

DSD/NIHE Asset Performance Evaluation Model Position Report 2014/15
Page 40
5.16 The geographical distribution of performance is illustrated at Appendix 2. The first map shows
financial performance only, with the second showing the financial performance in the inner
circle and non financial in the outer ring, with a zoom view on the Belfast area.

DSD/NIHE Asset Performance Evaluation Model Position Report 2014/15
Page 41
6.0 CONCLUSION AND APPLICATION OF RESULTS
6.1 This report focuses on a current-day financial analysis of the stock at a high level. The work
sets a framework for future investment decisions within an active asset management strategy.
The asset analysis work can be used to increase business plan capacity in future in order to:
Improve the capacity of NIHE business plan by setting long term plans for the
improvement and repair of high quality, affordable homes by demonstrating an
approach to asset management that represents value for money.
Improve communication between NIHE and tenants and leaseholders about investment
strategies by demonstrating the reasons for investment decisions.
Deliver a good return on social housing assets, where investment delivers an increase
in value (social and financial) over time.
Address regeneration needs to improve the sustainability of neighbourhoods.
Release resources for new development.
6.2 Issues to consider in understanding the outputs from the results include:
The opportunities available to set long term plans for investment and regeneration and
renewal, and NIHE’s role in working with partners on this activity.
The potential for further improvement in net present values through procurement and
efficiency savings linked to the development of detailed investment plans for the long
term sustainable stock.

DSD/NIHE Asset Performance Evaluation Model Position Report 2014/15
Page 42
Land use and development potential within asset groups which may present
opportunities for additional affordable housing.
6.3 Focus in the short term on those asset groups identified as performing at below average for
the stock, either on the basis of NPV or cash flow or sustainability or all three will highlight
areas where further appraisal may be of benefit in order to consider options for investment in
these areas. This will ensure that limited resources are allocated to units that provide a strong
financial and social return on assets.
6.4 This modelling can also be used by DSD in its oversight role:
To consider the extent to which asset management is improving the performance of
assets over time.
To ensure investment decisions and delivery demonstrate value for money.
To ensure resources are targeted effectively to delivery housing strategy.
To identify the link between housing and community planning and regeneration.
6.5 It will also be able to support the consideration of future options under Social Housing Reform
Programme. The sustainability analysis demonstrates the scale of challenge to be faced by
the future landlord of the stock, both in terms of the level of investment required, and the
sustainability and demand issues to be addressed. The modelling can help to consider how
portfolios of stock might be assembled for any small scale transfers, to ensure future landlords
have a balanced business plan. It would also help to inform the resident offer in the event of
any transfer proposals, for example by ensuring the deliverability of any promises made
regarding investment or regeneration.

DSD/NIHE Asset Performance Evaluation Model Position Report 2014/15
Appendices
Appendix 1
Asset Groups

DSD/NIHE Asset Performance Evaluation Model Position Report 2014/15
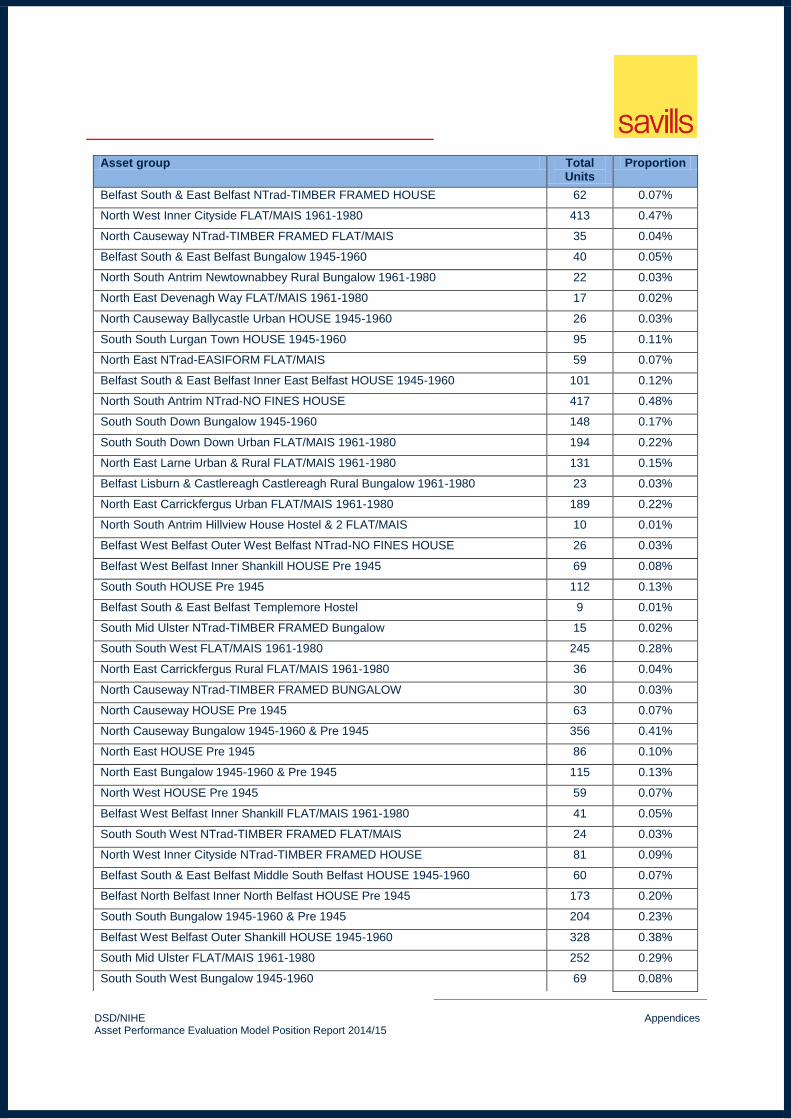
Appendices
Asset group Total Units
Proportion
Belfast North Belfast CARLISLE MAEVE HOUSE FLAT/MAIS MULTI-STOREY 50 0.06%
Belfast North Belfast CARLISLE FINN HOUSE FLAT/MAIS MULTI-STOREY 49 0.06%
Belfast North Belfast CARLISLE EITHNE HOUSE FLAT/MAIS MULTI-STOREY 49 0.06%
Belfast North Belfast CARLISLE FIANNA HOUSE FLAT/MAIS MULTI-STOREY 50 0.06%
Belfast North Belfast CARLISLE OISIN HOUSE FLAT/MAIS MULTI-STOREY 50 0.06%
North South Antrim RUSHPARK WOODLAND HOUSE FLAT/MAIS MULTI-STOREY
15 0.02%
North South Antrim MID RATHCOOLE ABBOTSCOOLE HOUSE FLAT/MAIS MULTI-STOREY
41 0.05%
North South Antrim RUSHPARK BEECHWOOD HOUSE FLAT/MAIS MULTI-STOREY
17 0.02%
Belfast North Belfast MOUNT VERNON MT VERNON HOUSE FLAT/MAIS MULTI-STOREY
62 0.07%
Belfast Lisburn & Castlereagh BELVOIR BELVOIR HOUSE FLAT/MAIS MULTI-STOREY
52 0.06%
North South Antrim MID RATHCOOLE Carncoole House FLAT/MAIS MULTI-STOREY
49 0.06%
Belfast Lisburn & Castlereagh BELVOIR BREDA HOUSE FLAT/MAIS MULTI-STOREY
55 0.06%
Belfast West Belfast DIVIS TOWER FLAT/MAIS & BEDSIT MULTI-STOREY 91 0.10%
Belfast North Belfast MOUNT VERNON ROSS HOUSE FLAT/MAIS MULTI-STOREY
75 0.09%
Belfast North Belfast CARLISLE GRAINNE HOUSE FLAT/MAIS & HOSTEL MULTI-STOREY
81 0.09%
North South Antrim MID RATHCOOLE MONKSCOOLE HOUSE FLAT/MAIS & BEDSIT MULTI-STOREY
68 0.08%
Belfast North Belfast CARLISLE CUCHULAINN HOUSE FLAT/MAIS MULTI-STOREY
50 0.06%
Belfast Lisburn & Castlereagh CONWAY FERNDALE HOUSE FLAT/MAIS MULTI-STOREY
27 0.03%
Belfast Lisburn & Castlereagh CONWAY PARKDALE HOUSE FLAT/MAIS MULTI-STOREY
30 0.03%
North South Antrim MID RATHCOOLE Glencoole House FLAT/MAIS MULTI-STOREY
57 0.07%
Belfast South & East Belfast FINAGHY MOVEEN HOUSE FLAT/MAIS MULTI-STOREY
37 0.04%
Belfast Lisburn & Castlereagh CONWAY RIVERDALE HOUSE FLAT/MAIS MULTI-STOREY
42 0.05%
Belfast Lisburn & Castlereagh WHINCROFT HOUSE FLAT/MAIS MULTI-STOREY 55 0.06%
Belfast Lisburn & Castlereagh CREGAGH WILLOWBROOK HOUSE FLAT/MAIS MULTI-STOREY
39 0.04%
Belfast Lisburn & Castlereagh CREGAGH WOODSTOCK HOUSE FLAT/MAIS MULTI-STOREY
40 0.05%
Belfast South & East Belfast CARNET HOUSE FLAT/MAIS & BEDSIT MULTI-STOREY
57 0.07%
Belfast Lisburn & Castlereagh CONWAY RATHMOYNE HOUSE FLAT/MAIS MULTI-STOREY
38 0.04%
Belfast South & East Belfast FINAGHY MOYLENA HOUSE FLAT/MAIS MULTI-STOREY
45 0.05%
Belfast South & East Belfast CLARAWOOD HOUSE FLAT/MAIS MULTI-STOREY 56 0.06%
Belfast Lisburn & Castlereagh CREGAGH KILBRONEY HOUSE FLAT/MAIS & BEDSIT MULTI-STOREY
71 0.08%
Belfast Lisburn & Castlereagh CONWAY COOLMOYNE HOUSE FLAT/MAIS 43 0.05%
DSD/NIHE Asset Performance Evaluation Model Position Report 2014/15
Appendices
Asset group Total Units
Proportion
MULTI-STOREY
North East NTrad-ORLIT HOUSE 69 0.08%
North East LATHARNA HOUSE FLAT/MAIS MULTI-STOREY 88 0.10%
South South West NTrad-ORLIT HOUSE 20 0.02%
North South Antrim NTrad-ORLIT HOUSE & BUNGALOW 26 0.03%
South Mid Ulster NTrad-ORLIT House & Bungalow 23 0.03%
Belfast West Belfast NTrad-ORLIT HOUSE 239 0.27%
North West NTrad-ORLIT HOUSE & BUNGALOW 15 0.02%
Belfast South & East Belfast NTrad-NO FINES BUNGALOW 20 0.02%
North East NTrad-ORLIT FLAT/MAIS 25 0.03%
South South Banbridge Rural FLAT/MAIS 1961-1980 16 0.02%
Belfast North Belfast NTrad-Wilson Masonry HOUSE 32 0.04%
North West NTrad-ALUM BUNGALOW 43 0.05%
Belfast West Belfast NTrad-TIMBER FRAMED Bungalow 14 0.02%
North East Devenagh Way NTrad-NO FINES FLAT/MAIS 32 0.04%
Belfast Lisburn & Castlereagh Castlereagh Urban NTrad-NO FINES HOUSE 40 0.05%
Belfast Lisburn & Castlereagh NTrad-ORLIT BUNGALOW 4 0.00%
Belfast Lisburn & Castlereagh NTrad-ALUM BUNGALOW 15 0.02%
Belfast North Belfast NTrad-NO FINES FLAT/MAIS 26 0.03%
North East NTrad-TIMBER FRAMED BUNGALOW 20 0.02%
Belfast South & East Belfast NTrad-NO FINES FLAT/MAIS 58 0.07%
South South Down NTrad-CROSS WALL HOUSE 2 0.00%
Belfast South & East Belfast NTrad-NO FINES HOUSE 142 0.16%
Belfast South & East Belfast FLAT/MAIS Pre 1945 22 0.03%
South South West NTrad-ORLIT Bungalow 59 0.07%
North West NTrad-NO FINES BUNGALOW 17 0.02%
South South West NTrad-NO FINES Bungalow 23 0.03%
North East NTrad-Wilson Masonry FLAT/MAIS 15 0.02%
North East Sallagh Park FLAT/MAIS 1945-1960 19 0.02%
North East Devenagh Way NTrad-NO FINES HOUSE 19 0.02%
South Mid Ulster NTrad-ALUM BUNGALOW 34 0.04%
South North Down & Ards NTrad-ALUM BUNGALOW 9 0.01%
North East Ferris Park FLAT/MAIS 1961-1980 1 0.00%
Belfast West Belfast NTrad-NO FINES FLAT/MAIS 59 0.07%
South South West NTrad-NO FINES FLAT/MAIS 30 0.03%
South Mid Ulster NTrad-TIMBER FRAMED FLAT/MAIS 20 0.02%
South Mid Ulster NTrad-NO FINES FLAT/MAIS 11 0.01%
Belfast Lisburn & Castlereagh NTrad-WILSON MASONRY FLAT/MAIS 86 0.10%
South North Down & Ards NTrad-NO FINES FLAT/MAIS 275 0.32%

DSD/NIHE Asset Performance Evaluation Model Position Report 2014/15
Appendices
Asset group Total Units
Proportion
Belfast Lisburn & Castlereagh NTrad-WILSON MASONRY HOUSE & BUNGALOW
128 0.15%
North West NTrad-NO FINES FLAT/MAIS 104 0.12%
North Causeway NTrad-NO FINES FLAT/MAIS 22 0.03%
Belfast North Belfast Inner North Belfast NTrad-NO FINES HOUSE 41 0.05%
Belfast North Belfast Outer North Belfast NTrad-NO FINES HOUSE 424 0.49%
North South Antrim NTrad-NO FINES FLAT/MAIS 300 0.34%
South South Down NTrad-NO FINES HOUSE & FLAT/MAIS 17 0.02%
North East NTrad-EASIFORM BUNGALOW 26 0.03%
North South Antrim Ollardale FLAT/MAIS 1945-1960 26 0.03%
South South NTrad-NO FINES FLAT/MAIS 63 0.07%
South South NTrad-NO FINES Bungalow 52 0.06%
Belfast Lisburn & Castlereagh Castlereagh Urban & Rural FLAT/MAIS Pre 1945 & 1945-1960
325 0.37%
North East NTrad-Wilson Masonry HOUSE 12 0.01%
South Mid Ulster NTrad-NO FINES HOUSE 49 0.06%
South South West NTrad-NO FINES HOUSE 35 0.04%
Belfast Lisburn & Castlereagh NTrad-NO FINES Bungalow 57 0.07%
Belfast South & East Belfast FLAT/MAIS 1945-1960 386 0.44%
Belfast West Belfast NTrad-NO FINES Bungalow 20 0.02%
North West NTrad-TIMBER FRAMED FLAT/MAIS 59 0.07%
North East Sallagh Park NTrad-NO FINES HOUSE 11 0.01%
Belfast North Belfast Middle North Belfast NTrad-NO FINES HOUSE & BUNGALOW
159 0.18%
Belfast Lisburn & Castlereagh Lisburn Urban & Rural FLAT/MAIS 1945-1960 386 0.44%
NORTH RURAL COTTAGE 356 0.41%
North South Antrim HOUSE Pre 1945 12 0.01%
North East NTrad-NO FINES FLAT/MAIS 48 0.06%
North East NTrad-NO FINES HOUSE 93 0.11%
South South West Bungalow Pre 1945 11 0.01%
Belfast North Belfast FLAT/MAIS 1945-1960 & Pre 1945 279 0.32%
North South Antrim Antrim Urban FLAT/MAIS 1945-1960 32 0.04%
Belfast West Belfast Inner West Belfast HOUSE Pre 1945 42 0.05%
South South West NTrad-ALUM BUNGALOW 21 0.02%
Belfast West Belfast Outer West Belfast FLAT/MAIS 1961-1980 431 0.49%
Belfast South & East Belfast NTrad-TIMBER FRAMED FLAT/MAIS 6 0.01%
Belfast Lisburn & Castlereagh Castlereagh Urban & Rural FLAT/MAIS 1961-1980 1019 1.17%
North South Antrim Newtownabbey Urban FLAT/MAIS 1945-1960 504 0.58%
Belfast Lisburn & Castlereagh NTrad-TIMBER FRAMED BUNGALOW 6 0.01%
Belfast West Belfast Middle West Belfast NTrad-NO FINES HOUSE 238 0.27%
North South Antrim Grange FLAT/MAIS 1961-1980 68 0.08%

DSD/NIHE Asset Performance Evaluation Model Position Report 2014/15
Appendices
Asset group Total Units
Proportion
North West FLAT/MAIS 1945-1960 & Pre 1945 105 0.12%
South South Down FLAT/MAIS 1945-1960 143 0.16%
North East NTrad-TIMBER FRAMED HOUSE 62 0.07%
South South West FLAT/MAIS 1945-1960 15 0.02%
North West Bungalow Pre 1945 & 1945-1960 134 0.15%
BELFAST RURAL COTTAGE 56 0.06%
Belfast Lisburn & Castlereagh NTrad-NO FINES FLAT/MAIS 127 0.15%
North Causeway FLAT/MAIS 1945-1960 193 0.22%
North South Antrim NTrad-NO FINES Bungalow 57 0.07%
South South FLAT/MAIS 1945-1960 193 0.22%
North East FLAT/MAIS 1945-1960 491 0.56%
North West NTrad-TIMBER FRAMED Bungalow 357 0.41%
South North Down & Ards NTrad-NO FINES HOUSE 205 0.24%
South South Banbridge Urban FLAT/MAIS 1961-1980 162 0.19%
South South Down Glebe Town Drive Hostel & FLAT/MAIS 6 0.01%
North East Doury FLAT/MAIS 1961-1980 17 0.02%
North South Antrim Ollardale Bungalow 1945-1960 15 0.02%
North Causeway Ballycastle Urban Bungalow 1961-1980 92 0.11%
South Mid Ulster Bungalow Pre 1945 5 0.01%
North West NTrad-NO FINES HOUSE 310 0.36%
South North Down & Ards NTrad-TIMBER FRAMED HOUSE & BUNGALOW 9 0.01%
Belfast West Belfast FLAT/MAIS 1945-1960 217 0.25%
Belfast South & East Belfast NTrad-TIMBER FRAMED Bungalow 35 0.04%
North South Antrim Newtownabbey Rural HOUSE 1945-1960 21 0.02%
North South Antrim Ollardale FLAT/MAIS 1961-1980 14 0.02%
South South West NTrad-TIMBER FRAMED Bungalow 52 0.06%
South South Down Bungalow Pre 1945 16 0.02%
South North Down & Ards FLAT/MAIS 1945-1960 222 0.25%
South South Portadown Urban FLAT/MAIS 1961-1980 211 0.24%
Belfast West Belfast BUNGALOW & RURAL COTTAGE Pre 1945 & 1945-1960 40 0.05%
South South Armagh Urban FLAT/MAIS 1961-1980 148 0.17%
South South NTrad-ORLIT Bungalow 13 0.01%
SOUTH RURAL COTTAGE & 3 NTrad-ORLIT 357 0.41%
Belfast North Belfast FLAT/MAIS 1961-1980 387 0.44%
Belfast West Belfast Outer Shankill FLAT/MAIS 1961-1980 58 0.07%
North East Ballymena Urban FLAT/MAIS 1961-1980 235 0.27%
Belfast South & East Belfast FLAT/MAIS 1961-1980 394 0.45%
South Mid Ulster FLAT/MAIS 1945-1960 36 0.04%
North East Ferris Park NTrad-TIMBER FRAMED HOUSE 24 0.03%
DSD/NIHE Asset Performance Evaluation Model Position Report 2014/15
Appendices
Asset group Total Units
Proportion
Belfast South & East Belfast NTrad-TIMBER FRAMED HOUSE 62 0.07%
North West Inner Cityside FLAT/MAIS 1961-1980 413 0.47%
North Causeway NTrad-TIMBER FRAMED FLAT/MAIS 35 0.04%
Belfast South & East Belfast Bungalow 1945-1960 40 0.05%
North South Antrim Newtownabbey Rural Bungalow 1961-1980 22 0.03%
North East Devenagh Way FLAT/MAIS 1961-1980 17 0.02%
North Causeway Ballycastle Urban HOUSE 1945-1960 26 0.03%
South South Lurgan Town HOUSE 1945-1960 95 0.11%
North East NTrad-EASIFORM FLAT/MAIS 59 0.07%
Belfast South & East Belfast Inner East Belfast HOUSE 1945-1960 101 0.12%
North South Antrim NTrad-NO FINES HOUSE 417 0.48%
South South Down Bungalow 1945-1960 148 0.17%
South South Down Down Urban FLAT/MAIS 1961-1980 194 0.22%
North East Larne Urban & Rural FLAT/MAIS 1961-1980 131 0.15%
Belfast Lisburn & Castlereagh Castlereagh Rural Bungalow 1961-1980 23 0.03%
North East Carrickfergus Urban FLAT/MAIS 1961-1980 189 0.22%
North South Antrim Hillview House Hostel & 2 FLAT/MAIS 10 0.01%
Belfast West Belfast Outer West Belfast NTrad-NO FINES HOUSE 26 0.03%
Belfast West Belfast Inner Shankill HOUSE Pre 1945 69 0.08%
South South HOUSE Pre 1945 112 0.13%
Belfast South & East Belfast Templemore Hostel 9 0.01%
South Mid Ulster NTrad-TIMBER FRAMED Bungalow 15 0.02%
South South West FLAT/MAIS 1961-1980 245 0.28%
North East Carrickfergus Rural FLAT/MAIS 1961-1980 36 0.04%
North Causeway NTrad-TIMBER FRAMED BUNGALOW 30 0.03%
North Causeway HOUSE Pre 1945 63 0.07%
North Causeway Bungalow 1945-1960 & Pre 1945 356 0.41%
North East HOUSE Pre 1945 86 0.10%
North East Bungalow 1945-1960 & Pre 1945 115 0.13%
North West HOUSE Pre 1945 59 0.07%
Belfast West Belfast Inner Shankill FLAT/MAIS 1961-1980 41 0.05%
South South West NTrad-TIMBER FRAMED FLAT/MAIS 24 0.03%
North West Inner Cityside NTrad-TIMBER FRAMED HOUSE 81 0.09%
Belfast South & East Belfast Middle South Belfast HOUSE 1945-1960 60 0.07%
Belfast North Belfast Inner North Belfast HOUSE Pre 1945 173 0.20%
South South Bungalow 1945-1960 & Pre 1945 204 0.23%
Belfast West Belfast Outer Shankill HOUSE 1945-1960 328 0.38%
South Mid Ulster FLAT/MAIS 1961-1980 252 0.29%
South South West Bungalow 1945-1960 69 0.08%

DSD/NIHE Asset Performance Evaluation Model Position Report 2014/15
Appendices
Asset group Total Units
Proportion
North South Antrim Antrim Urban FLAT/MAIS 1961-1980 317 0.36%
Belfast Lisburn & Castlereagh HOUSE Pre 1945 35 0.04%
North West Strabane Urban NTrad-TIMBER FRAMED HOUSE 348 0.40%
Belfast South & East Belfast Inner East Belfast HOUSE Pre 1945 275 0.32%
Belfast Lisburn & Castlereagh Lisburn Urban FLAT/MAIS 1961-1980 502 0.58%
North East NTrad-EASIFORM HOUSE 178 0.20%
South South NTrad-CROSS WALL HOUSE 8 0.01%
South South Armagh Urban HOUSE 1945-1960 108 0.12%
South South Armagh Urban Bungalow 1961-1980 190 0.22%
South South NTrad-NO FINES HOUSE 465 0.53%
North West Waterside Urban FLAT/MAIS 1961-1980 226 0.26%
North West Waterside Urban NTrad-TIMBER FRAMED HOUSE 66 0.08%
Belfast West Belfast Inner West Belfast FLAT/MAIS 1961-1980 86 0.10%
South North Down & Ards NTrad-NO FINES BUNGALOW 24 0.03%
North West Strabane Urban & Rural FLAT/MAIS 1961-1980 74 0.08%
North South Antrim Grange Bungalow 1961-1980 41 0.05%
North West Waterside Rural NTrad-TIMBER FRAMED HOUSE 23 0.03%
North East Ballymena Urban Bungalow 1961-1980 57 0.07%
Belfast Lisburn & Castlereagh Laburnum Walk Hostel 22 0.03%
North East Ballee FLAT/MAIS 1961-1980 103 0.12%
Belfast West Belfast Outer Shankill NTrad-NO FINES HOUSE 331 0.38%
Belfast Lisburn & Castlereagh BUNGALOW 1945-1960 & Pre 1945 78 0.09%
South North Down & Ards Bungalow 1945-1960 & Pre 1945 181 0.21%
South South Portadown Urban Bungalow 1961-1980 242 0.28%
South South Down Down Urban Bungalow 1961-1980 196 0.22%
South South Lurgan Rural HOUSE 1945-1960 54 0.06%
North Causeway FLAT/MAIS 1961-1980 476 0.55%
South South Lurgan Town & Rural FLAT/MAIS 1961-1980 240 0.28%
Belfast Lisburn & Castlereagh TWINBROOK FLAT/MAIS 1961-1980 152 0.17%
North East Ferris Park HOUSE 1945-1960 104 0.12%
South South Down Newry Urban & Rural FLAT/MAIS 1961-1980 268 0.31%
North South Antrim Antrim Rural HOUSE 1945-1960 25 0.03%
North South Antrim Newtownabbey Rural FLAT/MAIS 1961-1980 18 0.02%
North Causeway Ballycastle Rural Bungalow 1961-1980 93 0.11%
South South Banbridge Urban HOUSE 1945-1960 67 0.08%
North East Doury Bungalow 1961-1980 7 0.01%
South South Brownlow FLAT/MAIS 1961-1980 88 0.10%
Belfast West Belfast Middle & Inner Shankill HOUSE 1945-1960 42 0.05%
South South Banbridge Rural HOUSE 1945-1960 73 0.08%

DSD/NIHE Asset Performance Evaluation Model Position Report 2014/15
Appendices
Asset group Total Units
Proportion
North South Antrim Newtownabbey Urban FLAT/MAIS 1961-1980 635 0.73%
North West Outer Cityside FLAT/MAIS 1961-1980 128 0.15%
North East Larne Urban Bungalow 1961-1980 49 0.06%
North Causeway NTrad-NO FINES HOUSE & BUNGALOW 161 0.18%
Belfast West Belfast NTrad-TIMBER FRAMED HOUSE 140 0.16%
South South Armagh Rural FLAT/MAIS 1961-1980 49 0.06%
North West Waterside Rural HOUSE 1945-1960 32 0.04%
North South Antrim Bungalow 1945-1960 & 2 Pre 1945 108 0.12%
Belfast West Belfast Middle Shankill FLAT/MAIS 1961-1980 21 0.02%
North Causeway Ballycastle Rural HOUSE 1945-1960 71 0.08%
South South Lurgan Town Bungalow 1961-1980 125 0.14%
North East Larne Rural Bungalow 1961-1980 60 0.07%
North Causeway Limavady Rural Bungalow 1961-1980 152 0.17%
North South Antrim Antrim Rural Bungalow 1961-1980 26 0.03%
Belfast Lisburn & Castlereagh Castlereagh Urban Bungalow 1961-1980 442 0.51%
South North Down & Ards Newtownards Urban FLAT/MAIS 1961-1980 406 0.47%
South Mid Ulster Bungalow 1945-1960 221 0.25%
Belfast South & East Belfast Outer East Belfast HOUSE 1945-1960 148 0.17%
South South Down Down Rural FLAT/MAIS 1961-1980 60 0.07%
Belfast Lisburn & Castlereagh TWINBROOK NTrad-NO FINES HOUSE 98 0.11%
Belfast South & East Belfast Inner South Belfast HOUSE Pre 1945 747 0.86%
North West Waterside Rural Bungalow 1961-1980 42 0.05%
South South NTrad-CROSS WALL FLAT/MAIS 20 0.02%
Belfast Lisburn & Castlereagh Castlereagh Rural HOUSE 1945-1960 16 0.02%
North South Antrim NTrad-CROSS WALL HOUSE 1 0.00%
Belfast South & East Belfast Middle South Belfast FLAT/MAIS POST 1980 62 0.07%
South South Down HOUSE 1945-1960 495 0.57%
North South Antrim Newtownabbey Urban Bungalow 1961-1980 407 0.47%
North South Antrim Newtownabbey Urban HOUSE 1945-1960 445 0.51%
South South West Omagh Rural Bungalow 1961-1980 124 0.14%
North South Antrim Loughview House Hostel & FLAT/MAIS 6 0.01%
North East Ballymena Rural FLAT/MAIS 1961-1980 33 0.04%
North East Carrickfergus Rural Bungalow 1961-1980 68 0.08%
Belfast South & East Belfast Middle South Belfast HOUSE Pre 1945 190 0.22%
Belfast North Belfast Bungalow 1961-1980 & 1945-1960 & Pre 1945 101 0.12%
Belfast South & East Belfast Middle & Outer East Belfast HOUSE Pre 1945 201 0.23%
South South Down Newry Urban Bungalow 1961-1980 281 0.32%
North Causeway Ballymoney Urban HOUSE 1945-1960 101 0.12%
Belfast South & East Belfast Middle East Belfast HOUSE 1945-1960 211 0.24%

DSD/NIHE Asset Performance Evaluation Model Position Report 2014/15
Appendices
Asset group Total Units
Proportion
South Mid Ulster HOUSE Pre 1945 81 0.09%
South North Down & Ards Beauford Drive Hostel & Flat 6 0.01%
North West Inner Cityside HOUSE 1945-1960 536 0.61%
Belfast South & East Belfast Bungalow 1961-1980 148 0.17%
Belfast West Belfast Bungalow 1961-1980 175 0.20%
Belfast West Belfast Middle West Belfast HOUSE Pre 1945 384 0.44%
Belfast Lisburn & Castlereagh Lisburn Rural Bungalow 1961-1980 137 0.16%
North Causeway NTrad-TIMBER FRAMED HOUSE 162 0.19%
North West Inner Cityside Bungalow 1961-1980 54 0.06%
South South West Omagh Urban Bungalow 1961-1980 119 0.14%
Belfast North Belfast NTrad-TIMBER FRAMED HOUSE & BUNGALOW 15 0.02%
North Causeway Ballymoney Urban Bungalow 1961-1980 35 0.04%
South South NTrad-ALUM BUNGALOW 128 0.15%
North Causeway Ballycastle Urban HOUSE 1961-1980 90 0.10%
North South Antrim Antrim Urban HOUSE 1945-1960 19 0.02%
South North Down & Ards North Down Urban & Rural FLAT/MAIS 1961-1980 466 0.53%
North Causeway Limavady Urban Bungalow 1961-1980 178 0.20%
Belfast West Belfast NTrad-EASIFORM HOUSE 314 0.36%
North Causeway NTrad-ALUM BUNGALOW 32 0.04%
South South Banbridge Rural Bungalow 1961-1980 223 0.26%
North East Carrickfergus Urban Bungalow 1961-1980 146 0.17%
South North Down & Ards HOUSE 1945-1960 328 0.38%
South South West HOUSE Pre 1945 60 0.07%
South South Banbridge Urban Bungalow 1961-1980 236 0.27%
South Mid Ulster Dungannon Urban Bungalow 1961-1980 132 0.15%
South South Down HOUSE Pre 1945 92 0.11%
North Causeway Coleraine Urban Bungalow 1961-1980 246 0.28%
South South West Enniskillen Urban Bungalow 1961-1980 114 0.13%
North South Antrim Antrim Urban Bungalow 1961-1980 170 0.19%
North West Strabane Rural NTrad-TIMBER FRAMED HOUSE 106 0.12%
Belfast Lisburn & Castlereagh FLAT/MAIS POST 1980 204 0.23%
North West Outer Cityside Bungalow 1961-1980 104 0.12%
South South Down Down Rural Bungalow 1961-1980 294 0.34%
North West Strabane Urban HOUSE 1945-1960 35 0.04%
Belfast Lisburn & Castlereagh Lisburn Urban NTrad-NO FINES HOUSE 401 0.46%
Belfast North Belfast HOUSE 1945-1960 400 0.46%
South South Armagh Rural Bungalow 1961-1980 292 0.33%
North East Ballymena Rural Bungalow 1961-1980 176 0.20%
North East Doury HOUSE 1961-1980 87 0.10%

DSD/NIHE Asset Performance Evaluation Model Position Report 2014/15
Appendices
Asset group Total Units
Proportion
Belfast Lisburn & Castlereagh TWINBROOK BUNGALOW 1961-1980 & POST 1980
47 0.05%
South Mid Ulster HOUSE 1945-1960 347 0.40%
South South Down Newry Rural Bungalow 1961-1980 458 0.53%
South North Down & Ards North Down Rural Bungalow 1961-1980 56 0.06%
South South West HOUSE 1945-1960 141 0.16%
Belfast Lisburn & Castlereagh Lisburn Urban Bungalow 1961-1980 309 0.35%
Belfast West Belfast Outer West Belfast HOUSE 1945-1960 257 0.29%
North East HOUSE 1945-1960 478 0.55%
North West Strabane Rural Bungalow 1961-1980 218 0.25%
South South West FLAT/MAIS POST 1980 58 0.07%
Belfast West Belfast Middle & Outer Shankill HOUSE Pre 1945 209 0.24%
Belfast Lisburn & Castlereagh Lisburn Rural FLAT/MAIS 1961-1980 34 0.04%
North Causeway Coleraine Urban HOUSE 1945-1960 293 0.34%
Belfast South & East Belfast Inner South Belfast FLAT/MAIS POST 1980 374 0.43%
North East Sallagh Park HOUSE 1945-1960 6 0.01%
North East FLAT/MAIS POST 1980 105 0.12%
North East New Haven Hostel & Flat 9 0.01%
South South Down FLAT/MAIS POST 1980 106 0.12%
North West Waterside Urban HOUSE 1945-1960 158 0.18%
South South Portadown Urban & Rural HOUSE 1945-1960 154 0.18%
North Causeway FLAT/MAIS POST 1980 127 0.15%
North Causeway Coleraine Rural HOUSE 1945-1960 67 0.08%
South Mid Ulster Magherafelt Rural Bungalow 1961-1980 188 0.22%
North Causeway Coleraine Rural Bungalow 1961-1980 89 0.10%
North South Antrim Ollardale HOUSE 1961-1980 & 1945-1960 15 0.02%
Belfast West Belfast Moyard Hostel 17 0.02%
North West FLAT/MAIS POST 1980 289 0.33%
South North Down & Ards HOUSE Pre 1945 95 0.11%
Belfast Lisburn & Castlereagh Castlereagh Urban HOUSE 1945-1960 399 0.46%
North West Strabane Rural HOUSE 1945-1960 99 0.11%
South North Down & Ards FLAT/MAIS POST 1980 164 0.19%
Belfast North Belfast FLAT/MAIS POST 1980 329 0.38%
North South Antrim NTrad-ALUM BUNGALOW 56 0.06%
Belfast South & East Belfast Inner East Belfast FLAT/MAIS POST 1980 427 0.49%
Belfast West Belfast Middle West Belfast HOUSE 1945-1960 17 0.02%
Belfast North Belfast Outer North Belfast HOUSE Pre 1945 162 0.19%
South South Armagh Rural HOUSE 1945-1960 112 0.13%
South South FLAT/MAIS POST 1980 126 0.14%

DSD/NIHE Asset Performance Evaluation Model Position Report 2014/15
Appendices
Asset group Total Units
Proportion
South Mid Ulster Cookstown Urban Bungalow 1961-1980 42 0.05%
South Mid Ulster Dungannon Rural Bungalow 1961-1980 172 0.20%
North East Chichester House Hostel 11 0.01%
North South Antrim FLAT/MAIS POST 1980 103 0.12%
North West Strabane Urban Bungalow 1961-1980 50 0.06%
Belfast North Belfast Middle North Belfast HOUSE Pre 1945 376 0.43%
North West Outer Cityside NTrad-TIMBER FRAMED HOUSE 283 0.32%
South Mid Ulster Magherafelt Urban Bungalow 1961-1980 95 0.11%
North Causeway Limavady Urban HOUSE 1945-1960 76 0.09%
North West Waterside Urban Bungalow 1961-1980 202 0.23%
South North Down & Ards Newtownards Rural Bungalow 1961-1980 296 0.34%
South Mid Ulster FLAT/MAIS POST 1980 115 0.13%
South South Armagh Urban HOUSE 1961-1980 298 0.34%
North Causeway Ballymoney Rural Bungalow 1961-1980 133 0.15%
Belfast South & East Belfast Middle & Outer East Belfast FLAT/MAIS POST 1980 36 0.04%
Belfast Lisburn & Castlereagh Lisburn Rural HOUSE 1945-1960 113 0.13%
South South West NTrad-TIMBER FRAMED HOUSE 108 0.12%
South Mid Ulster NTrad-TIMBER FRAMED HOUSE 53 0.06%
North West Waterside Rural HOUSE 1961-1980 97 0.11%
North Causeway Limavady Rural HOUSE 1945-1960 24 0.03%
South South West Fermanagh Rural Bungalow 1961-1980 382 0.44%
North South Antrim Newtownabbey Rural HOUSE 1961-1980 30 0.03%
South South Banbridge Urban Bungalow POST 1980 72 0.08%
Belfast West Belfast FLAT/MAIS POST 1980 282 0.32%
North West Outer Cityside HOUSE 1945-1960 15 0.02%
North South Antrim Antrim Rural HOUSE 1961-1980 54 0.06%
North East Ballymena Urban HOUSE 1961-1980 553 0.63%
North East Ballymena Rural HOUSE 1961-1980 284 0.33%
Belfast Lisburn & Castlereagh Castlereagh Urban HOUSE 1961-1980 672 0.77%
South South Down Down Urban HOUSE 1961-1980 416 0.48%
North East Ballee Bungalow 1961-1980 131 0.15%
South South Armagh Rural HOUSE 1961-1980 216 0.25%
North West Clooney Mews Hostel & Warden Flat 11 0.01%
South South Lurgan Rural Bungalow 1961-1980 141 0.16%
South North Down & Ards North Down Urban Bungalow 1961-1980 227 0.26%
Belfast Lisburn & Castlereagh Lisburn Urban HOUSE 1945-1960 355 0.41%
Belfast South & East Belfast Bungalow POST 1980 332 0.38%
Belfast Lisburn & Castlereagh POLEGLASS BUNGALOW 1961-1980 11 0.01%
North West Waterside Rural Bungalow POST 1980 39 0.04%

DSD/NIHE Asset Performance Evaluation Model Position Report 2014/15
Appendices
Asset group Total Units
Proportion
North Causeway Ballymoney Rural HOUSE 1945-1960 52 0.06%
Belfast West Belfast Grosvenor Road Hostel 18 0.02%
Belfast Lisburn & Castlereagh Castlereagh Urban & Rural Bungalow POST 1980 115 0.13%
North East Ballee HOUSE 1961-1980 143 0.16%
South South Down Down Rural HOUSE 1961-1980 244 0.28%
Belfast North Belfast Inner North Belfast HOUSE 1961-1980 77 0.09%
North East Bungalow POST 1980 338 0.39%
South South Lurgan Town & Rural Bungalow POST 1980 171 0.20%
Belfast Lisburn & Castlereagh Lisburn Rural Bungalow POST 1980 56 0.06%
North West Strabane Urban HOUSE 1961-1980 217 0.25%
North Causeway Ballymoney Rural HOUSE 1961-1980 202 0.23%
Belfast Lisburn & Castlereagh POLEGLASS HOUSE 1961-1980 15 0.02%
Belfast West Belfast Outer Shankill HOUSE 1961-1980 130 0.15%
South North Down & Ards Newtownards Urban Bungalow 1961-1980 260 0.30%
South South Portadown Urban HOUSE 1961-1980 494 0.57%
South Mid Ulster Cookstown Rural Bungalow 1961-1980 57 0.07%
North West Inner Cityside Bungalow POST 1980 83 0.10%
North West Outer Cityside Bungalow POST 1980 191 0.22%
North South Antrim Antrim Urban HOUSE 1961-1980 978 1.12%
South South Banbridge Rural HOUSE 1961-1980 237 0.27%
North East Larne Rural HOUSE 1961-1980 64 0.07%
Belfast North Belfast Bungalow POST 1980 358 0.41%
South South Down Bungalow POST 1980 450 0.52%
Belfast West Belfast Bungalow POST 1980 440 0.50%
South South Down NTrad-ALUM Bungalow 2 0.00%
South South Brownlow Bungalow 1961-1980 79 0.09%
North West Inner Cityside HOUSE 1961-1980 352 0.40%
South South Banbridge Urban HOUSE 1961-1980 341 0.39%
South North Down & Ards Newtownards Urban Bungalow POST 1980 312 0.36%
South North Down & Ards Newtownards Urban HOUSE 1961-1980 794 0.91%
North West Bradley Park & Bridge Street & Drumard Close Hostel 22 0.03%
Belfast West Belfast Outer West Belfast HOUSE 1961-1980 707 0.81%
North Causeway Limavady Rural HOUSE 1961-1980 184 0.21%
Belfast Lisburn & Castlereagh POLEGLASS Bungalow POST 1980 180 0.21%
North Causeway Rathlin Island House & Bungalow POST 1980 4 0.00%
North West Waterside Urban Bungalow POST 1980 210 0.24%
South North Down & Ards North Down Rural HOUSE 1961-1980 16 0.02%
South South West Bungalow POST 1980 407 0.47%
North Causeway Bungalow POST 1980 353 0.40%

DSD/NIHE Asset Performance Evaluation Model Position Report 2014/15
Appendices
Asset group Total Units
Proportion
South Mid Ulster Cookstown Urban HOUSE 1961-1980 261 0.30%
North Causeway Ballymoney Urban HOUSE 1961-1980 204 0.23%
North South Antrim NTrad-TIMBER FRAMED House & Bungalow 25 0.03%
South South Armagh Rural Bungalow POST 1980 68 0.08%
South Mid Ulster Magherafelt Urban HOUSE 1961-1980 148 0.17%
North South Antrim Bungalow POST 1980 118 0.14%
South North Down & Ards Newtownards Rural Bungalow POST 1980 62 0.07%
North Causeway Coleraine Rural HOUSE 1961-1980 307 0.35%
North Causeway Ballycastle Rural HOUSE 1961-1980 196 0.22%
North Causeway Limavady Urban HOUSE 1961-1980 332 0.38%
Belfast South & East Belfast Inner South Belfast HOUSE POST 1980 1030 1.18%
North South Antrim Newtownabbey Urban HOUSE 1961-1980 1071 1.23%
Belfast Lisburn & Castlereagh Castlereagh Rural HOUSE 1961-1980 13 0.01%
Belfast Lisburn & Castlereagh Lisburn Urban Bungalow POST 1980 357 0.41%
South South Lurgan Rural HOUSE 1961-1980 93 0.11%
South South West Enniskillen Urban HOUSE 1961-1980 308 0.35%
South Mid Ulster Bungalow POST 1980 219 0.25%
South North Down & Ards North Down Urban Bungalow POST 1980 251 0.29%
South Mid Ulster Dungannon Rural HOUSE 1961-1980 230 0.26%
North West Waterside Urban HOUSE 1961-1980 899 1.03%
South South Lurgan Town HOUSE 1961-1980 290 0.33%
South North Down & Ards Newtownards Rural HOUSE 1961-1980 256 0.29%
South South Armagh Urban Bungalow POST 1980 64 0.07%
North South Antrim Grange HOUSE 1961-1980 71 0.08%
Belfast South & East Belfast Inner East Belfast HOUSE POST 1980 763 0.87%
Belfast South & East Belfast Middle East Belfast HOUSE POST 1980 178 0.20%
South Mid Ulster Magherafelt Rural HOUSE 1961-1980 230 0.26%
South Mid Ulster Cookstown Rural HOUSE 1961-1980 196 0.22%
North East NTrad-ALUM BUNGALOW 54 0.06%
Belfast Lisburn & Castlereagh Lisburn Urban HOUSE 1961-1980 775 0.89%
South South Down Newry Rural HOUSE 1961-1980 337 0.39%
South Mid Ulster Dungannon Urban HOUSE 1961-1980 409 0.47%
South North Down & Ards North Down Urban HOUSE 1961-1980 704 0.81%
South South Portadown Urban & Rural Bungalow POST 1980 96 0.11%
Belfast Lisburn & Castlereagh TWINBROOK HOUSE 1961-1980 & POST 1980 227 0.26%
Belfast West Belfast Middle Shankill HOUSE 1961-1980 49 0.06%
Belfast South & East Belfast Middle South Belfast HOUSE POST 1980 133 0.15%
South North Down & Ards North Down Urban & Rural HOUSE POST 1980 108 0.12%
Belfast South & East Belfast HOUSE 1961-1980 433 0.50%

DSD/NIHE Asset Performance Evaluation Model Position Report 2014/15
Appendices
Asset group Total Units
Proportion
Belfast Lisburn & Castlereagh Lisburn Rural HOUSE 1961-1980 69 0.08%
Belfast West Belfast Inner Shankill HOUSE 1961-1980 139 0.16%
South South Down Newry Urban HOUSE 1961-1980 695 0.80%
North East Carrickfergus Rural HOUSE 1961-1980 21 0.02%
North Causeway Coleraine Urban HOUSE 1961-1980 844 0.97%
Belfast North Belfast Outer North Belfast HOUSE 1961-1980 283 0.32%
North South Antrim Graystone Hostel NTrad-NO FINES 3 0.00%
North West Strabane Rural BUNGALOW POST 1980 139 0.16%
North West Strabane Urban Bungalow POST 1980 54 0.06%
North East Carrickfergus Urban HOUSE 1961-1980 338 0.39%
Belfast Lisburn & Castlereagh Castlereagh Urban HOUSE POST 1980 165 0.19%
South South Banbridge Rural Bungalow POST 1980 34 0.04%
South South West Fermanagh Rural HOUSE 1961-1980 326 0.37%
South North Down & Ards North Down Rural Bungalow POST 1980 10 0.01%
South South West Omagh Rural HOUSE 1961-1980 181 0.21%
North East Larne Urban HOUSE 1961-1980 178 0.20%
North West Strabane Rural HOUSE 1961-1980 300 0.34%
North West Inner Cityside HOUSE POST 1980 179 0.21%
Belfast West Belfast Inner West Belfast HOUSE POST 1980 489 0.56%
North East HOUSE POST 1980 167 0.19%
South South West Omagh Urban HOUSE 1961-1980 421 0.48%
Belfast West Belfast Middle West Belfast HOUSE 1961-1980 13 0.01%
North West Outer Cityside HOUSE 1961-1980 479 0.55%
North West Waterside Rural HOUSE POST 1980 15 0.02%
South South Portadown Rural HOUSE 1961-1980 21 0.02%
North Causeway HOUSE POST 1980 324 0.37%
Belfast North Belfast Middle North Belfast HOUSE POST 1980 518 0.59%
South North Down & Ards Newtownards Urban HOUSE POST 1980 450 0.52%
Belfast North Belfast Middle North Belfast HOUSE 1961-1980 205 0.24%
South North Down & Ards Newtownards Rural HOUSE POST 1980 29 0.03%
Belfast Lisburn & Castlereagh POLEGLASS HOUSE POST 1980 871 1.00%
Belfast North Belfast Inner North Belfast HOUSE POST 1980 978 1.12%
North West Waterside Urban HOUSE POST 1980 154 0.18%
Belfast West Belfast Middle & Outer Shankill HOUSE POST 1980 403 0.46%
South South Down HOUSE POST 1980 443 0.51%
Belfast Lisburn & Castlereagh Lisburn Rural HOUSE POST 1980 23 0.03%
Belfast Lisburn & Castlereagh Lisburn Urban HOUSE POST 1980 224 0.26%
Belfast West Belfast Inner Shankill HOUSE POST 1980 467 0.54%
North West Outer Cityside HOUSE POST 1980 538 0.62%

DSD/NIHE Asset Performance Evaluation Model Position Report 2014/15
Appendices
Asset group Total Units
Proportion
Belfast South & East Belfast Outer East Belfast HOUSE POST 1980 77 0.09%
South South HOUSE POST 1980 247 0.28%
Belfast West Belfast Inner West Belfast HOUSE 1961-1980 228 0.26%
Belfast West Belfast Middle West Belfast HOUSE POST 1980 521 0.60%
North Causeway Glenvara House Hostel 5 0.01%
Belfast West Belfast Outer West Belfast HOUSE POST 1980 559 0.64%
North South Antrim HOUSE POST 1980 106 0.12%
Belfast North Belfast Outer North Belfast HOUSE POST 1980 234 0.27%
North West Strabane Rural HOUSE POST 1980 129 0.15%
South South West HOUSE POST 1980 352 0.40%
South Mid Ulster HOUSE POST 1980 338 0.39%
South South Brownlow HOUSE 1961-1980 461 0.53%
North West Strabane Urban HOUSE POST 1980 116 0.13%
Total 87219 100.00%

DSD/NIHE Asset Performance Evaluation Model Position Report 2014/15
Appendices
Appendix 2
Asset Group Performance Maps

DSD/NIHE Asset Performance Evaluation Model Position Report 2014/15
Appendices
The geographical distribution of performance is illustrated in the maps below. The first map shows
financial performance only. On the second map the financial performance is shown in the inner circle
and non financial in the outer ring. The third shows a zoom view on the Belfast area.
Figure 20: NIHE stock, asset group 30yr NPV pu

DSD/NIHE Asset Performance Evaluation Model Position Report 2014/15
Appendices
Figure 21: NIHE, asset group 30 yr NPV pu and combined sustainability score

DSD/NIHE Asset Performance Evaluation Model Position Report 2014/15
Appendices
Figure 22: NIHE, asset group 30 yr NPV pu and combined sustainability score - Belfast