Asset Management Services - Raymond James
12
Asset Management Services BUILDING INVESTMENT PORTFOLIOS WITH AN INNOVATIVE APPROACH
Transcript of Asset Management Services - Raymond James

Asset Management Services
BUILDING INVESTMENT PORTFOLIOSWITH AN INNOVATIVE APPROACH

A results-driven approach to investing built around your financial goals

When Bob James founded Raymond James in 1962, he established a new way to help clients meet their long-term financial goals. He recognized that clients need to develop investment time horizons and strategies consistent with their risk tolerance. He also recognized the potential benefits of hiring professional investment managers who specialize in managing portfolios. This innovative approach, in line with what is known today as financial planning, uses a disciplined, systematic strategy to mitigate risk and optimize return.
Through the years, many programs have been developed in an effort to maximize risk-adjusted returns. We believe our approach to building investment portfolios with a focus on mitigating risk is one of the best choices available to clients today.
The Raymond James Asset Management Services process is founded on the investment techniques used by some of the largest, most sophisticated institutions and made available to you through your advisor.
Today, the Asset Management Services investment process serves as the foundation for the Freedom and Raymond James Consulting Services (RJCS) programs. RJCS as a platform offers thoroughly screened and recommended institutional managers in a diversity of styles to fit your needs, deployed within Unified Managed Account (UMA) portfolios. UMA is portfolio construction using separately managed accounts (SMAs), funds and other investment vehicles.
Available in a wide range of investment objectives, Freedom portfolios offer professionally designed asset allocation portfolios, automatic fund and manager selection, annual rebalancing and comprehensive performance reporting.
Understanding the investment process is the first step toward mitigating the risk in your portfolio and developing a plan designed to help you reach your financial goals.
We invite you to learn more about Raymond James Asset Management Services and to understand the Raymond James difference.
Further information on the funds selected for the Freedom portfolios is available by prospectus, which can be obtained through your advisor. Investors should carefully consider the investment objectives, risks, charges and expenses of mutual funds and exchange-traded funds before investing. The prospectus contains this and other information about the funds and should be read carefully before investing.All investments are subject to risk, including loss. There is no assurance that any investment strategy will be successful.
1
ASSET MANAGEMENT SERVICES
We believe that investors should be compensated for the risk they take in their investment portfolios. Many investment programs examine total return and total risk, where risk is defined as the volatility of a set of returns and measured by standard deviation.* While this is a good start, we believe it doesn’t go far enough, specifically because it fails to distinguish between the components of risk and return generated by the market and those generated by the investment manager.
Risk budgeting is the process by which the risk in a portfolio is broken into its components in an attempt to mitigate total risk more effectively. For the RJCS and Freedom programs, we select managers based on the excess risk-adjusted return (“alpha”) generated by the manager relative to its appropriate benchmark and the level of additional risk (“active risk”) taken on in pursuit of that alpha. Not only does this approach allow us to monitor the level of active risk in any portfolio (the “risk budget”), but it also helps ensure that the incremental performance in the portfolio is coming from the manager rather than the market.
Put simply, skilled managers should be able to generate alpha in any market environment. We would expect a high-alpha portfolio to provide incremental returns when the market is rising and, perhaps more important, reduce the downside in a falling market.
In areas where manager skill is unlikely to affect portfolio performance, passive investments such as exchange-traded funds (ETFs) can also be used to mitigate a portfolio’s total risk, as well as minimize costs. ETFs, which seek to replicate benchmark or index performance, take on only the risk inherent in the market and typically have lower fees than active managers.
That’s why we evaluate and attempt to mitigate market risk and optimize return through an asset allocation process for our Freedom portfolios. We use forward-looking assumptions in an effort to maximize the return potential at any level of risk selected. This is the core of the Raymond James difference and the process by which we strive to ensure that investors are compensated for the risks they take.
THE RAYMOND JAMES DIFFERENCE: MAXIMIZING RETURN POTENTIAL AT EACH LEVEL OF RISK
*Standard deviation: a measure of dispersion of a set of data from its mean.
The Raymond James Asset Management Services process described herein is applied exclusively within the Freedom and Unified Managed Account (UMA) programs. Raymond James Consulting Services (RJCS) managers are deployed within UMA portfolios.
Investing involves risk and investors may incur a profit or a loss. There is no assurance that any investment strategy will be successful.
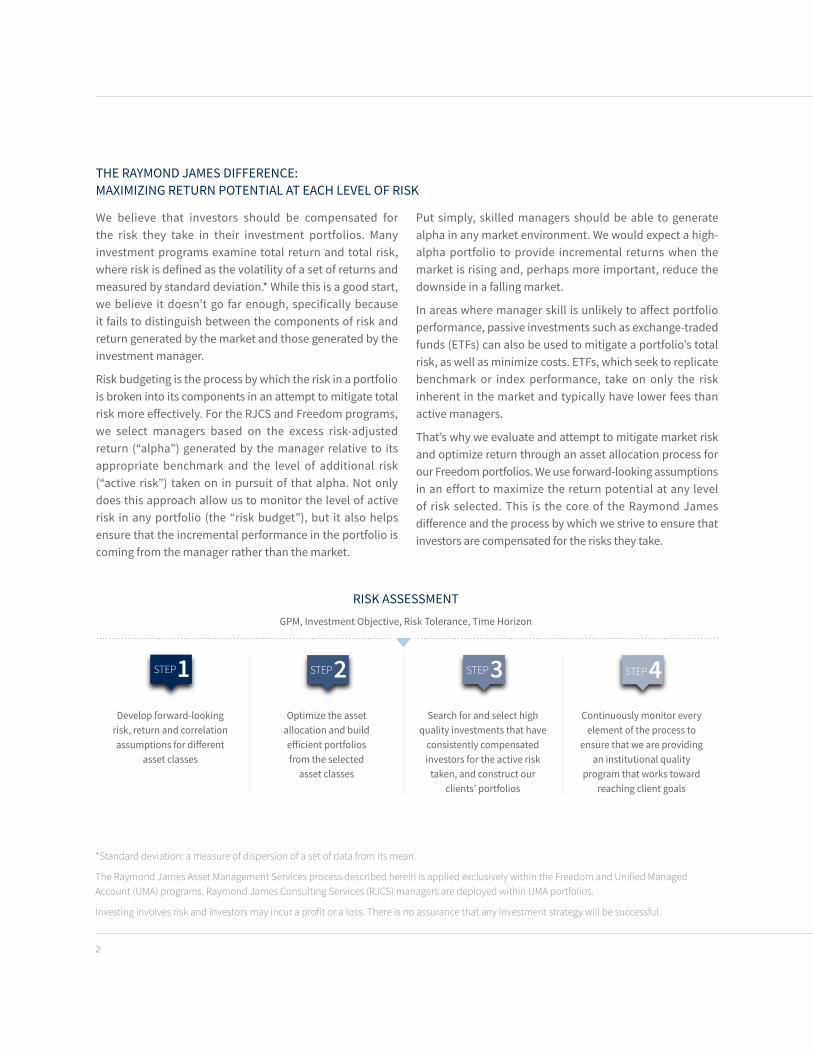
RISK ASSESSMENT
1STEP
2STEP
3STEP
4STEP
Develop forward-looking risk, return and correlation assumptions for different
asset classes
1STEP
2STEP
3STEP
4STEP
Optimize the asset allocation and build efficient portfoliosfrom the selected
asset classes
1STEP
2STEP
3STEP
4STEPSearch for and select high
quality investments that have consistently compensated investors for the active risk
taken, and construct our clients’ portfolios
1STEP
2STEP
3STEP
4STEP
Continuously monitor every element of the process to
ensure that we are providing an institutional quality
program that works toward reaching client goals
GPM, Investment Objective, Risk Tolerance, Time Horizon
2

RISK, RETURN AND CORRELATION ASSUMPTIONS: THE FOUNDATION OF ASSET ALLOCATION
We believe successful investing begins with developing a long-term view. Raymond James leverages internal expertise as well as external sources to develop a forward-looking, long-term expectation for various markets around the world. While some amount of history plays a role, the differentiator is the focus on the future as opposed to relying solely on history.
This approach is based on various expectations in the economies around the world such as economic growth, inflation as well as dividends and stock buybacks. The development of long-term expectations is complemented with near-term fundamental analysis to help identify opportunities for investors over the next three to five years relative to the long-term view.
The belief at Raymond James is that investors benefit long term by owning areas of the world with strong economic growth and dividend income. In addition, investors should own more of markets when they are selling at a discount to their normal valuation levels and vice versa.
It is generally believed that risk is easier to estimate than returns because it tends to be more stable over time.
Although the capital markets have gone through periods of increased and decreased risk, the total range of volatility over a reasonable time period has been narrower than a similar range for returns. Studies, however, indicate
investors are, at times, more concerned with downside risk than merely volatility, which we have incorporated into the process. We do this by analyzing many downside scenarios along with looking at current sentiment of each asset class return while trying to avoid catching a falling knife in relation to valuations.
Correlation is how asset classes move in relationship to each other. A correlation of 1.0 indicates identical behavior of the variables. A measure of -1.0 indicates opposite behavior, while 0.0 indicates no relationship whatsoever.
The expected correlation among asset classes is generally driven by long-term trends, such as the increased integration of the world economy, differing reactions to interest rates, or the total assumed level of inflation. It has been shown that correlations tend to shift over time and are based on market conditions. That being said, an important part of our process emphasizes the changing correlations in good and bad markets.
Rational capital market assumptions trace out a positive relationship between risk and return – higher return potential is expected to be accompanied by higher risk. Although certain asset classes may have outperformed others over short periods of time, over the long run risk and return have been rationally related to each other.
Raymond James Asset Management Services uses a rational, disciplined approach that reflects correlations according to current market conditions, thereby removing the
emotional aspect of asset allocation and seeking to avoid trend-chasing behavior.
Our proprietary process inherently recognizes that the past is not necessarily a reliable guide to the future.
Capital market assumptions
This forward-looking data is subject to change at any time and there is no assurance that the projections mentioned herein will be realized. Variations to capital market assumptions are expected and specific sectors or industries are more susceptible due to their increased vulnerability to any single economic, political or regulatory development.
1STEP
2STEP
3STEP
4STEP
ASSET MANAGEMENT SERVICES
3

Using the capital markets assumptions regarding risk, return and correlation developed in step one, our objective is to optimize the asset allocation to build portfolios that attempt to maximize the return potential at each level of risk. This range of risk/return relationships is commonly known as the “efficient frontier.”
In general, lower correlation among asset classes is expected to result in greater diversification benefits and, collectively, lower overall risk levels. Consider the diagram below. Risk reduction can be seen in moving from point C to point A: total risk is reduced at the same level of return potential.
If investors are comfortable with the level of risk at point C, they would probably prefer to move to point B instead, enhancing their return potential at their selected level of risk. In this illustration, point B provides the maximum return potential at that level of risk.
Along the efficient frontier, higher-risk, higher-return portfolios contain larger allocations of more volatile asset classes, such as international equities and small-cap equities. Lower-risk, lower-return portfolios contain larger allocations of relatively less volatile asset classes, such as fixed income.
Generally, investors expect to receive a higher return for assuming higher risk. This relationship can be represented as a straight line (in light blue). With the addition of diversified asset classes that don’t move in lock step (meaning correlation is less than 1.0), the risk/return relationship changes. The representation moves from the linear relationship to the theoretical “efficient frontier” – a curve along which returns would be maximized at each level of risk.
THE EFFICIENT FRONTIER
KEY TAKEAWAYS
EFFICIENT PORTFOLIOS
EFFICIENT FRONTIER
Efficient frontier correlation between asset classes < 1.0
Potential volatility effect of diversification
No diversification correlation between asset classes = 1.0A
B
C
Potential return effectof diversification
RE
TU
RN
V O L AT I L I T Y ( R I S K )
Return addedby activemanagement
Risk added by active management (i.e., active risk)
p
p
q
EFFICIENTFRONTIER
(Passive Portfolios)RE
TU
RN
V O L AT I L I T Y ( R I S K )
1
STEP 2
1STEP
2STEP
3STEP
4STEP
BUILDING PORTFOLIOS: BALANCING RISK AND RETURN POTENTIAL
The above illustration depicts the typical relationship between risk and return. All investing involves risk and you may incur a profit or a loss. Diversification does not ensure a profit or a loss. This information should not be construed as a recommendation of any investment strategy.
While diversification alone does not ensure a profit or guarantee against a loss, a
properly diversified portfolio is intended to help you pursue your goals with less
volatility by combining asset classes with lower correlation.
A reduction in volatility from diversification is designed to help you to stick with your investment
plan and stay on track with your long-term goals.
By attempting to offset the volatility of different asset classes, investors can
seek additional returns at the same level of risk (illustrated by moving from
point C to point B in the example).
4
We believe that the selection of managers should be driven by the value they add, isolated from the effects of the market. Moreover, we believe that the manager must demonstrate additional value to compensate for the incremental risk and expense of active management.
UNDERSTANDING EXCESS RETURNMost investors are familiar with the use of benchmarks and the expectation that good investment managers generate returns in excess of their benchmarks. However, managers can attempt to generate excess returns one of two ways.
The first method is to take on greater risk than the benchmark, as measured by beta, or a measure of the volatility of the portfolio relative to the benchmark. High-beta portfolios are expected to be more volatile, returning more than the benchmark in up markets and losing more in down markets. Low-beta portfolios are expected to be less volatile, moving less than the benchmark in both directions.
Generating excess return through beta, therefore, depends wholly on the direction of the market.
The second method is attempting to pick better stocks in better sectors. After adjusting the excess return for the beta, or “market,” portion, any excess return can be attributed to stock selection. This beta-adjusted excess return, called “alpha,” is a useful measure of manager skill because it accounts not only for returns from the manager’s style, but also for the degree of risk that’s accepted within that style.
The primary value of finding managers who add alpha is that alpha is independent of market direction. Specifically, alpha should help to protect the downside in a portfolio.
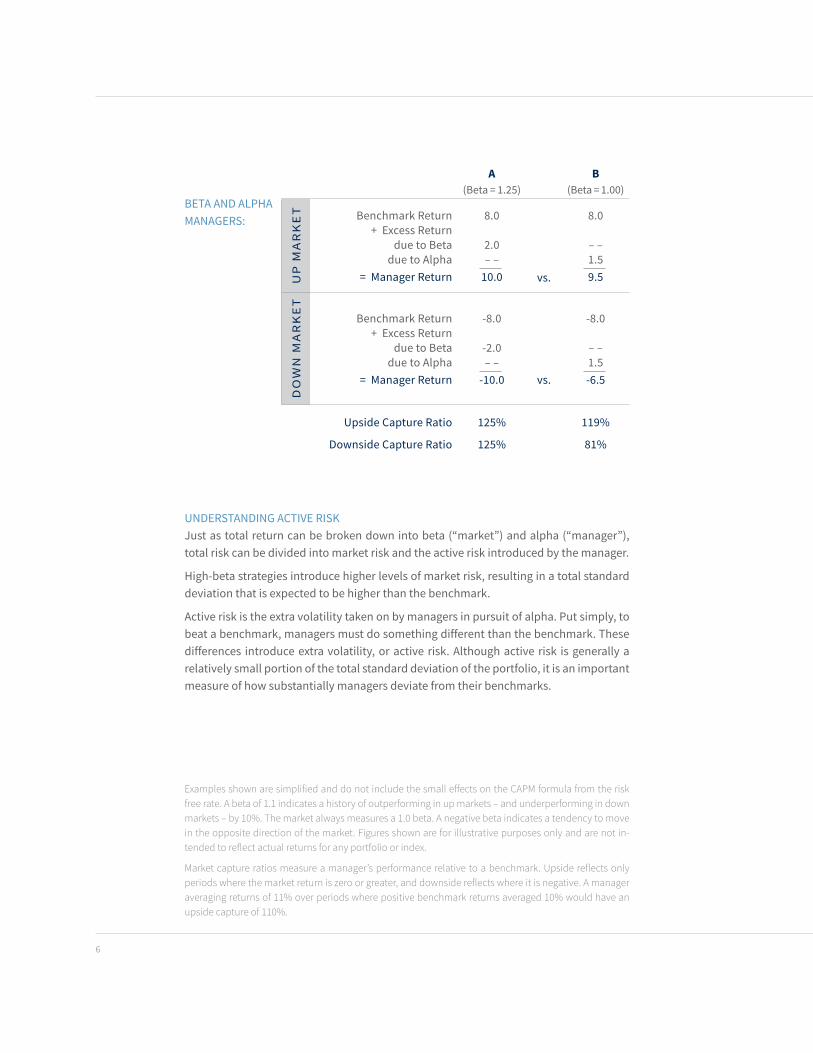
Consider managers A and B. Manager A is a high-beta manager (beta = 1.25) who generates no alpha, while Manager B is beta-neutral (beta = 1.00) and generates 1.50% of excess return through alpha (see next page).
The value of alpha becomes clear in a downturn. Specifically, Manager A is expected to be down more than the market due to high beta, but Manager B is expected to be down less because of consistently positive alpha and lower beta. Relating these concepts to upside and downside capture ratios, high-beta Manager A captures 125% of the upside, but also 125% of the downside, while alpha-generating, lower beta Manager B captures 119% of the upside, but only 81% of the downside.
While active managers seek to beat their benchmarks, passive investments seek to capture index performance through exchange-traded funds (ETFs) or indexed mutual funds, both of which typically have lower fees than actively managed investments. These passive investments are generally cost effective, with lower turnover among holdings and more favorable tax implications. To build Hybrid portfolios, we select passive investments in asset classes where active manager performance is less likely to affect returns.
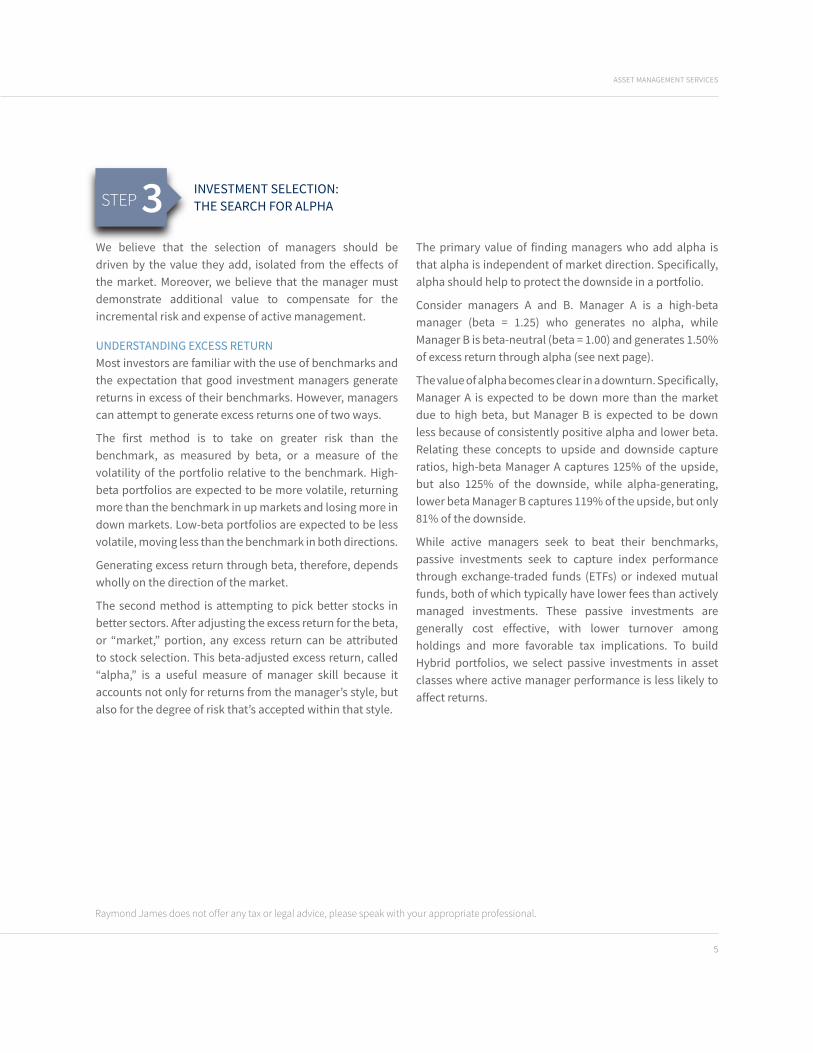
STEP 3 INVESTMENT SELECTION: THE SEARCH FOR ALPHA
1STEP
2STEP
3STEP
4STEP
Raymond James does not offer any tax or legal advice, please speak with your appropriate professional.
ASSET MANAGEMENT SERVICES
5
A(Beta = 1.25)
B(Beta = 1.00)
UP
MA
RK
ET Benchmark Return
+ Excess Return due to Beta
due to Alpha= Manager Return
8.0
2.0– –
10.0 vs.
8.0
– –1.5 9.5
DO
WN
MA
RK
ET
Benchmark Return+ Excess Return
due to Beta due to Alpha
= Manager Return
-8.0
-2.0– –
-10.0 vs.
-8.0
– –1.5 -6.5
Upside Capture Ratio 125% 119%
Downside Capture Ratio 125% 81%
BETA AND ALPHA MANAGERS:
6
UNDERSTANDING ACTIVE RISKJust as total return can be broken down into beta (“market”) and alpha (“manager”), total risk can be divided into market risk and the active risk introduced by the manager.
High-beta strategies introduce higher levels of market risk, resulting in a total standard deviation that is expected to be higher than the benchmark.
Active risk is the extra volatility taken on by managers in pursuit of alpha. Put simply, to beat a benchmark, managers must do something different than the benchmark. These differences introduce extra volatility, or active risk. Although active risk is generally a relatively small portion of the total standard deviation of the portfolio, it is an important measure of how substantially managers deviate from their benchmarks.
Examples shown are simplified and do not include the small effects on the CAPM formula from the risk free rate. A beta of 1.1 indicates a history of outperforming in up markets – and underperforming in down markets – by 10%. The market always measures a 1.0 beta. A negative beta indicates a tendency to move in the opposite direction of the market. Figures shown are for illustrative purposes only and are not in-tended to reflect actual returns for any portfolio or index.
Market capture ratios measure a manager’s performance relative to a benchmark. Upside reflects only periods where the market return is zero or greater, and downside reflects where it is negative. A manager averaging returns of 11% over periods where positive benchmark returns averaged 10% would have an upside capture of 110%.
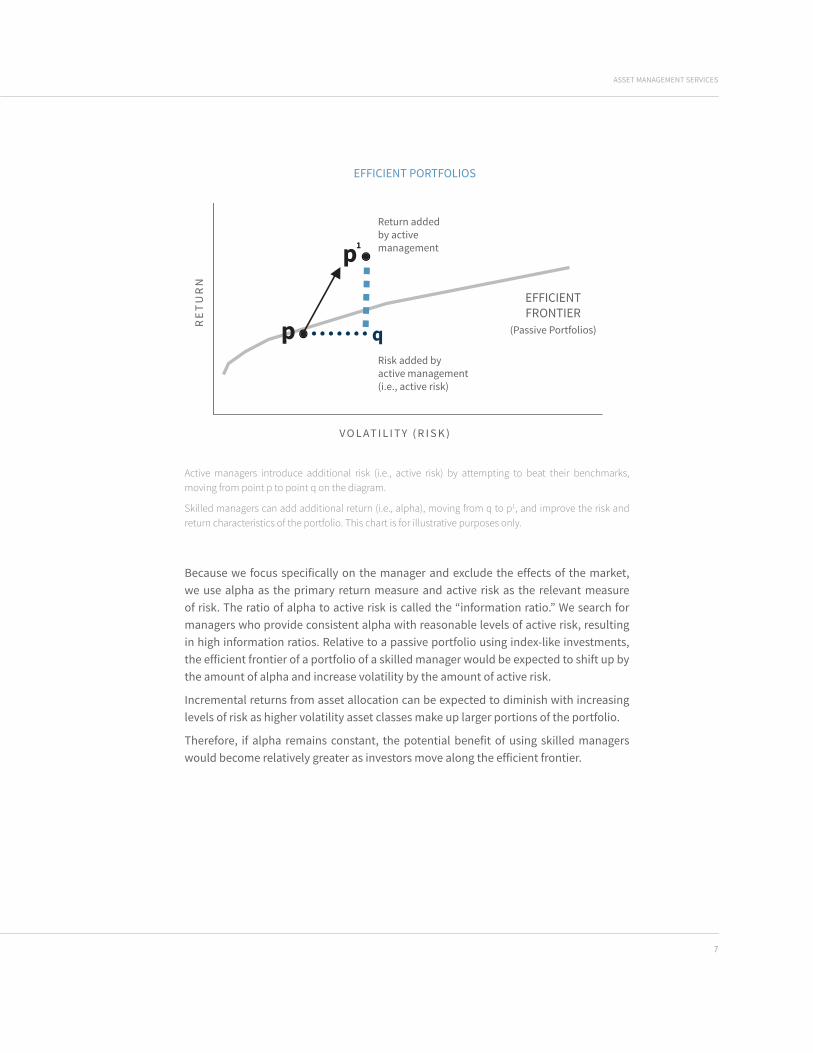
Active managers introduce additional risk (i.e., active risk) by attempting to beat their benchmarks, moving from point p to point q on the diagram.
Skilled managers can add additional return (i.e., alpha), moving from q to p1, and improve the risk and return characteristics of the portfolio. This chart is for illustrative purposes only.
EFFICIENT PORTFOLIOS
EFFICIENT PORTFOLIOS
EFFICIENT FRONTIER
Efficient frontier correlation between asset classes < 1.0
Potential volatility effect of diversification
No diversification correlation between asset classes = 1.0A
B
C
Potential return effectof diversification
RE
TU
RN
V O L AT I L I T Y ( R I S K )
Return addedby activemanagement
Risk added by active management (i.e., active risk)
p
p
q
EFFICIENTFRONTIER
(Passive Portfolios)RE
TU
RN
V O L AT I L I T Y ( R I S K )
1
ASSET MANAGEMENT SERVICES
7
Because we focus specifically on the manager and exclude the effects of the market, we use alpha as the primary return measure and active risk as the relevant measure of risk. The ratio of alpha to active risk is called the “information ratio.” We search for managers who provide consistent alpha with reasonable levels of active risk, resulting in high information ratios. Relative to a passive portfolio using index-like investments, the efficient frontier of a portfolio of a skilled manager would be expected to shift up by the amount of alpha and increase volatility by the amount of active risk.
Incremental returns from asset allocation can be expected to diminish with increasing levels of risk as higher volatility asset classes make up larger portions of the portfolio.
Therefore, if alpha remains constant, the potential benefit of using skilled managers would become relatively greater as investors move along the efficient frontier.

Next StepsIf you believe that Raymond James Asset Management Services may be right for you, your advisor will work with you to develop a customized proposal that recommends specific strategies that can help you work effectively toward your goals.
To learn more, talk to your advisor.
A critical part of an innovative investment management process is the regular review of both your objectives and your current portfolio. Your advisor will work with you on an ongoing basis to assess how changes in your situation may impact your goals and objectives and the appropriateness of your current portfolio.
Meanwhile, we monitor every element of the investment process on an ongoing basis to ensure that we are providing a quality program.
• We update the capital market assumptions on an ongoing basis. This allows us to recommend adjustments to the Freedom portfolios if the shape or location of the efficient frontier changes based on changes in the forward-looking risk, return or correlation assumptions.
• We monitor all of our existing managers and search for additional skilled managers and funds to offer in RJCS, UMA and Freedom on an ongoing basis. We also terminate managers from the program if we lose confidence in their ability to add alpha.
• We generate performance reports that measure managers against their benchmarks to determine if our managers are in fact compensating investors for the risk taken.
All of these resources are dedicated to delivering the Raymond James difference to you each and every day. The ongoing consulting process with your advisor helps identify changes that could alter your risk/return profile and ensures that your portfolio is the appropriate choice to help achieve your long-term goals. With this process, you can have confidence that you are invested in a program designed to fit your needs.
Don’t choose a portfolio manager based on sales tactics. Rigorous portfolio construction takes the
emotion out of manager selection.
We ensure your portfolio utilizes experienced institutional money managers who, we believe,
have consistently added value through active management.
The four-step portfolio construction process is designed to align your portfolio with your
investment goals and objectives.
You can have confidence that we’re taking steps to ensure your managers will adhere to their
philosophy and process and avoid unexpected biases that may indicate trend-chasing behavior.
1STEP
2STEP
3STEP
4STEPONGOING MONITORING: OUR COMMITMENT TO YOU
Further information on the funds selected for the Freedom portfolios is available by prospectus, which can be obtained through your advisor. Investors should carefully consider the investment objectives, risks, charges and expenses of mutual funds and exchange-traded funds before investing. All investments are subject to risk. The prospectus contains this and other information about the funds and should be read carefully before investing.

The foregoing content reflects the opinions of Raymond James Asset Management Services and is subject to change at any time without notice. Content provided herein is for informational purposes only and should not be used or construed as investment advice or a recommendation regarding the purchase or sale of any security outside of an account. This should not be considered forward looking, and are not guarantees of future performance of any investment.
Diversification and asset allocation do not ensure a profit or protect against a loss. There is no assurance that any investment program will result in success. Investing involves risk and investors may incur a profit or a loss.
It is important to review investment objectives, risk tolerance, tax objectives and liquidity needs before choosing an investment style or manager. In making an investment decision an individual should utilize other information sources and the advice of their advisor.
All investments carry a certain degree of risk and no one particular investment style or manager is suitable for all types of investors. Statements made herein should not be considered forward looking, and are not guarantees of future performance of any investment.
CAPITAL MARKET ASSUMPTIONS
Capital market assumptions provide additional resources for our investment manager search and selection process. This forward looking data is subject to change at any time and there is no assurance that the projections mentioned herein will be realized. Variations to capital market assumptions are expected and specific sectors or industries are more susceptible due to their increased vulnerability to any single economic, political or regulatory development.
Important information related to portfolio risks:
It is important to review the investment objectives, risk tolerance, tax objectives and liquidity needs before choosing an investment style or manager. All investments carry a certain degree of risk and no one
particular investment style or manager is suitable for all types of investors. Asset allocation and diversification does not ensure a profit or protect against a loss. This should not be considered forward looking, and are not guarantees of future performance of any investment. There is no assurance that any investment strategy will be successful.
• High-yield (below investment grade) bonds are not suitable for all investors and may present greater credit risk than other bonds.
• There is an inverse relationship between interest rate movements and fixed income prices. Generally, when interest rates rise, fixed income prices fall and when interest rates fall, fixed income prices generally rise. Bond and bond fund investors should carefully consider risks such as: interest rate risk, credit risk, liquidity risk and inflation risk.
• International investing involves special risks, including currency fluctuations, different financial accounting standards, and possible political and economic instability.
• Investing in emerging markets can be riskier than investing in well-established foreign markets. Emerging and developing markets may be less liquid and more volatile because they tend to reflect economic structures that are generally less diverse and mature and political systems that may be less stable than those in more developed countries.
• Investing in small-cap stocks generally involves greater risks, and therefore, may not be appropriate for every investor. Stocks of smaller or newer or mid-sized companies may be more likely to realize more substantial growth as well as suffer more significant losses than larger or more established issuers.
• Commodities trading is generally considered speculative because of the significant potential for investment loss. Among the factors that could affect the value of the fund’s investments in commodities are cyclical economic conditions, sudden political events, changes in sectors affecting a particular industry
or commodity, and adverse international monetary policies. Markets for precious metals and other commodities are likely to be volatile and there may be sharp price fluctuations even during periods when prices overall are rising.
• Specific sector investing such as real estate can be subject to different and greater risks than more diversified investments. Declines in the value of real estate, economic conditions, property taxes, tax laws and interest rates all present potential risks to real estate investments.
• Some accounts may invest in Master Limited Partnership (“MLP”) units, which may result in unique tax treatment. MLPs may not be appropriate for ERISA or IRA accounts, and cause K-1 tax treatment. Please consult your tax adviser for additional information regarding the tax implications associated with MLP investments.
• Alternative investments are generally considered speculative in nature and may involve a high degree of risk, particularly if concentrating investments in one or few alternative investments. These risks are potentially greater and substantially different than those associated with traditional equity or fixed income investments. The investment strategies used by certain Funds may require a substantial use of leverage. The investment strategies employed and associated risks are more fully disclosed in each Fund’s prospectus, which is available from your advisor.
• Changes in the value of a hedging instrument may not match those of the investment being hedged.
• These portfolios may be subject to international, small-cap and sector-focus exposures as well. Accounts may have over weighted sector and issuer positions, and may result in greater volatility and risk.
• Companies in the technology industry are subject to fierce competition, and their products and services may be subject to rapid obsolescence.
An ETF is a type of Investment Company whose investment objective is to achieve a return similar to that of a particular market index. An ETF will invest in either all of the securities or a representative sample of the securities included in the index they track. ETFs may be bought or sold throughout the day in the secondary market, but are generally not redeemable by retail investors for the underlying basket of securities they track. Clients likely to find a Freedom ETF strategy most appropriate are those willing to accept market-like returns, lower management fees and operating expenses, with little potential for the individual ETFs to outperform the indices they track. Mutual funds are typically actively managed, and as a result, the underlying management fees and operating expenses assessed by the fund companies are generally higher than those for ETFs (1% to 1.5% for mutual funds versus .20% to .30% for ETFs). Potential investors should understand that the annual advisory fee charged in the Freedom ETF program is in addition to the management fees, operating expenses, and other expenses associated with an investment in ETFs.

INTERNATIONAL HEADQUARTERS: THE RAYMOND JAMES FINANCIAL CENTER
880 CARILLON PARKWAY // ST. PETERSBURG, FL 33716 // 727.567.1000, EXT. 74569
RJFREEDOM.COM
© 2019 Raymond James & Associates, Inc., member New York Stock Exchange/SIPC. © 2019 Raymond James Financial Services, Inc., member FINRA/SIPC. Raymond James® is a registered trademark of Raymond James Financial, Inc. AMS 0505 0819 AB 8/19 AMS19-2676357 Expires: 08/09/2020 Marketplace: AMS 0505
LIFE WELL PLANNED.
NOT Deposits • Not Insured by FDIC or any other government agency
NOT GUARANTEED by the bank • Subject to risk and may lose value