ASSET MANAGEMENT PLAN - Walgett Shire · ASSET MANAGEMENT PLAN ECONOMIC AFFAIRS ... EFFECT OF...
73
ASSET MANAGEMENT PLAN ECONOMIC AFFAIRS 2011/12 – 2020/21 May 2012 Part of Walgett Shire Council’s Resourcing Strategy
Transcript of ASSET MANAGEMENT PLAN - Walgett Shire · ASSET MANAGEMENT PLAN ECONOMIC AFFAIRS ... EFFECT OF...
ASSET MANAGEMENTPLAN
ECONOMIC AFFAIRS2011/12 – 2020/21
May 2012
Part of Walgett Shire Council’s Resourcing Strategy

economic affairs _474C068.doc Page 2 of 73
Prepared For: Walgett Shire Council By: Focus Business Group Pty Ltd
Document Control
DOCUMENT I.D.Version Date Version Details Author Reviewer Approver
1 21/03/2012 Asset Management Plan (Version 3.0)
2 4/04/2012 Asset Management Plan (Version 3.1)
3 3/05/2012 Asset Management Plan (Version 3.2)
4 7/05/2012 Asset Management Plan (Version 3.3)
5 Adopted minute No. 000 Council
All rights reserved. No part of this document may be copied, removed,electronically stored or modified without the express permission of Walgett ShireCouncil.

economic affairs _474C068.doc Page 3 of 73
TABLE OF CONTENTS
EXECUTIVE SUMMARY 6
1. INTRODUCTION 11
2. LEVELS OF SERVICE 14
3. FUTURE DEMAND 19
4. LIFECYCLE MANAGEMENT PLAN 27
5. FINANCIAL SUMMARY 36
6. ASSET MANAGEMENT PRACTICES 46
7. PLAN IMPROVEMENT AND MONITORING 50
APPENDIX 1 – LEGISLATIVE REQUIREMENTS 53
APPENDIX 2 – SUSTAINABILITY RATIOS 55
APPENDIX 3 – DEFINITIONS 57
APPENDIX 4 – STRATEGIC LIFECYCLE MODEL 61
APPENDIX 5 – PLANNED CAPITAL EXPENDITURE BY ASSET CATEGORY 65
APPENDIX 6 – PLANNED CAPITAL EXPENDITURE BY TOWN 68

economic affairs _474C068.doc Page 4 of 73
LIST OF TABLES
TABLE 1 – COUNCIL’S ASSET MANAGEMENT PLANS 6
TABLE 2 - OVERVIEW OF COUNCIL'S ECONOMIC AFFAIRS ASSETS 7
TABLE 3 – ECONOMIC AFFAIRS ASSET FUNDING AND CONDITION TRENDS 7
TABLE 4 – ECONOMIC AFFAIRS ASSET PORTFOLIO CONDITION 9
TABLE 5 - COUNCILS ASSET MANAGEMENT PLANS 11
TABLE 6 - LEVEL OF SERVICE PERFORMANCE MEASURES 14
TABLE 7 - ASSET CONDITION RATING SYSTEM 15
TABLE 8 - WORKS COMPLETED IN 2010 /11 FINANCIAL YEAR 17
TABLE 9 - WORKS IN PROGRESS FOR 2011 /12 FINANCIAL YEAR 17
TABLE 10 - PLANNED WORKS FOR 2012/16 FINANCIAL YEARS 18
TABLE 11 – ECONOMIC AFFAIRS ASSET PORTFOLIO CONDITION 18
TABLE 12 - ABS POPULATION DATA FOR WALGETT SHIRE COUNCIL 19
TABLE 13 - POPULATION GROWTH PROJECTIONS CALCULATED FOR THIS PLAN 20
TABLE 14 - ABS NATIONAL DEMOGRAPHIC TRENDS 21
TABLE 15 - 2006 CENSUS DATA 22
TABLE 16 – COUNCIL’S ASSET MANAGEMENT DATA (ECONOMIC AFFAIRS) 22
TABLE 17 - EFFECT OF TECHNOLOGY CHANGES ON SERVICE DELIVERY 24
TABLE 18 - NEW ASSETS CURRENTLY PLANNED FOR 2012/16 24
TABLE 19 - DEMAND MANAGEMENT STRATEGIES 25
TABLE 20 - LEVEL 1 ASSETS 30
TABLE 21 - AVERAGE ASSET CONDITION (TECHNICAL MEASURE) 31
TABLE 22 - ASSETS FOR DISPOSAL 34
TABLE 23 – CRITICAL RISKS AND TREATMENT PLANS 35
TABLE 24 - ECONOMIC AFFAIRS ASSET VALUES AS AT 30 JUNE 2011 36
TABLE 25 - ASSET MANAGEMENT PLAN IMPROVEMENT PROGRAM 51
TABLE 26 - LEGISLATIVE REQUIREMENTS 53
TABLE 27 - SUMMARY ACCOUNTING AND COST ESTIMATE DATA 55
TABLE 28 – CONSUMPTION, RENEWAL AND UPGRADE RATIOS 55
TABLE 29 - LIFE CYCLE SUSTAINABILITY INDEX 56
TABLE 30 - 10 YEAR SUSTAINABILITY RATIO 56

economic affairs _474C068.doc Page 5 of 73
LIST OF FIGURES
FIGURE 1 - INTEGRATED PLANNING AND REPORTING PROCESS 13
FIGURE 2 - EXAMPLE - ASSET CONDITION RATING 16
FIGURE 3 - EXAMPLE - ASSET HIERARCHY 29
FIGURE 4 - DEPRECIATION PROJECTIONS (10 YEARS) 37
FIGURE 5 - FORECAST ASSET PORTFOLIO TOTALS (10 YEARS) 37
FIGURE 6 - PLANNED NEW CAPITAL EXPENDITURE (5 YEARS) 38
FIGURE 7 - PLANNED RENEWAL CAPITAL EXPENDITURE (5 YEARS) 38
FIGURE 8 - FORECAST TOTAL CAPITAL EXPENDITURE (10 YEARS) 39
FIGURE 9 - ASSET DISPOSAL PROJECTIONS (10 YEARS) 40
FIGURE 10 - PROJECTED MAINTENANCE EXPENDITURE (10 YEARS) 41
FIGURE 11 - PROJECTED OPERATIONS EXPENDITURE (10 YEARS) 42
FIGURE 12 - AVERAGE ANNUAL LIFECYCLE COSTS (10 YEARS) 42
FIGURE 13 - PROJECTED ASSET EXPENDITURE AS A % OF ASSET VALUE 43
FIGURE 14 - 5 YEAR TOTAL CAPITAL WORKS PROGRAM BY ASSET CATEGORY 65
FIGURE 15 - 5 YEAR NEW CAPITAL WORKS PROGRAM BY ASSET CATEGORY 66
FIGURE 16 - 5 YEAR RENEWAL CAPITAL WORKS PROGRAM BY ASSET CATEGORY 67
FIGURE 17 - 5 YEAR TOTAL CAPITAL WORKS PROGRAM BY TOWN 68
FIGURE 18 - WALGETT - 5 YEAR TOTAL CAPITAL WORKS PROGRAM 69
FIGURE 19 - LIGHTNING RIDGE - 5 YEAR TOTAL CAPITAL WORKS PROGRAM 70
FIGURE 20 - COLLARENEBRI - 5 YEAR TOTAL CAPITAL WORKS PROGRAM 70
FIGURE 21 - BURREN JUNCTION - 5 YEAR TOTAL CAPITAL WORKS PROGRAM 71
FIGURE 22 - CARINDA - 5 YEAR TOTAL CAPITAL WORKS PROGRAM 71
FIGURE 23 - CUMBORAH - 5 YEAR TOTAL CAPITAL WORKS PROGRAM 72
FIGURE 24 - ROWENA - 5 YEAR TOTAL CAPITAL WORKS PROGRAM 72
FIGURE 25 - POKATAROO - 5 YEAR TOTAL CAPITAL WORKS PROGRAM 73
economic affairs _474C068.doc Page 6 of 73
Executive SummaryWalgett Shire Council has a significant portfolio of community assets under itscare and control. Council’s Asset Management Plans (AMP’s) assist Council toplan for the future, allocate our financial and human resources efficiently andensure that assets are managed according to the changing needs of ourcommunity.
This AMP should be read in conjunction with following guiding Council plans.
1. Revised Walgett Shire Community Strategic Plan (26 March 2012).
2. Council’s Strategic Asset Management Plan (Version 1 - May 2012)
3. Council’s Asset Management Policy (Version 1 - April 2010)
The key elements of this Asset Management Plan are as follows:
LEVELS OF SERVICE - specifies levels of service to be provided by Council.
FUTURE DEMAND – impact on future service delivery and how this will be met.
LIFE CYCLE MANAGEMENT – managing our assets to meet agreed levels of service.
FINANCIAL SUMMARIES - what funds are required to meet agreed levels of service.
COUNCILS ASSET MANAGEMENT PRACTICES - our systems and processes.
MONITORING - how this plan will be monitored to ensure it is meeting Council’sobjectives.
AMP IMPROVEMENT PLAN – how we plan to improve our asset managementcapability.
Council’s Integrated Planning and Reporting Process
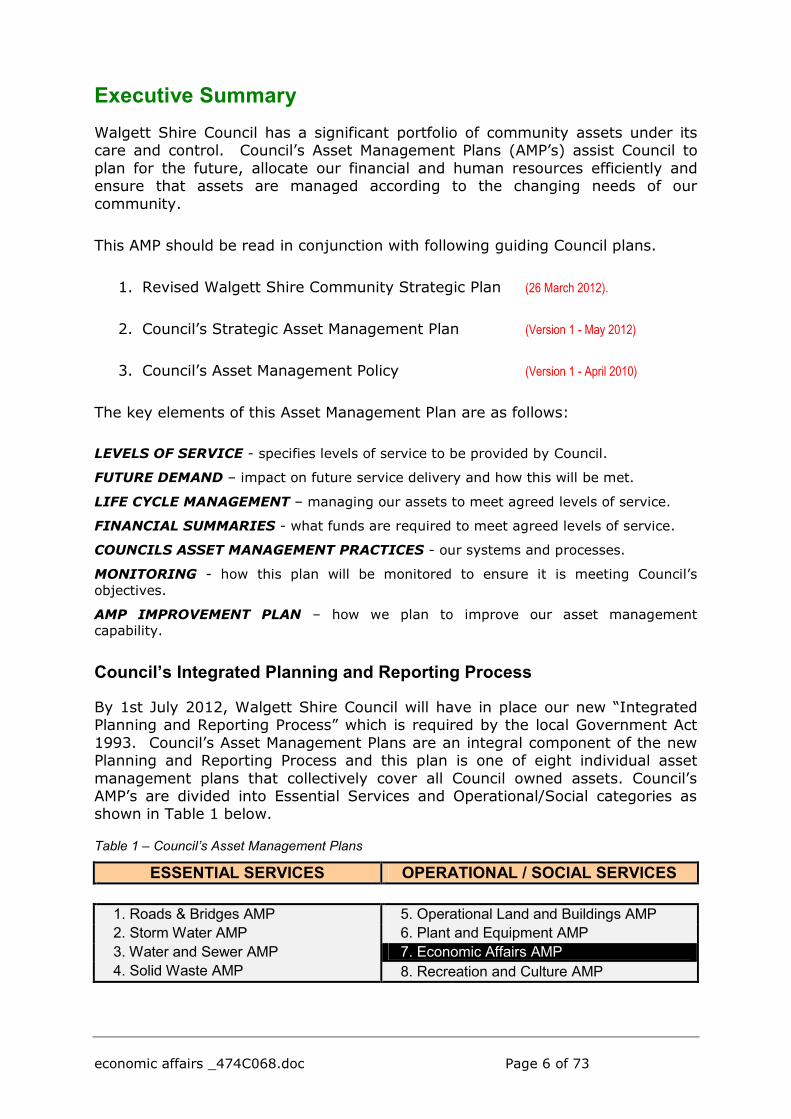
By 1st July 2012, Walgett Shire Council will have in place our new “IntegratedPlanning and Reporting Process” which is required by the local Government Act1993. Council’s Asset Management Plans are an integral component of the newPlanning and Reporting Process and this plan is one of eight individual assetmanagement plans that collectively cover all Council owned assets. Council’sAMP’s are divided into Essential Services and Operational/Social categories asshown in Table 1 below.
Table 1 – Council’s Asset Management Plans
ESSENTIAL SERVICES OPERATIONAL / SOCIAL SERVICES
1. Roads & Bridges AMP 5. Operational Land and Buildings AMP2. Storm Water AMP 6. Plant and Equipment AMP3. Water and Sewer AMP 7. Economic Affairs AMP4. Solid Waste AMP 8. Recreation and Culture AMP
economic affairs _474C068.doc Page 7 of 73
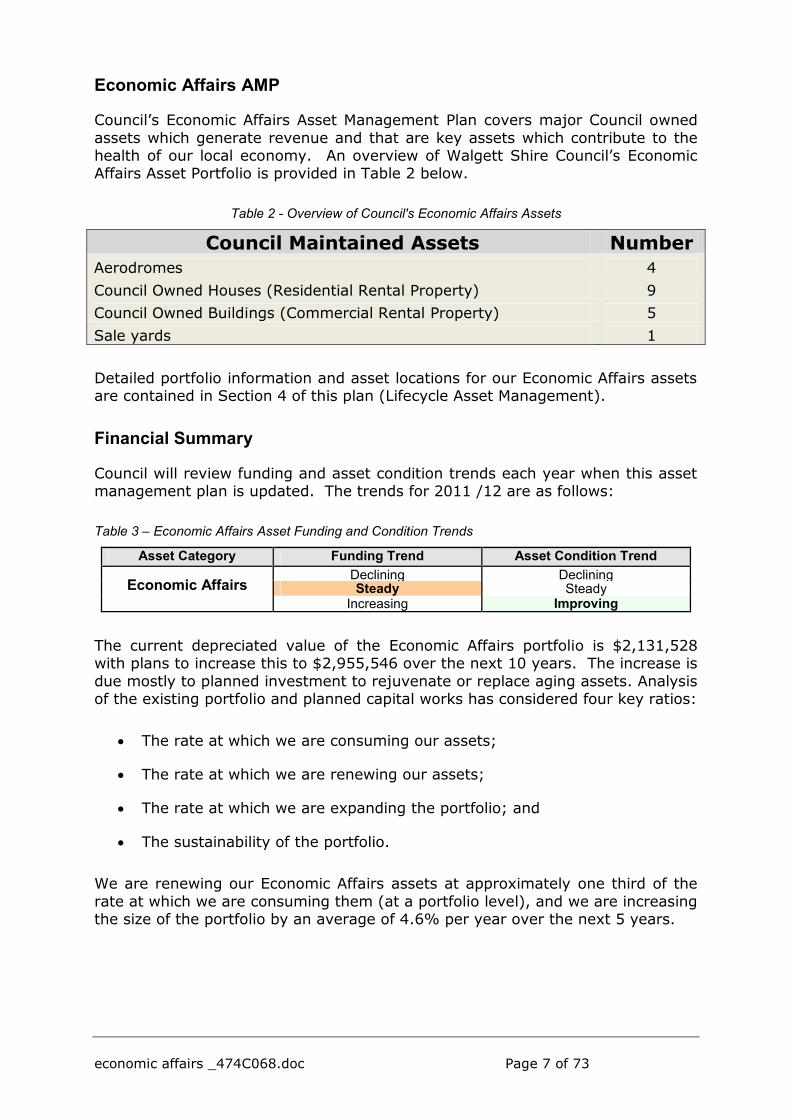
Economic Affairs AMP
Council’s Economic Affairs Asset Management Plan covers major Council ownedassets which generate revenue and that are key assets which contribute to thehealth of our local economy. An overview of Walgett Shire Council’s EconomicAffairs Asset Portfolio is provided in Table 2 below.
Table 2 - Overview of Council's Economic Affairs Assets
Council Maintained Assets NumberAerodromes 4Council Owned Houses (Residential Rental Property) 9Council Owned Buildings (Commercial Rental Property) 5Sale yards 1
Detailed portfolio information and asset locations for our Economic Affairs assetsare contained in Section 4 of this plan (Lifecycle Asset Management).
Financial Summary
Council will review funding and asset condition trends each year when this assetmanagement plan is updated. The trends for 2011 /12 are as follows:
Table 3 – Economic Affairs Asset Funding and Condition Trends
Asset Category Funding Trend Asset Condition Trend
Economic AffairsDeclining DecliningSteady Steady
Increasing Improving
The current depreciated value of the Economic Affairs portfolio is $2,131,528with plans to increase this to $2,955,546 over the next 10 years. The increase isdue mostly to planned investment to rejuvenate or replace aging assets. Analysisof the existing portfolio and planned capital works has considered four key ratios:
The rate at which we are consuming our assets;
The rate at which we are renewing our assets;
The rate at which we are expanding the portfolio; and
The sustainability of the portfolio.
We are renewing our Economic Affairs assets at approximately one third of therate at which we are consuming them (at a portfolio level), and we are increasingthe size of the portfolio by an average of 4.6% per year over the next 5 years.
economic affairs _474C068.doc Page 8 of 73
Lifecycle Sustainability Index
The sustainability index for the Economic Affairs Portfolio is 1.0. In real terms, aratio between 0.8 and 1.2 is adequate and at best this ratio should be used as aguide to indicate whether we need to further investigate the sustainability of ourasset portfolio. The ratio is simply the relationship between Council’s budgetexpenditure for the current year and the expenditure that we estimate isrequired to maintain our Economic Affairs assets portfolio over its lifecycle.
In other words, a Sustainability Ratio of 1.0 indicates that Council’s budget isequal to the estimated average expenditure required to maintain our assets toagreed standards. Details of how sustainability ratios are calculated arecontained in Appendix 2.
The reader will note that maintenance costs have spiked in the 2012 FY to date.This is largely due to flood repairs and clean-up, and these costs are expected toreturn to historical trends going forward.
Financial Projections are detailed in Section 5 (Financial Summary) of this AssetManagement Plan.
NOTE: Asset Lifecycle Costs are forecast in today’s dollars, meaning that inflation is notincorporated into these figures to allow comparative analyses and calculation ofmeaningful ratios. This differs from the Long-Term Financial Plan which does allocate CPIto all forecasts. Consequently, forecasts contained in this Asset Management Plan will ofnecessity be less than those in the LTFP.

economic affairs _474C068.doc Page 9 of 73
Levels of Service
‘Levels of Service’ measures describe the safety, quality, quantity, reliability,responsiveness, cost/efficiency and legislative compliance of Council-providedservices. Levels of service delivered by our current Economic Affairs assetportfolio are measured through our community engagement and feedbackprocess and by Council-generated technical and operational measures.
Community Based Levels of Service
Council completed our community engagement and feedback process in 2011. Asa final step in the consultation process a community workshop was held inWalgett on Wednesday 21 March 2012. Participants at the workshop, whorepresented all sections of the community, worked through the latest draft of theCommunity Strategic Plan.
Our Community’s assessment of the Levels of Service delivered by Council withrespect to our Economic Affairs assets is highlighted below:
1. Our community believes our current Economic Affairs Assets need reviewand improved maintenance.
2. Our community believes there is a clear need for more emphasis oneconomic development and “hard” infrastructure with a focus oninfrastructure that has been allowed to deteriorate due to ongoing fundingconstraints, including rate pegging.
Technical and Operational Measures of Levels of Service
Council’s primary measure of levels of service is asset condition andserviceability. Our medium term goal is to assess the condition of all Councilassets using a 1-5 rating system in line with Council’s Asset Management Policy.Each individual asset across all Council’s assets will be rated as we move fromCore to Advanced Asset Management systems and processes. Council’s currentassessment of the overall condition of our Economic Affairs asset portfolio is level3 as indicated in table 4 below.
Table 4 – Economic Affairs Asset Portfolio Condition
LEVEL CONDITION DESCRIPTION1 Excellent - No Work Required (normal maintenance)2 Good - Only minor maintenance required3 Average - Maintenance work required4 Poor - Renewal required5 Very Poor - Urgent renewal / upgrading required.
Source: Walgett Shire Council Asset management Policy 5.3.1 - 1st April 2010
A detailed discussion of Council’s community feedback and technical andoperational measures of levels of service is contained in Section 2 (Levels ofService) of this Asset Management Plan.

economic affairs _474C068.doc Page 10 of 73
Asset Management Achievements
Council has reached significant asset management milestones in the lead up tothe implementation of our new ‘Integrated Planning and Reporting Process’.
1. Council has completed 1 capital works renewal / upgrade project in ourEconomic Affairs asset portfolio in the last 12 months.
2. A significant amount of detailed asset data has been collected and enteredinto our asset management data base over the last 36 months.
3. Council is developing a solid asset management core capability with ourasset management systems and processes.
4. Eight detailed Asset Management Plans covering a significant portfolio ofCouncil assets have been completed in 2012.
Recently completed Economic Affairs capital works projects are detailed inSection 2 (Levels of Service) of this asset management plan.
Our Plans for the Future
Council’s overarching or high-level ‘Community Strategic Plan’ (CSP) guides allplans produced by Council as part of our new ‘Integrated Planning and ReportingProcess’. Council plans to continue maintaining and upgrading the condition,serviceability and relevance to our community of our Economic Affairs Assets.
This asset management plan addresses the specifics of the CSP higher levelplanning objectives and also informs the CSP from an asset managementperspective.
Our Aerodromes are the most significant asset in our Economic Affairs assetportfolio and Council is planning to invest $1.5 Million dollars over the 2013/14financial years upgrading Walgett Aerodrome facilities. The main functionalconsequence of this planned maintenance and infrastructure renewal program isa safe and fit-for-purpose airport.
Details of maintenance and capital works projects planned for the next 5 yearsare shown in Section 2 (Levels of Service) of this asset management plan.

economic affairs _474C068.doc Page 11 of 73
1. IntroductionAsset Management Plans are important documents that provide clear directionsand guidelines for the effective short- and long-term management of assetsunder Council’s control.
Development of all Council’s Asset Management Plans began as early as 2008with the acquisition of asset management software and the collection andmigration of a large amount of asset data. These plans mark the first time anattempt has been made to look at the entire portfolio of assets owned by Councilin a comprehensive and holistic manner.
Eight (8) asset management plans have been produced for 2012 and these aredivided into Essential Services AMPs and Operational/Social AMPs as listed intable 5 below.
Table 5 - Councils Asset Management Plans
ESSENTIAL SERVICES OPERATIONAL / SOCIAL SERVICES
1. Roads & Bridges AMP 5. Operational Land and Buildings AMP2. Storm Water AMP 6. Plant and Equipment AMP3. Water and Sewer AMP 7. Economic Affairs AMP4. Solid Waste AMP 8. Recreation and Culture AMP
Each Asset Management Plan lists, describes and accounts for all assets within aparticular asset category and provides Council with valuable information formanaging our community’s assets into the future.
Economic Affairs Asset Management Plan
The Economic Affairs Asset Management Plan seeks to provide Council Staff, theExecutive Management team, Utility Authorities, Government Agencies,Developers, Councilors and all interested members of the Walgett Shirecommunity with easy-to-read and informative asset management information.
Council seeks to –
1. Bring visibility to the costs and benefits associated with providing theagreed levels of service to our community.
2. Communicate the benefits of introducing the ‘asset management’ disciplineinto Council operations.

economic affairs _474C068.doc Page 12 of 73
Asset Management
Council is the custodian of several thousand individual assets within the WalgettShire Local Government Area. Each asset is in the process of being documentedand entered into Council’s asset management systems.
For each of these assets, Council is required to -
ensure the asset meets agreed ‘levels of service’;
make cost effective maintenance, renewal and replacement decisions;
ensure the asset remains relevant to the needs of our community;
ensure the asset meets operational and legislative standards;
identify and mitigate environmental, financial and public risks of assetfailure;
cost, budget and obtain funding for asset maintenance, renewal andupgrade; and
plan and budget for asset write off and disposal.
Asset Management is both a discipline and a tool to assist Council decision-makers and staff to meet the requirements listed above. Key objectives of theasset management planning process itself are to –
assist with cost reductions where possible by optimising whole-of-life assetcosts;
provide ‘on request’ database generated reports for higher level planning;
directly support the long term financial planning and workforcemanagement planning components of Council’s Resourcing Strategy; and
provide a documented basis for assigning priorities in work programmingand budgeting.
Asset Management Plans
Asset Management Plans are living documents that evolve with the needs of ourcommunity. Asset Management Plans must also respond to Government Policy,and economic and demographic change.
Sister plans to our Asset Management Plans are Council’s ‘Long Term FinancialPlan’ and ‘Workforce Management Plan’. Each of the three plans support andinform each other.
A pictorial representation of the entire ‘Integrated Planning and ReportingProcess’ appears in figure 1 over leaf.

economic affairs _474C068.doc Page 13 of 73
Integrated Planning and Reporting Process
The Walgett Community Strategic Plan (CSP) is Council’s most senior plan. TheCSP is developed in consultation with residents, service providers, governmentand non -government agencies and community groups. The CommunityStrategic Plan guides Council’s Resourcing Strategy which includes Council’sasset management plans.
Figure 1 - Integrated Planning and Reporting Process
ESSENTIAL SERVICES OPERATIONAL / SOCIAL SERVICES
1. Roads & Bridges AMP 5. Operational Land and Buildings AMP2. Storm Water AMP 6. Plant and Equipment AMP3. Water and Sewer AMP 7. Economic Affairs AMP4. Solid Waste AMP 8. Recreation and Culture AMP
RESOURCING STRATEGY
Workforce Management Plan (4 Year Plan)Long Term Financial Plan (10 Year Plan)
Asset Management Plans(10 Year Plans)
WalgettCommunity Strategic
Plan(10 Year Plan)
DeliveryProgram
(4 Year Plan)
AnnualOperations
Plan
Council’sAnnualReport

economic affairs _474C068.doc Page 14 of 73
2. Levels of ServiceCommunity-based Levels of Service are measures that describe the safety,quality, quantity, reliability, responsiveness, cost/efficiency and legislativecompliance of Council provided services. The Technical and Operationalperformance measures Council may use to measure these Levels of Servicenecessarily vary across each of our asset management plans due to the differentnature of the assets in question. For example, we are less concerned about theappearance and attractiveness of our underground water mains than we areabout the appearance of our parks, gardens and streets.
Council is developing technical and operational measures specific to each of ourasset management plans that will help us to assess the levels of service weprovide. For our Economic Affairs assets, these are represented in table 6 below.
Table 6 - Level of Service Performance Measures
PerformanceMeasure
Level ofService
Technical and OperationalMeasures.
SafetyProvide safe
suitable facilities,free from Hazards.
1. Asset Condition Level ( 1-5 rating system)2. Community Engagement and Feedback Data.3. Frequency of inspection and defect reporting.4. Number of reported incidents.5. Number of insurance claims.6. Number of Vandalism Incidents
Quality
Provide goodquality economic
affairs facilities andsupportingservices.
1. Asset Condition Level ( 1-5 rating system)2. Community Engagement and Feedback Data.3. Number of customer service requests (Commercial Users)4. Number of maintenance requests per annum.5. % of useful life remaining.
Quantity Provide sufficientnumber of assets
1. Optimal use of existing facilities.2. Commercial Feedback and Commercial Demand Monitoring.3. Frequency of use of existing assets.
Reliability Facility Availability1. Facilities are fully operational.2. Facilities are open for use (95%).3. Accessibility of facilities to all potential users.
ResponsivenessProvide responseto complaints to
satisfy users
1. Complaints investigation within agreed time frames.2. Action taken within agreed time frames.3. Method of communication if no action will be taken.
Cost / Efficiency
Assets meetagreed service
levels.Cost Minimisation
Efforts.
1. Maintenance costs within budget.2. Cost effective asset management decisions (renew, upgrade
or disposal decisions).3. Well researched business case for new expenditure.
LegislativeCompliance
Compliance withRelevant
Standards
1. Annual inspections for legislative compliance completed.2. Required actions to meet legislative compliance initiated /
completed.

economic affairs _474C068.doc Page 15 of 73
Community Engagement and Feedback
Council’s Community Strategic Plan (CSP or the Plan) is our Community’s mostsignificant guiding document. The CSP requires the highest possible level ofcommunity engagement before its recommendations and plans are implemented.As a final step in the consultation process a community workshop was held inWalgett on Wednesday 21 March 2012. Participants at the workshop, whorepresented all sections of the community, worked through the latest draft of theCommunity Strategic Plan. The response to ‘levels of service’ provided byCouncil that relate directly to our Economic Affairs Assets were as follows:
Our community’s desired levels of service listed above have been incorporatedinto Council’s Community Strategic Plan which guides this asset managementplan.
Technical measures of Levels of Service
Council’s primary measure of Levels of Service is the condition of our EconomicAffairs assets. Condition is measured using a 1 -5 rating system in line withCouncil’s Asset Management Policy.
Table 7 - Asset Condition Rating System
LEVEL CONDITION DESCRIPTION1 Excellent - No Work Required (normal maintenance)2 Good - Only minor maintenance required3 Average - Maintenance work required4 Poor - Renewal required5 Very Poor - Urgent renewal / upgrading required.
Source: Walgett Shire Council Asset management Policy 5.3.1 - 1st April 2010
1. Our community believes our current Economic Affairs Assets needfurther review and improved maintenance and renewal.
2. A clear need for more emphasis on economic development and “hard”infrastructure with a focus on that infrastructure that has beenallowed to deteriorate due to ongoing funding constraints includingrate pegging.
Source: Revised Walgett Shire Community Strategic Plan - 26 March 2012.

economic affairs _474C068.doc Page 16 of 73
The 1-5 rating system is used to rate our Economic Affairs assets both atindividual asset level and portfolio level as illustrated in figure 2 below.
Figure 2 - Example - Asset Condition Rating
Economic Affairs Asset PortfolioOVERALL PORTFOLIO CONDITION RATING = 3
AERODROMES
OVERALLCONDITION RATING = 3
COUNCIL OWNEDBUILDINGS
(Commercial Rentals)
OVERALLCONDITION RATING = 3
SALE YARDS
OVERALLCONDITION RATING = 4
COUNCIL OWNEDRENTAL HOUSES
(Commercial Rentals)
OVERALLCONDITION RATING = 2
Walgett AerodromeGwydir Highway Collarenebri
OVERALL CONDITION RATING = 3Economic Life
(EL)Used life
(UL)Condition
LevelTerminal Block 40 34 4
Terminal Block Lighting x 4 Sets 40 20 3
Demountable 50 40 3
Open Hanger 60 20 2
Airport Fence 25 4 1
Chemical Shed 50 30 3
Chemical Shed Fence 30 30 5
Fuel Shed 40 20 3
Aero Club (Includes Extension) 50 40 4
Aero Club Hangers 50 40 4
Asset condition is currently recorded in spreadsheet format and will berecorded in Council’s Asset Register as shown in the extract above in
future revisions of this plan.

economic affairs _474C068.doc Page 17 of 73
Rating the Condition of our Assets
Assessing the condition level of our Economic Affairs assets is ultimately asubjective judgement exercise which uses the 1-5 rating system as a guide.Council uses a combination of visual inspection and technical information such asasset useful life data to make Renewal, Upgrade or Disposal decisions. This isthe key to effective asset management and decision making.
As we develop our asset management database, systems and processes we willbe able to generate reports quickly and easily that will flag areas that mayrequire inspection/maintenance/renewal/upgrade or disposal well ahead of time.These reports are a valuable tool for budgeting, formulating maintenanceprograms and for establishing priorities for our maintenance programs. Council’scurrent asset management systems and processes are discussed in Section 6(Asset Management Practices) of this plan.
Improving Economic Affairs Levels of Service
Walgett Shire Council is currently in the process of enhancing our maintenanceand capital works systems and processes. Central to this process is thedevelopment of our asset management systems which will allow us to produceon-demand reports covering all Council’s maintenance and capital worksactivities. Council’s asset renewal, upgrade and new facilities initiatives continueto move forward. Capital Works completed in the 2010/11 financial year aresummarized in table 8 below.
Table 8 - Works completed in 2010 /11 Financial Year
YEAR LOCATION CAPITAL WORKS PROGRAMS STATUS2010/11 Walgett Walgett Airport Hanger & Apron – retaining or bond wall / drainage
construction.completed
( Source: Annual Report (2010 /11)
Works in Progress
Works underway for the 2011/12 Financial Year are listed in table 9 below.
Table 9 - Works in progress for 2011 /12 Financial Year
YEAR LOCATION CAPITAL WORKS PROGRAMS STATUS2011/12 Walgett Aerodrome - Obstacle limitation works In Progress2011/12 Collarenebri Installation of solar lighting and a warning system In Progress
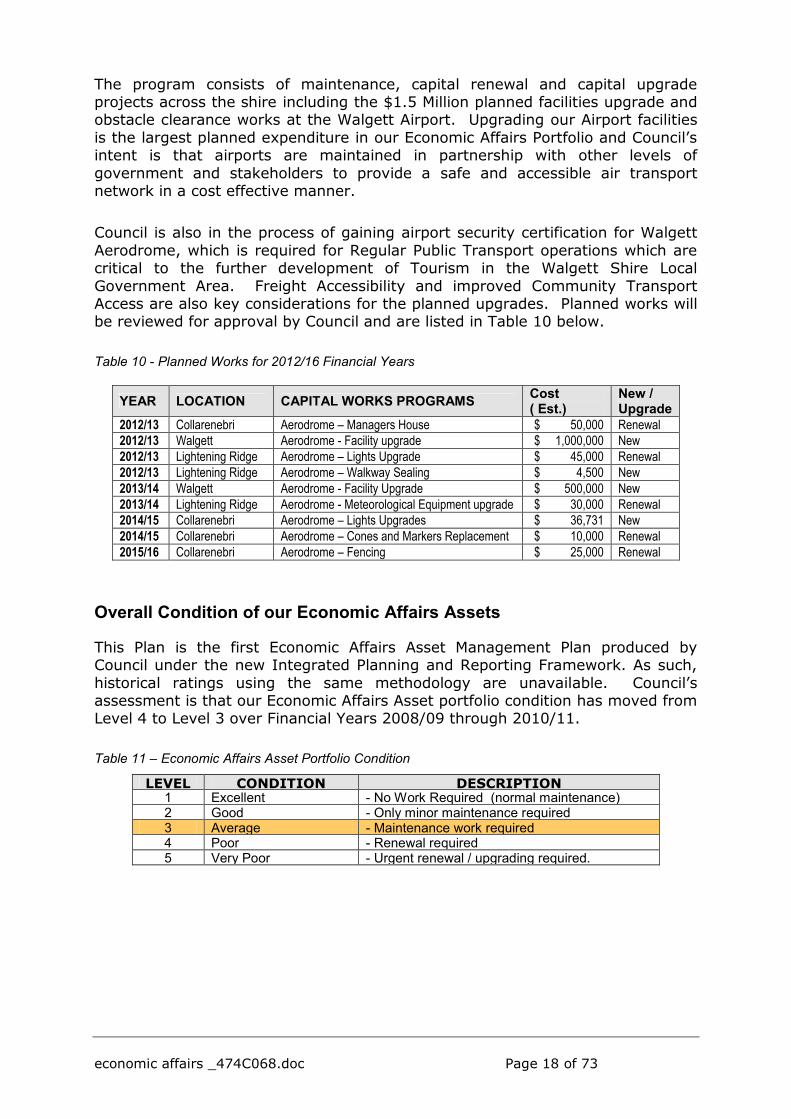
Planned Works (2012 – 2016)
Council’s medium-term objective is to elevate our levels of service by lifting ourEconomic Affairs asset portfolio to condition level 2. A program of proposedworks over the next five years has been formulated by Council, guided by our‘Community Strategic Plan’.
economic affairs _474C068.doc Page 18 of 73
The program consists of maintenance, capital renewal and capital upgradeprojects across the shire including the $1.5 Million planned facilities upgrade andobstacle clearance works at the Walgett Airport. Upgrading our Airport facilitiesis the largest planned expenditure in our Economic Affairs Portfolio and Council’sintent is that airports are maintained in partnership with other levels ofgovernment and stakeholders to provide a safe and accessible air transportnetwork in a cost effective manner.
Council is also in the process of gaining airport security certification for WalgettAerodrome, which is required for Regular Public Transport operations which arecritical to the further development of Tourism in the Walgett Shire LocalGovernment Area. Freight Accessibility and improved Community TransportAccess are also key considerations for the planned upgrades. Planned works willbe reviewed for approval by Council and are listed in Table 10 below.
Table 10 - Planned Works for 2012/16 Financial Years
YEAR LOCATION CAPITAL WORKS PROGRAMS Cost( Est.)
New /Upgrade
2012/13 Collarenebri Aerodrome – Managers House $ 50,000 Renewal2012/13 Walgett Aerodrome - Facility upgrade $ 1,000,000 New2012/13 Lightening Ridge Aerodrome – Lights Upgrade $ 45,000 Renewal2012/13 Lightening Ridge Aerodrome – Walkway Sealing $ 4,500 New2013/14 Walgett Aerodrome - Facility Upgrade $ 500,000 New2013/14 Lightening Ridge Aerodrome - Meteorological Equipment upgrade $ 30,000 Renewal2014/15 Collarenebri Aerodrome – Lights Upgrades $ 36,731 New2014/15 Collarenebri Aerodrome – Cones and Markers Replacement $ 10,000 Renewal2015/16 Collarenebri Aerodrome – Fencing $ 25,000 Renewal
Overall Condition of our Economic Affairs Assets
This Plan is the first Economic Affairs Asset Management Plan produced byCouncil under the new Integrated Planning and Reporting Framework. As such,historical ratings using the same methodology are unavailable. Council’sassessment is that our Economic Affairs Asset portfolio condition has moved fromLevel 4 to Level 3 over Financial Years 2008/09 through 2010/11.
Table 11 – Economic Affairs Asset Portfolio Condition
LEVEL CONDITION DESCRIPTION1 Excellent - No Work Required (normal maintenance)2 Good - Only minor maintenance required3 Average - Maintenance work required4 Poor - Renewal required5 Very Poor - Urgent renewal / upgrading required.

economic affairs _474C068.doc Page 19 of 73
3. Future DemandThere are a number of potential drivers of future demand for our community’sEconomic Affairs assets. Generally, these drivers place higher demands oninfrastructure provision and associated maintenance costs. However, they mayalso reduce demand for a particular asset or class of assets.
In this asset management plan, we consider the following influences on futuredemand for Economic Affairs assets:
Population growth
Demographic changes
Changes in ‘Desired Levels of Service’
Economic factors
Changes in technology
Demand Management Strategies for these influences are considered later in thissection of the Economic Affairs asset management plan.
Population Growth
There is potential for population growth to place higher demands on ourEconomic Affairs assets over the next ten years.
The most recent population data for the Walgett Shire Local Government Area isthe 2010 Australian Bureau of Statistics Regional Profile Data. The updated dataindicates reasonably stable population numbers in our Local Government Areabetween 2006 and 2010.
Table 12 - ABS Population Data for Walgett Shire Council
Historical ABS Data Most Recent Revised ABS Data
Year 2002 2003 2004 2005 2006 2007 2008 2009 2010
Population 8,106 7,852 7,560 7,353 7,273 7,169 7,124 7,209 7,235
While the ABS data is useful as a guide, the population of Walgett Shire isdifficult to collate due to the high number of people in the mining areas andAboriginal communities who choose not to complete the census and/or are notcounted through other data collection mechanisms.

economic affairs _474C068.doc Page 20 of 73
Population Growth in our Aboriginal Communities
Our Indigenous population has increased by approximately 30% since the year2000, especially in younger age groups. As a percentage of total populationacross the Walgett Shire Local Government Area, our Indigenous population wasestimated to be 30.1% in 2006 (ABS Data).
The Department of Families, Housing, Community Services and IndigenousAffairs (FaHCSIA) studies forecast Indigenous population growth of 43 percentbetween 2006 and 2026. Further, the number of Indigenous people in theunder-20 age bracket is forecast to increase by 19 per cent over the sameperiod.
Interpolation of the best available data suggests that our 2012 Indigenouspopulation is now 33% of our community’s total population. This trend mayincrease both the Level of Demand and Desired Levels of Service for ourEconomic Affairs assets over the next ten years.
Table 13 - Population Growth Projections calculated for this plan
Year 2012 2013 2014 2015 2016 2017 2018 2019 2020 2021 2022
1.Born Overseas 531 533 535 537 540 542 544 546 548 550 5532.Born in Australia 4,382 4,400 4,417 4,435 4,453 4,470 4,488 4,506 4,524 4,542 4,5603.Born in Australia
(Indigenous) 2,437 2,481 2,526 2,572 2,618 2,666 2,714 2,763 2,813 2,864 2,916
Total 7,358 7,414 7,478 7,544 7,610 7,678 7,746 7,815 7,885 7,957 8,029
Population Distribution Projections (%)
1.Born Overseas 7.2 7.2 7.2 7.1 7.1 7.1 7.0 7.0 7.0 6.9 6.92.Born in Australia 59.6 59.3 59.1 58.8 58.5 58.2 57.9 57.7 57.4 57.1 56.83.Born in Australia
(Indigenous) 33.2 33.5 33.8 34.1 34.4 34.7 35.0 35.4 35.7 36.0 36.3
Notes to table 13:
1. Data points 1 & 2 above are projected forward at a 0.4% per annum growth rate (interpolated estimate).2. Data point 3 is projected forward at a 1.8% per annum (geometric average of the FaHCSIA 20 year data).3. Total Population Growth over the next ten years is 9.1%.4. Indigenous population growth over the next ten years is 19.5%5. Our Indigenous population will increase from 33.2 % to 36.3% of total population over the next ten years.6. The proportion of our indigenous people less than 20 years of age will increase by 10% over the period.7. 2011 Census Data will be available in June 2012 and will be updated with future revisions of this plan.
Changes in Demographics
Walgett Shire Local Government Area has an aging population. This is anAustralia-wide demographic trend which is clearly reflected in our owncommunity. The most recent ABS data on the age distribution of our communityis tabulated below.

economic affairs _474C068.doc Page 21 of 73
Table 14 - ABS National Demographic Trends
Historical ABS Data (2006 data) Revised ABS Data (2010 data)
AGE 2002 2003 2004 2005 2006 2007 2008 2009 20100 - 14 21.7% 21.5% 21.4% 21.4% 21.8 % 21.0 % 20.6 % 20.4 % 19.9 %
15 - 24 11.2% 10.9% 10.3% 9.8% 9.8 % 10.3 % 10.6 % 10.4 % 10.4 %25 - 44 29.0% 28.4% 28.0% 27.6% 26.4 % 25.3 % 25.0 % 25.0 % 25.2 %45 - 64 27.5% 27.9% 28.6% 29.0% 29.2% 29.6 % 29.7 % 29.8 % 29.7 %65 plus 10.6% 11.3% 11.7% 12.1% 12.2% 13.7% 14.1% 14.4% 14.8%
Our 65-plus community has grown from 10.6% of our population to 14.8%between 2002 and 2010. For comparison and context, the Australia-wide ABSdata shows a growth in the 65-plus community of 11.1% to 13.6% over a twentyyear period (30 June 1990 - 30 June 2010). This comparison highlights thesignificance of the trend in the Walgett Shire Local Government Area. However,the FaHCSIA study suggests that there is significant population growth occurringwithin our Indigenous community that may not be captured in the ABS data.There is a particular emphasis on the growth in the number of people less than20 years of age.
Council is monitoring and assessing potential impacts on our Economic AffairsAssets which are consider in the Demand Management Strategies later in thissection of the plan.
Changes in ‘Desired Levels of Service’
Council has a substantial program of work planned to increase the levels ofservice provided by our Economic Affairs assets involving both asset and non-asset based programs. Key to the success of these programs is gaining areliable understanding of the mix of assets that are appropriate for ourcommunity as we move into the future.
As discussed in Section 2 of this plan (Levels of Service), Council uses acombination of Community Engagement and Feedback and Technical Indicatorsto assess the Levels of Service Council provides and to determine where we needto focus our efforts.
Through our Community Engagement and Feedback process a clear desire hasbeen identified for more emphasis on economic development and “hard”infrastructure with a focus on existing infrastructure that has been allowed todeteriorate.
Technical Indicators of Changes in ‘Desired Levels of Service’
Technical indicators provide valuable information which can be balanced andweighted against local knowledge and community feedback. The value of localknowledge and community feedback in Walgett Shire Local Government Area isheightened by the fact that detailed data is difficult to locate.

economic affairs _474C068.doc Page 22 of 73
The data in table 15 comes from the 2006 Census. 2011 census data will beavailable mid to late 2012 and will be reflected in future revisions of this plan.
Table 15 - 2006 Census Data
ITEM DIMENSIONTOTAL HOUSEHOLDS 2,661TOTAL FAMILIES 1,634
- Couple families with children under 15 and/or dependent students 519- One parent families with children under 15 and/or dependent students 236
INTERNAL MIGRATION - WALGETT SHIRE LOCAL GOVERNMENT AREA- Persons who lived in a different region of Australia 1 year ago ( Outside the Walgett LGA) 16.0 %- Persons who lived in a different region of Australian 5 years ago ( Outside the Walgett LGA) 34.5 %
POPULATION CONCENTRATION- Urban 62.4%- Within a Bounded Shire Locality 6.9%- Rural Balance 30.7%
The ABS data in the table above assists Council to look at the physical location ofeconomic affairs assets as a function of population concentration. Looking attrends over time is an important part of this process and Council looks forward tothe 2011 Census data which will be incorporated into future revisions of thisplan.
Asset management technical indicators are also supported by information weobtain through our asset management systems. Table 16 below indicates wherecapital and maintenance expenditure is allocated to economic affairs assets,which are primarily located in Walgett, Lightening Ridge and Collarenebri.
Table 16 – Council’s Asset Management Data (Economic Affairs)
Town Current CapitalInvestment
Share ofTotal
Investment
ForecastAverage Yrly
CapitalWorks
% of TotalCapitalWorks
ForecastAverageYearly
Expenses
% of TotalExpenses
Walgett $ 3,722,700 66.0% $ 255,600 92.5% $ 108,824 51.1%LightningRidge $ 1,244,740 22.1% $ 10,950 4.0% $ 48,223 22.7%
Collarenebri $ 671,756 11.9% $ 9,533 3.5% $ 46,268 21.7%BurrenJunction $ - N/A $ - N/A $ 4,903 2.3%
Carinda $ - N/A $ - N/A $ 4,687 2.2%
$5,639,196 100% $ 276,083 100% $ 212,905 100%
Economic factors
Council has completed a tourism strategy based on a study commissioned in2009 and continues to resource and develop tourism activities within the Shire.Significant progress has been made with tourism promotion through attendingindustry workshops, shows and conferences; developing merchandise for thevisitor’s centre, developing and updating tourism brochures, auditing signageand beginning signage upgrades, supporting web promotion of the Shire as atourism destination and participating in joint promotions with other areas andorganisations.

economic affairs _474C068.doc Page 23 of 73
Council has applied for Federal Government funding to enable the developmentof the Australian Opal Centre at Lightning Ridge and plans to continue tourismdevelopment which includes developing a detailed tourism strategy for the Shireas a primary strategy for stimulating the local economy.
Council plans that will have an impact on our economy over the next ten yearsand hence need to be assessed for the impact on our Economic Affairs assets arelisted below.
Improving road infrastructure under the Federal Government’s fundingprograms;
Developing a plan for long term asset financial management;
Developing a detailed tourism strategy for the Shire as a key way ofstimulating the local economy;
Working to become an employer of choice in the region;
Lobbying governments to ensure that appropriate levels of support areprovided for health, education, law and order, employment, housing andinfrastructure development and maintenance;
Developing new and innovative ‘blue sky’ ideas and strategies, andadopting programs that have worked in other rural and remotecommunities;
Improving the appearance of the main streets in the Shire’s three towns;
Improving tourism infrastructure, including expanding and furtherdeveloping tourism centers;
Developing the next stage of the Shire Tourism Strategy to acceleratetourism growth in the Shire, empower local organisations, provide Councilwith clear directions on the actions needed to ensure sustainable tourismgrowth and promote Walgett Shire as a unique outback destination; and
Developing a Chamber of Commerce for Walgett Shire LGA to activelypursue and support economic development.
Source: Revised Walgett Shire Community Strategic Plan - 26 March 2012
Council’s ongoing initiatives listed above will have an impact on future demandfor our economic affairs assets. Demand Management Strategies are consideredin this asset management plan and will evolve in future revisions of this plan.
Impact of Technology
Changes in technology and the degree of take up within Council operations andour Community can increase or decrease the costs associated with managing ourEconomic Affairs assets.

economic affairs _474C068.doc Page 24 of 73
Council will continue to add to and monitor the following changes in technologyfor impact on costs and usage of our Economic Affairs assets.
Table 17 - Effect of Technology Changes on Service Delivery
Change In Technology Effect on Service DeliveryHousehold Internet Access Increasing.
Of the 2661 Households within the Walgett Shire LocalGovernment Area, 39.5% have internet Access (Census2006).
Australian and International Internet Access and usage areaccelerating.
Internet access growing with national broadband. CouncilInternet Strategy to grow awareness of Walgett, Cheap andplentiful land, untapped workforce, tourism. Potential forincreased demand for Air Services in the form of tourism,freight and public transport impacting Shire Aerodromes.
Growth in up-market tourism has the potential to impactaerodrome requirements – heavier aircraft with increasedloadings on runways.
World Wide Web
Information isolation and anonymity is declining.
Council and Non-Council Web presence - attracting activityto the Shire.
Positive image for Walgett Shire and internet marketingexpertise on the World Wide Web will lead to increasedconsumption of Aerodrome Assets.
Management TechnologyAsset Management Systems and Processes improving.
Customer Relationship Management Systems
Knowledge of assets, component lives and costs iscontinually being improved. Systems to monitor usage ofour Economic Affairs Assets to ensure community desiredlevels of service match current and projected usage.
Solar Powered Runway Lighting Continued improvements in the efficiency of solar poweredlighting and Pilot Activated Lighting Technology has potentialto lower operating costs.
Sale Yard Design and Efficiency Opportunity to incorporate technologies and efficiencies intosale yards and produce a profitable commercial business.
New Assets
Acquiring new assets will commit council to fund ongoing operations andmaintenance costs over the period the asset is retained. These future costs areidentified and considered in developing forecasts of future operating andmaintenance costs.
Council proposes to increase annual asset maintenance and operating budgets by1 - 2% of the cost (in real terms) of all new capital expansion projects to ensuresufficient maintenance funds over the lifecycle of all newly created assets.
Planned new assets to be added into our economic affairs portfolio are listed inTable 18 below.
Table 18 - New Assets Currently Planned for 2012/16
YEAR LOCATION PROGRAM Cost(Est.)
2012/13 Walgett Aerodrome Facility upgrade ( New Assets) $1,000,0002012/13 Lightening Ridge Aerodrome Walkway Sealing (New Asset) $4,5002013/14 Walgett Facility upgrade ( New Assets) $500,0002014/15 Collarenebri Lights Upgrades ( New Asset) $36,731

economic affairs _474C068.doc Page 25 of 73
Demand Management Strategies
Demand for new services will continue to be managed as follows –
1. Look for non-asset solutions to any forecast increases in demand.
2. Maximize the number of uses and flexibility of our existing assets.
3. Upgrade existing assets when it is clear 1. and 2. above will not suffice.
4. Provide new assets when possible for changes in demand that cannot bemet through 1., 2. or 3. above.
Council’s Demand Management practices also include risk assessment of anyproposed solution from 1 – 4 above. Managing failures is an important part ofany Demand Management Strategy. Reviewing this asset management planannually for the success or failure of Council’s response to future demand is animportant part of our process.
Opportunities identified to date for demand management are shown in Table 19below. Further opportunities will be developed in future revisions of this assetmanagement plan.
Table 19 - Demand Management Strategies
DEMAND FACTOR IMPACTS STRATEGYPopulation Growth
Forecast 9.1% over next tenyears.
Increased frequency ofmaintenance due tohigher use of assets.
- Develop Council’s Maintenance Policy and Program.- Monitor ABS population data for confirmation ofestimated trends.- Adjust maintenance and inspection frequency in linewith any measurable increase in asset usage.
Demographic Changes
Ageing Population
Growing Indigenous Population
Impact on EconomicAffairs assets notdetermined at this stage.
- Monitor usage and demand for our Aerodromes, RentalProperty demand and Sale yard Activity.- Develop an Aerodrome Master Plan.- Monitor any increased activity or need for emergencyflights that may result from our ageing population and aresultant increase in the need to fly to major centerhospitals.
Desired Levels of Service
Desire for more emphasis oneconomic development and“hard” infrastructure.
Desired focus on infrastructurethat has been allowed todeteriorate due to ongoingfunding constraints.
Increased Capital andmaintenance Costs.
Maintenance Frequencyincreases.
- Capital expansion where clear need for new orexpanded facilities is identified.
- Continue to Develop and implement asset and non-asset based solutions for economic development.
- Lobby for increased funding.
- Foster, Encourage and attract Private SectorInvestment.
Economic factors
Tourism Growth
Increase in Visitors toShire.Increased Demand for - Renewal and upgrade of Aerodrome facilities to cater

economic affairs _474C068.doc Page 26 of 73
DEMAND FACTOR IMPACTS STRATEGYFarmingMiningCouncil ServicesFunding
Council Support andServices in fosteringEconomic Growth.Increased maintenanceand capital costs.
for expected increase in traffic over next ten years.- Aerodrome certification to allow RPT Activities.- Monitor growth/decline trends in Mining and Agricultureand any resultant shift in population distribution (2011ABS data due in 2012).
Changes in technology Possible cost advantageswith Aerodrome RunwayLighting.Increased interest inWalgett through internet.Ability to run Web basedbusiness from remoteareas is a growing trend.
- Monitor usage levels and budget accordingly.- Investigate Web based Businesses as a possible areafor council support.

economic affairs _474C068.doc Page 27 of 73
4. Lifecycle Management PlanCouncil’s lifecycle management plan details how Council plans to manage andoperate our Economic Affairs assets at the agreed levels of service discussed inSection 3. Lifecycle Management is simply a methodology that asks us toconsider and then answer to the following questions.
1. How can we minimize our costs while meeting our agreed levels of serviceto our community?
2. How can we minimise the risks associated with our Economic Affairsassets?
3. How can we maximise the benefits of our Economic Affairs assets?
4. How do we ensure that we are spending money on assets that are mostrelevant to our community?
Generically, the information relevant to answering these questions comes from –
1. Physical inspections and assessments of asset condition and performance
a. Planned and reactive maintenance activities
b. Cyclical asset inspections
c. Feedback from operations
d. Community reporting of issues
2. Assessments of future asset wear and tear and the means of maintainingthe assets.
a. Input from maintenance crews
b. Analysis of historical information for trends
3. Asset risk assessments and plans for managing identified risks
a. Actual and forecast costs of providing these assets
b. Historical data from financial systems
c. Budget activities for planned costs
4. Input from the community on current and future suitability.

economic affairs _474C068.doc Page 28 of 73
Management of the entire portfolio of Economic Affairs Assets uses the aboveinformation to indicate where and how we should invest the money we haveavailable. Understanding the physical and cost parameters of an asset over itsentire lifecycle allows us to make more informed and cost effective decisions onmaintenance and capital works programs.
Core and Advanced Asset Management
Council’s 2012 Asset Management Plans are the first to be prepared under thenew Integrated Planning and Reporting Process required by the ‘LocalGovernment Act 1993’. As such, they have been prepared as ‘core’ assetmanagement plans guided by the International Infrastructure ManagementManual.
‘Core’ asset management is a ‘top down’ approach which relies on general assetinformation and asset management systems and processes. ‘Advanced’ assetmanagement describes an operation where very detailed asset information hasbeen gathered, collated and categorized over a number of years. Advancedasset management also describes an operation that has developed assetregisters and a data base that can produce detailed reports on demand. Insummary ‘Core’ asset management can be described as a reactive approach tomanaging assets while advanced asset management is a proactive approachsupported by highly evolved data, systems and processes.
Council is well underway in developing its asset management data base, and aconsiderable amount of data gathering has taken place prior to the preparationof this asset management plan. Further information on Council’s AssetManagement Practices is contained in Section 6 (Asset Management Practices) ofthis plan.
economic affairs _474C068.doc Page 29 of 73
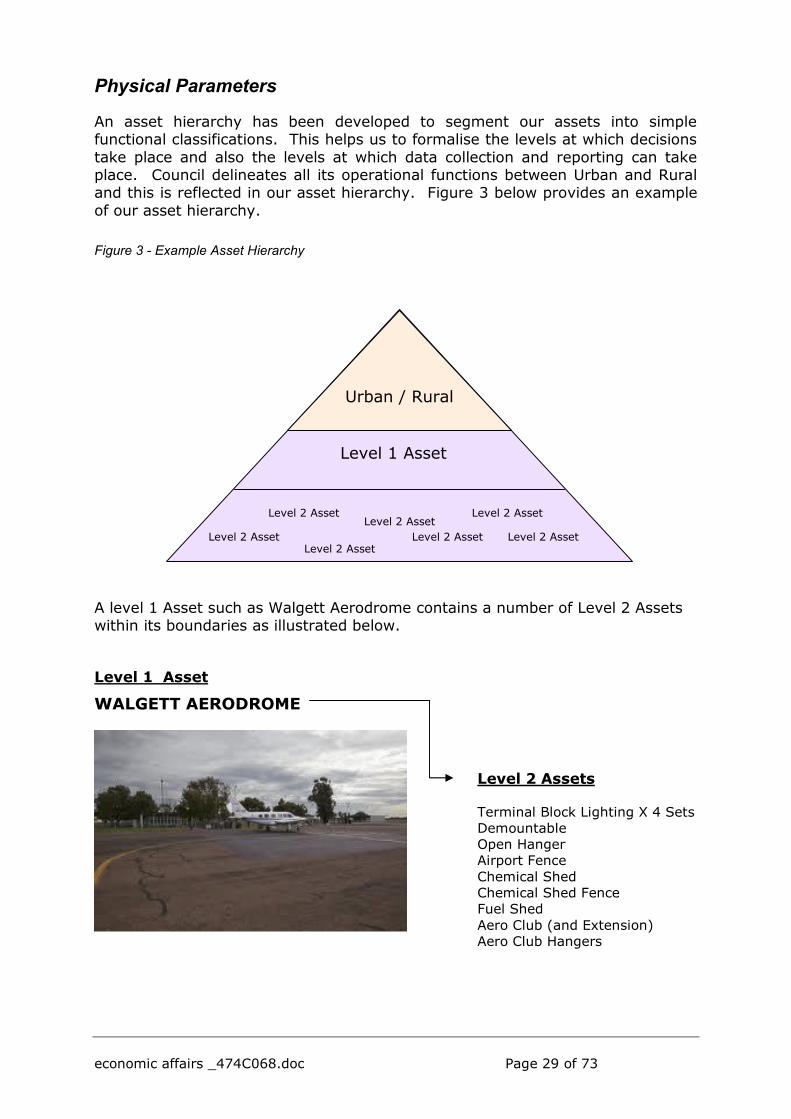
Physical Parameters
An asset hierarchy has been developed to segment our assets into simplefunctional classifications. This helps us to formalise the levels at which decisionstake place and also the levels at which data collection and reporting can takeplace. Council delineates all its operational functions between Urban and Ruraland this is reflected in our asset hierarchy. Figure 3 below provides an exampleof our asset hierarchy.
Figure 3 - Example Asset Hierarchy
A level 1 Asset such as Walgett Aerodrome contains a number of Level 2 Assetswithin its boundaries as illustrated below.
Level 1 Asset
WALGETT AERODROME
Level 2 Assets
Terminal Block Lighting X 4 SetsDemountableOpen HangerAirport FenceChemical ShedChemical Shed FenceFuel ShedAero Club (and Extension)Aero Club Hangers
Urban / Rural
Level 1 Asset
Level 2 AssetLevel 2 Asset
Level 2 AssetLevel 2 Asset
Level 2 Asset
Level 2 Asset Level 2 Asset

economic affairs _474C068.doc Page 30 of 73
Level 1 Assets as currently recorded in our Asset Register are listed below. Theasset hierarchy will be reviewed for relevance and practicality each year onreview of this asset management plan.
Table 20 - Level 1 Assets
LEVEL 1 - ECONOMIC AFFAIRS ASSETSNo. PARKS & GARDENS LOCATION
1 Aerodrome Walgett2 Aerodrome Residence Walgett3 Swimming Pool Residence Walgett4 Old Council Chambers Walgett5 Masonic Lodge Walgett6 Doctors' Surgery/Medical Centre Wee Waa Street Walgett7 Drs Residence (4 O'Neil Court) Walgett8 Family Day Care (46 Pitt Street) Walgett9 Sale yards Walgett10 Aerodrome Terminal Residence (Excluding Terminal Annex) Lightning Ridge11 House - 2 Lapkalle Street Lightning Ridge12 House - 7 Cardinal Road Lightning Ridge13 House - 9 Gem Street Lightning Ridge14 Aerodrome Collarenebri15 Pool Manager's Residence (32 George St) Collarenebri16 Residence (20 Herbert Street) Collarenebri17 Post Office (Agency) Collarenebri18 Aerodrome Burren Junction19 Aerodrome Carinda
Note that some Level 2 assets such as Aerodrome Hardstand Areas, Runways,Aprons, Taxiways, Aerodrome Access Roads and Car parks are covered inCouncil’s “Roads and Bridges” Asset Management Plan as these particular level 2Assets are effectively Roads.
Asset Condition and Performance
The most reliable information on the asset condition and performance comesfrom physical inspections and assessments. At present, this occurs inconjunction with regular maintenance and operating activities.
Future improvements to Council’s asset management practices will assesswhether scheduled inspections for some assets would provide cost and/orperformance benefits.
Technical Measures of Asset Condition
Useful Life and Asset Age data contained in the Asset Register is a usefulindicator of asset condition, and also as a guide for ongoing maintenanceexpenditure and future capital works to renew, upgrade or replace assets.
At present, the Asset Register contains the only documented indicator of assetcondition. Table 21 below is a summary of the average asset condition ofCouncil’s Economic Affairs assets as at June 2011.

economic affairs _474C068.doc Page 31 of 73
Table 21 - Average Asset Condition (Technical Measure)
TownAverage
RemainingLife
AverageCondition
Walgett 46% 3
Lightning Ridge 65% 2
Collarenebri 37% 3
Note: The condition rating above has been calculated using remaining useful life weighted by the assets initial capital cost.
This information is valuable for directing the attention of staff responsible forasset management. However, decisions on specific work required to maintain orimprove asset condition will be based on the assessment of individual assets orstructures.
Financial Parameters
In financial terms, lifecycle asset management considers all of the costsassociated with owning, operating and disposing of an asset over its life. Thesecost categories are:
1. Capital or Investment expenditure
2. Maintenance and Operating expenditure
3. Disposal or Demolition expenditure
The lifecycle costs of an asset are reduced by any revenue generated by theasset. For example, Net Earnings from Council owned commercially rentedhouses and buildings would help offset the costs of owning these assets. Futurerevisions of this plan will incorporate the revenue-generating aspects of relevantassets.
Financial parameters will be used to aid asset management decision-making,support business cases and grants for capital works, and help forecast and justifybudgets for asset management activities.
Council currently accumulates asset financial information at a reasonable level ofdetail. Practical enhancements to the identification, categorization and trackingof financial information will contribute to a better understanding andmanagement of our asset portfolio.
Asset management information from financial sources is documented in the nextsection 5 (Financial Summary) of this plan.

economic affairs _474C068.doc Page 32 of 73
Maintenance and Operations
Routine maintenance is the regular on-going work that is necessary to keepassets operating, including instances where portions of the asset fail and needimmediate repair to make the asset operational again.
Reactive maintenance is unplanned repair work carried out in responseto service requests and management/supervisory directions.
Planned maintenance is repair work that is identified and managedthrough a maintenance management system (MMS). MMS activitiesinclude inspection, assessing the condition against failure/breakdownexperience, prioritising, scheduling, actioning the work and reporting whatwas done to develop a maintenance history and improve maintenance andservice delivery performance.
Cyclic maintenance is replacement of higher value components/sub-components of assets that is undertaken on a regular cycle includingrepainting, building roof replacement, etc. This work generally falls belowthe capital/maintenance threshold.
At present maintenance expenditures are not separated into reactive, plannedand cyclic maintenance. Council is currently in the process of reviewingmaintenance processes and developing inspection and condition rating regimes.Council will separate our maintenance program into reactive, planned and cyclicin future revisions of this plan.
Formalising these maintenance processes will enable Council to increase theamount of planned and cyclic maintenance within existing budget allocations andassist in developing a more proactive approach to maintenance. This in turnshould reduce the total maintenance costs over time, and enhance the life ofsome assets such that refurbishment or replacement is delayed.
Deferred maintenance activities (i.e. works that are identified for maintenanceand unable to be funded) are to be included in the risk assessment process in theinfrastructure risk management plan.
Current and planned maintenance expenditure levels are considered to beadequate to meet Council’s target of increasing the overall condition rating of oureconomic affairs asset portfolio to Level 2.
Capital Works
Capital works are asset works that renew or improve an existing asset, or createa new asset.
To date, Council has forecast and planned capital works for the next five years.To contribute to a 10 year plan, another 5 years of projected renewals have beenincluded based on expiration of useful lives from the asset register. Current and

economic affairs _474C068.doc Page 33 of 73
planned Capital Works programs are listed in Section 2 (Levels of Service) of thisplan.
Renewal / Replacement Plan
Renewal expenditure is major work which does not increase the asset’s designcapacity but restores, rehabilitates, replaces or renews an existing asset to itsoriginal service potential. Work over and above restoring an asset to originalservice potential is upgrade/expansion or new works expenditure.
Assets requiring renewal are identified from estimates of remaining life obtainedfrom the asset register. These assets are inspected to verify accuracy ofremaining life estimate and to develop a preliminary renewal estimate. Verifiedproposals are ranked by priority and available funds, and scheduled in futureworks programs.
Projected future renewal expenditures are forecast to increase over time as theasset stock ages. Renewals are to be funded from Council’s capital worksprogram and grants where available.
This is further discussed in our Financial Summary in Section 5 of this plan.
New Works Plan – Creation / Acquisition / Upgrading
New works are those works that create a new asset that did not previously exist,or works which upgrade or improve an existing asset beyond its existingcapacity. They may result from growth, social or environmental needs. Assetsmay also be acquired at no cost to the Council from land development.
New assets and upgrade/expansion of existing assets are identified from varioussources such as councillor or community requests, proposals identified bystrategic plans, or a general need to meet future demand. The assets areinspected to verify need and to develop a preliminary renewal estimate. Verifiedproposals are ranked by priority and available funds and scheduled in futureworks programs.
New assets and services are to be funded from Council’s capital works programand grants where available. The planned upgrade/new capital works program isshown in the Financial Summary section.
Depreciation
Capital or Investment expenditure usually involves major expenditure topurchase, build or renew an asset that is used over a number of years. Theaverage life of our Economic Affairs assets is approximately 40 years. When weconsider how much it costs to own and operate an asset on a yearly basis, weallocate the original cost of an asset over its estimated life via depreciationexpense (an asset that cost $10,000 and has an estimated life of 10 years willhave costs allocated of $1,000 per year). This depreciation expense then, rather

economic affairs _474C068.doc Page 34 of 73
than the full capital cost, is added to other yearly expenditures when evaluatingcosts per year of an asset.
Disposal Plan
Disposal includes any activity associated with disposal of an asset no longer inuse including sale, demolition or relocation.
Council is reviewing assets that have been identified as potential candidates fordisposal over the next four years based on useful life data. Council will inspectthese assets and develop the disposal plan if appropriate. A disposal plan will beincorporated in future versions of this plan.
Table 22 - Assets for Disposal
Asset Reason for Disposal Timing Cash-flow from disposalTBATBATBATBA
Risk Management Plan
In general, risk management inspections are based on inspection at time ofmaintenance servicing to detect risks arising from unforeseen breakdown orvandalism. Customer complaints are also a source of information for assetbreakdown or hazard. Standards for public buildings are met through annualhazard and condition audits such as fire and pest control.
An assessment of risks associated with service delivery from Economic Affairsassets is being developed to assess risks to Council. Council’s risk assessmentprocess seeks to identify credible risks, the likelihood of the risk event occurring,the consequences should the event occur, develop a risk rating, evaluate the riskand develop a risk treatment plan for non-acceptable risks. Council is developingrisk tables for each of our Asset Management Plans. Future revisions of this planwill incorporate Risk Assessment and Risk Management Plans.

economic affairs _474C068.doc Page 35 of 73
Economic Affairs Risk Management Table
Table 23 – Critical Risks and Treatment Plans
AERODROMESAsset What Can Happen Risk
RatingRisk Treatment Plan
Runways Tire blow out due to debrison runway
H Increase frequency of runway sweeping. Monitor currentprogram, increase if required
Runway Tire blow out due topavement failure
H Increase frequency of resealing. Engineers Assessmentand report
Aircraft Damage due to animalactivity.
H Regular monitoring and upgrade of existing perimeterfencing. Occasional eradication and bird dispersal.
Drainage Water on hardstand areasdue to blocked drains.
H Increase frequency of resealing. Increase visualInspections.
Terminal Building Security/Vandalism H Security review and design review and change. Continuecurrent program and implement renewal program.
Terminal Building Electrical Fault H Regular inspections and preventative treatments.Increase Visual inspections
Terminal Building Public liability H Regular and documented inspections. Upgrade SafetyInspections to include action report
Terminal Building Fire (internal generatedwithin building)
H Maintain fire equipment. Building Audits. AnnualInspections.
SALE YARDS
Asset What Can Happen RiskRating Risk Treatment Plan
Fencing Animals getting loose. M Regular monitoring and upgrade of existing perimeterfencing.
Equipment Injury to public M Regular and documented inspections. Upgrade SafetyInspections to include action report.
RENTAL HOUSES & BUILDINGS
Asset What Can Happen RiskRating Risk Treatment Plan
All Buildings Fire H Regular inspections and preventative treatments.Increase Visual inspections.
All Buildings Public liability H Regular and documented inspections. Upgrade SafetyInspections to include action report.
All Buildings Electrical Fault H Regular inspections and preventative treatments.Increase Visual inspections.

economic affairs _474C068.doc Page 36 of 73
5. Financial SummaryThe financial costs of owning, operating and maintaining an asset are importantconsiderations for asset management.
While it is possible to document and classify the costs of asset management to amicro-level, the extent of data gathering and analysis must delivercommensurate benefits to be worthwhile. The extent to which the Council willimprove and adapt systems and procedures for asset financial management willdepend on legislative and/or regulatory requirements and then practicality.
This section contains the financial analyses and inputs referred to in previoussections of this asset management plan. The financial projections will beimproved as further information becomes available on desired levels of serviceand current and projected future asset performance.
Asset Values
Walgett Shire Council manages a significant portfolio of Economic Affairs Assets.The following table shows the value of these assets across the Shire as at 30June 2011.
Table 24 - Economic Affairs Asset Values as at 30 June 2011
TownCurrent
ReplacementCost
AnnualDepreciation
AccumulatedDepreciation
Current WrittenDown Value
Walgett $ 3,722,700 $ 71,400 $ 2,562,841 $ 1,159,859
Lightning Ridge $ 1,244,740 $ 22,111 $ 516,147 $ 728,593
Collarenebri $ 671,756 $ 14,560 $ 428,680 $ 243,076
TOTALS $ 5,639,196 $ 108,071 $ 3,507,668 $ 2,131,528
The depreciated replacement cost/current written down value (currentreplacement cost less accumulated depreciation) will vary over the forecastperiod depending on the rates of addition of new assets, disposal of old assets,and consumption and renewal of existing assets.
Depreciation is the allocation of the cost of the original investment over the lifeof the asset. Depreciation expense values are forecast below and are in line withprojected asset values in the following section.

economic affairs _474C068.doc Page 37 of 73
Figure 4 - Depreciation Projections (10 years)
Additions and Disposals
Asset values are forecast to increase as additional assets are added to the assetstock from construction and acquisition by Council. The graph below shows anestimate of the total cost of the Economic Affairs portfolio incorporating projectedreplacement cost asset values over the planning period, and the consequentdisposals.
Figure 5 - Forecast Asset Portfolio Totals (10 years)
Investment in all proposed Capital works (new assets and refurbishment ofexisting assets) over the next 10 years would mean an increase in the value ofthe portfolio of Economic Affairs assets of nearly 40%. Of this increase, 11% willbe asset renewals and 89% new assets.
economic affairs _474C068.doc Page 38 of 73
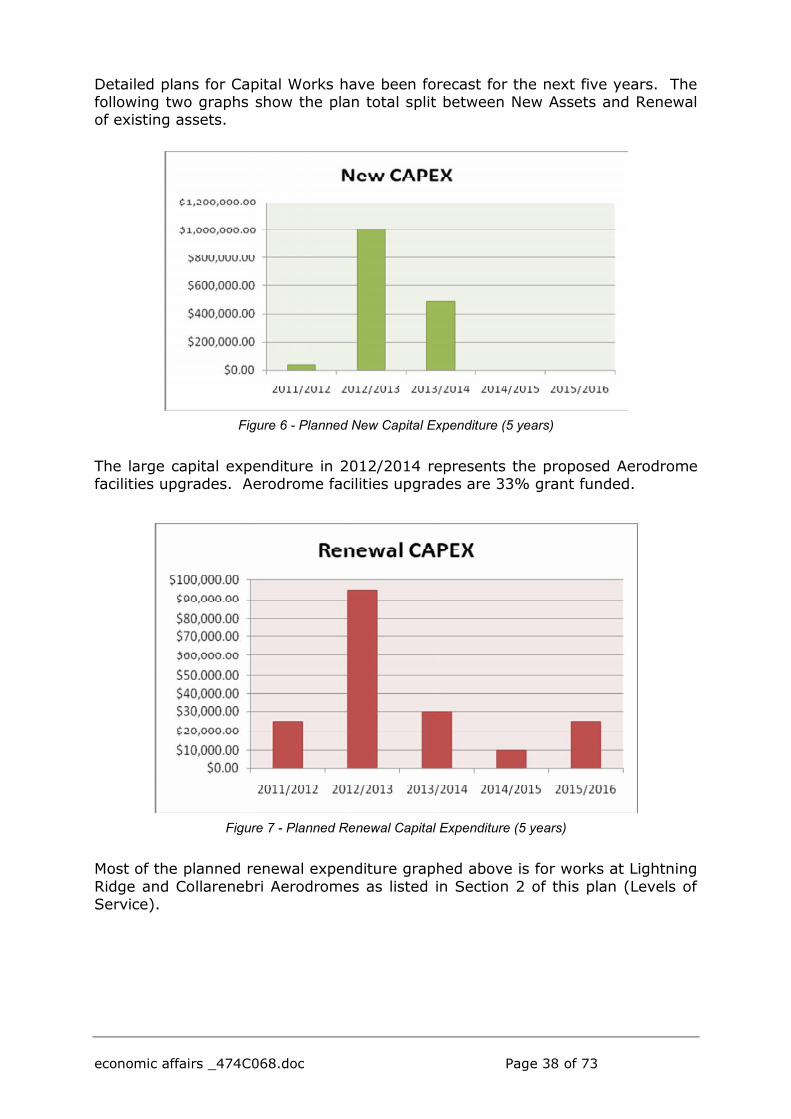
Detailed plans for Capital Works have been forecast for the next five years. Thefollowing two graphs show the plan total split between New Assets and Renewalof existing assets.
Figure 6 - Planned New Capital Expenditure (5 years)
The large capital expenditure in 2012/2014 represents the proposed Aerodromefacilities upgrades. Aerodrome facilities upgrades are 33% grant funded.
Figure 7 - Planned Renewal Capital Expenditure (5 years)
Most of the planned renewal expenditure graphed above is for works at LightningRidge and Collarenebri Aerodromes as listed in Section 2 of this plan (Levels ofService).

economic affairs _474C068.doc Page 39 of 73
Figure 8 - Forecast Total Capital Expenditure (10 years)
In forecasting 10 year financial figures, we included an additional 5 years ofprojected renewals based on expiration of useful lives.
A number of buildings across the portfolio will, on paper, reach the end of theiruseful lives. Replacement of these assets may not be required, but these assetswill need to be evaluated within the next 5-10 years for refurbishment orreplacement.
Assets that may require significant future expenditure include:
Walgett:
Residence (swimming pool)
Aero Club Building
Masonic Lodge
Sale yards
All disposals forecast in Economic Affairs are based on projected replacement ofthese assets within the next 10 years.

economic affairs _474C068.doc Page 40 of 73
Figure 9 - Asset Disposal Projections (10 years)
Current Financial Ratios and Trends
Asset Usage and Replenishment
Council reports the rate of annual asset consumption and compares this to assetrenewal and asset upgrade and expansion.
(The ratios below have been calculated using annual averages across 2011FY actual figures and 5 year projections for Capital Expenditure andDepreciation.)
Annual Asset Consumption is the rate at which we are using up our assets.
Annual AssetConsumption
= Depreciation
Depreciable Amount
= $128,220
$6,691,138
= 1.9%
To maintain the status of our asset portfolio and continue to deliver existingservices, the trending rate of Annual Asset Renewal needs to be greater thanconsumption.
This ratio is roughly 1/3 of the Consumption Ratio. This would normally indicate theneed to increase spending over the next 10 years to maintain existing assets andservice levels at a Shire level. However, considering the healthy Upgrade/Expansionratio below, indications are that the Council is replacing some of these assets ratherthan renewing them.
Annual Asset Renewal = Renewal Expenditure
Depreciable Amount
= $37,000
$6,691,138
= 0.6%

economic affairs _474C068.doc Page 41 of 73
The trending rate of Annual Upgrades or Expansions indicates at what rate we areexpanding or replacing our asset portfolio.
Council’s plans mean an increase in Economic Affairs assets of 4.6% over the next 5years.
AnnualUpgrade/Expansion
= Ann UpgradeExpansion
Depreciable Amount
= $308,246
$6,691,138
= 4.6%
The above ratios are not consistent across all towns in the Shire, and are onlyrelevant to Walgett, Lightning Ridge and Collarenebri. Overall, the ratios bytown show planned capital expenditure to be sufficient to maintain service levels.Yearly reviews of this plan will include forecasts beyond this period and furtherconsider the need for asset renewals by individual assets.
Lifecycle Costs
The following graphs show the 10 year projections of lifecycle costs for ourEconomic Affairs assets. That is, Maintenance, Operations, and Depreciation(shown earlier in this section).
Maintenance costs show a spike in 2012 due to flood damage and clean-up.Generally, however, future maintenance and operations costs have been forecastas slowly increasing. These figures are based on actual historical trends.
Figure 10 - Projected Maintenance Expenditure (10 years)
Operations expenditure has been forecast based on historical data. Futureexpenditure is expected to resemble historical expenditure trends.

economic affairs _474C068.doc Page 42 of 73
Figure 11 - Projected Operations Expenditure (10 years)
Figure 12 - Average Annual Lifecycle Costs (10 years)
The average annual costs, shown above, reveal that the overall cost per year ofproviding our Economic Affairs assets will range from around $0.32 – $0.38 M.

economic affairs _474C068.doc Page 43 of 73
The graph below shows forecast Maintenance and Operating Expenditure as apercentage of the Capital cost of all Economic Affairs Assets. This downwardtrend is indicative of the focus on renewing and growing the asset portfolio, witha comparatively smaller growth in maintenance costs.
Figure 13 - Projected Asset Expenditure as a % of Asset Value
Sustainability of Service Delivery
There are two key indicators for financial sustainability that have beenconsidered in the analysis of the services provided by this asset category, thesebeing –
The effective use of capital to replenish and expand the asset portfolio;and
The management of lifecycle costs for cost minimization while maintainingthe required community service levels.
The previous section shows our forecasts which indicate that we will meet theseobjectives over the next 10 years. Meeting these objectives relies on –
Capital budget approval and/or grants sufficient to fund these works; and
Implementing asset maintenance practices that result in ongoingreductions in maintenance costs.
Future iterations of this plan will incorporate further analysis of historical trendsand review any variances from the projections in this plan.

economic affairs _474C068.doc Page 44 of 73
Funding Strategy
Projected expenditure identified above is to be funded from Council’s operatingand capital budgets. Council funds construction, maintenance and improvementsto infrastructure assets from a variety of sources, these will include recurrentincome, grant and loan funding or any combination of these depending on thesize and scope of the project.
Key Financial Forecast Assumptions and Confidence Levels
This section details the key assumptions made in presenting the informationcontained in this asset management plan and in preparing forecasts of requiredoperating and capital expenditure and asset values, depreciation expense andcarrying amount estimates.
It is presented to enable readers to gain an understanding of the levels ofconfidence in the data behind the financial forecasts.
Key assumptions made in this asset management plan are:
1. Current asset useful lives contained in the asset register are reasonableestimates of the value of the assets to the community over time.
2. Costs for planned capital works will be approved in future budgets.
3. Historical trends for operating and maintenance costs are a reasonableprediction of future costs, plus an uplift to allow for asset deteriorationover time.
4. The implementation of practical asset management practices will generatesome cost savings.
5. Future budgetary funding for operating and maintenance costs will beapproved.
6. There will be no extraordinary increases or decreases in costs due toeconomic factors (such as aberrant inflation) over the next 40 years.
Financial Forecast Parameters:
1. Depreciation forecasts calculated using an average portfolio useful life of52 years, giving a depreciation rate of 1.9%
2. Capital or Investment Expenditure, forecast as follows:
a. 5 years planned capital works (2012 – 2016 FYs)

economic affairs _474C068.doc Page 45 of 73
These figures are further broken up into New or Replacement assetsand Renewal/Refurbishment costs
b. 5 years of projected replacements based on expiration of usefullives (2017 – 2021 FYs)
3. Estimated yearly maintenance and operating expenditures, extrapolatedfrom:
a. 4.5 years worth of actual costs, incorporating trends and significantchanges
b. Year on year uplifts of 2% to account for marginal cost increasesover time
c. Cost increases of 3.5% in 2012/2013 to account for council payrises
Accuracy of future financial forecasts may be improved in future revisions of thisasset management plan by the following actions:
1. Periodic reviews of useful lives/depreciation rates as improved conditionand asset consumption information becomes available.
2. Future projected expenditure to be modelled on asset condition.
3. More specific allocation of operating and maintenance costs to individualassets, to provide reliable historical trends.
4. More detailed collection of data for income-producing assets, to offsetagainst asset expenditure.

economic affairs _474C068.doc Page 46 of 73
6. Asset Management PracticesCouncil staff are very familiar with the assets in our economic affairs portfolioand the requirements for keeping these in a reasonable condition. Currentlythere is little formalization nor documentation of these practices and the AssetRegister is used primarily as an accounting resource rather than a tool for assetmanagement.
The Council plans to address these gaps in the future.
Current Financial and Accounting Systems
Walgett Shire Council uses the ‘Authority’ by Civica software package foraccounting and reporting purposes. Authority has a number of general purposemodules including:
General Ledger
Purchasing
Debtors
Payroll
Rates
Water Billing
Project Costing
Financial reporting is prepared in accordance with the requirements of the LocalGovernment Act 1993 and relevant Australian Accounting Standards.
Current Asset Management Systems
Walgett Shire Council uses the Conquest Infrastructure Asset ManagementSoftware System. Conquest’s asset register supports both the operational andfinancial aspects of Asset Management, and the software integrates withMicrosoft project, Microsoft Office and allows seamless integration withGeographic Information Services (GIS).
The conquest software allows for quick ‘what-if’ analysis to rank assets and/orwork in order of importance based on risk, consequence of failure, economicbenefit or any other user definable parameter.
Council’s Asset Management systems are not integrated with our accounting andfinancial systems from a software interface perspective, however improvementsin this area would require substantial changes to the use of and level ofinvestment in “Authority” which also has an asset management software moduleavailable.

economic affairs _474C068.doc Page 47 of 73
Council prepares General Purpose Financial Reports on an annual basis. Thesereports are used in conjunction with our asset management system and datamodels to complete our asset management financials each year.
Accountabilities
Accountability for the operation and management of the asset managementsystem is corporate and requires both the technical, operational and financialareas of Council to be closely involved.
The Finance Manager is responsible for the operation and maintenance of theWalgett Shire Council’s Financial Reporting and Asset Management Systems.
Information Flow Requirements and Processes
The key information flows into this asset management plan are:
Asset register data on size, age, value, remaining life of the network;
Unit rates for categories of work/material;
Adopted service levels;
Projections of various factors affecting future demand for services;
Correlations between maintenance and renewal, including decay models;
Data on new assets acquired by council.
The key information flows from this asset management plan are:
Assumed Works Program and trends;
Resulting budget, valuation and depreciation projections;
Useful life analysis.
Estimate of costs to meet Council’s agreed service levels.
These will impact the Long Term Financial Plan, Workforce Management Plan andCouncil’s higher level Community Strategic Plan.

economic affairs _474C068.doc Page 48 of 73
Planned Areas of Improvement
1. Briefly document current asset management practices.
2. Determine which current practices are suitable to the purpose and meetfundamental asset management principles and which would providebenefits through improvements.
3. Prepare a plan for improvements to be implemented over the next 3years, including
a. Documenting the Condition of all Level 1 and Level 2 assets basedon physical inspection.
b. Developing a 3-year Planned Maintenance Schedule based on AssetConditions from (a.) above.
c. Collecting a complete list of all facilities, structures and otherfixtures in the Economic Affairs category which are maintained oroperated by Council. (This is to extend the Asset Register listing,which has a financial basis, to the extent that it can be utilised forasset management purposes.)
d. Re-evaluating the useful lives (for depreciation purposes) of allassets which have been significantly refurbished within the last 5years.
e. Reviewing management and reporting of asset maintenanceexpenditure with a view to giving it more structure in line with thisasset management plan and more correlation to asset conditionsassessed at (a.) above.
f. Adjusting the financial recording of revenue from Economic Affairsassets to permit allocation to all individual income-producingfacilities.
4. Evaluate the Asset Register for its suitability in recording and reporting onAsset Management information, and its consequent application in AssetManagement decisions and funding.
5. Review the current structure for recording and reporting AssetManagement expenditure in Authority and determine whether changeswould make the data a more useful Asset Management tool.
6. Review Council’s Asset Management Funding Strategy and BudgetaryProcesses to incorporate information flows between these activities andchanges in Asset Management Practices.

economic affairs _474C068.doc Page 49 of 73
Standards and Guidelines
‘International Infrastructure Management Manual’, Institute of Public WorksEngineering Australia, Sydney, 2006 / 2011
AAS27, ‘Financial Reporting by Local Governments’, Australian AccountingStandards, June 1996
AASB1031, ‘Materiality’, Australian Accounting Standards Board, July 2004
AASB116, ‘Property, Plant and Equipment’, Australian Accounting StandardsBoard, July 2007
In regard to Asset Management Planning, the financial regulations that apply areoutlined as part of the Integrated Planning Framework, especially with regard tothe Long Term Financial Plan.
Further reference may also be made to Council’s Asset Management Policy,Capital Threshold Policy, and planned changes to Financial Systems.

economic affairs _474C068.doc Page 50 of 73
7. Plan Improvement and MonitoringThis document is the first version of the Council’s Economic Affairs AssetManagement Plan. It is based on knowledge and data available from existingsystems and practices. Throughout the document, there are references toimprovements in asset management practices and data collection as a movefrom Core to Advanced asset management.
It is important that Asset Management Practices and this overriding plan areused and enhanced as a means of –
Providing suitable Economic Affairs Assets to the community;
Ensuring these assets meet criteria for safety, accessibility, and requiredlevels of service; and
Meeting these objectives cost-effectively.
Performance Measures
The effectiveness of the asset management plan can be measured in thefollowing ways:
1. The degree to which Levels of Service and Asset Condition are maintainedor improved, evaluated each year as the plan is updated.
2. The degree to which Asset Data quality is improved and the ease withwhich it is collected and evaluated for incorporation in the yearly planupdates.
3. The degree of correlation between Forecast Asset Expenditures (Capitaland Ongoing) and Actual Expenditures improves as asset managementpractices are implemented.
4. The degree to which Maintenance Expenditure shifts from Reactive toPlanned Maintenance activities.
5. The degree to which Community Satisfaction in this area improves overtime.
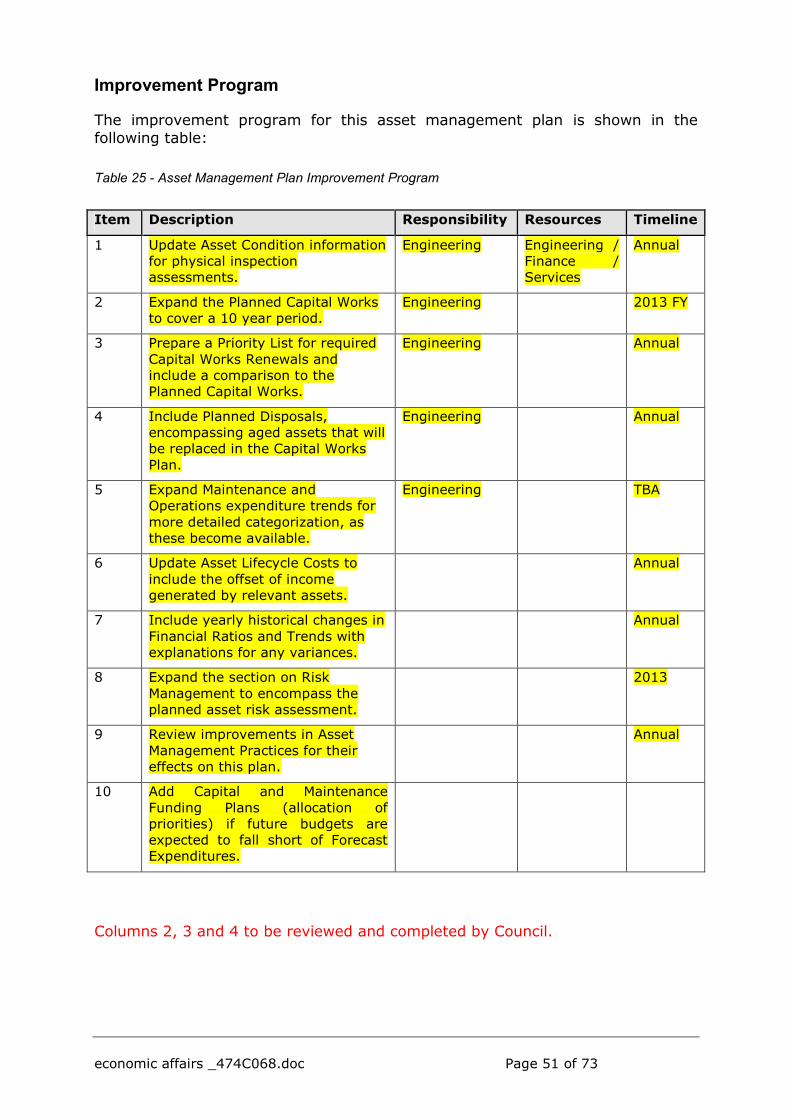
economic affairs _474C068.doc Page 51 of 73
Improvement Program
The improvement program for this asset management plan is shown in thefollowing table:
Table 25 - Asset Management Plan Improvement Program
Item Description Responsibility Resources Timeline
1 Update Asset Condition informationfor physical inspectionassessments.
Engineering Engineering /Finance /Services
Annual
2 Expand the Planned Capital Worksto cover a 10 year period.
Engineering 2013 FY
3 Prepare a Priority List for requiredCapital Works Renewals andinclude a comparison to thePlanned Capital Works.
Engineering Annual
4 Include Planned Disposals,encompassing aged assets that willbe replaced in the Capital WorksPlan.
Engineering Annual
5 Expand Maintenance andOperations expenditure trends formore detailed categorization, asthese become available.
Engineering TBA
6 Update Asset Lifecycle Costs toinclude the offset of incomegenerated by relevant assets.
Annual
7 Include yearly historical changes inFinancial Ratios and Trends withexplanations for any variances.
Annual
8 Expand the section on RiskManagement to encompass theplanned asset risk assessment.
2013
9 Review improvements in AssetManagement Practices for theireffects on this plan.
Annual
10 Add Capital and MaintenanceFunding Plans (allocation ofpriorities) if future budgets areexpected to fall short of ForecastExpenditures.
Columns 2, 3 and 4 to be reviewed and completed by Council.

economic affairs _474C068.doc Page 52 of 73
Monitoring and Review Procedures
This asset management plan will be reviewed during annual budget preparationand amended to recognise any changes in service levels and/or resourcesavailable to provide those services as a result of the budget decision process.
The Plan has a life of 10 years and is due for revision annually and updatingwithin 1 year of each Council election.

economic affairs _474C068.doc Page 53 of 73
Appendix 1 – Legislative RequirementsCouncil is guided by many National and State level legislative and regulatoryrequirements. These include:
Table 26 - Legislative Requirements
Legislation RequirementLocal Government Act Sets out role, purpose, responsibilities and
powers of local governments including thepreparation of a long term financial plansupported by asset management plans forsustainable service delivery
The Australian Accounting Standards The Australian Accounting Standards BoardStandard, AASB 116 Property, Plant &Equipment, requires that assets be valued, andreported in the annual accounts, which alsoincludes depreciation value (i.e. how fast arethese assets wearing out).
CASA Regulations MOS Part 139 Manual of Operating Systems forAirports.
The Aviation Transport Security Act2004 (the Act)
An Act to safeguard against unlawful interferencewith aviation, and for other purposesAdministered by: Infrastructure and Transport
Aviation Transport Security Regulations2005
Regulations to safeguard against unlawfulinterference with aviation, and for other purposes
AS1428-Pts 1-5 (2011)Design for Access and Mobility.
To ensure infrastructure provides access for all.
Disability Discriminations Act, 1992 (a) to eliminate, as far as possible, discriminationagainst persons on the grounds of disability in theareas of:(i) work, accommodation, education, access topremises, clubs, and sport;(ii) the provision of goods, facilities, services andland;(iii) existing laws; and(iv) the administration of Commonwealth laws andprograms; and(b) to ensure, as far as practicable, that personswith disabilities have the same rights to equalitybefore the law as the rest of the community; and(c) to promote recognition and acceptance withinthe community of the principle that persons withdisabilities have the same fundamental rights asthe rest of the community.
Work Health & Safety Act 2011 Sets out requirements for safe work practices.Occupational Health and SafetyAct1983
Impacts all operations.
Note public safety – insurance.
Cost implications.
Council’s responsibility to ensure health, safetyand welfare of employees and others at places ofwork.
Public Works Act Role of DPWS in planning and construction ofnew assets.

economic affairs _474C068.doc Page 54 of 73
Legislation RequirementEnvironmental Planning andAssessment Act 1979
Requirement for LEP and DCP’s.
Council control of service approvals.
Standards and Specifications
Insert any council policy standards for Economic Affairs assets.

economic affairs _474C068.doc Page 55 of 73
Appendix 2 – Sustainability RatiosThe accounting and cost estimate data used to calculate Council’s EconomicAffairs Sustainability Index and Ratios is tabulated below.
Table 27 - Summary Accounting and Cost Estimate Data
Financial Measure 6 Year Total Average Annual ExpenditureCapital Renewal $ 185,000 $ 37,000Capital Upgrade/Expansion $ 1,541,231 $ 308,246
10 Year TotalMaintenance Expenditure $ 1,741,668 $ 174,167Operating Expenditure $ 387,378 $ 38,738Depreciation $ 1,396,430 $ 139,643
Consumption, Renewal and Upgrade Ratios
Table 28 – Consumption, Renewal and Upgrade Ratios
Ratio Result Calculation1 Average Annual Asset Consumption 1.9% = Average Annual Depreciation / Depreciable Amount2 Average Annual Rate of Renewal 0.6% = Average Annual Renewal Expenditure / Depreciable Amount3 Average Annual Upgrade/expansion 4.6% = Average Annual upgrade expansion / Depreciable Amount4 Depreciable Amount $6,691,138 = See Depreciable Amount Definition below
1. Average Annual Asset Consumption
The percentage of the portfolio’s asset base consumed during a year. A measure of theaverage annual consumption of our asset portfolio (AAAC) which we express as apercentage of the depreciable amount (AAAC/DA). The Depreciable Amount is a measureof the total value of our asset base for the purpose of calculating this ratio. Depreciationmay be used for AAAC.
2. Average Annual Rate of Renewal
This number is the yearly average of planned renewal expenditure over the planningperiod (ten years). It is a measure of the rate at which assets are being renewed perannum expressed as a percentage of the depreciable amount (Average Capital RenewalExpenditure/DA).
3. Average Annual Upgrade/expansion
This number is the yearly average of planned capital upgrade expenditure over theplanning period (ten years). It is a measure of the rate at which assets are beingupgraded and expanded per annum expressed as a percentage of depreciable amount(Average Capital Upgrade/Expansion Expenditure/DA).
4. Depreciable Amount (DA)
The cost of an asset, or other amount substituted for its cost, less its residual value(AASB 116.6).

economic affairs _474C068.doc Page 56 of 73
Life Cycle Sustainability Index
Table 29 - Life Cycle Sustainability Index
Ratio Result Calculation1 Portfolio Life Cycle Cost $ 434,097 = Average Yearly Total Cost of the Asset Portfolio2 Portfolio Life Cycle Expenditure $ 447,266 = Planned Expenditure (For Current Year)3 Portfolio Life Cycle Gap $ 13,168 = Difference between 1 & 24 Portfolio Life Cycle Sustainability Index 1.03 = 2 / 1 ( Life Cycle Expenditure / Lifecycle Cost)
(Average Lifecycle used in the above calculations = 40 years)
1. Life Cycle Cost
The life cycle cost is average cost to provide the service over the life of the asset. Itcomprises annual maintenance and asset consumption expense, represented bydepreciation expense. The Life Cycle Cost does not indicate the funds required to providethe service in a particular year. To calculate the Lifecycle Cost of an asset all cash flows,both positive (inflows) and negative (outflows) need to be identified for each year of theuseful life of the asset or asset portfolio. Cash flows should be stated in actual cashterms, that is all costs and incomes are at the levels expected in that year. No allowanceshould be made for inflation.
2. Life Cycle Expenditure
The Life Cycle Expenditure is the actual or planned annual maintenance and capitalrenewal expenditure incurred in providing the service in a particular year. Life Cycle Costmay be compared to Life Cycle Expenditure to give an initial indicator of life cyclesustainability.
3. Life Cycle Gap
A gap between life cycle costs and life cycle expenditure gives an indication as towhether present consumers are paying their share of the assets they are consuming eachyear. The purpose of this Economic affairs asset management plan is to identify levels ofservice that the community needs and can afford and develop the necessary long termfinancial plans to provide the service in a sustainable manner.
4. Portfolio Life Cycle Sustainability Index
A Lifecycle sustainability Index of 1.0 indicates that the current year Maintenance &Renewal Expenditure equals the estimated Annualised Lifecycle Cost. Given that there isa broad range of variables across the asset network these ratios are reliable as a guideonly.
The 10 Year Sustainability Ratio
Table 30 - 10 Year Sustainability Ratio
Ratio Result CalculationSustainability index (10 Year) TBA = Current Year LTFP Funding Allocation / 10 Yr Required Expenditure Estimate.
This ratio is identical to the lifecycle sustainability index above in concept. It simplyproduces a ratio calculated for the planning period (10 years) rather than the life of theasset or asset portfolio which could be 60 years or more.
A sustainability index of 1.0 indicates that the current year Long Term Financial Planbudget allocation equals the estimated Annualised cost of maintaining the assets to meetagreed service levels over the next ten years.

economic affairs _474C068.doc Page 57 of 73
Appendix 3 – Definition
Annual Service CostAn estimate of the cost that would be tendered, perannum, if tenders were called for the supply of a serviceto a performance specification for a fixed term. TheAnnual Service Cost includes operating, maintenance,depreciation, finance/ opportunity and disposal costs,less revenue.
Asset CategoryGrouping of like assets, e.g. all Urban Parks.
Asset ClassGrouping of like asset categories, e.g. Parks, Gardens,Reserves, Sporting Facilities and Swimming Pools are allpart of the asset class of Recreation and Culture.
Asset Condition AssessmentThe process of continuous or periodic inspection,assessment, measurement and interpretation of the datato indicate the condition of a specific asset.
Asset ManagementThe combination of management, financial, economic,engineering and other practices applied to physicalassets with the objective of providing the required level ofservice in the most cost effective manner.
AssetsFuture economic benefits controlled by the entity as aresult of past transactions or other past events(AAS27.12).Property, plant and equipment including infrastructureand other assets (such as furniture and fittings) withbenefits expected to last more than 12 months.
Average Annual Asset ConsumptionThe amount of a local government’s asset baseconsumed during a year. This may be calculated bydividing the Depreciable Amount (DA) by the Useful Lifeand totalled for each and every asset OR by dividing theFair Value (Depreciated Replacement Cost) by theRemaining Life and totalled for each and every asset inan asset category or class.
Brownfield Asset ValuesAsset revaluation values based on the cost to replace theasset including demolition and restoration costs.
Capital Expansion ExpenditureExpenditure that extends an existing asset, at the samestandard as is currently enjoyed by residents, to a newgroup of users. It is discretional expenditure, which
increases future operating, and maintenance costs,because it increases council’s asset base, but may beassociated with additional revenue from the new usergroup. e.g. provision of a new swimming pool in a newproperty development for new residents.
Capital ExpenditureRelatively large (material) expenditure, which hasbenefits, expected to last for more than 12 months.Capital expenditure includes renewal, expansion andupgrade. Where capital projects involve a combination ofrenewal, expansion and / or upgrade expenditures, thetotal project cost needs to be allocated accordingly.
Capital FundingFunding to pay for capital expenditure.
Capital GrantsMonies received generally tied to the specific projects forwhich they are granted, which are often upgrade and/orexpansion or new investment proposals.
Capital New ExpenditureExpenditure which creates a new asset providing a newservice to the community. As it increases servicepotential it may impact revenue and will increase futureoperating and maintenance expenditure.
Capital Renewal ExpenditureCapital renewal is expenditure on an existing asset,which increases asset service potential of an existingasset. This may be to the same or a lower level thaninitially provided (partial renewal). It is periodicallyrequired expenditure, relatively large (i.e. material) invalue compared with the value of the asset or assetcomponent being renewed. As it reinstates existingservice potential, it has no impact on revenue but mayreduce future operating and maintenance expenditure ifcompleted at the optimum time (e.g. replacing bridgedecking or resurfacing an oval). Where renewal worksinclude a significant upgrade, the renewal and upgradecomponents should be separately identified (e.g. if aswimming pool with a replacement cost of $2m isreplaced with a $9m leisure centre, then $2m is identifiedas renewal and $9m as upgrade).
Capital Upgrade ExpenditureExpenditure which enhances an existing asset to providea higher level of service or expenditure that will increasethe life of the asset beyond that which it had originally.Upgrade expenditure is discretional and often does notresult in additional revenue unless direct user chargesapply. It will increase operating and maintenance

economic affairs _474C068.doc Page 58 of 73
expenditure in the future because of the increase inCouncil’s asset base (e.g. enlarging a grandstand at asporting facility, replacing an existing bridge with onehaving a greater carrying capacity). Where capitalprojects involve a combination of renewal, expansion and/ or upgrade expenditures, the total project cost needs tobe allocated accordingly.
Carrying AmountThe dollar amount at which an asset is recorded afterdeducting any accumulated depreciation / amortisationand accumulated impairment losses thereon.
ComponentAn individual part of an asset which contributes to thecomposition of the whole and can be separated from orattached to an asset or a system.
Cost of an AssetThe amount of cash or cash equivalents paid or the fairvalue of the consideration given to acquire an asset atthe time of its acquisition or construction, plus any costsnecessary to place the asset into service. This includesone-off design and project management costs.
Current Replacement CostThe cost the entity would incur to acquire the asset onthe reporting date. The cost is measured by reference tothe lowest cost at which the gross future economicbenefits could be obtained in the normal course ofbusiness or the minimum it would cost, to replace theexisting asset with a technologically modern equivalentNEW asset with the same economic benefits (grossservice potential) allowing for any differences in thequantity and quality of output and in operating costs.
Current Replacement Cost “As New”The current cost of replacing the original service potentialof an existing asset, with a similar modern equivalentasset, i.e. the total cost of replacing an existing asset withan as NEW or similar asset expressed in current dollarvalues.
Cyclic Maintenance**Replacement of higher value components / sub-components of asset undertaken on a regular cycleincluding repainting, building roof replacement, cycle,replacement of air conditioning equipment, etc. This workgenerally falls below the capital / maintenance thresholdand needs to be identified in a specific maintenancebudget allocation.
Depreciable AmountThe cost of an asset, or other amount substituted for itscost, less its residual value (AASB 116.6)
Depreciated Replacement Cost
The current replacement cost of an asset less, whereapplicable, accumulated depreciation calculated on thebasis of such cost to reflect the already consumed orexpired future economic benefits of the asset
Depreciation / AmortisationThe systematic allocation of the depreciable amount ofan asset over its useful life.
Fair ValueThe amount for which an asset could be exchanged, or aliability settled, between knowledgeable, willing parties, inan arm’s length transaction.
Greenfield Asset ValuesAsset (re)valuation values based on the cost to initiallyacquire the asset.
Heritage AssetAn asset with historic, artistic, scientific, technological,geographical or environmental qualities that is held andmaintained principally for its contribution to knowledgeand culture and this purpose is central to the objectivesof the entity holding it.
Impairment LossThe amount by which the carrying amount of an assetexceeds its recoverable amount.
Infrastructure AssetsPhysical assets of the entity or of another entity thatcontribute to meeting the public's need for access tomajor economic and social facilities and services, eg.roads, drainage and sewerage. The components of theseassets may be separately maintained, renewed orreplaced individually so that the required level andstandard of service from the network of assets iscontinuously sustained. Generally the components andhence the assets have long lives. They are fixed in placeand are often have no market value.
Investment propertyProperty held to earn rentals or for capital appreciation orboth, rather than for:(a) use in the production or supply of goods or servicesor for administrative purposes; or(b) sale in the ordinary course of business (AASB 140.5)
Level of ServiceThe defined service quality for a particular serviceagainst which service performance may be measured.
Life Cycle CostThe life cycle cost is average cost to provide the serviceover the longest asset life cycle. It comprises annualmaintenance and asset consumption expense,represented by depreciation expense. The Life Cycle

economic affairs _474C068.doc Page 59 of 73
Cost does not indicate the funds required to provide theservice in a particular year.
Life Cycle ExpenditureThe Life Cycle Expenditure is the actual or plannedannual maintenance and capital renewal expenditureincurred in providing the service in a particular year. LifeCycle Cost may be compared to Life Cycle Expenditureto give an initial indicator of life cycle sustainability.
Maintenance and Renewal GapDifference between estimated budgets and projectedexpenditures for maintenance and renewal of assets,totalled over a defined time (usually 10 - 20 years).
Maintenance and Renewal Sustainability IndexRatio of estimated budget to projected expenditure formaintenance and renewal of assets over a defined time(usually 10 - 20 years).
Maintenance ExpenditureRecurrent expenditure, which is periodically or regularlyrequired as part of the anticipated schedule of worksrequired to ensure that the asset achieves its useful lifeand provides the required level of service. It isexpenditure, which was anticipated in determining theasset’s useful life.
MaterialityAn item is material if its omission or misstatement couldinfluence the economic decisions of users taken on thebasis of the financial report
Modern Equivalent Asset.A structure similar to an existing structure and having theequivalent productive capacity, which could be built usingmodern materials, techniques and design. Replacementcost is the basis used to estimate the cost of constructinga modern equivalent asset.
Non-Revenue Generating InvestmentsInvestments for the provision of goods and services tosustain or improve services to the community that are notexpected to generate any savings or revenue to theCouncil, eg. Parks, playgrounds, footpaths, roads andbridges.
Operating ExpenditureExpenditure on providing a service, which is continuouslyrequired including staff salaries and wages, plant hire,materials, power, fuel, accommodation and equipmentrental, on-costs and overheads. Operating expenditureexcludes maintenance and depreciation.
Planned Maintenance
Repair work that is identified and managed through amaintenance management system (MMS). MMSactivities include inspection, assessing the conditionagainst failure / breakdown criteria / experience,prioritizing scheduling, actioning the work and reportingwhat was done to develop a maintenance history andimprove maintenance and service delivery performance.
Rate of Annual Asset ConsumptionA measure of average annual consumption of assets(AAAC) expressed as a percentage of the depreciableamount (AAAC/DA). Depreciation may be used forAAAC.
Rate of Annual Asset RenewalA measure of the rate at which assets are being renewedper annum expressed as a percentage of depreciableamount (capital renewal expenditure / DA).
Rate of Annual Asset UpgradeA measure of the rate at which assets are beingupgraded and expanded per annum expressed as apercentage of depreciable amount (capital upgrade orexpansion expenditure / DA).
Reactive MaintenanceUnplanned repair work that carried out in response toservice requests and management / supervisorydirections.
Recoverable AmountThe higher of an asset's fair value, less costs to sell andits value in use.
Recurrent ExpenditureRelatively small (immaterial) expenditure or that whichhas benefits expected to last less than 12 months.Recurrent expenditure includes operating andmaintenance expenditure.
Recurrent FundingFunding to pay for recurrent expenditure.
Remaining LifeThe time remaining until an asset ceases to provide therequired service level or economic usefulness. Age plusremaining life is useful life.
RenewalSee capital renewal expenditure definition above.
Residual ValueThe net dollar amount which an entity expects to obtainfor an asset at the end of its useful life after deducting theexpected costs of disposal.

economic affairs _474C068.doc Page 60 of 73
Revenue Generating InvestmentsInvestments for the provision of goods and services tosustain or improve services to the community that areexpected to generate some savings or revenue to offsetoperating costs.
Risk ManagementThe application of a formal process for the managementof risk which determines identifies a possible range ofoutcomes and their probability of occurrence.
Section or SegmentA self-contained part or piece of an infrastructure asset.
Service PotentialThe capacity to provide goods and services inaccordance with the entity's objectives, whether thoseobjectives are the generation of net cash inflows or theprovision of goods and services of a particular volumeand quantity to the beneficiaries thereof.
Service Potential RemainingA measure of the remaining life of assets expressed as apercentage of economic life. It is also a measure of thepercentage of the asset’s potential to provide servicesthat is still available for use in providing services(DRC/DA).
Useful lifeEither:(a) the period over which an asset is expected to beavailable for use by an entity, or(b) the number of production or similar units expected tobe obtained from the asset by the entity.It is estimated or expected time between placing theasset into service and removing it from service, or theestimated period of time over which the future economicbenefits embodied in a depreciable asset, are expectedto be consumed by the council. It is the same as theeconomic life.

economic affairs _474C068.doc Page 61 of 73
Appendix 4 – Strategic Lifecycle ModelExpenditure Types
Expenditure on infrastructure works can be split into two types:
1. Operations and Maintenance
2. Capital
These can be further classified as shown below:
Maintenance Expenditure on an asset which maintains the asset in usebut does not increase its service potential or life, e.g.repairing a pothole in a road, repairing the decking on atimber bridge, unblocking a pipe, repairing the fencing in apark, repair work to prevent early failure of an asset or aportion of an infrastructure network.
Capital Renewal Expenditure on renewing an existing asset or a portion of aninfrastructure network which increases the service potentialor extends the life, e.g. rebuilding grandstands, re-sheetingpart of a road, renewing a section of a drainage network,major maintenance on bridge pylons, resurfacing an oval.
The Two Expenditures Below add to Future LiabilitiesCapital Expansion Expenditure on extending an infrastructure network, at the
same standard currently enjoyed by existing residents, to anew group of users, e.g. extending a drainage or roadnetwork, the provision of a sports oval or park in a new partof town.
Capital Upgrade Expenditure on upgrading the standard of an existing assetorinfrastructure network to provide a higher level of service tousers, e.g. widening the pavement and sealed area of anexisting road, replacing drainage pipes with pipes of agreater capacity, building a new grandstand at a sportingfacility, replacing an existing bridge with one having agreater carrying capacity, replacing a wood park bench withhigher grade aluminium benches.
1. Capital upgrade and expansion commit council to fund ongoing budgetliabilities for operations, maintenance, depreciation and finance costs forthe life of the asset.
2. Capital renewal works restore existing service levels and do not add tobudget liabilities. Well-planned capital renewal works can reduce operatingand maintenance costs by reviewing service levels, use of automation andmore energy efficiency equipment.
economic affairs _474C068.doc Page 62 of 73
About Useful Life Figures (also referred to as Economic Life)
The level of analysis behind the adopted useful life of assets is a critical to theaccuracy of the lifecycle model used by Asset Managers.
A lack of practical or realistic useful life information can create a situation wherelifecycle and sustainability ratios are questionable in terms of their meaning. Thiscan only be addressed over time through the accumulation of reliable useful lifedata.
Depreciation
Depreciation is the measure of the consumption of service potential (the rate atwhich an asset is “used up”. The two primary variables in the calculation ofdepreciation are:
1. The age of the asset (service potential consumed to date)
2. The remaining life of the asset (how much service potential remains)
The useful life of an asset is the sum of these two variables. The averagedepreciation over the life of the asset is the current replacement value per assetdivided by the useful life. The current depreciation is the written down currentreplacement cost divided by the remaining life.
The progressive failure and renewal of an asset means that the renewalexpenditure and useful life are distributions and not single values. Actual assetbehaviour needs to be understood and interpreted for useful asset managementand financial reporting.
Useful Life Information
The total economic life for most road asset pavements is unknown. Of a sampleof over 150 councils from SA, VIC, NSW and TAS, none have a statistical basisfor useful life.
Therefore, detailed analysis of useful life is critical to ensure financial reports donot dramatically either over or understate the actual depreciation. Errors likely tomaterially affect financial reports are caused by:
1. Over or underestimating useful life.
2. The limits of using condition based analysis to predict future remaining lifewhere there is not statistical basis to determine the relationship betweencondition and remaining life.
3. Over or understating the assets current replacement cost.
economic affairs _474C068.doc Page 63 of 73
Breaking assets into components and having a realistic basis for assessing usefullife, remaining life and asset depreciation is the solution that will bring reliabilityand meaning to sustainability ratios.
Renewal Values
Asset valuation is an essential management tool. It assists in the determinationand allocation of costs and provides performance/rate of return reporting,resource allocation, shareholder equity and accountability.
Asset Consumption
The consumption of an asset is calculated as the current replacement value perasset divided by the economic life. This is described as the Average Annual AssetConsumption (AAAC) and indicates the average annual renewal expenditurerequired to sustain the asset.
Renewal Gaps
The renewal gap is the difference between current maintenance/renewalexpenditure and the estimated lifecycle cost. Ideally the Sustainability Ratio foran asset or asset group should be 1.0. A sustainability ratio of 1.0 indicates thatthe current Maintenance & Renewal Expenditure equals the estimated AnnualisedLifecycle Cost. Given that there is a broad range of variables across the assetnetwork these ratios are reliable for the purposes of indicating the overall statusof the current situation.
However they are indicative only, given the data used in the analysis and theunknowns relating to economic life of long life assets, a range of SustainabilityRatio between 0.8 and 1.2 is considered to represent a satisfactory situation.
Sustainability Ratios of less than 0.8 provide an indication that the long-termsustainability of the asset may not be possible and that more detailed review isrequired. The Council’s asset management position has been analysed todetermine how the assets are being consumed by present citizens and the rate ofasset renewal. This gives a snapshot of average age of the assets, and how therate of asset consumption compares to the rate of asset renewal.
The analysis undertaken in formulating this asset management plan indicatedthat the renewal of assets is significantly less than the consumption of assetsmeaning there is a funding gap. However, this gap will likely be offset by thereplacement of aging assets indicated by the high upgrade/expansion ratio.
Any funding gap in future years may be managed by:
Improving asset knowledge (performance, condition and remaining life)
Rationalising (disposing of) unnecessary and low-use assets
Improving maintenance to extend asset lives and defer projected renewal

economic affairs _474C068.doc Page 64 of 73
Improving efficiency in delivery of maintenance and renewal
Developing and using low cost renewal methods
Lowering service levels
Increasing renewal funding

economic affairs _474C068.doc Page 65 of 73
Appendix 5 – Planned Capital Expenditure by Asset CategoryThe 5-year capital works plan has been allocated to specific assets. The following graphs provide an overview of where thesefunds have been allocated.
Figure 14 - 5 Year Total Capital Works Program by Asset Category

economic affairs _474C068.doc Page 66 of 73
Figure 15 - 5 Year New Capital Works Program by Asset Category
NOTE: Funding from Grants has not been included to offset total costs.
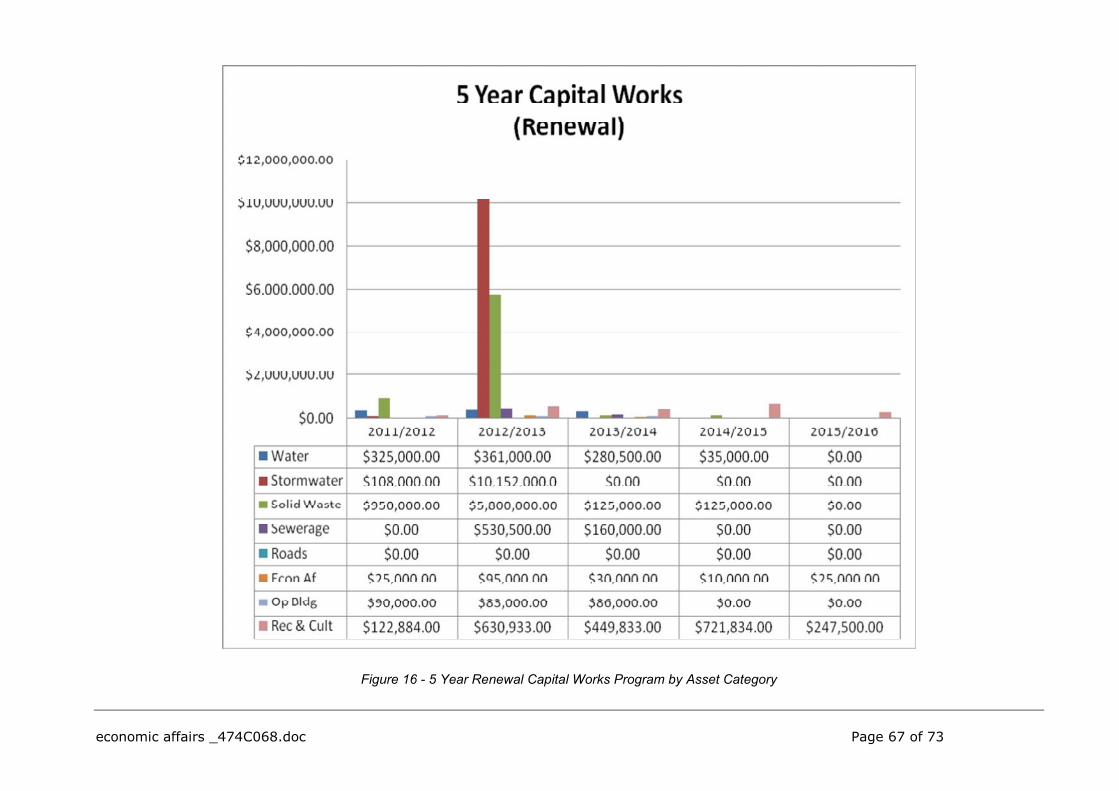
economic affairs _474C068.doc Page 67 of 73
Figure 16 - 5 Year Renewal Capital Works Program by Asset Category

economic affairs _474C068.doc Page 68 of 73
Appendix 6 – Planned Capital Expenditure by TownThe following graphs provide an overview of where these funds have been allocated.
Figure 17 - 5 Year Total Capital Works Program by Town
AssetCategory Walgett Lightning
Ridge Collarenebri BurrenJunction Carinda Cumborah Rowena Pokataroo Total CAPEX
Water $ 5,163,000 $ 762,477 $ 495,000 $ - $ 27,000 $ - $ 17,500 $ - $ 6,464,977Stormwater $ 10,335,000 $ 90,000 $ - $ - $ - $ - $ - $ - $ 10,425,000Solid Waste $ 6,100,000 $ 400,000 $ 100,000 $100,000 $100,000 $ - $100,000 $100,000 $ 7,000,000Sewerage $ 2,613,000 $ 169,000 $ 111,500 $ - $ - $ - $ - $ - $ 2,893,500Roads $ 200,000 $ 65,000 $ - $ - $ - $ - $ - $ 265,000Econ Af $ 1,525,000 $ 79,500 $ 121,731 $ - $ - $ - $ - $ - $ 1,726,231Op Bldg $ 4,677,000 $ 982,079 $ 12,000 $ - $ - $ 90,000 $ 4,500 $ - $ 5,765,579Rec & Cult $ 3,494,700 $ 3,323,000 $ 2,925,100 $480,584 $245,500 $ - $236,500 $ - $ 10,705,384Total CAPEX $ 33,907,700 $ 6,006,056 $ 3,830,331 $580,584 $372,500 $ 90,000 $358,500 $100,000 $ 45,245,671

economic affairs _474C068.doc Page 69 of 73
While the total Capital Plan for Walgett looks extreme by comparison to the othertowns in the Shire, $31M is allocated to large one-off projects, and includes $4Mof external funding:
Levee rehabilitation
New Landfill
New Depot
PCYC Youth Centre (possibly fully funded)
New Aged Care Facility – 2016/2017 (fully funded)
Aerodrome upgrade (30% subsidised via grants)
Water reticulation and Sewerage systems
Namoi Sewerage improvement
Figure 18 - Walgett - 5 Year Total Capital Works Program

economic affairs _474C068.doc Page 70 of 73
As discussed earlier in this plan, Lightning Ridge and Collarenebri capital planseach include $2M for a new Youth Centre, shown below in the large segments forRecreation and Culture. Final construction of the HACC centre in Lightning Ridgewill be completed in the 2011/2012 FY, explaining the large segment forOperational Buildings. Construction of this facility is fully funded by Grants.
Figure 19 - Lightning Ridge - 5 Year Total Capital Works Program
Figure 20 - Collarenebri - 5 Year Total Capital Works Program
The majority of the capital plans for Burren Junction involve the School of ArtsHall and the Evaporation Pond for the Bore Baths.

economic affairs _474C068.doc Page 71 of 73
Figure 21 - Burren Junction - 5 Year Total Capital Works Program
Plans for Carinda include two new Toilet/Shower blocks for the Swimming Pooland the Showground/Racecourse.
Figure 22 - Carinda - 5 Year Total Capital Works Program
Construction of a Meeting Room is planned for Cumborah.

economic affairs _474C068.doc Page 72 of 73
Figure 23 - Cumborah - 5 Year Total Capital Works Program
Significant work is planned for the Rowena Town Hall, and adaptation of theSports Oval to accommodate Camping Facilities.
Figure 24 - Rowena - 5 Year Total Capital Works Program

economic affairs _474C068.doc Page 73 of 73
Figure 25 - Pokataroo - 5 Year Total Capital Works Program