Asset Management Lessons from Peers - UMS Group
17
© UMS Group Inc., All Rights Reserved Asset Management Lessons from Peers Results and Best Practices International Transmission Asset Management Study 2016 (ITAMS 2016) Johan Huisma, June 2017
Transcript of Asset Management Lessons from Peers - UMS Group
© UMS Group Inc., All Rights Reserved
Asset Management Lessons from PeersResults and Best Practices International Transmission Asset Management Study 2016 (ITAMS 2016)
Johan Huisma, June 2017
© UMS Group Inc., All Rights Reserved ITAMS 2016 | Results and Best Practices | Page 2
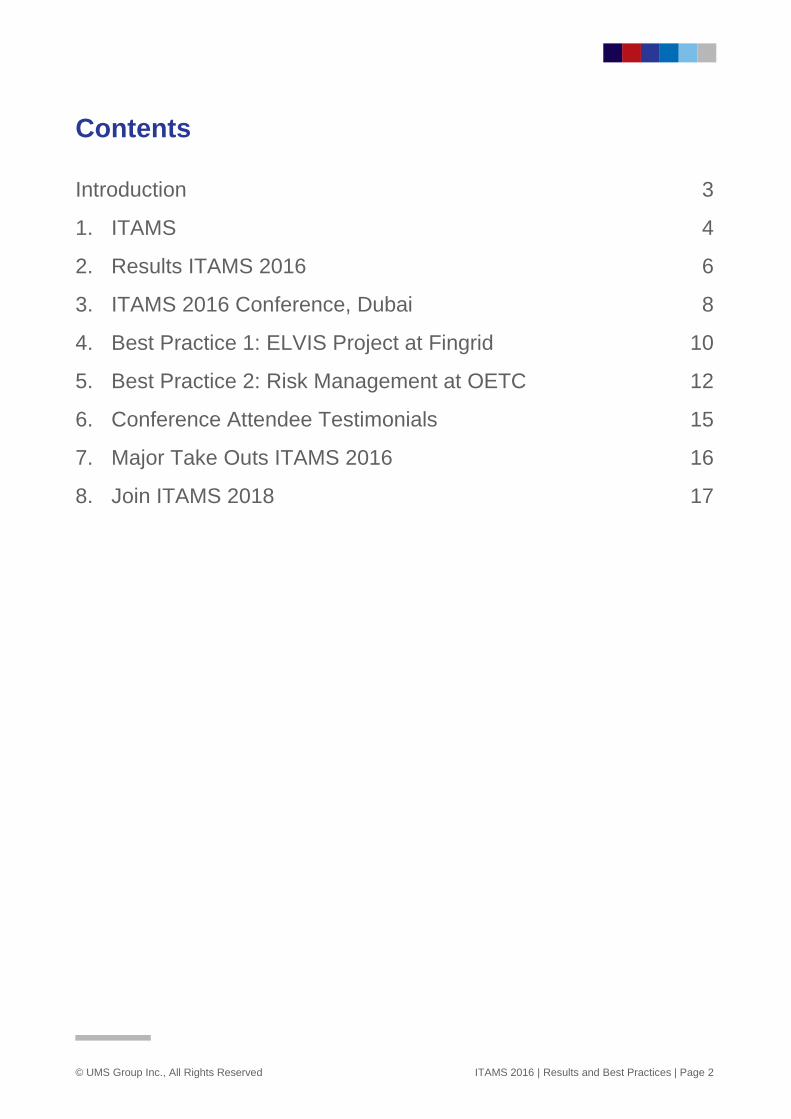
Contents
Introduction 3
1. ITAMS 4
2. Results ITAMS 2016 6
3. ITAMS 2016 Conference, Dubai 8
4. Best Practice 1: ELVIS Project at Fingrid 10
5. Best Practice 2: Risk Management at OETC 12
6. Conference Attendee Testimonials 15
7. Major Take Outs ITAMS 2016 16
8. Join ITAMS 2018 17
© UMS Group Inc., All Rights Reserved ITAMS 2016 | Results and Best Practices | Page 3
Introduction
It is acknowledged across various industries and business sectors globally that commercial
success is dependent on the ability to coordinate all aspects of the business towards
achieving common goals and objectives. Top level strategic management must align with
daily operations and asset infrastructure management. Effective asset management plays
a central and critical role in bringing all the business disciplines together and ensuring the
most profitable balance of benefit, cost and risk.
In 2016/17 eleven TSOs from the USA, Canada, Australia, Finland, Belgium, Italy,
Slovenia, United Arab Emirates, Oman and Saudi Arabia joined the International
Transmission Asset Management Study (ITAMS) to compare Asset Management systems
and processes and share knowledge and experience with a view to targeting and
implementing improvement programs based on industry best practice and compliance with
ISO55001 requirements.
This eBook presents an overview of the ITAMS program, the program’s most recent
results, and concludes with some major take outs of this cycle.
Enjoy your journey of discovery,
Johan Huisma
Program Manager ITAMS
UMS Group Europe BV
© UMS Group Inc., All Rights Reserved ITAMS 2016 | Results and Best Practices | Page 4
Chapter 1
ITAMS
The International Transmission Asset Management Study (ITAMS) is a multi-company
initiative, designed for the leading companies in the area of Asset Management. It creates
insights into leading practices for improving the effectiveness of Asset Management and is
aligned to ISO 55001. ITAMS has been set up as a learning consortium and is supervised
by an Executive Advisory Board comprised of participants. ITAMS was launched in 2010
and is performed every two years. A cycle ends with a results/best practices conference
designed for sharing knowledge and addressing opportunities and improvement initiatives.
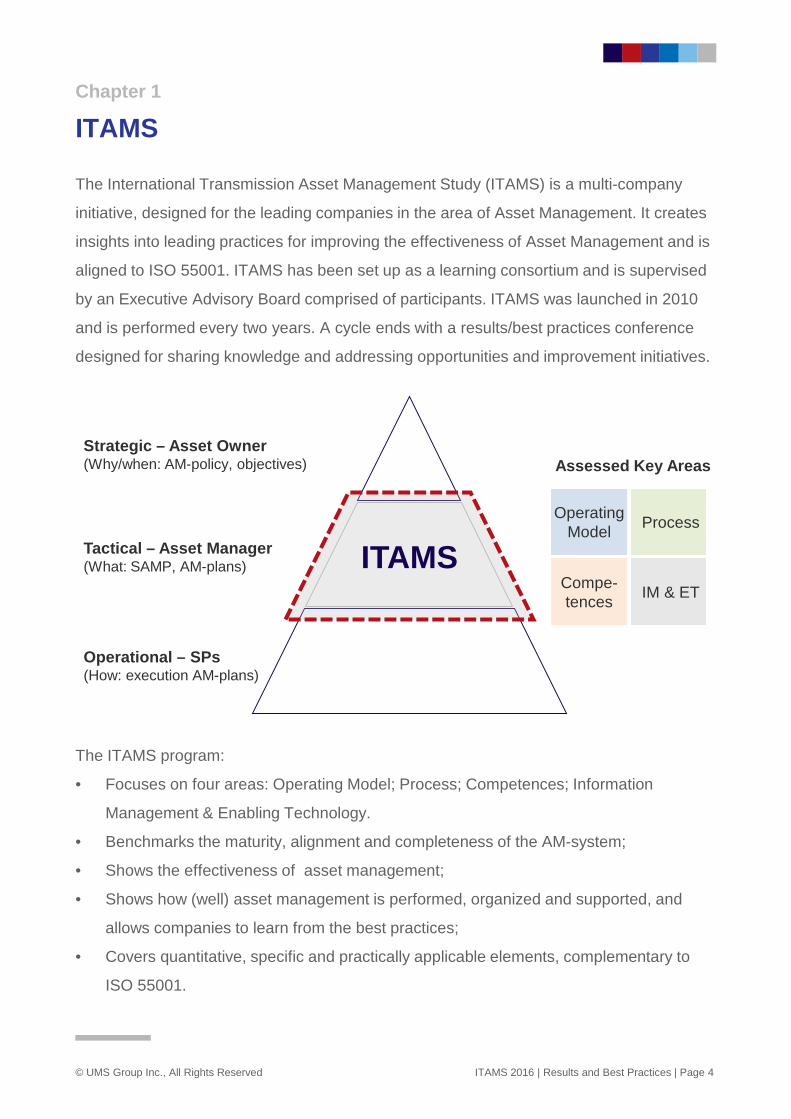
The ITAMS program:
• Focuses on four areas: Operating Model; Process; Competences; Information
Management & Enabling Technology.
• Benchmarks the maturity, alignment and completeness of the AM-system;
• Shows the effectiveness of asset management;
• Shows how (well) asset management is performed, organized and supported, and
allows companies to learn from the best practices;
• Covers quantitative, specific and practically applicable elements, complementary to
ISO 55001.
Operating Model Process
Compe-tences IM & ET
Strategic – Asset Owner(Why/when: AM-policy, objectives)
Tactical – Asset Manager(What: SAMP, AM-plans)
Operational – SPs(How: execution AM-plans)
ITAMS
Assessed Key Areas
© UMS Group Inc., All Rights Reserved ITAMS 2016 | Results and Best Practices | Page 5
Chapter 1
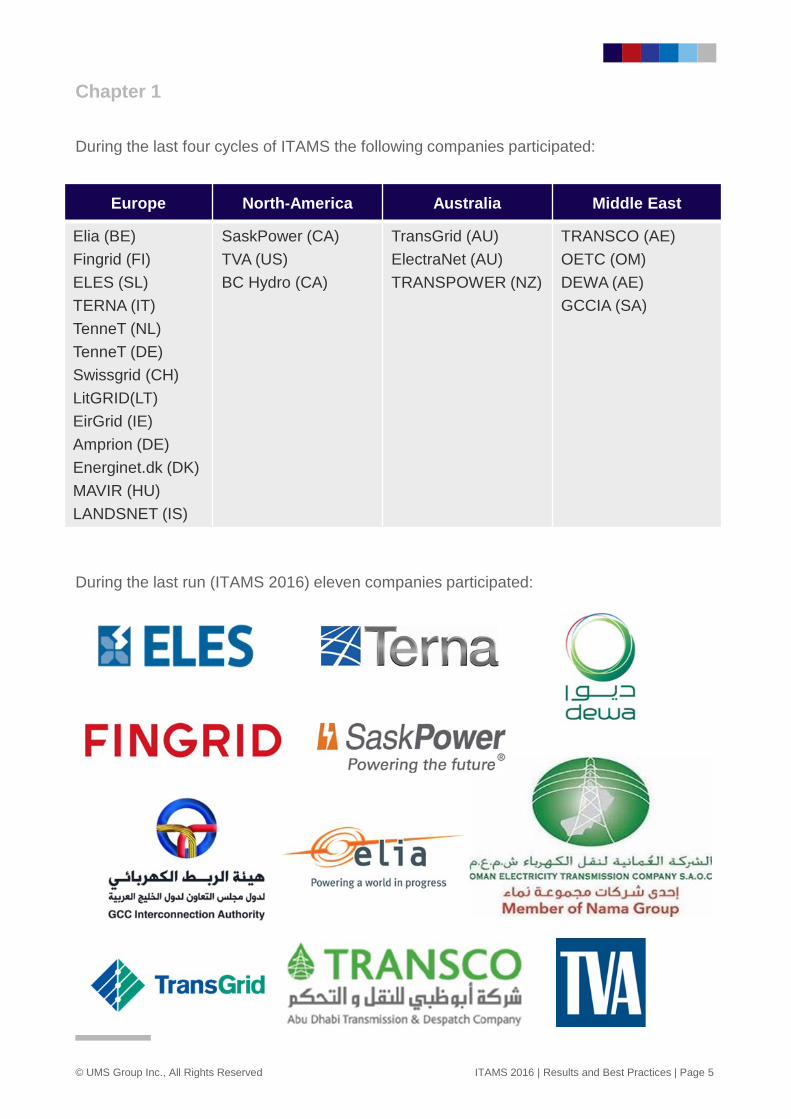
During the last four cycles of ITAMS the following companies participated:
During the last run (ITAMS 2016) eleven companies participated:
Europe North-America Australia Middle East
Elia (BE)Fingrid (FI)ELES (SL)TERNA (IT)TenneT (NL)TenneT (DE)Swissgrid (CH)LitGRID(LT) EirGrid (IE) Amprion (DE)Energinet.dk (DK)MAVIR (HU)LANDSNET (IS)
SaskPower (CA)TVA (US)BC Hydro (CA)
TransGrid (AU)ElectraNet (AU)TRANSPOWER (NZ)
TRANSCO (AE)OETC (OM)DEWA (AE)GCCIA (SA)
© UMS Group Inc., All Rights Reserved ITAMS 2016 | Results and Best Practices | Page 6
Chapter 2
Results ITAMS 2016
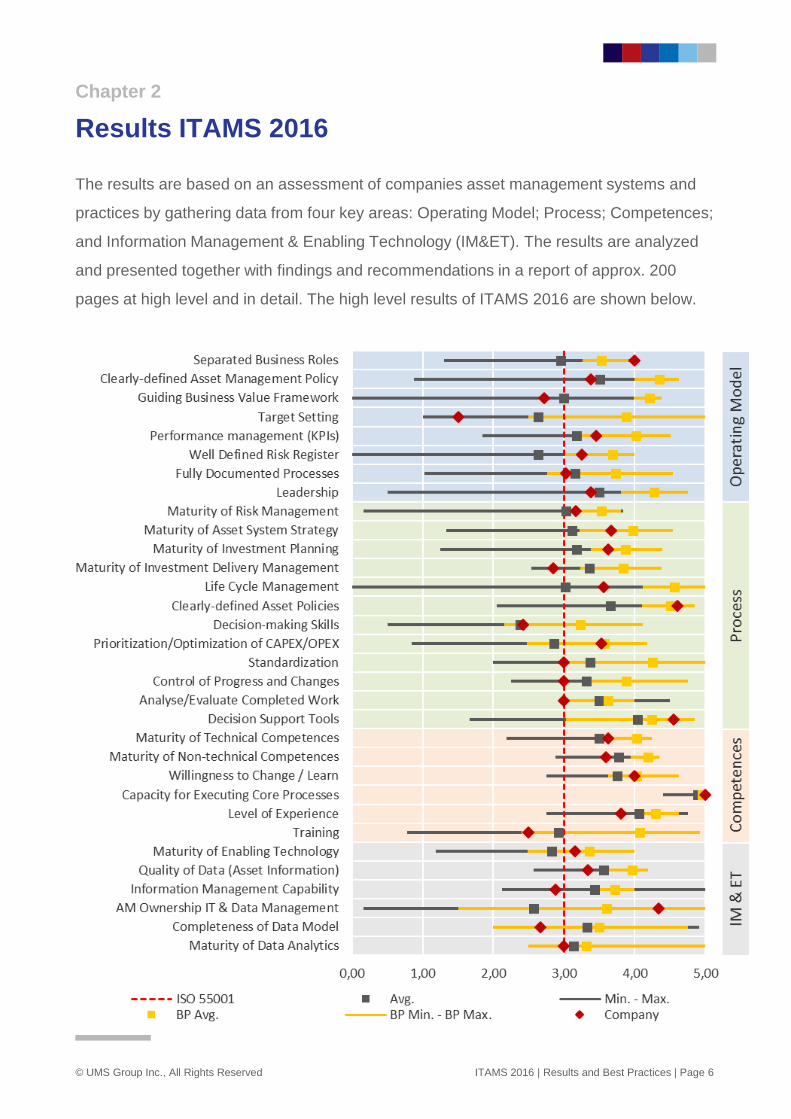
The results are based on an assessment of companies asset management systems and
practices by gathering data from four key areas: Operating Model; Process; Competences;
and Information Management & Enabling Technology (IM&ET). The results are analyzed
and presented together with findings and recommendations in a report of approx. 200
pages at high level and in detail. The high level results of ITAMS 2016 are shown below.
© UMS Group Inc., All Rights Reserved ITAMS 2016 | Results and Best Practices | Page 7
Chapter 2
The ITAMS maturity scale is aligned with the maturity scale used for assessing compliance
with the requirements of ISO55001. The scores for ‘Company’ indicate a high level of
compliance with the requirements of ISO 550001. The results (orange) of the overall four
best performers (BP) are plotted in the graph on top of the overall results (dark grey). By
comparing it can be easily determined which BP offers a best practice which might be
inspiring for further development. In some cases where the overall average (Avg.) is
substantially higher than the ‘ISO 55001’ level a best practice might be found at others as
well. Five of the participating companies are ISO 55001 certified of which three are BPs
indicating that certification according ISO 55001 pays off.
Major areas for improvement (Avg. below ‘ISO 55001’ level) are:
• Target Setting
• Well Defined Risk Register
• Decision-making Skills
• Prioritization/Optimization of CAPEX/OPEX
• Maturity of Enabling Technology
• AM Ownership of IT & Data Management
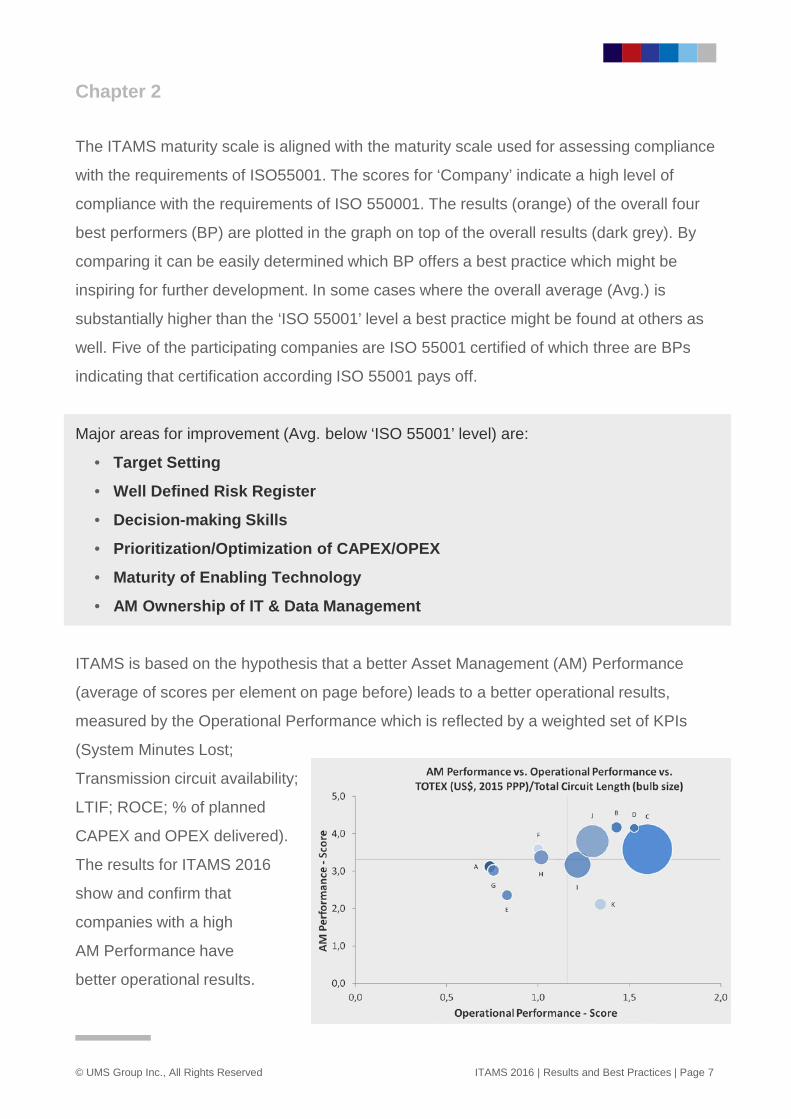
ITAMS is based on the hypothesis that a better Asset Management (AM) Performance
(average of scores per element on page before) leads to a better operational results,
measured by the Operational Performance which is reflected by a weighted set of KPIs
(System Minutes Lost;
Transmission circuit availability;
LTIF; ROCE; % of planned
CAPEX and OPEX delivered).
The results for ITAMS 2016
show and confirm that
companies with a high
AM Performance have
better operational results.
© UMS Group Inc., All Rights Reserved ITAMS 2016 | Results and Best Practices | Page 8
Chapter 3
ITAMS 2016 Conference, Dubai
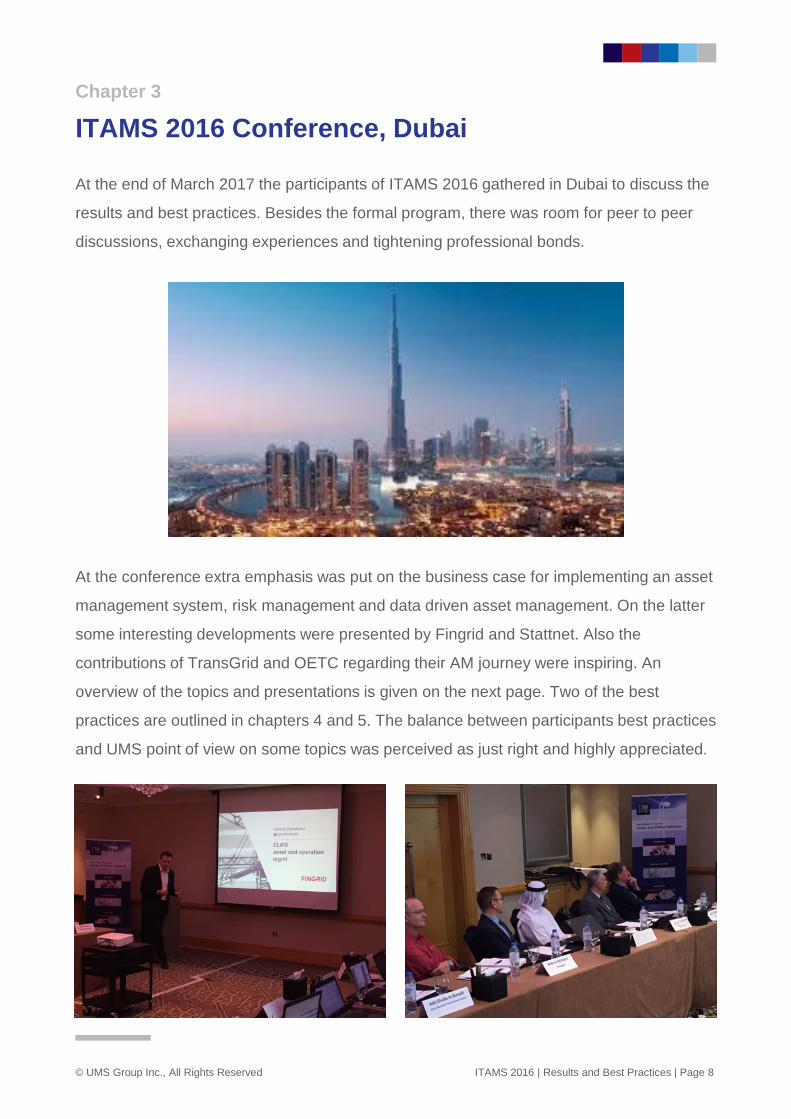
At the end of March 2017 the participants of ITAMS 2016 gathered in Dubai to discuss the
results and best practices. Besides the formal program, there was room for peer to peer
discussions, exchanging experiences and tightening professional bonds.
At the conference extra emphasis was put on the business case for implementing an asset
management system, risk management and data driven asset management. On the latter
some interesting developments were presented by Fingrid and Stattnet. Also the
contributions of TransGrid and OETC regarding their AM journey were inspiring. An
overview of the topics and presentations is given on the next page. Two of the best
practices are outlined in chapters 4 and 5. The balance between participants best practices
and UMS point of view on some topics was perceived as just right and highly appreciated.
© UMS Group Inc., All Rights Reserved ITAMS 2016 | Results and Best Practices | Page 9
Chapter 3
At the ITAMS 2016 Results Conference the following topics and best practices were
presented and discussed:
1. ITAMS 2016 High Level Results (UMS)
2. Organizational Developments
- Successful reorganizing the Asset Manager (TransGrid)
- Major developments (All)
3. Risk Management
- RM-tool SAM and interface with MBI (TERNA)
- Risk Management process OETC (OETC) - see chapter 5
- Risk Management from an international perspective (UMS)
4. IM & ET
- Data driven asset management. Is there a business case? (UMS)
- ELVIS Project (Fingrid) - see chapter 4
5. Maintenance Strategies
- Value driven maintenance (ELES)
- Maintenance 2021 project (Fingrid)
6. Interface with Internal SP(s)
- Peer review process Terna (TERNA)
- Practice per participant (All)
7. Business Case for implementing an AM System
- AM journey at OETC (OETC)
- The real value added by Asset Management (UMS)
8. Technical Innovations
- Mobile capturing device substation inspections (TransGrid)
- Use of drones for OHL inspection (GCCIA)
© UMS Group Inc., All Rights Reserved ITAMS 2016 | Results and Best Practices | Page 10
Chapter 4
Best Practice 1: ELVIS Project at Fingrid
Main goals
• Master Data - To have a system where Master Data would be in control and all available
data (+ external data resources) is usable for analytics. Single source for power system
information (one version of the truth). Data entered only ONCE into ONE system, other
systems uses this data.
• Integration - Combining asset management data with IoT (Internet of Things) generated
data. Enabling industry wide data analytics by integrating all business data. Able to tie
data to a physical location.
• Digitalization - A common platform for asset and operation management that will fulfill
today's and future needs From performance dashboards to on-line location based
heatmaps.
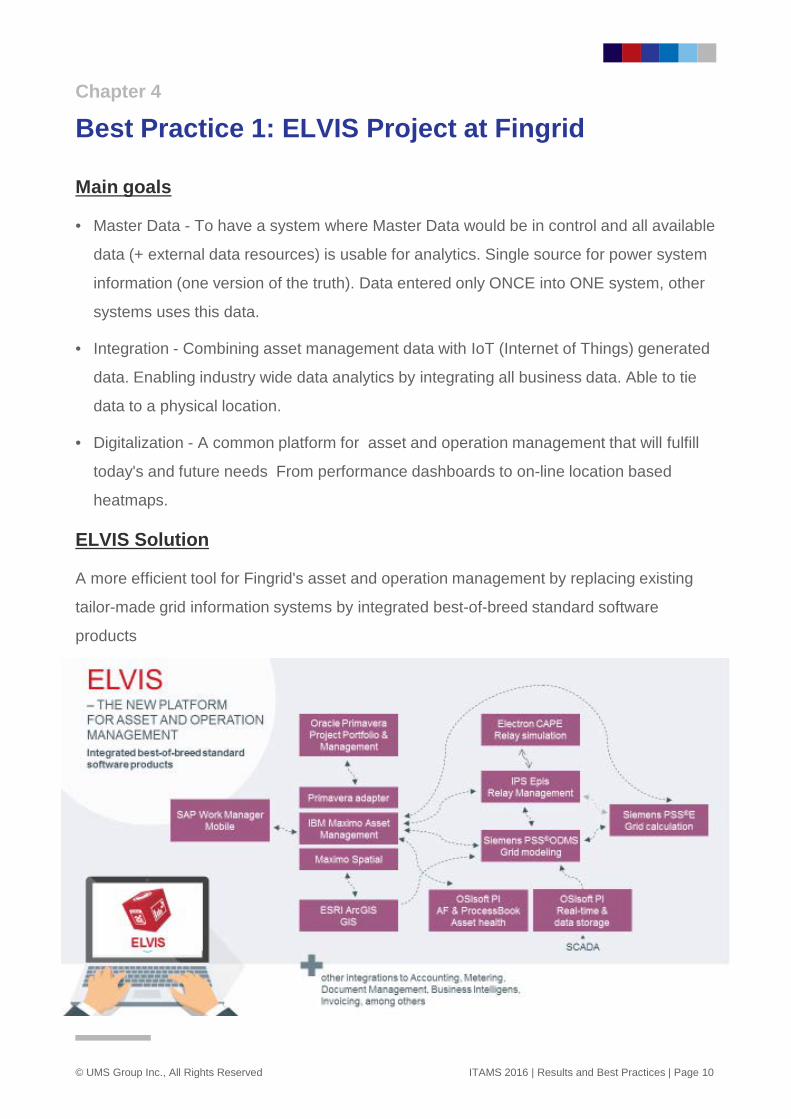
ELVIS Solution
A more efficient tool for Fingrid's asset and operation management by replacing existing
tailor-made grid information systems by integrated best-of-breed standard software
products
© UMS Group Inc., All Rights Reserved ITAMS 2016 | Results and Best Practices | Page 11
Chapter 4
Take outs
• ELVIS is part of the Asset Management strategy, not part of IT.
• Fundamental Architectural Strategies:
• Data should be entered once and distributed as needed;
• Standard software products should be used with a minimum of customization
required.
• Integration based on a Service Oriented Architecture, with the adoption of the IEC
Common Information Model (“CIM”) as the canonical data model.
• The consolidated data strategy ensures the high data quality that is the foundation for
any qualified decision making.
• The clue regarding business process optimization lies in seeing the big picture and
implementing a data sharing strategy. With better business process support and lots of
flexibility it is:
• Easier to calculate the value of the grid;
• Possible to make more accurate calculation and assessment of life-cycle costs;
• Easier and quicker to access relevant and updated information for Fingrid
personnel – centrally as well as in the field using mobile devices;
• Adapt to future developments and make use of Big Data.
• Cost and time intensive. (ELVIS contract was signed with IBM in 2012. ELVIS fully in
operation in 2016.)
• Any transmission or large distribution company aiming at optimizing processes across
GIS, enterprise asset management and electrical grid calculation / design should take a
look at the Fingrid ELVIS solution.
Videos about Elvis at Fingrid are on YouTube channel:
• https://youtu.be/gL4z-guklKM
• https://youtu.be/OwXrqIIBLzE
© UMS Group Inc., All Rights Reserved ITAMS 2016 | Results and Best Practices | Page 12
Chapter 5
Best Practice 2: Risk Management at OETC
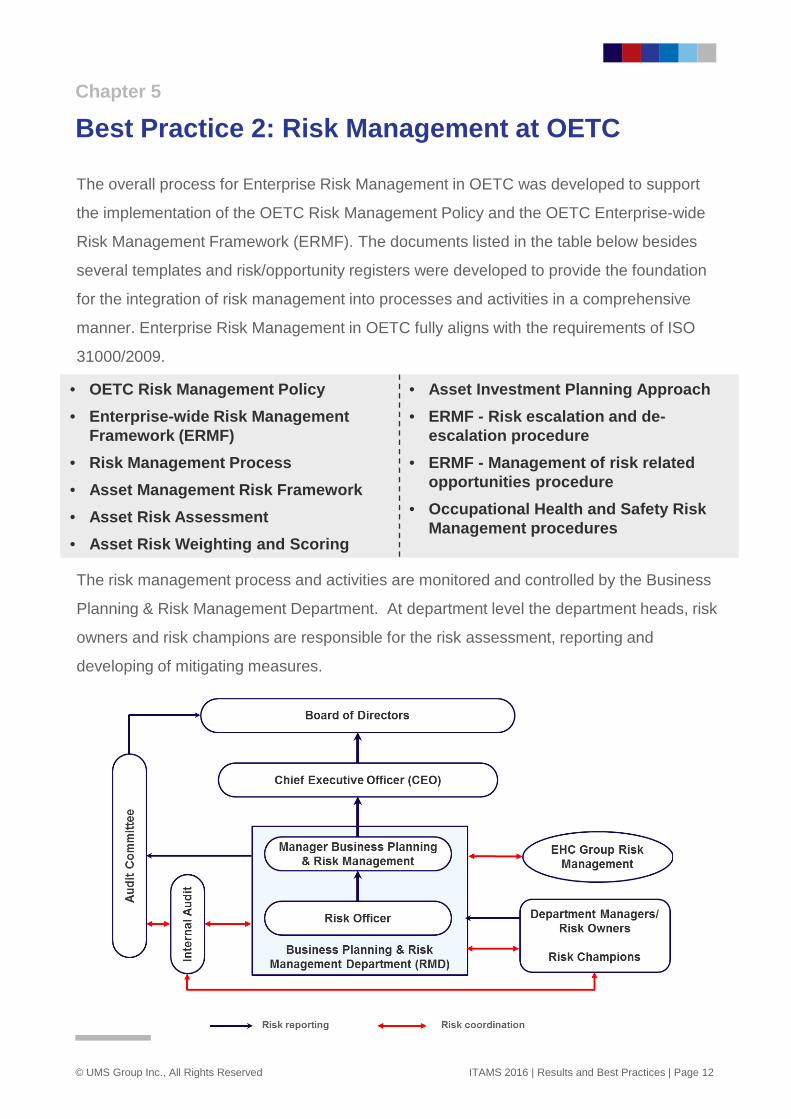
The overall process for Enterprise Risk Management in OETC was developed to support
the implementation of the OETC Risk Management Policy and the OETC Enterprise-wide
Risk Management Framework (ERMF). The documents listed in the table below besides
several templates and risk/opportunity registers were developed to provide the foundation
for the integration of risk management into processes and activities in a comprehensive
manner. Enterprise Risk Management in OETC fully aligns with the requirements of ISO
31000/2009.
The risk management process and activities are monitored and controlled by the Business
Planning & Risk Management Department. At department level the department heads, risk
owners and risk champions are responsible for the risk assessment, reporting and
developing of mitigating measures.
• OETC Risk Management Policy• Enterprise-wide Risk Management
Framework (ERMF)• Risk Management Process• Asset Management Risk Framework• Asset Risk Assessment• Asset Risk Weighting and Scoring
• Asset Investment Planning Approach• ERMF - Risk escalation and de-
escalation procedure• ERMF - Management of risk related
opportunities procedure• Occupational Health and Safety Risk
Management procedures
© UMS Group Inc., All Rights Reserved ITAMS 2016 | Results and Best Practices | Page 13
Chapter 5
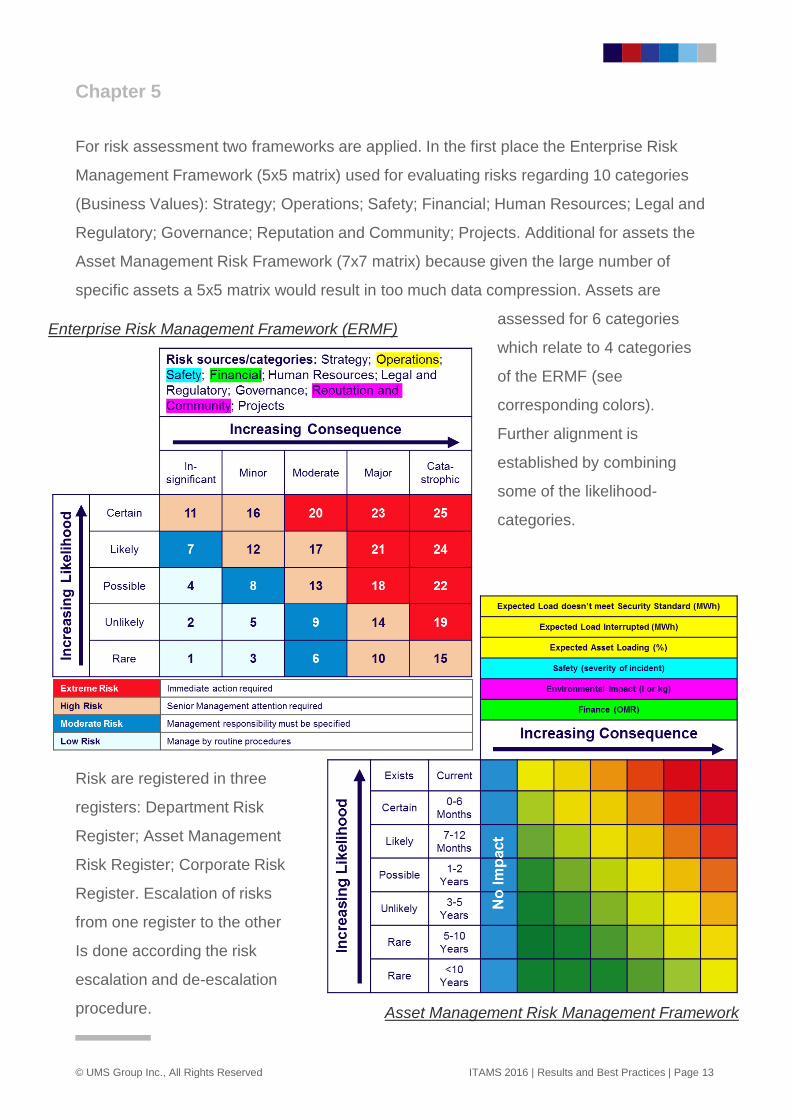
For risk assessment two frameworks are applied. In the first place the Enterprise Risk
Management Framework (5x5 matrix) used for evaluating risks regarding 10 categories
(Business Values): Strategy; Operations; Safety; Financial; Human Resources; Legal and
Regulatory; Governance; Reputation and Community; Projects. Additional for assets the
Asset Management Risk Framework (7x7 matrix) because given the large number of
specific assets a 5x5 matrix would result in too much data compression. Assets are
assessed for 6 categories
which relate to 4 categories
of the ERMF (see
corresponding colors).
Further alignment is
established by combining
some of the likelihood-
categories.
Risk are registered in three
registers: Department Risk
Register; Asset Management
Risk Register; Corporate Risk
Register. Escalation of risks
from one register to the other
Is done according the risk
escalation and de-escalation
procedure.
Enterprise Risk Management Framework (ERMF)
Asset Management Risk Management Framework
© UMS Group Inc., All Rights Reserved ITAMS 2016 | Results and Best Practices | Page 14
Chapter 5
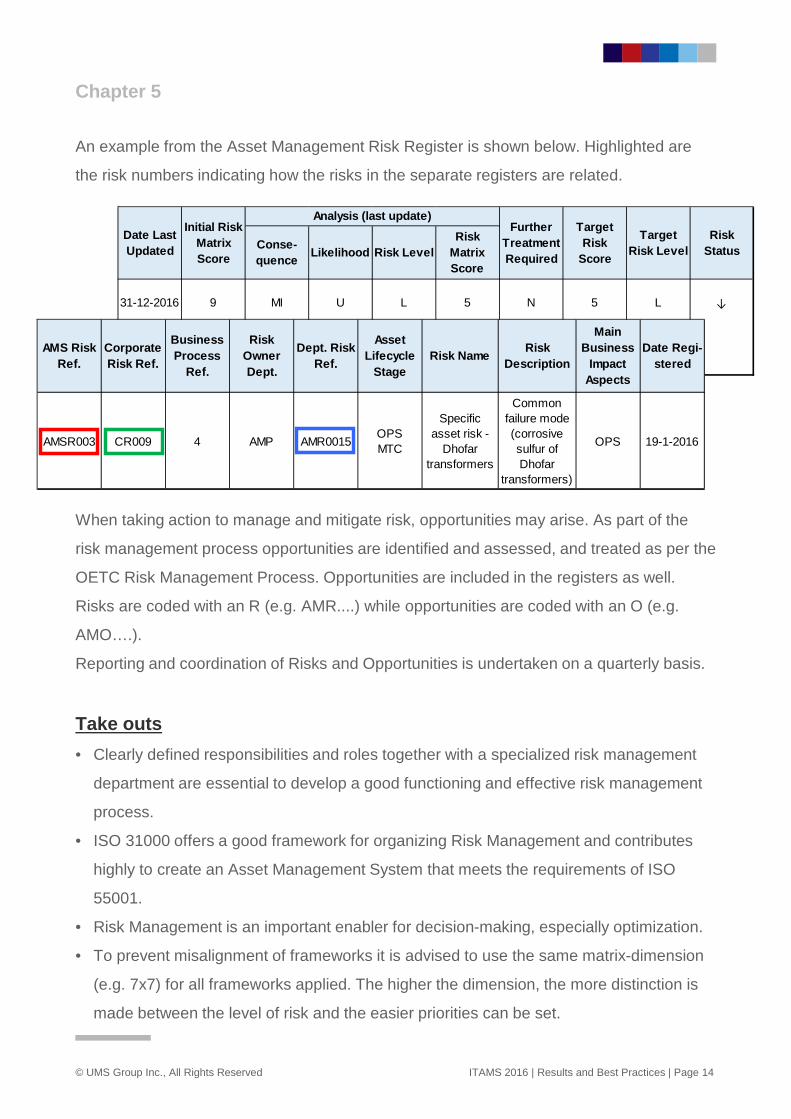
An example from the Asset Management Risk Register is shown below. Highlighted are
the risk numbers indicating how the risks in the separate registers are related.
When taking action to manage and mitigate risk, opportunities may arise. As part of the
risk management process opportunities are identified and assessed, and treated as per the
OETC Risk Management Process. Opportunities are included in the registers as well.
Risks are coded with an R (e.g. AMR....) while opportunities are coded with an O (e.g.
AMO….).
Reporting and coordination of Risks and Opportunities is undertaken on a quarterly basis.
Take outs• Clearly defined responsibilities and roles together with a specialized risk management
department are essential to develop a good functioning and effective risk management
process.
• ISO 31000 offers a good framework for organizing Risk Management and contributes
highly to create an Asset Management System that meets the requirements of ISO
55001.
• Risk Management is an important enabler for decision-making, especially optimization.
• To prevent misalignment of frameworks it is advised to use the same matrix-dimension
(e.g. 7x7) for all frameworks applied. The higher the dimension, the more distinction is
made between the level of risk and the easier priorities can be set.
Conse-quence Likelihood Risk Level
Risk Matrix Score
31-12-2016 9 MI U L 5 N 5 L ↓
Target Risk Level
Risk Status
Analysis (last update)Further
Treatment Required
Target Risk
Score
Initial Risk Matrix Score
Date Last Updated
AMSR003 CR009 4 AMP AMR0015 OPS MTC
Specific asset risk -
Dhofar transformers
Common failure mode (corrosive sulfur of Dhofar
transformers)
OPS 19-1-2016
AMS Risk Ref.
Corporate Risk Ref.
Business Process
Ref.
Risk Owner Dept.
Dept. Risk Ref.
Asset Lifecycle
StageRisk Name Risk
Description
Main Business
Impact Aspects
Date Regi-stered
© UMS Group Inc., All Rights Reserved ITAMS 2016 | Results and Best Practices | Page 15
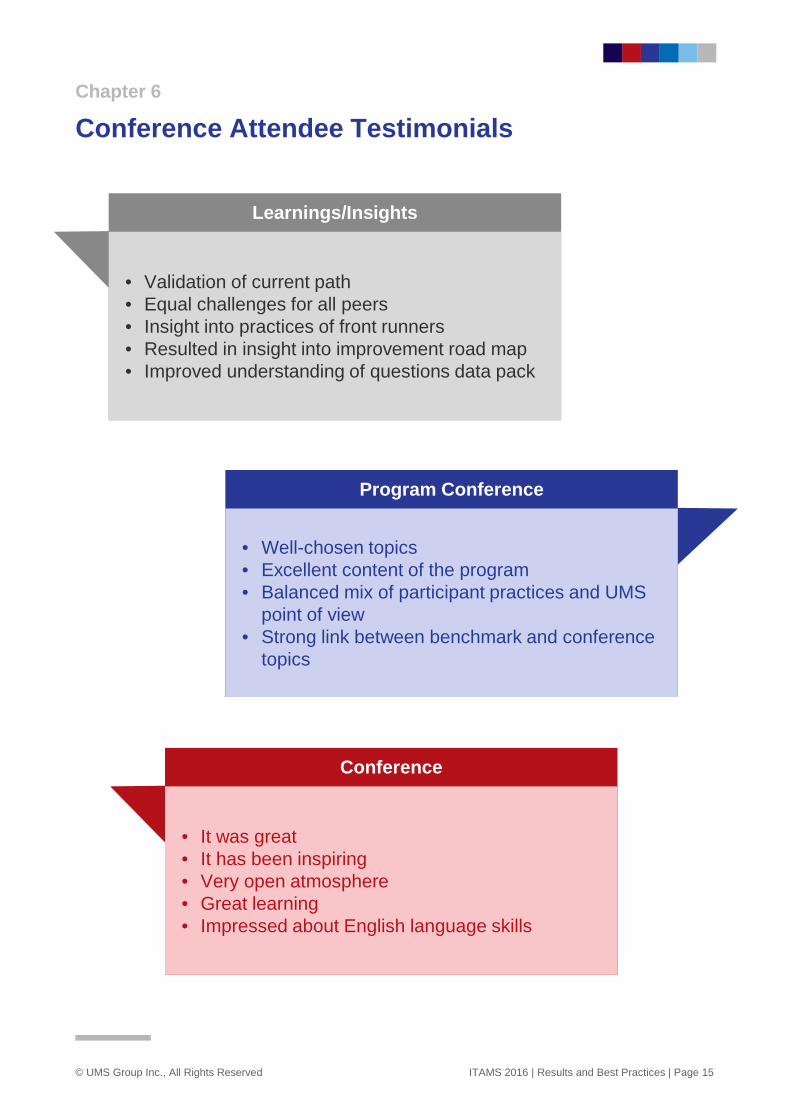
Chapter 6
Conference Attendee Testimonials
Learnings/Insights
• Validation of current path• Equal challenges for all peers• Insight into practices of front runners • Resulted in insight into improvement road map• Improved understanding of questions data pack
Program Conference
• Well-chosen topics• Excellent content of the program• Balanced mix of participant practices and UMS
point of view• Strong link between benchmark and conference
topics
Conference
• It was great• It has been inspiring• Very open atmosphere• Great learning• Impressed about English language skills
© UMS Group Inc., All Rights Reserved ITAMS 2016 | Results and Best Practices | Page 16
Chapter 7
Major Take Outs ITAMS 2016
There is no “right” structure or model for organizing asset management. For most
companies, of the three distinct roles, the Asset Manager role (decision-making) and
Service Provider role (execution) are clearly separated. Not all companies have a
dedicated Asset Owner role which might compromise the alignment of the asset
management strategy and business strategy. Good outcomes require clear roles,
governance and system integration. Management systems (incl. the asset management
system) need to adapt to suit organization and not be implemented just for certification.
The diversity of applied risk matrices illustrate that risk management is still not
acknowledged as major part of decision-making. Integrating risk management in the
decision-making process (risk-based asset management) offers the possibility to determine
threats that really needs solving before starting to develop solutions. Also the process of
prioritizing and optimizing of the asset plans benefits from a well aligned risk matrix.
Although MS-Excel is still broadly applied, the developments at Fingrid and Stattnet show
the way forward. New technologies (IoT, drones, etc.) offer new cost effective ways of
gathering data and new ways of integrating IT-systems for storing and processing this
data. Data Driven Asset Management seems to become the new focus area for TSOs.
Evident is, that implementing these technologies and systems is part of the Asset
Management strategy, not part of IT. This requires new skills for processing and analyzing
the huge amount of data this development creates.
ITAMS 2016 was great learning experience again. ITAMS is an excellent way to serve a
company’s ambition to learn from others and illustrate their excellence to the board and
certifying authorities. The current participants underpin the great value of benchmarking
their asset management practice and sharing this. Therefore they would like to invite more
TSOs to join ITAMS.
© UMS Group Inc., All Rights Reserved ITAMS 2016 | Results and Best Practices | Page 17
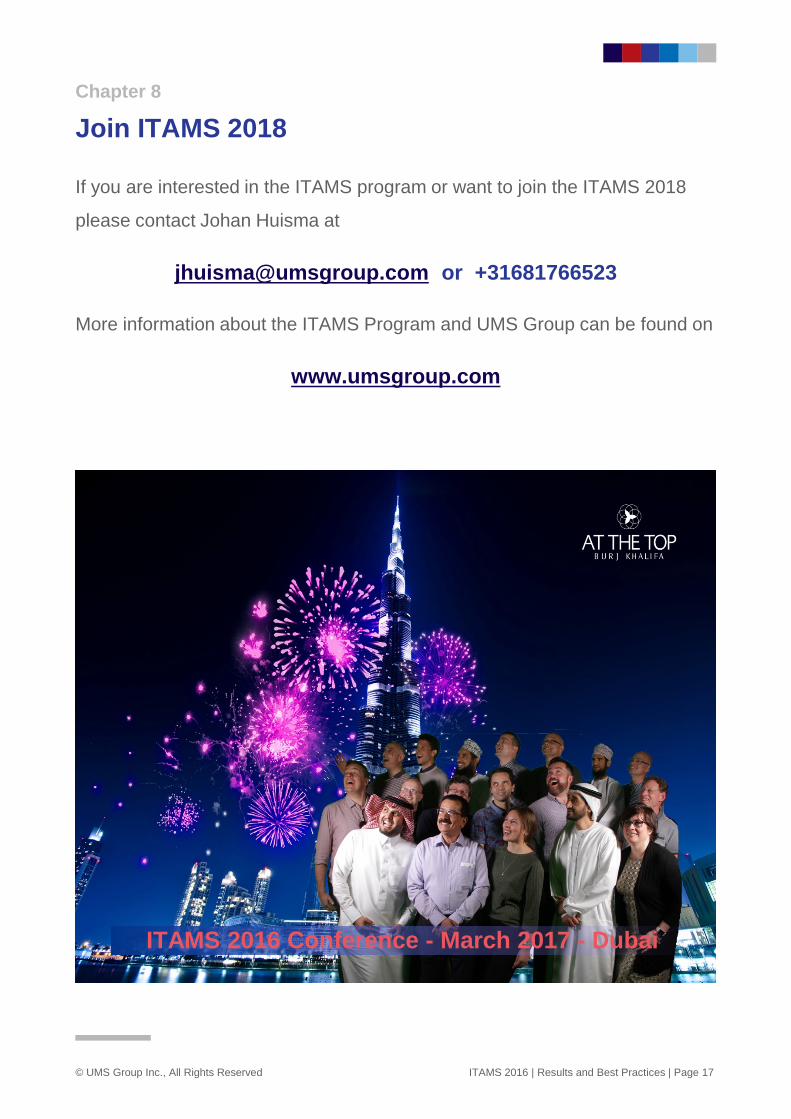
Chapter 8
Join ITAMS 2018
If you are interested in the ITAMS program or want to join the ITAMS 2018
please contact Johan Huisma at
[email protected] or +31681766523
More information about the ITAMS Program and UMS Group can be found on
www.umsgroup.com
ITAMS 2016 Conference - March 2017 - Dubai