Asset Management in the UK 2010-2011 The IMA Annual Survey · 2019-05-08 · managed by IMA...
106
Asset Management in the UK 2010-2011 The IMA Annual Survey
Transcript of Asset Management in the UK 2010-2011 The IMA Annual Survey · 2019-05-08 · managed by IMA...

Asset Management in the UK 2010-2011The IMA Annual Survey
revsurvey 1:IMASurvey201011 22/07/2011 17:27 Page a

© Investment Management Association (2011). All rights reserved.No reproduction without permission of IMA.
Investment Management Association65 KingswayLondon WC2B 6TDUnited Kingdom
Tel: +44 (0)20 7831 0898Fax: +44 (0)20 7831 9975
www.investmentuk.org
July 2011
revsurvey 1:IMASurvey201011 22/07/2011 17:27 Page b
1
Contents
About the Survey 5
Survey Foreword 6
Key Statistics 9
Key Interview Findings 11
1. Overview of the UK Asset Management Industry 13Key Findings 13Total Assets Under Management 14
Assets and funds 15Wider Industry 16Client Type 17Assets and Markets 19Overall Asset Allocation 20
Equity allocation 21Fixed income allocation 22
Evolution of Industry Focus 23Improving Client Trust 26
2 UK Institutional Market 29Key Findings 29Overview of UK Institutional Data 30Overview of Third Party Institutional Business 31
Asset allocation 31Active vs passive 33Segregated vs pooled 35Multi-asset vs specialist 36
Outlook for the UK Institutional Market 38
3. UK Funds Market 40Key Findings 40Total Funds Under Management 41
Flows vs performance 42Asset mix 43
Retail Investor Behaviour 44Drivers of behaviour 44ISAs 46
Asset class choices 47Bond fund sales 47Recovery of risk appetite 48Index tracker funds 50Ongoing move towards absolute return 51Property funds 51Popularity of balanced funds and funds of funds 52Ethical funds 54Newly launched funds 54
Offshore-Domiciled Funds Distributed in the UK 55Distribution Dynamics and their Implications 55UK Industry Concentration and Structure 56
Measuring concentration 58The European Context 60
Contents
revsurvey 1:IMASurvey201011 22/07/2011 17:27 Page 1

2
Investment Management Association
4. Operational and Structural Issues 62Key Findings 62Revenue and Costs 63Performance Fees 63Employment 65Ownership, Consolidation and Concentration 68
Emergence of standalone asset managers 69Overall industry concentration 71
Regulatory Environment 73Four regulatory concerns 75Impact of RDR 77
5. The International Dimension 79Key Findings 79Four Dimensions 80
Overseas clients 80Overseas-headquartered firms 82Overseas domicile of funds 82Overseas management of assets 83
The UK in a Comparative Context 83Fund management 84
Current Outlook for Location Decisions 86Erosion of traditional advantages 88Risks to new investment 89
6. Market Interaction and the Impact of MiFID 90Key Findings 90Equity Trading 92
Execution-only trades 93Use of brokers 93Use of equity CFDs 94
Corporate Bond Trading 94Use of agency broking 94
Derivative Trades 95Collateral 95Central clearing of OTC derivatives 96
Impact of MiFID 97Execution policies 97Publication of equity trade data 98Cost of trading 99
Compliance with GIPS 99
Appendix One: Assets Under Management in the UK 100
Appendix Two: UK Institutional Market 102
Appendix Three: Survey Respondents 104
Appendix Four: Firms Interviewed 106
revsurvey 1:IMASurvey201011 22/07/2011 17:27 Page 2

3
Index of Charts, Tables and Figures
Index of Charts, Tables and Figures
Charts
Chart 1: Top ten firms by UK and global assets under management 15Chart 2: Total assets under management in the UK and in UK-authorised funds (2005 – 2010) 15Chart 3: Proportion of survey respondents managing different asset classes in the UK 16Chart 4: Assets managed in a range of UK fund vehicles (2009 – 2010) 17Chart 5: Assets managed in the UK by client type 17Chart 6: Assets managed in the UK by client type (2005 – 2010) 18Chart 7: Equity market movements (2008 – 2010) 19Chart 8: Asset manager assessment of general conditions in fixed income markets (2008 – 2010) 20Chart 9: Overall asset allocation of UK-managed assets (2007 – 2010) 20Chart 10: Equity allocation of UK-managed assets by region (2006 – 2010) 21Chart 11: Fixed income allocation of UK-managed assets by type and region (2008 – 2010) 22Chart 12: UK institutional market by client type 30Chart 13: UK institutional mandates by asset type 31Chart 14: UK pension fund mandates by asset type 31Chart 15: Specialist equity allocation by client type 32Chart 16: Specialist fixed income allocation by client type 33Chart 17: Active and passive mandates by institutional client type 34Chart 18: Segregated and pooled mandates by client type 35Chart 19: Segregated and pooled mandates among UK pension funds 35Chart 20: Specialist and multi-asset mandates by client type 36Chart 21: Industry funds under management (2000 – 2010) 41Chart 22: Funds under management as percentage of GDP (1960 – 2010) 41Chart 23: Changes in funds under management by total net sales vs performance (1993 – 2010) 42Chart 24: Funds under management by fund/asset type 43Chart 25: Quarterly net retail sales as percentage of retail funds under management vs household
savings ratio (Q4 1986 – 2010) 44Chart 26: Quarterly net retail sales as percentage of retail funds under management vs
Bank of England base rate (Q4 1986 – 2010) 44Chart 27: Net retail sales vs sales as percentage of gross household disposable income (1960 – 2010) 45Chart 28: Quarterly retail funds under management vs funds as percentage of total gross financial assets
of the household sector (2005 – 2010) 45Chart 29: Net ISA sales (1999 – 2010) 46Chart 30: Net retail sales of bond funds (1992 – 2010) 47Chart 31: Annual net retail sales of UK and non-UK equity funds (1992 – 2010) 48Chart 32: Net retail sales of tracker funds by index investment type (2003 – 2010) 50Chart 33: Funds under management of tracker funds by index investment type (2003 – 2010) 50Chart 34: Monthly net retail sales of absolute return funds vs absolute return funds
as percentage of total funds under management (2008 – 2010) 51Chart 35: Net retail sales of property funds vs IPD UK All Property Index (Jan 1992 – 2010) 51Chart 36: Net retail sales of balanced funds and funds of funds (1998 – 2010) 52Chart 37: Net retail sales of fettered and unfettered funds of funds (1992 – 2010) 53Chart 38: Ethical net retail sales and funds under management (1992 – 2010) 54Chart 39: Net retail sales of newly launched funds by fund/asset type 54Chart 40: Estimated average holding period of retail investors (2004 – 2010) 56Chart 41: Top ten UK fund companies by total funds under management (2009 – 2010) 56Chart 42: Top ten UK fund companies by retail funds under management (2009 – 2010) 57Chart 43: Combined market share of top firms by funds under management (1995 – 2010) 57Chart 44: Fund operator net retail sales 58Chart 45: Combined market share of top funds by funds under management (1995 – 2010) 59Chart 46: Combined market share of top funds by gross sales (1995 – 2010) 59Chart 47: Breakdown of UCITS funds under management by fund domicile 60Chart 48: Net sales of UCITS by asset class as percentage of total UCITS funds under
management, selected countries 61
revsurvey 1:IMASurvey201011 22/07/2011 17:27 Page 3

4
Investment Management Association
Chart 49: Net sales of equity funds per capita, UK and Europe ex UK (2001 – 2010) 61Chart 50: Industry net revenue vs revenue and costs as percentage of average assets under
management (2006 – 2010) 63Chart 51: Industry headcount estimate (2006 – 2010) 65Chart 52: Percentage breakdown of respondents by total staff size (direct employment only) 65Chart 53: Ownership of asset management firms by UK assets under management (2003 – 2010) 69Chart 54: Firm ranking by UK assets under management (June 2010) 71Chart 55: Market share of largest firms by UK assets under management (June 2003 – June 2010) 71Chart 56: Percentage change in UK-managed assets across 19 IMA boutique firms (June 2009 – June 2010) 72Chart 57: Overseas client assets as percentage of firm assets under management in the UK (2006 – 2010) 80Chart 58: UK assets under management by region of parent group headquarters (2007 – 2010) 82Chart 59: Comparative asset growth, Hong Kong, Singapore, UK (2003 – 2009) 84Chart 60: Fund assets by domicile, Ireland, Luxembourg, UK (2000 – 2010, projected to 2014) 85Chart 61: Total number of funds by domicile, Ireland, Luxembourg, UK (2000 – 2010) 85
TablesTable 1: Net retail sales by fund type (2009 – 2010) 47Table 2: Net retail sales and total funds under management among equity sectors (2009 – 2010) 49Table 3: Net retail sales of balanced funds by sector (2009 – 2010) 52Table 4: Mean and median fund sizes (2001 – 2010) 59Table 5: Proportion of firms using performance fees (2008 – 2010) 63Table 6: Proportion of assets under management subject to performance fees 64Table 7: Use of performance fees in retail products (2008 – 2010) 64Table 8: Change over past year and expectation of future use of performance fees 64Table 9: Distribution of staff by activity (direct employment only) 66Table 10: Proportion of respondents outsourcing part of their activity (2007 – 2010) 67Table 11: Major M&A deals in the UK asset management sector (2009 –2010 vs 2010 – 2011) 68Table 12: Assets managed in the UK by IMA firm size 71Table 13: Proportion of equity trades directed on an execution-only basis 93Table 14: Number of brokers used for the majority of trades 93Table 15: Proportion of overall single-issuer equity exposure coming through the use of single equity CFDs 94Table 16: Proportion of bond trading conducted with agency brokers 94Table 17: Liquidity provision by market makers 94Table 18: Collateral demands on firms 95Table 19: Exchange of independent amounts 95Table 20: Central clearing of OTC derivatives 96Table 21: Negotiation of ISDA terms 96Table 22: Transaction cost analysis 97Table 23: Clients asking for detail of execution policy and compliance demonstration 97Table 24: Brokers asked for execution policies 98Table 25: Post-trade transparency after MiFID implementation 98Table 26: Impact of MiFID on the cost of trading 99Table 27: Compliance with GIPS 99
FiguresFigure 1: IMA member characteristics 14Figure 2: Wider asset management industry 16Figure 3: Key themes four years on 23Figure 4: Potential opportunities in the DC pensions environment 25Figure 5: International dimensions of the UK asset management industry 80Figure 6: Assets under management in Europe (December 2009) 83Figure 7: European investment funds by country of domicile 84Figure 8: Five views from across the industry (2006 – 2011) 87
revsurvey 1:IMASurvey201011 22/07/2011 17:27 Page 4

5
About the Survey
About the Survey
The survey focuses on asset management activity inthe UK on behalf of domestic and overseas clients.The results are based on the questionnaire responsesof 76 IMA member firms, who between them manage£3.3trn in this country (85% of total UK assetsmanaged by IMA members).
We also conducted in-depth interviews with 30 seniorfigures from 23 IMA member firms. Their views arereflected both in the commentary and in the directquotations, reproduced on an anonymous basisthroughout the survey.
The survey is in six main chapters:
1 Overview of the UK Asset ManagementIndustry
2 UK Institutional Market
3 UK Funds Market
4 Operational and Structural Issues
5 The International Dimension
6 Market Interaction and the Impact of MiFID
A summary of the findings can be found in AppendixOne and Appendix Two. Questionnaire respondentsare listed in Appendix Three and firms interviewed inAppendix Four.
A number of general points should be noted:
Unless otherwise specified, all references to ‘assetsunder management in the UK’ refer to UK assetsunder management by IMA members as atDecember 2010.
Unless otherwise specified, the IMA survey andinternal databases are the source of all data cited.
Not all respondents have been able to provideinformation for all questions and not all questionshave been answered on the same basis. Responserates, therefore, differ across questions.
The survey has been designed with comparability tothe previous survey in mind. However, even wherefirms replied in both years, some may haveresponded to a question last year but not this yearor vice versa. Where meaningful comparisons arepossible, they have been made.
The IMA would like to express its gratitude to memberfirms who provided detailed questionnaire information,as well as to the individuals who gave their time forinterviews.
revsurvey 1:IMASurvey201011 22/07/2011 17:27 Page 5

6
Investment Management Association
The IMA’s annual survey is the most comprehensiveaccount of the UK investment management industry.Our ninth annual survey’s findings are based uponquestionnaire responses from 76 IMA member firms(between them managing £3.3 trn in the UK) and in-depth interviews with 30 senior figures from 23 IMAmember firms.
An industry in good shape...
Some two years after the deepest phase of the creditcrisis, it is clear that the industry has come throughrelatively unscathed. Assets under management are ata record £3.9 trillion (see Chapter One), while industryrevenues have recovered, and are now exceeding pre-crisis levels.
Since our first survey in 2002, assets undermanagement have doubled, notwithstanding subduedinvestment returns. The FTSE 100 index rose only 27per cent over that period, for example. The growth istherefore primarily the result of inflows from clients, athird of whom are outside the UK. At the same time,the industry has continued to evolve: in ownershipterms it is increasingly independent of banking andinsurance, while retaining its un-concentrated andcompetitive overall structure.
The UK retail funds industry had another strong year in2010, with net inflows at their second highest level onrecord, following 2009, and many retail investorsdisplaying an increasingly global outlook. Overall,authorised funds experienced retail inflows of £60 billionover these two years and saw total funds undermanagement increase by 60% to a total of £579 billion.
...but facing challenges
Despite this positive commercial performance, theindustry faces challenges. Although revenues arebuoyant, many of those we interviewed are consciousof the growing appetite for index-tracking funds,increasingly in the form of exchange-traded funds, aswell as the growing importance of platformintermediaries. Both developments could haveimplications for industry business models in the future.
Many of our interviewees believe that ten years of highlyvolatile stock market returns and a huge credit crisis inthe Western world have left some investors nervousand distrustful of financial markets. In the retail fundsmarket, we have seen strong inflows into managed andabsolute return funds. And our interviews revealedgrowing interest from institutional investors in multi-asset strategies, although as Chapter Two shows,single-asset mandates still predominate.
Survey Foreword
Richard SaundersChief Executive
revsurvey 1:IMASurvey201011 22/07/2011 17:28 Page 6

7
Survey Foreword
How to respond?
Against this background, firms are seeking to fosterinvestor trust and confidence. The majority ofmanagers we spoke to believe that association withproblems in the banking sector has contributed to adecline in trust among the industry’s clients. But firmsbelieve there is more that the industry itself should bedoing.
This is why many managers are actively seeking tofocus on meeting specific client needs by movingtowards more outcome-oriented products andstrategies (see Chapters One and Two). It is worthhighlighting three such themes:
Liability matching strategies for defined benefitpension funds and other clients. Assets subject to aliability-driven mandate are continuing to growstrongly.
Default fund strategies within defined contributionpension schemes, which aim to provide appropriateasset allocation strategies for scheme memberswhich evolve over time.
Funds which aim to provide constrained levels ofrisk for clients, particularly retail investors, such asabsolute return products.
Through a greater emphasis on areas such as assetallocation and an approach based upon specific clientneeds, many interviewees felt this could mark thebeginnings of a renewed relationship with end clients.
International competitiveness
Over the last few years we have tracked growingconcern that the many advantages enjoyed by the UKas a location for an investment management businessmay be eroding. We heard this even more strongly thisyear (see Chapter Five).
Several of those we interviewed said that massiveimprovements in communications and a shiftingbalance of global economic power were making thecase for a global “cluster” for asset management lesscompelling. And, importantly for an industry drawingon talent globally, a lack of certainty about the stabilityof the fiscal, regulatory and immigration regimes couldundermine the UK’s position relative to otherjurisdictions.
Nobody expects this to result in an exodus ofestablished firms from London. But several memberssuggested that we could see more marginal decisionsabout incremental investment go against the UK infuture. Just as mutual fund domiciles have migrated toDublin and Luxembourg, so we may see other suchmoves over time. This is something to which the UKGovernment needs to be alert.
Regulation from Europe...
Regulation has risen significantly up the list of industrypreoccupations. This is recognised as inevitable in thewake of the credit crisis, and indeed to some extentwelcome. But concerns are growing about the volumeand appropriateness of new regulation that is affectingthe industry, much of it originating from the EU.
Frequently cited is the Alternative Investment FundManagers Directive, which sought to tackle theregulation of hedge funds and private equity funds. Notonly was their role in the credit crisis marginal, but thedirective also brought a wide variety of other fundstructures within its scope. Indeed, the importance ofhedge funds is frequently overstated – the assetsmanaged by IMA member firms at the end of 2010were three times those of the global hedge fundindustry.
revsurvey 1:IMASurvey201011 22/07/2011 17:28 Page 7

8
Investment Management Association
The impact of the first wave of EU legislation, the lastdecade’s “Financial Services Action Plan”, has beendecidedly mixed. For example, the Markets in FinancialInstruments Directive was intended, among otherthings, to improve competitiveness in equity tradingmarkets. But the majority of members reported that inpractice the result has been a decrease in post-tradetransparency and no reduction in trading costs (seeChapter Six).
When we conducted our interviews for this survey, theindustry was facing the prospect of some 20 differentlegislative measures from Europe over the coming twoyears. This will have significant impact on firms’operating environment.
...and from the UK
The Financial Service Authority’s Retail DistributionReview is the main current proposal for UK-originatedregulation affecting the industry. Investment managerssupport the Review’s objectives of a more transparentand consumer-friendly market, but our industry hasconcerns about whether this would indeed be theoutcome. Some feared that the fund managementindustry might be put at a competitive disadvantage tolife insurers. And there was widespread agreement thatmiddle and lower income groups would find it moredifficult to access advice in the future.
A further challenge will be the impact of the legislationexpected later this year to replace the FSA with twonew regulators, the Financial Conduct Authority and thePrudential Regulation Authority. This will inevitablyresult in further disruption as relationships withregulators undergo a fundamental change.
One group that may be disproportionately affected bythe regulatory agenda is smaller specialist firms.Investment management has always had relatively lowbarriers to entry: with no requirement for large amountsof capital, investment managers are in essence muchmore akin to non-financial service sector businessesthan to financial firms like banks. But someinterviewees suggested that the increasing regulatoryrequirements could start to provide more significantbarriers to entry than in the past, ultimately perhapsdriving greater consolidation.
Conclusion
While the industry has ridden through the financial crisiswell, it finds itself at a strategic crossroads and themood among firms is generally reflective. The growingneed for individuals to take responsibility for their ownretirement provision continues to create an attractivelong term prospect for the industry. But evolving clientpreferences, a difficult market environment andchanging regulation at both UK and EU levels arecombining to present firms with new strategicchallenges, which they will have to face up to in orderto grasp potential opportunities.
Richard SaundersChief Executive, Investment Management AssociationJuly 2011
revsurvey 1:IMASurvey201011 22/07/2011 17:28 Page 8
9
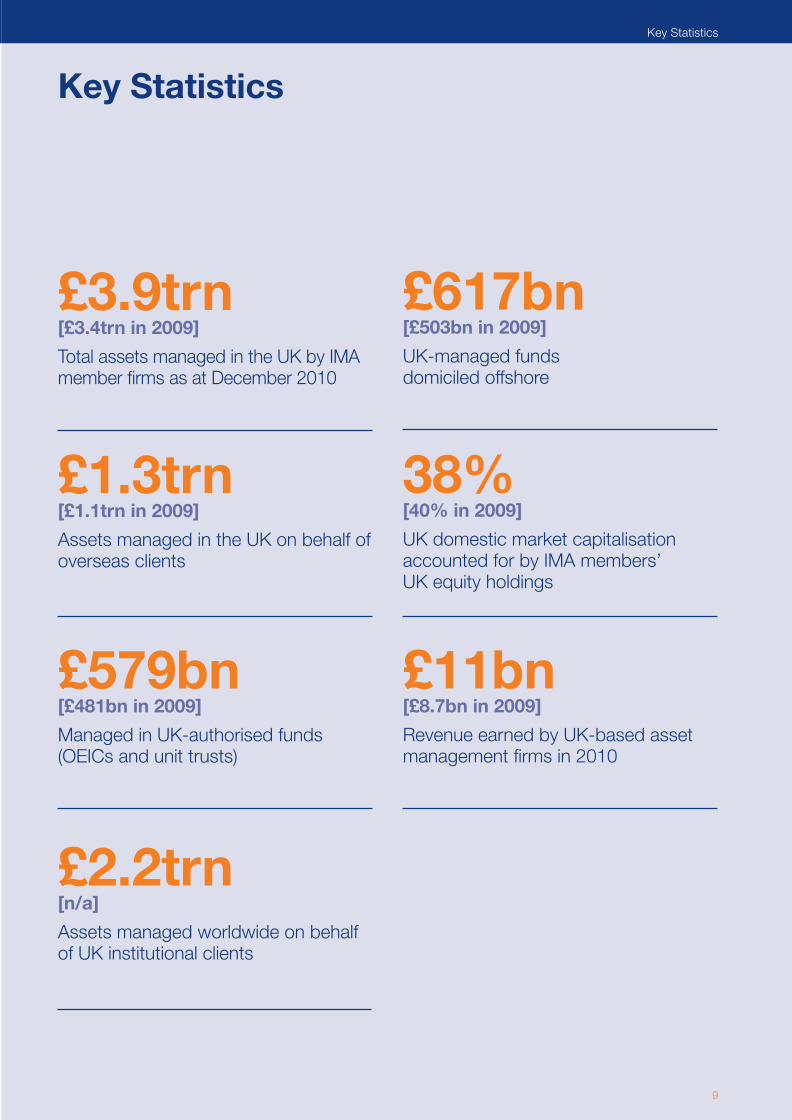
Key Statistics
£3.9trn[£3.4trn in 2009]
Total assets managed in the UK by IMAmember firms as at December 2010
£1.3trn[£1.1trn in 2009]
Assets managed in the UK on behalf ofoverseas clients
£579bn[£481bn in 2009]
Managed in UK-authorised funds(OEICs and unit trusts)
£617bn[£503bn in 2009]
UK-managed funds domiciled offshore
38%[40% in 2009]
UK domestic market capitalisationaccounted for by IMA members’ UK equity holdings
£11bn[£8.7bn in 2009]
Revenue earned by UK-based assetmanagement firms in 2010
Key Statistics
£2.2trn[n/a]
Assets managed worldwide on behalfof UK institutional clients
revsurvey 1:IMASurvey201011 22/07/2011 17:28 Page 9
11
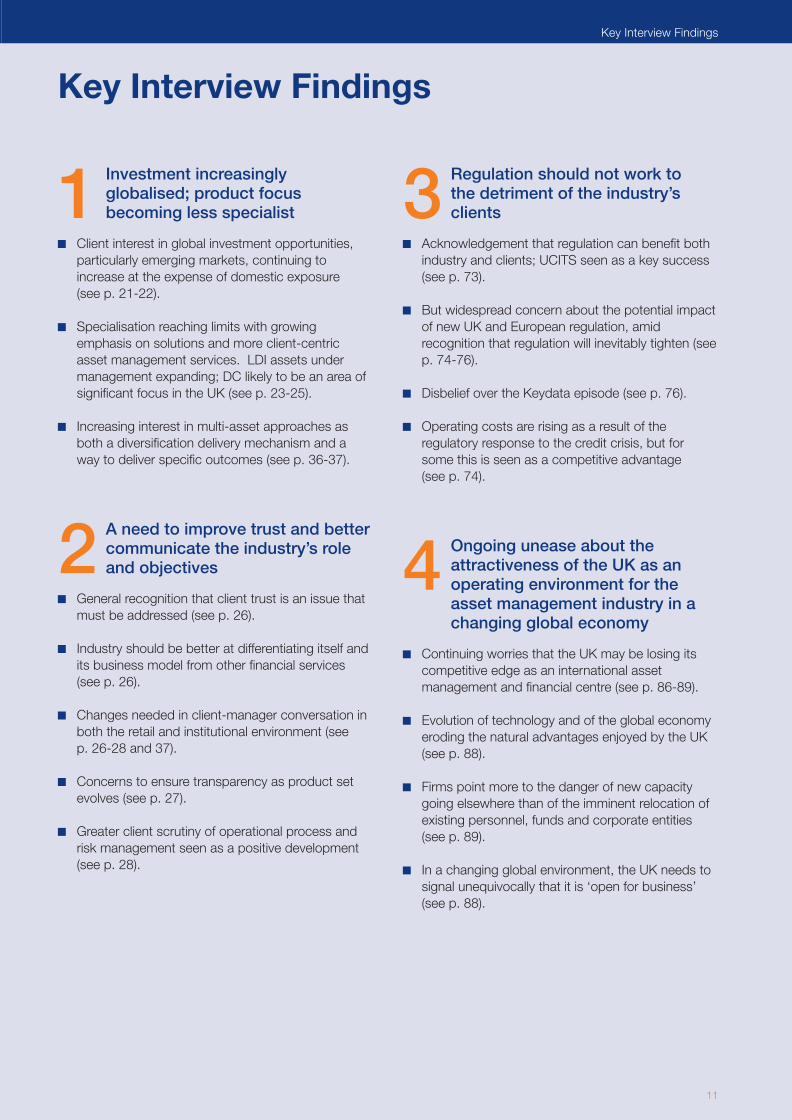
Key Interview Findings
Key Interview Findings
1 Investment increasingly globalised; product focus becoming less specialist
Client interest in global investment opportunities,particularly emerging markets, continuing toincrease at the expense of domestic exposure (see p. 21-22).
Specialisation reaching limits with growingemphasis on solutions and more client-centricasset management services. LDI assets undermanagement expanding; DC likely to be an area ofsignificant focus in the UK (see p. 23-25).
Increasing interest in multi-asset approaches asboth a diversification delivery mechanism and away to deliver specific outcomes (see p. 36-37).
2 A need to improve trust and bettercommunicate the industry’s roleand objectives
General recognition that client trust is an issue thatmust be addressed (see p. 26).
Industry should be better at differentiating itself andits business model from other financial services(see p. 26).
Changes needed in client-manager conversation inboth the retail and institutional environment (see p. 26-28 and 37).
Concerns to ensure transparency as product setevolves (see p. 27).
Greater client scrutiny of operational process andrisk management seen as a positive development(see p. 28).
3 Regulation should not work to the detriment of the industry’s clients
Acknowledgement that regulation can benefit bothindustry and clients; UCITS seen as a key success(see p. 73).
But widespread concern about the potential impactof new UK and European regulation, amidrecognition that regulation will inevitably tighten (seep. 74-76).
Disbelief over the Keydata episode (see p. 76).
Operating costs are rising as a result of theregulatory response to the credit crisis, but forsome this is seen as a competitive advantage (see p. 74).
4 Ongoing unease about the attractiveness of the UK as an operating environment for the asset management industry in a changing global economy
Continuing worries that the UK may be losing itscompetitive edge as an international assetmanagement and financial centre (see p. 86-89).
Evolution of technology and of the global economyeroding the natural advantages enjoyed by the UK(see p. 88).
Firms point more to the danger of new capacitygoing elsewhere than of the imminent relocation ofexisting personnel, funds and corporate entities(see p. 89).
In a changing global environment, the UK needs tosignal unequivocally that it is ‘open for business’(see p. 88).
revsurvey 1:IMASurvey201011 22/07/2011 17:28 Page 11

Overall size and location
Assets managed in the UK by all IMA member firmstotalled £3.9trn as at December 2010, a rise of17% from 2009. Total assets under managementwere boosted by a sharp rise in UK-authorisedfunds under management,1 which rose 20% year-on-year to £579bn.
Including a range of non-IMA firms (principallyhedge funds, private equity funds and discretionaryprivate client asset managers), we estimate totalassets under management in the UK at £4.4trn.
Client type
Institutional assets under management in the UKaccount for just under 78% of the total, with retailrepresenting 21%. Private client money accountsfor 1.6% of total assets under management.
The largest institutional client type by the size of UKassets under management is pension funds (34%),followed by insurance companies (24%).
Overall asset allocation
Of the £3.9trn under management by IMA firms,46% was invested in equities, 36% in bonds, 9% incash/money market instruments and 4% inproperty. The remaining 6% largely represents arange of alternative asset classes and liability-driveninvestment (LDI) strategies.
Allocation to UK equities continued to decrease to43% of the total (compared with 47% in 2009),which represents 38% of the UK domestic marketcapitalisation. Emerging market equity continuedits growth, now representing almost 10% of theentire equity allocation.
Evolution of industry focus
Interviews suggest greater attention being paid tospecific client needs, which firms strive to meet byadopting increasingly different approaches toproduct design and delivery.
Product transparency and client communicationseen as key to improving trust in the industry.
13
Overview of the UK Asset Management Industry
1. Overview of the UK Asset Management Industry
Key Findings
1 UK-authorised funds refer to UK-authorised unit trusts and open-ended investment companies (OEICs).
1
revsurvey 1:IMASurvey201011 22/07/2011 17:28 Page 13

14
Investment Management Association
1. Overview of the UK Asset Management Industry
The UK is a leading asset management centre, with theindustry serving a wide range of domestic and overseasclients. The majority of activity is concentrated inLondon, but there is also a significant Scottish cluster.
Although many asset management firms developedhistorically as part of larger financial institutions, such asbanks or insurance companies, the industry uses a verydistinct business model. It provides services to retail,institutional and private client investors on an agencybasis, with a clear separation between operatingcompanies and assets.
Total Assets Under Management
Investment services are provided in two broad ways:through a variety of pooled vehicles, which commingleassets from different investors, and through segregatedmandates, where a client’s assets are managedseparately.
This survey captures all aspects of the industry’s assetmanagement activity. Total assets under managementin the UK by IMA members were £3.9trn at the end ofDecember 2010, up 17% from a year earlier and 30%above the levels seen in 2008.
The £3.9trn covers assets managed by IMA membersin this country for both UK and overseas clients (seeFigure 1). This includes:
All in-house and third party client assets.
All segregated mandates.
All pooled vehicles, including authorised unit trusts,OEICs, unauthorised investment vehicles (eg.unauthorised unit trusts) and life funds.
Within the UK, we estimate that 14% of total assets(£550bn) are managed in Scotland, primarily inEdinburgh. Like their counterparts based in other partsof the UK, a number of Scottish asset managementfirms also have significant overseas operations.
As we discuss further in Chapter Five, overseas clients account for one-third of total assets managed inthe UK.
Looking at the largest firms (see Chart 1 overleaf), thetop ten as at December 2010 continue to becharacterised by three features:
There is a marked contrast between a number ofglobal players with very large overseas operationsand those firms whose asset management activity isconcentrated primarily in the UK.
The three largest firms in the UK are distinguishedby a significant beta capability through their indexingbusinesses. However, their range of activities goeswell beyond this and they should not be definedsolely in these terms.
Despite the rise in significance of autonomous assetmanagement firms (see p. 69), only two of the topten firms are fully independent asset managers(BlackRock and Schroders). The other eight belongto insurance companies or retail, investment orcustodian banks.
Figure 1: IMA member characteristics
IMA members fall into five general categories:
Asset management firms with a sizeable globalfootprint themselves, or which are part of firmswith such a footprint. Such firms undertake awide range of asset management activities acrossthe institutional and retail market space and tendto have considerable overseas client money undermanagement in the UK.
Large and medium-sized firms, whose business isprimarily UK/Europe-focused and which offer adiverse range of services.
Firms whose business is primarily based oninvestment funds.
Smaller asset management firms, which may bespecialist boutiques or focused on the privateclient market.
Occupational Pension Scheme (OPS) managersrunning in-house asset management operations.
revsurvey 1:IMASurvey201011 22/07/2011 17:28 Page 14

15
Overview of the Asset Management Industry
Assets and funds
Chart 2 shows the progress of assets undermanagement since December 2005. It includes one ofthe most important sub-components: the UK-domiciled investment funds industry (authorised unittrusts and OEICs), which represents 15% of totalassets under management, the highest proportionrecorded since the survey began.
As we explore further in Chapter Three, one particularlynotable feature of 2009-2010 was the spectaculargrowth in UK-domiciled funds under management,rising by one fifth year-on-year to a record £579bn atthe end of December 2010. This was partly a reflectionof asset mix and market movements, but also resultsfrom significant inflows.
Within the survey, we refer to assets undermanagement as a ‘catch-all’ term covering all forms ofmanagement activity, both funds and segregatedmandates. Where we are referring specifically to UK-authorised funds (unit trusts and OEICs), we use theterm funds industry.
Chart 2: Total assets under management in the UK andin UK-authorised funds (2005 – 2010)
£bn
UK-Authorised FundsTotal UK Assets Under Management
2005 2006 2007 2008 2009 20100
500
1,000
1,500
2,000
2,500
3,000
3,500
4,000
Chart 1: Top ten firms by UK and global assets under management
Insight Investment
Schroder Investment Management
Standard Life Investments
Aviva Investors
JP Morgan Asset Management
Scottish Widows Investment Partnership
M&G Investments
State Street Global Advisors
Legal & General Investment Management
BlackRock Investment Management
£bn
■ UK Assets Under Management ■ Global Assets Under Management
0 500 1,000 1,500 2,000 2,500
2,302
530
354
342
1,284
198
188
193
838
161
260
142
146
141
157
132
197
128
108
108
1
revsurvey 1:IMASurvey201011 22/07/2011 17:28 Page 15
16
Investment Management Association
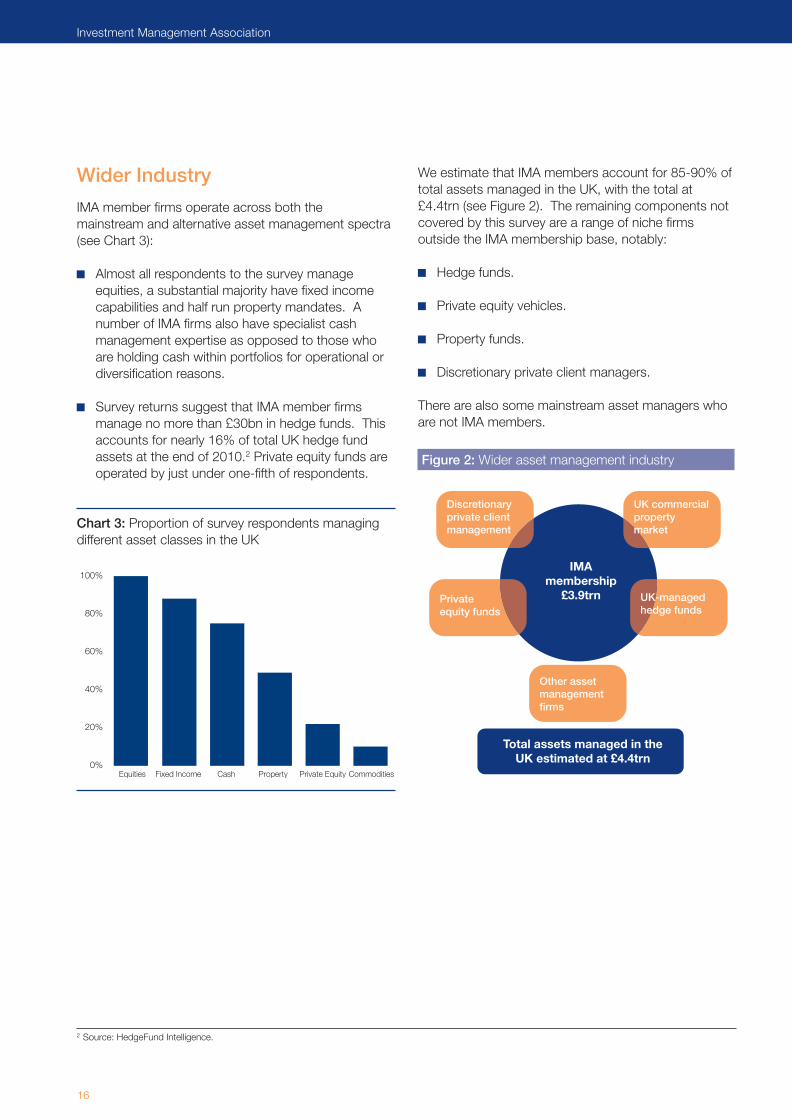
Wider Industry
IMA member firms operate across both the mainstream and alternative asset management spectra(see Chart 3):
Almost all respondents to the survey manageequities, a substantial majority have fixed incomecapabilities and half run property mandates. Anumber of IMA firms also have specialist cashmanagement expertise as opposed to those whoare holding cash within portfolios for operational ordiversification reasons.
Survey returns suggest that IMA member firmsmanage no more than £30bn in hedge funds. Thisaccounts for nearly 16% of total UK hedge fundassets at the end of 2010.2 Private equity funds areoperated by just under one-fifth of respondents.
Chart 3: Proportion of survey respondents managingdifferent asset classes in the UK
We estimate that IMA members account for 85-90% oftotal assets managed in the UK, with the total at£4.4trn (see Figure 2). The remaining components notcovered by this survey are a range of niche firmsoutside the IMA membership base, notably:
Hedge funds.
Private equity vehicles.
Property funds.
Discretionary private client managers.
There are also some mainstream asset managers whoare not IMA members.
Equities Fixed Income Cash Property Private Equity Commodities0%
20%
40%
60%
80%
100%
Figure 2: Wider asset management industry
IMAmembership£3.9trn
Discretionaryprivate clientmanagement
UK commercial property market
Private equity funds
UK-managed hedge funds
Total assets managed in theUK estimated at £4.4trn
Other assetmanagementfirms
2 Source: HedgeFund Intelligence.
revsurvey 1:IMASurvey201011 22/07/2011 17:28 Page 16
17
Overview of the Asset Management Industry
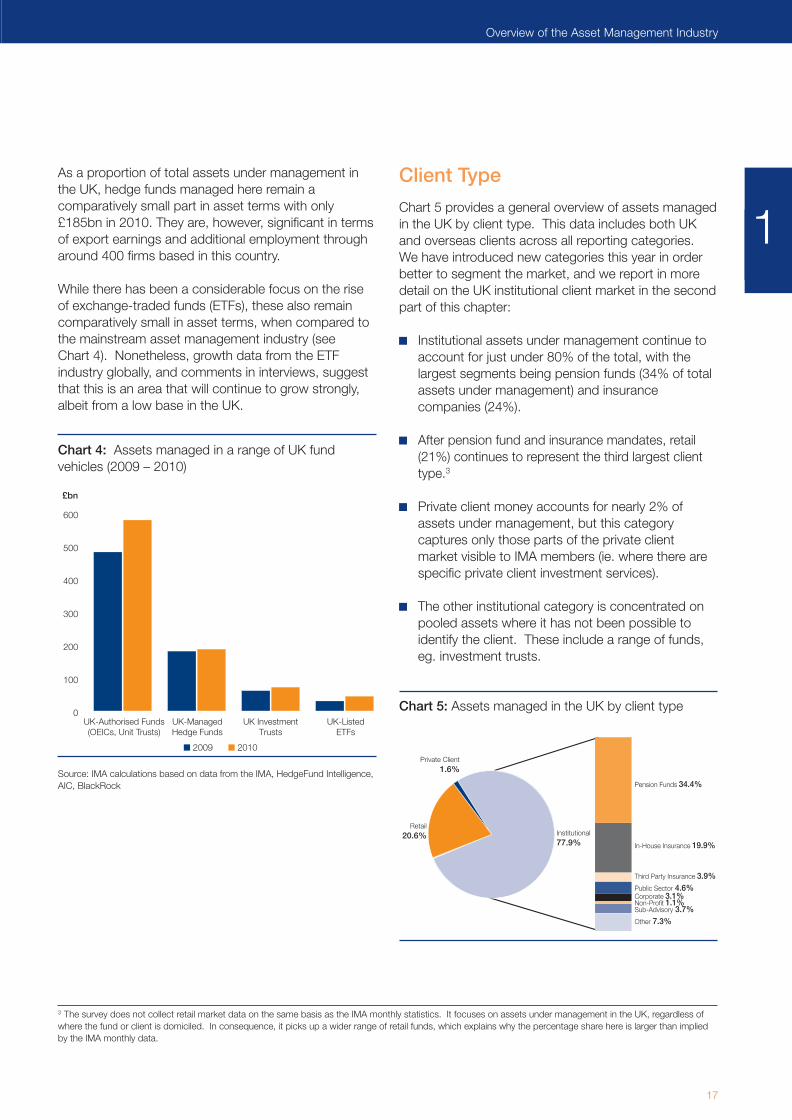
As a proportion of total assets under management inthe UK, hedge funds managed here remain acomparatively small part in asset terms with only£185bn in 2010. They are, however, significant in termsof export earnings and additional employment througharound 400 firms based in this country.
While there has been a considerable focus on the riseof exchange-traded funds (ETFs), these also remaincomparatively small in asset terms, when compared tothe mainstream asset management industry (see Chart 4). Nonetheless, growth data from the ETFindustry globally, and comments in interviews, suggestthat this is an area that will continue to grow strongly,albeit from a low base in the UK.
Chart 4: Assets managed in a range of UK fundvehicles (2009 – 2010)
Source: IMA calculations based on data from the IMA, HedgeFund Intelligence,AIC, BlackRock
Client Type
Chart 5 provides a general overview of assets managedin the UK by client type. This data includes both UKand overseas clients across all reporting categories.We have introduced new categories this year in orderbetter to segment the market, and we report in moredetail on the UK institutional client market in the secondpart of this chapter:
Institutional assets under management continue toaccount for just under 80% of the total, with thelargest segments being pension funds (34% of totalassets under management) and insurancecompanies (24%).
After pension fund and insurance mandates, retail(21%) continues to represent the third largest clienttype.3
Private client money accounts for nearly 2% ofassets under management, but this categorycaptures only those parts of the private clientmarket visible to IMA members (ie. where there arespecific private client investment services).
The other institutional category is concentrated onpooled assets where it has not been possible toidentify the client. These include a range of funds,eg. investment trusts.
Chart 5: Assets managed in the UK by client type0
100
200
300
400
500
600
£bn
■ 2009 ■ 2010
UK-Managed UK Investment UK-Listed Hedge Funds Trusts ETFs
UK-Authorised Funds(OEICs, Unit Trusts)
Private Client1.6%
Retail20.6% Institutional
77.9%
Pension Funds 34.4%
In-House Insurance 19.9%
Third Party Insurance 3.9%Public Sector 4.6%Corporate 3.1%Non-Profit 1.1%Sub-Advisory 3.7%Other 7.3%
3 The survey does not collect retail market data on the same basis as the IMA monthly statistics. It focuses on assets under management in the UK, regardless ofwhere the fund or client is domiciled. In consequence, it picks up a wider range of retail funds, which explains why the percentage share here is larger than impliedby the IMA monthly data.
1
revsurvey 1:IMASurvey201011 22/07/2011 17:28 Page 17

18
Investment Management Association
Chart 6 shows the split by client type since 2005 whenthe IMA started to collect the data in this specificformat. These are headline numbers and thereforesubject to some sample fluctuation. Nonetheless, theyare highly representative of the industry and twofeatures of the historic progression are quite striking:
1. Rise in ‘other institutional’ categories. Theproportion accounted for by the ‘other institutional’category has increased steadily in recent years. Thisappears to reflect a number of factors. To some extent,there has been a broadening of the asset managementindustry’s international client base beyond traditionalinstitutional categories (pension funds and insurancecompanies). Internationally, opportunities for third partyasset managers are becoming ever more extensive,both in the corporate and public or quasi-public sector(see p. 80).
There is also increasing use of pooled vehicles byinstitutional clients, driven by a variety of factors,notably:
The move into passive, where different forms ofpooled vehicles can be accessed.
Openness to specialists who may operate primarilythrough pooled vehicles. A number of firmspreviously associated more with the retailenvironment have in recent years reportedinstitutional business in areas of excellence.
The rise of multi-manager products, where the endclient may be retail, but the relationships betweenmanagers and sub-managers are essentiallyinstitutional.
Points two and three are a particular feature of thewider trend towards the blurring of the retail andinstitutional markets.
Chart 6: Assets managed in the UK by client type (2005 – 2010)
100%
90%
80%
70%
60%
50%
40%
30%
20%
10%
0%
revsurvey 1:IMASurvey201011 22/07/2011 17:28 Page 18

19
Overview of the Asset Management Industry
2. Fall in proportion of insurance assets. From justunder 31% in 2005, the proportion of assets undermanagement for insurance companies has fallensignificantly over the past five years. These assets areprimarily run for life insurance parent companies andinclude products such as life funds and annuities.
Looking back on the data in terms of total assets undermanagement, the decline is relative rather thanabsolute. Figures from 2005 suggest total insuranceassets under management by IMA members of£852bn, rising to £934bn in 2010 (an increase of 10%).Meanwhile, pension fund assets managed in the UKincreased from £973bn to £1,355bn (39%) and theother institutional category, discussed above, doubledfrom £385bn to £779bn (102%).
Assets and Markets
The key theme running through 2010 was uncertaintyabout the direction of the global economy, despite twostrong years for equity markets since the lows of thefirst quarter of 2009:
Over the course of 2010, the FTSE All-Share rose11% in capital return terms and almost 15% in totalreturn terms (see Chart 7).
Average stock market levels were 21% higher forthe FTSE All-Share, which was positively reflected inindustry revenue.
International equity market indices also rosestrongly, with notable gains in emerging markets,albeit at a slower pace than in 2009. The FTSE All-World Emerging Markets index rose 21%, havinggained almost 60% over 2009.
In the fixed income markets, corporate bondsperformed less strongly than in 2009, with the IMAsterling corporate bond sector returning 7% overthe year (14% a year earlier). However, with interestrates remaining low and inflation concernspersisting, the ‘hunt for yield’ remains an ongoingtheme in investor behaviour (see also ChapterThree, p. 44)
Chart 7: Equity market movements (2008 – 2010)
Source: Lipper IM (calculated on a capital return basis)
-60%
-50%
-40%
-30%
-20%
-10%
0%
30%
20%
10%
Jan-
08
May
-08
Sep
-08
Jan-
09
May
-09
Sep
-09
Jan-
10
May
-10
Sep
-10
Dec
-10
FTSE All-Share FTSE AW Emerging Market FTSE World (ex UK)
1
revsurvey 1:IMASurvey201011 22/07/2011 17:28 Page 19

As this survey went to press in the summer of 2011,there were very mixed signals for the likely outcome forthis year. Chart 8 shows data from an internal IMAsurvey of senior fund managers in the fixed incomemarkets, mainly focused on sterling and euro corporatebonds. The survey started in early 2008, withmanagers asked to rank conditions on a scale of up to10, where this level represents pre-crisis marketconditions.
Last year saw a sharp recovery through the secondhalf, after an unstable first half during which emergingfears about the sovereign credit crisis caused banks tounwind risk on their balance sheets. While 2011started well, there are signs that the index is starting tofalter as worries intensify once again over Europeansovereign credit, particularly in Greece.
Chart 8: Asset manager assessment of generalconditions in fixed income markets (2008 – 2010)
Source: IMA
Overall Asset Allocation
The overall mix of assets managed in the UK at the endof 2010 is shown in Chart 9, which also shows theprogression from 2007:
The changes in 2007-2008 were consistent with ashift out of equities towards fixed income, cash andLDI products.4 This appeared to result both fromongoing trends in institutional behaviour and a ‘flightto safety’ response, reflected in the rise in cashholdings.5
The 2008-2009 changes are less pronounced andmore consistent with aggregate market movementsthan significant shifts in overall client assetallocations.
In 2009-2010, the changes are consistent with amovement out of cash, but also further movement,or at least rebalancing out of equities to the benefitof fixed income. While there is evidence that thisreflects further adjustments in UK pension fundclient behaviour, it is difficult to draw firmconclusions from aggregate data based on a rangeof client assets managed from this country, andtherefore influenced by many different parts ofdiverse international markets.
Chart 9: Overall asset allocation of UK-managed assets(2007 – 2010)
-2
-1
0
1
2
3
4
5
6
7
8
Jan-
08
Feb-
08
Apr
-08
Jun-
08
Aug
-08
Oct
-08
Dec
-08
Feb-
09
Apr
-09
Jun-
09
Aug
-09
Oct
-09
Dec
-09
Feb-
10
Apr
-10
Jun-
10
Aug
-10
Oct
-10
Dec
-10
10 = Pre-crisis conditions
Man
ager
Ass
essm
ent
of
Mar
ket
Co
nditi
ons
Eurozonesovereigndebt crisis
Collapse ofLehmanBrothers
0%
10%
20%
30%
40%
50%
60%
2007 2008 2009 2010
■ Equities ■ Bonds ■ Cash ■ Property ■ Other
20
Investment Management Association
4 Given that we are not recording new money flows, such observations are based on asset returns applied to matched samples from year to year. The findings musttherefore be treated with considerable caution. It should also be remembered that this data contains both UK and overseas investors and is therefore not indicativeof any individual geographically-defined client market.5 The cash category includes money market funds.
revsurvey 1:IMASurvey201011 22/07/2011 17:28 Page 20

21
Overview of the Asset Management Industry
Equity allocation
The equity split by region is shown in Chart 10. Moststriking in recent years has been the decline withinequity holdings of UK equities, as the erosion of homebias by UK institutions and retail investors hascontinued. Holdings are significantly smaller than twodecades ago when UK pension funds and insurancecompanies accounted for a large proportion of the totalUK equity market (41% in 1999, compared to 26% in2008).6
The proportion of UK equities relative to the overallbasket of equities has fallen again during 2010. Fouryears ago, UK equities represented close to 60% oftotal equities managed in the UK. This figure has nowdropped to 43%. We estimate that IMA members nowaccount for just over 38% of UK domestic stock marketcapitalisation, equating to £768bn.
6 Source: Office for National Statistics, Share Ownership Survey 2008.
1
Chart 10: Equity allocation of UK-managed assets by region (2006 – 2010)
100%
90%
80%
70%
60%
50%
40%
30%
20%
10%
0%
2006 2007 2008 2009 2010
■ UK 59.2% 51.4% 46.2% 47.1% 42.6%
■ Europe (ex UK) 16.2% 18.1% 20.6% 17.0% 19.9%
■ North America 12.1% 14.8% 15.6% 13.7% 15.1%
■ Pacific (ex Japan) 04.8% 05.8% 05.2% 08.1% 07.3%
■ Japan 04.3% 04.7% 05.8% 04.7% 04.3%
■ Emerging Markets 01.8% 04.3% 06.0% 08.4% 09.7%
■ Other 01.7% 00.9% 00.6% 01.0% 01.1%
revsurvey 1:IMASurvey201011 22/07/2011 17:28 Page 21

indu
stryview
Looking back to 2006, the other striking feature ofequities managed in the UK has been the increasingproportion of emerging market and Pacific (ex Japan)equities. A number of UK managers will also berunning emerging market and Pacific mandates outsidethe UK, particularly in Hong Kong and Singapore.
Major shift to emerging markets
We have seen, both among UK clients andelsewhere around the world, the appetite foremerging market equity and debt continuing togrow strongly. There is a very strong mood tomake larger and more explicit allocations toemerging markets. This is no longer about a smallproportion of assets – to have 2-3% optionally –but about a strategic asset allocation, alsoevidenced by people increasingly saying that theywill benchmark performance against ACWI (AllCountry World Index) rather than traditionaldeveloped markets.
All financial asset structures are susceptible tobubbles and it’s entirely possible that we’ll get abubble in emerging markets. But the fundamentaldifference is that people now recognise that interms of geo-political and economic realities, thelevel of wealth creation and need for wealthpreservation in emerging market economies isdramatically larger and more sustainable than itwas in previous times.
Fixed income allocation
In terms of fixed income, the overall allocation isillustrated in Chart 11. The majority is sterlinginvestment, with government and index-linked bondsaccounting for 37% of the total.8 As a proportion oftotal gilts (including index-linked) in issue, thisrepresents 53%.9 The fall in gilt holdings relative toindex-linked over the past two years is particularlynotable. Equally notable is the increase in UKcorporate bond holdings since 2008, although as aproportion of overall fixed income managed in the UK,UK corporate bonds fell back in 2010.
Chart 11: Fixed income allocation of UK-managedassets by type and region (2008 – 2010)7
“
”
100%
90%
80%
70%
60%
50%
40%
30%
20%
10%
0%
2008 2009 2010
■ UK Government (ex Index-Linked) 26.1% 22.7% 21.3%
■ UK Corporate Bond 35.5% 39.9% 37.4%
■ UK Index-Linked 12.9% 12.9% 15.5%
■ Other UK 02.5% 03.1% 01.8%
■ Overseas Bond 23.1% 21.5% 24.0%
22
Investment Management Association
7 Earlier data is not available due to a change in reporting. 8 With large insurance-owned asset managers strongly represented in the respondent sample, the implied gilt (incl. index-linked) holdings may over-state the trueposition. The same is true of UK corporate debt holdings.9 Based on market values net of Government holdings as at December 2010.
revsurvey 1:IMASurvey201011 22/07/2011 17:28 Page 22

23
Overview of the Asset Management Industry
1Evolution of Industry Focus
In our 2006 Survey, a year before the onset of the creditcrisis, we pointed to eight key long-term trends in theindustry. In many respects, these trends remain valid in2011 (see Figure 3). However, in the past couple ofyears, the Survey has reported interview respondentsfocusing on a perception that client needs must beaddressed more explicitly, even as the retail industry is
increasingly intermediated. We suggested that thelimitations of the component-driven, specialisedapproach were increasingly apparent to a range ofplayers within the industry. We also reported that anumber of asset management firms were looking to adifferent role in helping their ultimate clients achieve theirinvestment goals, particularly in the pension fundenvironment.
indu
stryview
Figure 3: Key themes four years on
2006 – 2007 IMA Survey Findings
Greater polarisation brought about by alpha andbeta separation and the commoditisation ofcertain beta products.
Specialisation/fragmentation as activemanagers focus increasingly on alpha-seeking inspecific asset classes, but signs of emergence of‘new balanced’ approaches.
Greater diversification as clients look towardswider sources of return (eg. hedge funds,infrastructure, commodities, private equity).
Convergence in certain areas between the hedgefund environment and ‘mainstream’ assetmanagers (eg. increasing demand for absolutereturn funds) and between the retail andinstitutional product offerings.
Liability preoccupations driving the developmentof a range of LDI products designed to helppension schemes better manage their fundingdifficulties.
Increased intermediation as new forms of funddistribution and assembly mechanisms emerge,turning asset managers increasingly intomanufacturers selling their products throughprofessional buyers in wholesale relationships.
Ongoing Europeanisation of the regulatory andcommercial operating environment.
Globalisation as a combination of new client andinvestment opportunities are provided by thegradual liberalisation of the international economyand by demographic shifts favourable to anenhanced savings culture.
2010 – 2011 IMA Survey Findings
Intensification of separation and commoditisation asthe ETF market develops.
Wider acknowledgement of the limits ofspecialisation and significantly increased interestacross the industry in asset allocation and multi-asset products.
Ongoing client interest in alternative asset classes.
Ongoing signs of convergence, evident not just incertain forms of investment technique andobjective, but in fund vehicles with wider use ofUCITS powers.
LDI continuing to grow substantially. Anincreasingly crowded commercial space as assetmanagers and consultants compete to offer a rangeof fiduciary and implemented consulting services.
Ongoing growth of platforms as a core distributionvehicle. Evolution of open architectureaccompanied by a growing focus on guidedarchitecture, particularly in the context of DCplatforms.
While changes in the commercial landscape remainuneven and slow, the European regulatory agendais increasing significantly in the aftermath of thecredit crisis.
Long-term secular shifts remain intact, with growingrecognition among clients of a shift in globaleconomic growth dynamics and consequent re-allocation of capital towards emerging markets.
revsurvey 1:IMASurvey201011 22/07/2011 17:28 Page 23

indu
stryview
indu
stryview
Are clients getting the experience theyexpected?
One of my questions coming out of the 2007-08 dislocation was: did the clients that haveinvested in the markets and used our industry fortheir long-term savings and prosperity get theexperience that they expected? Some did but alot of them didn’t. Why? Is it that they haven’tunderstood the product offerings, have they notbeen positioned properly by the seller, has it beentoo industrialised? I don’t think the industrybehaved poorly, but I do question whether it hasthought enough about what the client reallyneeds.
I do think that our reputation as beingtrustworthy custodians of people’s money issomething we want to build on. It’s going to bemuch more than saying: ‘Here’s the index, we’veout-performed it and are top quartile in our peergroup!’ So, if you’re 64 years old and closer toretirement, how are you going to deal with this?How will you convert the pension into an incomestream? There will be a different role for assetmanagers.
Sitting behind this shift in emphasis is the observationthat some clients may not have been best served byinvestment goals such as outperforming standardmarket benchmarks. At the same time, the value ofthose benchmarks even for specialised mandates hasbeen increasingly questioned. There are a variety ofresponses to this:
Greater use of absolute or target return products.
Further development of unconstrained orbenchmark-unaware strategies.
A focus on tailored, more outcome-orientedapproaches, particularly for individual pension funds.
As we pointed out last year, solution propositionsrepresent an attempt by some asset managers todeploy their intellectual capital differently, reassertingtheir expertise base and developing their capabilities.While this has been given greater impetus by thedislocation of the credit crisis, it is also the culminationof broader trends, notably changing demographics andevolving regulatory demands on pension schemes.
Impact of demographics and regulation
A combination of demographics andregulation, particularly accounting regulation,creates a greater focus on liability matching asopposed to benchmark matching. For individualsthis means that people are approachingretirement, and so they’re moving out of anaccumulation into a decumulation environment.For institutions it’s maturing DB pension fundswhere it used to be about new joiners andgrowing assets, and now it’s about winding themdown.
That gets you focused on outcomes, and youcare less about what the various benchmarks are.If you’re focused on the outcome you ask yourself‘who can help me with that outcome’, andinstitutions may decide they want to speak to afiduciary manager or a consultant.
“
”“
”“
”
24
Investment Management Association
revsurvey 1:IMASurvey201011 22/07/2011 17:28 Page 24
25
Overview of the Asset Management Industry
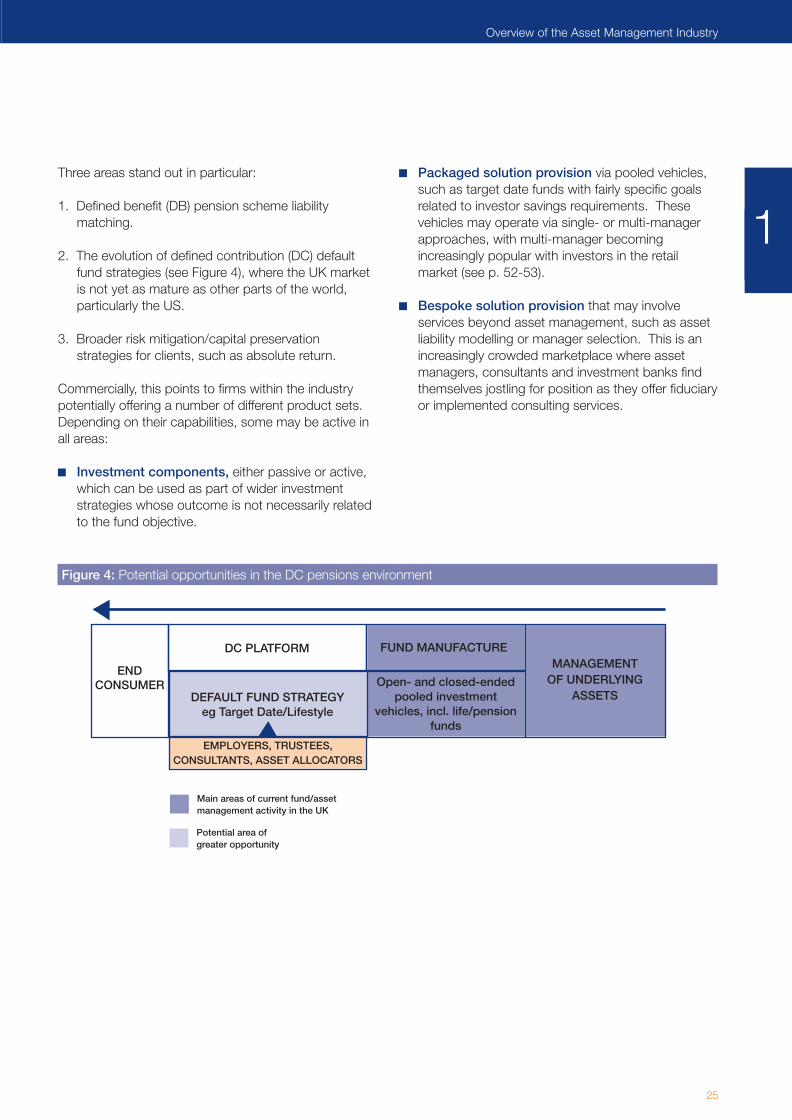
Three areas stand out in particular:
1. Defined benefit (DB) pension scheme liabilitymatching.
2. The evolution of defined contribution (DC) defaultfund strategies (see Figure 4), where the UK marketis not yet as mature as other parts of the world,particularly the US.
3. Broader risk mitigation/capital preservationstrategies for clients, such as absolute return.
Commercially, this points to firms within the industrypotentially offering a number of different product sets.Depending on their capabilities, some may be active inall areas:
Investment components, either passive or active,which can be used as part of wider investmentstrategies whose outcome is not necessarily relatedto the fund objective.
Packaged solution provision via pooled vehicles,such as target date funds with fairly specific goalsrelated to investor savings requirements. Thesevehicles may operate via single- or multi-managerapproaches, with multi-manager becomingincreasingly popular with investors in the retailmarket (see p. 52-53).
Bespoke solution provision that may involveservices beyond asset management, such as assetliability modelling or manager selection. This is anincreasingly crowded marketplace where assetmanagers, consultants and investment banks findthemselves jostling for position as they offer fiduciaryor implemented consulting services.
1
Figure 4: Potential opportunities in the DC pensions environment
ENDCONSUMER
MANAGEMENTOF UNDERLYING
ASSETS
FUND MANUFACTURE
Open- and closed-endedpooled investment
vehicles, incl. life/pensionfunds
DEFAULT FUND STRATEGYeg Target Date/Lifestyle
DC PLATFORM
EMPLOYERS, TRUSTEES, CONSULTANTS, ASSET ALLOCATORS
Main areas of current fund/assetmanagement activity in the UK
Potential area ofgreater opportunity
revsurvey 1:IMASurvey201011 22/07/2011 17:28 Page 25

indu
stryview
indu
stryview
Improving Client Trust
Clearly, as in all industries, trust is a key component ofclient relationships. The majority of firms we spoke tobelieve that more could be done by the industry in thisarea. One immediate concern in the context of thecredit crisis is the need to distinguish the assetmanagement industry from other parts of the financialservices industry and to ensure that clients betterunderstand what firms are trying to achieve on theirbehalf. This implies a significant communication task forasset managers.
Trust issues and identity
The industry is suffering from a lack of trustand consumers tell us. Individual companiesmay not have a problem because, typically, thecustomer says ‘I don’t trust others, but my firmis good’. There’s a big difference between thegeneral and the specific in customer trust andthe closer you get to the individual choice thatthe customer’s made, the greater the trust. Soyou could say that trust is strong if you’ve had astrong brand and if you’ve kept up your clientcommunication.
But as an industry we’re now ranked as low asbanks. And in Europe, the reason is becausemany are owned by banks and therefore thedifferentiation as to whether it was the productthat failed or the bank advice or the bank, theconsumer doesn’t know.
Even the most sophisticated investor can’tdistinguish properly between the role ofinvestment management, investment banking and retail banking. We have senior policy-makersthat confuse this, so what chance has theconsumer? If you asked an ordinary person toname five investment managers they’d struggle,and even then they’d probably name thoseowned by investment banks.
At the same time, transparency is felt to be particularlyimportant in the context of an investment environmentcharacterised by:
Increasingly sophisticated investment objectives anddelivery mechanisms.
End consumers who frequently lack a strongunderstanding of investment products, but who willbe increasingly exposed to those products(particularly through DC pensions).
Increasing degrees of intermediation, putting evergreater distance between asset or fund managerand end client.
More intrusive regulation.
The importance of transparency andcommunication
We need to get the essence of the productand the risk in a simple, digestible form, and weneed to be available to answer questions. One ofthe biggest frustrations that I have is that we doproduce a lot of information, some of it regulatedalmost to the point of being impenetrable, but theproblem is that it doesn’t reach the customer. Sothe big challenge that we haven’t grappled with ishow we form a direct communication relationshipwith our customers without undermining the roleof good quality intermediation and good qualityadvice. After all, we’re not advisers in the retailspace.
One of the things that has really accelerated isthe erosion of that artificial distinction betweenlong-only and alternative. We’ve got hedge fundmanagers launching long-only funds and activemanagers launching hedge funds and absolutereturn type funds. I don’t think it is just a questionof marketing in terms of working with thecustomer to make sure they understand what’sgoing on and they’re protected. It’s alsoincumbent on our industry to ensure that duediligence on portfolio construction, on all theoperational issues – particularly surrounding theuse of derivatives in these funds which are anefficient means of constructing a portfolio – are ofthe highest order.
“
”“
”
“
”“
”
26
Investment Management Association
revsurvey 1:IMASurvey201011 22/07/2011 17:28 Page 26

indu
stryview
indu
stryview
27
Overview of the Asset Management Industry
1Transparency is a particular concern in the retail spaceand has been expressed consistently to us by a smallnumber of interviewees in the last three surveys asabsolute return funds have grown in popularity (see p. 51). While absolute return remains extremely smallas a proportion of overall investment funds undermanagement (less than 3%), there is no expectationthat investor demand will diminish for products thatattempt to move towards more tangible returnobjectives than the traditional index benchmark.
Furthermore, an emerging trend towards the use ofUCITS10 vehicles for less mainstream strategies (eg. byhedge funds) also worries some of those to whom wespoke with respect to potential threats to a highlysuccessful international brand.
Reputational risk
If we’re moving into target return or absolutereturn funds, it’s incredibly important that, in termsof building the industry’s trust and reputation, wemake sure we’re putting stuff into the marketplacethat stands a reasonable chance of doing what itsays on the tin. We need to be as transparent aspossible about the way in which these portfoliosare put together.
The problem is that it’s quite hard to manageexpectations for these things, both internally andexternally, and it does worry me about theindustry in general that there is a potential fordisappointed expectations when people buy whatthey perceive as absolute return products. Wehope that most of the assets are going to beuncorrelated, but they’re obviously not going tobe all uncorrelated in a crisis. The ‘diversifiedgrowth’ name applies to a very wide variety ofapproaches at the moment, so it’s an area whereit’s easy for people to get something different fromwhat they thought they were buying.
UCITS had an extraordinary run and it reallyought to be considered one of the majorsuccesses of the European single market initiative.On the other hand, I think there’s every chancethat this gets thrown away over the next few yearsamid all the pressure for more flexible investmentstrategies. At some point, some UCITS fund willgo down, having done something really stupid,and people will wonder how on earth we allowedit to happen.
A number of interviewees also identified cost controland charges as an issue that the industry shouldconsider more carefully. This is clearly a contentiousarea with some strong views both within and outsidethe industry, which raises the broader question of costversus overall value for money, and how this can bemeasured.
Cost control and value for money
I would not pay two-and-twenty to anyone,not even myself. In a world of low nominal returns,I do think we, as an industry, have to keep acontrol over cost. Otherwise, too great a share ofthe gross return is going to us and not enough tothe end client.
The danger is that people only focus on thecost rather than getting value for money and theworst outcome from my point of view would berushing into passive because they think it’scheaper but then actually ending up with highrisks relative to their wealth because they’repositioned in expensive stocks. But we, as anindustry, don’t have the right to tell them what todo.
“
”“
”“
”
“
”“
”
10 UCITS refers to the Undertakings for Collective Investment in Transferable Securities Directives.
revsurvey 1:IMASurvey201011 22/07/2011 17:28 Page 27

indu
stryview
Finally, as we reported last year, those we interviewedgenerally made the observation that clients wereincreasingly scrutinising asset managers, particularlyaround investment process and operational risk issues.In this respect, trust is also linked to being able tosatisfy client concerns in these areas and firm size wasonce again cited as an increasingly important factor (forfurther comment, see p. 74).
Greater client scrutiny
If you look at the due diligence that we aresubject to in terms of our institutional mandates, itis much more focused on risk and operationalmanagement than it was before. On a scale of 1-10, the focus of due diligence visits to ourheadquarters is 7.5 on operations and riskmanagement and 2.5 on performance. It’s exactlythe reverse of five years ago. Clients are muchmore concerned about the health of their assetmanagers, banks and financial counterpartiesthan they were before.
Our clients are asking for more information.The risk management that we develop internallywe also use in our marketing and communicationsso it meets our internal requirements as well asthe new requirements from our clients. This isanother consequence of the greater focus on risk.Everyone expects to have information instantlyabout every possible kind of risk, includingliquidity, which has not been focused on as muchbefore.
There’s greater scrutiny, not only regulatorybut also from the client side. Clients want toknow where the company they’re dealing with willbe 12 months from now. And it doesn’t fit in withthe current perception of ‘big is bad’ and‘boutique is good’ so maybe there’s going to be arethink around that.
Taken together, these developments create a range ofopportunities, but also challenges for asset managers(and other players in the market):
1. Effective innovation and delivery without over-promising.
2. Effective communication, particularly in a highlyintermediated retail environment.
3. Effective competition with other players and themaintenance of a level playing field.
4. Potential vulnerability to reputational damage in theevent of product failure within the broader industry(see in particular the discussion on ETFs, p. 77).
“
”“
”“
”
28
Investment Management Association
revsurvey 1:IMASurvey201011 22/07/2011 17:28 Page 28
29
UK Institutional Market
Market size
The UK institutional market as served by IMAmembers (regardless of where assets are managed)is estimated at £2.2trn, with the overall marketestimated at £2.4 – £2.5trn.
Client type
Within the UK market, pension funds and insurancecompanies continue to represent the largestinstitutional client types for IMA members, with 50%and 34% of institutional assets respectively.
The third largest client type is the ‘Other Institutional’category (9%) which consists primarily of pooledassets. While it is not possible to identify theunderlying client type in this category, the majority islikely to be institutional clients.
Asset allocation
Over 38% of third party institutional client assets areinvested in equities, with fixed income representing37%. Multi-asset mandates account for nearly11%. ‘Other’ specialist mandates represent almost8% and consist mostly of LDI and alternatives.
The geographic distribution of specialist institutionalequity mandates clearly exemplifies increasinginternationalisation (only 36% by value of theirassets are invested in UK equities). As one wouldexpect, fixed income mandates remain stronglyfocused on the domestic market with 84% of totalassets invested in UK bonds.
Separation of alpha and beta
Passive institutional mandates account for 38% oftotal third party institutional client assets, with 41%of total pension fund assets managed by IMAmembers on a passive basis.
Specialist vs multi-asset
Specialist mandates account for almost 90% of totalthird party institutional client assets. Despite anincreasing client focus on multi-asset and flexiblestrategies evident from interviews, there is littleevidence of significant change.
Outlook for the UK institutionalmarket
Boundaries within the industry are becomingincreasingly blurred, with traditional and alternativeas well as retail and institutional sectors converging.
The upcoming automatic enrolment reforms in theUK present an important development for UKretirement provision and savings behaviour moregenerally. For the asset management industry, thereare both challenges, particularly in terms of productdevelopment, and commercial opportunities.
2. UK Institutional Market
Key Findings
2
revsurvey 1:IMASurvey201011 22/07/2011 17:28 Page 29

indu
stryview
2. UK Institutional Market
30
Investment Management Association
In the last Survey, the broad message was that somedegree of normality began to return to the institutionalmarketplace in 2009, with a number of pre-existingthemes apparent, notably:
A significant focus on liabilities and putting in placeviable solutions for meeting these.
An ongoing move out of equities by occupationalpension schemes and a continued erosion of homebias in remaining equity holdings.
An interest in absolute/total return strategies andalternative asset classes.
These all remain true in 2010. However, as weexplored in the previous chapter, a theme that hascome more to the fore in this year’s Survey has beenthat of how to ensure greater flexibility in terms ofinvestment decision-making processes, moving awayfrom more static, traditional benchmark-driven assetallocation approaches, particularly for pension funds,towards more tactical management. According tothose we interviewed, this is seen in a number of ways:
Greater interest in multi-asset investment strategiesamong institutional clients.
Greater openness among clients to benchmarkunaware processes.
Growth of interest in fiduciarymanagement/implemented consulting.
Changes in internal pension scheme governance,with a number of schemes appointing in-house CIOs.
Towards greater flexibility
The manifestation of diversified growth,implemented consulting and fiduciarymanagement may be the same phenomenon indifferent guises. It’s the same desire to transferthe responsibility for tactical decisions to a morenimble organisation. A number of the larger plansin the UK have also formed small committees orappointed CIOs.
Overview of UK Institutional Data
This year, we have started collecting data specificallyon the UK institutional client base (see Chart 12). Itincludes mandates from UK clients, regardless ofwhere the assets are managed. Our first estimate ofthe size of the UK institutional market served by IMAmembers is £2.2trn.
Chart 12: UK institutional market by client type
Of this, nearly a half is managed on behalf of pensionfunds, with insurance companies accounting for justover 34%.11 The majority is in-house insurance (30% oftotal assets), with third-party insurance accounting for4%. The wide usage of institutional pooled vehicles byclients has complicated precise estimates of clientassets in that around 9% of assets are in pooledvehicles where managers were unable to make a clientdetermination (eg. unauthorised unit trusts, investmenttrusts). Those were the majority of assets classifiedunder the ‘Other Institutional’ category.
Taking account of non-IMA members and usingexternal sources of information on institutional clients,we estimate that total UK institutional assets undermanagement are in the region of £2.4 – £2.5trn. IMAcalculations suggest that total assets for UK DBschemes accounted for £1.2trn as at the end of 2010with occupational DB and DC together accounting for£1.3 – £1.4trn.12
“
”
Other Institutional 9.0%
Sub-Advisory 3.9%Non-Profit 1.2%
Corporate 1.4%Public Sector 0.7%
Insurance34.2%
Pension Funds49.6%
11 Pension fund data primarily includes occupational (ie. trust-based) schemes and covers DB and DC across corporate pensions, local government pensionschemes and other schemes such as charities’ pension funds. A more detailed breakdown is provided in Appendix Two. However, the complex nature of pensionprovision in the UK means that DC assets, as seen by asset managers, will be accounted for in both the pension fund and insurance categories. Investment intopooled vehicles also makes some DB and DC money difficult to identify. 12 This estimate is arrived at using data from the DCLG, LCP, NAPF, ONS, TPR and PPF.
revsurvey 1:IMASurvey201011 22/07/2011 17:28 Page 30
31
UK Institutional Market
2
Overview of Third Party Institutional Business
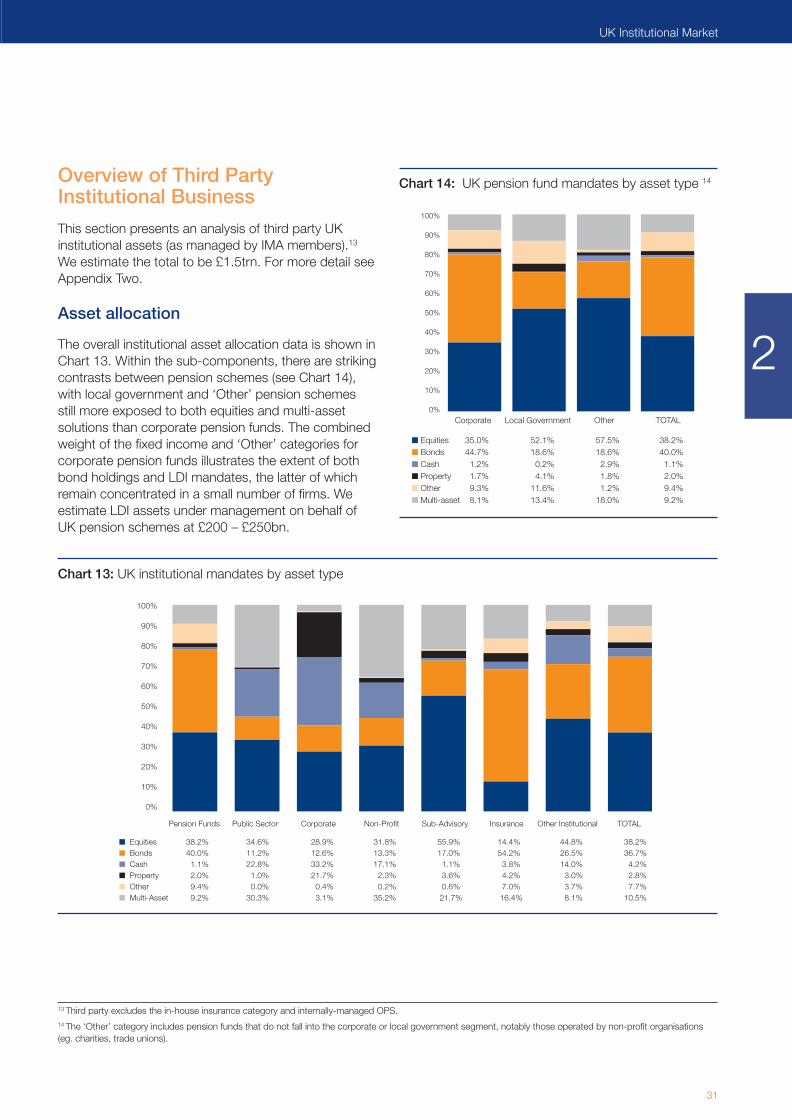
This section presents an analysis of third party UKinstitutional assets (as managed by IMA members).13
We estimate the total to be £1.5trn. For more detail seeAppendix Two.
Asset allocation
The overall institutional asset allocation data is shown inChart 13. Within the sub-components, there are strikingcontrasts between pension schemes (see Chart 14),with local government and ‘Other’ pension schemesstill more exposed to both equities and multi-assetsolutions than corporate pension funds. The combinedweight of the fixed income and ‘Other’ categories forcorporate pension funds illustrates the extent of bothbond holdings and LDI mandates, the latter of whichremain concentrated in a small number of firms. Weestimate LDI assets under management on behalf ofUK pension schemes at £200 – £250bn.
Chart 14: UK pension fund mandates by asset type 14
100%
90%
80%
70%
60%
50%
40%
30%
20%
10%
0%
■ Equities 35.0% 52.1% 57.5% 38.2%■ Bonds 44.7% 18.6% 18.6% 40.0% ■ Cash 01.2% 00.2% 02.9% 01.1%■ Property 01.7% 04.1% 01.8% 02.0%■ Other 09.3% 11.6% 01.2% 09.4% ■ Multi-asset 08.1% 13.4% 18.0% 09.2%
Corporate Local Government Other TOTAL
13 Third party excludes the in-house insurance category and internally-managed OPS.14 The ‘Other’ category includes pension funds that do not fall into the corporate or local government segment, notably those operated by non-profit organisations(eg. charities, trade unions).
Chart 13: UK institutional mandates by asset type
100%
90%
80%
70%
60%
50%
40%
30%
20%
10%
0%
Pension Funds Public Sector Corporate Non-Profit Sub-Advisory Insurance Other Institutional TOTAL
■ Equities 38.2% 34.6% 28.9% 31.8% 55.9% 14.4% 44.8% 38.2%■ Bonds 40.0% 11.2% 12.6% 13.3% 17.0% 54.2% 26.5% 36.7%■ Cash 01.1% 22.8% 33.2% 17.1% 01.1% 03.8% 14.0% 04.2%■ Property 02.0% 01.0% 21.7% 02.3% 03.6% 04.2% 03.0% 02.8%■ Other 09.4% 00.0% 00.4% 00.2% 00.6% 07.0% 03.7% 07.7%■ Multi-Asset 09.2% 30.3% 03.1% 35.2% 021.7% 016.4% 08.1% 10.5%
revsurvey 1:IMASurvey201011 22/07/2011 17:28 Page 31

indu
stryview
32
Investment Management Association
Looking at the geographic split of specialist equitymandates (see Chart 15), UK pension funds are welldown the path of international diversification, with UKequities accounting for only 36% of specialistmandates (by value of assets). This is the sameproportion as for the total UK third party institutionalclient market, and is evidence of an erosion of homebias that was a strong characteristic for many years.While we do not have a historical dataset for UKmandates split out by global vs specialist overseas, it isapparent that global rather than specialist internationalequity mandates are increasingly popular as clients tryto take advantage of broader opportunity sets. This isalso linked to rising interest in unconstrained mandates.
Popularity of unconstrained mandates
The challenge for firms is to reorganise themselvesfor a world where asset allocation structures are goingto shift much more, and to make up their mind as towhether they are going to stay a component providerwith a narrow niche or whether they’re really going toembrace more holistic fund management. The otherthing is, if you start making dynamic asset allocationdecisions, somebody somewhere is going to get itwrong. Closet indexing – which is what so much of theindustry has done when you have been asked to justbeat the All-Share index – can’t be done in this kind ofworld. In fact, some of our strategies no longer haveany market benchmark whatsoever.
Benchmarks have done a terrible job for people,compelling them to allocate a large amount of capitalto banks at one point, and then technology severalyears earlier. That message has sunk in. It is inevitablethat benchmark-unaware will at times underperformthe index, but it’s difficult sometimes to explain toclients the framework under which we work.Consistency is very important in terms of behaviour.When you take on benchmark-unaware business, youneed to explain your process and stick with it. Wehave won vast amounts of business from people whohad a similar proposition to us and then under pressureduring the credit crisis changed their process. At thatpoint, they were absolutely dead in the water.
“
”
”“
Chart 15: Specialist equity allocation by client type
100%
90%
80%
70%
60%
50%
40%
30%
20%
10%
0%
■ UK 35.8% 5.1% 47.7% 46.6% 47.9% 28.1% 23.4% 35.7%■ Europe 12.6% 42.6% 06.2% 05.4% 11.1% 21.1% 09.3% 12.5%■ North America 13.8% 00.0% 00.2% 08.0% 01.4% 14.0% 08.7% 12.3%■ Pacific (ex Japan) 05.7% 19.3% 00.0% 00.9% 11.7% 20.1% 23.5% 07.4%■ Japan 04.9% 00.0% 08.2% 01.6% 01.5% 05.8% 02.6% 04.6%■ Emerging Market 02.1% 31.2% 02.5% 11.1% 02.2% 06.7% 13.0% 03.2%■ Other 01.6% 00.2% 00.4% 00.2% 01.0% 00.0% 00.8% 01.4%■ Global 23.6% 01.6% 34.7% 26.1% 23.3% 04.2% 18.7% 22.9%
Pension Funds Public Sector Corporate Non-profit Sub-advisory Insurance Other TOTAL Institutional
revsurvey 1:IMASurvey201011 22/07/2011 17:28 Page 32

33
UK Institutional Market
Chart 16: Specialist fixed income allocation by client type15
■ UK 87.0% 100% 43.2% 69.3% 74.9% 78.3% 17.0% 84.0%■ Overseas 04.0% 0% 31.8% 04.6% 10.8% 16.1% 39.0% 06.0%■ Global 09.1% 0% 25.1% 26.2% 14.4% 05.6% 44.0% 10.1%
Pension Funds Public Sector Corporate Non-profit Sub-advisory Insurance Other TOTAL Institutional
100%
90%
80%
70%
60%
50%
40%
30%
20%
10%
0%
15 The results of the ‘Public Sector’ category should be treated with caution due to sampling distortions.16 See WM UK Pension fund Annual Review 2010, which suggests that passive accounts for 27% of total pension scheme assets, from 17% in 2000.
In contrast, fixed income mandates remain verydomestically focused (see Chart 16). This is notparticularly surprising given the objectives of pensionfunds and insurance companies (eg. indexed pensionpayments or annuity provision) in the context of aresolutely national inflation and interest rateenvironment.
Active vs passive
The overall split between active and passive isillustrated in Chart 17 overleaf. Taken as a proportion oftotal third party UK institutional assets undermanagement, passive mandates represent 38% of thetotal, with the most extensive use seen in pensionfunds (41%).
In this respect, there is a strong contrast between theextent to which indexation is used in corporate pensionfunds (45%) and local government pension schemes(22%), with the latter still more oriented towards activemanagement.
Despite the increasing prevalence of ETFs, theprovision of passive management in the institutionalmarket remains, in asset terms, highly concentratedamong a small number of players. In this respect, ourheadline survey results are likely to over-represent thescale of passive mandates across the wider market.Measuring IMA member passive mandates against ourestimate of the wider UK occupational schemeuniverse suggests the overall figure is closer to 30%.This estimate is more compatible with data fromWM/State Street Investment Analytics, based on actualpension fund holdings data.16
Active managers we spoke to expressed the view thatthe active industry faced a range of challenges in theinstitutional market. In addition to the debate on cost vsvalue for money, issues include changing demands inthe product space (linked partly to the solutionsdebate) and client frustration over timing and managerperformance.
2
revsurvey 1:IMASurvey201011 22/07/2011 17:28 Page 33
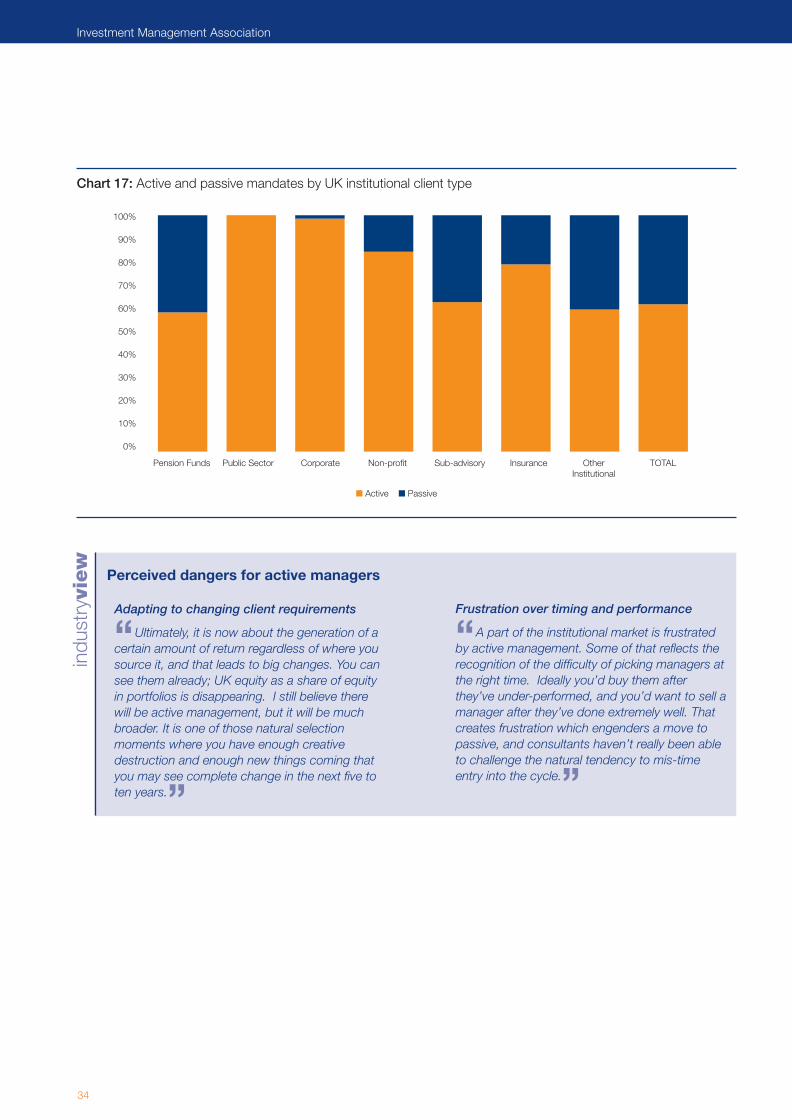
indu
stryview
Perceived dangers for active managers
Adapting to changing client requirements
Ultimately, it is now about the generation of acertain amount of return regardless of where yousource it, and that leads to big changes. You cansee them already; UK equity as a share of equityin portfolios is disappearing. I still believe therewill be active management, but it will be muchbroader. It is one of those natural selectionmoments where you have enough creativedestruction and enough new things coming thatyou may see complete change in the next five toten years.
Frustration over timing and performance
A part of the institutional market is frustratedby active management. Some of that reflects therecognition of the difficulty of picking managers atthe right time. Ideally you’d buy them afterthey’ve under-performed, and you’d want to sell amanager after they’ve done extremely well. Thatcreates frustration which engenders a move topassive, and consultants haven’t really been ableto challenge the natural tendency to mis-timeentry into the cycle.
“
”
“
”
34
Investment Management Association
Chart 17: Active and passive mandates by UK institutional client type
100%
90%
80%
70%
60%
50%
40%
30%
20%
10%
0%
■ Active ■ Passive
Pension Funds Public Sector Corporate Non-profit Sub-advisory Insurance Other TOTAL Institutional
revsurvey 1:IMASurvey201011 22/07/2011 17:28 Page 34

Segregated vs pooled
Chart 18 shows the split between segregated andpooled mandates. There are several notable features:
The use of pooled funds by corporate pension fundsremains much greater than that seen in localgovernment pension schemes, with 41% and 31%,respectively (see Chart 19). This partly reflects thegreater use of indexing among the former.
Sub-advisory and third party insurance business ispredominantly segregated.
The ‘Other Institutional’ category, as we explain onp. 30, is primarily accounted for by pooled vehicleswhere it has been difficult to make a determinationas to the precise nature of the end client.
Chart 19: Segregated and pooled mandates amongUK pension funds
100%
90%
80%
70%
60%
50%
40%
30%
20%
10%
0%
■ Segregated ■ Pooled
Corporate Local Other TOTAL Government
35
UK Institutional Market
Chart 18: Segregated and pooled mandates by client type
100%
90%
80%
70%
60%
50%
40%
30%
20%
10%
0%
■ Segregated ■ Pooled
Pension Funds Public Sector Corporate Non-profit Sub-advisory Insurance Other TOTAL Institutional
2
revsurvey 1:IMASurvey201011 22/07/2011 17:28 Page 35

36
Investment Management Association
Multi-asset vs specialist
The significant move towards specialisation in the UKinstitutional market seen over the last decade cameafter a period when asset managers had enjoyedgreater control over asset allocation through wide useof balanced mandates. Since interviews began for theSurvey four years ago, a small number of firms haveemphasised their belief that ‘new balanced’approaches were going to become more prominent. Incontrast to ‘old balanced’, new balanced mandatestend to be characterised by greater asset class andgeographic diversification, and cash- or inflation-linkedbenchmarks.
For now, our data points to specialised mandates stillbeing dominant (see Chart 20), accounting for almost90% of assets. However, as we point out in ChapterOne, there is a growing consensus in the industry thatgreater involvement is needed in the asset allocationprocess. Especially evident in this year’s interviews hasbeen the belief that specialisation may have gone toofar. None of the firms we spoke to disagreed with theobservation that multi-asset approaches were likely tobecome increasingly important, even if likelycommercial positioning varies. While we do not yet seean extensive move towards multi-asset fund or asset
management offerings in the institutional market, it isnotable that multi-asset funds are enjoying verysignificant interest among retail investors (see p. 52-53).
The greater focus on multi-asset within the industry isthe result of a wide range of factors:
A renewed interest among clients in approachesthat can offer more flexible and tactical assetallocation, particularly in the aftermath of the crisis.This may be achieved through new balanced ordiversified growth mandates, which also tend to bemore outcome-focused, using cash or inflationbenchmarks. Equally, it can be achieved structurally(with different commercial implications). Somepension funds are substantially boosting their in-house investment expertise or working with externaladvisers through fiduciary or implementedconsulting arrangements.
A belief in the industry that managers have more tooffer in the asset allocation space, given theimportance of this aspect of behaviour to long-terminvestment returns. This is coupled with aperception in some quarters that some consultantsmay not have performed effectively in recent years.
Chart 20: Specialist and multi-asset mandates by client type
100%
90%
80%
70%
60%
50%
40%
30%
20%
10%
0%
■ Specialist ■ Multi-asset
Pension Funds Public Sector Corporate Non-profit Sub-advisory Insurance Other TOTAL Institutional
revsurvey 1:IMASurvey201011 22/07/2011 17:28 Page 36

indu
stryviewindu
stryview
A conviction that asset managers are able to offermore diverse and sophisticated multi-asset solutionsthan previously seen in the era of the balancedmandates used by many UK pension funds prior tothe specialisation trend.
This is not an issue that will be confined to DBschemes. As DC becomes increasingly significant inasset terms, attention will focus on the design of thedefault funds which is likely to be central to theexperience of the majority of scheme members.
Several of those we spoke to also pointed out thatmulti-asset is a natural commercial repositioning foractive managers, who may be increasingly squeezed bythe move to passive in a number of developed markets.
The appeal of multi-asset
The new multi-asset offerings are presented ina more thoughtful way and the client is engaged.There isn’t a wholesale change, but the industryhas matured.
All the things that have happened over the lastfew years have made clients realise that they needhelp. The old way of doing it where you’d reviewyour equity manager every three years was quitemechanical, and all the things that have happenedhave made clients reach out and ask how theycan make things better and who can help themdo it. It might be a fund manager, it might be aconsultant or it might be that the client decided toset up an investment sub-committee.
People recognise that, although the oldstrategic asset allocation model was blown up in2007-08, diversification is key. People arerevisiting multi-asset, sometimes with tail-riskhedging, sometimes with a risk overlay,sometimes with a tactical asset allocationinput.
However, not everybody sees themselves in thesolutions or multi-asset space. Indeed, some specialistmanagers have drawn a similar conclusion aboutmeeting client needs, while remaining focused on theircore expertise. One firm commented that the biglesson of the credit crisis was that even where a clientuses a specialist mandate, they expect you to thinkabout them: “Managers need to increase their clientdirection capabilities. It’s not just a salesman pitchingtrack records, it’s a conversation.”
The theme of a better conversation with clients picksup a point made in Chapter One about the need forimproved communication. This is seen by firms asholding true for both retail and institutional clients,particularly in the context of the changing nature ofproducts on offer. A number of asset managers wespoke to believe that the move towards a fiduciaryroute or greater in-house investment oversight is beingdriven by the complexity of some of the investmentvehicles and strategies now being deployed.
Challenges posed by changinginvestment approaches
One big challenge is client knowledge and thatis genuinely difficult stuff. It may be better forclients, but they have a loss of control when itcomes to alternative asset classes. The goodthing with a benchmark is that you can walk intoan asset manager and say: ‘Here’s thebenchmark, I see you’re 2% underweight BP or3% overweight Glaxo’. So you’ve got anautomatic frame of reference. With alternativeclasses, you have a range of issues arising –liquidity, valuation, duration. And very often,people can confuse what they think is a lack ofcorrelation with a lack of liquidity.
This remains an incredibly difficult area. Notbecause alternatives won’t offer good returns butit is incredibly difficult for clients to put in place agovernance framework. We have at the same timeseen some of the larger in-house managed fundsincreasing their level of in-house expertise so thatthey can take greater ownership of decision-making and knowledge-building across a broaderrange of strategies.
”
”“
“”
“ “
”
37
UK Institutional Market
2
revsurvey 1:IMASurvey201011 22/07/2011 17:28 Page 37

indu
stryview
38
Investment Management Association
Outlook for the UK Institutional Market
Much of what we report above is a reflection of theboundaries within the industry becoming increasinglyblurred over the last five years, in particular:
Traditional and alternative. The notion of the‘traditional’ and ‘alternative’ asset managementindustries is breaking down very quickly.Mainstream investment houses are frequently usingtechniques and instruments that are more usuallyassociated with alternatives (eg. long-short funds).The move by some hedge funds into UCITSstructures only reinforces this. At the same time, anumber of asset managers are developingincreasingly sophisticated approaches to deal withthe management and mitigation of longevity risk.
Asset management and consulting. Assetmanagers are offering a broader range of services inthe institutional market, seen for example throughthe emergence of fiduciary mandates, whileinvestment consultants, banks and others are alsolooking to gain traction in this area.
Retail and institutional. While the changing natureof distribution is the main reason for the erosion ofthe retail and institutional distinction, the greaterfocus on precise client needs also has the potentialfurther to break down boundaries. Liabilitymatching and more targeted approaches have beenassociated with the institutional rather than the retailmarket. However, as firms reflect further on DC andindividual investment needs, it is starting to becomeapparent that comparable techniques may graduallybe introduced in a part of the pensions marketwhere the choice set for individuals gives it a moreretail than institutional hue.
Indeed, DC is an area that will be crucially important forthe asset management industry, even if DB remains thelargest single component of the UK pensions market inasset terms for some time to come. In this respect,there are a number of significant policy developments:
2012 will mark a significant milestone in UK pensionprovision with the gradual introduction of automaticenrolment into workplace pension schemes.Although auto-enrolment has already beenintroduced in New Zealand, the UK exercise is likely
to be the largest of its kind ever conducted. It hasalso seen the creation of the National EmploymentSavings Trust (NEST), a government-establishedoccupational pension scheme with a requirement foruniversal service provision. NEST will serveemployers who do not wish to choose a pensionprovider in the private sector. In asset managementterms, NEST will operate using the services of avariety of third party asset managers.
2010 saw reforms to UK retirement incomeregulation that has resulted in the abolition of whatwas effective compulsion to annuitise over the ageof 75. It is expected that the reforms will pave theway for a gradual shift in the retirement incomeproduct market. This is likely to result in moredrawdown and ‘third way’ products that bridge thegap between the pooled risk approach used in anannuity, and the individual risk seen in pure incomedrawdown products.
The role of NEST and the commercialchallenges of DC
Pre-packaged solutions are going to be keyhere; 90% of participants will in my opinion go intoa pre-packaged solution driven by theiremployers. The only big issue is NEST; what kindof competitor is it going to end up being for theprivate sector? It would be unhealthy for there tobe only one solution in the marketplace. You needto foster competition. The big challenge with DCis whether we are going to be able to saveenough money in it to pay for our retirements.There’s no way the investment results are going togenerate enough return if you don’t put enoughin. You can’t offset that contribution reduction withinvestment returns.
There are opportunities and it will take sometime, culturally, for a mindset shift to reallyembrace DC. Perhaps it will be a generationalshift because people in the UK are really used toDB. The 401(k) system was introduced over 30years ago in the US and now it’s just part of theprocess. There’s also an opportunity for that tohappen here. It will take engagement andpersuasion but the market has a potential to grow.But there needs to be a fundamental shift in thethinking of an entire population.
“
”“
”
revsurvey 1:IMASurvey201011 22/07/2011 17:28 Page 38

indu
stryview
indu
stryview
39
UK Institutional Market
Interviewees also pointed to the fact that DC raises thequestion of the provision of advice (implicit or explicit)that we explore elsewhere in the Survey (see p. 78).This creates a range of challenges across both theworkplace and individual marketplaces as individualsare faced with potentially difficult decisions that willoften see the use of ‘default’ fund options rather thanactive choice.
Advice and DC
Just like some expensive consumer goods,advice may become available only to a relativelywealthy subset. At some point that’ll have toreverse because more people need either adviceor somehow advice-packaged products from us.Between NEST and the execution-only fundplatforms, you’re going to need more advisersagain or more people who bake some fiduciarythinking into what they are selling.
With most asset managers unlikely to build their ownbundled proposition in DC, a number of choicespresent themselves:
Provide components for default or self-selectstrategies.
Provide solutions-based approaches (eg. targetdate funds) for default or self-select strategies.
Explore products that bridge the accumulation anddecumulation phases, now that the effectivecompulsion to annuitise has been abolished.
The UK industry as a whole is in the early stages ofdeciding how to position itself in the face of thesechoices.
The challenges and opportunities of DC
This is going to raise questions for somehouses about what an asset manager is. In a DCworld, which bits are you actually doing? Are yousimply providing a fund which has a set of risk andreturn characteristics that has a place in aportfolio of a DC platform or do you offersomething broader than that? And in particular,are you looking to influence the content of thedefault fund on a DC platform, and if you do that,what are the fiduciary risks that go with it?
It’s quite clear that over the next ten years we’regoing to see acceleration in the shift from DB toDC, a big change in the mandates that are onoffer and I think there’s going to be a hugeincrease in the competitive environment becausethe institutional world belonged to returnmanufacturers and investment consultants. TheDC world is going to be very competitive; there’sgoing to be fund managers, banks, actuarialconsulting firms and insurance firms, all looking tocompete in that lucrative, pretty crowdedspace.
The bull in me thinks that this is the mostfabulous industry to be involved in for the next 20to 30 years. The banks typically won’t get it rightfor two reasons: they are mentally still savings andloans institutions and their interest in the medium-to long-term savings market is cyclical. Theinsurers are split into two camps, those withcapital and those without. Those without capitalwill effectively be competing with the assetmanagement companies. In the UK we probablyhave more of those than anywhere else. Thosethat are not capital-rich will effectively becomeasset management companies. Those with capitalwill have a huge opportunity.
My concern is that over the next 20 to 30years, the degree of social and political pressurefrom the DC and discretionary savings market onthe industry is going to grow massively. Theopportunity is absolutely enormous, but I do notsee an industry yet that is well geared up to makethe most of it.
“
”
“
”“
”“
”
2
revsurvey 1:IMASurvey201011 22/07/2011 17:28 Page 39

3. UK Funds Market
Key Findings
Total funds under management
Total investment funds (including both UK- andoverseas-authorised funds) managed in the UK areestimated at £1.2trn.
UK-authorised funds totalled £579bn as atDecember 2010, a 20% rise year-on-year.
Sales trends
Total net sales (retail and institutional) of UK-authorised funds showed an inflow of £49.8bncompared to £34.4bn in 2009.
This was the largest ever recorded inflow in ourdata, and was driven by both retail and institutionalinvestors who invested £29.5bn and £20.2bn,respectively, during 2010.
Retail investors further globally diversified in 2010,with Global Bonds, Global Growth and GlobalEmerging Markets sectors all reporting the highestnet retail sales on record in 2010.
Asset mix in investment funds
Equity funds accounted for the largest proportion ofassets under management at 57% with bond fundsat 17% and balanced funds at 14%. Property fundsrepresented just over 2% of total funds undermanagement.
UK industry concentration andstructure
Fund sales are becoming more concentrated withthe top 100 funds taking 55% of total gross sales in2010 compared with 47% in 2005.
While the top ten firms’ share of the funds market issteady, the share of the next ten firms is increasingat the expense of the smallest firms.
Nevertheless, the funds industry remains veryunconcentrated compared to other parts of thefinancial services industry.
European comparisons
European investment fund assets reached a record€8.0trn in 2010 (from €7.1trn a year earlier).
The comparative asset class mix once againillustrates the difference across European markets.The UK has a much higher equity allocation (57% ofUCITS funds) compared to the European average(32%). Money market funds have a larger profile inEurope (22%) whereas they have a minimal uptakeamong UK retail investors (0.7%).
40
Investment Management Association
revsurvey 1:IMASurvey201011 22/07/2011 17:28 Page 40

41
UK Funds Market
3
This part of the survey covers UK-authorised unit trustsand OEICs. These funds are thought of primarily asretail vehicles, although institutional investors such aspension funds and insurance companies may alsoinvest in them. A small number of authorised funds arepurely institutional vehicles. As we outlined in ChapterTwo, increasing intermediation in the distributionstructure makes it also harder to identify retail endclients.
The analysis in this section is based on internal IMAfund data, which is both more detailed and has a longerhistory than the IMA Asset Management Surveyquestionnaire (which started in 2002). Mostimportantly, it captures flow data on a monthly basis.
As at December 2010, there were a total of 2,574 UK-authorised funds (from 2,524 in December 2009)classified in the IMA universe. The IMA collected dataon 2,483 of these funds.
Sales of funds of funds have normally been excludedfrom IMA industry statistics to avoid double counting,but they have been included in this survey. Estimates ofsales of funds to funds of funds, however, have beenexcluded since these are internal to the industry. Thisapproach gives a more accurate picture of retailinvestment behaviour in particular and will soon beadopted in the IMA’s regular monthly statistics.
Total Funds Under Management
Total funds under management at the end of December2010 were £579bn, an increase of 20% from a yearearlier. This was the highest ever recorded figure.Including overseas-domiciled funds managed in the UK(£607bn), total investment funds managed in thiscountry are almost £1.2trn.
As Chart 21 shows, the industry has grown in nominalasset terms by 67% over the last five years and by122% since the end of 2000. During the past decade,despite the economic dislocation of the dot.com crashand the credit crisis, the compound annual growth rateis 8.3% in nominal terms and 5.5% in real terms. Thiscompares to a compound rate for the FTSE All-Shareof 3.7% in nominal terms including re-invested income.
Chart 21: Industry funds under management (2000 – 2010)
Looking back over a longer historical period, theannualised growth rate from 1960 to 2010 is around17% in nominal and 11% in real terms.17 Suchexpansion rates are clearly greater than those for UKGDP, with fund industry growth rates particularly strongin the 1980s. At the end of 1960, funds undermanagement equated to less than 1% of GDP (seeChart 22). By the end of 2010, the figure wasalmost 40%.
Chart 22: Funds under management as percentage ofGDP (1960 – 2010)
0
100
200
300
400
500
600
£bn
2000 2001 2002 2003 2004 2005 2006 2007 2008 2009 2010
0%
5%
10%
15%
20%
25%
30%
35%
40%
1960
1962
1964
1966
1970
1972
1974
1976
1978
1980
1982
1984
1986
1988
1990
1992
1994
1996
1998
2000
2002
2004
2006
2008
2010
3. UK Funds Market
17 The GDP deflator has been used to calculate the inflation impact.
revsurvey 1:IMASurvey201011 22/07/2011 17:28 Page 41

Flows vs performance
Total net investment (retail and institutional) into the UKfund industry was a record £49.8bn during 2010,comfortably beating the previous high of £34.4bn seenin 2009:
The main driver of total net sales for 2010 was retailinvestors who invested a net £29.5bn, just belowthe 2009 record high level (£29.8bn).
Net institutional investment was also a high at£20.2bn, more than three times the previous recordof 2006 (£6.2bn). This largely reflects funds re-structured into OEICs.
The annual rise in UK-authorised funds undermanagement was due to an equal combination ofrecord net investment inflows and market returns.Market movements were responsible for 48% of theincrease in annual funds under management, while newmoney accounted for the remaining 52%.
Chart 23 shows the changes in funds undermanagement since 1993, broken down into net flowsand performance of the underlying assets. Lookingyear-on-year, asset performance is the main driver ofannual fluctuations in funds under management. Long-term, however, net inflows make a more significantcontribution to funds under management, and theyhave accounted for just over half of the increase infunds under management since the beginning of 1993.
42
Investment Management Association
Chart 23: Changes in funds under management by total net sales vs performance (1993 – 2010)
270
240
210
180
150
120
90
60
30
0
-30
-60
-90
-120
£bn
1993
1994
1995
1996
1997
1998
1999
2000
2001
2002
2003
2004
2005
2006
2007
2008
2009
2010
■ Sales ■ Performance Cumulative Sales Cumulative Performance
revsurvey 1:IMASurvey201011 22/07/2011 17:28 Page 42
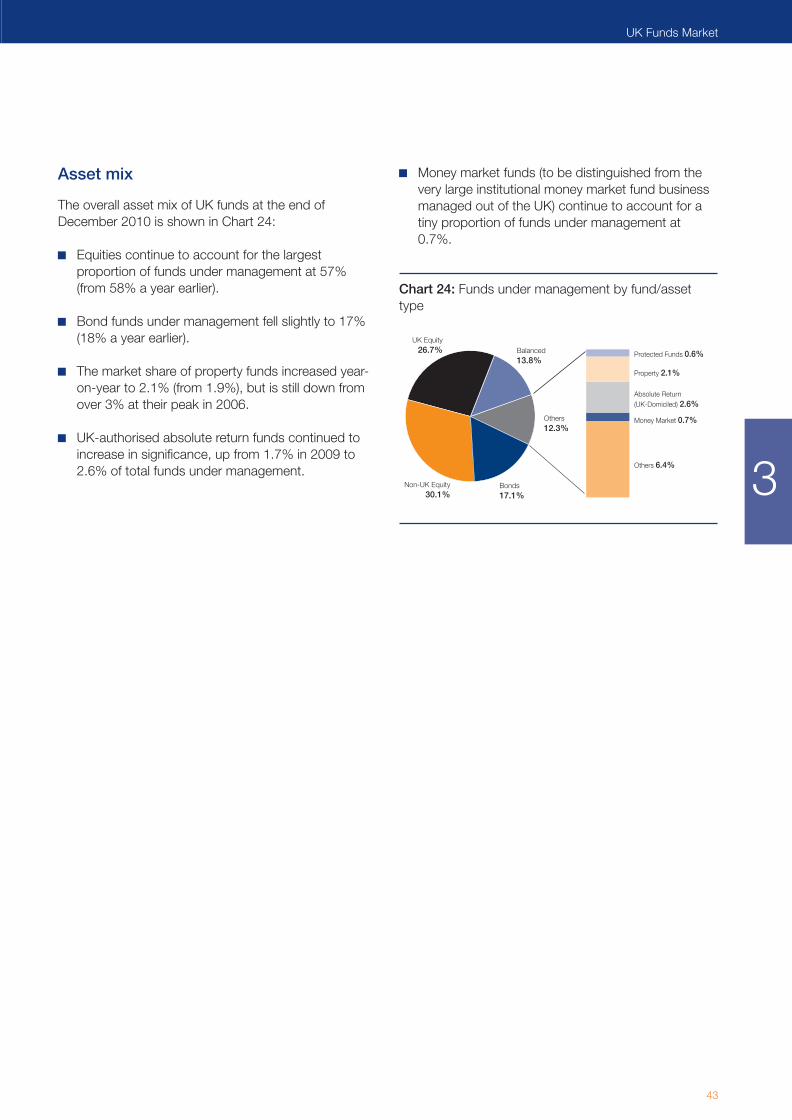
43
UK Funds Market
Asset mix
The overall asset mix of UK funds at the end ofDecember 2010 is shown in Chart 24:
Equities continue to account for the largestproportion of funds under management at 57%(from 58% a year earlier).
Bond funds under management fell slightly to 17%(18% a year earlier).
The market share of property funds increased year-on-year to 2.1% (from 1.9%), but is still down fromover 3% at their peak in 2006.
UK-authorised absolute return funds continued toincrease in significance, up from 1.7% in 2009 to2.6% of total funds under management.
Money market funds (to be distinguished from thevery large institutional money market fund businessmanaged out of the UK) continue to account for atiny proportion of funds under management at0.7%.
Chart 24: Funds under management by fund/assettype
UK Equity26.7%
Non-UK Equity30.1%
Bonds17.1%
Balanced13.8%
Others12.3%
Protected Funds 0.6%
Property 2.1%
Absolute Return (UK-Domiciled) 2.6%
Money Market 0.7%
Others 6.4% 3
revsurvey 1:IMASurvey201011 22/07/2011 17:28 Page 43

indu
stryview
44
Investment Management Association
Retail Investor Behaviour
Retail investors made a net investment of £29.5bn intofunds in 2010, the second consecutive year of veryhigh sales (£29.8bn in 2009). These figures comparewith £19.1bn net retail sales in 2000 at the peak of thedot.com boom. At that point, net investment wasmainly into equity funds whereas last year it was spreadacross a range of asset classes.
Drivers of behaviour
Although detailed information on consumer behaviour isunavailable, in the context of rising savings rates, it isperhaps not surprising that fund flows have been sohigh. However, the history of the last 20 years does notoffer evidence of a straightforward link between thehousehold savings rate and net retail sales of the fundindustry. Indeed, as Chart 25 shows, there is someevidence of an inverse relationship between flows andthe savings rate in the early 1990s recession.
Chart 25: Quarterly net retail sales as percentage ofretail funds under management vs household savings ratio (Q4 1986 – 2010)
Source: IMA, ONS
One obvious feature of this earlier period was very highinterest rates and, at this level, there appears to be amore direct connection between interest movementsand fund flows (see Chart 26). Given the record lowinterest rates of recent years, it seems likely that retailflows have been, in part at least, driven by a search foryield.
Chart 26: Quarterly net retail sales as percentage ofretail funds under management vs Bank of Englandbase rate (Q4 1986 – 2010)
Source: IMA, Bank of England
The hunt for yield
There has been a very slow reduction in riskaversion and risk sensitivity and it has beenprompted more in the retail segments where youhave retirees or the partially retired looking foryield and income. People are being forced out oftheir comfort zone because they’re just not gettingthe return on their investments that they need tolive on.
There’s an underlying theme here which youcan see in the global markets at the moment;we’re back in the hunt for yield. The investorshave known what they’re looking for and theycontinue to do so, and have followed that strategythrough.
5.0%
4.5%
4.0%
3.5%
3.0%
2.5%
2.0%
1.5%
1.0%
0.5%
0%
16%
14%
12%
10%
8%
6%
4%
2%
0%
1986
1987
1988
1989
1990
1991
1992
1993
1994
1995
1996
1997
1998
1999
2000
2001
2002
2003
2004
2005
2006
2007
2008
2009
2010
BOE Base Rate (LH) Net Retail Sales (RH)
5.0%
4.5%
4.0%
3.5%
3.0%
2.5%
2.0%
1.5%
1.0%
0.5%
0%
14%
12%
10%
8%
6%
4%
2%
0%
Household Savings Ratio (LH) Net Retail Sales (RH)
1986
1987
1988
1989
1990
1991
1992
1993
1994
1995
1996
1997
1998
1999
2000
2001
2002
2003
2004
2005
2006
2007
2008
2009
2010
“
”“
”
revsurvey 1:IMASurvey201011 22/07/2011 17:28 Page 44
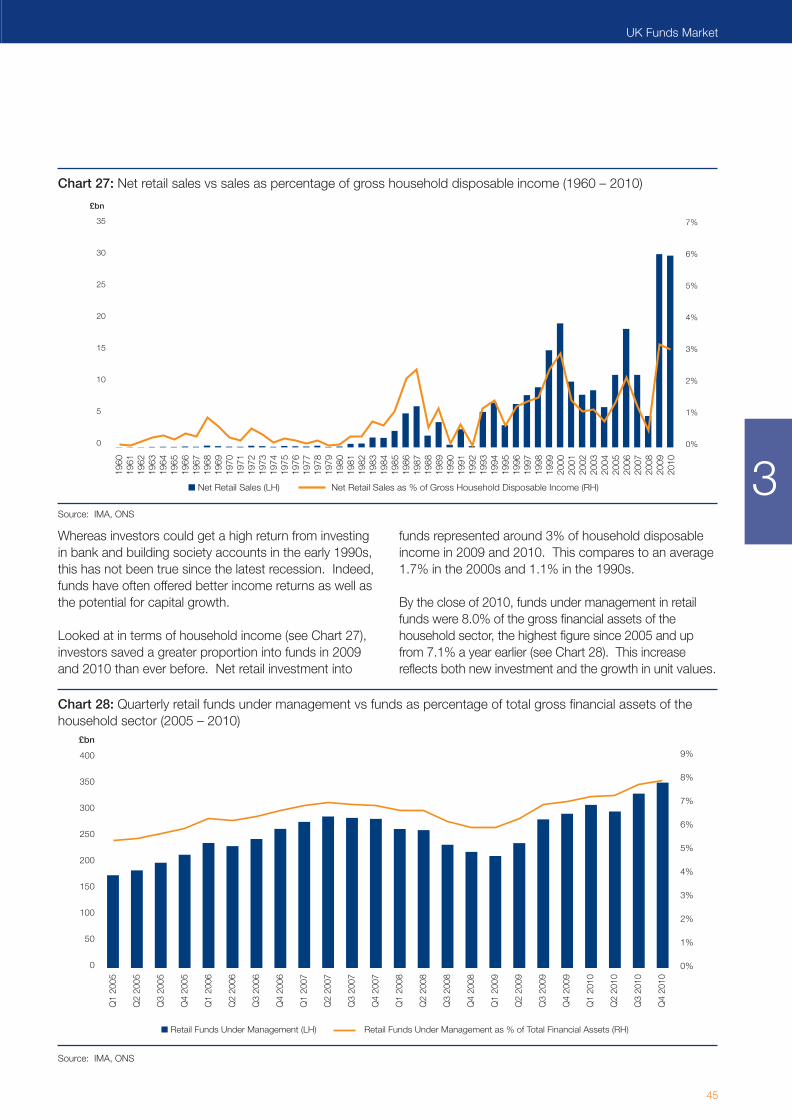
Whereas investors could get a high return from investingin bank and building society accounts in the early 1990s,this has not been true since the latest recession. Indeed,funds have often offered better income returns as well asthe potential for capital growth.
Looked at in terms of household income (see Chart 27),investors saved a greater proportion into funds in 2009and 2010 than ever before. Net retail investment into
funds represented around 3% of household disposableincome in 2009 and 2010. This compares to an average1.7% in the 2000s and 1.1% in the 1990s.
By the close of 2010, funds under management in retailfunds were 8.0% of the gross financial assets of thehousehold sector, the highest figure since 2005 and upfrom 7.1% a year earlier (see Chart 28). This increasereflects both new investment and the growth in unit values.
45
UK Funds Market
Chart 27: Net retail sales vs sales as percentage of gross household disposable income (1960 – 2010)
7%
6%
5%
4%
3%
2%
1%
0%
35
30
25
20
15
10
5
0
£bn
1960
1961
1962
1963
1964
1965
1966
1967
1968
1969
1970
1971
1972
1973
1974
1975
1976
1977
1978
1979
1980
1981
1982
1983
1984
1985
1986
1987
1988
1989
1990
1991
1992
1993
1994
1995
1996
1997
1998
1999
2000
2001
2002
2003
2004
2005
2006
2007
2008
2009
2010
■ Net Retail Sales (LH) Net Retail Sales as % of Gross Household Disposable Income (RH)
Chart 28: Quarterly retail funds under management vs funds as percentage of total gross financial assets of thehousehold sector (2005 – 2010)
Source: IMA, ONS
9%
8%
7%
6%
5%
4%
3%
2%
1%
0%
£bn
400
350
300
250
200
150
100
50
0
Q1
2005
Q2
2005
Q3
2005
Q4
2005
Q1
2006
Q2
2006
Q3
2006
Q4
2006
Q1
2007
Q2
2007
Q3
2007
Q4
2007
Q1
2008
Q2
2008
Q3
2008
Q4
2008
Q1
2009
Q2
2009
Q3
2009
Q4
2009
Q1
2010
Q2
2010
Q3
2010
Q4
2010
■ Retail Funds Under Management (LH) Retail Funds Under Management as % of Total Financial Assets (RH)
Source: IMA, ONS
3
revsurvey 1:IMASurvey201011 22/07/2011 17:28 Page 45

46
Investment Management Association
ISAs
A substantial chunk of the net retail flows went into tax-advantaged wrappers, including Individual SavingsAccounts (ISAs). The IMA collects information on ISA-wrapped sales where the ISA wrapper is provided bythe fund manager or one of five large fund platforms(Cofunds, Fidelity Funds Network, HargreavesLansdown, Skandia, Transact). IMA figures account foraround three-quarters of the total value of funds heldwithin ISAs, with the majority of the remainder beingwrapped by distributors.
As shown in Chart 29,18 net ISA sales in 2010 were£4.1bn, the highest level since 2001. This was thesecond consecutive year of positive net ISA inflowsafter five years of disinvestment.
A key influence on this turnaround was an increase inthe ISA allowance from £7,200 to £10,100 in October2009 for the over 50s, and in April 2010 for everyoneelse.
Nevertheless, sales remain lower than in the first coupleof years after ISAs were introduced in April 1999. ISAstook a much larger share of total net retail sales in 1999(57%) than in 2010 (14%).
Chart 29: Net ISA sales (1999 – 2010)
-2
0
2
4
6
8
10
1999
2000
2001
2002
2003
2004
2005
2006
2007
2008
2009
2010
£bn
18 As of April 2008 PEPs were consolidated into stocks and shares ISAs. All ISA data shown for periods prior to April 2008 also combine PEPs and ISAs, except inthe case of fund supermarkets where they reflect ISAs only.
revsurvey 1:IMASurvey201011 22/07/2011 17:28 Page 46

47
UK Funds Market
Asset class choices
The difficulty with interpreting retail flows, however, isthat at any given time aggregate flows reflect a widevariety of behaviour and preferences on the part of fundinvestors.
Table 1 shows quite a high dispersion of sales acrossdifferent fund types, and our analysis below identifies anumber of features of behaviour during 2010:
Ongoing strong movements into bond funds.
A sustained recovery in risk appetite.
Strong sales of global funds, including fundsinvesting in emerging markets.
A renewed interest in tracker funds.
Continued interest in absolute return offerings.
Strong sales growth in balanced funds and funds offunds.
Table 1: Net retail sales by fund type (2009 – 2010)
Fund type Net retail sales (£bn)
2009 2010
Bond funds 10.0 7.1
Balanced funds 3.8 6.8
Equity funds 7.8 6.8
Absolute return funds 2.6 2.4
Property funds 1.8 1.8
Money market funds 0.0 -0.2
Other funds 3.8 4.8
TOTAL 29.8 29.5
Bond fund sales
The ‘hunt for yield’ story in the context of low interestrates is well supported by the data from 2008 and 2009when the £ Corporate Bond sector was the best-sellingsector for two years.
Overall, bond funds again sold well in 2010 with £7.1bnin net retail sales (see Chart 30). However, the type ofbond fund purchased in 2010 shows an interesting shiftin investor preference. As corporate bond yields fell forthe second consecutive year, net retail sales of the £ Corporate Bond sector were just £658m, £5.3bndown on 2009 levels (£6.0bn). Instead, retail investorsopted for a different approach to bond investment, withthe £ Strategic Bond sector seeing net retail inflows of£3.0bn in 2010, up 48% on 2009 (£2.1bn).
The popularity of both the £ Strategic Bond sector andthe Global Bonds sector, the latter attracting retailinvestment of £2.4bn, points to the intensification of atrend familiar from equity fund patterns: the erosion ofhome bias, and rising interest in overseas stocks andsecurities.
Chart 30: Net retail sales of bond funds (1992 – 2010)
0
2
4
6
8
10
1992
1993
1994
1995
1996
1997
1998
1999
2000
2001
2002
2003
2004
2005
2006
2007
2008
2009
2010
£bn
3
revsurvey 1:IMASurvey201011 22/07/2011 17:28 Page 47

48
Investment Management Association
Recovery of risk appetite
While some investors undoubtedly remain focused onyield, others are more strategic, and the recovery in theequity markets through 2009 and 2010 saw anincreased risk appetite among retail investors. Netretail investment into equity funds was £6.8bn during2010, with 2009 and 2010 seeing the highest annualinflows since the dot.com boom of 2000.
Net retail flows in 2010 went mainly into non-UK funds,continuing a recent shift away from domestic equities in
favour of non-UK equity funds.19 Chart 31 shows netretail equity sales since 1992 split by those classified asUK equity funds versus non-UK equity funds. Non-UKequity net retail sales totalled £6.8bn in 2010, onceagain dwarfing sales of UK equity funds (£52m).
Although the UK equity sectors saw a minimalcombined net inflow in 2010, UK retail investorscontinue to invest heavily in their home market. The UKsectors still accounted for 47% of the industry’s totalequity funds under management at the end of 2010.
Chart 31: Annual net retail sales of UK and non-UK equity funds (1992 – 2010)
£bn
1992
1993
1994
1995
1996
1997
1998
1999
2000
2001
2002
2003
2004
2005
2006
2007
2008
2009
2010
■ UK Equity Funds ■ Non-UK Equity Funds
-2
0
2
4
6
8
10
12
19 The non-UK equities category includes regionally-focused funds (eg. Europe ex UK) as well as global funds.
revsurvey 1:IMASurvey201011 22/07/2011 17:28 Page 48
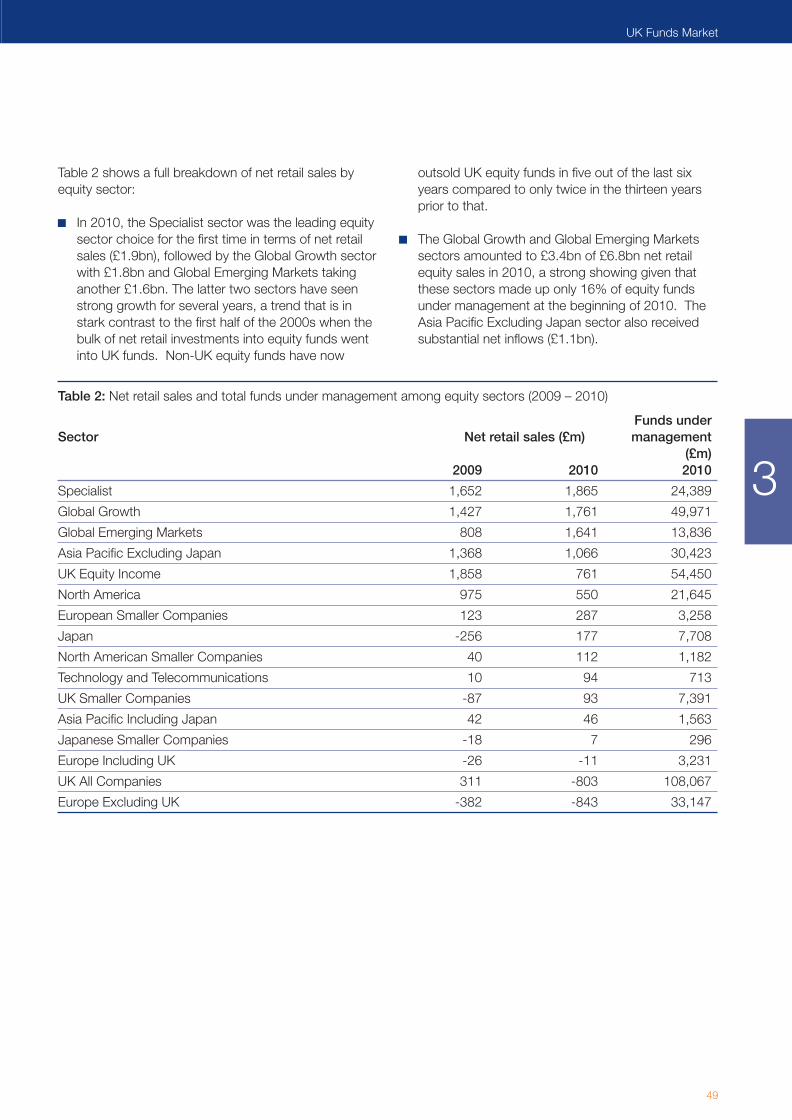
49
UK Funds Market
Table 2 shows a full breakdown of net retail sales byequity sector:
In 2010, the Specialist sector was the leading equitysector choice for the first time in terms of net retailsales (£1.9bn), followed by the Global Growth sectorwith £1.8bn and Global Emerging Markets takinganother £1.6bn. The latter two sectors have seenstrong growth for several years, a trend that is instark contrast to the first half of the 2000s when thebulk of net retail investments into equity funds wentinto UK funds. Non-UK equity funds have now
outsold UK equity funds in five out of the last sixyears compared to only twice in the thirteen yearsprior to that.
The Global Growth and Global Emerging Marketssectors amounted to £3.4bn of £6.8bn net retailequity sales in 2010, a strong showing given thatthese sectors made up only 16% of equity fundsunder management at the beginning of 2010. TheAsia Pacific Excluding Japan sector also receivedsubstantial net inflows (£1.1bn).
Table 2: Net retail sales and total funds under management among equity sectors (2009 – 2010)
Funds underSector Net retail sales (£m)5i management
(£m) 2009 2010 2010
Specialist 1,652 1,865 24,389
Global Growth 1,427 1,761 49,971
Global Emerging Markets 808 1,641 13,836
Asia Pacific Excluding Japan 1,368 1,066 30,423
UK Equity Income 1,858 761 54,450
North America 975 550 21,645
European Smaller Companies 123 287 3,258
Japan -256 177 7,708
North American Smaller Companies 40 112 1,182
Technology and Telecommunications 10 94 713
UK Smaller Companies -87 93 7,391
Asia Pacific Including Japan 42 46 1,563
Japanese Smaller Companies -18 7 296
Europe Including UK -26 -11 3,231
UK All Companies 311 -803 108,067
Europe Excluding UK -382 -843 33,147
3
revsurvey 1:IMASurvey201011 22/07/2011 17:28 Page 49

50
Investment Management Association
Index tracker funds
Index tracker funds saw net retail inflows of £1.5bnduring 2010, more than treble the amount in 2009 andthe highest figure since the dot.com boom in 2000 (seeChart 32). Together with substantial institutionalinvestment and rising stock markets around the world,strong performance in 2010 helped to take total fundsunder management in index tracker funds to £38.3bnat the close of the year, up 33% from 2009 (see Chart 33).
Chart 32: Net retail sales of tracker funds by indexinvestment type (2003 – 2010)
These funds now represent approximately 6.6% ofindustry funds under management. Over the last fiveyears the average annual growth rate in tracker fundshas closely matched that of the overall industry:
While there have been increased flows into fundsthat track bond indices in recent years, most fundscontinue to go into equity tracker funds, whichaccount for 95% of tracker funds undermanagement.
The proportion invested in non-UK equity trackerfunds has risen from 19% to 30% in the past fiveyears as investors seek to diversify equity trackinginvestments.
There have also been substantial inflows into ETFs.While the IMA does not collect detailed data onthese products, ETFs with a primary London listingreached £43bn in funds under management at theend of 2010.
Chart 33: Funds under management of tracker fundsby index investment type (2003 – 2010)
£m
2,000
1,500
1,000
500
0
-5002003 2004 2005 2006 2007 2008 2009 2010
■ UK Equity ■ European Equity ■ North American Equity ■ Other International/Global Equity ■ Bond
2003 2004 2005 2006 2007 2008 2009 2010
■ UK Equity ■ North American Equity ■ Bond ■ European Equity ■ Other International/Global Equity
£bn
0
5
10
15
20
25
30
35
40
revsurvey 1:IMASurvey201011 22/07/2011 17:28 Page 50
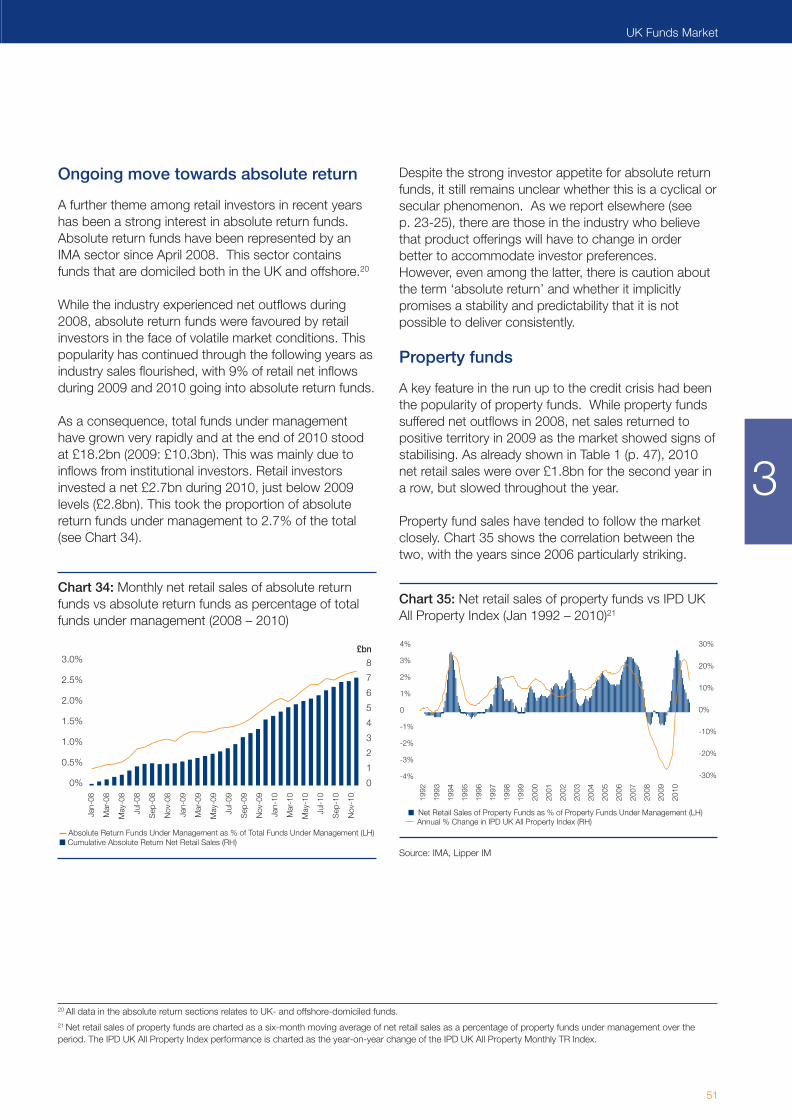
51
UK Funds Market
Ongoing move towards absolute return
A further theme among retail investors in recent yearshas been a strong interest in absolute return funds.Absolute return funds have been represented by anIMA sector since April 2008. This sector containsfunds that are domiciled both in the UK and offshore.20
While the industry experienced net outflows during2008, absolute return funds were favoured by retailinvestors in the face of volatile market conditions. Thispopularity has continued through the following years asindustry sales flourished, with 9% of retail net inflowsduring 2009 and 2010 going into absolute return funds.
As a consequence, total funds under managementhave grown very rapidly and at the end of 2010 stoodat £18.2bn (2009: £10.3bn). This was mainly due toinflows from institutional investors. Retail investorsinvested a net £2.7bn during 2010, just below 2009levels (£2.8bn). This took the proportion of absolutereturn funds under management to 2.7% of the total(see Chart 34).
Chart 34: Monthly net retail sales of absolute returnfunds vs absolute return funds as percentage of totalfunds under management (2008 – 2010)
Despite the strong investor appetite for absolute returnfunds, it still remains unclear whether this is a cyclical orsecular phenomenon. As we report elsewhere (see p. 23-25), there are those in the industry who believethat product offerings will have to change in orderbetter to accommodate investor preferences.However, even among the latter, there is caution aboutthe term ‘absolute return’ and whether it implicitlypromises a stability and predictability that it is notpossible to deliver consistently.
Property funds
A key feature in the run up to the credit crisis had beenthe popularity of property funds. While property fundssuffered net outflows in 2008, net sales returned topositive territory in 2009 as the market showed signs ofstabilising. As already shown in Table 1 (p. 47), 2010net retail sales were over £1.8bn for the second year ina row, but slowed throughout the year.
Property fund sales have tended to follow the marketclosely. Chart 35 shows the correlation between thetwo, with the years since 2006 particularly striking.
Chart 35: Net retail sales of property funds vs IPD UKAll Property Index (Jan 1992 – 2010)21
Source: IMA, Lipper IM
3.0%
2.5%
2.0%
1.5%
1.0%
0.5%
0%
8
7
6
5
4
3
2
1
0
£bn
Jan-
08
Mar
-08
May
-08
Jul-0
8
Sep
-08
Nov
-08
Jan-
09
Mar
-09
May
-09
Jul-0
9
Sep
-09
Nov
-09
Jan-
10
Mar
-10
May
-10
Jul-1
0
Sep
-10
Nov
-10
Absolute Return Funds Under Management as % of Total Funds Under Management (LH)■ Cumulative Absolute Return Net Retail Sales (RH)
30%
20%
10%
0%
-10%
-20%
-30%
4%
3%
2%
1%
0
-1%
-2%
-3%
-4%
1992
1993
1994
1995
1996
1997
1998
1999
2000
2001
2002
2003
2004
2005
2006
2007
2008
2009
2010
■ Net Retail Sales of Property Funds as % of Property Funds Under Management (LH) Annual % Change in IPD UK All Property Index (RH)
20 All data in the absolute return sections relates to UK- and offshore-domiciled funds.21 Net retail sales of property funds are charted as a six-month moving average of net retail sales as a percentage of property funds under management over theperiod. The IPD UK All Property Index performance is charted as the year-on-year change of the IPD UK All Property Monthly TR Index.
3
revsurvey 1:IMASurvey201011 22/07/2011 17:28 Page 51

52
Investment Management Association
Popularity of balanced funds and funds of funds
The very strong sales of balanced funds and funds offunds were one of the most notable features in 2010.We review these together because the two are veryclosely linked. Around three-fifths of funds of funds (interms of funds under management) sit in balancedsectors, in particular Active Managed, BalancedManaged, Cautious Managed, and UK Equity andBond Income. Net retail sales for balanced funds andfunds of funds are shown in Chart 36.
As can be seen from the chart, last year was a bumperyear for both balanced funds and funds of funds. Netretail sales of balanced funds were £6.8bn, up from
Chart 36: Net retail sales of balanced funds and fundsof funds (1998 – 2010)
£3.8bn in 2009 which, until last year, was itself the bestyear ever. Similarly, funds of funds saw net retail salesreach £6.6bn in 2010, up from £3.9bn the previousyear, which had been the best year until then.
In 2010, the Cautious Managed sector took thegreatest net inflows followed by Balanced Managedand Active Managed, the same as in the previous year(see Table 3). All these sectors saw big increases in netretail sales. Despite the substantial retail flows, totalfunds under management in the Cautious Managedsector, including institutional holdings, still lag behindthe Balanced Managed sector.
As already noted, retail investors often choosebalanced funds that are funds of funds. This can beseen as part of a greater shift towards funds of funds:
Funds of funds under management hit their highestlevel on record at the end of 2010, rising 36% year-on-year to £57.9bn. This is a higher rate of increasethan for the funds industry as a whole (20%).
These funds of funds now account for 10% of totalindustry funds under management. Ten years ago,the share was only 5%.
During 2010, funds of funds attracted a record£6.6bn of new retail money.
0
1
2
3
4
5
6
7
£bn
1998 1999 2000 2001 2002 2003 2004 2005 2006 2007 2008 2009 2010
■ Balanced Funds ■ Funds of Funds
Table 3: Net retail sales of balanced funds by sector (2009 – 2010)
Funds underSector Net retail sales (£m)5 management
(£bn) 2009 2010 2010
Cautious Managed 2,569 4,049 31.4
Balanced Managed 824 1,893 37.9
Active Managed 589 1,004 14.9
UK Equity & Bond Income -141 -108 3.6
revsurvey 1:IMASurvey201011 22/07/2011 17:28 Page 52

indu
stryview
53
UK Funds Market
Chart 37 breaks down net retail fund of funds sales byfettered (internally invested) and unfettered (externallyinvested) since 1992:
As the UK funds of funds market has matured, retailinvestors have directed sales mainly into unfetteredrather than fettered funds.
Unfettered funds have taken in 79% of net retailinvestment in the past decade. Consequently, theproportion of funds under management held withinunfettered funds was 48% at the end of 2010, verydifferent to ten years earlier when the figure was only25%.
This may reflect the shift to open architecture and“best-in-breed” manager selection practices in thepast decade.
Chart 37: Net retail sales of fettered and unfetteredfunds of funds (1992 – 2010)
Multi-asset and multi-manager funds
Retail investors don’t want to take on the riskof making specific investment decisionsthemselves, and they are looking to funds andfund managers that can be flexible enough toadapt to the market. Funds that offer aninvestment solution – or where the fund managerhas built up their reputation brand – result in hugeinflows. The multi-asset side in particular iscontinuing to grow as investors say that theydon’t want to make investment and assetallocation calls themselves.
Multi-manager is a much stronger part of themarket than it was. We’ve seen increaseddemand for global type offerings rather thancountry offerings, and increased demand in thewholesale and retail market for multi-managerdiversified.
“
”
0
1
2
3
4
5
6
7
8
1992
1993
1994
1995
1996
1997
1998
1999
2000
2001
2002
2003
2004
2005
2006
2007
2008
2009
2010
■ Fettered ■ Unfettered
£bn
”“
3
revsurvey 1:IMASurvey201011 22/07/2011 17:28 Page 53

indu
stryviewEthical funds
The IMA flags ethical funds in accordance withclassification by EIRIS (Experts in ResponsibleInvestment Solutions).
At the end of 2010, ethical funds under managementhad increased by 21% year-on-year to £6.9bn althoughthe number of funds dropped to 57 (from 61 in 2009).Funds are spread among various IMA sectors, with theUK All Companies and Global sectors showing greatestconcentration.
As a proportion of total funds under management,ethical funds have grown by over 22% each year onaverage since IMA records for this fund type began in1992, which is a higher rate of increase than for theindustry in general (15%).
Chart 38 shows the progression of ethical funds undermanagement and net retail sales from 1992 to 2010.Net retail sales of ethical funds were £340m in 2010,60% up on 2009.
Chart 38: Ethical net retail sales and funds undermanagement (1992 – 2010)
However, there are some issues around definition,which make the concept and broad scope of sociallyresponsible investment (SRI) quite difficult to determineconsistently.
The advantages and challenges of SRI
SRI is an advantage for active housesbecause you demonstrate that you can really dosomething active about it. The issue is that it’sbecoming too wide. SRI is starting to address allsorts of issues: employment practices, naturepreservation, deforestation, etc. and it’s becomingway too dispersed.
Newly launched funds
During 2010, the IMA collected data on 153 newlylaunched funds, into which retail investors made a netinvestment of £2.6bn.22 As can be seen from Chart 39,newly launched fund sales followed the trend of thewider market with non-UK equity, bond and balancedfunds taking the majority of sales.
Chart 39: Net retail sales of newly launched funds byfund/asset type
£m
500
450
400
350
300
250
200
150
100
50
0
£bn
8
7
6
5
4
3
2
1
0
1992
1993
1994
1995
1996
1997
1998
1999
2000
2001
2002
2003
2004
2005
2006
2007
2008
2009
2010
■ Net Retail Sales (LH) Funds Under Management (RH)
“
”
Absolute Return - UK0.6%
Bonds31.0%
Protected11.4%
Non-UK Equities19.4%
UK Equities2.4%
Balanced35.1%
54
Investment Management Association
22 This figure is based on the number of funds launched during 2010 which the IMA collects data for.
revsurvey 1:IMASurvey201011 22/07/2011 17:28 Page 54

Offshore-Domiciled FundsDistributed in the UK
In January 2010 offshore funds were included in theIMA sectors for the first time. These funds are FSA-recognised funds domiciled overseas and sold into theUK with distributor status. From the end of May 2012,this will become “reporting status” – offshore funds willneed to report their income to UK investors but will nothave to distribute it.
The IMA has collected data on these funds since July2006:
The number of funds for which data is collectedstood at 601 at the end of 2010, up from 573 a yearearlier, and it represented funds from 37 firms. Totalfunds under management on behalf of UK investorswere £27.3bn, an increase of 8.4% compared toDecember 2009.
Net retail sales of non-UK domiciled funds into theUK were £1.4bn for 2010, down from £1.6bn theprevious year.
A substantial part of this net retail inflow was withinthe IMA Absolute Return sector, which received£320m from retail investors.
The low level of assets in non-UK domiciled funds soldto UK investors contrasts strongly with the sizeableportion of non-UK domiciled funds whose assets aremanaged here (see p. 83).
Distribution Dynamics and theirImplications
Back in 2000, one-half of gross retail fund sales weremade direct to investors by fund companies. Thisdecreased to 13% last year, mainly through companysales forces or tied agents.
Meanwhile, fund platforms have become a significantfeature of fund distribution, taking 38% of gross retailsales last year when changes to the IMA’s statisticscollection enabled separate data to be collated forthese platforms for the first time.
These figures show that fund platforms made net salesof £13.2bn in 2010. The IMA also collects moredetailed information on the five large platforms, whichby the close of 2010 had £107bn funds underadministration. This was up 29% over the year,boosted by net sales as well as rising markets and re-registrations of funds to these platforms.
Fund platforms have become especially prominent inthe ISA market. Gross ISA sales by these five platformswere £8.7bn in 2010 compared with £6.6bn by fundcompanies themselves. Just two years earlier,platforms and fund companies were selling similarproportions to one another.
For these platforms, tax-wrapped products generatedthe majority of 2010 gross fund sales, with personalpensions (incl. Self-invested Personal Pensions)accounting for 28%, ISAs taking 27%, and on-shoreand offshore investment bonds 9%. The remainingplatform sales did not benefit from a tax wrapper.
The web has made it easier for investors and financialadvisers to buy and sell funds. It has also made it easierfor them to monitor the performance of theirinvestments. Fund platforms have played a big part inthis change and these developments are likely to beone reason why fund managers are experiencinggreater flow volatility. The estimated average time forwhich investors hold funds has shown a decline inrecent years.
55
UK Funds Market
3
revsurvey 1:IMASurvey201011 22/07/2011 17:28 Page 55

56
Investment Management Association
Chart 40 shows a declining trend in the average holdingperiod for retail investors, based on a calculation of theinverse of the average annualised redemption rate forall retail funds.
Chart 40: Estimated average holding period of retailinvestors (2004 – 2010)
UK Industry Concentration and Structure
By the end of 2010, there were 101 fund companies(ie. companies operating funds but not necessarilyresponsible for managing the assets) in the UK, downfrom 118 five years earlier. The drop is due to acombination of a number of small-level closures andconsolidation (mainly mid-level acquisitions during2010). The effect of this activity has seen acorresponding decrease in top-level concentration.However, as we outline below, it has also seen anincrease in mid-level concentration.
The UK fund management industry remains a highlycompetitive environment, with the top ten firmsrepresenting approximately 45% of total industry UK-authorised funds under management at the end ofDecember 2010, a similar level to the early 1990s.Chart 41 shows the top ten fund companies by totalretail and institutional funds under management at theend of December 2010, while Chart 42 overleaf showsthe top ten firms in terms of only retail funds undermanagement.23
0
1
2
3
4
5
6
7
Years
2004 2005 2006 2007 2008 2009 2010
Chart 41: Top ten UK fund companies by total funds under management (2009 – 2010)
0 5 10 15 20 25 30 35 40
Invesco Fund Managers
M & G Securities
FIL Investment Management
Legal & General (Unit Trust) Managers
Schroder Unit Trusts
HBOS Investment Fund Managers
BlackRock Investment Management
BNY Mellon Fund Managers
SLTM
Threadneedle Investment Services
■ 2009 ■ 2010
38.034.4
30.022.9
28.827.1
27.825.2
23.619.9
23.519.2
22.717.0
22.516.9
22.322.8
21.819.1
£bn
23 In this context, retail funds are defined as funds with a minimum lump sum investment amount of up to £10,000 and with at least one third of gross sales over thepreceding three years being retail.
revsurvey 1:IMASurvey201011 22/07/2011 17:28 Page 56

57
UK Funds Market
As can be seen from Chart 43, the share of the top tenfirms in terms of total funds under management haschanged little over the last fifteen years. However, whilethe share of the top ten companies has stayed thesame, the composition has changed significantly. Onlysix companies have remained in the top ten since1995. The top ten companies today had betweenthem 33% of the market in 1994.
Bigger changes have taken place outside the top ten.The combined market share of the fund companiesranked between 11th and 20th increased from 16% to28% between 1995 and 2010. Thus the top 20companies increased their share from 60% to 72%.
Chart 43: Combined market share of top firms byfunds under management (1995 – 2010)24
The market share of companies ranked between 21stand 30th also increased marginally – from 12% to 13%over the same period. Overall, the top 30 companiestook 86% of the market at the end of 2010. However,the market share of companies outside the top 30declined substantially from 29% in 1995 to 14% in 2010.
100%
80%
60%
40%
20%
0%
1995
1996
1997
1998
1999
2000
2001
2002
2003
2004
2005
2006
2007
2008
2009
2010
Remaining Firms
Chart 42: Top ten UK fund companies by retail funds under management (2009 – 2010)
0 5 10 15 20 25 30 35 40
Invesco Fund Managers
M & G Securities
FIL Investment Management
Threadneedle Investment Services
Jupiter Unit Trust Managers
Legal & General (Unit Trust) Managers
SWIP Fund Management
Schroder Unit Trusts
BlackRock Investment Management
Capita Financial Managers
■ 2009 ■ 2010
37.133.2
27.7
19.9
21.918.8
19.716.3
18.816.2
17.213.7
16.4
13.9
14.010.8
13.310.0
13.010.0
£bn
24 The market shares are presented as cumulative percentages in Charts 43, 45 and 46.
3
revsurvey 1:IMASurvey201011 22/07/2011 17:28 Page 57

58
Investment Management Association
Measuring concentration
A common metric for the measurement of industryconcentration is the Herfindahl-Hirschmann Index (HHI)which applies a greater weighting to those firms withlarger market shares. The clear conclusion fromapplying this measure is that the fund industry ishistorically and currently very unconcentrated.
A reading on this index of over 1,000 is usually taken toindicate mild concentration and a value over 1,800indicates high concentration. The reading at the end of2010 for the UK funds industry was 298 compared with312 a year earlier.
This very low level of concentration is consistent with avery competitive industry. In measuring concentration,we have used market shares of funds undermanagement (rather than sales, for example). This isbecause funds under management are the maindeterminant of the industry’s revenue stream, and aremost representative of the service that the industrydelivers to its investors – the management of theirmoney.
It is also interesting to look at the sales figures in thiscontext since sales can be a forward indicator of trendsin funds under management. Firms with larger sharesof sales than funds under management will tend toincrease their share of funds under management overtime.
At the close of 2010, the top ten companies (as per thesize of their funds under management) had a 36%share of gross fund sales compared with a 45% shareof funds under management. The next ten companieshad a 39% share of fund sales and a 28% share offunds under management. There is no indication herethat the top ten companies are strengthening their gripon the funds market.
Notwithstanding the lack of change in the firmlyunconcentrated nature of the funds market, there wereclear winners and losers amongst fund managers in thecompetition for retail sales in 2010.
Chart 44 shows the distribution of net retail salesacross all fund managers. In a year of strong inflows,there were more fund companies with inflows thanoutflows – 61 companies experienced net retail inflowsand 42 companies had net outflows. Three companieshad net retail inflows of more than £2bn and twocompanies experienced net outflows greater than£500m.
Chart 44: Fund operator net retail sales
As well as sales performance, there are other factorsthat affect the evolution of firms’ shares of industryfunds under management: the rate of redemption oftheir units by investors, the investment performance oftheir funds and company takeovers.
£m
4,000
3,500
3,000
2,500
2,000
1,500
1,000
500
0
-500
-1,000
-1,500
revsurvey 1:IMASurvey201011 22/07/2011 17:28 Page 58

59
UK Funds Market
Fund platforms and the web have made it easier forinvestors and advisers to monitor fund performanceand switch between funds. One can therefore also lookat whether flows into individual funds have becomemore concentrated in recent years. Chart 45 shows theshares of the top ten, 20, 50 and 100 funds in terms offunds under management and Chart 46 does this interms of gross sales:
As noted earlier, there were 2,574 funds at the closeof 2010. Just ten of these funds accounted for 11%of funds under management and the top 100 fundstook 43%. Both were slightly down on 2009 but inline with most of the last 15 years.
Fund sales are more concentrated than funds undermanagement. As with funds under management,the market share of the top funds has fluctuatedover the years. However, there has been someevidence of an upward trend developing particularlyover the last two years. In terms of gross sales, thetop ten best-selling funds took 17% in 2010, upfrom 16% a year earlier and 13% in 2005. The top100 took 55% of total sales compared with 52% ayear earlier and 47% in 2005.
In addition, this recent trend towards concentration canbe seen in Table 4, with the median fund size risingmore slowly than the mean fund size. Whilst the topten funds in 2010 had an average £6.2bn undermanagement, one-half of all funds managed less than£74.1m. The distribution of fund sizes is highlyskewed.
Chart 45: Combined market share of top funds byfunds under management (1995 – 2010)
Chart 46: Combined market share of top funds by gross sales (1995 – 2010)
Table 4: Mean and median fund sizes (2001 – 2010)
Mean MedianNo. of funds (£m) (£m)
2001 2,507 126.5 39.1
2002 2,512 103.4 30.9
2003 2,381 131.1 40.6
2004 2,396 147.6 47.2
2005 2,354 185.1 63.0
2006 2,406 215.9 71.3
2007 2,499 230.6 69.6
2008 2,600 165.5 46.6
2009 2,524 217.0 59.6
2010 2,574 278.8 74.1
In summary:
The top ten firms control 45% of funds undermanagement, broadly the same as 15 years ago.
Although the HHI indicator confirms that the industryas a whole continues to be unconcentrated, there isa trend towards greater concentration in the mid-market, in particular firms ranked 11th to 20th, atthe expense of smaller firms.
Gross fund flows have also become moreconcentrated in recent years, with the top 100 fundstaking 55% of sales last year compared with 47% in2005.
100%
80%
60%
40%
20%
0%
1995
1996
1997
1998
1999
2000
2001
2002
2003
2004
2005
2006
2007
2008
2009
2010
■ Top 10 ■ Top 20 ■ Top 50 ■ Top 100 ■ Remaining Funds
1995
1996
1997
1998
1999
2000
2001
2002
2003
2004
2005
2006
2007
2008
2009
2010
100%
90%
80%
70%
60%
50%
40%
30%
20%
10%
0%
■ Top 10 ■ Top 20 ■ Top 50 ■ Top 100 ■ Remaining Funds
3
revsurvey 1:IMASurvey201011 22/07/2011 17:28 Page 59

60
Investment Management Association
The European Context
Focusing just on the market for UCITS funds, whichaccounts for 75% of funds under management acrossEurope, industry funds under management rose to€6.0trn by the end of 2010, just short of the recordlevel of 2007 (€6.2trn). Total European investmentfunds reached €8.0trn, up from €7.1trn a year earlier.
The European funds market remains very different fromthe UK, both in terms of distribution and fundpreferences:
Whereas UK retail fund distribution takes placemainly through IFAs, continental distribution remainsdominated by banks and insurance companies.
At the end of 2010, some 57% of UK funds undermanagement were in equity funds compared withan average 32% in the rest of Europe.
Money market funds have a larger profile in Europe,accounting for 22% of retail investment. In the UK,on the other hand, they have a minimal uptakeamong retail investors (0.7%).
However, the UK is not alone in this strong equity biasamong investors, and a wide dispersion of assetpreference across countries continues to be a strikingfeature of the European funds market (see Chart 47).
Chart 47: Breakdown of UCITS funds undermanagement by fund domicile
Source: IMA, EFAMA
Sweden
Slovenia
Belgium
Norway
United Kingdom
Germany
Denmark
Finland
Poland
Luxembourg
EUROPEAN AVERAGE
Bulgaria
Switzerland
Spain
France
Greece
Hungary
Portugal
Austria
Czech Republic
Italy
Liechtenstein
Slovakia
Romania
Turkey
■ Equity ■ Bonds ■ Balanced ■ Money Market ■ Others
0% 10% 20% 30% 40% 50% 60% 70% 80% 90% 100%
revsurvey 1:IMASurvey201011 22/07/2011 17:28 Page 60

61
UK Funds Market
In terms of sales, the strong inflows of €150bn seenduring 2009 were bettered in 2010 with net inflowsreaching €166bn. This was despite money marketfunds suffering outflows of €126bn. These moneymarket flows in continental Europe reflect very differenttraditions of usage of such funds by investorscompared to the UK where bank and building societydeposits are the norm for such savings.
Chart 48 displays net sales of European UCITS fundsby asset class for the top ten countries (ranked by thesize of their total funds under management),25
expressed as a percentage of average UCITS assetsduring 2010.
Chart 48: Net sales of UCITS by asset class aspercentage of total UCITS funds under management,selected countries
Source: EFAMA
Despite the contrasting cultures, European investorswere putting increasing amounts into equity fundsahead of the financial crisis, catching up with the UK interms of equity investment. This can be seen fromChart 49 which shows net UCITS sales of equity fundsper capita in the UK and in Europe over the last tenyears.26
As seen in Chart 49, both UK and other Europeaninvestors began to sell equity funds during 2007. Thefollowing year, European investors sold equity fundsworth €356 per capita compared with net sales by UKresidents of €92 per capita. These net redemptions bynon-UK European investors amounted to 6% of fundsunder management in equity funds at the beginning ofthe year compared with 1% for UK investors calculatedon the same basis.
Chart 49: Net sales of equity funds per capita, UK andEurope ex UK (2001 – 2010)
Source: IMA, EFAMA
Both UK and other European investors returned to netinvestment in equity funds in 2009 and 2010. UKinvestors showed greater confidence, adding to theirholdings of equity funds at a higher rate than otherEuropeans.
15%
10%
5%
0%
-5%
-10%
-15%
Equity Bond Balanced Money Market Others
Luxe
mbo
urg
Fran
ce
Uni
ted
Kin
gdom
Ger
man
y
Italy
Spa
in
Sw
itzer
land
Sw
eden
Aus
tria
Den
mar
k
-400
-350
-300
-250
-200
-150
-100
-50
0
50
100
150
200
250
300
2001 2002 2003 2004 2005 2006 2007 2008 2009 2010
■ UK ■ Europe ex UK
€
25 Excluding Ireland, as granular asset level data is not available.26 These figures cover all sales both to retail and institutional investors as EFAMA do not show retail investors separately.
3
revsurvey 1:IMASurvey201011 22/07/2011 17:28 Page 61

62
Investment Management Association
4. Operational and Structural Issues
Key Findings
Revenue and fee structures
Survey data suggests that total industry revenue(net of commission) rose 26% in 2010, taking theoverall estimate to £11bn. As a percentage ofaverage assets under management, this equated to 30bps.
Costs rose by 24% to an estimated £7.3bn (£5.9bnin 2009), having fallen for the two previous years.
The industry operating margin was 34%, still below2007 levels.
The use of performance-based fees increasedslightly in 2010 (85% of respondents as opposed to82% in 2009), although at 16% it still accounts for acomparatively small amount of the total UK-managed asset base. Performance fees are mostcommonly used in institutional, absolute return andhedge fund product offerings.
Employment
Estimated total direct industry employmentincreased by over 4% this year to 25,000 (24,000 in2009). Employment thus approached pre-crisislevels on the back of continuing industry recoveryand increasing investor confidence.
This figure, however, still understates overall industryemployment due to increased outsourcing of anumber of business activities to third-partyproviders. In 2010, 78% of respondents outsourcedsome part of their business.
Industry concentration andconsolidation
Although the market share of the top ten assetmanagement firms remains above 50%, M&Aactivity measured in asset terms has slowed downin 2010 compared to 2009.
The combined effect of industry consolidation andasset growth has solidified the predominance ofautonomous asset managers, accounting for nearly40% of UK assets under management.
Boutique members of the IMA had a strong year,experiencing an average year-on-year increase inUK managed assets of 38% compared with 14%among IMA members overall.
Regulatory environment
Despite widespread acceptance of tighterregulation, concerns remain over the potential foradverse consequences resulting from poorlytargeted or insufficiently coordinated measures.
Greater regulatory scrutiny, resulting in increasedoperating costs, may provide a competitiveadvantage for larger firms.
revsurvey 1:IMASurvey201011 22/07/2011 17:28 Page 62

4
63
Operational and Structural Issues
Revenue and Costs
Firms were asked to report total cost and revenuenumbers. The data presented below includes both in-house and third party activity:
Total industry revenue (net of commission) rose 26%during 2010, having fallen 7% during 2009 and 8%during 2008. This takes the overall estimatedrevenue to £11bn, from £8.8bn in 2009. While thisis above the level seen in 2007 (see Chart 50),expressed as a percentage of average assets undermanagement, 2010 revenue was lower (30bps vs32bps in 2007).
Total costs rose by 24% during 2010, having fallen8% over 2008 and 2009, and are now estimated at£7.3bn. As a proportion of assets, this represents20bps (from 18bps in 2009 and 20bps in 2007).Cost increases have been driven by a range offactors, including higher headcounts, variablecompensation arrangements, businessdevelopment and regulatory compliance.
The overall industry gross operating margin was34% (from 33% in 2009).27 This is still lower than in2007 (37%).
Expressed as a proportion of GDP, industry net revenuerepresents 0.7%.28 This is an increase on the levelsseen in 2006-2009, driven by higher revenues and littlechange in the UK GDP numbers. The revenuecontribution of the wider asset management industry(including hedge fund and private equity) is estimated tobe close to 1.2%. Factoring in downstream andoutsourced activity will lead to a significantly highercontribution. In balance of payments terms, ONSestimates suggest a positive contribution of £2.9bn in 2009.
Chart 50: Industry net revenue vs revenue and costs aspercentage of average assets under management(2006 – 2010)
Performance Fees
Just under 85% of respondents use performance feesin parts of their business, a small increase on last year(see Table 5). However, the majority of firms usingperformance fees are doing so on a comparativelysmall proportion of their assets (see Table 6 overleaf)and responses suggest that the total asset basesubject to such fees is only 16%.
Table 5: Proportion of firms using performance fees(2008 – 2010)
2008 2009 2010
Proportion of firms using performance fees 83% 82% 85%
12
10
8
6
4
2
0
50
40
30
20
10
02006 2007 2008 2009 2010
£bn bps
■ Net Revenue (LH) Revenue as % of Average Assets Under Management (RH) Costs as % of Average Assets Under Management (RH)
4. Operational and Structural Issues
27 Calcuated as net revenue less costs divided by net revenue. 28 This is based on net revenue adjusted for output that may be accounted for in other market sectors.
revsurvey 1:IMASurvey201011 22/07/2011 17:28 Page 63

64
Investment Management Association
We also asked firms to tell us in what parts of theirbusiness performance fees were most widely used:
Nearly a half of respondents identified theirinstitutional business.
Just under a third pointed to absolute return andhedge funds.
The remainder pointed to other areas such as retailfunds and investment trusts.
Table 6: Proportion of assets under managementsubject to performance fees
Proportion of assets Total UKunder management Percentage assets undersubject to of managementperformance fees respondents (£m)
0% 15% 52,001
1-5% 23% 1,005,582
6-10% 13% 750,865
11-25% 23% 440,193
26-50% 8% 256,125
>50% 17% 370,864
TOTAL 100% 2,875,631
While institutional business still predominates withrespect to the use of performance fees, responses overrecent years suggest that there is increasing interest intheir application to retail products. Just under a half ofthe respondents (47%) to this year’s Survey indicatedthat they were using performance fees for retailproducts, up from over a third in 2009 and from justunder a quarter in 2008 (see Table 7). However, thisrefers to retail funds where the assets are managed inthe UK and not necessarily funds that are distributed inthe UK.
Table 7: Use of performance fees in retail products(2008 – 2010)
2008 2009 2010
Proportion of firms usingperformance fees inretail products 24% 37% 47%
The change in performance fee usage over the pastyear and expectations for future use are shown in Table 8. One can see that over 80% of those who haveseen increases over the past year expect furtherincreases in the coming year, identifying institutionalbusiness as the area of likely increase.
Table 8: Change over past year and expectation of future use of performance fees
Has the use of performance-based Total UK assets Percentage of totalfees in your product range become Percentage of under management assets subjectmore prevalent over the past year? respondents (£bn) to performance fee
Yes 36% 1,621 15%
No 64% 1,270 18%
Of those who answered Yes, do you expect further increases in the coming year?
Yes 84% 1,327 13%
No 16% 295 25%
Of those who answered No, do you expect further increases in the coming year?
Yes 9% 19 23%
No 91% 1,250 17%
revsurvey 1:IMASurvey201011 22/07/2011 17:28 Page 64

65
Operational and Structural Issues
Employment
From questionnaire responses, we estimate directemployment numbers for UK-based assetmanagement activity at 25,000, up from 24,000 lastyear. The over 4% increase in overall headcount is likelyto be a further reflection of industry recovery on theback of buoyant market performance and stronginflows. Direct employment in 2010 thus significantlyapproached the headcount levels in 2007, when itstood at 25,500 (see Chart 51).
Chart 51: Industry headcount estimate (2006 – 2010)
Chart 52 shows a distribution of respondents by totalstaff size (direct employment only) and illustrates thatthe majority of firms (53%) employ less than 200 staffmembers. Considering that the respondent sample isweighted towards larger firms, however, it is likely tounderstate the industry-wide proportion of small firms, and therein particularly those with less than 50 employees.
Chart 52: Percentage breakdown of respondents bytotal staff size (direct employment only)
2006 2007 2008 2009 20100
5,000
10,000
15,000
20,000
25,000
30,000
0%
5%
10%
15%
20%
25%
30%
<50 50-200 201-500 501-1000 >1000
Total Staff Size (direct employment only)
Per
cent
age
of
Res
po
nden
ts
4
revsurvey 1:IMASurvey201011 22/07/2011 17:28 Page 65
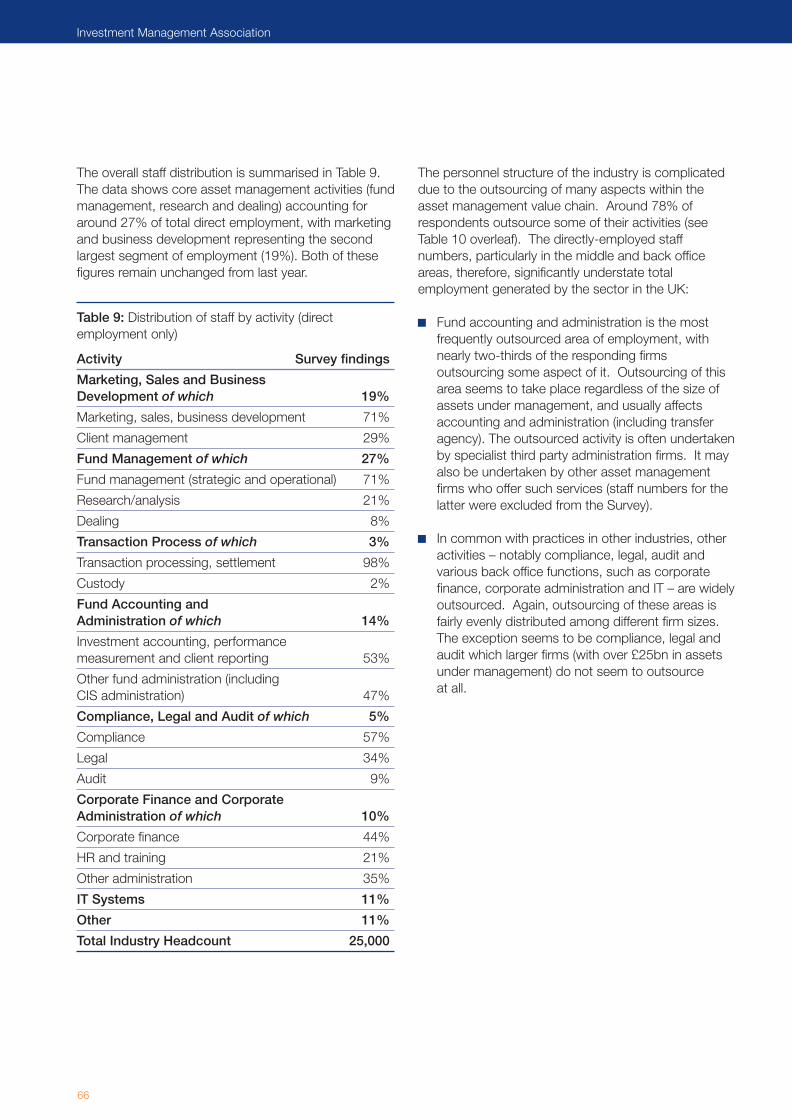
66
Investment Management Association
The overall staff distribution is summarised in Table 9.The data shows core asset management activities (fundmanagement, research and dealing) accounting foraround 27% of total direct employment, with marketingand business development representing the secondlargest segment of employment (19%). Both of thesefigures remain unchanged from last year.
The personnel structure of the industry is complicateddue to the outsourcing of many aspects within theasset management value chain. Around 78% ofrespondents outsource some of their activities (seeTable 10 overleaf). The directly-employed staffnumbers, particularly in the middle and back officeareas, therefore, significantly understate totalemployment generated by the sector in the UK:
Fund accounting and administration is the mostfrequently outsourced area of employment, withnearly two-thirds of the responding firmsoutsourcing some aspect of it. Outsourcing of thisarea seems to take place regardless of the size ofassets under management, and usually affectsaccounting and administration (including transferagency). The outsourced activity is often undertakenby specialist third party administration firms. It mayalso be undertaken by other asset managementfirms who offer such services (staff numbers for thelatter were excluded from the Survey).
In common with practices in other industries, otheractivities – notably compliance, legal, audit andvarious back office functions, such as corporatefinance, corporate administration and IT – are widelyoutsourced. Again, outsourcing of these areas isfairly evenly distributed among different firm sizes.The exception seems to be compliance, legal andaudit which larger firms (with over £25bn in assetsunder management) do not seem to outsource at all.
Table 9: Distribution of staff by activity (directemployment only)
Activity Survey findings
Marketing, Sales and Business Development of which 19%
Marketing, sales, business development 71%
Client management 29%
Fund Management of which 27%
Fund management (strategic and operational) 71%
Research/analysis 21%
Dealing 8%
Transaction Process of which 3%
Transaction processing, settlement 98%
Custody 2%
Fund Accounting and Administration of which 14%
Investment accounting, performance measurement and client reporting 53%
Other fund administration (including CIS administration) 47%
Compliance, Legal and Audit of which 5%
Compliance 57%
Legal 34%
Audit 9%
Corporate Finance and Corporate Administration of which 10%
Corporate finance 44%
HR and training 21%
Other administration 35%
IT Systems 11%
Other 11%
Total Industry Headcount 25,000
revsurvey 1:IMASurvey201011 22/07/2011 17:28 Page 66
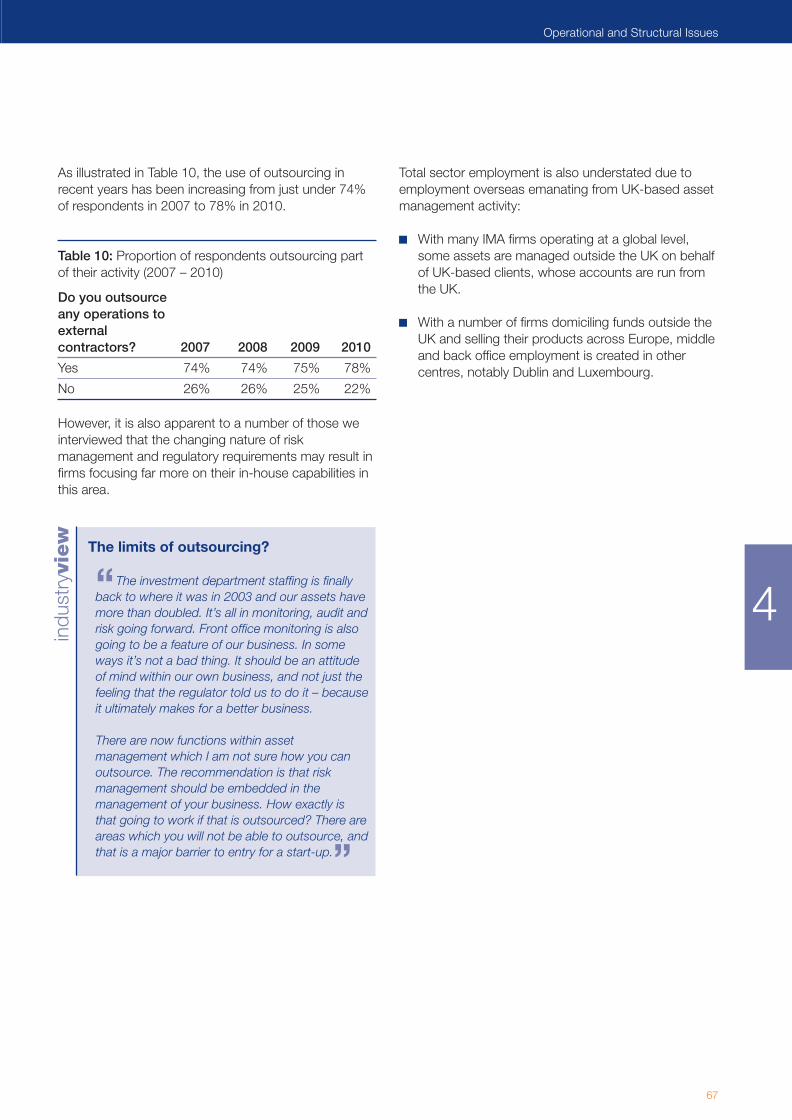
indu
stryview
67
Operational and Structural Issues
As illustrated in Table 10, the use of outsourcing inrecent years has been increasing from just under 74%of respondents in 2007 to 78% in 2010.
Table 10: Proportion of respondents outsourcing partof their activity (2007 – 2010)
Do you outsource any operations to external contractors? 2007 2008 2009 2010
Yes 74% 74% 75% 78%
No 26% 26% 25% 22%
However, it is also apparent to a number of those weinterviewed that the changing nature of riskmanagement and regulatory requirements may result infirms focusing far more on their in-house capabilities inthis area.
The limits of outsourcing?
The investment department staffing is finallyback to where it was in 2003 and our assets havemore than doubled. It’s all in monitoring, audit andrisk going forward. Front office monitoring is alsogoing to be a feature of our business. In someways it’s not a bad thing. It should be an attitudeof mind within our own business, and not just thefeeling that the regulator told us to do it – becauseit ultimately makes for a better business.
There are now functions within assetmanagement which I am not sure how you canoutsource. The recommendation is that riskmanagement should be embedded in themanagement of your business. How exactly isthat going to work if that is outsourced? There areareas which you will not be able to outsource, andthat is a major barrier to entry for a start-up.
Total sector employment is also understated due toemployment overseas emanating from UK-based assetmanagement activity:
With many IMA firms operating at a global level,some assets are managed outside the UK on behalfof UK-based clients, whose accounts are run fromthe UK.
With a number of firms domiciling funds outside theUK and selling their products across Europe, middleand back office employment is created in othercentres, notably Dublin and Luxembourg.
”
“ 4
revsurvey 1:IMASurvey201011 22/07/2011 17:28 Page 67
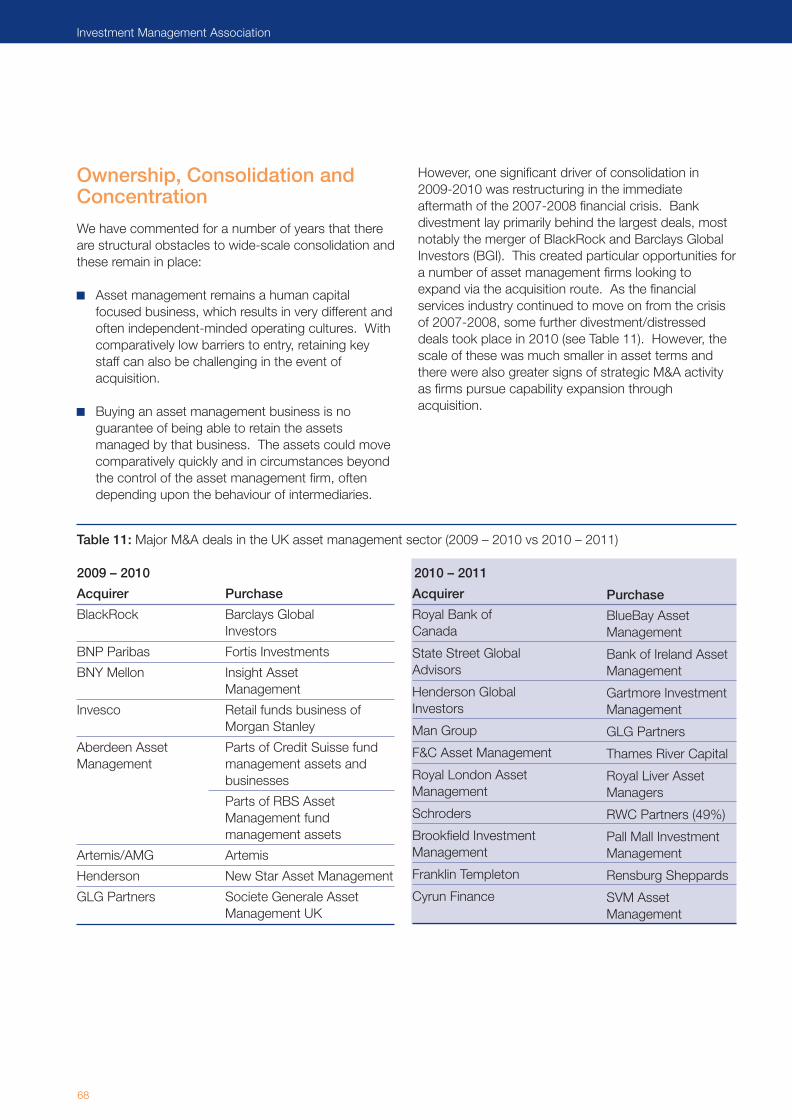
68
Investment Management Association
Ownership, Consolidation andConcentration
We have commented for a number of years that thereare structural obstacles to wide-scale consolidation andthese remain in place:
Asset management remains a human capitalfocused business, which results in very different andoften independent-minded operating cultures. Withcomparatively low barriers to entry, retaining keystaff can also be challenging in the event ofacquisition.
Buying an asset management business is noguarantee of being able to retain the assetsmanaged by that business. The assets could movecomparatively quickly and in circumstances beyondthe control of the asset management firm, oftendepending upon the behaviour of intermediaries.
However, one significant driver of consolidation in2009-2010 was restructuring in the immediateaftermath of the 2007-2008 financial crisis. Bankdivestment lay primarily behind the largest deals, mostnotably the merger of BlackRock and Barclays GlobalInvestors (BGI). This created particular opportunities fora number of asset management firms looking toexpand via the acquisition route. As the financialservices industry continued to move on from the crisisof 2007-2008, some further divestment/distresseddeals took place in 2010 (see Table 11). However, thescale of these was much smaller in asset terms andthere were also greater signs of strategic M&A activityas firms pursue capability expansion throughacquisition.
Purchase
BlueBay AssetManagement
Bank of Ireland AssetManagement
Gartmore InvestmentManagement
GLG Partners
Thames River Capital
Royal Liver Asset Managers
RWC Partners (49%)
Pall Mall InvestmentManagement
Rensburg Sheppards
SVM Asset Management
Acquirer Purchase
BlackRock Barclays Global Investors
BNP Paribas Fortis Investments
BNY Mellon Insight Asset Management
Invesco Retail funds business ofMorgan Stanley
Aberdeen Asset Parts of Credit Suisse fundManagement management assets and
businesses
Parts of RBS Asset Management fund management assets
Artemis/AMG Artemis
Henderson New Star Asset Management
GLG Partners Societe Generale AssetManagement UK
Table 11: Major M&A deals in the UK asset management sector (2009 – 2010 vs 2010 – 2011)
2009 – 2010 2010 – 2011
Acquirer
Royal Bank of Canada
State Street Global Advisors
Henderson Global Investors
Man Group
F&C Asset Management
Royal London Asset Management
Schroders
Brookfield Investment Management
Franklin Templeton
Cyrun Finance
revsurvey 1:IMASurvey201011 22/07/2011 17:28 Page 68
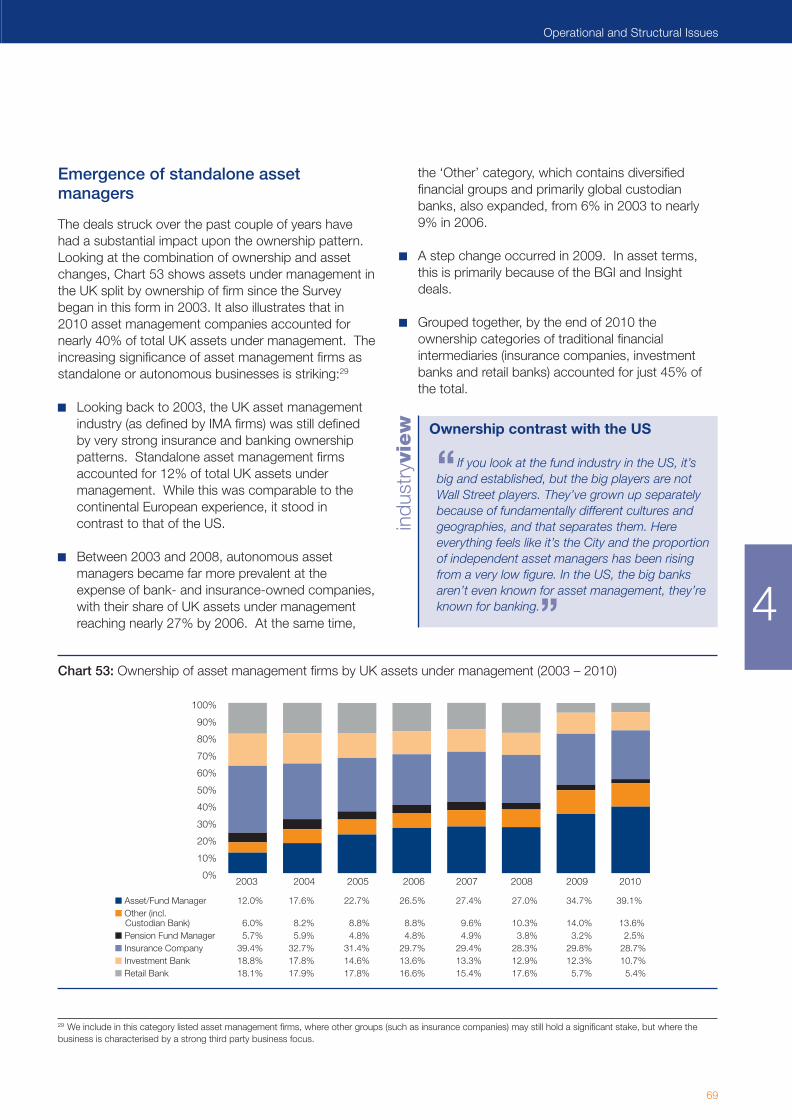
indu
stryview
Emergence of standalone assetmanagers
The deals struck over the past couple of years havehad a substantial impact upon the ownership pattern.Looking at the combination of ownership and assetchanges, Chart 53 shows assets under management inthe UK split by ownership of firm since the Surveybegan in this form in 2003. It also illustrates that in2010 asset management companies accounted fornearly 40% of total UK assets under management. Theincreasing significance of asset management firms asstandalone or autonomous businesses is striking:29
Looking back to 2003, the UK asset managementindustry (as defined by IMA firms) was still definedby very strong insurance and banking ownershippatterns. Standalone asset management firmsaccounted for 12% of total UK assets undermanagement. While this was comparable to thecontinental European experience, it stood incontrast to that of the US.
Between 2003 and 2008, autonomous assetmanagers became far more prevalent at theexpense of bank- and insurance-owned companies,with their share of UK assets under managementreaching nearly 27% by 2006. At the same time,
the ‘Other’ category, which contains diversifiedfinancial groups and primarily global custodianbanks, also expanded, from 6% in 2003 to nearly9% in 2006.
A step change occurred in 2009. In asset terms,this is primarily because of the BGI and Insightdeals.
Grouped together, by the end of 2010 theownership categories of traditional financialintermediaries (insurance companies, investmentbanks and retail banks) accounted for just 45% ofthe total.
Ownership contrast with the US
If you look at the fund industry in the US, it’sbig and established, but the big players are notWall Street players. They’ve grown up separatelybecause of fundamentally different cultures andgeographies, and that separates them. Hereeverything feels like it’s the City and the proportionof independent asset managers has been risingfrom a very low figure. In the US, the big banksaren’t even known for asset management, they’reknown for banking.
“
”
69
Operational and Structural Issues
Chart 53: Ownership of asset management firms by UK assets under management (2003 – 2010)
0%
20%
40%
60%
80%
100%
2003 2004 2005 2006 2007 2008 2009 2010
10%
30%
50%
70%
90%
■ Asset/Fund Manager 12.0% 17.6% 22.7% 26.5% 27.4% 27.0% 34.7% 39.1% ■ Other (incl. Custodian Bank) 06.0% 08.2% 08.8% 08.8% 09.6% 10.3% 14.0% 13.6% ■ Pension Fund Manager 05.7% 05.9% 04.8% 04.8% 04.9% 03.8% 03.2% 02.5% ■ Insurance Company 39.4% 32.7% 31.4% 29.7% 29.4% 28.3% 29.8% 28.7%■ Investment Bank 18.8% 17.8% 14.6% 13.6% 13.3% 12.9% 12.3% 10.7%■ Retail Bank 18.1% 17.9% 17.8% 16.6% 15.4% 17.6% 05.7% 05.4%
29 We include in this category listed asset management firms, where other groups (such as insurance companies) may still hold a significant stake, but where thebusiness is characterised by a strong third party business focus.
4
revsurvey 1:IMASurvey201011 22/07/2011 17:28 Page 69

indu
stryview
70
Investment Management Association
At the same time, ownership categories by parentgroup are becoming less meaningful. First, cross-sector consolidation and expansion is creating agrowing number of global diversified financial servicesfirms, which will often combine a wide range of servicesto retail and institutional clients. Second, the businessrealities for asset management subsidiaries are oftenquite different than their ownership structure mightsuggest:
Some firms within larger banking and insurancegroups have a longstanding or growing emphasison external business as a defining element, asopposed to the more usual relationships which seestrong internal commercial ties.
Open architecture in the insurance and bankingsectors, and the rise of fund platforms, means thatthe notion of a bank-owned or insurance-ownedasset manager is also less relevant for retaildistribution than it may have been in the past.Within parts of the UK insurance industry, there isnow an increasing focus on asset gathering, withplatforms including products from third partymanagers.
These changing structures also make the relationshipsbetween firms in the asset management anddistribution arena increasingly complicated. Forexample, an insurance-owned asset manager might bedistributing through both a parent group’s distributionnetwork and third party platforms. Equally, an assetmanager could be providing services to clients whoseown products compete with those of that assetmanager’s parent group.
Views continue within the industry about the merits ofdifferent ownership and operating structures. It is by nomeans the case that all asset managers perceive aneed to work in independently owned assetmanagement firms. Some of those we spoke toappreciate what they perceive as the security thatcomes with a large financial services parent. As alreadyreported, in an uncertain environment, there is aperceived competitive advantage potentially arisingfrom being associated with a parent with a largebalance sheet.
Impact of different ownershipstructures
Fund houses that are part of large financialgroups had a balance sheet benefit going throughwhat were particularly tough times. Particularly ifyou’re a small equity house, and you wentthrough the two to three years the industry’s beenthrough, and you see a massive fall in yourrevenue, there’s a limit to what you can do torebalance your cost. Most of our businessesdon’t have a massive variable cost base, peopleare the biggest cost.
The negative is the reputational damage that hasbeen done to the financial services sector as awhole. Everybody points to banks but financialservices in general have been very badly tarnishedover the past two years. So if you’re part of thegroup, you suffer more from this than if you werea small boutique that clearly had nothing to dowith it.
Bank-owned firm
You need stable ownership. Your clients willwant to know that there’s going to be no changeto the business model and they’re going to bedealing with the same institution. We need stabilityand secure, long-term ownership. This businesshas boomed under that ownership structure, andit was in part because we didn’t have to exposeourselves to quarterly reporting. If you constantlyhave to think about what you’re going to say, youjust get short-term.
Insurance-owned firm
I think that people are beginning to rediscoverthe benefit of asset managers being independentof bigger financial institutions, and in particularbanks who had to divest their asset managementbusiness to rebuild their balance sheets. Theemployees of asset management firms are alsorediscovering the joys of not having multiplemasters but the client being the master. Clientsare beginning to realise the simplicity of it all andthere is much more alignment across theindustry.
Independent firm
“
”“
”“
”
revsurvey 1:IMASurvey201011 22/07/2011 17:28 Page 70

Overall industry concentration
The range of firms managing assets in the UK isillustrated in Chart 54.30 The chart continues to show asteep curve downwards from a comparatively smallnumber of very large firms, and a long tail:
Average assets under management increased to£26.2bn (2009: £23.1bn) with the median at aslightly increased £7.4bn (2009: £6.2bn).
While ten IMA member firms each managed inexcess of £100bn (see Table 12), 92 managed lessthan £15bn, 28 of whom managed less than £1bn.
Chart 54: Firm ranking by UK assets undermanagement (June 2010)
Table 12: Assets managed in the UK by IMA firm size
Assets under No. of surveymanagement No. of firms respondents
>£100bn 10 10
£51-100bn 11 8
£26-50bn 8 7
£16-25bn 12 7
£1-15bn 64 33
<£1bn 28 4
TOTAL 133 6931
Looking at the position of the largest firms (ranked byassets managed in the UK) as at June 2010, there aresmall changes to 2009:
The top ten firms accounted for 52% of assetsmanaged in the UK by IMA members. This is aslight decrease from a year earlier (54%) and ismainly explained by changes to the IMAmembership base.
The market share of the five largest firms alsodeclined slightly to 35% (37% in 2009).
As illustrated in Chart 55, until 2009 the situation hadremained relatively unchanged for several years. At notime between 2003 and 2008 had the share of thelargest ten firms exceeded 50% of the market. On theHHI measure, the UK asset management industry hasbeen particularly unconcentrated. This remains thecase with the measure falling back to 386 from arevised 405 in 2009. Markets with an HHI between1,000 and 1,800 are considered moderatelyconcentrated.
Chart 55: Market share of largest firms by UK assetsunder management (June 2003 – June 2010)
£bn
450
400
350
300
250
200
150
100
50
0
IMA Firms
60%
50%
40%
30%
20%
10%
0%2003 2004 2005 2006 2007 2008 2009 2010
1,800
1,600
1,400
1,200
1,000
800
600
400
200
0
■ Top 5 (LH) ■ Top 10 (LH) HHI (RH)
HHI
Sha
re o
f U
K A
sset
s U
nder
Man
agem
ent
71
Operational and Structural Issues
30 A full internal IMA dataset on UK assets under management is used for this analysis, and this is collected every June. The IMA membership includes a number offund management firms who outsource their asset management operations, but it does not include investment fund operators who outsource all their assetmanagement operations. 31 Although 76 responses were received, seven of the firms are mutual fund operators which undertake no in-house asset management in the UK.
4
revsurvey 1:IMASurvey201011 22/07/2011 17:28 Page 71

One of the themes arising from interviews over the pasttwo years was that commercial conditions couldbecome more difficult for boutique firms if clientsgravitated towards firms perceived as better capitalisedand if broader regulatory scrutiny intensified. This year,we again attempted to track the fortunes of those firmswe identified as boutique asset managers. The criteriawere:
UK assets under management of less than £5bn.
Independent ownership.
A degree of specialisation.
Self-definition.
Looking at asset growth, this (diverse) group ofmembers has continued to display strongerperformance compared to the wider IMA population,having increased their managed assets by 38% year-on-year as opposed to 14% among IMA membersoverall (see Chart 56). Last year, this group saw assetsfall 5% compared to 12% for the wider IMAmembership. As we are not able to evaluate theboutique universe outside IMA membership, it is difficultto draw precise conclusions. However, availableevidence does not point to a boutique universe undersignificant strain.
Chart 56: Percentage change in UK-managed assetsacross 19 IMA boutique firms (June 2009 – June 2010)
-40% -20% 0% 20% 40% 60% 80% 100%
72
Investment Management Association
revsurvey 1:IMASurvey201011 22/07/2011 17:28 Page 72

indu
stryview
73
Operational and Structural Issues
Regulatory Environment
Regulation is an intrinsic part of the financial servicesindustry’s operating culture. At its best, regulationpromotes confidence, protects consumers and allowswell-run firms to distinguish themselves from theircompetitors. The UK investment fund industry inparticular is highly regulated (both at product andmanagement company level) and this degree of controlis generally seen by IMA member firms as a positiveelement, providing consumers with protection in amarket which offers a range of solutions to thoselooking to invest and save. This provides a quality markthat has both domestic and international value. At theEuropean level, this positive element is furthercomplemented by the international success of theUCITS brand, which is a frequently cited example ofEuropean regulation at its best.
As we reported in last year’s Survey, asset managersbelieve that the credit crisis will require new regulationand/or legislation in a number of areas:
The collapse of Lehman Brothers exposed aparticular range of problems related to inadequateresolution mechanisms in the event of bankinsolvency. While the UK has addressed some ofthese in recent legislation, the wider issue of cross-border resolution and crisis management is yet tobe seriously tackled.
The majority of asset managers thought that thereneeded to be some form of mechanism that dealtwith the risks arising from the same bankinginstitution being engaged in both principal andagency activities, particularly where trading activitiesmight be implicitly underpinned by statutorilyguaranteed deposits.
With respect to asset management specifically, there isbroad acceptance that there are a number of lessonsto learn. Whilst asset managers do not engage inproprietary trading and so are unlikely to be put at riskby movements in the market value of investments, theycan be exposed to significant operational risks. Indeed,one of the main longer-term consequences of the2007-2008 phase of the financial crisis has been amajor focus within the industry on eliminating andmitigating operational risk. The other form of risk whichhas been subjected to historically high levels of scrutinysince the early phases of the financial crisis iscounterparty risk (ie. the risk that the person on whomyou rely to settle a trade or make payments under aninvestment will default in so doing).
Greater focus on counterparty risk
A number of illusions have been shattered. Interms of our dealings with counterparties, thediscussions are on a completely different levelnow. You don’t assume anymore that your brokerwon’t go bust and we’re doing more oncounterparty risk than ever before. And I thinkthat’s healthy.
“
” 4
revsurvey 1:IMASurvey201011 22/07/2011 17:28 Page 73

indu
stryviewFirms already report a significant intensification of FSA
activity in risk management and this is generally seen asinevitable. While the overall impact is likely to bepositive, it will drive up operating costs and thecommercial consequences of this will not become clearfor some time:
Some interviewees believe it may be easier for largerfirms to adapt and to bear the costs of a regulatoryenvironment that is expected to be characterised byfar greater degrees of scrutiny. This could, theybelieve, provide some form of competitiveadvantage while raising barriers to entry for theboutique end of the market. Longer term, this couldalter the commercial shape of the industry.
Others are more circumspect and believe that theindustry is inherently characterised by a long tail ofsmaller firms and that there will be an adaptation tochanged regulatory structures, particularly if differentdegrees of regulatory scrutiny are applied to largeand small firms. However, that creates its ownchallenges with respect to potential firm failure.
Impact of changing oversight
We always thought we were very traditionaland very cautious, but the FSA is now on amission in terms of risk management governance.What you historically thought was the regulatorydividend for being the ‘good guy’ is no longeravailable to you. We’ve got to invest a lot more inthat area, even though we think everything is doneextremely well. There is a massive upgrade inoversight to try to prevent another financial crisis.And I ask myself: ‘How can a boutique possiblysurvive that?’. This actually creates a competitiveadvantage for big fund managers because theycan do it; it costs a lot of money, but they will do itand do it well. But if the FSA does it to everyone Icannot see where these boutiques are going.
The one uncertainty that I have is that there isstill an appetite, certainly at the FSA, for a differentlevel of scrutiny for small and big firms. And if onestandard isn’t applied to all, in the end, you couldend up with more ‘cowboy’ institutions becausenot much attention is paid to them.
“
”“
”
74
Investment Management Association
revsurvey 1:IMASurvey201011 22/07/2011 17:28 Page 74
indu
stryview
Four regulatory concerns
There is also unanimity that it is near impossible forregulation to prevent future financial crises and a strongmajority (70%) of those we interviewed identified thecurrent regulatory environment as one of the key areasof concern for them.
This finds expression in four ways:
1. Regulatory initiatives perceived to bedisproportionate or wrongly targeted, notably:
The original proposals for the Alternative InvestmentFund Managers Directive (AIFMD). The range offirms and activities caught, including pooled pensionvehicles, did not appear justified to firms across theindustry given the root causes of the credit crisis.
The remuneration code. The UK’s asset managerswere impacted by rules relating to remunerationdisproportionately when compared to the rest of theEU (as well as the US). To a great extent, that was areflection of a significant concentration of UK-basedinstitutional asset managers within the EU. But italso reflected the FSA’s approach of treating UCITSmanagers, who have permission to carry outdiscretionary portfolio management, as caught bythe full width of the EU’s Capital RequirementsDirective. In the end, the proportionate approachpromulgated by the European Banking Regulatorsand adopted by the FSA delivered an acceptablesolution.
Changing capital requirements for assetmanagement firms. There continues to be a fearthat the supervisory focus upon prudentialweakness at banks will feed into the supervisoryapproach taken in relation to asset managers. Therisks in relation to which capital needs to be held areof a different nature in asset management firms anddemands for excessive capital will directly impactthe costs borne by clients.
Need for proper regulatory targeting
There are certainly good elements out therethat are quasi-regulatory, for example, centralisedclearing of derivatives. Those make the marketbetter. The robustness and diversity of tradingplatforms also makes the market better andsounder. But the reality is that most of thoseinnovations are industry-led. Some of thecompensation measures, on the other hand, lookpunitive in comparison.
2. Risks of unintended consequences. Rapidregulatory change always risked unintendedconsequences. The example cited by several of thosewe interviewed was centralised clearing. While broadlysupportive of the direction of travel, they feared that theway in which proposals were being implemented couldresult in considerable cost for end clients (see p. 92).
“
”
75
Operational and Structural Issues
4
revsurvey 1:IMASurvey201011 22/07/2011 17:28 Page 75

indu
stryview
indu
stryview
3 Lack of adequate international coordination.While strong and credible regulation can be a source ofcomparative advantage for individual jurisdictions, in aninternational environment characterised by differentpolitical pressures and economic competition betweenfinancial centres, any lack of coordination, whether onsubstance or timing, can result in regulatory arbitrageand poor outcomes.
Coordination internationally
You’ve still got regulatory arbitrage. Theindustry has internationalised. Regulation hasnot. Regulators are unable to present a singlecoherent international proposition and they stillengage in regulatory comparative advantage.This is one of the biggest things that has notchanged.
We’ve got to harmonise across Europe, we’rea European business. So the idea that they canrun UK consumer-centric initiatives independentlyis just completely flawed. Let’s go slower, let’sharmonise with Europe and let’s roll out acoherent pan-European policy. Let’s stop thinkingthe UK is an island that does everythingseparately and independently. Because that’swhat’s driving up our costs.
However, where European harmonisation is takingplace, interviewees strongly felt that legislation shouldbe carefully considered and driven not by politics but bysingle market considerations that will ultimately benefitindustry and consumer.
4. The way in which regulatory oversight isexercised. The UK retail fund industry has been hitheavily by compensation levies as a result of the defaultof Keydata Investment Services Ltd.32 This followedearlier compensation payouts to investors relating tothe defaults of Pacific Continental Securities andSquare Mile Securities. The retail firms we interviewedcited Keydata as a source of major irritation with
respect to the quality of regulatory oversight. Equally,there is some recognition of the fine balance betweenthe kind of scrutiny that can avoid such failures andwhat might be perceived as a regulatory ‘heavy hand’.
There is also a broader desire to be able to work moreeffectively with regulators. For several years in theSurvey, respondents have expressed frustration withthe difficulty in establishing consistent relationships withsupervisory teams, due in particular to the perceivedhigh turnover of staff at the FSA.
In addition to the immediate financial implication ofKeydata, broader points were raised by intervieweeswith respect to product regulation and how a focus onmore sophisticated products, such as absolute returnfunds, might be detrimental to the further developmentof more outcome-oriented products. However, thisconcern about product regulation sits alongside awidely perceived need to ensure that such products donot over-promise or mislead consumers with respect towhat the investment strategies aim to achieve.
A need for care over product regulation
Absolute return strategies and other productswith an element of guarantee associated withthem are very complex instruments. You don’twant to know much about them, you just wantthem to work. The regulators, as a result of thecrisis, are suspicious that we are introducing thiscomplexity to generate more fees whereas Igenuinely believe that there is value for our clientsin these sophisticated tools. And we have a bigcommunication task to explain this.
I am concerned that people are going to endup with very low-risk products as perceived by theFSA, when in fact they could be catastrophicallyhigh-risk when you’re thinking about inflation orgovernment debt. People have these low-riskproducts but I’m actually not sure they know whatit means.
“
”“
”“
”“
”
76
Investment Management Association
32 Keydata is an investment firm that had sold life insurance-linked investment products from Luxembourg companies SLS and Lifemark. It was declared insolventand closed down by the FSA in 2009. Owing to the structure of the UK Financial Services Compensation Scheme, UK retail fund managers were required on shortnotice to contribute £233m to subsidise the obligation of another class of firms to finance compensation payments to investors.
revsurvey 1:IMASurvey201011 22/07/2011 17:28 Page 76

indu
stryview
indu
stryview
One specific product area of concern were ETFs,particularly in the context of their very strong recentasset growth. Four interviewees identified some typesof ETFs as a potential threat, both systemically and tothe broader reputation of the industry.
Risks posed by ETFs
There’s a bomb going to go off with ETFs.There are synthetic ETFs out there and I don’tthink we’re giving them a close enough look.You’re buying a piece of paper.
The ETF market concerns me in terms of howmuch volume it’s getting. I just hope we don’t getinto a situation like the one we had with thecollateralised debt obligation markets where a lotof people don’t know where the credit risklies.
ETFs are another issue because something’sgoing to happen with one of the fringe players,which you worry about if you’re an indexer.
The Financial Stability Board’s report on ETFswas very interesting because, clearly, they arenow being perceived as potentially systemically ata point of vulnerability, particularly those that arenot invested in physicals but in swaps.
Impact of RDR
While emphasising their responsibilities with respect tocommunication and transparency, intervieweesrepeatedly stressed the dependence of the retail fundmanagement industry upon its distributors. In the UK,this means that the industry has a major interest inensuring that the IFA distribution channel operates withhigh standards and in an accessible, transparentmanner.
Reputational dependence ondistribution
You have to wipe out mis-selling scandals tothe extent that these exist. These are the mostcorrosive things you can imagine. And now thatthe investment management industry has becomedetached from distribution almost entirely, you’vegot what I would call a separate industry erodingthe trust of our industry. Nobody notices that.Everybody thinks that a mutual fund is an entirepackage from manufacturing through delivery toreporting, but asset managers only do so muchbefore they hand over to distributors. And they’rethe ones who mis-sell. Keydata is a case in pointwhere none of us had anything whatsoever to dowith it and we’re now suffering from the erosion oftrust. So if you don’t address the mis-sellingissue, you won’t address the trust issue.
As we have reported in previous surveys, there issupport for the broad aims of the Retail DistributionReview (RDR), even as the details of its implementationremain the subject of disagreement with the regulator.However, while the adviser-charging model will giveconsumers and their advisers greater control overcommission payments from providers, intervieweesalso expressed concern about its limitations. Manywithin the fund industry believe that there are marketdistortions to the advantage of the insurance industrythat will continue to have a detrimental impact onconsumer outcomes.
“”
“
”“
”“
”
“
”
77
Operational and Structural Issues
4
revsurvey 1:IMASurvey201011 22/07/2011 17:28 Page 77

indu
stryviewGiven the current uncertainty over the final outcome,
our questions on RDR this year were of a more generalnature:
The prevailing industry view is that access to advicemay become more difficult for middle to low incomegroups. Where it is available, it may look verydifferent, with a focus on a smaller range of options.
Some of those we interviewed believe this will leadto an increasing focus on packaged products whichwill embed certain decisions that may otherwise bean area where advice might have been sought.Asset managers can play a wide variety of roles inthe manufacture of such products (eg. multi-manager, multi-asset, solution-based).
Within such an environment, there is no realconsensus on what combination of advice orguidance may be needed, and how that can bedelivered effectively. Clearly, however, the way inwhich it is delivered will have significant implicationsboth for asset manager relationships withdistributors and the ability of consumers effectivelyto access the full range of financial servicesproducts.
A need for regulated advice orguidance?
We see a separation of a market for thesophisticated client who still wants pure products.It is more and more obvious that this space islimited to high net worth individuals whilst in themass market people have limited resources andthere may not be advice available at a reasonableprice. In such an environment, I believe that weshould have more portfolios where advice is in-built, and where the portfolio is managed notbecause of its content but for the outcome. Andthis I think is going to be the direction of travel forthe mass market.
I think the majority of people actually don’tneed advice. If your finances are complex, forexample when you’re a high earner, you need allkinds of advice about that. But if you’re investingmoney over the long-term as an ordinary person Ithink you need guidance and that can be providedoff the internet and in many cases is done so veryeffectively now.
We’ll find a lot of the smaller IFAs eitherdisappearing or merging, and a lot of them notoffering true advice. It will be guided advice, it willbe mechanical. You go onto a platform, you putyour profiles in, and you’ll be pushed in certaindirections. It’s simpler for the investor but it alsoraises the question of how much knowledge youhave before you invest. Or are you going to get avery vanilla offering, so choice is removed fromthe industry? People will have much less choiceand they’ll have very simple offerings. And that’sgood and bad. It’s good because it’s simpler tounderstand but you also want choice anddiversity, you want people to be able to builddifferent portfolios and have control over theirfuture.
“
”“
”“
”
78
Investment Management Association
revsurvey 1:IMASurvey201011 22/07/2011 17:28 Page 78
5. The International Dimension
Key Findings
79
The International Dimension
Four international dimensions
The total share of assets managed in the UK onbehalf of overseas clients has grown to 33%, upfrom 31% in 2009. The industry’s increasinginternationalisation is also evidenced by a growingproportion of firms with primarily overseas clients.
Overseas-owned firms now account for 52% in UKassets under management, a small decreasecompared to the year before (53%).
The size of overseas-domiciled funds managed inthe UK has increased 20% year-on-year to £617bn,of which the largest part (75-80%) is domiciled inDublin and Luxembourg.
In total, IMA members including their parent groupsare estimated to have over £19.9trn in assets undermanagement globally (£17.3trn in 2009).
UK in comparative context
With 31% of total European assets undermanagement, the UK continues to be the largestsingle asset management centre in Europe and thesecond largest in the world. While growing veryfast, competing centres in the Far East are startingfrom a far lower base in asset terms.
Strong growth in the UK domestic marketnotwithstanding, the UK’s position as a funddomicile continues to be far less favourable,accounting for only 10% of the European fundindustry.
Current outlook for locationdecisions
While the UK continues to rate highly as a financialservices centre, concerns remain on all three levelsof domicile choice – corporate, personal and fund.Only 14% of respondents noted an improvement inthe business climate over the past year.
In addition to policy shifts perceived as negative,there is a sense that the UK’s traditional locationaladvantages are being challenged through greatertechnological and communication sophistication aswell as economic and labour market shifts.
The danger focuses as much on future locationchoice for new capacity as relocation of existingcapacity.
This increases the need for a stable and predictablefiscal environment and a regulatory regime thatmaintains high standards while not falling foul ofregulatory arbitrage. Overall, the UK industry wouldlike an unequivocal message that the UK is ‘openfor business’.
5
revsurvey 1:IMASurvey201011 22/07/2011 17:28 Page 79
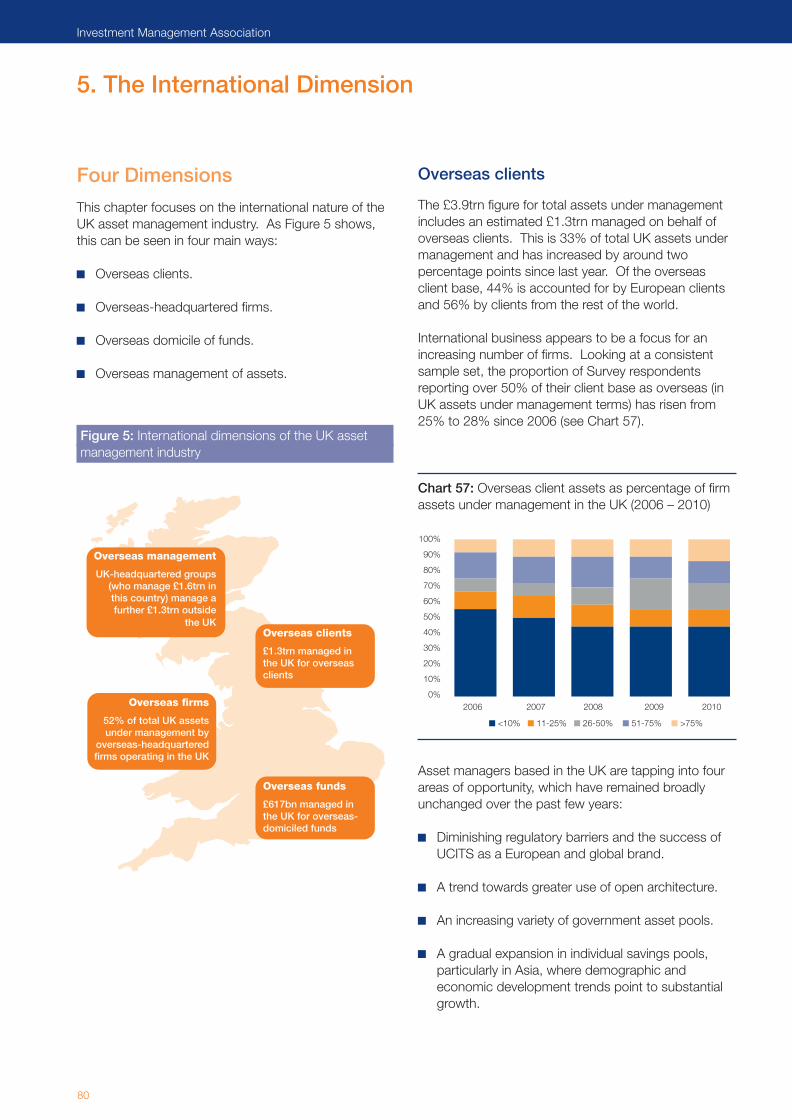
80
Investment Management Association
Four Dimensions
This chapter focuses on the international nature of theUK asset management industry. As Figure 5 shows,this can be seen in four main ways:
Overseas clients.
Overseas-headquartered firms.
Overseas domicile of funds.
Overseas management of assets.
Overseas clients
The £3.9trn figure for total assets under managementincludes an estimated £1.3trn managed on behalf ofoverseas clients. This is 33% of total UK assets undermanagement and has increased by around twopercentage points since last year. Of the overseasclient base, 44% is accounted for by European clientsand 56% by clients from the rest of the world.
International business appears to be a focus for anincreasing number of firms. Looking at a consistentsample set, the proportion of Survey respondentsreporting over 50% of their client base as overseas (inUK assets under management terms) has risen from25% to 28% since 2006 (see Chart 57).
Chart 57: Overseas client assets as percentage of firmassets under management in the UK (2006 – 2010)
Asset managers based in the UK are tapping into fourareas of opportunity, which have remained broadlyunchanged over the past few years:
Diminishing regulatory barriers and the success ofUCITS as a European and global brand.
A trend towards greater use of open architecture.
An increasing variety of government asset pools.
A gradual expansion in individual savings pools,particularly in Asia, where demographic andeconomic development trends point to substantialgrowth.
Figure 5: International dimensions of the UK assetmanagement industry
3Overseas management
UK-headquartered groups(who manage £1.6trn inthis country) manage afurther £1.3trn outside
the UK
Overseas firms
52% of total UK assetsunder management by
overseas-headquarteredfirms operating in the UK
Overseas clients
£1.3trn managed inthe UK for overseasclients
Overseas funds
£617bn managed inthe UK for overseas-domiciled funds
100%
90%
80%
70%
60%
50%
40%
30%
20%
10%
0%2006 2007 2008 2009 2010
■ <10% ■ 11-25% ■ 26-50% ■ 51-75% ■ >75%
5. The International Dimension
revsurvey 1:IMASurvey201011 22/07/2011 17:28 Page 80

indu
stryview
indu
stryview
81
The International Dimension
The speed at which these opportunities come tofruition, and the scale that they represent, variessubstantially. As we have noted in previous surveys,there continues to be concern about the speed ofchange in the European distribution landscape and arecognition that it will take many years to achieve thekind of opening to third party fund competition that anumber of UK exporting firms are seeking to achieve.
Ensuring a more transparent Europeandistribution environment
First, there is a need to remove the opacity inEuropean charging structures. In the UK, youhave a clear understanding of what you’re payingfor. If you go to Europe, that is not the case.Second, professional, independent advice needsto be able to flourish in the region. Having toinvest savings in the stranglehold of a singledominant channel or sector isn’t good. PRIPs33
will move it in some way, but we should transportsome UK standards into Europe.
I would like to see a distribution environmentwhere choice is a basic consumer right, whereevery distributor has to offer a reasonable rangeof choice, where any perception that theconsumer might have about a potential conflict ofinterest is openly disclosed and managed, eitherthrough regulation or through industry self-policing and best behaviour. I’d like to see a worldwhere the whole of the industry is aligned to makesure that the consumer does get the bulk of thereturn of the capital they provide, and we figureout how we split the rest.
Nonetheless, for some firms, the reality of a very largepool of assets in Europe is as attractive, if not more so,than opportunities in other parts of the world where thepotential is clearly evident but the asset pools may takelonger to build up.
Europe as an attractive market for UKfirms
The pool of assets is much bigger in Europethan it is in Asia. Many get caught up in growth asthe main driver, whereas I think the assetmanagement industry lends itself to servicing apool of assets, and the European pool of assets isvery deep and available. We are getting goodflows in Europe relative to the size of ouroperations, which makes us think that there is anincreasing openness to cross-border players. Thetide is swinging towards a more transparent salesprocess, which is allowing a decent number ofexternal alternatives into the mix.
“
”
”“
“
”
33 The Packaged Retail Investment Products (PRIPs) initiative aims to align disclosure requirements as well as the regulation on the selling and marketing of differenttypes of competing financial products across the EU.
5
revsurvey 1:IMASurvey201011 22/07/2011 17:28 Page 81
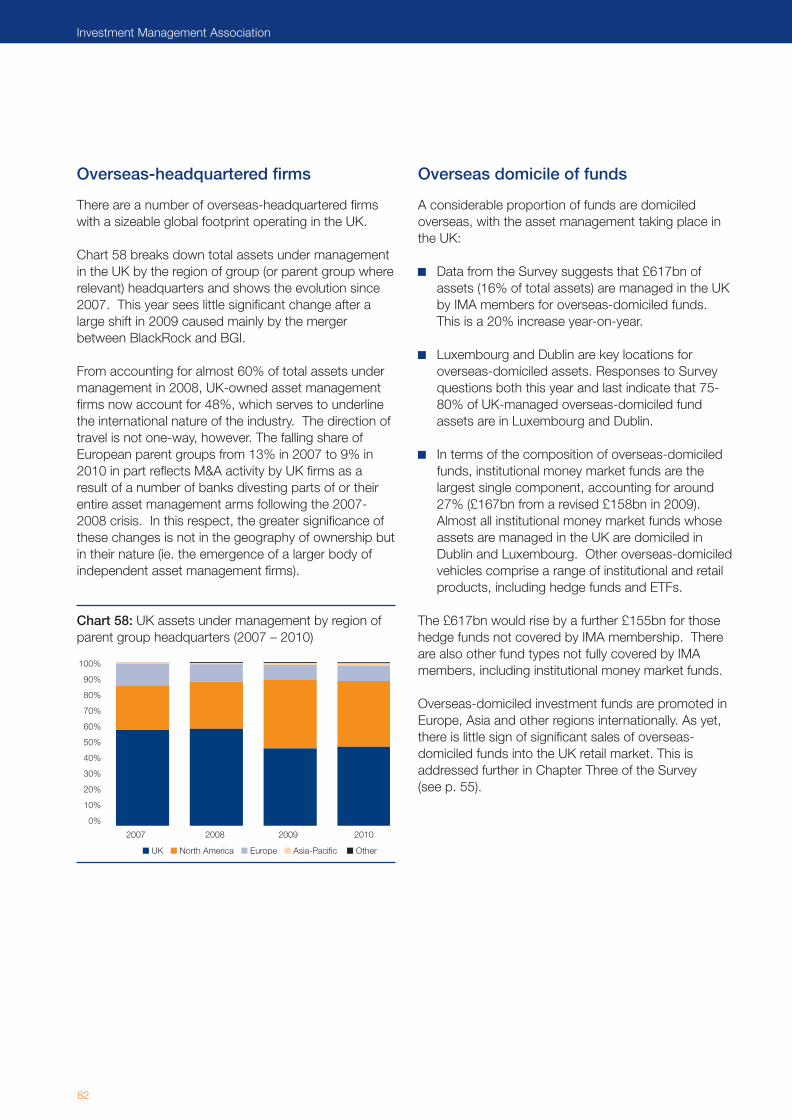
82
Investment Management Association
Overseas-headquartered firms
There are a number of overseas-headquartered firmswith a sizeable global footprint operating in the UK.
Chart 58 breaks down total assets under managementin the UK by the region of group (or parent group whererelevant) headquarters and shows the evolution since2007. This year sees little significant change after alarge shift in 2009 caused mainly by the mergerbetween BlackRock and BGI.
From accounting for almost 60% of total assets undermanagement in 2008, UK-owned asset managementfirms now account for 48%, which serves to underlinethe international nature of the industry. The direction oftravel is not one-way, however. The falling share ofEuropean parent groups from 13% in 2007 to 9% in2010 in part reflects M&A activity by UK firms as aresult of a number of banks divesting parts of or theirentire asset management arms following the 2007-2008 crisis. In this respect, the greater significance ofthese changes is not in the geography of ownership butin their nature (ie. the emergence of a larger body ofindependent asset management firms).
Chart 58: UK assets under management by region ofparent group headquarters (2007 – 2010)
Overseas domicile of funds
A considerable proportion of funds are domiciledoverseas, with the asset management taking place inthe UK:
Data from the Survey suggests that £617bn ofassets (16% of total assets) are managed in the UKby IMA members for overseas-domiciled funds.This is a 20% increase year-on-year.
Luxembourg and Dublin are key locations foroverseas-domiciled assets. Responses to Surveyquestions both this year and last indicate that 75-80% of UK-managed overseas-domiciled fundassets are in Luxembourg and Dublin.
In terms of the composition of overseas-domiciledfunds, institutional money market funds are thelargest single component, accounting for around27% (£167bn from a revised £158bn in 2009).Almost all institutional money market funds whoseassets are managed in the UK are domiciled inDublin and Luxembourg. Other overseas-domiciledvehicles comprise a range of institutional and retailproducts, including hedge funds and ETFs.
The £617bn would rise by a further £155bn for thosehedge funds not covered by IMA membership. Thereare also other fund types not fully covered by IMAmembers, including institutional money market funds.
Overseas-domiciled investment funds are promoted inEurope, Asia and other regions internationally. As yet,there is little sign of significant sales of overseas-domiciled funds into the UK retail market. This isaddressed further in Chapter Three of the Survey (see p. 55).
100%
90%
80%
70%
60%
50%
40%
30%
20%
10%
0%
2007 2008 2009 2010
■ UK ■ North America ■ Europe ■ Asia-Pacific ■ Other
revsurvey 1:IMASurvey201011 22/07/2011 17:28 Page 82

83
The International Dimension
Overseas management of assets
Assets are managed outside the UK on behalf of bothUK and international clients. While some firmscentralise their asset management, many have thereverse philosophy (ie. portfolio management andtrading being located in the region of the asset ratherthan the client). The latter will either delegate formally orsimply manage the assets directly in overseas offices inthe relevant region. For example, regardless of clientdomicile, a firm might manage its UK and Europeanequities out of the UK but run its US equities out ofNorth America or its Asian equities out of Tokyo,Singapore or Hong Kong:
UK-headquartered firms which responded to theSurvey manage £1.6trn in the UK. Globally, thesefirms manage a further £632bn. The groups ofwhich they are a part have an even wider reach,managing a total of £3trn internationally.
In total, we estimate that IMA members, or thegroups of which they are a part, managed over£19.9trn globally at the end of December 2010(from £17.3trn a year earlier).
Year-on-year comparisons in both cases are affectedby changes in the IMA membership and in corporateactivity at parent group level.
The UK in a Comparative Context
The UK continues to be the largest single assetmanagement centre in Europe. Figure 6 shows that, as at December 2009 (the most recent year for whichcomparative data is available), the UK share of totalEuropean assets under management had risen slightly to 31% (from 30% in 2008). Sterling weakness saw this share shrink in euro terms from34% in 2006 – 2007.
Source: EFAMA
Accurate wider comparative data on a managementlocation basis is difficult, tending to be based onindividual market sizes. However, all available datapoint to the UK being the second largest assetmanagement centre in the world, after the US.34
Figure 6: Assets under management in Europe(December 2009)
1
2
3
4
6
5
Country Net assets Market(€bn) share
1 UK 3,783 30.6%2 France 2,816 22.8%3 Germany 1,460 11.8%4 Italy 658 5.3%5 Netherlands 474 3.8%6 Belgium 393 3.2%7 Other 2,782 22.5%
34 Discretionary asset management undertaken by SEC registered firms is estimated by the Investment Adviser Association (IAA) at $35.2trn (£23.1trn) as at April2010. However, this includes assets managed overseas, so will inevitably be an overstatement of management activity actually undertaken in the US. Data from theBoston Consulting Group puts the size of the US market (measured in terms of professionally managed assets) at $26.1trn (£16.4trn) at the end of 2009.
5
revsurvey 1:IMASurvey201011 22/07/2011 17:28 Page 83
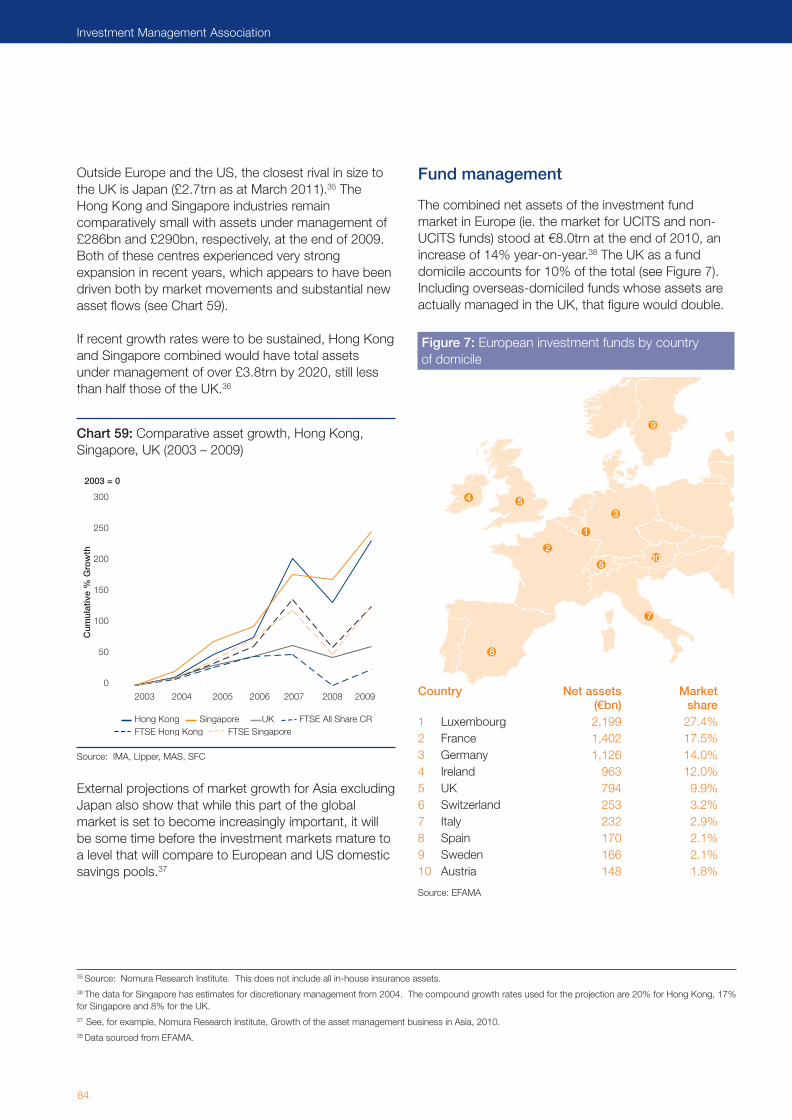
84
Investment Management Association
Outside Europe and the US, the closest rival in size tothe UK is Japan (£2.7trn as at March 2011).35 TheHong Kong and Singapore industries remaincomparatively small with assets under management of£286bn and £290bn, respectively, at the end of 2009.Both of these centres experienced very strongexpansion in recent years, which appears to have beendriven both by market movements and substantial newasset flows (see Chart 59).
If recent growth rates were to be sustained, Hong Kongand Singapore combined would have total assetsunder management of over £3.8trn by 2020, still lessthan half those of the UK.36
Chart 59: Comparative asset growth, Hong Kong,Singapore, UK (2003 – 2009)
Source: IMA, Lipper, MAS, SFC
External projections of market growth for Asia excludingJapan also show that while this part of the globalmarket is set to become increasingly important, it willbe some time before the investment markets mature toa level that will compare to European and US domesticsavings pools.37
Fund management
The combined net assets of the investment fundmarket in Europe (ie. the market for UCITS and non-UCITS funds) stood at €8.0trn at the end of 2010, anincrease of 14% year-on-year.38 The UK as a funddomicile accounts for 10% of the total (see Figure 7).Including overseas-domiciled funds whose assets areactually managed in the UK, that figure would double.
Source: EFAMA
1
2
4 5
7
8
6
9
3
10
Country Net assets Market(€bn) share
1 Luxembourg 2,199 27.4%2 France 1,402 17.5%3 Germany 1,126 14.0%4 Ireland 963 12.0%5 UK 794 9.9%6 Switzerland 253 3.2%7 Italy 232 2.9%8 Spain 170 2.1%9 Sweden 166 2.1%10 Austria 148 1.8%
Figure 7: European investment funds by country of domicile
2003 2004 2005 2006 2007 2008 2009
Hong Kong Singapore UK FTSE All Share CRFTSE Hong Kong FTSE Singapore
300
250
200
150
100
50
0
2003 = 0
Cum
ulat
ive
% G
row
th
35 Source: Nomura Research Institute. This does not include all in-house insurance assets.36 The data for Singapore has estimates for discretionary management from 2004. The compound growth rates used for the projection are 20% for Hong Kong, 17%for Singapore and 8% for the UK.37 See, for example, Nomura Research Institute, Growth of the asset management business in Asia, 2010.38 Data sourced from EFAMA.
revsurvey 1:IMASurvey201011 22/07/2011 17:28 Page 84
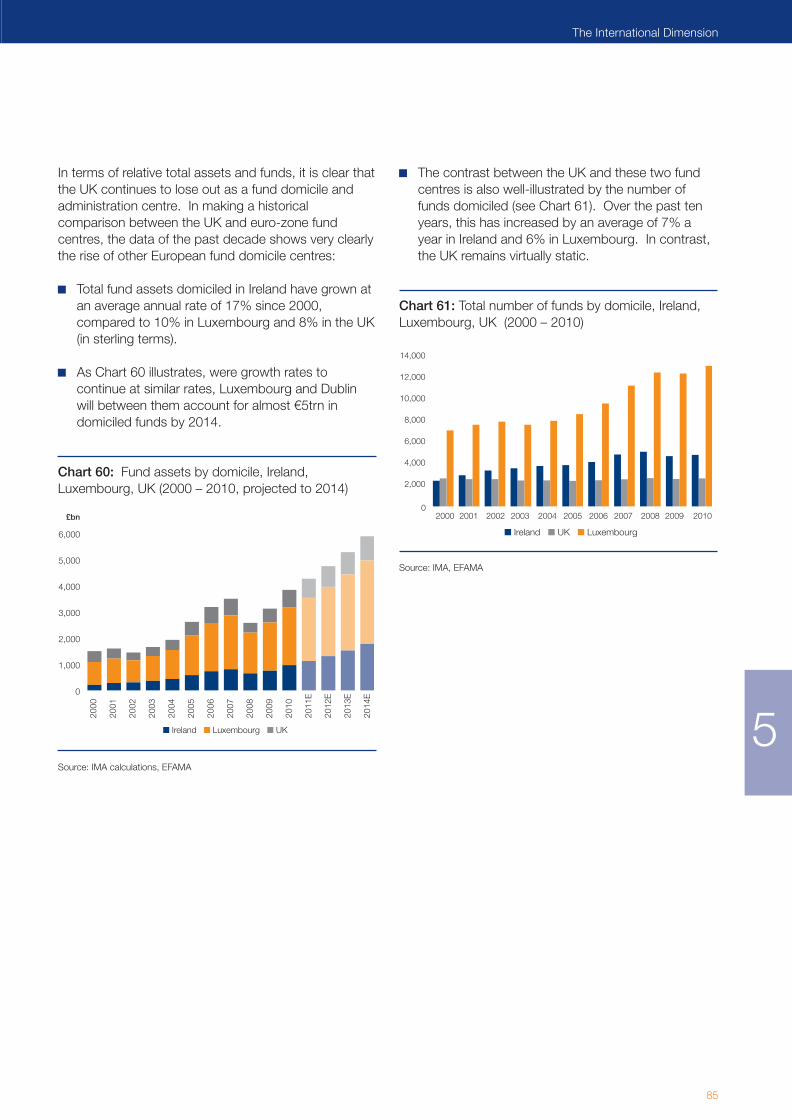
In terms of relative total assets and funds, it is clear thatthe UK continues to lose out as a fund domicile andadministration centre. In making a historicalcomparison between the UK and euro-zone fundcentres, the data of the past decade shows very clearlythe rise of other European fund domicile centres:
Total fund assets domiciled in Ireland have grown atan average annual rate of 17% since 2000,compared to 10% in Luxembourg and 8% in the UK(in sterling terms).
As Chart 60 illustrates, were growth rates tocontinue at similar rates, Luxembourg and Dublinwill between them account for almost €5trn indomiciled funds by 2014.
Chart 60: Fund assets by domicile, Ireland,Luxembourg, UK (2000 – 2010, projected to 2014)
Source: IMA calculations, EFAMA
The contrast between the UK and these two fundcentres is also well-illustrated by the number offunds domiciled (see Chart 61). Over the past tenyears, this has increased by an average of 7% ayear in Ireland and 6% in Luxembourg. In contrast,the UK remains virtually static.
Chart 61: Total number of funds by domicile, Ireland,Luxembourg, UK (2000 – 2010)
Source: IMA, EFAMA
0
1,000
2,000
3,000
4,000
5,000
6,000
2000
2001
2002
2003
2004
2005
2006
2007
2008
2009
2010
2011
E
2012
E
2013
E
2014
E
■ Ireland ■ Luxembourg ■ UK
£bn
■ Ireland ■ UK ■ Luxembourg
0
14,000
12,000
10,000
8,000
6,000
4,000
2,000
2000 2001 2002 2003 2004 2005 2006 2007 2008 2009 2010
85
The International Dimension
5
revsurvey 1:IMASurvey201011 22/07/2011 17:28 Page 85

indu
stryview
Current Outlook for Location Decisions
The UK is still rated as the leading global centre forasset management in the most recent GFCI report, andis comfortably ahead of other European centres as afinancial hub.39 However, while several intervieweescommented on how resilient the UK – and London inparticular – has been, the mood among those weinterviewed was generally fairly downbeat:
Only three interviewees (14%) noted animprovement in the UK as an operating environmentduring 2010. A slightly higher proportion (22%)expressed positive sentiment about the outlook forthe next five years.
This broadly repeats our findings last year andstands in marked contrast to the kinds of commentsthat we reported when we first started asking aboutthis issue in the 2006 Survey (see Figure 8 overleaf).
Concerns cover all three areas of domicile choice(corporate, personal and fund) and are broadly familiarfrom earlier surveys:
With respect to personal and corporate domicile,the predictability of fiscal measures has been agrowing concern in recent years, as has been aperceived negative shift in the immigration climate.
Although the industry and Treasury continue to workto improve the competitiveness of the tax regime forinvestment funds, the momentum that has builtparticularly in Dublin and Luxembourg is thoughtdifficult to reverse, certainly in the foreseeable future.Firms we spoke to gave a view that points to aconsiderable and ongoing ‘perception gap’ betweenthe degree of change in the UK funds regime andthe reality as investors see it.
Loss of position as a fund domicile ofchoice
Our problem is that perception of the UK isstill not good. There are people in the offshoremarket that just won’t touch a product domiciledin the UK. Whereas there’s a perception that youcan invest in a product domiciled in Luxembourgand you’ll be taxed at your local level, there’s aconcern that UK authorities constantly changetheir tax policy so people just don’t trust them.
I would like a clear policy statement from the UKGovernment that this is a suitable domicile forglobal funds distribution and that the UK willensure that all global investors are treated fairly,their rights of access to that product are unlimitedand there will be no tax recoverability at the UKlevel other than for UK investors.
“
”
86
Investment Management Association
39 See Z/Yen, The Global Financial Centres Index 9, March 2011.
revsurvey 1:IMASurvey201011 22/07/2011 17:28 Page 86
Figure 8: Five views from across the industry (2006 – 2011)
2006 – 2007 IMA Survey
General degree of satisfaction, butworries about rising costs
We like London. It’s almost our head office.We see an amazing pool of resources in the UK.It’s deeper and broader than in other places.London is still the natural place. We do haveincreasing costs and retention issues, but that hasmore to do with the direction of the industry thanLondon per se.Major international firm (overseas HQ)
London really is the financial capital of theworld. It’s a very natural place to run globalequities products, emerging markets products. Ireally cannot see any weakening of the presencehere from the fund management perspective.”Major international firm (overseas HQ)
We’re entirely happy about London at themoment. There’s no reason for us to leave.Major international firm (UK HQ)
London is winning as a financial centre, sothere’s major pressure on costs and infrastructure.You can go and work at a boutique tomorrow atsignificantly more than you can earn here. There’sa huge demand for talent.Major UK firm
I have no hesitation in saying that London willcontinue to be the global financial centre, and Ithink New York will fade.Major UK firm
“
”
“
“
“
“
”
”
”
2010 – 2011 IMA Survey
Rising unease, diminished confidenceabout long-term outlook
It has got worse at three levels: regulation,political attitudes and tax. The UK is now lessattractive and less competitive in consequence.This is an international business that now has todeal with domestic issues. Ten years ago, Londonwas setting the pace in the internationalisation ofworkforce. Hong Kong and Singapore say ‘we’reopen for business’. The UK says ‘we’re open forbusinesses’, but it’s not a welcoming climate.”
I think you’ll lose the new investment. And it’snot about the high-paid fund managers. There arethousands of people in this building and down theroad in support functions; that’s a lot of jobs thataren’t going to be in London or even in the UK.”
If the 50% tax is temporary, then fine. If itstays, then anyone opening an asset managementbusiness today would be unlikely to chooseLondon, and memories can be quite long in thisregard. Furthermore, with so much of the world’sgrowth and savings being in Asia, and anincreasing share of our revenue being from outsidethe UK, we could see ourselves eventuallyrelocating to Asia.”
From an investment management perspective,the outlook is positive. But as a domicile, we’renot getting any clear indication from the UKgovernment that keeping UK or global fundsdomiciled here is a priority for them. I still feel that,at the moment, the Government still hasn’t quitedecided to support our industry; they feel it’s sortof a dirty word. But we’re a UK-basedorganisation, and we’d probably withstand a lot ofpressure before we moved.”
The business climate has improved a little inthat the City is no longer seen as the enemy. I amoptimistic about the long-term future of the UK asan asset management centre.”
“
“
“
“
“
87
The International Dimension
5
revsurvey 1:IMASurvey201011 22/07/2011 17:28 Page 87

indu
stryview
88
Investment Management Association
Erosion of traditional advantages
One theme that has received greater attention ininterviews this year has been the extent to whichexternal factors are also having an impact. Severalinterviewees have suggested that some of the relativeadvantages of London and the UK, notably scale,language and time zone, are starting to decline.
A number of reasons are provided for this:
Greater inter connection as a result of technologicaladvances, which are diminishing the ‘cluster’advantages available to UK financial services.
Actual – and anticipated – shifts in the patterns ofeconomic and market growth in different globalregions, particularly Asia but also Latin America andthe Middle East/Gulf.
The ongoing dominance of English as the globalbusiness language facilitating mobility in theinternational financial services industry.
Labour market flexibility internationally, allowing firmsto operate across time zones with greater ease thanhaving to depend upon the straddling effect providedin the UK (and continental European) time zones.
Combined with concerns about predictability and theneed for policy change that is seen as durable ratherthan arbitrary, all of this is leading firms to emphasisethe importance of an ongoing proactive effort by the UKauthorities. This would involve an unequivocal signalthat the UK is ‘open for business’ and will fight to retainits pre-eminence as an international financial centre.
The erosion of cluster advantages
The cluster argument is weakening andtechnology has a lot to do with that. You have amore multi-polar world. Although you still have acluster benefit in the case of an equity or a bondfund manager, why can’t you sit somewhere elsewith broadband? Competitive firms can emerge inother countries as long as the savings pool is bigenough.
It’s easier for us now to place people whereverwe feel like placing them. You don’t really needpeople sitting together in ways you did in the past.That’s the reason why the UK needs to be moreassertive about creating a good environment.
Without question, the effects of having thebuy-side and sell-side close together are lesssignificant than they were ten years ago. Theadvance in communication and technology hasbeen enormous. The benefits of co-location aremore in doubt now. And so is the time zonebenefit, particularly when you consider the cost ofliving in London. People are working 24/7 so theymay just as well be doing that in Singapore, Indiaor elsewhere. But these are longer-termfactors.
“
”
”
”
“
“
revsurvey 1:IMASurvey201011 22/07/2011 17:28 Page 88

indu
stryview
indu
stryview
89
The International Dimension
Risks to new investment
While the actual number of asset management staffrelocating from the UK in recent years due to policyshifts has been comparatively small, it has been areality. International firms also stress that the problemis less visible when measured in these terms. Moresignificant will therefore be decisions on the futurelocation of new capacity, notably:
Whether corporate decisions favour overseasfinancial centres.
Whether individual employees prefer not to relocateto the UK from overseas.
New capacity and potential recruits togo elsewhere?
Not that many people have voted with theirfeet yet but it’s not about that; you haven’t seennew people come in either. The UK is a lessattractive place from the tax, regulatory and otherperspectives. There is a definitive risk that overtime, you’ll see attrition here but no replacement.But this doesn’t seem to be seen as a realproblem on a political level.
We’ve lost more than a couple of peopleoverseas. As successful as we are, we have towork incredibly hard to get people from overseas towork in the UK. It is not the posting that it was fiveyears ago. It used to be top of everybody’s list. Wedon’t have issues with visa yet, but half of the battleis creating your shortlist to choose from and that’sgetting more and more difficult for non-Brits.
If we are trying to compete with the best firmsall over the world, then we have to recruit the bestpeople and this year a number of our recruits hada hard time getting their visas. So from that pointof view things are looking less good, although notto the extent of making us want to relocateelsewhere.
There isn’t an understanding that there’s awar for talent and you need to be competitive. Itjust doesn’t seem to have got through to people. Iam very worried about a ‘one-size-fits-all’ paystructure or remuneration code which means thatwe will no longer be competitive with jurisdictionsthat don’t require that.
In this respect, shifts of perception by both large firmsand more mobile, smaller investment firms andboutiques will be extremely important.
A final point made by several respondents revolvedaround the need to ensure that the UK capital marketsthemselves operate in a competitive and healthy way infuture years. The unifying theme here is the ability tomaintain a world-leading status as a ‘turntable’ forcapital, ensuring that companies regard the UK as apre-eminent location for the raising of finance.
Broader support for capital markets
We’ve lost our focus not in terms of the assetmanagement industry but in terms of capitalmarkets. We need to continue to make sure thatentrepreneurs will be here and companies arelisted here because that’s where business will bebuilt.
A lot more thinking needs to be done aboutthe structure of capital markets and I’m afraid tosay that, having tried to generate some of thoseconversations, I don’t think this will become a livedebate until the point at which the recovery getsgoing and they’re going to find there’s a demandfor capital in one place, and the supply in another.In terms of London and its position, we also needto be thoughtful about the power shifts aroundthe world. London has been pre-eminent in thisspace because historically it’s been the place thatfinance has been processed through. Actuallythere’s a dominant new financial power rising inthe world: China. What are we going to do tomake sure that when all that R&D finance is madeavailable, that it’s processed throughLondon?
“
”
“
”
”
”
”
”“
“
“
“
5
revsurvey 1:IMASurvey201011 22/07/2011 17:28 Page 89

90
Investment Management Association
Market interaction
Firms are increasingly adapting to the post2007-2008 crisis market conditions, althoughuncertainties remain around bank capital levels andresolution regimes.
Concerns exist about the effectiveness andappropriateness of regulatory measures aiming toimprove and internationally harmonise the marketinfrastructure. In particular, firms are worried aboutthe approach to the central clearing of derivatives.
Equity trading
We included a new question about the use of singleequity contracts for difference (CFDs) to gain abetter understanding about the use of derivativesfor synthetic equity exposure. Overall usage as aproportion of single-issuer equity exposure remainslow, with most respondents (89%) indicating wellbelow 10%.
Corporate bond trades
While dependence on banks remains high, theirability to provide adequate liquidity is not universallyacknowledged. Almost 30% of respondents are notsatisfied in this respect.
Derivative trades
For the first time, we asked about the exchange of‘independent amounts’ between counterparties inderivative trades. While this kind of capital set-asidehas not typically featured for over-the-counter(OTC) trades, 35% of respondents now appear touse it.
Impact of MiFID
Consistent with 2009, respondents do not see animprovement in post-trade transparency resultingfrom the Markets in Financial Instruments Directive(MiFID). We also asked a question about theimpact of MiFID on the cost of trading. Contrary toexpectations and the reform objectives, the majorityof respondents (59%) do not see a decrease intrading costs.
6. Market Interaction and the Impact of MiFID
Key Findings
revsurvey 1:IMASurvey201011 22/07/2011 17:28 Page 90
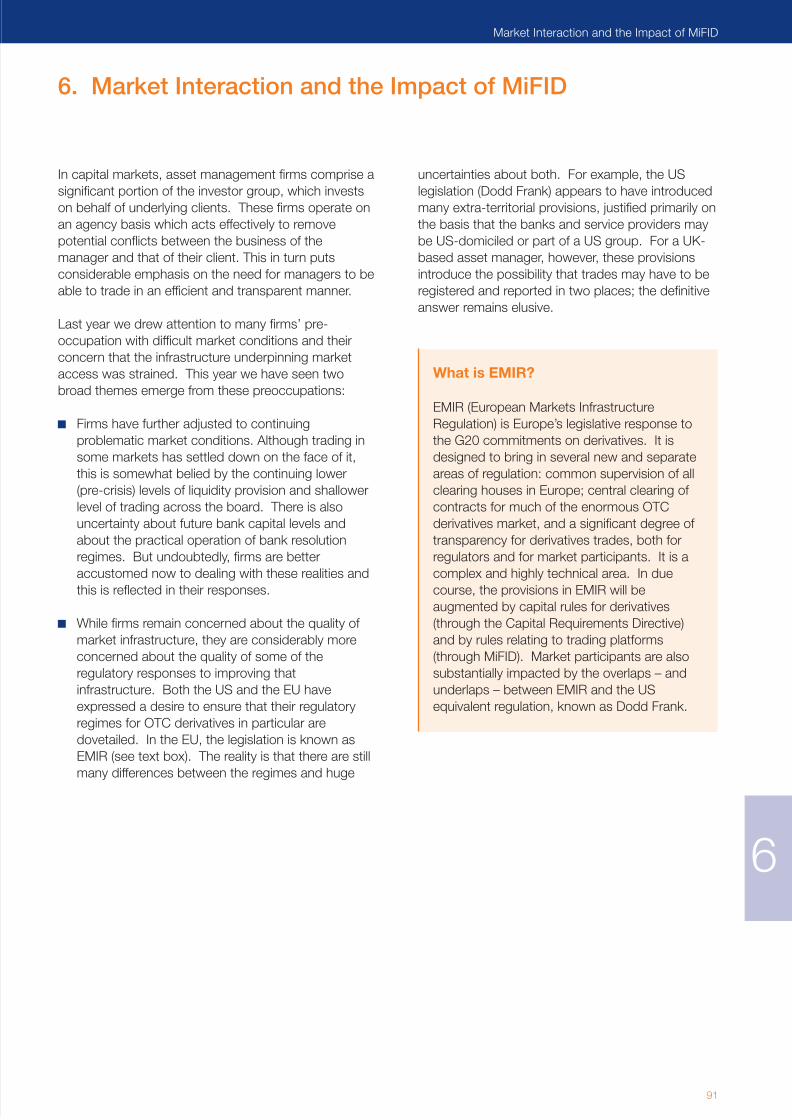
6
91
Market Interaction and the Impact of MiFID
In capital markets, asset management firms comprise asignificant portion of the investor group, which investson behalf of underlying clients. These firms operate onan agency basis which acts effectively to removepotential conflicts between the business of themanager and that of their client. This in turn putsconsiderable emphasis on the need for managers to beable to trade in an efficient and transparent manner.
Last year we drew attention to many firms’ pre-occupation with difficult market conditions and theirconcern that the infrastructure underpinning marketaccess was strained. This year we have seen twobroad themes emerge from these preoccupations:
Firms have further adjusted to continuingproblematic market conditions. Although trading insome markets has settled down on the face of it,this is somewhat belied by the continuing lower(pre-crisis) levels of liquidity provision and shallowerlevel of trading across the board. There is alsouncertainty about future bank capital levels andabout the practical operation of bank resolutionregimes. But undoubtedly, firms are betteraccustomed now to dealing with these realities andthis is reflected in their responses.
While firms remain concerned about the quality ofmarket infrastructure, they are considerably moreconcerned about the quality of some of theregulatory responses to improving thatinfrastructure. Both the US and the EU haveexpressed a desire to ensure that their regulatoryregimes for OTC derivatives in particular aredovetailed. In the EU, the legislation is known asEMIR (see text box). The reality is that there are stillmany differences between the regimes and huge
uncertainties about both. For example, the USlegislation (Dodd Frank) appears to have introducedmany extra-territorial provisions, justified primarily onthe basis that the banks and service providers maybe US-domiciled or part of a US group. For a UK-based asset manager, however, these provisionsintroduce the possibility that trades may have to beregistered and reported in two places; the definitiveanswer remains elusive.
What is EMIR?
EMIR (European Markets InfrastructureRegulation) is Europe’s legislative response tothe G20 commitments on derivatives. It isdesigned to bring in several new and separateareas of regulation: common supervision of allclearing houses in Europe; central clearing ofcontracts for much of the enormous OTCderivatives market, and a significant degree oftransparency for derivatives trades, both forregulators and for market participants. It is acomplex and highly technical area. In duecourse, the provisions in EMIR will beaugmented by capital rules for derivatives(through the Capital Requirements Directive)and by rules relating to trading platforms(through MiFID). Market participants are alsosubstantially impacted by the overlaps – andunderlaps – between EMIR and the USequivalent regulation, known as Dodd Frank.
6. Market Interaction and the Impact of MiFID
revsurvey 1:IMASurvey201011 22/07/2011 17:28 Page 91

indu
stryview
In the EU, firms continue to question the wisdom ofsome aspects of the Commission’s approach both tocentral clearing of derivatives and the introduction ofnew trading concepts across all asset classes in MiFID.They have been alarmed that such importantdevelopments appear to be considered within verynarrow time windows and without clear guidingprinciples in terms of improved market resilience. Itwas also notable in the legislative proposal for OTCderivatives that many investor-specific issues had beenmissed because of the rush to legislate.
Risks for centralised clearing
Centralised clearing is an area where I worryabout unintended consequences at the marketstructure level. If everybody has to clear and youdon’t recognise the different riskiness of differenttypes of participants, you may end up makingcertain risk-reducing activities, such as LDIhedging, so expensive that in fact it’s no longerviable to do. And as a result you don’t manageyour risk as well as you could and risks withinimportant pools of capital such as pension fundsend up rising not falling.
The regulatory challenge worries me a lot.There is a danger that instead of penalising thosethat have created problems, you end uppenalising everybody. Some of what is currentlyon the agenda has not been thought throughenough and it’s very difficult to make headway. Ifcentralisation of derivatives clearing were to beimplemented in the way that it had originally beenproposed, it would be a disaster for assetmanagers and pension funds. We are not sayingthat you don’t need to improve things, but to askfor greater consideration of the implications. Willthere be more liquidity? I’m not so sure. There isa real risk of forcing things into a monopolisticstructure.
As part of the Survey, we asked firms detailedquestions about their interaction with capital markets.Compared with previous years, more questions wereasked, which reflects our expectation that the nextthree years will see significant changes in mostmarkets. This includes changes in the OTC derivativesmarket owing to the introduction of central clearing andthe standardisation of many contracts in Europe andthe US, and gradually in Asia and other parts of theworld. The review of MiFID has discussed potentiallyfar-reaching changes in the equity and fixed incomemarkets with regard to publication of data oncompleted trades and, more unexpectedly,considerable prescription in markets pre-trade.
Equity Trading
Over the last decade, there has been a shift at almostevery level of firm size to dedicated dealing staff andgreater reliance on technology. The latter trend hasbecome more marked in recent years, as investment intechnology improves the opportunities to secure goodquality execution of trades. Commonly this equates to asearch for liquidity in sufficiently large volume to allowpurchases and sales to occur without undue change inthe dealt price.
Many firms have stepped up their equity tradingtechnology to a higher level even compared with a fewyears ago. Given the huge increase in reliance onalgorithms for optimising trade flow and the banks’simultaneous introduction of many trade-crossingnetworks (so-called “dark pools”), there is now likely tobe pressure to consolidate trading mechanisms.
“
”
”“
92
Investment Management Association
revsurvey 1:IMASurvey201011 22/07/2011 17:28 Page 92

93
Market Interaction and the Impact of MiFID
Execution-only trades
As in previous years, we asked firms what proportion ofequity trades through brokers, crossing networks anddirect market access were directed on an execution-only basis. Originally introduced to track changes inbroker commission arrangements, the question alsoprovides an indication of the extent to which firms aretaking control of their equity trading.
Respondents were asked what proportion of equitytrading by value was completed on an execution-onlybasis. This refers to trade execution where thecommission was paid for pure execution and did notinclude payment for other services. Trades may beconducted through many different routes – such asexecution-only brokers, broker crossing networks andthrough direct market access (DMA) which managersaccess through a broker. What they have in common is that the firm is taking charge of carrying out its client trades, accessing the various services only forliquidity.
As shown in Table 13, almost one-quarter ofrespondents conducted all their business on anexecution-only basis, although these accounted for lessthan 5% of the value of their equity holdings. Mostfirms (60%) did less than one-half of their business thisway and accounted for 51% of the value of equityholdings. Looking at a matched sample, the responsesshow little overall change since last year.
Table 13: Proportion of equity trades directed on anexecution-only basis
Percentage of Equity holdingsRange respondents (£bn)
<1% 0% 0
1-25% 40% 335
26-50% 20% 291
51-75% 6% 282
76-99% 10% 275
100% 24% 54
TOTAL 100% 1,237
Use of brokers
Respondents were asked how many brokers they usedfor the majority of their equity trades by value. Thisyear’s Survey has broken the results down into threegeographic areas – UK, Europe ex UK and the rest ofthe world (see Table 14):
Across all three areas, over 60% of firms use 5-15brokers.
For the UK and the rest of the world, around 18% ofrespondents use 16-25 brokers, while for Europethat category falls to 7%.
The results were similar to those of the 2009 Survey,which observed that firms had reviewed their brokerrelationships after MiFID implementation and thesubsequent increase in trading venues, and hadreached the optimum number of brokers in terms oftheir choice of trading strategies.
On a matched basis, however, there has been anincrease in the number of brokers used for trading inthe rest of the world. In 2009, just over 60% ofrespondents used 5-15 brokers. One year later, theresults show only one-quarter of firms in this category,with 70% using more than 15, and 10% using over 50.What we have observed about increasing allocations to emerging markets (see p. 21-22) may explain theincrease.
Table 14: Number of brokers used for the majority oftrades
Number Europe Rest ofof brokers UK (ex UK) world
<5 10% 16% 16%
5-15 63% 67% 61%
16-25 18% 7% 18%
26-35 2% 5% 0%
36-45 4% 5% 2%
46-50 2% 0% 2%
TOTAL 100% 100% 100%
6
revsurvey 1:IMASurvey201011 22/07/2011 17:28 Page 93
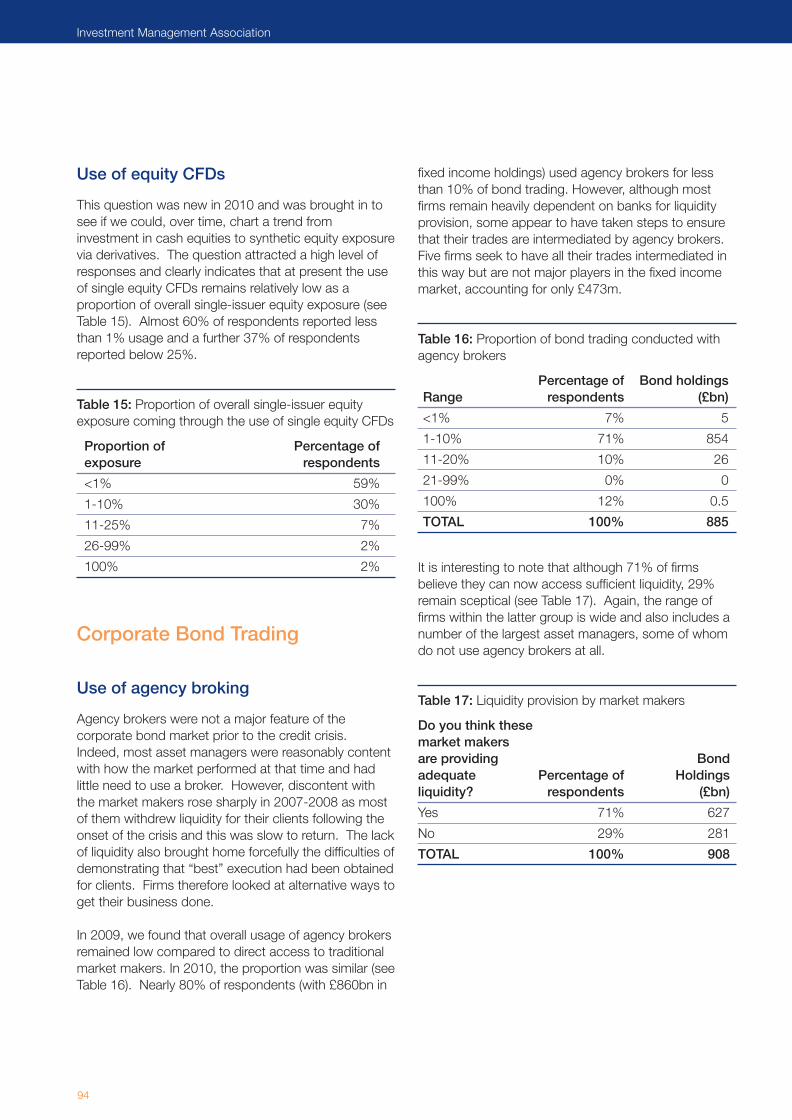
Use of equity CFDs
This question was new in 2010 and was brought in tosee if we could, over time, chart a trend frominvestment in cash equities to synthetic equity exposurevia derivatives. The question attracted a high level ofresponses and clearly indicates that at present the useof single equity CFDs remains relatively low as aproportion of overall single-issuer equity exposure (seeTable 15). Almost 60% of respondents reported lessthan 1% usage and a further 37% of respondentsreported below 25%.
Table 15: Proportion of overall single-issuer equityexposure coming through the use of single equity CFDs
Proportion of Percentage of exposure respondents
<1% 59%
1-10% 30%
11-25% 7%
26-99% 2%
100% 2%
Corporate Bond Trading
Use of agency broking
Agency brokers were not a major feature of thecorporate bond market prior to the credit crisis.Indeed, most asset managers were reasonably contentwith how the market performed at that time and hadlittle need to use a broker. However, discontent withthe market makers rose sharply in 2007-2008 as mostof them withdrew liquidity for their clients following theonset of the crisis and this was slow to return. The lackof liquidity also brought home forcefully the difficulties ofdemonstrating that “best” execution had been obtainedfor clients. Firms therefore looked at alternative ways toget their business done.
In 2009, we found that overall usage of agency brokersremained low compared to direct access to traditionalmarket makers. In 2010, the proportion was similar (seeTable 16). Nearly 80% of respondents (with £860bn in
fixed income holdings) used agency brokers for lessthan 10% of bond trading. However, although mostfirms remain heavily dependent on banks for liquidityprovision, some appear to have taken steps to ensurethat their trades are intermediated by agency brokers.Five firms seek to have all their trades intermediated inthis way but are not major players in the fixed incomemarket, accounting for only £473m.
Table 16: Proportion of bond trading conducted withagency brokers
Percentage of Bond holdingsRange respondents (£bn)
<1% 7% 5
1-10% 71% 854
11-20% 10% 26
21-99% 0% 0
100% 12% 0.5
TOTAL 100% 885
It is interesting to note that although 71% of firmsbelieve they can now access sufficient liquidity, 29%remain sceptical (see Table 17). Again, the range offirms within the latter group is wide and also includes anumber of the largest asset managers, some of whomdo not use agency brokers at all.
Table 17: Liquidity provision by market makers
Do you think these market makers are providing Bond adequate Percentage of Holdingsliquidity? respondents (£bn)
Yes 71% 627
No 29% 281
TOTAL 100% 908
94
Investment Management Association
revsurvey 1:IMASurvey201011 22/07/2011 17:28 Page 94

95
Market Interaction and the Impact of MiFID
Derivative Trades
We introduced questions about derivative trades for thefirst time in the 2009 Survey. The intention was to beable to track changes in market usage during theperiod in which many new regulatory requirements willbe introduced, principally central clearing for manyderivative trades that are currently dealt and settledbilaterally with a single bank counterparty.
Collateral
A hallmark of the credit crisis was the lack ofinformation about many aspects of derivative trades,including importantly the extent to which trades wereappropriately collateralised and margined. It is clear thatmargining of trades – using collateral or otherwise – isnow well embedded in the process.
Table 18: Collateral demands on firms
Compared to 2009, how much collateral are you being Percentage of asked to post? respondents
More 37%
Less 9%
About the same 54%
TOTAL 100%
Our question about changes in collateral produced avariety of responses, with the headline findingsindicating that collateral requirements are rising for asignificant proportion of firms (see Table 18).
It should be noted that collateral has always beenexchanged to cover some degree of mark-to-marketrisk for OTC derivative contracts. However, the markethas seen changes bringing in increased marginrequirements, notably with respect to ‘independentamounts’. Independent amounts mimic requirementsfor on-exchange trading, where a fixed amount has tobe set aside against the possibility of default by one ofthe parties to a trade. The amount is set by referenceto the perceived risk of the instrument traded (thereforein addition to the daily mark-to-market movement invalue). Typically, this type of buffer capital had not beena feature of the bilateral OTC markets, at least not oneinvolving investment managers, but this has changedand independent amounts are now often exchanged.
Out of 37 respondents, 35% reported that they postindependent amounts for bilateral derivatives (this is thefirst time we have asked about this aspect specifically).Of those posting independent amounts, over 70% ofrespondents do so to all their counterparties, andtypically in amounts equivalent to up to 5% of thecontract size (see Table 19).
Table 19: Exchange of independent amounts
Do you post independent amounts for bilateral Percentage ofderivatives? respondents
Yes 35%
No 65%
TOTAL 100%
Of those who answered Yes, to what proportion of your Percentage ofcounterparties approximately? respondents
0-10% 18%
11-99% 9%
100% 73%
TOTAL 100%
Of those who answered Yes, in what amount approximately, Percentage ofas a proportion of contract size? respondents
<1% 36%
1-5% 36%
6-20% 27%
>20% 0%
TOTAL 100%
6
revsurvey 1:IMASurvey201011 22/07/2011 17:28 Page 95

Central clearing of OTC derivatives
The results of the Survey show that it is still rare forinvestors to clear any OTC derivatives trades centrally,regardless of the underlying asset. Over 90% ofrespondents report proportions of less than 1% clearedcentrally (see Table 20). We expect this to change from2012 once the US and EU legislation is brought intoeffect. However, it is notable that there has been verylittle client movement. We believe it stems from the asyet poorly developed initiatives for clearing client tradesas much of the focus has continued to be on clearingdealer trades.
Table 20: Central clearing of OTC derivatives
Proportion ofOTC derivative trades cleared CDS/Credit Equitycentrally derivatives derivatives Other
<1% 100% 93% 100%
1-99% 0% 3% 0%
100% 0% 3% 0%
TOTAL 100% 100% 100%
Documentation published and maintained by theInternational Swaps and Derivatives Association (ISDA)is used by most market participants. Thedocumentation is complex and requires considerableresource to maintain. It did, however, provideprotection for firms’ clients during the bankruptcy ofLehman Brothers. The Survey shows continuingdifficulty in agreeing contractual terms with the banksfor derivative trades – 54% of firms report this –although we believe the situation has improved slightlyfrom 2009 (see Table 21).
Table 21: Negotiation of ISDA terms
Have you found it more difficult to negotiateISDAs for your derivative Percentage oftrades since 2009? respondents
Yes 54%
No 46%
TOTAL 100%
96
Investment Management Association
revsurvey 1:IMASurvey201011 22/07/2011 17:28 Page 96

97
Market Interaction and the Impact of MiFID
Impact of MiFID
We continue to ask a series of questions in the area ofmarket or market-related regulation. These cover areasof regulation that apply to firms in their dealings in themarket and with clients. They also cover regulation ofother service providers on which our firms may berelying. Questions were introduced several years backto gauge the impact of MiFID. As the MiFID Reviewprogresses we are likely to ask additional questions inthis area.
Table 22: Transaction cost analysis
Is transaction cost Do you provideanalysis used as transaction cost
part of your internal analysis on a assessment of regular basis toachieving best institutional
execution? clients?
Yes 80% 42%
No 20% 58%
TOTAL 100% 100%
As shown in Table 22, some 80% of respondents (45out of 56) undertake transaction cost analysis as part oftheir internal assessment of achieving best execution, asimilar proportion to last year. With the introduction ofMiFID in 2007, a direct regulatory requirement wasimposed on managers to act in the best interests oftheir clients when placing orders that result in decisionsto deal. Indeed, 42% of respondents (22 out of 52)provide transaction cost analysis on a regular basis toclients, which on a matched basis is slightly down on2009.
Execution policies
As in previous years, we asked about the provision ofinformation to and requests from clients (see Table 23).This year we also asked about the provision ofinformation from brokers to asset managers.
MiFID states that asset managers are required toprovide appropriate information on their executionpolicy to clients on request. We asked whetherinstitutional clients did actually request copies of firms’full execution policies, rather than accepting asummary. The results show that, similar to 2009, asignificant portion of clients did not ask to see firms’execution policy.
MiFID also requires that investment firms have toprovide clients with a demonstration of their bestexecution policy upon request. Again there appears tobe little appetite amongst institutional clients to requestsuch evidence. The vast majority of firms (89%) hadbeen asked by less than one-quarter of their clients,though 9% of firms had been asked by all.
Table 23: Clients asking for detail of execution policyand compliance demonstration
What proportion Proportion requested a copy of of clients your execution policy?
<1% 52%
1-25% 18%
26-50% 2%
51-75% 5%
76-99% 2%
100% 20%
TOTAL 100%
What proportion requested a demonstration of
Proportion compliance with yourof clients best execution policy?
<1% 60%
1-25% 29%
26-50% 0%
51-75% 2%
76-99% 0%
100% 9%
TOTAL 100%
6
revsurvey 1:IMASurvey201011 22/07/2011 17:28 Page 97

As Table 24 illustrates, 76% of respondents had askedevery broker for a copy of their execution policies.There were very few responses this year that suggestedthat brokers’ policies were not forthcoming one way oranother.
Table 24: Brokers asked for execution policies
From what proportion of your brokers What have you asked proportion of
Proportion for their execution those brokersof brokers policies? responded?
<1% 13% N/A
1-25% 2% 3%
26-50% 2% 0%
51-75% 2% 5%
76-99% 4% 15%
100% 76% 78%
TOTAL 100% 100%
Publication of equity trade data
MiFID requires that investment firms which concludetransactions in shares trading on public markets(whether or not they are themselves trading on a publicmarket) must publish the volume, price and time atwhich the transactions were concluded. Thisinformation is to be made public as close to real-timeas possible in a manner that facilitates consolidation ofpost-trade data, and those who publish it must make itavailable on a reasonable commercial basis. Assetmanagers had expressed concerns well before MiFIDwas implemented that equity market data was at risk offragmenting.
Table 25: Post-trade transparency after MiFIDimplementation
How has post-trade transparency in equity markets developed Europeansince MiFID UK (ex UK)implementation? equities equities
Increased 9% 11%
Decreased 64% 53%
Same 28% 36%
TOTAL 100% 100%
Similar to the 2009 Survey findings, almost two-thirdsof respondents report a deterioration of post-tradetransparency for UK equities since MiFIDimplementation, while just over a quarter report that ithad remained the same. Just over one-half said thattransparency had deteriorated for European equities inthat time, a slight improvement on 2009 (62%).
98
Investment Management Association
revsurvey 1:IMASurvey201011 22/07/2011 17:28 Page 98

99
Market Interaction and the Impact of MiFID
Cost of trading
This year, we also asked whether the MiFID reformshad brought about a reduction in the cost of trading.One of the main changes brought about by MiFID wasthe abolition of the “concentration rule”, which allowedindividual member states to require that all secondarymarket equity trading be carried out on their nationalstock exchange. This abolition was to allow for morecompetition in the trading of European equities and ithas resulted in a proliferation of alternative tradingvenues over the last three years. The consequentbenefit should be a reduction in the cost of trading.Disappointingly, 59% of respondents reported that theyhad not seen a reduction in the cost of trading (seeTable 26).
Table 26: Impact of MiFID on the cost of trading
Do you think the reforms under MiFID brought about a reduction in the cost of Percentage of trading? respondents
Yes 41%
No 59%
TOTAL 100%
Compliance with GIPS
Out of 57 respondents, three-quarters claimedcompliance with Global Investment PerformanceStandards (GIPS), a similar proportion to last year (seeTable 27). It would appear that some firms choose notto become GIPS-compliant, but the Survey doesinclude a number of firms which do not have the samecommercial requirement, since they have mainly retailclients.
Of those claiming compliance, almost 90% areindependently verified. The 2010 GIPS revisions wereadopted at the beginning of 2011 and they do notinclude a requirement to be independently verified,encouraging firms to do so and to disclose if they are not.
Table 27: Compliance with GIPS
Is your firm GIPS Percentage of compliant? respondents
Yes 75%
No 25%
TOTAL 100%
Of those who answered Yes, is the process externally Percentage of verified? respondents
Yes 88%
No 12%
TOTAL 100%
6
revsurvey 1:IMASurvey201011 22/07/2011 17:28 Page 99

Appendix One: Summary of Main Responses – Assets under Management in the UK1
Sample sizes vary between questions
CLIENT TYPE TOTAL
Assets Under Management in the UK (£m) 3,939,104
Segregated (directly invested) or Pooled Institutional Assets (%)
Assets directly invested on a segregated basis 54.8%
Managed on a pooled basis 45.2%
Active or Passive (%)
Actively managed 79.3%
Passively managed of which 20.7%
Equities 61.8%
Other asset classes 38.2%
Asset Allocation (%)
Equities of which: 45.7%
UK 42.6%
Europe ex UK 19.9%
North America 15.1%
Pacific ex-Japan 07.3%
Japan 04.3%
Emerging Market 09.7%
Other 01.1%
Fixed Income2 of which: 36.1%
UK Government 21.3%
UK Corporate 37.4%
UK Index-Linked 15.5%
Other UK 01.8%
Overseas 24.0%
Cash/Money Market 08.6%
Property 04.0%
Other 05.6%
1 This includes all assets under management in this country, regardless of where clients or funds are domiciled. Caution should be used in undertaking direct year-on-year comparisons with previous surveys. Where relevant or possible, we have used matched results in the Survey analysis to validate observations of change.2 With holdings of UK Government and corporate debt quite concentrated among IMA members, direct extrapolations from the Survey headline findings are likely to overstate the value of these securities held.
100
Investment Management Association
revsurvey 1:IMASurvey201011 22/07/2011 17:28 Page 100

INSTITUTIONAL
Pension PublicCorporate Non-Profit
Sub- In-House Third Party OtherALL
RETAILPRIvATE
Fund Sector Advisory Insurance Insurance InstitutionalINSTITUTIONAL CLIENT
1,354,210 180,267 123,295 42,929 146,140 781,937 152,067 286,306 3,067,151 810,666 61,287
34.4% 04.6% 03.1% 01.1% 03.7% 19.9% 03.9% 07.3% 77.9% 20.6% 01.6%
0
0
0
App
endi
ces
101
Appendix One
revsurvey 1:IMASurvey201011 22/07/2011 17:28 Page 101
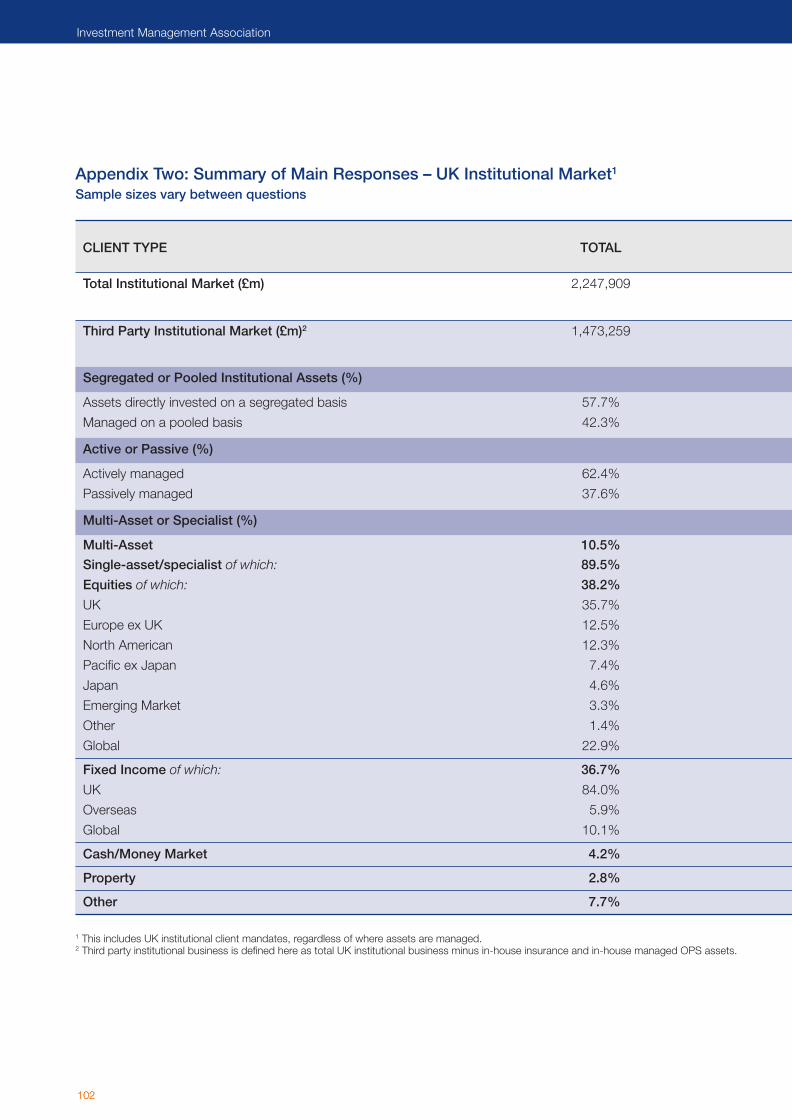
102
Investment Management Association
102
Investment Management Association
Appendix Two: Summary of Main Responses – UK Institutional Market1
Sample sizes vary between questions
CLIENT TYPE TOTAL
Total Institutional Market (£m) 2,247,909
Third Party Institutional Market (£m)2 1,473,259
Segregated or Pooled Institutional Assets (%)
Assets directly invested on a segregated basis 57.7%
Managed on a pooled basis 42.3%
Active or Passive (%)
Actively managed 62.4%
Passively managed 37.6%
Multi-Asset or Specialist (%)
Multi-Asset 10.5%
Single-asset/specialist of which: 89.5%
Equities of which: 38.2%
UK 35.7%
Europe ex UK 12.5%
North American 12.3%
Pacific ex Japan 07.4%
Japan 04.6%
Emerging Market 03.3%
Other 01.4%
Global 22.9%
Fixed Income of which: 36.7%
UK 84.0%
Overseas 05.9%
Global 10.1%
Cash/Money Market 04.2%
Property 02.8%
Other 07.7%
1 This includes UK institutional client mandates, regardless of where assets are managed.2 Third party institutional business is defined here as total UK institutional business minus in-house insurance and in-house managed OPS assets.
revsurvey 1:IMASurvey201011 22/07/2011 17:28 Page 102

103
Introduction
App
endi
ces
Appendix Two
Pension Funds
CorporateLocal
OtherPublic
Corporate Non-ProfitSub- In-House Third Party Other
GovernmentSector Advisory Insurance Insurance Institutional
935,405 150,148 29,870 16,778 30,365 26,610 87,808 676,500 91,680 202,745
41.6% 06.7% 01.3% 00.7% 01.4% 01.2% 03.9% 30.1% 04.1% 09.0%
837,255 150,148 29,870 16,778 30,365 26,610 87,808 91,680 202,745
56.8% 10.2% 02.0% 01.1% 02.1% 01.8% 06.0% 06.2% 13.8%
59.1% 69.5% 51.6% 94.8% 68.5% 67.9% 95.6% 93.4% 11.7%
40.9% 30.5% 48.4% 05.2% 31.5% 32.1% 04.4% 06.6% 88.3%
54.7% 77.5% 82.5% 100.0% 98.6% 84.5% 63.3% 79.2% 60.1%
45.3% 22.5% 17.5% 00.0% 01.4% 15.5% 36.7% 20.8% 39.9%
08.1% 13.4% 18.0% 30.3% 03.1% 35.2% 21.7% 16.4% 08.1%
91.9% 86.6% 82.0% 69.7% 96.9% 64.8% 78.3% 83.6% 91.9%
35.0% 52.1% 57.5% 34.6% 28.9% 31.8% 55.9% 14.4% 44.8%
38.0% 32.6% 18.0% 5.1% 47.7% 46.6% 47.9% 28.1% 23.4%
15.0% 07.0% 03.9% 42.6% 06.2% 05.4% 11.1% 21.1% 09.4%
16.5% 08.0% 00.9% 00.0% 00.2% 08.0% 01.4% 14.0% 08.7%
06.8% 03.4% 02.0% 19.3% 00.0% 00.9% 11.7% 20.1% 23.5%
05.8% 02.8% 02.1% 00.0% 08.2% 01.6% 01.5% 05.8% 02.6%
01.5% 03.9% 01.0% 31.2% 02.5% 11.1% 02.2% 06.7% 13.0%
01.4% 01.7% 03.3% 00.2% 00.4% 00.2% 01.0% 00.0% 00.8%
14.9% 40.6% 68.9% 01.6% 34.7% 26.1% 23.3% 04.2% 18.7%
44.7% 18.6% 18.6% 11.2% 12.6% 13.3% 17.0% 54.2% 26.5%
88.3% 77.1% 69.2% 100.0% 43.2% 69.3% 74.9% 78.3% 17.0%
4.0% 01.2% 15.7% 00.0% 31.7% 04.6% 10.7% 16.1% 39.0%
7.7% 21.8% 15.5% 00.0% 25.1% 26.2% 14.4% 05.6% 43.9%
01.2% 00.2% 02.9% 22.8% 33.2% 17.1% 1.1% 003.8% 14.0%
01.7% 04.1% 01.8% 01.0% 21.7% 02.3% 03.6% 004.2% 003.0%0
9.3% 11.6% 01.2% 00.0% 00.4% 00.2% 00.6% 007.0% 003.7%
revsurvey 1:IMASurvey201011 22/07/2011 17:28 Page 103

104
Investment Management Association
Aberdeen Asset Management
Aberforth Partners
AEGON Asset Management
Aerion Fund Management
Alliance Trust Asset Management
AllianceBernstein
Allianz Global Investors
Ashmore Investment Management
Aviva Investors
BAE Systems Pension Funds Investment Management
Baillie Gifford & Co
Baring Asset Management
BlackRock Investment Management
Brewin Dolphin
British Airways Pension Investment Management
Canada Life Asset Management
Capital International
Cazenove Capital Management
CCLA Investment Management
Edinburgh Partners
Family Investment Management
Fidelity International
First State Investments
Franklin Templeton Investment Management
GLG Partners
Henderson Global Investors
Hermes Fund Managers
HSBC Global Asset Management
Ignis Asset Management
Insight Investment Management
Invesco Perpetual
Investec Asset Management
Invista Real Estate Investment Management
JO Hambro Capital Management
JP Morgan Asset Management
Jupiter Asset Management
Kotak Mahindra
Lazard Asset Management
Legal & General Investment Management
Liontrust Investment Funds
Liverpool Victoria Asset Management
M&G Investments
Manek Investment Management
Martin Currie
Morgan Stanley Investment Management
Newton Investment Management
Nikko Asset Management
Nomura Asset Management
Octopus Investments
Odey Asset Management
Old Mutual Fund Managers
Origin Asset Management
Pictet Asset Management
Premier Portfolio Managers
Principal Global Investors
Pyrford International
Rathbone Unit Trust Management
Record Currency Management
Royal London Asset Management
Santander Asset Management
Schroder Investment Management
Scottish Friendly Asset Managers
Appendix Three: Survey Respondents
revsurvey 1:IMASurvey201011 22/07/2011 17:28 Page 104

App
endi
ces
105
Appendix Three
SEI Investments
Sharefunds
SMARTfund Administration
St James’s Place Unit Trust
Standard Life Investments
State Street Global Advisors
Scottish Widows Investment Partnership
T. Bailey Asset Management
T. Rowe Price International
The Co-operative Asset Management
Threadneedle Asset Management
UBS Global Asset Management
Vanguard Asset Management
Veritas Asset Management
revsurvey 1:IMASurvey201011 22/07/2011 17:28 Page 105

106
Investment Management Association
AllianceBernstein
Allianz Global Investors
Aviva Investors
Baillie Gifford & Co
Barclays Wealth
BlackRock Investment Management
Capital International
F&C Asset Management
Fidelity International
Insight Investment Management
Invesco Perpetual
Investec Asset Management
Invista Real Estate Investment Management
JP Morgan Asset Management
Lazard Asset Management
M&G Investments
Newton Investment Management
Odey Asset Management
Schroder Investment Management
Standard Life Investments
Scottish Widows Investment Partnership
Threadneedle Asset Management
Vanguard Asset Management
Appendix Four: Firms Interviewed
Senior figures from the firms below were interviewed for the Survey. With their agreement, selected quotationshave been reproduced on an anonymous basis throughout the Survey.
IMASurvey2011Final:IMASurvey201011 25/07/2011 17:00 Page 106