Asset Liability Management in Developing Countries1...
36
Asset Liability Management in Developing Countries 1 - A Balance Sheet Approach Andre Proite* Abstract This paper presents a discussion on the usage of a Balance Sheet Approach applied to developing countries. As an initial stage to conduct proper asset and liability management it discusses how this analytical tool could be used to increase the level of awareness from the debt managers’ point of view. The conclusion is that, although gathering the data is often difficult, the rationale behind it is rather straightforward, which could be useful to help the authorities to mitigate public debt risks while formulating policies. JEL Codes: E61, G11, H63 Keywords: balance sheet, debt strategy, maturity structure, interest and currency risk, net worth. 1 This paper has been modified from an article previously supported by the Development Account UNCTAD’s project “Strengthening Capacity for Effective Asset and Liability Management in National Debt Management Offices” (Development Account 7th Tranche Project). * Manager of the Investor Relations’ Office in the Brazilian National Treasury’s DMO. The author alone is responsible for errors of fact and judgment. Views expressed here do not necessarily reflect those of any institutions with which this author is now or has been associated.
-
Upload
trinhthien -
Category
Documents
-
view
218 -
download
3
Transcript of Asset Liability Management in Developing Countries1...

Asset Liability Management in Developing Countries1 - A Balance Sheet Approach
Andre Proite*
Abstract
This paper presents a discussion on the usage of a Balance Sheet Approach applied to
developing countries. As an initial stage to conduct proper asset and liability
management it discusses how this analytical tool could be used to increase the level of
awareness from the debt managers’ point of view. The conclusion is that, although
gathering the data is often difficult, the rationale behind it is rather straightforward,
which could be useful to help the authorities to mitigate public debt risks while
formulating policies.
JEL Codes: E61, G11, H63
Keywords: balance sheet, debt strategy, maturity structure, interest and currency risk,
net worth.
1 This paper has been modified from an article previously supported by the Development Account UNCTAD’s project “Strengthening Capacity for Effective Asset and Liability Management in National Debt Management Offices” (Development Account 7th Tranche Project). * Manager of the Investor Relations’ Office in the Brazilian National Treasury’s DMO. The author alone is responsible for errors of fact and judgment. Views expressed here do not necessarily reflect those of any institutions with which this author is now or has been associated.

2
Acronyms
BIS Bank of International Settlements
BCRA Central Bank- Argentina
BCB Brazilian Central Bank
BoP Balance of Payments
BSA Balance Sheet Approach
CL Contingent Liabilities
CPI Consumer Price Index
DMO Debt Management Office
DSA Debt Sustainability Analysis
DPA Debt Portfolio Analysis
GAAP General Accepted Accounting Principles
GFS Government Finance Statistics
GGGD Gross General Government Debt
IMF International Monetary Fund
MDRI Multilateral Debt Relief Initiative
MoF Ministry of Finance
MOFED Ministry of Finance, Economics and Development - Ethiopia
NBE National Bank of Ethiopia
NPSD Net Public Sector Debt
ONCP Oficina Nacional de Crédito Público - Argentina
SDDS Special Dissemination Data Standard
SOE State Owned Enterprises
SPNNF Non-Financial National Public Sector- Argentina
UNCTAD United Nations Conference on Trade and Development
WB The World Bank
YTM Yield to Maturity
3
1. Introduction
Public debt has long been associated with a heavy burden that constraints the
government’s ability towards policy implementation, but also with the periodical
occurrence of financial distress and economic crisis. Governments usually raise funds
to meet their financing needs using a range of securities and loans with different
maturities, interest rates, and exchange rate structures. While doing that, debt managers
need to consider various policy objectives to decide on the structure of the public
liability portfolio The selection of specific financial instruments and their intersection
with other sectors of the economy could exacerbate the fragilities on the underlying
public sector balance sheet leading to instability and negatively affecting the real sector.
Governments worry about their liabilities because of the financial and economic costs
that result from an unexpected increase in debt servicing flows. This means that, in
general, the emphasis is on the liability side and policy makers often have a narrow
view of integrated asset and liability management (ALM). Nonetheless there are
benefits in managing their liabilities more consistently with the characteristics of the
available assets. Because of the nature of government assets, the application of
traditional ALM framework to the sovereign risk analysis is more complex. Many
public assets lack the exogenous and explicit financial features that are at the core of
risk identification and quantification in the traditional ALM framework. To highlight
the different sources of risks Das, et al (2012a) argue that some countries face other
financial risks associated with an aging population, structural issues that need reform
(health and pension), contingent liabilities arising from systemically important financial
or corporate sectors, and imbalances coming from sub-national entities. These risks, if
materialized, could cause a significant fiscal and financial drain with a consequent fall
in the country’s domestic absorption and potential output.
Over time, various crisis-related events have shown that policy makers could no longer
rely solely on a country's so-called flow variables (among them revenues, expenditures,
imports, exports, and borrowing) as a guide to economic vulnerabilities. Financial
soundness turned out to be more complicated than traditional macroeconomic

4
imbalances which can be promptly identified. Monitoring fiscal policy and its
framework is no longer sufficient to assess debt sustainability and its impacts on
growth, inflation, and employment.
It is unusual to see governments engaging into risk management activities of their assets
and liabilities in an integrated way. This paper will show some relevant aspects that
could be effective for developing countries to take the initial steps in risk management,
using the data available and reasoning on the risk nature residing on each part of their
balance sheet. Aside from this introduction, the following section connects ALM with
Balance Sheet Approach (BSA); section 3 comments on how to build a balance sheet
for the public sector; section 4 expands the analysis to a more comprehensive scope in
order to include other sectors. Section 5 presents a few examples and section 6
concludes.
2. ALM and the Balance Sheet Approach
“Unlike mermaids and unicorns, sovereign balance sheets are real, but very rare. They
are also very valuable, for a range of reasons”. With that peculiar comment, Ball,
(2012) characterizes the importance of financial balance sheets in identifying hidden
risks and unveiling financial imbalances that could unfold in a series of negative events
affecting the sovereign fiscal position and public debt bond market. Many sovereigns
have been careless about their financial balance sheets or simply have lacked one,
failing to prevent crisis and getting hampered when market financing conditions became
more restrictive.
This situation does not seem to be restricted only to developed countries, where
complex economic structures make the identification of crises far more difficult than in
smaller economies. Though the scenario has changed a lot in the past decade, emerging
economies typically have shown weak revenue base and poor expenditure controls.
This has contributed to explain why fiscal balances and public debt sustainability have
been on the top of the agenda for most policy makers. Because many emerging
economies have also achieved more integration with the external sector and have
developed their domestic markets, with greater financial intermediation, other sources
of risks gained importance. For example, these risks may be originated in the banking

5
industry, non-financial corporate sector, state owned companies or in the external
sector.
The Balance Sheet Approach (BSA) provides important hints to snipe proper
imbalances on sovereigns’ structure and potentially anticipates increases in overall
riskiness. It can be seen as a comprehensive framework for looking at vulnerabilities
that may emerge as a result of: (i) interactions between different debt types, and
structures (maturity related) and the relevant assets for servicing these debts; (ii)
linkages between sector balance sheets [IMF, (2004)]. However, most countries do not
have a balance sheet, despite the recent efforts to provide guidance on that2. For those
countries which choose not to publish a balance sheet, questions would be raised about
the status of their fiscal position. There are clear incentives to publish a balance sheet
because, if credible, the disclosure of government’s true fiscal stance could be
reassuring to markets, resulting on financial relief on debt financing conditions.
Other aspects could be related to the importance of balance sheets. Because it is an
account of all government’s assets and liabilities and, therefore, provides a clearer
snapshot of its financial strength and sustainability, it is more complete than only
observing debt to GDP ratios. It also elucidates that sovereigns have also important
obligations other than traditionally reported debt (far more complicated to identify) and
different asset structures from which to meet those liabilities. It enhances transparency
and guide investors to better analyze the issuers’ fiscal position, preventing the debtor to
bear unnecessary costs.
In addition, a balance sheet gives a sovereign a starting point for better managing its
assets and liabilities. This aspect must be highlighted for developing countries, which
are the main object of this paper. In fact, the BSA can be easily built, at least on a
conceptual basis, in order to create the initial stages towards a more complete
understanding of asset and liability management (ALM). Therefore, sound accounting
helps a government to use its assets more effectively insulating its balance sheet from
intrinsic risks.
2 See IMF (2012).

6
On the policy front, cross-country experiences underscore the importance of temporary
protection associated with strong public sector balance sheets. Thus, they highlight the
benefits of promoting appropriate hedge to improve risk allocation within and across
sectors. They also support the strengthening of banking supervision, limit currency
exposure and avoid maturity mismatches as will be explored in the following sections.
Considering both private and public sectors, balance sheets show how robust liability
management is useful in taming interest rate, currency, and rollover risks.
Despite the fact that it seems straightforward to conceptually build a balance sheet, there
is no consensus on how to do it. There is an ongoing discussion on whether one should
include only financial assets and liabilities rather than physical ones, such as real estate
property. Alternatively, one might also consider more intangible assets such as the
present value of unexplored natural resources or cultural heritage. Evidently, it does
add complexity and instability to these concepts3.
Should financial assets dominate the balance sheet? To give vent to these ideas, one
would assume that this is not necessarily true. Thus, to illustrate, what is the Amazon
Forest value? How much is the South African shoreline worth? At which price could a
public building be sold? Indeed, it is very hard to assess the economic value of these
national assets and incorporate them into a balance sheet. Because of practical reasons
and liquidity constraints of more tangible assets, sovereigns should avoid including the
non-financial assets in the balance sheet, which is often described as a "snapshot of a
sovereign financial condition". This guards a close relationship with corporate finance.
A standard corporate balance sheet has three parts: assets, liabilities and ownership
equity. The main categories of assets are usually listed first and typically in order
of liquidity. Assets are followed by the liabilities. The difference between the assets and
the liabilities is known as equity or the net assets or the net worth or capital of the
company.
3 According to Ball (2012), very few governments seek to manage their balance sheet such as
corporations do, that is, complying with standard accounting rules. New Zealand is one example.

7
A business operating entirely in cash can measure its profits by the sum of all bank
balance plus any cash in hand at the end of the period. However, many businesses’
dividends are not paid immediately; companies often build up inventories and acquire
buildings and equipment. Likewise, government activities accumulate assets and so they
cannot, even if they want to, immediately turn these into cash at the end of each period.
On other occasions, businesses and the public sector do not withdraw all their original
capital and profits at the end of each period because they owe money to suppliers and
the proprietors.
The fact that, unlike companies, a sovereign cannot be put under foreclosure implies
that legal disputes may occur in extraordinary circumstances making it a more difficult
to include non-financial assets in the balance sheet. In addition to the practical reasons
aforementioned, one should only include financial assets that could be measured by
reasonable methodologies.
Hence, BSA cannot be easily reduced to a small set of readily comparable indicators
that quantify vulnerabilities, and, by definition, it disregards off-balance sheet
transactions. Nevertheless, there are papers demonstrating that available data, even
where limited, providing useful insights into the nature of intersectoral vulnerabilities
and the channels by which they are transmitted4.
As previously stated, balance sheet represents an initial step. Putting it together does
not guarantee that a government will use the information effectively. Careful research
reinforces a better assessment of the liability side of the public sector’s balance sheet
and, when confronted to certain assets, allows authorities to reduce the level of debt
toward sustainable levels. For example, Hausmann and Panizza (2003) provide insights
on the original sin - the inability to borrow in the long-term and in local currency -
drawing attention to important differences between debt structures of advanced and
some emerging economies. Though many countries have been overcoming that
shortfall5, it is still a very important restriction on the liability side.
4 See IMF, (2004); Das, Lu, Papaiaoannu, and Petrova, (2012)
5 Countries like, Brazil, Colombia and Uruguay gradually accessed the external capital market to issue
securities denominated in their local currency, transferring exchange rate risk to the bond holder, thus, redeeming from the original sin. See more on Papaioannou (2009).

8
Another example that relates to vulnerabilities on the liability side is the partial
dollarization of the domestic economy and its embedded foreign exchange regime.
Households’ holdings of dollar deposits, for example, can leave the banking system and
the overall economy vulnerable to a self-reinforcing deposit run, as a shock to the
portfolio preferences of domestic households prompts a shift out of domestic dollar
deposits toward relatively safer international assets [IMF, (2004)]. The need to offset
dollar deposits with domestic dollar-linked borrowings increases demand for foreign
currency and significantly augments the exchange rate linked claims in the system. In
turn, adding severity on the impact of currency depreciation and setting the stage to the
occurrence of a financial distress. This sort of mismatches, both on corporate and
public balance sheets, hinders monetary authorities’ (and policy makers, in general)
tolerance towards currency movements. If currency pressures are strong and persistent
enough, the authorities will eventually run out of ammunition to intervene and avoid
large movements on the exchange rate.
One may realize the fragility and self-fulfillingness of this scheme. Latin America
displayed many examples of that situation, often associated with the usage of hard
currency indexation to anchor inflationary expectations in stabilization plans devised in
the 80’s and early 90’s. Important examples will be further explored later, but some
initial thoughts are useful. Fiscal policies and financing current expenditures through
public debt issuance was quite characteristic. Because there was limited capacity to
fund public debt obligations on local currency and longer maturities this outlook has
proven particularly vulnerable to sudden capital outflows, sharp changes on investors’
confidence and underlying sources of financing. As a result, currency mismatches had
arisen, maturity and interest rate risks had sharpened, leading public sector finances to
be highly sensitive to shocks6.
Next, a few concepts and inputs will be discussed on how to build a balance sheet.
First, emphasis is given to the sovereign and then an expanded balance sheet is
presented aggregating other sectors and its cross linkages. After that, a few country
examples are presented.
6 See Reinhart, Rogoff, and Savastano (2003); De Nicoló, Honohan, and Ize (2003); Caballero and
Krishnamurthy (2000); Calvo (1998).

9
3. Building a Sovereign Balance Sheet for Sovereigns
The BSA can be best understood as a comprehensive framework for scanning
vulnerabilities that may emerge as a result of poor debt profile (composition), structure
(maturity-related), and the relevant assets for servicing these debts besides the
correlations between sectoral balance sheets.
Rosemberg et al, (2005), proposes that ALM should focus on the continuous search for
constraints that could emerge from different parts of the economy. It reinforces the idea
of interdependency across different sectors and tries to establish relations between risk
exposure, transmission channels and policy responses. Table 1 shows these relations.
Table 1 – Balance Sheet and ALM Components
Source: Rosemberg at al, (2005)
Moving towards a more operational level, the IMF – GFS (Government Finance
Statistics) provides guidance on an internationally recognized statistical reporting
framework, also advocating for simplicity on balance sheet for the public sector. Table
2 shows that it would be interesting to have an inventory of both financial and non-
financial assets. The latter could be somehow controversial and cumbersome to assess
also with practical difficulties in pricing, as discussed below. Moreover, it should be
mentioned that one is looking to consider assets that could be used to offset the
government’s obligations under specific conditions. Therefore, it is vital to be
reasonable and realistic about which type of assets could be included in the analysis.

10
Table 2 –GFS (IMF) definition for Government Balance Sheet
Source: GFS/IMF. Elaborated by the author.
Refining the discussion above, Merton, (2007) introduces economic principles and
intertemporal linkages in substitution of mere accounting ones. This would include
future revenues and expenditures, potentially giving more stability and predictability on
the balance sheet. On the asset side, a country’s foreign reserves and long-term funds,
such as a sovereign wealth fund, are part of sovereign assets. Cash, securities, loans, and
receivables owned by the government are also sovereign assets. Equity in state-owned-
companies profits is also counted as sovereign assets in some cases. On the liability
side, public debt is included irrespective of whether it is issued by the central bank or
the government [Das, Lu, Papaiannou and Petrova, (2012)].
ASSETS LIABILITIES
Financial Assets (Domestic and External) Liabilities (Domestic and External)
•Currency and Deposits •Currency and Deposits
•Securities (except shares) •Securities (except shares)
•Loans •Loans
•Shares •Shares
Receivables• Insurance/derivatives
Payables• Insurance/derivatives
Foreign Reserves
Net Financial Worth
•Non Financial Assets
•Fixed Assets
•Inventories
•Other
Net Worth

11
Table 3 – Customized Balance Sheet
Source: Merton, (2007). Elaborated by the author.
From the analytical point of view, this conceptual7 balance sheet is the most relevant for
policy analysis even if precise data is only available for the financial balance. Note that
Table 3 brings the concept of contingent liabilities, which is tagged as “a different
animal”. They are far more difficult to quantify, concern market analysts, government
officials and can be defined as a potential source of government cash outflow, which
has to be met through either increasing borrowing or selling assets [Currie and
Velandia, (2002)]. They may be divided into explicit – already accounted for - and
implicit ones – those clearly absorbable by the government, depending on the state of
the nature. Figure 1 represents this classification and brings examples.
7 It is unusual to see published conceptual balance sheet mostly because of the challenges in estimating
revenues and expenditures in present value, not to mention contingent liabilities.
ASSETS LIABILITIES
Income (PV) Expenditures (PV)
•Taxes •Social and Economic Development
•Fees •Gov’t Administration
•Seignioriage •Loans
Balances of: Balances of:
•Cash •Monetary Base
•Currency Reserves •Gov’t Debt
•Investments (SWF, other) •Domestic
•State Owned Enterprises •External
•Infrastructure •Pension Liabilities
•Real State Contingent Liabilities
•Gov’t Commodities •Guarantees to Banks
•Other Assets •Other Guarantees
Net Worth
Net Financial Worth
Inflation Risk
Interest Rate Risk
FX risk
Commodities Risk
Interest Rate Risk
FX risk
Interest Rate Risk
Aging Population
A Different Animal

12
Figure 1 – Examples of Contingent Liabilities
Contingent Assets Contingent Liabilities
Explicit
Legal actions in process by the State Legal actions in process against the State
Insurance purchased Guarantees issued by the State
Contingent credit lines Government insurance schemes
Ex: Deposit insurance, war-risk insurance
Implicit
Windfall gains
Ex: Undiscovered natural resources that could be licensed or
explored
Banking failure
Beyond deposit insurance
Natural Disaster / Catastrophe
Sub-National Government Defaults
Elaborated by the author.
Box 1 presents some examples of explicit contingent liabilities. Das et al, (2012a)
argue that contingent liabilities are more likely to be realized during economic
recessions, when government borrowing requirements tend to be high. The size,
extension and evaluation of contingent liabilities draw the attention of many economic
agents, bringing a lot of discussion with both financial analysts and credit agencies.
The later have recently modified the credit analysis framework to monitor the effects of
those on government finances. Ultimately, the crystallization of these liabilities
depends on many assumptions, including probability of defaults and recovery rates,
which are difficult to estimate.
The next step is going to be important for didactic purposes and explains the benefits of
incorporating other sectors that are quite helpful to derive a broader view of the
economic structure. An expanded balance sheet facilitates understanding how
intersectoral relations could pressure public finances.
Box 1– Important Aspects of Contingent Liabilities (CL)
Contingent Liabilities are obligations that materialize conditional on the occurrence of a
particular event. They are possible liabilities as a result of the state of the nature and its
emergence depend on uncertain events that are often out of control of the sovereign. One

13
important characteristic associated with CL is that it is hard to accurately quantify its value.
It can be divided 8 into explicit CL, where the sovereign contractually recognizes its
responsibility in covering the beneficiary under given circumstances, or implicit CL, where the
sovereign is expected to assume the obligation for political, “moral” or practical reasons.
Although it is a controverted topic, some sovereigns choose to include CL in their balance
sheet and assess their value as an expected cost associated with a probability distribution and
expressed in present value.
Examples of explicit CL are given by credit guarantees given from the central to local
governments; concessions of public services (airports, railways, roads) and legal disputes
already decided by the court of law.
As for implicit CL, some examples could be represented by the amount needed to support
public enterprises that are considered strategic for the government (for instance, state owned
oil companies), but also important corporates. Also, the financial sector and the needs to
correct its imbalances are often contingent and sizable. Clear examples arise from the
subprime crisis and the restructurings in the Swedish banking system in the 80’s and in the
Brazilian in the mid 90’s. The associated costs were plenty more than what the government
would have been willing the bear. In other cases, like state run pension systems, the
government is expected to fulfill its obligations (for moral and political reasons) even though
the funding scheme is structurally running on deficit. Finally, it has been observed that sub-
national borrowing may result in future debt restructuring and absorption by the federal
government, a topic colored with high political sensitiveness.
Some countries proactively monitor CL and prepare to buffer its effects if needed. In Chile, for
example, there is an emergency fund, financed from fiscal sources, that is ready to be used
upon natural seismic catastrophes. In the UK, there is a team in the H.M. Treasury dedicated
to monitor the government-backed securities issued by the banking industry (Banking Act,
2009). If a default event occurs, then the Treasury covers it, whether if it goes well, they collect
a fee for engaging in these operations. In fact, the British use market based CDS (Credit Default
Swaps) to assess the probability of default and come up with an estimate of the expected cost
of this CL.
Because CL can have a significant impact on fiscal sustainability, they should also be included in
DSA (Debt Sustainability Analysis). There have been suggestions in the literature to identify
and to create quantitative triggers for the materialization of CL, above all, in the banking
industry [IMF, (2013b)]. The calibration of the resulting shocks should be tailored to country-
specific circumstances.
8An explicit CL is usually the result of a contract (a guarantee, an insurance contract, etc.) that legally
binds the Government to a payment (or multiple payments) if a given condition (or event) realizes. implicit CL allows the Government to decide after the triggering event, if it is necessary to make a payment and the amount of the payment. By definition of implicit CL, the economic and/or social cost of not making any payment, may be particularly high.

14
4. Building a Comprehensive Balance Sheet
Financial vulnerabilities are often originated outside the government. Allen, et al
(2002), provides a comprehensive review of the literature on the role weak balance
sheets could play in the genesis and evolution of a financial crisis. It focuses on the risks
created by maturity, currency, capital structure mismatches and solvency. This
framework draws attention to the vulnerabilities created by debt among residents
(particularly those denominated in foreign currency) and it helps to explain how
problems in one sector could spill over into other segments, eventually triggering an
external balance of payments crisis.
Despite all data weaknesses evolving the construction of a balance sheet, recent events
illustrate how intersectoral linkages have deepened over time, especially regarding the
financial sector. This suggests that the BSA is becoming increasingly relevant for
vulnerability analysis.
Constructing an expanded balance sheet evolves putting together a matrix summarizing
the asset and liability positions of the main sectors of the economy. One should start
with a step by step approach on the government side. Initially, debt managers should
list Central Government’s (Federal Government and Central Bank) assets and liabilities
and then consider other government entities, such as Local Governments (States and
Municipalities), Public Enterprises to form different levels and be in a position to
understand broader sorts of risks and buffers. Figure 2 shows the relation between
government levels.
Ideally, the analysis starts with a compilation of the data needed to fill the cells of that
matrix for the public sector, private financial sector, and nonfinancial sectors vis-à-vis
each other as well as the rest of the world. Data for the first two are often readily
available, while data for the nonfinancial private sector is usually harder to obtain.
Information on the international investment position or external data sources (such as
the BIS or SDDS) can help in compiling the external position and deriving (as a
residual) some of the unknown data elsewhere in the matrix [IMF, (2004)]. Although

15
data limitation is a common constraint, it does not impede analysts to have insights from
those numbers. Where possible, the balance sheet approach can be augmented by
including off-balance sheet items, such as contingent liabilities or derivatives. Further,
linkages across economies could be examined to assess possible routes for contagion.
Figure 2 – Relationship Between Government Levels
Elaborated by the author
Further exploring this idea, the IMF,(2004) suggests that the balance sheet could be
broken down in four segments, (i) Public Sector, (ii) Financial Private Sector, (iii) Non-
Financial Sector, (iv) Rest of the World. Then, it should be listed, for each of these,
short-term liabilities – usually within a period of a year – mid and long-term liabilities,
both denominated in local and foreign currencies. Equity should also be included as
detailed in Table 4.
Unlike traditional analysis, which is based on the examination of flow variables (such as
current account and fiscal balance), the balance sheet approach focuses on the
examination of stock variables in a country’s sectoral balance sheets and its aggregate
(assets and liabilities) [Allen et al, (2002)]. A financial crisis occurs when there is a
sharp downfall in demand for financial assets of one or more sectors: creditors may lose
their faith in a country’s ability to earn foreign exchange to service the external debt, in
the government’s ability to service its debt, in the banking system’s ability to meet
deposit outflows, or in corporations’ ability to service its debt. It is interesting to see the
pace these changes could assume. In a matter of days, debt managers may face a
complete different scenario upfront, severely affecting their financing conditions. An
entire sector may be unable to attract new financing or roll over existing short-term
liabilities. It must then either find the resources to pay off its debts or seek a
Federal
Government
Central Goverment (Federal Government + Central Bank)
General Government (Federal+ Local Governments)
Non-Financial Public Sector (General Government + State Owned Companies)

16
restructuring9. Ultimately, a plunge in demand for the country’s assets leads to a surge
in demand for foreign assets and/or for assets denominated in foreign currency. Massive
outflows of capital followed by sharp depreciation of the exchange rate, large current
account surplus, and deep recession that reduces domestic absorption are often the
consequence to a sudden adjustment in investors’ willingness to hold a country’s
accumulated stock of financial assets.
Table 4 – Asset and Liability Position Across Sectors
Source: IMF, (2004)
Note: To see a full description of the assets and liabilities for each group, plus aggregated data per region, see IMF
(2004).
An analytical framework that examines the balance sheets of an economy’s major
sectors for maturity, currency, and capital structure mismatches helps to highlight how
balance sheet problems in one sector can spill over into other sectors, and eventually
trigger an external balance of payments crisis. Indeed, one of the core arguments that
9 To explore this point, see Das, U., Papaioannou, M., Trebesch,C., (2012).
Issuer of the Liability Public Sector
Private
Financial
Sector
Non Financial
Sector
Rest of the
World
Public Sector
Monetary Base
Total Liability
Short Term
Domestic Currency
FX-linked
Mid and Long Term
Domestic Currency
FX-linked
Equity
Private Finacial Sector
Total Liability
Short Term
Domestic Currency
FX-linked
Mid and Long Term
Domestic Currency
FX-linked
Equity
Non Financial Sector
Total Liability
Short Term
Domestic Currency
FX-linked
Mid and Long Term
Domestic Currency
FX-linked
Equity
Rest of the World
Total Liability
Domestic Currency
FX-linked
Equity

17
emerge from this approach is that the debt among residents that create internal balance
sheet mismatches also generate vulnerability to an external balance of payments crisis.
The transmission mechanism often works through the domestic banking system. For
instance, broad concerns about the government’s ability to service its debt, whether
denominated in domestic or foreign currency, will quickly destabilize confidence in the
banks holding this debt and leading to a deposit run [Allen et al, (2002)], [Krugman,
(2000)]. Alternatively, a change in the exchange rate coupled with unhedged foreign
exchange exposure in the corporate sector can undermine confidence in the banks that
have lent to that sector. The run on the banking system can take the form of a
withdrawal of cross-border lending by nonresident creditors, or the withdrawal of
deposits by domestic residents.
Though the description above fits very well onto a series of events over the past 20
years, it no longer suffices given the incredible complexity of interconnections across
different sectors. Moreover, the complexity is proportional to the development of
financial sector, market sophistication, deepness, regulation and openness. Usually, mid
to low income developing countries are in the early stages of that and allows BSA
approach to be used more comfortably by analysts and researchers. Contrasting to that,
there are developing countries, such as Brazil, Turkey, Mexico and South Africa with
reasonable complex economies and sophisticated domestic markets. The more complex
the economy, the more limited is the usage of the BSA, calling for other approaches to
conduct proper ALM.
Before introducing a few country examples, an important issue arises regarding policy
makers: how to effectively spot risk sources, such as contingent liabilities and poor debt
structures, that would have impact on public finances? As it has been mentioned, the
financial sector has originated crisis in a number of occasions in different parts of the
world. Typically, the consequences of dealing with it share a couple of characteristics,
such as large increases in public debt levels and costs. In the leeway of the 2008’s
crisis, a lot of criticism was raised towards ineffective oversight and efforts have been
put in place to overcome that. For instance, the IMF (2013b) has been working on
policy papers exploring the main channels through which financial sector stress
endangers public debt sustainability. This evolves documentation of current practices in
measuring and reporting risks from the financial sector to the sovereign and raising

18
awareness of the need to integrate financial sector risks in the assessment of public debt
sustainability. To implement that, country authorities’ have been surveyed to input their
current practices on how to identify, measure and monitor risks stemming from the
financial sector and its implications on public debt. Box 2 describes how surveys could
be useful in that sense.
Box 2 – Applying Surveys to Identify Risks
Surveys could be helpful in identifying potential sources of risks. To cover that, the IMF
(2013b) has designed a template to shed some light on the institutional framework under
which financial sector risks are monitored and reported assessing their potential impact on
public finances and debt.
Attention is given to specific division of responsibilities for identifying, recording, and
quantifying financial sector contingent liabilities that could potentially be transferred to the
government balance sheet. Here, explicit guarantees given to the financial sector should be
closely monitored by a single agency. By the same token, it is important to knowledge which
agency is responsible for quantifying and reporting potential CL associated with implicit
guarantees (i.e. potential fiscal cost of bailing out financial institutions in the event of a crisis).
Furthermore it investigates if there is a crisis resolution mechanism in place delineating each
agency’s responsibilities in this process.
A list of indicators must emerge to assess and monitor vulnerabilities in the financial sector.
Examples suggest leverage and indebtedness ratios for households and corporates; credit risk
indicators (non performing loans, coverage ratios, write-off); liquidity and market risk
indicators (FX and interest rate risk exposures, derivatives positions; maturity mismatches, CDS
spreads, YTM); external vulnerability (external funding reliance, asset exposure to foreign
countries, credit lines availability).
Evaluating public debt sustainability is also important. A distinction between public debt
sustainability analysis (DSA) and public debt portfolio analysis (DPA) should be kept in mind.
Questions are made on the regularity, responsibility of DSA, and ultimately, its application.
DPA is also present to see how do the structure and conditions of the financial sector affect
the design of the public debt management strategy. It factors in its main influence on public
debt management (e.g. regulatory requirements, liquidity conditions, concentration and liquid
asset ratios, capacity of absorb government debt, etc.).
Similar initiatives have been delivered by UNCTAD in Africa. To illustrate, a survey has been
used to conduct an assessment of current explicit and implicit contingent liabilities of the
Government of Zambia with the indication of policy and organizational reforms aimed at
strengthening the management of such.

19
The surveys should be answered by all agencies involved in identifying, measuring, and
monitoring financial sector risks as well as risks to public debt sustainability, including
the ministry of finance, the central bank, the local securities and exchange commission
and other relevant agencies.
5. Country Examples of Sovereign Balance Sheets
As it was mentioned earlier, the BSA approach allows debt managers to have a
comprehensive view of assets and liabilities in a snapshot. It is of particular interest for
low income developing countries which lack of a centralized debt management unit and
often face institutional problems over the coverage of debt management. Building a
balance sheet for the public sector is already a challenging task and, scrutinizing intra-
governmental relations in depth would most likely be at least a good managerial
exercise for practioneers. Adding other sectors to the balance sheet is a step forward
which very few countries are up to take. In this sense, this section will focus on the
public sector examples and briefly describe how the BSA approach has been used to
sparkle ALM analysis and concepts in Ethiopia, Argentina, Bolivia and how it was
applied in Brazil about a decade ago.
a) Ethiopia
According to the National Bank of Ethiopia10
, the country has experienced steady
growth for a decade, averaging 11.2% from 2003-2010. Economic growth has been
supported by robust export growth and public enterprise investments. One of the main
policies has been the contraction of base money, with NBE (National Bank of Ethiopia)
ceasing to finance the budget and sales of foreign exchange. As a result of this foreign
exchange intervention, gross official foreign reserves have declined to under two
months of import coverage. The budget execution has been prudent, but increased
domestic credit to public enterprises has been providing fiscal impulse, potentially
imposing risks to the balance sheet.
10
NBE Annual Report http://www.nbe.gov.et/publications/annualreport.html

20
Having that said, it will be shown how an initial simple balance sheet was built for
Ethiopia in conceptual terms with some specific data. Supposedly, this was meant to
motivate authorities to conduct further analysis and to build up on the preliminary
balance sheet11
.
The institutional set up in Ethiopia basically consists on the monetary authority –
National Bank of Ethiopia (NBE) – running the monetary policy and operating in the
interbank market on a daily basis, but also issuing Treasury Bills. These are tendered
with 4 maturities, 28, 91, 182, 364 days. Any financial institution can take part in the
auctions subjected to a minimum amount. NBE is also responsible for banking
supervision.
On the other side, there is the MOFED – Ministry of Finance and Economic
Development – which allocates budget, administrates public finances, formulates
development policies and mobilizes external resources. With limited access to the
market, most of the funding comes from external sources. Hence, contractual debt with
multilateral institutions is usually the type of debt managed by the Ministry.
Clearly, there is an institutional arrangement that does not favor the issuance of
government bonds other than those conducted by NBE. There is not a term structure
cultivated by the Treasury, which is set within the MOFED, to issue bonds seeking to
finance government’s expenditures. Contrasting to that, NBE has been consistently
keeping interest rates below inflation rates and there is heavy monetary financing by the
public sector. In addition to this, financing largely relies on bank credit.
Table 5 shows a proposed qualitative balance sheet to the Ethiopian government, built
after discussions held with the MOFED and the NBE. The underlying idea was to build
a description of the main financial assets that are under the influence of these two key
institutions inside the government and induce the staff to name the type of risk exposure
adherent to each asset or liability, for didactic purposes.
In this sense, another institutional aspect that emerged is the quasi-fiscal apparatus used
by the Central Government to promote investment. There is a set of funds financed and
managed by the public sector which are bounded to other government agencies policies
11
The BSA was introduced in an UNCTAD’s mission on Dec-12 on Assets and Liability Management and Debt Portfolio Analysis Workshop.

21
or MOFED. Though the precise nature and operational structure under those were not
clear, some of the funds are susceptible to commodity risk. Notably, this matter only
came up during the discussions with the technical team. It would have been very
difficult to identify it by only speaking to the authorities.
Concessions and investment schemes are also on the government’s radar, but the format
these initiatives will assume is yet to be designed. The program includes, airports,
railways, roads, housing and are subjected to line ministries policies. Some of the
financing will come from the issuance of debt with credit institutions and are subjected
to interest rate risk for the government.
Another interesting aspect that appeared in the discussion was the relationship with
regional governments. Central government has provided loans to local governments
and has guarantees against those entities. In case of non-performing loans, it can arrest
legal transfers towards up the credit owed by them. In theory, this mechanism was
described to work properly, buy yet requires further investigation.

22
Table 5 – Ethiopian Tempted Balance Sheet12
Source: MoFED, NBE, UNCTAD. Note: This table does not represent an official depiction of the Ethiopian Balance Sheet and was
put together solely for didactic purposes within a specific context.
On the liability side, standard domestic and external debts are included. Special
attention was given to the external debt due to balance of payments problems observed
in the past and the shortage of international reserves. Currently, it is clear that FX-
reserves surpassed foreign currency liabilities by more than three times. Again, these
are not official estimates and were built only for didactic objectives of illustrating how
an initial step could be made to introduce the balance sheet for the government.
12
Qualitative list proposed by MoFED, NBE and author’s comments.
Asset LiabilityDescription Risk institutions Description Risk institutionsINTERNATIONAL RESERVE FUND PUBLIC SECTOR DEBT
Cash Foreign Currencies FX risk NBE Central Gov't Debt
Balance with Foreign Correspondents FX risk NBE Domestic Debt
Foreign Securities FX risk / interest rate NBE Direct Advances refinancing risk MoFED
Gold Commodity price risk NBE Bonds refinancing risk MoFED
SDR FX risk NBE/MoFED T-Bills
refinancing risk/
interest rate MoFED
PRGF-HIPC Assistance (IMF) FX risk NBE
External Debt
refinancing risk/
interest rate/
FX risk MoFED
IDB
INVESTMENT FUNDS Comodity risk MoFED IMF
Water Fund WWCE Bilateral
Sugar Fund sugar dev't co. Other Multilateral
Railway Fund railway co. Private Banks
Road Fund road authority State Owned Companies - SOE
Other Funds To Domestic Debt
External Debt
CONCESSIONS Interest rate risk Line Ministries
Airports REGIONAL GOV'T
Ports MOFED subsidies on Local Gov't loans
Roads
Railways CONTINGENT LIABILITIES
Land lease DBE loans to the public DBE credit risk
Rental Housing NBE
MARKETABLE SECURITIES
(receivables) Market risk MoFEDNATIONAL BANK OF ETHIOPIA -NBE -
Relationship with the Central Gov't NBE
Treasury SINGLE ACCOUNT held at the NBERIGHTS OVER THE DBE -other official financial
institutions Depends on the loan MoFED NBE own Balance Sheet
Monetary Base (M1) liabilities
Repurchase Agreements (if any) liabilities
REGIONAL GOV'T NBE Credits to financial institutions assets
MOFED relations with Local Government MOFED NBE Bills to DBE (5y) assets
MOFED securities on NBE assets
NATIONAL BANK OF ETHIOPIA -NBE -
Relationship with the Central Gov't MOFED
Treasury SINGLE ACCOUNT held at the NBE
NBE Bills to DBE
Domestic Debt
Direct Advances MoFED
Special bonds MoFED

23
b) Bolivia
Bolivia has been working on initiatives to develop a risk management analysis after a
debt relief that has cut debt levels and stabilized it to around 31% of GDP in 2012.
External debt represents around 48% of total debt and is mostly described by
concessional loans with multilaterals, bilateral organisms and, more recently, by a 10-
years bond issued in the external market. Hence, the debt is relatively long and the
costs are not high.
However, from the risk management perspective, the external debt would represent a
risk if the government were not building up FX-reserves. Most of the external inflows
come from exports of hydrocarbons that have grown steadily in the past few years.
Because the maturity profile has a sizable concentration in the next ten years, specially
in 2022 (due to a 10y bond issued abroad), the government has been seeking to fund it
domestically or through other external sources, preparing themselves from a transition
period towards the end of concessional borrowing.
The BSA could be useful to jump start the risk analysis of the government financial
stance and to shed some light in other sources of potential volatility. Government
revenues are heavily dependent on the commodities cycle and the public sector has been
building international reserves also to buffer against an abrupt downturn in hydrocarbon
prices. Some risks are posed in that respect because there is a fixed exchange rate
regime, which maintenance could deplete the level of official reserves under a stressful
scenario.
Another aspect that the BSA could provide useful insights is the presence of contingent
liabilities arising from various sources. For example the fideicomiso- financial
arrangements dedicated to fund infrastructure and other investment or expenditures that
are not fully recorded in the government accounts. Though some fideicomiso are on-
the-budget, its investment plans are still to be better detailed and may well represent a
source of liability that could be absorbed by the public sector, if the projects are not as
good as initially estimated. Further investigation must be done in this area to clarify on

24
the nature of those financial schemes. Hence, there have been initial attempts to build a
public sector balance sheet by the Ministry of Finance.
c) Argentina
The Argentinean crisis in 2001-2002 is well documented in the literature13
. Although
the crisis rooted from deep macroeconomic imbalances, it also derived from weaknesses
in the private sector’s balance sheets. A lot of attention has been put on the
inconsistencies between Argentina’s fiscal and exchange rate policies, its difficulties to
promote fiscal adjustments during a prolonged recession, the weaknesses in the public-
sector balance sheet, and the government’s large stock of foreign-currency debt [IMF,
(2004)]. On the top of this, bank and corporate sector balance sheet mismanagement
exacerbated FX-rate exposure adding critical volatility to the system. Then, balance
sheet approach was used in helping to explain how vulnerabilities in the private sector
augmented the underlying weaknesses in Argentina’s public sector, and also contributed
to intensify the crisis in 2001–0214
.
From that period to the present, the Argentinean government has accessed the external
market intermittently, where funding has been relying mostly on domestic sources.
Recently, efforts have been made to come up with an ALM approach, considered to be a
more complete risk analysis tool available to the Public Sector. In turn, this would
allow authorities to have a broader and more integrated view of both sides of their
balance sheet.
Aside from providing information enabling analysts to have another perspective of the
fiscal side, ALM facilitates the design of financing strategies adapting the
characteristics of financial liabilities to the assets at hand, with positive pay offs on debt
sustainability, risk perception and, eventually, favoring cost reduction.
13
See Roubini, (2001); Goldenstein and Turner,(2004). 14
A complete description of the precedents and unfolding events can be found in IMF, (2004).

25
By the end of 2011, the Argentinean DMO15
put together a balance sheet for the public
sector. As it has been described, the balance sheet considers only financial assets and
liabilities. From the asset side, it includes financial instruments (cash deposits, loans,
securities, receivables), gold deposits, SDDS. They can either be denominated in book
values, or mark-to-market if such.
The liabilities are evaluated as the difference between the original nominal value and
the amortization (with accrued interest). Arguably, this would bring less volatility to
the liability side when compared to mark-to-market approach.
Table 6 displays the results as of Dec-11 in notional and risk-related terms. The public
sector financial net worth is negative in AR$ 212 bn (about 11.5% of GDP). This is a
result of the accumulation of AR$ 405 bn in assets and AR$ 617 bn in liabilities. The
sheet is clustered in non-financial public sector (SPNNF) items, local governments
(state and municipalities) and monetary authority (BCRA).
Table 6 – Balance Sheet for the Argentinean Public Sector
Source: ONCP, Wright (2013).
Some points can be highlighted. The overall net worth is a consequence of the central
government net debtor condition in AR$ 240 bn. The majority of that debt (14% GDP)
15
ONCP- Oficina Nacional de Crédito Público . See ONCP, (2012)
Asset AR$ mn Liability AR$ mn
405,155.0 617,070.0
Description Risk institutions amount Description Risk institutions amount AR$ mn % GDP
Sub Total 167,530.0 Sub Total 407,741.0 (240,211.0) -13.0%
Deposits in AR$ fixed rate 130,512 Central Gov't Debt
Finacial Trusts fixed rate 4,897 National Debt fixed rate 1,252 110,319 6.0%
Mutual Funds fixed rate 4,798 National Debt fixed rate 32,981
Cash (Receivables) fixed rate SPNNF 2,533 SPNNF Other fixed rate 1,812
Equity floating rate 16,462 National Debt floating rate 41,940 (25,478) -1.4%---- Inflation-linked National Debt inflation-linked 63,854 (63,854) -3.5%
Deposits in FX FX-rate 6,516 National Debt FX-rate 200,409 (261,198) -14.2% National Debt FX-rate 67,305
Sub Total 858.0 Sub Total 42,726.0 (41,868.0) -2.3%
Deposits of states*and Municipalitiesfixed rate 858 Local Gov't Debt (Provincias) fixed rate 535 323 0.02%
---- floating rate Local Gov't ---- floating rate Local Gov't 5,741 (5,741) -0.3%
---- inflation-linked ---- inflation-linked 329 (329) -0.02%
---- FX-rate ---- FX-rate 36,121 (36,121) -2.0%Sub Total 236,767.0 Sub Total 166,603.0 70,164.0 3.8%
Rights for Repos fixed rate 25,903 Obligations for Repos fixed rate 24,437 (37,827) -2.1%
LEBAC fixed rate 39,293
---- floating-rate NOBAC floating-rate Central Bank (BCRA) 44,889 (44,889) -2.4%
Loans to the Financial System inflation-linked Central Bank (BCRA) 2,074 ---- inflation-linked 2,074 0.1%
Contributions to International OrganismsFX-rate 9,225 Obligations with International OrganismsFX-rate 5,230 150,806 8.2%
FX-Reserves FX-rate 199,565 Counterpart of C to OI FX-rate 3,899
Current Accounts on Foreign CurrencyFX-rate 24,621
Other FX-rate 24,234
Memo AR$ mn Net Worth -211,915.0 -11.5%
GDP-linked securities 25,254
in local currency 4,057
in foreign currency 21,197
Holdouts 12,840
Paris Club non-performing debt 39,736
GDP 2011 1,842,022
Mismatch

26
is foreign currency linked, while 1.4% of GDP is in floating rate and, because of earlier
debt exchange occurred in the past, around 3.5% of GDP emerged as inflation-linked
debt. Regional governments also represent an important source of indebtedness (2.3%
of GDP)16
. Central Bank differs from the other official entities and it holds a positive
net worth of 3.8% GDP.
More importantly, Table 7 resumes the type of exposure observed in the balance sheet,
which allows one to prompt on the mismatches instantly. Clearly, foreign exchange rate
exposure across the public sector pops up and raises the need of further investigation on
the structure of those liabilities, with possible policy implications. Because of instability
in international liquidity, a slowdown in external trade, restricted access in the
international capital market and the challenges in maintaining/accumulating foreign
exchange reserves, the referred mismatch may be even more severe and this type of
exercise could serve as a side indicator for the authorities.
Table 7 – Net Financial Position by Risk Exposure – AR$ bn
Fixed
Rate
Floating
Rate
Inflation-
linked FX-rate
AR$ mn 72,815 -76,108 -62,109 -146,513
% GDP 4.0% -4.1% -3.4% -8.0%
Source: ONCP, Wright (2013).
As it has been argued, the balance sheet approach is more complete when other key
sectors are included, as counterparty risk may also arise from the interrelation across
sectors. Nonetheless, ONCP has managed to map out a great deal of the current asset-
liability structure to the public sector, despite partial data missing on local government,
and has given an important initial step in risk management. Subsequently, it adopted
another approach towards further analysis on debt sustainability and then introduced
stochastic financial analysis combined to optimal portfolio theory to derive debt
management strategies. Similar approach was taken by the Brazilian DMO in the early
2000’s.
16
Data is lacking on “Provincias” (similar to states). Hence, only municipalities are covered.

27
d) Brazil
The Brazilian economic stabilization process has nearly completed two decades. After
years of price instability, there were automatic indexation schemes to protect savings
and investments value, which, in turn, fueled the next round of price adjustments, self-
fulfilling expectations on rising inflation, resulting in a vicious cycle.
In this context, there were underdeveloped term structures, incapable to distribute
intertemporal wealth through traditional market instruments. Instead, an overnight rate
culture widespread on the economy where financial instruments were concentrated in
the very short term. To remark that, between 1990 and mid-1995, there was virtually no
fixed rate bonds in the domestic debt portfolio, while overnight linked bonds and FX-
linked bonds dominated the federal debt portfolio. Despite the success of the
stabilization plan in bringing prices to acceptable levels (compared to other stable
countries) it did not change the local financial community’s short-term preferences of
securities and investments linked to the overnight rate.
The ensuing maintenance of high short term interest rates preserved their attractiveness.
There wasn’t any other type of instrument that could provide, simultaneously, high
return, low risk, and daily liquidity. The so called LFT – Treasury floating rate bills -
naturally became an important source of public funding, especially in moments of high
risk aversion.
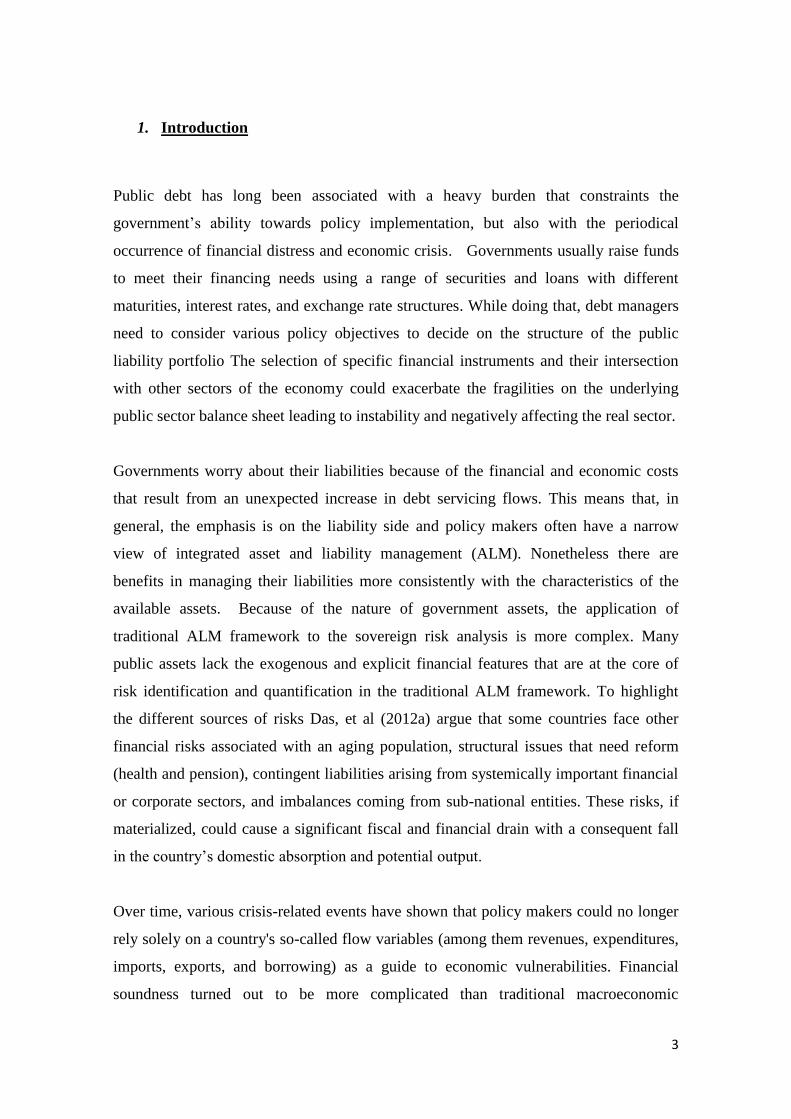
The term structure remained underdeveloped 17 as of 1999-2000. Despite mild
improvements in macroeconomic fundamentals, direct indexation to monetary policy
reference rate was a source of high market risk for the public debt, in an illiquid bond
market, characterized by shallowness and near term concentration.
As market sentiment deteriorated during 2002, about 90% of the overall federal debt
was linked either to the foreign exchange or to the floating rate. Gradually, the DMO
was able to swap its structure by issuing fixed rate and inflation-linked bonds18. Figure
3 shows a historical view of that change.
17
In parallel, the issuance of external debt in the foreign capital market gained importance as a funding source. 18
For further examination of this type of strategy, see Papaioannou, (2009), Brazilian National Treasury website- Debt Reports.

28
Figure 3 – Brazilian Federal Public Debt Profile
Source: Brazilian National Treasury
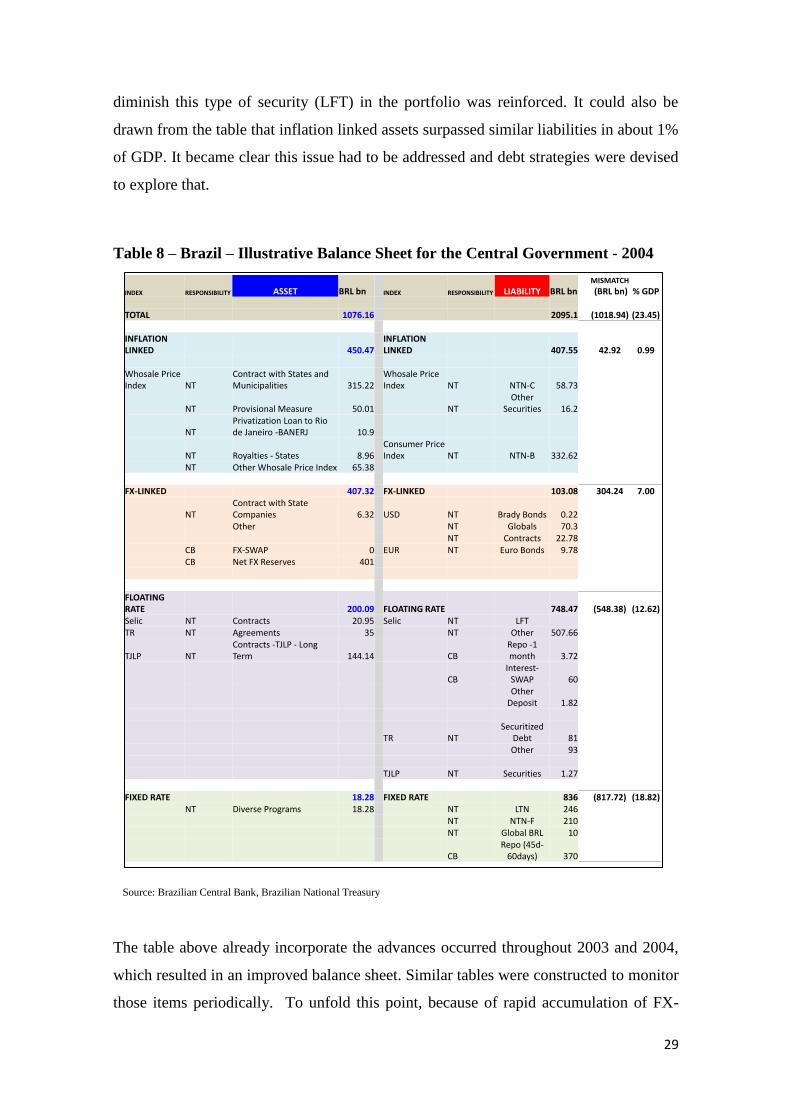
This BSA example will show how the Brazilian government was able to systematically
adopt a transition strategy to revert a liability side worrisome situation where roll-over,
interest and foreign exchange risk agglutinated in the debt portfolio, in parallel with
asset accumulation, especially those regarding external reserves. Even though a more
sophisticated framework was used in order to control the debt and to establish a long
term financing strategy, early stages of risk management used BSA to disseminate the
need to tackle the deteriorated debt profile and to sediment long term objectives towards
a more stable and less risky debt composition.
The usefulness of this type of exercise can be described as the following: the approach
aimed at analyzing the net mismatch between the federal government’s assets and
liabilities from the viewpoint of various bonds types, as well as associated maturity and
cash flow. It was an additional reference debt managers used for medium and long-term
planning. For that time being, this instrument was essentially indicative.
As of 2002-4, the government sequenced a series of measures to highlight the necessity
to promote changes in debt outlook, consisting in putting together and comparing the
most relevant data on assets and liabilities managed by the central government. To
illustrate, floating rate liabilities were exceeding assets in around 12% of GDP in 2004.
Because the government couldn’t generate assets to match that, the necessity to
0%
10%
20%
30%
40%
50%
60%
70%
80%
90%
100%
Jan-9
0
Sep-9
0
May-9
1
Jan-9
2
Sep-9
2
May-9
3
Jan-9
4
Sep-9
4
May-9
5
Jan-9
6
Sep-9
6
May-9
7
Jan-9
8
Sep-9
8
May-9
9
Jan-0
0
Sep-0
0
May-0
1
Jan-0
2
Sep-0
2
May-0
3
Jan-0
4
Sep-0
4
May-0
5
Jan-0
6
Sep-0
6
May-0
7
Jan-0
8
Sep-0
8
May-0
9
Jan-1
0
Sep-1
0
May-1
1
Jan-1
2
Sep-1
2
Fixed Rate Inflation Linked Floating Rate Exchange Rate
29
diminish this type of security (LFT) in the portfolio was reinforced. It could also be
drawn from the table that inflation linked assets surpassed similar liabilities in about 1%
of GDP. It became clear this issue had to be addressed and debt strategies were devised
to explore that.
Table 8 – Brazil – Illustrative Balance Sheet for the Central Government - 2004
Source: Brazilian Central Bank, Brazilian National Treasury
The table above already incorporate the advances occurred throughout 2003 and 2004,
which resulted in an improved balance sheet. Similar tables were constructed to monitor
those items periodically. To unfold this point, because of rapid accumulation of FX-
INDEX RESPONSIBILITY ASSET BRL bn INDEX RESPONSIBILITY LIABILITY BRL bnMISMATCH
(BRL bn) % GDP
TOTAL 1076.16 2095.1 (1018.94) (23.45)
INFLATION LINKED 450.47
INFLATION LINKED 407.55 42.92 0.99
Whosale Price Index NT
Contract with States and Municipalities 315.22
Whosale Price Index NT NTN-C 58.73
NT Provisional Measure 50.01 NTOther
Securities 16.2
NTPrivatization Loan to Rio de Janeiro -BANERJ 10.9
NT Royalties - States 8.96Consumer Price Index NT NTN-B 332.62
NT Other Whosale Price Index 65.38
FX-LINKED 407.32 FX-LINKED 103.08 304.24 7.00
NTContract with State Companies 6.32 USD NT Brady Bonds 0.22Other NT Globals 70.3
NT Contracts 22.78CB FX-SWAP 0 EUR NT Euro Bonds 9.78CB Net FX Reserves 401
FLOATING RATE 200.09 FLOATING RATE 748.47 (548.38) (12.62)Selic NT Contracts 20.95 Selic NT LFTTR NT Agreements 35 NT Other 507.66
TJLP NTContracts -TJLP - Long Term 144.14 CB
Repo -1 month 3.72
CBInterest-
SWAP 60Other
Deposit 1.82
TR NTSecuritized
Debt 81Other 93
TJLP NT Securities 1.27
FIXED RATE 18.28 FIXED RATE 836 (817.72) (18.82)NT Diverse Programs 18.28 NT LTN 246
NT NTN-F 210NT Global BRL 10
CBRepo (45d-
60days) 370
30
reserves and concomitant reduction in external debt and local FX-linked debt, currency
risk was sharply mitigated in those years. In that sense, there has been concomitant asset
accumulation by the Central Bank, giving leeway to the Treasury to redeem local debt
exposed to foreign currency. It is also worthy to mention that, as previously indicated,
because the federal government had assets linked to inflation indexes against local
governments, it gave vent to put in place a debt issuance strategy to explore this
segment improving diversification and lengthening debt structure.
It is important to emphasize that this was a simple exercise conducted by the DMO to
illustrate the imbalances perpetrated in the debt structure. It also permitted to see the
important buffers that diversification could yield if properly explored in formal debt
strategies. Eventually, the Brazilian National Treasury launched other analytical
frameworks to conduct risk management in a more rigorous and complete way
calibrating costs and risk under stochastic scenarios19
. Eventually, other market
advances were introduced and debt structure achieved a much more comfortable
structure where about 60% was in fixed rate or inflation linked securities (as of July
2007).
6. Conclusions
Despite all the benefits described in this section, the BSA approach holds a few short
comings [IMF, (2004)]. To begin with it should be seen as a conceptual framework to
oversee the types of exposure a given sovereign is bounded to, assessing its
vulnerabilities and related policy options, given the prevailing political and economic
environment. As pointed earlier, it is very hard to use BS to do cross country
comparisons, as opposed to other traditional economic indicators.
It does not include off-balance sheet transactions, a topic that has definitely gained
importance in the recent past. The subprime crisis revealed the banking industry devised
instruments to unload important operations from their balances which allowed them to
increase their leverage on a large scale, posing significant risks to the overall system. It
19
See Brazilian National Treasury and World Bank, (2008), Part 2, chapter 3 and Optimal Composition https://www.tesouro.fazenda.gov.br/en/publications/optimal-composition

31
has been demonstrated that in some countries, such transactions could be used to
implicitly increase the riskiness of the government balance sheet, posing moral hazard
issues on the discussion on whether the central government should support those sectors
[Lewis, (2010)] and [IMF (2004)].
A complete assessment of underlying risks needs to consider the probability distribution
of relevant shocks. Nonetheless, it is very hard to associate a distribution adherent to
more realistic hypothesis due to the abnormal nature of shocks20. For instance, under a
fixed or pegged exchange rate regime, a situation of clear and meaningful misalignment
would raise the level of concern related to the vulnerabilities pointed out by the BSA.
Thus, it would require urgency from policy makers to intervene in anticipation of
triggering events.
Policy makers should keep in mind that the BSA is an useful framework to minimize
financial risks while adjusting imbalances on the economic structure. Such an approach
could be used to evaluate the soundness of the financial system, currency and maturity
composition of external debt and optimal reserve accumulation. Noteworthy, this may
require a lot of policy coordination and institutional strength, a topic that shouldn’t be
underestimated.
20
See Taleb, (2007).

32
5. References
Allen, M., Rosenberg,C., Keller C., Setser, B., and Roubini, N., (2002), “A Balance Sheet
Approach to Financial Crisis”, IMF Working Paper 02/210 (Washington: International
Monetary Fund)
Au-Yeung,W., McDonald, J., Sayegh, A., (2006).”Australian Government Balance Sheet
Management”. NBER Working Paper 12302, June.
Ball, I., (2012), “Sovereign Balance Sheets: stranger than fiction”, Public Finance
International, July.
Bernardell C., Cardon P., Coche J., Diebold F.X. and Manganelli S. (2004),
“Risk Management for Central Bank Foreign Reserves”, European Central
Bank Publication, May.
Beck R. and Rahbari E. (2008), “Optimal Reserve Composition in the Presence
of Sudden Stops, the Euro and the Dollar as Safe Haven Currencies”, European
Central Bank Working Paper, No 916, July.
Brazilian National Treasury and the World Bank (2010), “Public Debt – The Brazilian
Experience”, https://www.tesouro.fazenda.gov.br/en/federal-public-debt
Bodie, Zvi and Brière, Marie (2011),“Sovereign Wealth and Risk Management”.
Working Paper Amundi # 6 .
Bohn,H., (2002), “Government Asset and Liability in an Era of Vanishing Debt”, Journal
of Money, Credit and Banking, Vol. 34, N.3, Part 2, August, pp. 887-933.
Bradbury, S.,Brumby, J., Skilling, D., (1997), “Sovereign Net Worth: An Analytical
Framework”, New Zealand Treasury Working Paper 99-3, Sep-97.
Caballero, R. and Krishnamurthy,A. (2000), “Dollarization of Liabilities:
Underinsurance and Domestic Financial Underdevelopment,” NBER Working
Paper No. 7792.
Calvo,G. (1998), “Capital Flows and Capital-Market Crises: The Simple
Economics of Sudden Stops”, Journal of Applied Economics, Vol. 1 (November),
pp. 35–54.

33
Cassard, M., Folkerts-Landau, D.,(1997), “Risk Management of Sovereign Asset and
Liability,” IMF working paper, WP/97/166, 1997.
Claessens, S., Kreuser J., Seigel L. and R. Wets (1998), "A Tool for Strategic Asset and
Liability Management," World Bank working paper, Research Project Ref. No. 681-23.
Currie, E., and Velandia, A., (2002), “ Risk Management of Contingent Liabilities within
a Sovereign Asset-Liability Framework” , (Washington: World Bank).
Das, U.; Lu, Yinqiu; Papaiaoannu, M.G. and Petrova, I. (2012a), “Sovereign Risk and
Asset and Liability Management- Conceptual Issues” , IMF Working Paper 12/241
Das, Udaibir, Papaioannou, M., and Trebesch, C., (2012b), "Sovereign Debt
Restructurings 1950 - 2010: Literature Survey, Data, and Stylized Facts", IMF Working
Paper 12/203, International Monetary Fund
Debt Management Office, (2008). “DMO Annual Review – 2008-09”, Chapter 6, United
Kingdom.
Demmel, R., (1999), “Fiscal Policy, Public Debt and the Term Structure of Interest
Rates”, Lecture Notes in Economics and Mathematical Sciences 476, Springer-Verlag,
Berlin-Heidelberg DE.
De Nicoló, G., Honohan,P. and Ize, A.(2003), “Dollarization of the Banking
System: Good or Bad?” IMF Working Paper 03/146 (Washington: International
Monetary Fund).
Gray, D. (2007), “A New Framework for Risk and Sovereign Wealth Management”, In
Sovereign Wealth Management, Chapter 9, edited by J. Johnson-Calari and M.
Rietveld, London, UK, Central Banking Publications.
Grimes, A., (2001). “ Crown financial asset management: Objectives and practice”,
New Zealand Treasury Working paper 01/12.
Grubman, N., (1987), “BESMOD: A Strategic Balance Sheet Simulation Model”,
European Journal of Operational Research 30, 30-4.
Goldfajn, I., de Paula, A., (1999), “Uma Nota Sobre a Composição Ótima da Dívida
Pública – Reflexões para o Caso Brasileiro”, Texto para Discussão n. 411, PUC-Rio.

34
Goldstein, M., Turner P.,(2004),”Controlling Currency Mismatches in Emerging
Markets” (Washington: Institute of International Economics).
Grimes, A., (2001), “Crown Financial Asset Management: Objectives and Practice”, The
New Zealand Treasury Working Paper Series, 01-12, Dec-01.
Hausmann, R., and Panizza, U., (2003), “The Determinants of Original Sin: An
Empirical Investigation,” The Journal of International Money and Finance, Vol. 22, pp.
957-990.
IMF, (2004), “Debt-Related Vulnerabilities and Financial Crises—An Application of the
Balance Sheet Approach to Emerging Market Countries ”, Prepared by the Policy
Department and Review Department, Jul-04.
IMF and World Bank (2006), “Review of Low-Income Country Debt Sustainability
Framework and Implications of the MDRI”, Prepared by the staff of IMF and the World
Bank, Mar-06.
IMF, (2013a), “Staff Guidance Note for Public Debt Sustainability Analysis in Market-
Access Countries”, Prepared by the Strategy, Policy and Review Department, in
collaboration with the F.A. Debt Department, May-13.
IMF, (2013a), “From Banking to Sovereign Stress: Implications for Public Debt” (Survey
for Policy paper - Mimeo).
IMF, (2012), “International Monetary Fund’s ‘Guiding Principles for Managing
Sovereign Risk and High Levels of Public Debt” , Jun-12.
IMF (2011), “Modernizing the Framework for Fiscal Policy and Public Debt
Sustainability Analysis”, Prepared by the Strategy, Policy and Fiscal Affairs Department,
Aug-11.
IMF (2010), “Reserve Accumulation and International Monetary Stability”, Prepared by
the Strategy, Policy and Review Department, Apr-10.
Krugman, P., (2000), “The Return of Depression Economics”, Norton Books, 2000.

35
Lewis, M. (2010), “ The Big Short – Inside the Doomsday Machine” , W.W. Norton and
Company, Inc. 500 5th Avenue New York-NY.
Lu, Y., Papaioannou, M. and Petrova, I., (2007), “Sovereign Asset and Liability
Management,”IMF 7th Debt Managers’ Forum, Nov-07, Washington, D.C.
Manasse, P., Roubini, N., and Schimmelpfenning, A., (2003), “Predicting Sovereign
Debt Crises” IMF Working Paper 03/221, IMF, Washington, D.C.
Maziad, S., Farahmand,P., Wang, S., Segal, S., and Ahmed, F., (2011),
“Internationalization of Emerging Market Currencies:A Balance between Risks and
Rewards”, IMF Discussion Note, SDN 11/17, Oct 2011.
Medeiros, C., Papaioannou, M. and Souto, M., (2008), “Emerging Market Public Debt
Management - IMF Develops New Risk Measures Tools for Public Debt,” IMF Survey
Magazine: Policy, January 14
Melecky,M., (2007), “A Cross-Country Analysis of Public Debt Management
Strategies” Policy Research Working Paper 4287, Washington, D.C.
Merton, R.C., (2007), “Observations on Sovereign Wealth Fund, Reserve and Debt
Management: A Country Risk Management Perspective,” Luncheon Address at the First
IMF Annual Roundtable of Sovereign Asset and Reserve Managers, November 15-16.
ONCP, (2012), “Manejo de Activos y Pasivos del Sector Público Argentino - Un análisis
de costos y riesgos y la definición de una estructura de deuda óptima para el largo
plazo, MIMEO.
Papaioannou ,M. (2009), “Exchange Rate Risk Measurement and Management: Issues
and Approaches for Public Debt Managers” South-Eastern Europe Journal of
Economics 1 (2009) 7-34
Reinhart, C., Rogoff, K. Savastano,M. (2003),“Addicted to Dollars,” NBER Working
Paper No. 10015.
Romanyuck, Y., (2010), “Asset-Liability Management: An Overview”, Bank of Canada,
Discussion Paper 2010-10.
Roubini, N., (2001), “ Should Argentina Dollarize or Float? The Pros and Cons of
Alternative Exchange Rate Regimes and their Implications for Domestic and Foreign
Debt Restructuring Reduction” , mimeo, (New York: Stern School of Business).

36
Rosenberg, C.,Halikias, I., House, B., Keller, C., Nystedt, J., Pitt,A. and Setser, B., (2005).
“Debt-related Vulnerabilities and Financial Crises: An Application of the Balance Sheet
Approach to Emerging market countries,” IMF Occasional Paper 240, (Washington DC:
International Monetary Fund).
Taleb, N. (2007), “Black Swan and Domains of Statistics”, The American Statistician,
Aug-2009, Vol 61, N. 3.
World Bank (2008) 1, “Developing the Domestic Government Bond Market- From
Diagnostics to Reform Implementation”, Book - The World Bank Group
World Bank (2008) 2, “Managing Public Debt- From Diagnostics to Reform
Implementation”, Book - The World Bank Group
World Bank and IMF (2001),“Developing a Government Bonds Market – a Handbook”-
July 2001-22866
Wright, S. (2013), “Asset and Liability Management of the Argentine Public Sector”,
ONCP- National Bureau of Public Credit, June – MIMEO.