Asset Exchanges and the Transactions Demand for Money… · Asset Exchanges and the Transactions...
17
Asset Exchanges and the Transactions Demand for Money, 1919-29 By ALEXANDER J. FIELD* This paper addresses a general theoretical question—the appropriate specification of the transactions demand for money—as well as a particular historical question: what trig- gered the Great Depression? Theoretically, fluctuations in the volume and value of asset exchanges in secondary asset markets can influence the transactions demand for money independently of real output and interest rates, and ought to be integrated into the analysis of those forces perturbing 1 the de- mand for money and shifting LM curves in the absence of monetary intervention. Empirically, I demonstrate that, over the years 1919-29, monthly fluctuations in the volume and value of trading on the New York Stock Exchange did influence the transactions demand for money indepen- dently of fluctuations in real output and interest rates. Moreover, in the context of relatively slow post-1925 growth rates of monetary aggregates, the unprecedented in- crease in the volume and value of such trad- ing from the beginning of 1925 to October 1929 had the effect of shifting the LM curve persistently to the left. The failure of U.S. monetary authorities to accommodate this *Associate Professor of Economics, University of Santa Clara, Santa Clara, CA 95053. The groundwork for this project was conducted during 1979-80 at the Institute for Advanced Study in Princeton. I am grateful to the Institute for the opportunity afforded to branch into a new area of research. I thank David Laidler and Milton Friedman for detailed comments on earlier ver- sions, and also thank participants in the All-UC Sym- posium on the Great Depression, Berkeley, May 1982, at which an earlier version of this paper was presented. 1 Such fluctuations are analogous in their effects to, but analytically distinct from, volatile shifts in liquidity preference: both types of disturbances may cause the demand for money not to be a "stable function" of a "fairly small" number of variables. It is worth recalling that Milton Friedman came to identify the volatility of Keynes' liquidity preference function, not the proposi- tion that the demand for money was interest sensitive, as the distinctive feature of the Keynesian approach (see his 1966 article, p. 85). surge in transactions demand, a failure un- recognized at the time, was associated with an antispeculative policy that drove real in- terest rates to very high levels in 1928-29, levels not approached again until the early 1980's. This deflationary impulse, larger than is apparent from a simple examination of monetary growth figures in relation to GNP growth, was the proximate cause of the downturn in real activity generally dated from August 1929. 2 I. Asset Exchanges and the Transactions Demand for Money The preponderance of transactions in asset markets involves the conveyance or transfer from one individual to another of previously issued securities. This was true in the 1920's and is true today. A certain base level of transactions results from the issuance of new securities, and from life cycle effects, as indi- viduals liquidate their holdings, or rearrange their portfolios at various stages of their careers. But the observed volatility in trading volume in secondary asset markets is largely driven by other forces, forces related to but distinct from those that determine asset prices. At any moment in time individuals have different expectations about the future course of particular asset prices. Such differences themselves may, but do not nec- essarily, give rise to trades of existing assets. But when these expectations are changing rapidly in different ways for different indi- viduals as the result of new information dif- ferentially available, or differently inter- preted, increases in trading volume are likely to result. Such trading volume can persist without necessarily giving rise to changes in an asset price index. By contrast, new infor- 2 This is a statement about the origin—not the depth or duration—of the Great Depression. 43 Digitized for FRASER http://fraser.stlouisfed.org/ Federal Reserve Bank of St. Louis
-
Upload
truongkien -
Category
Documents
-
view
228 -
download
0
Transcript of Asset Exchanges and the Transactions Demand for Money… · Asset Exchanges and the Transactions...
Asset Exchanges and the Transactions Demandfor Money, 1919-29
By ALEXANDER J. FIELD*
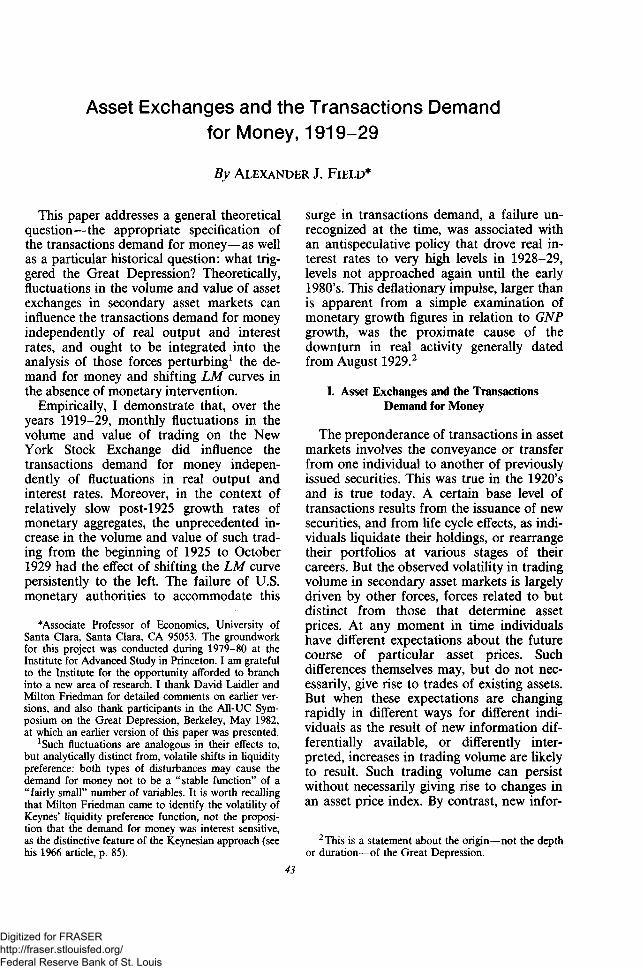
This paper addresses a general theoreticalquestion—the appropriate specification ofthe transactions demand for money—as wellas a particular historical question: what trig-gered the Great Depression? Theoretically,fluctuations in the volume and value of assetexchanges in secondary asset markets caninfluence the transactions demand for moneyindependently of real output and interestrates, and ought to be integrated into theanalysis of those forces perturbing1 the de-mand for money and shifting LM curves inthe absence of monetary intervention.
Empirically, I demonstrate that, over theyears 1919-29, monthly fluctuations in thevolume and value of trading on the NewYork Stock Exchange did influence thetransactions demand for money indepen-dently of fluctuations in real output andinterest rates. Moreover, in the context ofrelatively slow post-1925 growth rates ofmonetary aggregates, the unprecedented in-crease in the volume and value of such trad-ing from the beginning of 1925 to October1929 had the effect of shifting the LM curvepersistently to the left. The failure of U.S.monetary authorities to accommodate this
*Associate Professor of Economics, University ofSanta Clara, Santa Clara, CA 95053. The groundworkfor this project was conducted during 1979-80 at theInstitute for Advanced Study in Princeton. I am gratefulto the Institute for the opportunity afforded to branchinto a new area of research. I thank David Laidler andMilton Friedman for detailed comments on earlier ver-sions, and also thank participants in the All-UC Sym-posium on the Great Depression, Berkeley, May 1982,at which an earlier version of this paper was presented.
1Such fluctuations are analogous in their effects to,but analytically distinct from, volatile shifts in liquiditypreference: both types of disturbances may cause thedemand for money not to be a "stable function" of a"fairly small" number of variables. It is worth recallingthat Milton Friedman came to identify the volatility ofKeynes' liquidity preference function, not the proposi-tion that the demand for money was interest sensitive,as the distinctive feature of the Keynesian approach (seehis 1966 article, p. 85).
surge in transactions demand, a failure un-recognized at the time, was associated withan antispeculative policy that drove real in-terest rates to very high levels in 1928-29,levels not approached again until the early1980's. This deflationary impulse, larger thanis apparent from a simple examination ofmonetary growth figures in relation to GNPgrowth, was the proximate cause of thedownturn in real activity generally datedfrom August 1929.2
I. Asset Exchanges and the TransactionsDemand for Money
The preponderance of transactions in assetmarkets involves the conveyance or transferfrom one individual to another of previouslyissued securities. This was true in the 1920'sand is true today. A certain base level oftransactions results from the issuance of newsecurities, and from life cycle effects, as indi-viduals liquidate their holdings, or rearrangetheir portfolios at various stages of theircareers. But the observed volatility in tradingvolume in secondary asset markets is largelydriven by other forces, forces related to butdistinct from those that determine assetprices. At any moment in time individualshave different expectations about the futurecourse of particular asset prices. Suchdifferences themselves may, but do not nec-essarily, give rise to trades of existing assets.But when these expectations are changingrapidly in different ways for different indi-viduals as the result of new information dif-ferentially available, or differently inter-preted, increases in trading volume are likelyto result. Such trading volume can persistwithout necessarily giving rise to changes inan asset price index. By contrast, new infor-
2 This is a statement about the origin—not the depthor duration—of the Great Depression.
43
Digitized for FRASER http://fraser.stlouisfed.org/ Federal Reserve Bank of St. Louis
44 THE AMERICAN ECONOMIC REVIEW MARCH 1984
mation, widely available and similarly inter-preted, may cause asset prices to rise or fallon very low levels of trading.
In other words, prices in secondary assetmarkets, unlike prices in commodity markets,do not depend for their maintenance on acontinual flow of expenditures. Without sucha flow, commodity prices eventually declinebecause of the involuntary accumulation ofinventories that ensues in an environmentwhere production flows are positive and theholding of inventories is costly. No sucheventuality necessarily accompanies the ces-sation or slowing of trading in secondaryasset markets. Yet, when expectations differabout the appreciation potential of particularassets, exchanges will take place, sometimesaccompanied by and sometimes not accom-panied by price changes.
If individuals simply bartered financial as-sets when they wished to trade them, a trans-actions demand for money could never arisefrom such exchanges, but for the same rea-son money serves as a convenience andtemporary repository of value in goods trans-actions, nonmonetary assets tend to be ren-dered more liquid before being reconvertedto other assets. As a result, in periods of hightrading volume, a monetary system may ex-perience (at given interest rates and outputlevels) an increase in the transactions de-mand for money, especially in large financialcenters such as New York City. Tradingvolume and value, and the resulting transac-tions demand for money, can therefore beinfluenced by forces not directly related toflows of production, income, consumption,and saving, and as a result have great poten-tial to move independently of movements inGNP or even the average price level of tradedassets.
The possible consequences of such move-ments have been only infrequently examinedin the last half century.3 These and related
3 Franco Modigliani, Robert Rasche, and J. P.Cooper (1970) found, but did not report, a very smallbut positive influence of the value of stock markettransactions on the demand for money. This resultapplied to a regression on quarterly U.S. data from1955:I to 1966:IV, using a ratio specification. A recentcriticism of assuming proportionality between GNP andtotal transactions demand is found in Charles Lieber-
issues were discussed extensively during the1920's within the context of a protracteddebate over whether or not stock exchange"speculation" deprived other sectors of theeconomy of stocks of cash balances and/orflows of saving. Many observers, includinginfluential decision makers in the FederalReserve System, had an intuitive sense thatthe existence of the stock exchange, andthe call loan market in which funds werelent for the purpose of purchasing securi-ties, "drained" funds from the rest of theeconomy.4 But advocates of "absorption"employed impressionistic and sometimes con-tradictory arguments that left them vulner-able to the criticisms of sophisticated mone-tary theorists such as Gustav Cassel andFritz Machlup.5
The conclusion that the stock market didnot absorb cash balances was based on anumber of irrefutable logical arguments andscattered bits of empirical evidence. Oppo-
man (1977), who advocates using total debits, adjustedfor currency transactions, as a measure of transactionsdemand. Two other recent reviewers of research on thedemand for money have also noted the potential dangersentailed by the use of GNP as a proxy for total transac-tions demand: "This whole line of reasoning, however,overlooks the large and rapid fluctuations that can takeplace in the volume of transactions conducted in thefinancial markets," (David Laidler, 1977, p. 58), and "itis not clear that real GNP is a good measure of transac-t ions. . ." (Steven Goldfeld, 1973, p. 583). Both of theseremarks occur in footnotes, however, and are not sys-tematically followed up. Somewhat earlier, Tibor Scitov-sky issued a similar warning (1969, p. 39). See alsoJacob Enzler, Lewis Johnson and John Paulus, whorecognize asset exchanges as possibly influencing trans-actions demand (1976, p. 269), but empirically are moreinterested in intermediate goods transactions. Friedmanand Anna Schwartz also recognize the possibility thatasset exchanges might influence transactions demand(1982, p. 39), although this is not incorporated into theirtheoretical framework.
4 See Fritz Machlup (1940, especially chs. 2-4) for asuperior although critical introduction to this literature.
5 For example, the proposition that stock marketspeculation deprived legitimate commerce and industryof needed capital sometimes coexisted with the proposi-tion that overinflated stock prices made it "too easy" forbusinesses to raise expansion capital by issuing equities.While these claims can be reconciled by differentiatingbetween those firms that did (because of their size orreputations) and those that did not have access to thestock market, most of the discussion lacked this kind ofclarification.
Digitized for FRASER http://fraser.stlouisfed.org/ Federal Reserve Bank of St. Louis

VOL. 74 NO. 1 FIELD: DEMAND FOR MONEY, 1919-29 45
nents of absorption pointed out correctlythat purchases and sales of existing securitiesin secondary markets did not extinguish cashbalances any more than did purchases andsales of a rare painting or a loaf of bread.Critics of absorption went on to emphasizethe lack of a close connection between assetprices and the transactions balances neces-sary to sustain them. Although Machlupwaffled on this point,6 he did claim that therecould be in principle no limit to the rise inasset prices over time consistent with a givenmoney supply, so long as new informationwas interpreted similarly by most investors.He neither emphasized nor denied that theopposite extreme was also possible: highlevels of trading among individuals with dif-ferent and changing expectations about theappreciation potential of different securitiesin the absence of major movements in indi-vidual stock prices and their average.
The central issue, recognized as early as1916 by such German writers as Herbert vonBeckerath,7 and in the 1920's by some of theEnglish and American writers, was whetherfluctuations in the volume and value of ex-changes of existing securities could havemeasurable influences on the stock demandfor cash balances for transactions purposes.This was never denied as a theoretical possi-bility. But after extensive debate amongmonetary theorists in the 1920's, a consensuswas reached: such trivial amounts of cashrelative to the volume of transactions were
6Compare Machlup "No additional money capital isnecessary for a rise in securities prices" (p. 46) withp. 92, where he claims that a lasting stock market boomcan result only from inflationary credit supply. Machlupand others dismissed the phenomenon of margin buyingas simply an increase in the number of layers of finan-cial intermediation—without real consequence—andpointed to the use of clearance mechanisms and broker-age deposits by regular customers as evidence that veloc-ity was costlessly, or at least very inexpensively, flexiblein financial transactions.
7"The money which is withdrawn from expenditureon the markets for goods and labour, and used as a unitof account for business on the stock exchange, leads to atemporary reduction in the demand for goods and forlabour. That is to say that the money is held up on itsway and for the time being can neither be spent nor lentin the economic process proper" (Beckerath, p. 162,cited in Machlup, p. 68).
involved in the transfer of securities, and thevariance in the demand for such balanceswas so small, due to highly (inexpensively)flexible velocity, that the empirical impact offluctuations in the volume of asset exchangeson the transactions demand for money hadto be insignificant.8 Even John MaynardKeynes, towards the end of the first volumeof the Treatise, expressed skepticism as tothe empirical importance of a theoreticalmechanism he had outlined in some detail atits beginning.9
The consensus reached by economists inthe late 1920's and early 1930's that fluctua-tions in asset exchanges had little or no effecton the demand for cash balances has notbeen systematically reexamined since then, atleast insofar as it applies to the 1920's. Bythe early 1930's, a decade of consistentlycollected data were available (now assembledin Banking and Monetary Statistics, 1976a),but inexpensive statistical techniques for theiranalysis were not. Applying multiple regres-sion analysis to data from the 1920's, it isnow possible to show that over the years1919-29, the volume and value of trading onthe New York Stock Exchange did have aneconomically important impact on the trans-actions demand for money in New York andin 100 major commercial and industrialcenters, as well as on the demand for morebroadly defined national monetary aggre-gates.
II. Asset Trading and Transactions Demand,1919-29
According to conventional analysis, theposition of an economy's LM curve is condi-tional on a number of parameters, the mostimportant of which are 1) the stock of nomi-nal cash balances in the system, 2) the pricelevel of GNP-related transactions, and 3) agiven state of liquidity preference. If assetexchanges require fluctuating levels of trans-actions balances, then at least two additionalparameters need to be added: 4) the volume
8Machlup (p. 94); Seymour Harris (1933, p. 611);Charles Hardy (1932, p. 167).
9Keynes (1934, I. pp. 44 and 249); see my 1983paper.
Digitized for FRASER http://fraser.stlouisfed.org/ Federal Reserve Bank of St. Louis

46 THE AMERICAN ECONOMIC REVIEW MARCH 1984
of asset exchanges in secondary markets, and5) the average volume-weighted price oftraded assets. A contractionary open marketoperation, a change in liquidity preferenceleading to a higher demand for money as anasset, or a surge in the desired level of assetexchanges can now all, ceteris paribus, beinterpreted as shifting the LM curve to theleft, resulting in higher interest rates andlower levels of real GNP in the short run.Eventually, price declines in GNP-relatedtransactions might lead to counterbalancingshifts in both IS and LM schedules. In mostbusiness cycle episodes, however, variouskinds of expectational and institutional in-ertia keep goods and services prices frommoving sufficiently rapidly to prevent quan-tity movements.10 Such price movements, andtheir consequences, will be treated in thispaper as of a second order of importance.
Two conclusions follow from these as-sumptions. A major change in the level ofasset exchanges must in the short-run resultin some combination of (a) nominal moneystock changes, (b) interest rate changes, or(c) changes in real GNP. Absent accommo-dation, the effect will be (assuming the changeto be an increase) some combination of higherinterest rates and lower real output, depend-ing on the shape of the IS curve. With totalaccommodation, nominal money supplywould be higher, with unchanged interestrates and real output. How accommodativecan we assume the System to have been?
The Federal Reserve System was set up inpart to satisfy temporary seasonal variationin the demand for credit or money associatedwith such events as fall harvests or Decem-ber retail sales. The effect of the introductionof the System was to reduce substantially theseasonal variability in interest rates that hadpreviously characterized the American econ-omy.11 Through a combination of openmarket operations, foreign exchange transac-tions, and discount window policy, the Fed'soperations permitted the nominal money
10 Examples include overlapping contracts for the de-livery of output as well as the purchase of inputs,including labor, or the failure of inflation expectationsto adjust downward (upward) until several periods oflower than (higher than) expected inflation have elapsed.
11 See Friedman and Schwartz (1963, pp. 293-95).
supply to be endogenously determined byallowing the commercial banking system tosatisfy, at least in part, the transactions de-mand forthcoming, at targeted interest rates,during different months.12
The Fed's philosophy with respect to cycli-cal fluctuations in the demand for credit wasless clear. Some argued for accommodatingall legitimate "needs of trade," while othersmaintained that the System should tightenup towards the end of an expansion to pre-vent speculative "overaccumulation" of in-ventories.13 In spite of these and other dif-ferences, however, there was fundamentalagreement within the System on two proposi-tions: first, that the ultimate source offluctuations in desired money holdings, bethey seasonal or cyclical, were fluctuations inreal, GNP-related activity, and second, thatthe responsibility given the System to regu-late the supply of money entailed a responsi-bility to safeguard its purchasing power.
This obligation to maintain the purchasingpower of money meant that although theSystem was willing in the short run toaccommodate unexpected cyclical as well asseasonal fluctuations in desired money hold-ings, originating in perturbations in the ISschedule or the money demand function, thewillingness to make such accommodationcould, over time, come into conflict with theimplicit longer-run objective. Periodically, theOpen Market Investment Committee, con-sisting in 1929 of five bank governors withthe New York governor as chair, respondedto current economic conditions including (atleast implicitly) observed longer-run changesin the nominal money supply (Mt - Mt-1)by ratcheting up or down the interestrate/credit conditions targets. Appropriatechanges in discount rate and/or open marketpurchases or sales consistent with thesetargets were then made.
12" Transactions demand for money" is used here inthe sense of desired money holdings. Such fluctuationscould have their origins in the perturbations in thedemand for money function (i.e., influences on desiredmoney holdings other than changes in Y or r), or inchanges in the flow demand for credit, as reflected in theposition of the IS schedule.
13See Friedman and Schwartz (1963, p. 263). Supportfor both of these positions is to be found in the System'sTenth Annual Report. See Hardy, pp. 79-81.
Digitized for FRASER http://fraser.stlouisfed.org/ Federal Reserve Bank of St. Louis

VOL. 74 NO. 1 FIELD: DEMAND FOR MONEY, 1919-29 47
Ceteris paribus, monetary growth rateswould change as a result of such changes.Although primarily concerned with creditconditions and interest rates, policymakerscould not help keeping an eye on monetarygrowth rates, both for what such rates toldthem about the health of the real side of theeconomy, and for the warning they mightgive of longer-run inflationary dangers. Ac-commodating short-term seasonal or cyclicalfluctuations in the desired money holdingswas an important objective of the system,but so too was price stability or mild defla-tion over the longer term, and most centralbankers believed the implications of thequantity theory of money: that control of thelonger-term growth rate of the money supplyin relation to the growth rate of real GNPwas the necessary means to this end.
In normal times, then, the System can beviewed as having a short-run (accommoda-tive) interest rate target, and a longer-run(less accommodative) monetary growthtarget, with a feedback mechanism linkingthe two. The problem was that the late 1920'swere not "normal times." In particular, theregressions and simulations discussed belowdemonstrate that an empirically importantincrease in transactions demand resultedfrom the rising volume of asset exchanges inthe post-1925 period. Because this increaseddemand was unrecognized, it short-circuiteda feedback mechanism that otherwise wouldhave led to a moderation of the high interestrate policy that pushed the economy intorecession in 1929. Before the logic of thatargument is developed, however, the in-fluence of asset exchanges on the transac-tions demand for money must be establishedeconometrically.
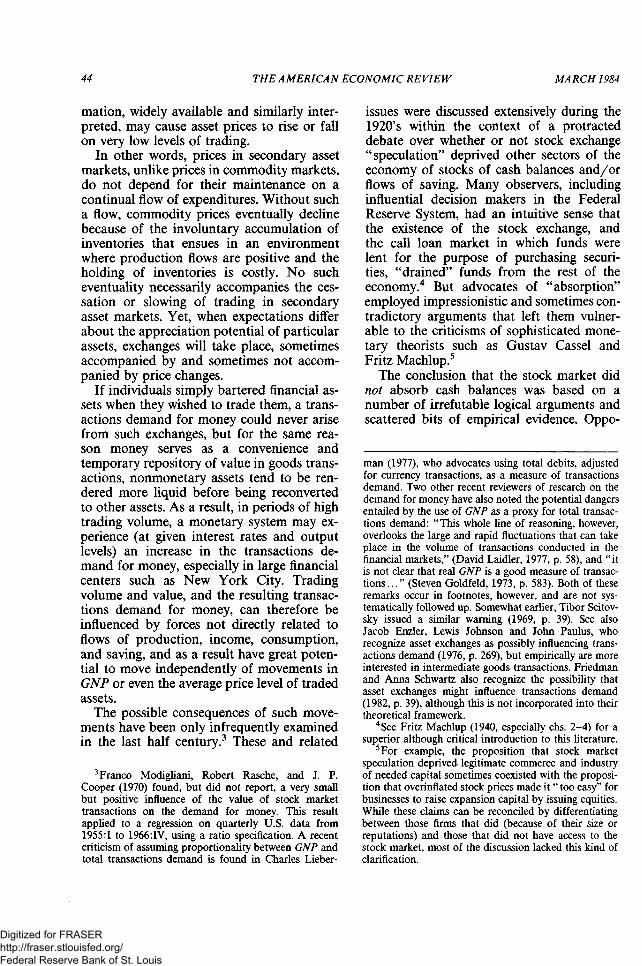
The regressions reported in Table 1 testthe fundamental empirical question at issuein this paper. Using monthly data, they askwhether, when one holds the level of nominalincome and interest rates constant, the levelof trading on the New York Stock Exchangeexercised a statistically significant and eco-nomically important impact on the demandfor and holdings of nominal cash balances.Six monetary aggregates serve as the depen-dent variables in Table I. These include de-mand deposits in New York City, demanddeposits in 100 major centers (excluding New
York City), demand deposits in 101 centers(including New York City), currency plusdemand deposits in commercial banks (Ml),currency plus demand and time deposits incommercial banks (M2), and M2 plus de-posits in mutual savings banks and the postalsavings system (M3). All dependent and in-dependent variables (excluding dummies)have been transformed into natural loga-rithms to facilitate the calculation of elastici-ties. Two short-term interest rates are used:that on prime commercial paper, 4-6 monthmaturity (PCP46), and the rate in the callmoney market for loans on new securities(CALL).
Nominal income data is not available on amonthly basis for the 1920's, and three mea-sures have been used to estimate it. One(YINT) is a simple linear interpolation fromannual data, with endpoints centered in mid-year. The second proxy (YIND) is con-structed using a two-stage procedure. Annualnominal income is regressed on an annualindex of industrial production. The resultingregression coefficients are then used to con-struct predicted monthly income data basedon this annual relationship, and monthly sea-sonally adjusted industrial production data.The third proxy (YM) is constructed by mul-tiplying monthly seasonally adjusted in-dustrial production data times a monthlywholesale price index, less farm products.The choice of income proxy does not materi-ally affect any of the conclusions of thepaper. To conserve space, only the resultsusing the third proxy are reported, but re-gressions have been run using each of thethree.
The asset exchange variable (TRAD1) con-sists of the monthly volume of trading on theNew York Stock Exchange in millions ofshares, round lots times an index of commonstock prices (1935-39=100). The volumeseries is based on the Exchange ticker, andexcludes odd lots, stopped sales, private sales,split openings, crossed transactions and/or"errors of ommission."14
l4TRAD1 is an imperfect estimate of trading value,inasmuch as the weights used in the stock price indexmay not have reflected the relative trading volumes ofdifferent securities. On the trading volume series, seeU.S. Bureau of the Census, Vol. II, p. 999, note on seriesX-531.
Digitized for FRASER http://fraser.stlouisfed.org/ Federal Reserve Bank of St. Louis
48 THE AMERICAN ECONOMIC REVIEW MARCH 1984
TABLE 1—DEMAND FOR MONEY REGRESSIONS, 1919-29a
Demand Deposits:NYC:
(1) R2 =.980, D-W = 1.87p =.200 (2.20)
(2) R2 =.985, D-W = 1.85p =.264 (2.99)
Outside NYC:(3) R2=.996, D-W = 1.97
p =185 (2.06)(4) R2 = .996, D-W = 1.97
p =.174 (1.93)101 Centers:
(5) R2 =.994, D-W = 1.83p =.164 (1.73)
(6) R2 =.996, D-W = 1.82p =.267 (2.95)
M1:(7) R2=.9996, D-W =2.19
p =-.512 (-6.52)(8) R2=.9997, D-W =2.19
p = - .533 (-7.21)M2:(9) R2 =.9997, D-W= 2.01
p =- .393 (-4.72)(10 R2 =.998, D-W= 2.09
p = - .477 (-5.92)M3:
(11) R2 = .9998, D-W = 2.03p = - .404 (-4.90)
(12) R2=.9999, D-W =2.12p = - .485 (-6.08)
Log ofLagged
EndogenousVariables
.754(17.61)
.772(16.14)
.888(50.53)
.891(55.04)
.835(34.76)
.851(31.11)
.874(50.32)
.886(56.30)
.933(118.9)
.941(143.2)
.944(139.2)
.951(166.8)
Log ofTradingValue,
NYSEb
.020(5.16)
.016(3.94)
.0077(4.38)
.0047(3.02)
.013(5.83)
.0087(3.73)
.0073(5.44)
.0048(3.95)
.0069(6.11)
.0042(4.48)
.0062(5.97)
.0038(4.38)
Log ofNominalIncomeProxyc
.040(2.67)
.024(1.47)
.033(4.79)
.027(4.42)
.036(4.44)
.026(2.84)
.031(5.96)
.027(5.75)
.020(5.95)
.017(5.76)
.016(5.46)
.013(5.18)
Log of Short-TermInterest Rate
CallLoan
-.039(-4.81)
-.025(-6.42)
-.032(-6.92)
-.015(-5.80)
-.016(-7.71)
-0.14(-7.63)
CommercialPaper
-.036(-2.62)
-.039(-7.35)
-.038(-4.80)
-.023(-6.67)
-.023(-9.50)
-.020(-9.33)
Seasonal DummiesJanuary
.011(1.70)
.014(2.10)
.012(3.76)
.013(4.22)
.011(3.02)
.014(3.61)
August
-.020(-3.28)
-.018(-2.81)
-.0034(-1.15)
-.0021(-.72)
-.010(-2.99)
-.0093(-2.58)
Constant
.180(5.61)1.75
(4.77)
.832(6.06)
.878(6.67)
1.34(6.68)1.27
(5.41)
1.09(6.94)1.03
(7.08)
.587(7.84)
.556(8.60)
.505(7.65)
.477(8.33)
Sources: Federal Reserve System (1976a): Demand Deposits: Tables 49 and 50, pp. 164-74; 196-206; PrimeCommercial Paper Rates: Table 120, p. 450; Call Loan Rates, New Loans: Table 120, p. 450; Index of CommonStock Prices: Table 133, pp. 480-81; Volume of Trading on NYSE: Table 135, p. 485. Federal Reserve System(1976b): Seasonally Adjusted Industrial Production: p. S-27. Friedman and Schwartz (1963): M1, M2, M3: AppendixA, pp. 710-12. U.S. Bureau of the Census (1975): Volume and Value of Trading on NYSE, 1935-39, SeriesX-525—526, Vol. II, p. 1007. U.S. Department of Commerce (1940): Wholesale Prices, All Commodities other thanFarm Products, p. 18.
an =131 observations (February 1919-December 1929.) The method of estimation was ordinary least squares withfirst-order autocorrelation coefficient selected by a maximum-likelihood procedure. Durbin-Watson (D-W) statisticsare biased towards 2 in such models. However, an approximation of the Durbin h-statistic, h = (1 - d/2)(N/(l - N(vara)))1/2, where d is the D- W statistic, N is sample size, and a is the estimate of the coefficient on thelagged endogenous variable, enables us to reject at the 5 percent level the hypothesis that the errors in the estimatedequation are serially correlated. The t-statistics are shown in parentheses. The t-statistic for p is to its right.
bTrading volume, millions of shares X asset price index (see text).c Industrial production index, seasonally adjusted, X WPI, other than farm products, X a scaling factor (.0518) to
make estimates comparable to annual GNP estimates.
This study employs a widely used, al-though sometimes criticized,15 partial-adjust-
15See Goldfeld (1973, pp. 581-83). Criticisms centeraround the proposition that demanders of money neveractually hold their desired cash balances, and on the
ment model estimated through the use of aKoyck transformation. Including the laggeddependent variable on the right-hand side of
econometric difficulties of constructing a confidence in-terval around the long-term elasticity estimates.
Digitized for FRASER http://fraser.stlouisfed.org/ Federal Reserve Bank of St. Louis
VOL. 74 NO. 1 FIELD: DEMAND FOR MONEY, 1919-29 49
the equation implies that previous month'scash balances (Mt_1) adjusted only partiallyto current month's desired level (Mt*). Be-cause regressions are run on demand de-posits in New York City as well as in 100centers outside New York City, this specifi-cation facilitates the comparison of the speedsof adjustment of different monetary aggre-gates.
A maximum-likelihood procedure is usedto estimate the autocorrelation coefficient p.16
In addition to the above mentioned vari-ables, two seasonal dummies were intro-duced in the demand deposit regressions todeal with systematic variation in thedeposit-currency ratio over the year. Onemight anticipate the need for a positivedummy for December to take account of thelarge fraction of retail sales that take placeduring the Christmas season, and the result-ing increased demand for money. In the1920's, however, almost all of the impact ofthe Christmas season shows up in an in-crease in the demand for currency, as op-posed to demand deposits. It is in January,which typically experiences the largestmonth-to-month drop in the amount of cur-rency in circulation, that demand depositsrise to unusual levels. As merchants deposittheir cash receipts from the Christmas sea-son, and consumers cut back on their cur-rency withdrawals, the deposit-currency ratiorises, and so, temporarily, does the amountof demand deposits. By the end of January,demand deposits begin to fall, as the Fedtraditionally contracts the money supply. Butaverage weekly January demand depositstend to be higher than would otherwise bethe case, as the result of this seasonal varia-tion in the deposit-currency ratio. As theregressions show, this increase is statisticallyindependent of variation in the other right-hand variables discussed above. The sign ofthe coefficient on the August dummy can beexplained as the result of a shift in thedeposit-currency ratio in the opposite direc-tion.17
16See Charles Beach and James MacKinnon (1978).This procedure is a variant on the original Cochrane-Orcutt technique.
17 For all years except the recession year of 1921, theend-of-month currency in circulation figures are higherfor August than July (and continue at higher than
TABLE 2—LONG-RUN ELASTICITIES OF MONEYWITH RESPECT TO TRADING VALUE a
New York City100 Major Centers101 CentersM1M2M3
.246
.112
.165
.126
.067
.056
Long-RunElasticity
.081
.069
.079
.058
.103
.111
a Based on Table 1 estimates. Industrial productionindex X WPI less farm products as nominal incomeproxy; call loan rate as short-term interest rate.
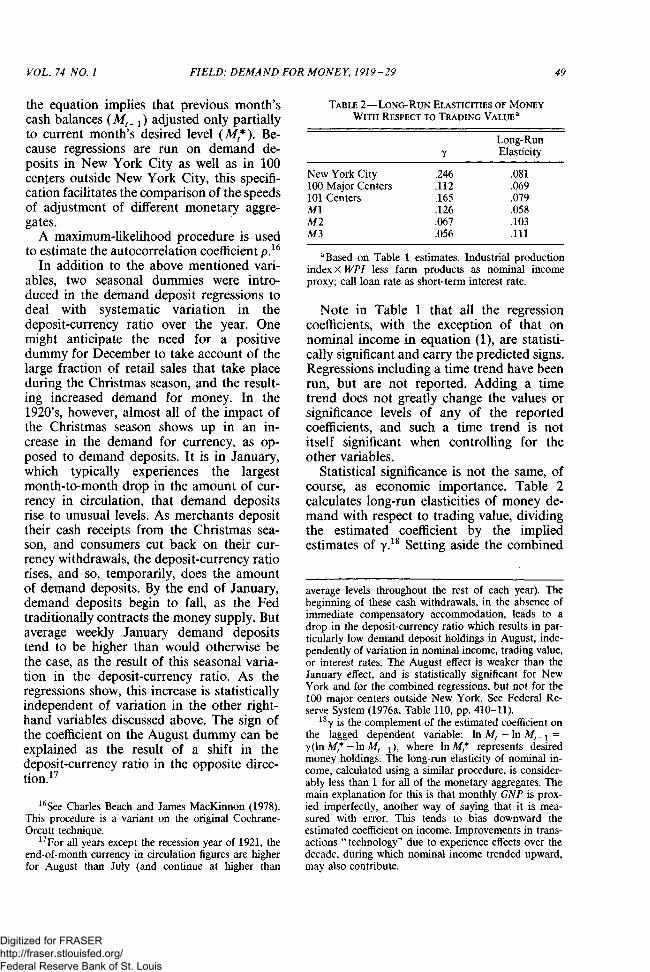
Note in Table 1 that all the regressioncoefficients, with the exception of that onnominal income in equation (1), are statisti-cally significant and carry the predicted signs.Regressions including a time trend have beenrun, but are not reported. Adding a timetrend does not greatly change the values orsignificance levels of any of the reportedcoefficients, and such a time trend is notitself significant when controlling for theother variables.
Statistical significance is not the same, ofcourse, as economic importance. Table 2calculates long-run elasticities of money de-mand with respect to trading value, dividingthe estimated coefficient by the impliedestimates of 18 Setting aside the combined
average levels throughout the rest of each year). Thebeginning of these cash withdrawals, in the absence ofimmediate compensatory accommodation, leads to adrop in the deposit-currency ratio which results in par-ticularly low demand deposit holdings in August, inde-pendently of variation in nominal income, trading value,or interest rates. The August effect is weaker than theJanuary effect, and is statistically significant for NewYork and for the combined regressions, but not for the100 major centers outside New York. See Federal Re-serve System (1976a, Table 110, pp. 410-11).
18 y is the complement of the estimated coefficient onthe lagged dependent variable: 1n Mt -1n Mt_1 =y(ln Mt* -1n Mt-1), where 1n Mt* represents desiredmoney holdings. The long-run elasticity of nominal in-come, calculated using a similar procedure, is consider-ably less than 1 for all of the monetary aggregates. Themain explanation for this is that monthly GNP is prox-ied imperfectly, another way of saying that it is mea-sured with error. This tends to bias downward theestimated coefficient on income. Improvements in trans-actions " technology" due to experience effects over thedecade, during which nominal income trended upward,may also contribute.
Digitized for FRASER http://fraser.stlouisfed.org/ Federal Reserve Bank of St. Louis
50 THE AMERICAN ECONOMIC REVIEW MARCH 1984
demand deposits in 101 centers, one canrank the remaining five monetary aggregatesin the order of their cumulative sensitivity totrading value fluctuations, as estimated bylong-run elasticity: M3, M2, demand de-posits in NYC, demand deposits outside ofNYC, and Ml. However, the speed of ad-justment implied by the coefficient on thelagged endogenous variable tends to rise themore narrowly one defines the monetary ag-gregates, and is the highest for demand de-posits in New York City. Although Ml andM3 eventually experience a larger percentageincrease in response to a given percentageincrease in trading value, the impact coeffi-cient is approximately three times larger fordemand deposits in New York than it is forany of the Friedman-Schwartz monetary ag-gregates.
Over the period in question, annual nomi-nal income fluctuated from a low of $69.9billion in 1921 to a high of $102.1 billion in1929, while trading value on the New YorkStock Exchange fluctuated from an annual-ized low of $1.6 billion a year (July 1921) toa high of an annualized rate of $97.8 billion(October 1929).19 Whereas nominal income's1921 low was 68.5 percent of its 1929 high,trading value's 1921 low was 1.6 percent ofits 1929 high. Almost all of the rise in trad-ing value from its July 1921 trough to itsOctober 1929 peak took place in the post-1925 period. One way to consider the eco-nomic importance of the Table 2 elasticitiesis to ask how much the post-1925 growth inasset trading changed money growth rates, ascompared with a hypothetical scenario inwhich interest rate policy and GNP growthtook their historical levels, but asset tradingremained at its pre-1925 levels. The counter-factual posited, therefore, is one in whichtrading value remained constant throughoutthe period at the average of its level duringthe first 72 months of the sample, but inter-
19These estimates are obtained by taking the mini-mum and the maximum value of the TRAD1 series(constructed by multiplying a common stock price indexby the volume of trading), multiplying them by theaverage price during the base years (1935-39) of theindex, ($26.95) and dividing by 100. Average annualstock prices calculated from U.S. Bureau of the Census,Vol. II, p. 1007, Series X-525 and X-526.
est rates and nominal income had their ac-tual values.
Dynamic simulations of monetary stocks(i.e., simulations in which the lagged depen-dent variables are simulated rather than ac-tual values) using the regression coefficientsreported in equations (1) and (7) were con-ducted for demand deposits in New YorkCity, as well as Friedman and Schwartz Ml.These simulations indicate that, absent thepost-1925 surge in asset exchanges, averageholdings of New York City demand depositsover the 24-month period 1928-29 wouldhave been 20.3 percent lower than they actu-ally were. Holdings of Ml would have beenon average 17 percent below their actuallevels.20 These results have important impli-cations.
The decision to raise discount rates as ameans of controlling speculative activity onthe stock market engendered substantial dis-agreement within the System.21 Experiencein 1920-21 had led to the advocacy of dis-count policy to control speculation in com-modities, where speculation was understoodto mean excessive holding of inventory stocksin anticipation of future price rises. Suchholdings made an economy particularlyvulnerable to downturns in real activityinasmuch as a change in expectations re-garding future price levels or rates of in-crease could rapidly change the stock of in-voluntarily held inventories, leading to animmediate downturn in production. Thesharp rise in the discount rate in January1920, and the economy's response to it, gaveammunition both to those opposed to suchcountercyclical policy, who argued that therise was too severe, and those in favor, whoargued that the rise should have comeearlier.22
In 1928-29, however, debate concernedthe use of discount policy to combat specula-tion not in commodities (whose prices weredropping), but in financial assets, in particu-
20 New York City demand deposits ' actual 24-monthaverage was $5,379 million. The average for the simula-tion over the same period was $4,286 million. For M l ,the corresponding figures are $26,300 million and$21,824 million.
21 Fr iedman and Schwartz (1963, p. 254).2 2 Fr iedman and Schwartz (1963, p. 231).
Digitized for FRASER http://fraser.stlouisfed.org/ Federal Reserve Bank of St. Louis

VOL. 74 NO. 1 FIELD: DEMAND FOR MONEY, 1919-29 51
lar, equities. Although there are some simi-larities between commodity speculation andspeculation in equities, the potential effect ofsuch speculation on real activity is moreattenuated, and therefore the rationale forattempting to use monetary policy to controlit is less compelling. In proposing to use highinterest rates to moderate an explosion inasset prices in a deflationary environmentcharacterized by rapid real growth, the Sys-tem was moving into uncharted waters, afact recognized both by proponents and op-ponents of such policy. There were concernsamong opponents—in retrospect, legitimate—that such higher rates would adverselyaffect real economic activity, much as dis-count rate policy in 1920 had helped plungethe economy into one of the shortest butmost severe recessions in U.S. history. How-ever, opponents of higher interest rates didnot disagree with proponents regarding thedesirability of some Federal Reserve actionto deal with developments on the stockmarket: they simply believed that asset pricescould somehow be deflated through the useof direct pressure (selective controls on loansfor speculative purposes) without affectingreal activity. Moreover, both opponents andproponents lacked an awareness of the addi-tional source of transactions demand result-ing from asset exchanges.
A plausible case can be made that thisignorance resulted in a tighter monetarypolicy than otherwise would have obtained.Suppose there had in fact been no suchadditional source of transactions demand (or,alternately, no rise in the value of exchanges).The simulations described above indicate thathad asset exchanges remained at their pre-1925 level, the Fed would have been con-fronted, already in 1928, with the beginningsof a fairly precipitous decline in monetaryaggregates (or, in the case of the broaderaggregates, their rate of growth). One cannotpredict exactly what the System's response tothis would have been, but there is goodreason to believe that such developmentswould have strengthened the hand of thosewho opposed the high interest rate policy,and that the policy would have been mod-erated, thus avoiding, or at least making lesssevere the downturn, centered in construc-
tion and automobiles, that was gatheringmomentum already in the second quarter of1929.
In the event, there was a complete failureto understand the nature or dimensions ofthe transactions demand for cash arising fromthe rising volume of asset exchanges. Onecan, with the benefit of hindsight, argue thatobservers should have been puzzled by thefact that the rise in interest rates in 1928-29had little effect on monetary growth rates.Optimists apparently looked at this evidenceand concluded that, in the context of theWall Street mania, high interest rates werenot adversely affecting the real side of theeconomy, since holdings of cash balances,which they implicitly assumed to be entirelyGNP related, continued to grow at ap-proximately the same rate as before, contraryto what one would have expected in morenormal times.
Unfortunately, real activity was being ad-versely affected. The steady growth in mone-tary aggregates did not, according to theseregressions, reflect a steady growth in GNP-related transactions demand. The interpreta-tion suggested by these regressions is that therise in interest rates, as theory predicts, ledto a general decline in desired money hold-ings, but that this decrease was more or lesscompensated for by the surge in transactionsdemand coining from the stock market, leav-ing Ml, for example, virtually unchangedfrom September 1925 to September 1929.
III. Further Econometric Issues
If the transactions demand for money werealmost exclusively associated with GNP-related transactions, then it would be reason-able to speak of a CPI, WPI, or GNP defla-tor as approximating its "price," and deflateboth nominal income and the monetary ag-gregate by such a index. But, if the argumentof this paper is correct and transactions insecondary asset markets exercised a nonneg-ligible impact on the transactions demandfor money, this procedure for generating aseries of real cash balances is subject tocriticism. The income proxy can be deflatedby the WPI to give us industrial production,and the trading value index can be deflated
Digitized for FRASER http://fraser.stlouisfed.org/ Federal Reserve Bank of St. Louis
52
M1
P =D-W =
MlP =
D-W =M3
P =D-W =
THE AMERICAN ECONOMIC REVIEW
TABLE 3—INSTRUMENTAL VARIABLE ESTIMATESa
- .517 (-6.619)2.128
- .393 (-4.71)2.087
- .384 (-4.600)2.011
LaggedDependent
Variable
.8924(47.75)
.9427(108.9)
.9522(129.8)
Log ofTrading
valueNYSE
.0058(4.016)
.0055(4.296)
.0048(4.170)
Log ofNominalIncome
(IND x WPI)
.029(5.212)
.0195(5.468)
.0163(5.369)
Log ofCall Money
Rate
- .014(-5.046)
- .0144(-6.611)
- .013(-6.692)
MARCH 1984
C
.933(5.522)
.5008(6.101)
.424(5.969)
a Instruments include lagged dependent variable, constant, and lagged values of logsof trading value, nominal income, and call money rate. Correction for serially correlatederrors has been made.
by the asset price index to give us tradingvolume, but what is the appropriate deflatorto use for the stock of money? That obvi-ously depends on how important is the assetexchange component of the transactions de-mand for money. The more important thiscomponent, the larger should be the weightattached to the asset price index in themonthly composite deflator. Were asset pricesand goods prices positively correlated overthe period in question, the relative weightingof such price indexes would not be empiri-cally of great concern. But, for the 1920's, aseries of real balances calculated using acomposite deflator is very sensitive to theweighting procedure used, because monthlygoods prices (the WPI) and asset prices (astock price index) were negatively correlated(r = — .384) over the 132-month sample.Small changes in the prior specification ofthe weighting scheme will produce majorchanges in the calculated series of real bal-ances. Moreover, that weighting scheme can-not adequately be specified without firstreaching conclusions regarding the funda-mental questions at issue in this study. Theseconsiderations argue, I believe, for a nominalspecification, not because people necessarilysuffered from money illusion and exhibiteddemand for nominal balances, but ratherbecause such a specification permits testingof an important hypothesis in a manner thatdoes not require prejudging the outcome ofthat test.
Regressions were nevertheless run on NewYork demand deposits, deflating all nominalvariables (demand deposits, trading value,and nominal income) by the WPI less farmproducts. These still show economically im-portant and statistically significant estimatesof the elasticity of the monetary aggregatewith respect to deflated trading value.23
However, the results are somewhat weaker,and, as indicated, I do not feel that thisprocedure is theoretically satisfactory, be-cause it assumes that asset prices have noweight in the nominal balance deflator.
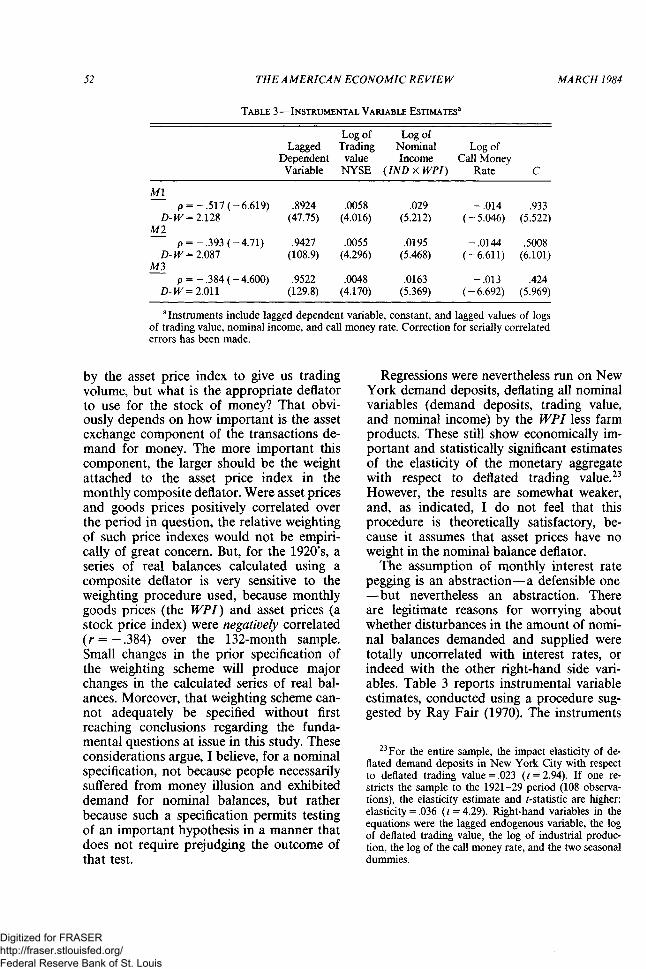
The assumption of monthly interest ratepegging is an abstraction—a defensible one—but nevertheless an abstraction. Thereare legitimate reasons for worrying aboutwhether disturbances in the amount of nomi-nal balances demanded and supplied weretotally uncorrelated with interest rates, orindeed with the other right-hand side vari-ables. Table 3 reports instrumental variableestimates, conducted using a procedure sug-gested by Ray Fair (1970). The instruments
23 For the entire sample, the impact elasticity of de-flated demand deposits in New York City with respectto deflated trading value =.023 (t = 2.94). If one re-stricts the sample to the 1921-29 period (108 observa-tions), the elasticity estimate and t-statistic are higher:elasticity = .036 (t = 4.29). Right-hand variables in theequations were the lagged endogenous variable, the logof deflated trading value, the log of industrial produc-tion, the log of the call money rate, and the two seasonaldummies.
Digitized for FRASER http://fraser.stlouisfed.org/ Federal Reserve Bank of St. Louis

VOL. 74 NO. 1 FIELD: DEMAND FOR MONEY, 1919-29 53
include the lagged dependent variable, andlagged values of all other right-hand vari-ables. The estimates in Table 3, designed tocorrect for possible simultaneous equationbias, do not markedly affect the conclusionsof this paper. For example, the elasticity ofM3 with respect to trading value is .111using ordinary least squares; the instrumen-tal variable estimates imply an elasticity of.100.24
Econometric issues aside, there remain al-ternate interpretations of these results. Thereis no necessary connection between thevolume of stock market trades and the assetprice index, but, as an empirical matter, theywere closely correlated in the 1920's (r =.937). Given this empirical relationship, onealternate interpretation emphasizes the in-fluence of wealth on the demand for transac-tions balances. Since wealth grew with thevalue of securities, these regressions mightreflect the fact that people demanded andpaid the opportunity cost of carrying highertransactions balances at given (Y, r) combi-nations, but higher levels of wealth. The sta-tistical results would be due to a spuriouscorrelation of the value of asset exchangeswith the value of assets. A second alternateinterpretation argues that the spurious corre-
24 In recent years, a number of papers have beenpublished utilizing econometric procedures to test for"causality," where the direction of causality cannot bespecified on a priori grounds and the assumption ofinstantaneous joint determination, reflected in the use ofsimultaneous equation methods, is rejected as inapplica-ble or unrealistic. The results of such causality testsseem to be quite sensitive not only to the choice of lagtruncation, but also to the prefilters applied to the data.Such sensitivity seems to be particularly acute in thecase of the Sims tests, although the conclusions of EdgarFeige and D. K. Pearce (1979) cast some doubt on theprocedures in general. Nevertheless, I did run a multi-variate Granger test on the Friedman and Schwartz M1data, logging and first differencing the logs of all vari-ables, and using lags of 18 months. Two regressionswere run, the first including 18 lagged values of thedependent variable, income (YM), trading value, andinterest rates (call money rate) and a constant, and thesecond minus the trading value variables. The F-ratio
((RSS- URSS)x(n - k))/(URSS x q) = 2.07
where n =113, k = 12 and q = 18. The upper 5 percentpoint for F(18,41) = 1.87. This result is consistent withthe Table 1 results.
lation is with the volume of exchanges ratherthan the value of assets. Suppose that agrowing volume of asset exchanges reflectedincreased uncertainty, and that increased un-certainty gave rise to an increased demandfor liquidity (shift in liquidity preference).These regressions would then be picking upthe fact that the demand for money as anasset, not its demand for transactions pur-poses, had increased due to increased uncer-tainty, which also affected the volume oftrading.
The best available measure of transactionsvelocity is the debit-deposit ratio—the ratioof the total monthly flow of debits to depositaccounts to the average stock of depositsheld. Both of the above hypotheses implythat high levels of asset trading would havebeen associated (at any interest rate) withhigher holdings of stocks of transactions bal-ances (the denominator of a debit-depositratio) without being associated with higherflows of debits (the numerator). Therefore,both of these alternate hypotheses imply thatfluctuations in the value of asset exchangesshould, ceteris paribus, have been inverselyassociated with transactions velocity.
IV. Exchange Trading and Deposit-TurnoverRates
Econometric work on short-term varia-tions in velocity is relatively rare, and thatwhich has been done has primarily consid-ered income velocity as the dependent vari-able. Such work has concluded that incomevelocity tends to vary procyclically, and themost widely accepted explanation for this isthat interest rates vary procyclically andvelocity is positively sensitive to interestrates.25 Interest rates influence velocity be-cause the higher the rate of return on alter-nate financial assets, the higher will be theindividual and aggregate ratio of expendi-tures to non- or low-interest-bearing cashbalances.26 This hypothesis should also apply
25 Over the 1919-29 period, the monthly prime com-mercial paper rate is negatively correlated with in-dustrial production, although the call money rate doesvary procyclically in this sample.
26A second hypothesis, advanced by Friedman, callsless attention to interest rates. During the cyclical up-
Digitized for FRASER http://fraser.stlouisfed.org/ Federal Reserve Bank of St. Louis

54 THE AMERICAN ECONOMIC REVIEW MARCH 1984
to regressions using a measure of transac-tions velocity.
If the results of Table 1 are to be ex-plained using either of the two alternate in-terpretations suggested above, one would inaddition expect to find a negative coefficienton trading variables in a velocity regression.Such a negative coefficient would result fromthe posited association of asset trading witha growth in the denominator, but not thenumerator of the debit-deposit ratio, due inthe first instance to the growth in transac-tions balances at given (Y,r) combinationsrelated to higher wealth levels, for whichasset prices were a proxy, and in the secondinstance to the growth in the asset demandfor money associated with uncertainty (forwhich trading volume was a proxy). In con-trast, if the argument of this paper is correct,velocity should covary positively with thevolume of trading on the New York StockExchange.27
swing, he argues, measured income is greater than per-manent income (which largely determines the stock de-mand for money) so that measured income velocity(GNl/M) is high during expansion. Similarly, in thecyclical downturn, measured income is less than perma-nent income, so GNI/M is low. The stock demand forcash balances is more stable over the business cycle thanmeasured income, leading to procyclical movements inmeasured velocity. Friedman's hypothesis suggests thatincome should be positively associated with velocity,independently of interest rates. This hypothesis has beencriticized by Laidler on the grounds that transitoryincreases in income increase wealth, and that "elemen-tary notions" of liquidity preference suggest that moneybalances might receive a portion of it. See Friedman andSchwartz (1963, pp. 642-43); Laidler (1966, p. 56).
27Let = the elasticity of the stock demand formoney with respect to trading value, and theelasticity of the flow of debits with respect to tradingvalues. If = then trading value will not affectvelocity. Two extreme cases would be (a) = 0and (b) . In case (a) neither debits nordeposits held are affected by trading value, and in case(b), equally unrealistic, deposits held rise dollar fordollar with debits. The two alternate interpretations ofthe Table 1 results discussed at the end of Section IIimply that and in particular that isclose to 0. The arguments and evidence of this paper,however, suggest the contrary, that , whichimplies positive elasticity of velocity with respect totrading volume, as Table 4 shows. Nevertheless, theTable 4 results cannot discriminate between= 0 and In the former case, that ofcostlessly flexible velocity in the financial circulation,there would be little reason to expect any impact of
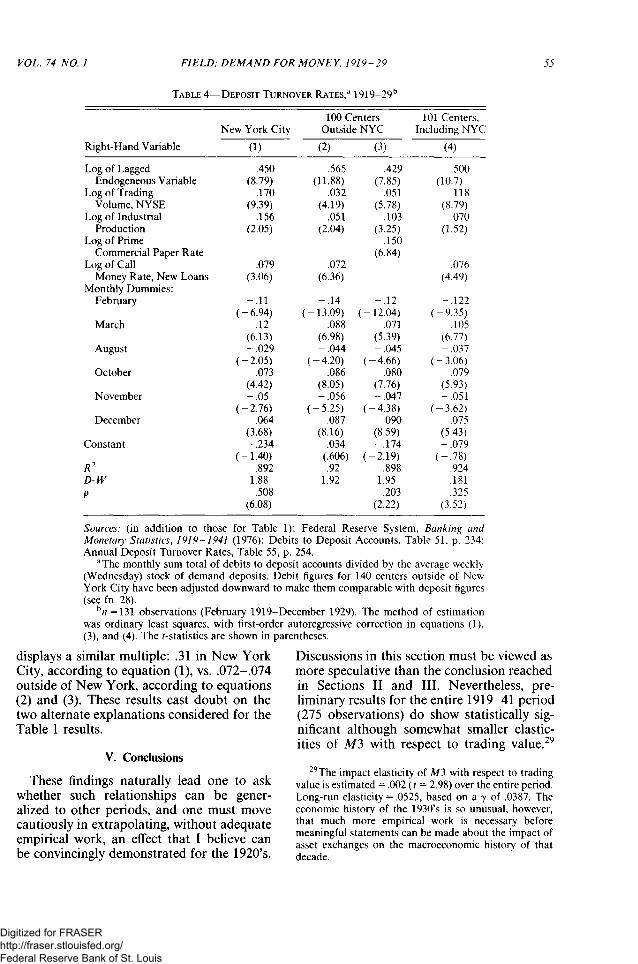
The regressions reported in Table 4 haveas their dependent variable the debit-depositratio. The regressions are run for New YorkCity, for 100 centers outside New York,28
and for 101 centers, including New York. Allthree series exhibit strong seasonal regular-ity, (generally strongest in the outside NewYork City series), and six monthly dummiesare included to capture these effects. A par-tial-adjustment model is again estimated, al-though without an autocorrelation correctionin equation (2), where it is not needed. Thecall loan rate is used as the short-term inter-est variable, except for the outside of NewYork regressions, where an equation usingthe prime commercial paper rate (3) is alsoreported. As before, instrumental variableestimates, using a procedure similar to thatdescribed for Table 3, result in only minorvariations in coefficient estimates, and in thiscase are not reported. Calculations of Durbinh-statistics, conducted as described in thenote to Table 1, again reject at 5 percent thehypothesis of serial correlation in the esti-mated equations.
The results in Table 4 show unambigu-ously that trading volume as well as interestrates exercised a positive influence on trans-actions velocity in the 1920's. They also showthat the immediate impact of a surge intrading volume on deposit turnover was threeto five times higher in New York City thanoutside of New York City, depending onwhich of equations (2) and (3) one uses ascomparison. The long-run elasticity of de-posit turnover with respect to trading volume
trading on the real side of the economy. The argumentsof this paper, therefore, depend on both the velocity(Table 4) and the stock demand for money (Table 1)regressions.
28 Regressions run on data for the 100 centers outsideof New York required some transformation of the seriespresented in Banking and Monetary Statistics, becausethe debit data is reported for 140 centers outside of NewYork (Table 51), whereas the deposit data is for 100cities outside of New York (Table 50). However, inTable 55, Federal Reserve Board statisticians have ad-justed downward the debit data to make them compara-ble to the deposit data in order to calculate annualdebit-deposit ratios. The implicit annual downward ad-justment factors applicable to the debit data were ex-tracted from Table 55 and these annual factors weremultiplied by the monthly observations to create amonthly debit series comparable to the monthly deposit
Digitized for FRASER http://fraser.stlouisfed.org/ Federal Reserve Bank of St. Louis
VOL. 74 NO. 1 FIELD. DEMAND FOR MONEY, 1919-29
TABLE 4—DEPOSIT TURNOVER RATES,a
Right-Hand Variable
Log of LaggedEndogeneous Variable
Log of TradingVolume, NYSE
Log of IndustrialProduction
Log of PrimeCommercial Paper Rate
Log of CallMoney Rate, New Loans
Monthly Dummies:February
March
August
October
November
December
Constant
R2
D-Wp
New York City
(1)
.450(8.79)
.170(9.39)
.156(2.05)
.079(3.06)
- .11(-6.94)
.12(6.13)-.029
(-2.05).073
(4.42)- .05
(-2.76).064
(3.68)-.234
(-1.40).892
1.88.508
(6.08)
1919-29b
100 CentersOutside NYC
(2)
.565(11.88)
.032(4.19)
.051(2.04)
.072(6.36)
- .14(-13.09)
.088(6.98)-.044
(-4.20).086
(8.05)-.056
(-5.25).087
(8.16).034
(.606).92
1.92
(3)
.429(7.85)
.051(5.78)
.103(3.25)
.150(6.84)
- .12(-12.04)
.071(5.39)-.045
(-4.66).080
(7.76)-.047
(-4.38).090
(8.59)-.174
(-2.19).898
1.95.203
(2.22)
101 Centers,Including NYC
(4)
.500(10.7)
.118(8.79)
.070(1.52)
.076(4.49)
-.122(-9.35)
.105(6.77)-.037
(-3.06).079
(5.93)-.051
(-3.62).075
(5.43)-.079
(-.78).924.181.325
(3.52)
55
Sources: (in addition to those for Table 1): Federal Reserve System, Banking andMonetary Statistics, 1919-1941 (1976): Debits to Deposit Accounts, Table 51, p. 234;Annual Deposit Turnover Rates, Table 55, p. 254.
aThe monthly sum total of debits to deposit accounts divided by the average weekly(Wednesday) stock of demand deposits. Debit figures for 140 centers outside of NewYork City have been adjusted downward to make them comparable with deposit figures(see fn. 28).
= 131 observations (February 1919-December 1929). The method of estimationwas ordinary least squares, with first-order autoregressive correction in equations (1),(3), and (4). The t-statistics are shown in parentheses.
displays a similar multiple: .31 in New YorkCity, according to equation (1), vs. .072-.074outside of New York, according to equations(2) and (3). These results cast doubt on thetwo alternate explanations considered for theTable 1 results.
V. Conclusions
These findings naturally lead one to askwhether such relationships can be gener-alized to other periods, and one must movecautiously in extrapolating, without adequateempirical work, an effect that I believe canbe convincingly demonstrated for the 1920's.
Discussions in this section must be viewed asmore speculative than the conclusion reachedin Sections II and III. Nevertheless, pre-liminary results for the entire 1919-41 period(275 observations) do show statistically sig-nificant although somewhat smaller elastic-ities of M3 with respect to trading value.29
29 The impact elasticity of M3 with respect to tradingvalue is estimated = .002 (t = 2.98) over the entire period.Long-run elasticity = .0525, based on a y of .0387. Theeconomic history of the 1930's is so unusual, however,that much more empirical work is necessary beforemeaningful statements can be made about the impact ofasset exchanges on the macroeconomic history of thatdecade.
Digitized for FRASER http://fraser.stlouisfed.org/ Federal Reserve Bank of St. Louis

56 THE AMERICAN ECONOMIC REVIEW MARCH 1984
Analogous mechanisms may today exerciseperturbing influences on the transactions de-mand for money. For example, maturationof large numbers of All-Savers Certificates inOctober of 1982 was associated with an un-expectedly large increase in monetary ag-gregates, presumably the result of an accom-modated increase in the transactions demandfor cash to be used in exchanging these as-sets for other assets. A plausible demonstra-tion of such effects for the 1920's opens thedoor to more sophisticated investigations ofsuch possibilities.
Current claims in the 1980's that financialtakeovers, such as that of Conoco by Dupont,absorb cash balances have an air stronglyreminiscent of the 1920's, both in the qualityof the analysis evident, and in the oppositionto such ideas generated among monetaryeconomists. Yet, if the arguments of thispaper are accepted, one must conclude thatproponents of absorption in that earlier de-cade were partially correct in their intuition,although for reasons they did not always(especially in the United States) articulatewell. The same may turn out to be the casewith respect to these current discussions.Similarly, this analysis of the 1920's providesa perspective on the influence of interna-tional asset exchanges on the transactionsdemand for dollars, an influence that wasunderlined by the rise in monetary aggre-gates associated with the transfer of assets toIran under the term of the hostage releaseagreement.30 More generally, currency sub-stitutability between dollar, mark, and yenmay play a role analogous to that of the NewYork Stock Exchange in introducing instabil-ity in the demand for dollar balances in the1980's.31
Setting aside the research opportunitiesopened up for subsequent decades, this paperdoes suggest a number of new interpretationsof some key aspects of the macroeconomichistory of the 1920's. It explains the Fried-man-Schwartz puzzling result that incomevelocity rises hardly at all towards the end ofthe 1920's, in spite of record high interest
30 Wall Street Journal, August 17, 1981, p. 20.31I base this remark on discussion with Ronald
McKinnon. See his 1982 article.
rates.32 It suggests a way of understandingthe relationship between trading on the NewYork Stock Exchange and the downturn inthe German economy in 1928, a relation thathas been rejected by those who deny thatstock market "speculation" could have"absorbed" funds previously loaned inGermany.33 Finally, it provides some insightinto the proximate causes of the downturn inreal economic activity in the United States,usually dated from August 1929.
The U.S. monetary authorities allowed themoney stock, by any number of definitions,to grow quite rapidly after the recession of1920-21. The Ml stood at $20.5 billion inJanuary 1922, then rose to $26.2 billion fouryears later (September 1925), approximatelythe same level recorded for September 1929.Ml and M3 also grew at slower rates after1926. Beginning in 1925, and picking upsteam in late 1927, however, trading volumeand value on the New York Stock Exchangebegan to rise to historically unprecedentedlevels. Confronted by pressure at the dis-count window to provide more reserves, the
32See Friedman and Schwartz (1963, Chart 16, p.197). The resolution is that transactions velocity, whichwas not proportional to income velocity, rose quitedramatically toward the end of the decade, as one mighthave expected. This emphasis on the potential influenceof fluctuations in the transactions-income ratio may alsoprovide insight into a current macroeconomic issue.Many macroeconomists are puzzled by why velocity hasgrown so slowly since 1981, more slowly than periods inthe 1970's characterized by nominal interest rates in thesame range (see Wall Street Journal, May 24,1983). Theproblem again may be that income velocity is not theright variable. The April 1983 Federal Reserve Bulletin(p. A-16) indicated that between 1980 and 1982, debit-deposit ratios in all insured banks rose from 198.7 to324.2, a 63 percent increase in the space of two years. Asof February 1983, that figure had risen even further, to361.3. This evidence suggests that the demand to holdcash balances for transactions purposes may be higherthan policymakers would normally expect, given currentlevels of real output and interest rates, perhaps explain-ing policymakers' tolerance of a money growth rateexceeding 12 percent (at an annualized rate) in the firsthalf of 1983.
33 In a recent discussion of this episode Peter Teminbriefly entertained the possibility that the "increasedvolume of activity on the New York Stock Exchangerequired an increased quantity of money for transac-tions purposes..." before rejecting it on the groundsthat "it is hard to believe [transactions demand] rosevery much" (1976 p. 154).
Digitized for FRASER http://fraser.stlouisfed.org/ Federal Reserve Bank of St. Louis
VOL. 74 NO. 1 FIELD: DEMAND FOR MONEY, 1919-29 57
Fed first tried to clamp on selective creditcontrols, threatening to refuse discount ifloans were for "speculative" purposes.34
By and large, the System viewed such loanssolely with regard to their impact on assetprices, apparently maintaining that assetprices, like goods prices, required a continualflow of expenditures to sustain them. Therewas little discussion of the possible roleplayed by such credit expansion in satisfying(if this paper is correct) the rise in demandfor transactions balances associated with theunprecedented rise in the volume of financialtransactions, an accomodation that wasessential if such trading volumes were tocontinue along with normal GNP relatedtransactions. Eventually, the System de-termined that selective controls were arbi-trary and discriminatory, and permitted in-terest rates to rise to very high levels—theonly course of action (outside of major in-stitutional changes) consistent with maintain-ing a policy of virtually no annual growth inMl in the last three years of the decade.
Some corporations benefited from the abil-ity to raise long-term expansion capitalcheaply in the inflated stock market. Butmany other firms and households began tocurtail their investment and consumption de-mand, especially that for consumer durablessuch as automobiles,35 thus helping to pre-cipitate the downturn in real GNP signifiedby the drop in industrial output starting inAugust. It is reasonable to believe that partof this decline was in response to the veryhigh prevailing interest rates. The persistenceof those rates, in turn, can be linked to theSystem's failure to understand the contribu-tion of the rising volume and value of stock
34Friedman and Schwartz (1963, pp. 254-66).35See Temin (pp. 64; 171-72) for a discussion of the
importance of consumption declines in 1930. However,Temin attributes the decline in consumption to theeffect of the stock market crash on household wealth.Yet seasonally adjusted automobile production peakedin June 1929, several months before the crash. I attri-bute part of the decline in consumer durables produc-tion and consumption, as well as the failure of construc-tion to continue to recover after mid-1928, to the tightercredit conditions associated with the Fed's antispecula-tive policies. See Survey of Current Business (January1930, pp. 2-3, 7, 12, 17, 49, 65). For a more extensivediscussion, see my 1984 article.
trading to the transactions demand for mon-ey.36 It was in this sense, and really in thissense alone, that one can speak of stockmarket speculation absorbing cash balances,thereby adversely affecting the real side ofthe economy.
36 This argument does not deny the possibility thatautonomous forces were generating concurrent contrac-tionary shifts in the IS schedule. Nevertheless, high realinterest rates prevailing in 1928-29 do suggest that thedeflationary impulse came primarily from movements inthe LM not the IS schedule.
REFERENCES
Baumol, William J., "The Transactions De-mand for Cash: An Inventory TheoreticApproach," Quarterly Journal of Econom-ics, November 1952, 66, 545-56.
Beach, Charles M. and MacKinnon, James G., "AMaximum Likelihood Procedure for Re-gression with Autocorrelated Errors,"Econometrica, January 1978, 46, 51-88.
Beckerath, Herbert von, Kapitalmarkt undGeldmarkt, Jena: G. Fischer, 1916.
Cooley, Thomas F. and Leroy, Stephen F.,"Identification and Estimation of MoneyDemand," American Economic Review,December 1981, 71, 825-44.
Enzler, Jacob, Johnson, Lewis and Paulus, John,"Some Problems of Money Demand,"Brookings Papers on Economic Activity,1:1976, 261-80.
Fair, Ray C, "The Estimation of Simulta-neous Equation Models with Lagged En-dogenous Variables and First Order Seri-ally Correlated Errors," Econometrica,May 1970, 38, 507-16.
Feige, E. L. and Pearce, D. K., "The CasualCausal Relationship Between Money andIncome: Some Caveats for Time SeriesAnalysis," Review of Economics and Statis-tics, November 1979, 61, 521-33.
Field, Alexander J., "Price and Quantity Ad-justment in the Treatise on Money," work-ing paper, University of Santa Clara, 1983.
, "A New Interpretation of the Onsetof the Great Depression," Journal of Eco-nomic History, June 1984, 44, forthcoming.
Fisher, Irving, The Purchasing Power of Mon-ey: Its Determination and Relation to Credit,
Digitized for FRASER http://fraser.stlouisfed.org/ Federal Reserve Bank of St. Louis
58 THE AMERICAN ECONOMIC REVIEW MARCH 1984
Interest and Prices, New York: Macmillan,1911.
Friedman, Milton, Studies in the Quantity The-ory of Money, Chicago: University ofChicago Press, 1956.
, "Interest Rates and the Demand forMoney," Journal of Law and Economics,October 1966, 9, 71-85.
and Schwartz, Anna J., A Monetary
The Applied Theory of Money, London:MacMillan, 1934.
_, The General Theory of Employment,
History of the United States, 1867-1960,Princeton: Princeton University Press,1963.
and , Monetary Trends in theUnited States and the United Kingdom:Their Relation to Income, Prices and Inter-est Rates, 1867-1975, Chicago: Universityof Chicago Press, 1982.
Garvy, George and Blyn, Martin R., The Velocityof Money, New York: Federal ReserveBank of New York, 1969.
Goldfeld, Steven M., "The Demand for MoneyRevisited," Brookings Papers on EconomicActivity, 3:1973, 577-638.
, "The Case of the Missing Money,"Brookings Papers on Economic Activity,3:1976, 683-730.
Gordon, Robert J., Milton Friedman's Mone-tary Framework: A Debate with his Critics,Chicago: University of Chicago Press,1974.
Granger, C. W. J., "Investigating Causal Rela-tions by Econometric Methods and Cross-Spectral Methods," Econometrica, July1969, 37, 424-38.
Hansen, Alvin, Monetary Theory and FiscalPolicy, New York: McGraw-Hill, 1949.
Hardy, Charles O., Credit Policies of the FederalReserve System, Washington: The Brook-ings Institution, 1932.
Harris, Seymour E., Twenty Years of FederalReserve Policy, Including an Extended Dis-cussion of the Monetary Crisis, 1927-1933,Vol. 2: The Monetary Crisis, Cambridge:Harvard University Press, 1933.
Keynes, John Maynard, "Is There Inflation inthe United States?," (1928), in DonaldMoggridge, ed., The Collected Writings ofJohn Maynard Keynes, Vol. XIII: The Gen-eral Theory and After, Part I, Preparation,London: Macmillan, 1973, 52-76.
,A Treatise on Money in Two Volumes,Vol. I: The Pure Theory Of Money, Vol. II:
Interest and Money, New York: HarcourtBrace, 1964.
Laidler, David, "Some Evidence on the De-mand for Money," Journal of PoliticalEconomy, February 1966, 74, 55-68.
, The Demand for Money: Theoriesand Evidence, 2d ed., New York: Dun-Donneley, 1977.
Lieberman, Charles, "The Transactions De-mand for Money and TechnologicalChange," Review of Economics and Statis-tics, August 1977, 59, 307-17.
, "A Transactions vs. Asset DemandApproach to the Empirical Definition ofMoney," Economic Inquiry, April 1979,18,237-53.
McKinnon, Ronald, "Currency Substitutionand Instability in the World Dollar Stan-dard," American Economic Review, June1982, 72, 320-32.
Machlup, Fritz, The Stock Market, Credit andCapital Formation, trans, by Vera C. Smith,Borsenkredit, Industriekredit and Kapital-bildung, 1931, New York: Macmillan,1940.
Modigliani, Franco, Rasche, Robert and Cooper,J. P., "Central Bank Policy, the MoneySupply and the Short Term Rate of Inter-est," Journal of Money, Credit and Bank-ing, May 1970, 2, 166-218.
Owens, Richard N. and Hardy, Charles O., Inter-est Rates and Stock Speculation, New York:Macmillan, 1925.
Reed, Harold L., Federal Reserve Policy,1921-1930, New York: McGraw-Hill,1930.
Reisch, Richard, " Ruckwirkungen der Borsen-spekulation auf den Kreditmarkt," Zeit-schrift fur Nationalokonomie, 1929, I, 205-21.
Rogers, James H., Stock Speculation and theMoney Market, Columbia: Lucas Bros.,1927.
Scitovsky, Tibor, Money and the Balance ofPayments, Chicago: Rand McNally, 1969.
Selden, Richard T., "Money: Velocity of Cir-culation," in International Encyclopedia ofthe Social Sciences, New York: Macmillan,1968.
Digitized for FRASER http://fraser.stlouisfed.org/ Federal Reserve Bank of St. Louis

VOL. 74 NO. 1 FIELD: DEMAND FOR MONEY, 1919-29 59
Temin, Peter, Did Monetary Forces Cause theGreat Depression?, New York: Norton,1976.
Tobin, James, "The Interest Elasticity ofTransactions Demand for Cash," Reviewof Economics and Statistics, August 1956,38, 241-47.
, "Liquidity Preference as BehaviorToward Risk," Review of Economic Stud-ies, February 1958, 25, 65-86.
Warburton, Clark, "The Volume of Moneyand the Price Level Between World Wars,"Journal of Political Economy, June 1945,54, 153-64.
Federal Reserve System, Federal Reserve Bulle-tin, April 1983, Washington: PublicationsServices.
, (1976a) Banking and Monetary Sta-
tistics, 1914-1941, Washington: Publi-cations Services, 1976.
_, (1976b) Industrial Production, 1976Revision, Washington: Publications Ser-vices, 1976.
U.S. Bureau of the Census, Historical Statisticsof the United States, Colonial Times to1970, Washington: USGPO, 1975.
U.S. Department of Commerce, Survey of Cur-rent Business, February 1930, 10; Septem-ber 1940, 20.
U.S. House of Representatives, Federal ReserveAct of 1913, with Amendments and LawsRelating to Banking, Washington: USGPO,1966.
Wall Street Journal, August 17, 1981, p. 20;"Velocity Throws the Money Men aCurve," May 24, 1983.
Digitized for FRASER http://fraser.stlouisfed.org/ Federal Reserve Bank of St. Louis