Asset & Financial Management Strategies & Plans 11 October ...
56
Asset & Financial Management Strategies & Plans 11 October 2018 Annexure 7 - C1 - October 2018
Transcript of Asset & Financial Management Strategies & Plans 11 October ...
Asset & Financial Management Strategies & Plans
11 October 2018
Annexure 7 - C1 - October 2018

Annexure 7 - C1 - October 2018
Asset & Financial Management Strategies & Plans – October 2018 Page 1
Contents
Introduction ............................................................................................................................................................... 1
Executive Summary ................................................................................................................................................. 2
PART 1
Long-Term Financial Management Strategy Plan & Policies .................................................................... 3
1 Strategic Plan ............................................................................................................................................... 3
2 Annual Plan ................................................................................................................................................... 4
3 Interpretation .............................................................................................................................................. 5
4 Classes of Assets ......................................................................................................................................... 5
5 Long-Term Financial Management Plan ............................................................................................. 7
6 Financial Management Strategy ........................................................................................................ 23
PART 2
Long Term Asset Management Strategies Plans & Policies ................................................................... 30
7 Asset Management Plan ....................................................................................................................... 30
7.1 Overview of the Asset Management Plan: ............................................................................ 31
7.2 Roads .................................................................................................................................................. 33
7.3 Buildings & Facilities ..................................................................................................................... 34
7.4 Waste Management Program .................................................................................................... 35
7.5 Plant and Machinery ..................................................................................................................... 37
7.6 Land – Council owned Land ........................................................................................................ 37
7.7 Airport Infrastructure ................................................................................................................... 37
7.8 Summary of the 20-year Capital program at Budget 2019 ............................................. 38
8 Asset Management Policy .................................................................................................................... 41
8.1 Principles ........................................................................................................................................... 41
8.2 Accounting Policies for Property Plant and Infrastructure: ............................................ 43
9 Asset Management Strategy ............................................................................................................... 46
PART 3
Budget 2019 Commentary in Context to the Long-Term Financial & Asset Management Strategies ................................................................................................................................................................. 47
10 2019 Budget & Rating Commentary ............................................................................................ 47
10.1 Background ...................................................................................................................................... 47
10.2 Current Situation............................................................................................................................ 50
10.3 Budget 19 Documents: ................................................................................................................. 51
References ............................................................................................................................................................... 52
Annexure 7 - C1 - October 2018

Asset & Financial Management Strategies & Plans – October 2018 Page 1
Introduction
Under the Local Government Act 1993, Councils have a range of functions and powers including but not limited to the following: S20(1) (a) to provide for the health, safety and welfare of the community (b) to represent and promote the interests of the community (c) to provide for peace, order and good government of the municipal area In terms of achieving these and other objectives, Council is required to develop a range of strategic and operational plans that underpin the operations of the Council the importance of which should not be underestimated.
S68 Strategic Plan Section 1 S70 Long Term Financial Management Plan Section 5 S70A Financial Management Strategies Section 6 S70B Long-term Strategic Asset Management Plan Section 7 S70C Asset Management Policies Section 8 S70D Asset Management Strategies Section 9 S71 Annual Plan Section 1 S82 Estimate (Budget & Rating Strategy Section 3
This document assists in setting the framework for the Budget Estimates of Council’s revenue and expenditure, and aims to explain the rationale, context and overall operational philosophy underpinning Flinders Council’s plans and strategies. It provides analysis of past operations and future predictions leading to the eventual adoption of future budgets and annual business plans. The document has been prepared in three (3) basic parts as follows:
PART1 Long Term Financial Management Strategy Plan & Policies
PART 2 Long Term Asset Management Strategies Plans & Policies
PART 3 Budget Commentary in Context to the Long Term Financial & Asset Management Strategies
The Format of this document has been also prepared to highlight the “legislative” the provisions of the Local Government Act 1993 as expressed through the Local Government (Content and Strategies Order) 2014. Each Section of these orders corresponds to the relevant heading within the document. The applicable requirements under the Order are shown in Blue Text, with the strategy outputs
is in black text.
Annexure 7 - C1 - October 2018
Asset & Financial Management Strategies & Plans – October 2018 Page 2
Executive Summary
The Long Term Financial and Asset Management Strategy & Plans and related commentary outlined in the following document embraces fundamental principles and assumptions to enable a credible financial strategy is achievable over the next 20 years. Importantly it highlights a few salient facts and challenges that recognises the structural and financial operation of Flinders Council and the Furneaux Islands generally is significantly disadvantaged due to our remoteness as we are not connected to land, are made up of some 52 islands and have a very small population and rate base relative to our size and population. This is particular highlighted with respect to the long-term funding of Councils Airport Runway which significantly influences and challenges Councils operation that takes away from being able to fund a number of traditional local government services. Guiding Principles The main guiding principles to measure the credibility of the Financial Strategy are:
• Meeting the minimum Net Cash reserve which has been set at $1.7million in the 2019 Budget. The minimum reserve uses the depreciation level to determine future years requirements. This is the key ratio to ensure that Council can meet its Operational and Capital requirements.
• Council’s ability to achieve a Low Risk Underlying Surplus within a reasonable timeframe. This measure is used to determine the Council’s future sustainability, and its ability to remain autonomous
Assumptions The main assumptions that are pivotal to the achievement of the strategies are:
• Maintaining the lowest most efficient operational costs. Costs and income have only been subject to a 2 % inflation, and the future forecasts have assumed that costs will be maintained without additional increases
• The 20-year Capital Program has been kept to the basic minimal needs. Larger programs such as Safe Harbour, General Infrastructure and the Construction of New Roads have not been included in this strategy, and future inclusion should only be considered if the capital projects can generate sufficient income to cover the full operational cost (including depreciation).
• Additional Income has been factored into the Financial Modelling:
Rate Increases – 2019 9%, 2020 10%, 2021 7.5%, 2022 onwards 5%
User Fees Increase - $20k a year from 2019 onwards – initiatives have been identified in the 2019 Budget to deliver this income
Airport Passenger increases - $ 1 each year from 2020 onwards
Additional $210k a year other revenue from the Airport. The strategy has identified that due to the large capital requirements for the Airport Runway of $1.8million in year 2022, an additional income of $210k will need to be derived from future initiatives (not identified in this strategy) to ensure the viability of the Airport.
Overall these plans and strategies represents the minimum prudent approach that can achieve Council’s strategic outcomes and ensures that Council remains financially viable in the long term.
Annexure 7 - C1 - October 2018
Asset & Financial Management Strategies & Plans – October 2018 Page 3
PART 1
Long-Term Financial Management Strategy Plan & Policies
1 Strategic Plan
Council’s Strategic Plan was adopted following public consultation in September 2015. Under the Act it needs to be reviewed at least every 4 years, however, a Council may decide if it wishes, to adopt a rolling review. The next review is due early 2019, following the 2018 October council elections. Council has identified 5 main Strategic Priorities:
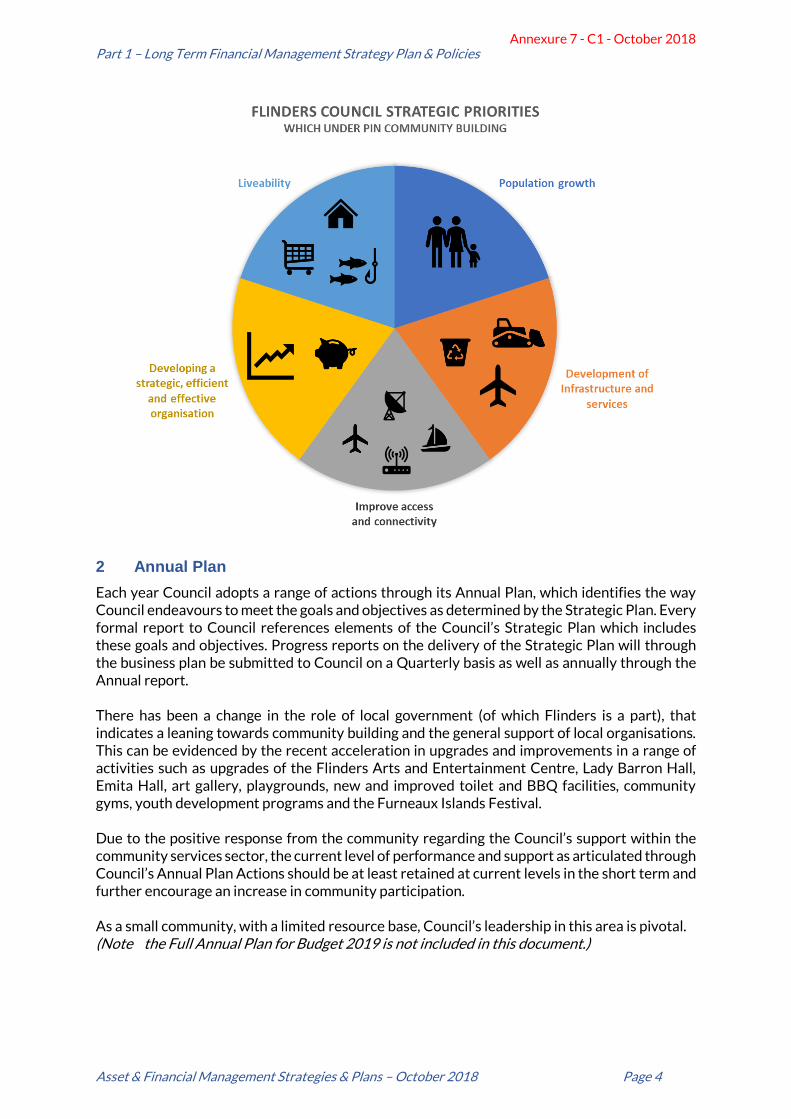
1 Population growth – focusing on strategies, projects and policy initiatives that support the community, assist in the economic development and address investment attraction.
2 Development of Infrastructure and services – placed base approach to planning and delivery to ensure community and environmental values are maintained.
(A place-based approach targets an entire community and aims to address issues that exist at the neighbourhood level, such as poor housing, social isolation, poor or fragmented service provision that leads to gaps or duplication of effort and limited economic opportunities. Several recent authors have recommended that “sense of place” should become an important concept in our evaluation of environmental policies.)
3 Improve access and connectivity – work with service providers and other relevant stakeholders to improve security and reliability of access and connectivity in a cost-effective manner.
4 Developing a strategic, efficient and effective organisation – to have the ability to respond to risks and opportunities.
5 Liveability – to protect, improve and promote the safety, creativity, health and wellbeing of the Islands’ communities.
The above Strategic Objectives encompasses the Council’s overarching philosophy which is Community Building and the improvement of infrastructure. As evidenced by the following extract, the nature of Council’s Strategic Plan is not dissimilar to most Councils who all focus on community building. An Extract from the Northern Tasmanian Council Shared Services Study – Final Report July 2017: Seven Strategic priorities have been identified in the northern council’s Strategic Plans in terms of commonality. The main strategic priority that appears in each council’s strategic plan is community building. Community building in the sense of creating a community that is liveable and engaging. The second most common priority is infrastructure in terms of improvement and upgrades for various purposes such as public transport or industry etc. Environment planning is the next most common priority of the councils. Environment planning includes environment conservation, adopting sustainable practices in service delivery and the mitigating effect of climate change”
Annexure 7 - C1 - October 2018
Part 1 – Long Term Financial Management Strategy Plan & Policies
Asset & Financial Management Strategies & Plans – October 2018 Page 4
2 Annual Plan
Each year Council adopts a range of actions through its Annual Plan, which identifies the way Council endeavours to meet the goals and objectives as determined by the Strategic Plan. Every formal report to Council references elements of the Council’s Strategic Plan which includes these goals and objectives. Progress reports on the delivery of the Strategic Plan will through the business plan be submitted to Council on a Quarterly basis as well as annually through the Annual report. There has been a change in the role of local government (of which Flinders is a part), that indicates a leaning towards community building and the general support of local organisations. This can be evidenced by the recent acceleration in upgrades and improvements in a range of activities such as upgrades of the Flinders Arts and Entertainment Centre, Lady Barron Hall, Emita Hall, art gallery, playgrounds, new and improved toilet and BBQ facilities, community gyms, youth development programs and the Furneaux Islands Festival. Due to the positive response from the community regarding the Council’s support within the community services sector, the current level of performance and support as articulated through Council’s Annual Plan Actions should be at least retained at current levels in the short term and further encourage an increase in community participation. As a small community, with a limited resource base, Council’s leadership in this area is pivotal. (Note the Full Annual Plan for Budget 2019 is not included in this document.)
Annexure 7 - C1 - October 2018
Part 1 – Long Term Financial Management Strategy Plan & Policies
Asset & Financial Management Strategies & Plans – October 2018 Page 5
3 Interpretation
The following legislative aspects associated with the are to be considered within the Local Government (Content and Strategies Order) 2014
S3(1) In this Order:
AASB 101 means the AASB 101 – Presentation of Financial Statements
(a) Published by the Australian Accounting Standards Board, as appointed by the Financial Reporting Council of the Commonwealth; and
(b) As amended or substituted from time to time;
Act means the local Government Act 1993;
comprehensive income has the same meaning as other comprehensive income in the AASB 101,
comprehensive result has the same meaning as total comprehensive income in the AASB 101;
relevant asset means an asset within a class of assets specified in clause 4
underlying surplus or deficit means an amount that is the recurrent income (not including income received specifically for new or upgraded assets, physical resources received free of charge or other income of a capital nature) of a council for a financial year less the recurrent expenses of the council for the financial year.
The Comprehensive Income and result includes asset revaluations/revaluation adjustments, and profit from the sale of assets. The Budget 2019 has $30k in for the Income of Sale of assets, but in future years there is no prediction for sale of assets and revaluations, as this area is too unpredictable. S3(2) The Acts Interpretation Act 1931 applies to the interpretation of this order as if it were by-
laws.
4 Classes of Assets
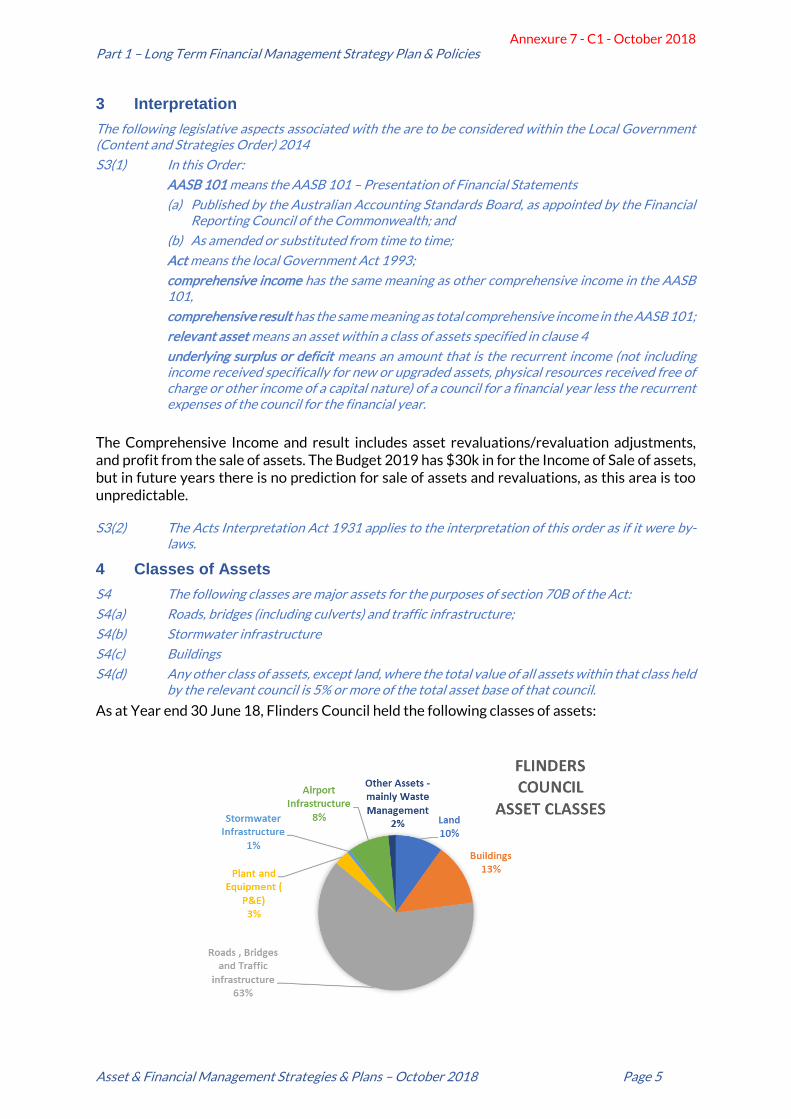
S4 The following classes are major assets for the purposes of section 70B of the Act:
S4(a) Roads, bridges (including culverts) and traffic infrastructure;
S4(b) Stormwater infrastructure
S4(c) Buildings
S4(d) Any other class of assets, except land, where the total value of all assets within that class held by the relevant council is 5% or more of the total asset base of that council.
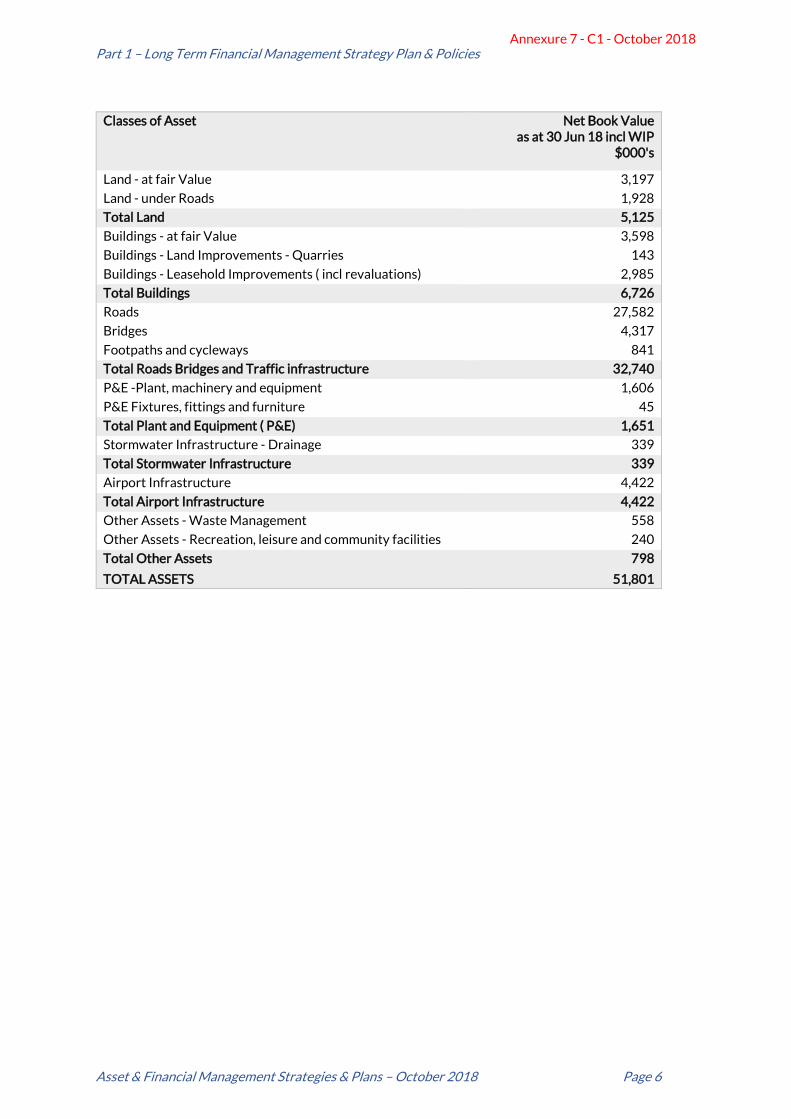
As at Year end 30 June 18, Flinders Council held the following classes of assets:
Annexure 7 - C1 - October 2018
Part 1 – Long Term Financial Management Strategy Plan & Policies
Asset & Financial Management Strategies & Plans – October 2018 Page 6
Classes of Asset Net Book Value
as at 30 Jun 18 incl WIP $000's
Land - at fair Value 3,197
Land - under Roads 1,928
Total Land 5,125
Buildings - at fair Value 3,598
Buildings - Land Improvements - Quarries 143
Buildings - Leasehold Improvements ( incl revaluations) 2,985
Total Buildings 6,726
Roads 27,582
Bridges 4,317
Footpaths and cycleways 841
Total Roads Bridges and Traffic infrastructure 32,740
P&E -Plant, machinery and equipment 1,606
P&E Fixtures, fittings and furniture 45
Total Plant and Equipment ( P&E) 1,651
Stormwater Infrastructure - Drainage 339
Total Stormwater Infrastructure 339
Airport Infrastructure 4,422
Total Airport Infrastructure 4,422
Other Assets - Waste Management 558
Other Assets - Recreation, leisure and community facilities 240
Total Other Assets 798
TOTAL ASSETS 51,801
Annexure 7 - C1 - October 2018
Part 1 – Long Term Financial Management Strategy Plan & Policies
Asset & Financial Management Strategies & Plans – October 2018 Page 7
5 Long-Term Financial Management Plan
S5(1) In this clause – long-term financial management plan of a council, means a long-term financial management plan prepared by the council in accordance with section 70 of the Act.
S5(2) A long-term financial management plan of a council is required to include the following matters:
S5(2)(a) The estimated revenues and expenses for each financial year of the plan, including the revenues and expenses in relation to each of the following matters:
(i) all capital works;
(ii) all capital expenditure;
(iii) all asset management requirements identified as required under clause 7(2)(b) in the long-term strategic asset management plan;
The Long-term Financial plan has been divided into three segments:
• Total Council Income and Expenditure 20-year forecast
• Airport Income and Expenditure 20-year forecast
• Municipal Income and Expenditure 20-year forecast
The Long-Term Financial Plan was prepared in conjunction with and as part of preparing the 2018/19 Budget. Significant work has been undertaken in preparing a Long-Term Asset Management Plan (Section 7), which plays a significant part of the Long-Term Financial Plan and provides a framework to enable an assessment of the Councils revenue resources and assists the Council to plan and fund operational and capital expenditures. The Act requirements as indicated in blue text, is the framework for the long-term financial management plan. The current long-term financial strategy, though not fully complete as required under the relevant Ministerial Orders, nevertheless, provides a sound way forward as it highlights how Council’s cash position is to be managed and identifies the challenges to meet future sustainability. Each section has been reviewed, and where an area has not been addressed by this report, it has been noted. This section has been completed. Reservation however is made on the term “all capital works and expenditure” in so far as the work carried out has sought to review to the best of our ability the main categories, and though significant work has been undertaken, there may be areas that we have not identified.
S5(2)(b) For each financial year of the plan, a statement of comprehensive income, including estimates of –
(i) Recurrent revenue; and
(ii) Recurrent expenses; and
(iii) Underlying surplus or deficit; and
(iv) Net surplus or net deficit; and
(v) Comprehensive result;
The Flinders Council Long-term Financial plan has included recurrent revenue and recurrent expenses. The underlying surplus or deficit and comprehensive result has been calculated for the Budget 2019 and requires detailed forecasting of the depreciation to enable forecasting the underlying surplus or deficit, and comprehensive result for the years beyond 2019. This section is completed as fpllows:
Annexure 7 - C1 - October 2018
Part 1 – Long Term Financial Management Strategy Plan & Policies
Asset & Financial Management Strategies & Plans – October 2018 Page 8
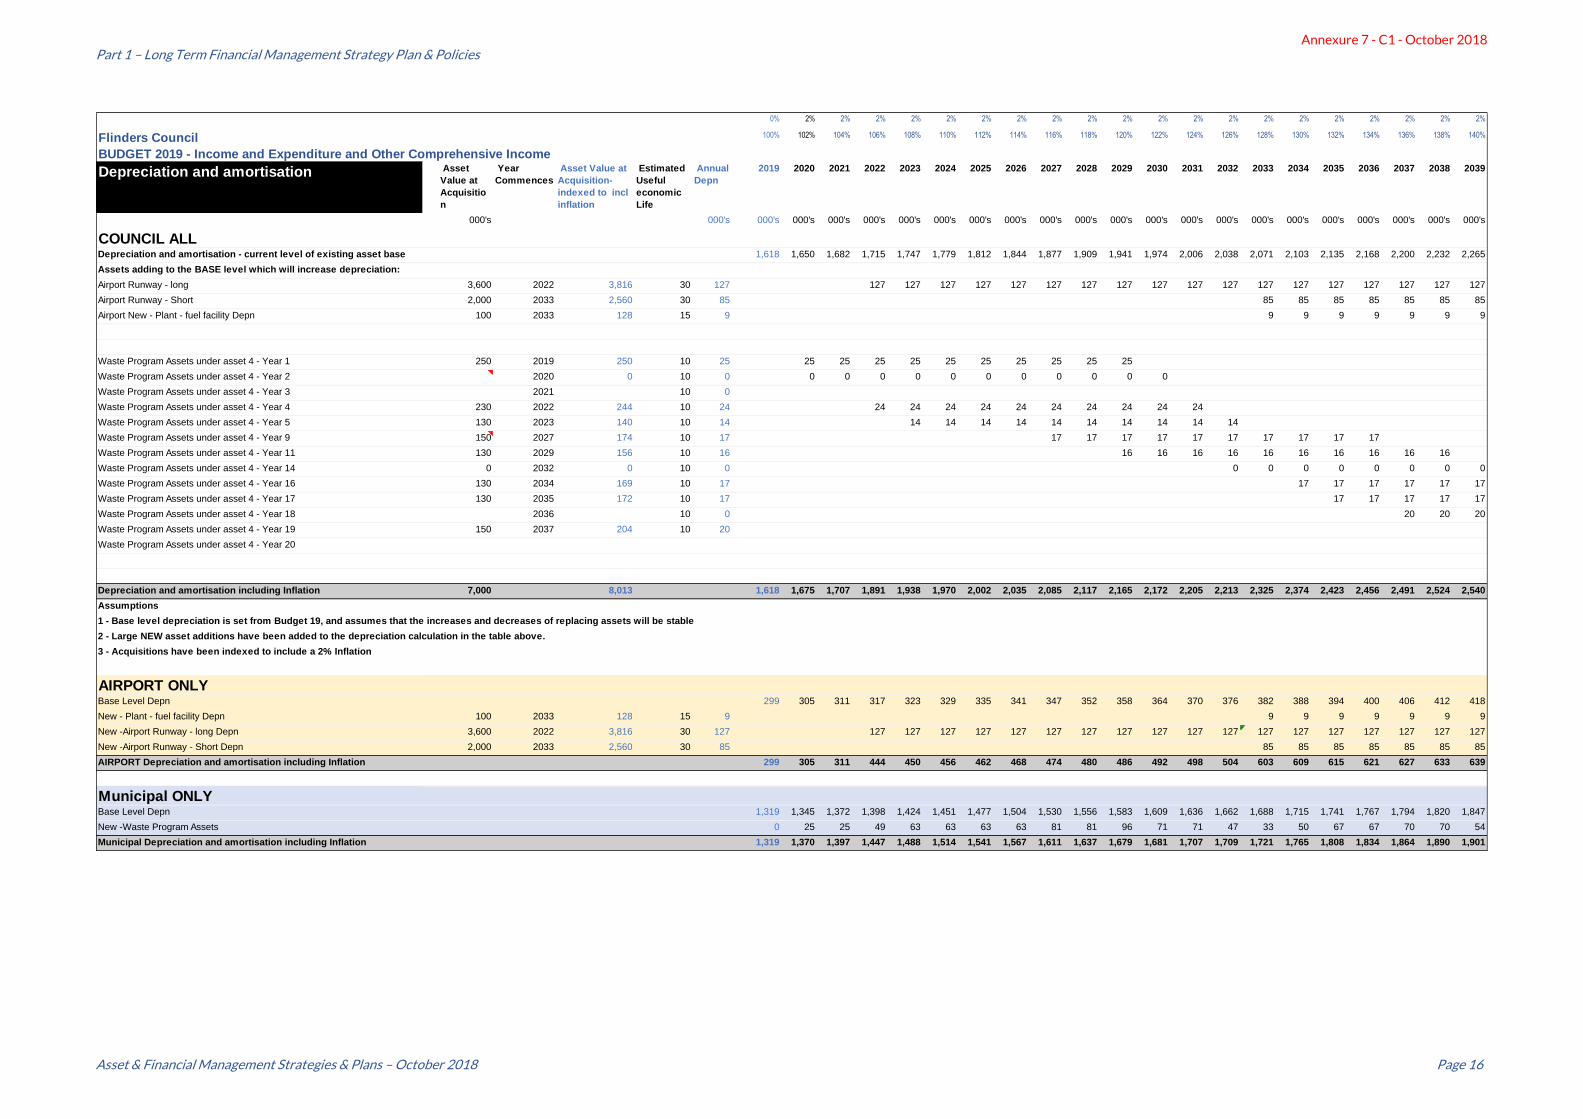
The depreciation prediction has applied the following assumptions:
• Base level of depreciation: For this strategy the prediction of depreciation assumes that the base level of depreciation as predicted in the Budget 2019 will continue in a stable manner, as any additional capital spent on the renewal/replacement of assets, will be off-set by the drop-off of the retired assets they replace. The only adjustment to the base depreciation is to include inflation of 2%.
• New capital assets that add to the current base: the strategy has included the larger items of additional capital within the 20-year program e.g. Airport Runway’s, Safe Harbour, General Infrastructure, Waste program, and the Roads Construction, to calculate their effect on the future depreciation.
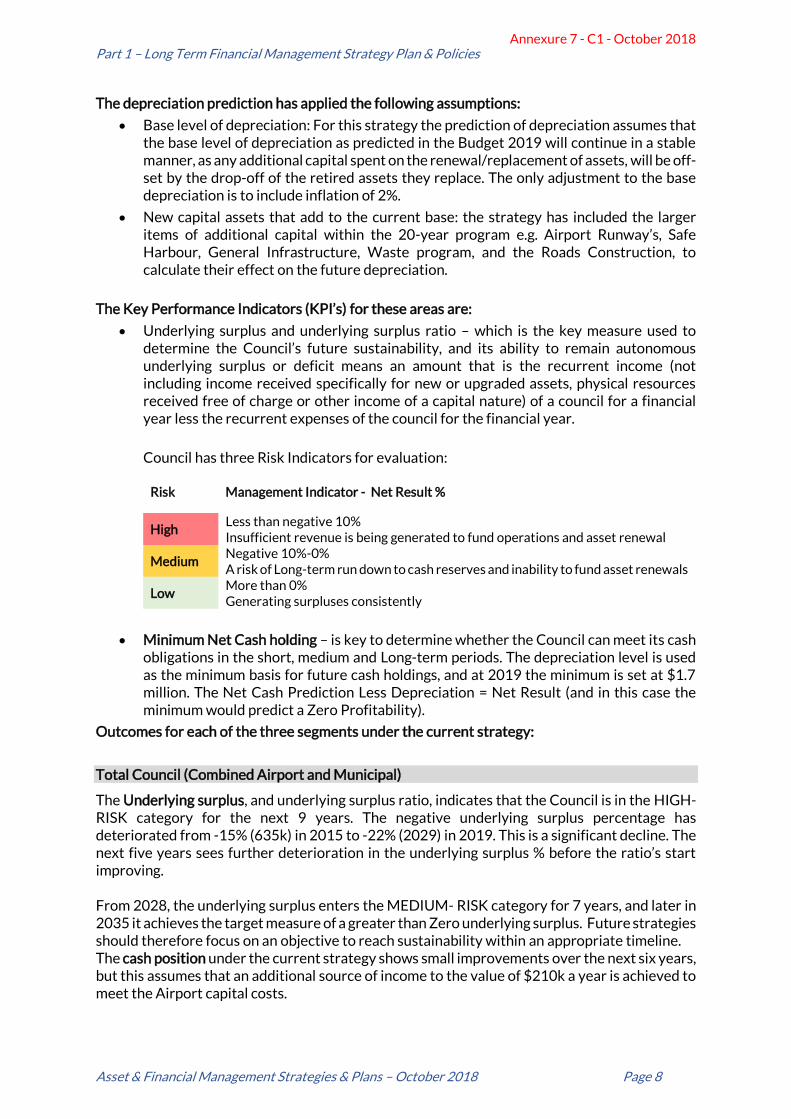
The Key Performance Indicators (KPI’s) for these areas are:
• Underlying surplus and underlying surplus ratio – which is the key measure used to determine the Council’s future sustainability, and its ability to remain autonomous underlying surplus or deficit means an amount that is the recurrent income (not including income received specifically for new or upgraded assets, physical resources received free of charge or other income of a capital nature) of a council for a financial year less the recurrent expenses of the council for the financial year.
Council has three Risk Indicators for evaluation:
Risk Management Indicator - Net Result %
High Less than negative 10% Insufficient revenue is being generated to fund operations and asset renewal
Medium Negative 10%-0% A risk of Long-term run down to cash reserves and inability to fund asset renewals
Low More than 0% Generating surpluses consistently
• Minimum Net Cash holding – is key to determine whether the Council can meet its cash obligations in the short, medium and Long-term periods. The depreciation level is used as the minimum basis for future cash holdings, and at 2019 the minimum is set at $1.7 million. The Net Cash Prediction Less Depreciation = Net Result (and in this case the minimum would predict a Zero Profitability).
Outcomes for each of the three segments under the current strategy:
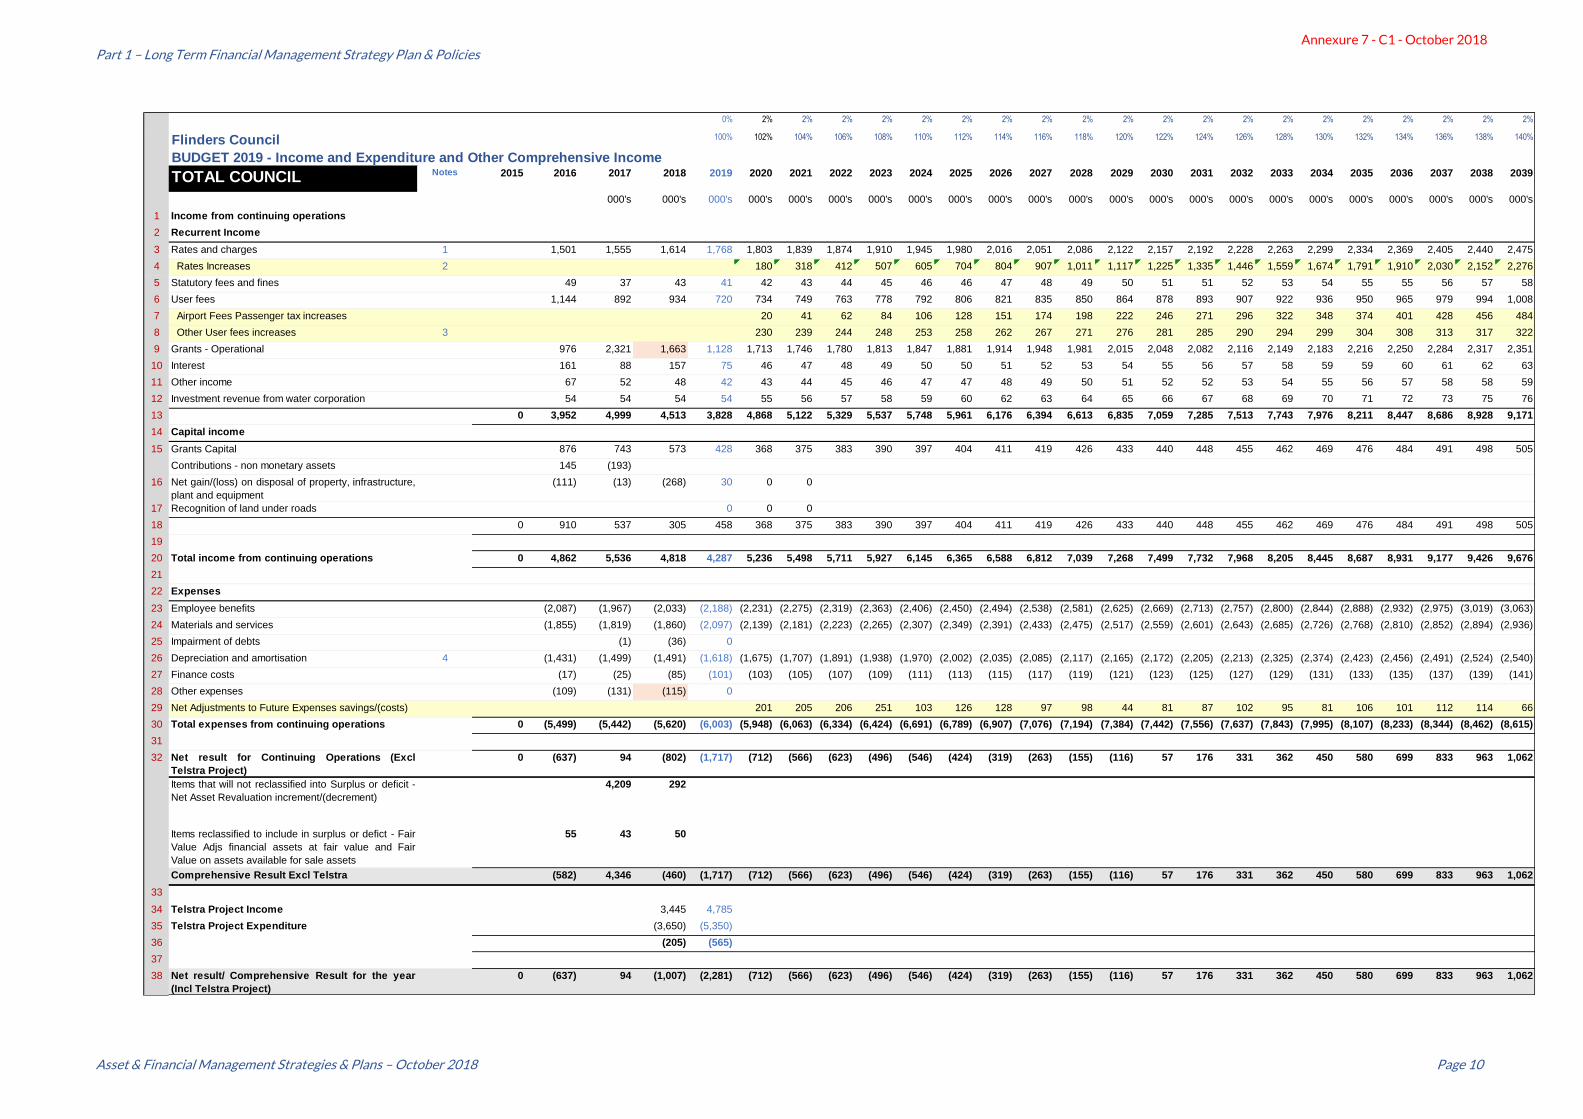
Total Council (Combined Airport and Municipal)
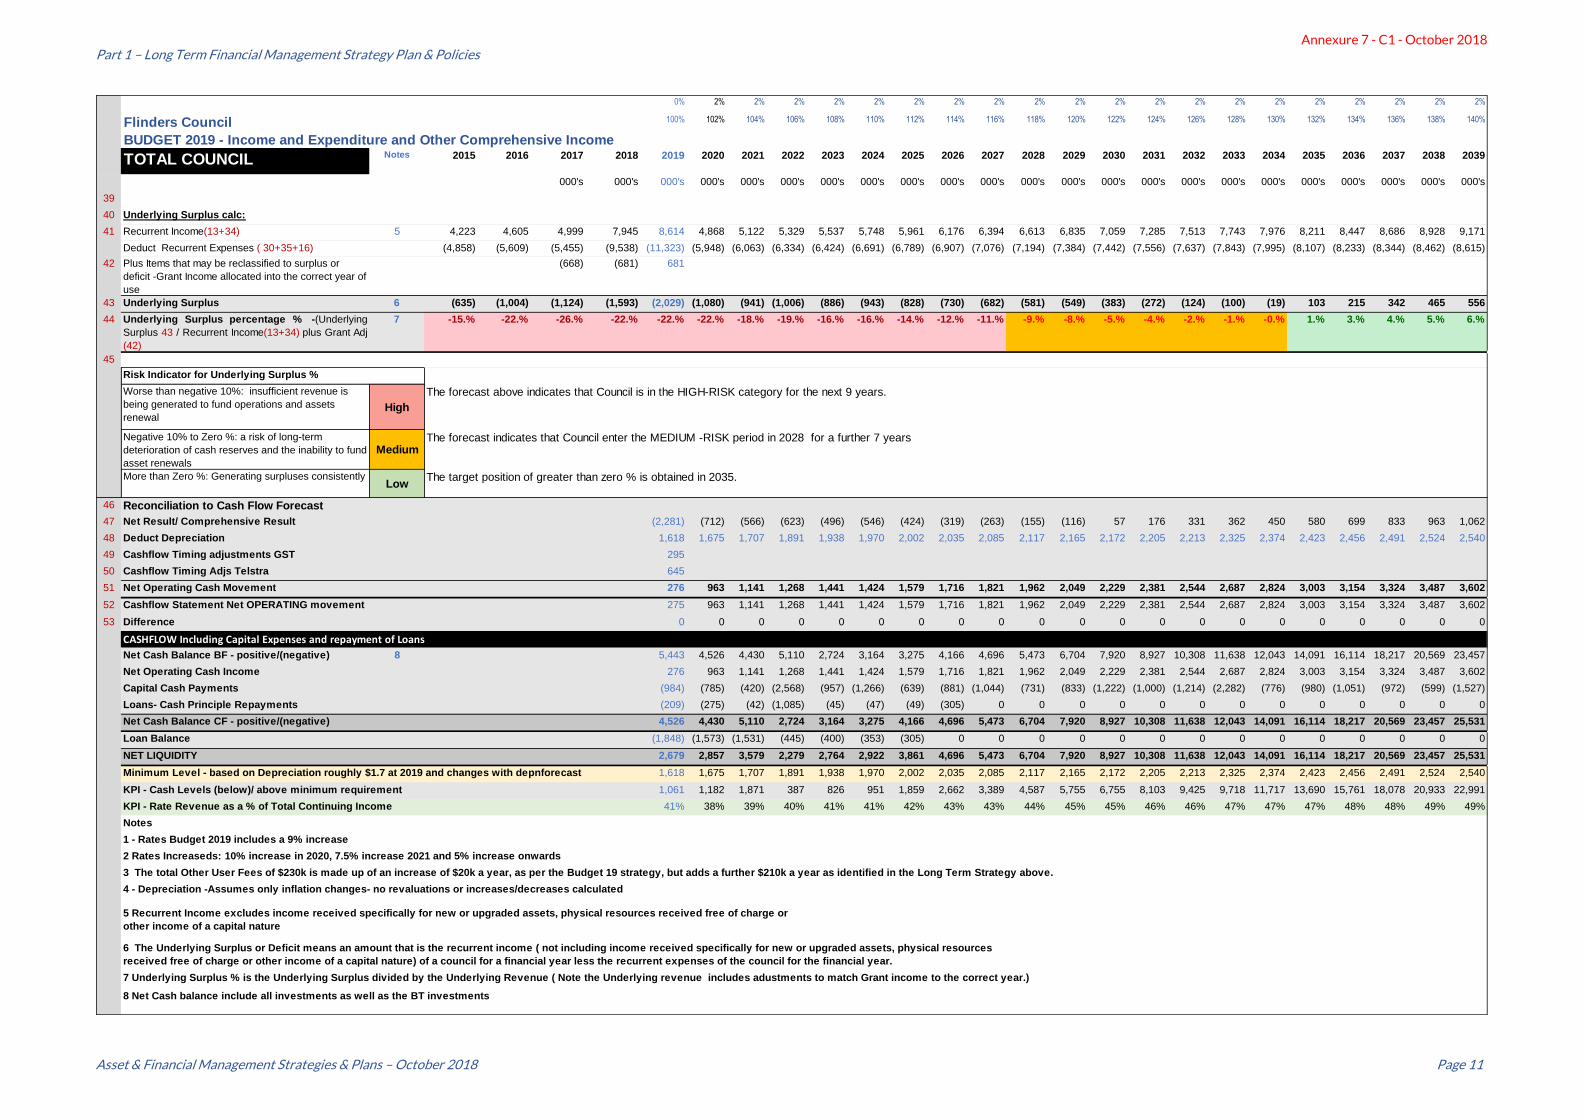
The Underlying surplus, and underlying surplus ratio, indicates that the Council is in the HIGH-RISK category for the next 9 years. The negative underlying surplus percentage has deteriorated from -15% (635k) in 2015 to -22% (2029) in 2019. This is a significant decline. The next five years sees further deterioration in the underlying surplus % before the ratio’s start improving. From 2028, the underlying surplus enters the MEDIUM- RISK category for 7 years, and later in 2035 it achieves the target measure of a greater than Zero underlying surplus. Future strategies should therefore focus on an objective to reach sustainability within an appropriate timeline. The cash position under the current strategy shows small improvements over the next six years, but this assumes that an additional source of income to the value of $210k a year is achieved to meet the Airport capital costs.
Annexure 7 - C1 - October 2018
Part 1 – Long Term Financial Management Strategy Plan & Policies
Asset & Financial Management Strategies & Plans – October 2018 Page 9
The main factors contributing to the inability to improve the underlying surplus within a short timeframe lies with these issues:
• Small Revenue base: The Council has a small revenue base and therefore a small recurrent income, but high operational costs (high recurrent expenditure) which leaves insufficient funds to manage the extensive capital program.
• Large asset carrying level: Though Flinders is a small council, it has a very large asset carrying level of $52 million. The Rates Revenue (1.7million in 2019) in ratio to the Asset Carrying is only 3%. To improve this ratio the rates income needs to significantly increase and the asset carrying needs to reduce (or a bit of both). But the current strategy as it stands aims to increase its asset base within the next 20 years and by 2039 the new carrying level is predicted to be $76 million, with an annual rates income of 2.5 million, resulting in a Rates to Asset Holding Ratio of 3%. The ratio indicates that there is some improvements over the 20-year period.
• Evaluation of Capital needs should be based on Asset Value and the Councils ability to fund future operational and capital replacements: When evaluating additional capital needs, the asset carrying level is not based on the Council’s cash contribution to the asset, but on the value of the asset at the time of acquisition. For example, the Airport Runway has a $1.8 million cost to be incurred by council (as a grant is predicted to be provided for the other $1.8 million), but the value of the asset to be maintained and replaced in future is valued at $3.6 million. As such if the useful life of the asset is 30 years, then the Council needs to ensure that there is an additional $127k cash set aside each year for a period of 30 years, to provide for replacing/renewing that asset. This is what the depreciation fund is measuring.
Based on this principle, as the Council are already struggling to meet its basic capital requirements to maintain the $52 million asset base, any new capital therefore creates an additional burden and exacerbates the problem.
Asset additions removed from the current strategic plan. The Strategic Long- Term Asset Management Plan removed the following assets from the plan in the draft version 2, as the asset additions were too large for the forecast revenue base.
Safe Harbour Project $5.5 million
General Infrastructure $1.0 million
Road Construction (3km a year) $6.2 million
The above projects will need to be considered in future strategies. The Council’s ability to fund such large projects has not been identified in this strategy, and future inclusion should only be considered if the capital projects can generate sufficient income to cover both the ongoing operational costs, including the depreciation fund.
Airport
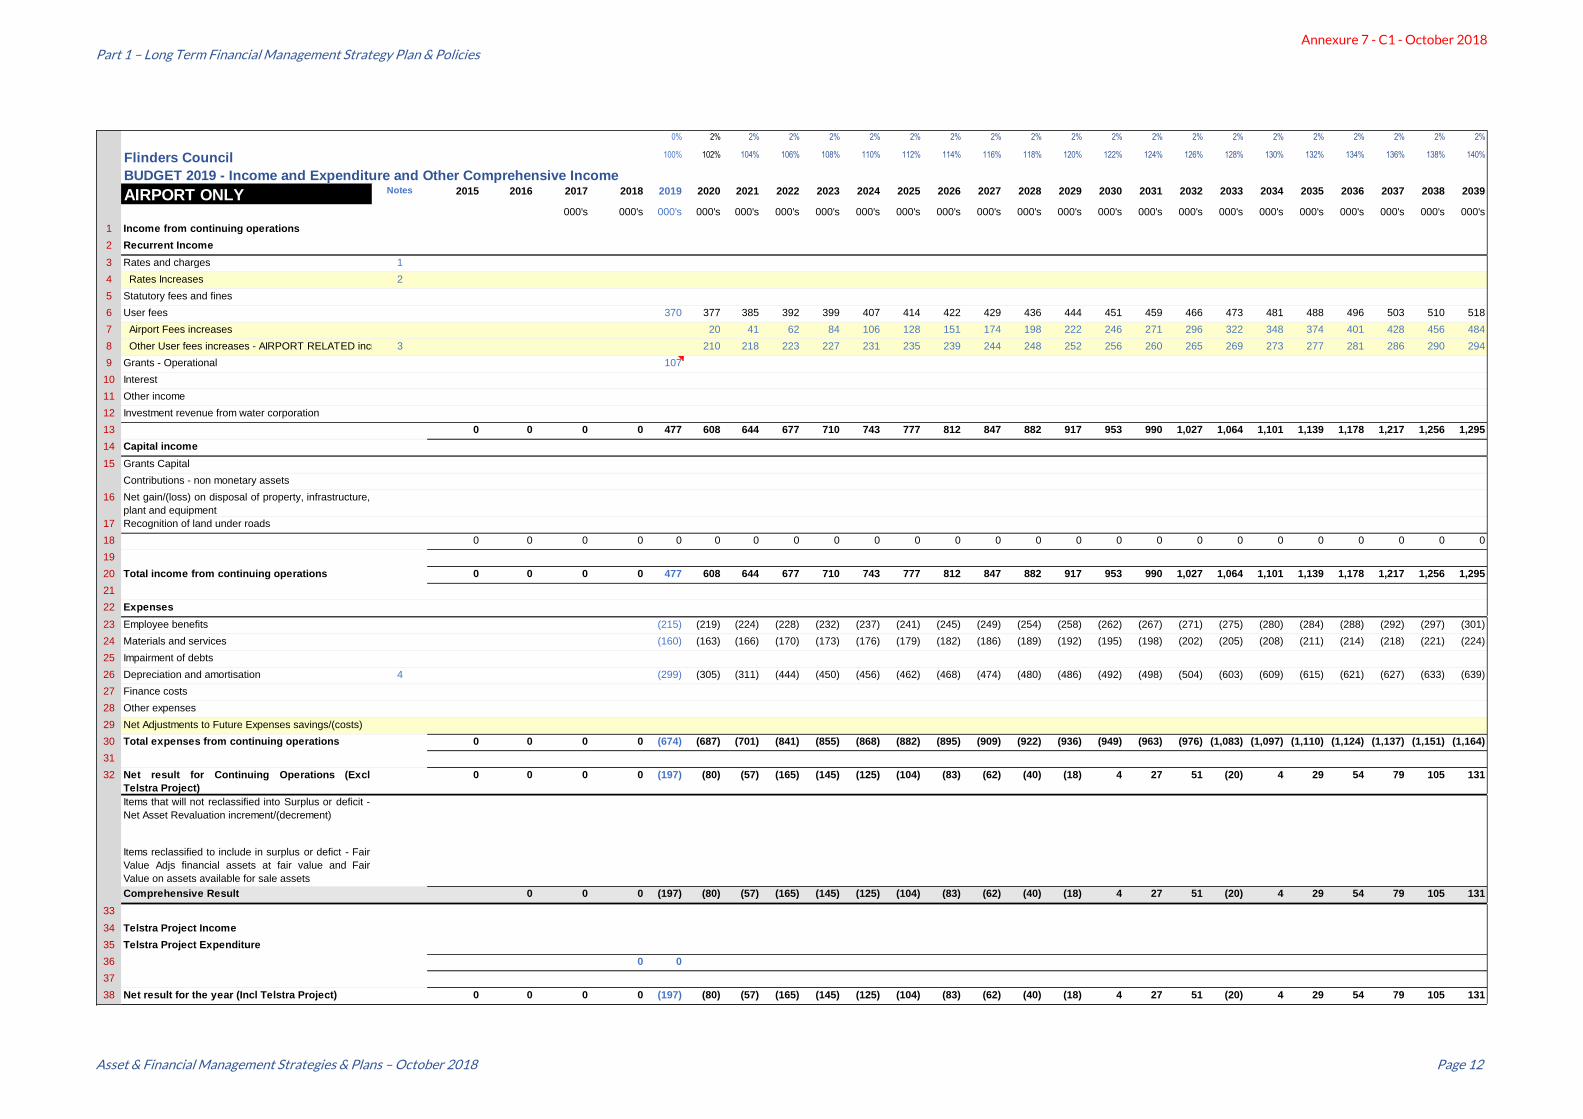
The Airport underlying surplus remains in the HIGH-RISK category for the first 8 years, and then enters the MEDIUM – RISK period for in 2017 for a further 3 years. The strategy achieves the targeted LOW-RISK under-lying surplus in 2030. The important point to note here is that the future sustainability of the airport and positive outlook presented in this strategy is hinged on the ability to achieve an additional $210k a year of Airport Income to cover the Airport Runway Capital costs. The strategy has not reviewed or identified the future possible sources of income that represent the $210k.
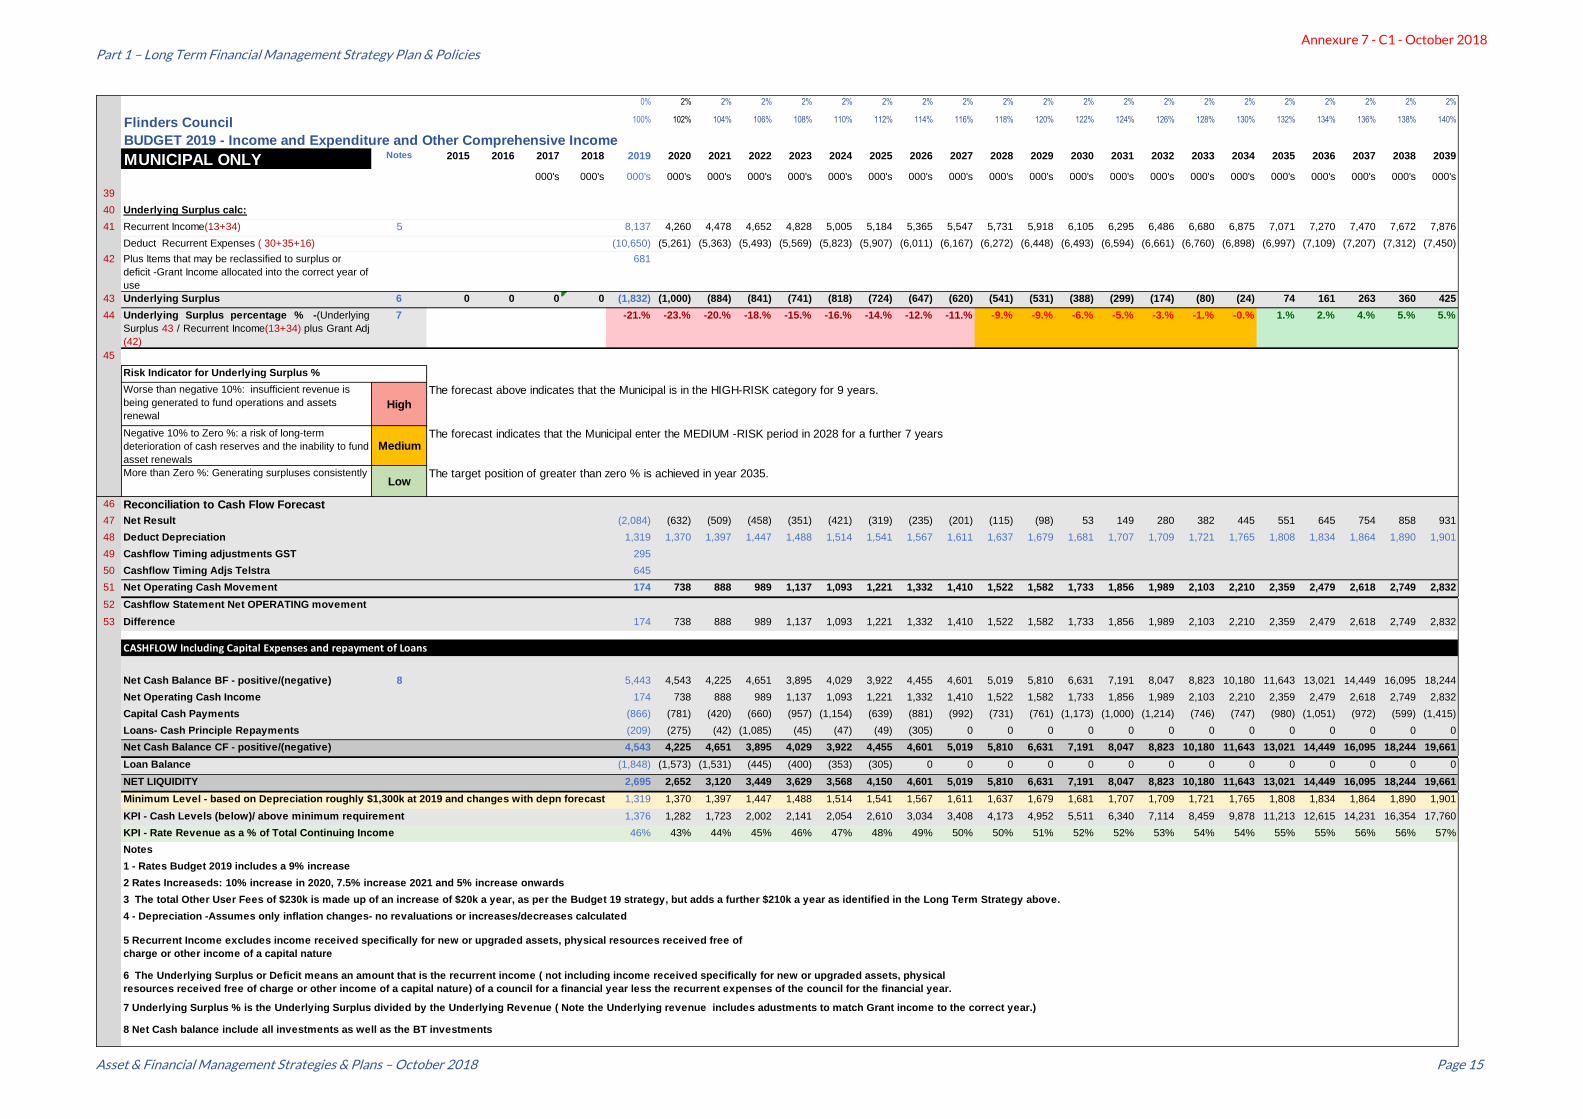
Municipal
The Municipal is in the HIGH-RISK category for 9 years, before entering the MEDIUM- RISK period in 2028 for a further 7 years. The targeted LOW-RISK status is reached very late in 2035.
Annexure 7 - C1 - October 2018
Part 1 – Long Term Financial Management Strategy Plan & Policies
Asset & Financial Management Strategies & Plans – October 2018 Page 10
0% 2% 2% 2% 2% 2% 2% 2% 2% 2% 2% 2% 2% 2% 2% 2% 2% 2% 2% 2% 2%
Flinders Council 100% 102% 104% 106% 108% 110% 112% 114% 116% 118% 120% 122% 124% 126% 128% 130% 132% 134% 136% 138% 140%
BUDGET 2019 - Income and Expenditure and Other Comprehensive Income
TOTAL COUNCIL Notes 2015 2016 2017 2018 2019 2020 2021 2022 2023 2024 2025 2026 2027 2028 2029 2030 2031 2032 2033 2034 2035 2036 2037 2038 2039
000's 000's 000's 000's 000's 000's 000's 000's 000's 000's 000's 000's 000's 000's 000's 000's 000's 000's 000's 000's 000's 000's 000's
1 Income from continuing operations
2 Recurrent Income
3 Rates and charges 1 1,501 1,555 1,614 1,768 1,803 1,839 1,874 1,910 1,945 1,980 2,016 2,051 2,086 2,122 2,157 2,192 2,228 2,263 2,299 2,334 2,369 2,405 2,440 2,475
4 Rates Increases 2 180 318 412 507 605 704 804 907 1,011 1,117 1,225 1,335 1,446 1,559 1,674 1,791 1,910 2,030 2,152 2,276
5 Statutory fees and fines 49 37 43 41 42 43 44 45 46 46 47 48 49 50 51 51 52 53 54 55 55 56 57 58
6 User fees 1,144 892 934 720 734 749 763 778 792 806 821 835 850 864 878 893 907 922 936 950 965 979 994 1,008
7 Airport Fees Passenger tax increases 20 41 62 84 106 128 151 174 198 222 246 271 296 322 348 374 401 428 456 484
8 Other User fees increases 3 230 239 244 248 253 258 262 267 271 276 281 285 290 294 299 304 308 313 317 322
9 Grants - Operational 976 2,321 1,663 1,128 1,713 1,746 1,780 1,813 1,847 1,881 1,914 1,948 1,981 2,015 2,048 2,082 2,116 2,149 2,183 2,216 2,250 2,284 2,317 2,351
10 Interest 161 88 157 75 46 47 48 49 50 50 51 52 53 54 55 56 57 58 59 59 60 61 62 63
11 Other income 67 52 48 42 43 44 45 46 47 47 48 49 50 51 52 52 53 54 55 56 57 58 58 59
12 Investment revenue from water corporation 54 54 54 54 55 56 57 58 59 60 62 63 64 65 66 67 68 69 70 71 72 73 75 76
13 0 3,952 4,999 4,513 3,828 4,868 5,122 5,329 5,537 5,748 5,961 6,176 6,394 6,613 6,835 7,059 7,285 7,513 7,743 7,976 8,211 8,447 8,686 8,928 9,171
14 Capital income
15 Grants Capital 876 743 573 428 368 375 383 390 397 404 411 419 426 433 440 448 455 462 469 476 484 491 498 505
Contributions - non monetary assets 145 (193)
16 Net gain/(loss) on disposal of property, infrastructure,
plant and equipment
(111) (13) (268) 30 0 0
17 Recognition of land under roads 0 0 0
18 0 910 537 305 458 368 375 383 390 397 404 411 419 426 433 440 448 455 462 469 476 484 491 498 505
19
20 Total income from continuing operations 0 4,862 5,536 4,818 4,287 5,236 5,498 5,711 5,927 6,145 6,365 6,588 6,812 7,039 7,268 7,499 7,732 7,968 8,205 8,445 8,687 8,931 9,177 9,426 9,676
21
22 Expenses
23 Employee benefits (2,087) (1,967) (2,033) (2,188) (2,231) (2,275) (2,319) (2,363) (2,406) (2,450) (2,494) (2,538) (2,581) (2,625) (2,669) (2,713) (2,757) (2,800) (2,844) (2,888) (2,932) (2,975) (3,019) (3,063)
24 Materials and services (1,855) (1,819) (1,860) (2,097) (2,139) (2,181) (2,223) (2,265) (2,307) (2,349) (2,391) (2,433) (2,475) (2,517) (2,559) (2,601) (2,643) (2,685) (2,726) (2,768) (2,810) (2,852) (2,894) (2,936)
25 Impairment of debts (1) (36) 0
26 Depreciation and amortisation 4 (1,431) (1,499) (1,491) (1,618) (1,675) (1,707) (1,891) (1,938) (1,970) (2,002) (2,035) (2,085) (2,117) (2,165) (2,172) (2,205) (2,213) (2,325) (2,374) (2,423) (2,456) (2,491) (2,524) (2,540)
27 Finance costs (17) (25) (85) (101) (103) (105) (107) (109) (111) (113) (115) (117) (119) (121) (123) (125) (127) (129) (131) (133) (135) (137) (139) (141)
28 Other expenses (109) (131) (115) 0
29 Net Adjustments to Future Expenses savings/(costs) 201 205 206 251 103 126 128 97 98 44 81 87 102 95 81 106 101 112 114 66
30 Total expenses from continuing operations 0 (5,499) (5,442) (5,620) (6,003) (5,948) (6,063) (6,334) (6,424) (6,691) (6,789) (6,907) (7,076) (7,194) (7,384) (7,442) (7,556) (7,637) (7,843) (7,995) (8,107) (8,233) (8,344) (8,462) (8,615)
31
32 Net result for Continuing Operations (Excl
Telstra Project)
0 (637) 94 (802) (1,717) (712) (566) (623) (496) (546) (424) (319) (263) (155) (116) 57 176 331 362 450 580 699 833 963 1,062
Items that will not reclassified into Surplus or deficit -
Net Asset Revaluation increment/(decrement)
4,209 292
Items reclassified to include in surplus or defict - Fair
Value Adjs financial assets at fair value and Fair
Value on assets available for sale assets
55 43 50
Comprehensive Result Excl Telstra (582) 4,346 (460) (1,717) (712) (566) (623) (496) (546) (424) (319) (263) (155) (116) 57 176 331 362 450 580 699 833 963 1,062
33
34 Telstra Project Income 3,445 4,785
35 Telstra Project Expenditure (3,650) (5,350)
36 (205) (565)
37
38 Net result/ Comprehensive Result for the year
(Incl Telstra Project)
0 (637) 94 (1,007) (2,281) (712) (566) (623) (496) (546) (424) (319) (263) (155) (116) 57 176 331 362 450 580 699 833 963 1,062
Annexure 7 - C1 - October 2018
Part 1 – Long Term Financial Management Strategy Plan & Policies
Asset & Financial Management Strategies & Plans – October 2018 Page 11
0% 2% 2% 2% 2% 2% 2% 2% 2% 2% 2% 2% 2% 2% 2% 2% 2% 2% 2% 2% 2%
Flinders Council 100% 102% 104% 106% 108% 110% 112% 114% 116% 118% 120% 122% 124% 126% 128% 130% 132% 134% 136% 138% 140%
BUDGET 2019 - Income and Expenditure and Other Comprehensive Income
TOTAL COUNCIL Notes 2015 2016 2017 2018 2019 2020 2021 2022 2023 2024 2025 2026 2027 2028 2029 2030 2031 2032 2033 2034 2035 2036 2037 2038 2039
000's 000's 000's 000's 000's 000's 000's 000's 000's 000's 000's 000's 000's 000's 000's 000's 000's 000's 000's 000's 000's 000's 000's
39
40 Underlying Surplus calc:
41 Recurrent Income(13+34) 5 4,223 4,605 4,999 7,945 8,614 4,868 5,122 5,329 5,537 5,748 5,961 6,176 6,394 6,613 6,835 7,059 7,285 7,513 7,743 7,976 8,211 8,447 8,686 8,928 9,171
Deduct Recurrent Expenses ( 30+35+16) (4,858) (5,609) (5,455) (9,538) (11,323) (5,948) (6,063) (6,334) (6,424) (6,691) (6,789) (6,907) (7,076) (7,194) (7,384) (7,442) (7,556) (7,637) (7,843) (7,995) (8,107) (8,233) (8,344) (8,462) (8,615)
42 Plus Items that may be reclassified to surplus or
deficit -Grant Income allocated into the correct year of
use
(668) (681) 681
43 Underlying Surplus 6 (635) (1,004) (1,124) (1,593) (2,029) (1,080) (941) (1,006) (886) (943) (828) (730) (682) (581) (549) (383) (272) (124) (100) (19) 103 215 342 465 556
44 Underlying Surplus percentage % -(Underlying
Surplus 43 / Recurrent Income(13+34) plus Grant Adj
(42)
7 -15.% -22.% -26.% -22.% -22.% -22.% -18.% -19.% -16.% -16.% -14.% -12.% -11.% -9.% -8.% -5.% -4.% -2.% -1.% -0.% 1.% 3.% 4.% 5.% 6.%
45
Risk Indicator for Underlying Surplus %
Worse than negative 10%: insufficient revenue is
being generated to fund operations and assets
renewalHigh
Negative 10% to Zero %: a risk of long-term
deterioration of cash reserves and the inability to fund
asset renewals
Medium
More than Zero %: Generating surpluses consistentlyLow
46 Reconciliation to Cash Flow Forecast
47 Net Result/ Comprehensive Result (2,281) (712) (566) (623) (496) (546) (424) (319) (263) (155) (116) 57 176 331 362 450 580 699 833 963 1,062
48 Deduct Depreciation 1,618 1,675 1,707 1,891 1,938 1,970 2,002 2,035 2,085 2,117 2,165 2,172 2,205 2,213 2,325 2,374 2,423 2,456 2,491 2,524 2,540
49 Cashflow Timing adjustments GST 295
50 Cashflow Timing Adjs Telstra 645
51 Net Operating Cash Movement 276 963 1,141 1,268 1,441 1,424 1,579 1,716 1,821 1,962 2,049 2,229 2,381 2,544 2,687 2,824 3,003 3,154 3,324 3,487 3,602
52 Cashflow Statement Net OPERATING movement 275 963 1,141 1,268 1,441 1,424 1,579 1,716 1,821 1,962 2,049 2,229 2,381 2,544 2,687 2,824 3,003 3,154 3,324 3,487 3,602
53 Difference 0 0 0 0 0 0 0 0 0 0 0 0 0 0 0 0 0 0 0 0 0
CASHFLOW Including Capital Expenses and repayment of Loans
Net Cash Balance BF - positive/(negative) 8 5,443 4,526 4,430 5,110 2,724 3,164 3,275 4,166 4,696 5,473 6,704 7,920 8,927 10,308 11,638 12,043 14,091 16,114 18,217 20,569 23,457
Net Operating Cash Income 276 963 1,141 1,268 1,441 1,424 1,579 1,716 1,821 1,962 2,049 2,229 2,381 2,544 2,687 2,824 3,003 3,154 3,324 3,487 3,602
Capital Cash Payments (984) (785) (420) (2,568) (957) (1,266) (639) (881) (1,044) (731) (833) (1,222) (1,000) (1,214) (2,282) (776) (980) (1,051) (972) (599) (1,527)
Loans- Cash Principle Repayments (209) (275) (42) (1,085) (45) (47) (49) (305) 0 0 0 0 0 0 0 0 0 0 0 0 0
Net Cash Balance CF - positive/(negative) 4,526 4,430 5,110 2,724 3,164 3,275 4,166 4,696 5,473 6,704 7,920 8,927 10,308 11,638 12,043 14,091 16,114 18,217 20,569 23,457 25,531
Loan Balance (1,848) (1,573) (1,531) (445) (400) (353) (305) 0 0 0 0 0 0 0 0 0 0 0 0 0 0
NET LIQUIDITY 2,679 2,857 3,579 2,279 2,764 2,922 3,861 4,696 5,473 6,704 7,920 8,927 10,308 11,638 12,043 14,091 16,114 18,217 20,569 23,457 25,531
Minimum Level - based on Depreciation roughly $1.7 at 2019 and changes with depnforecast 1,618 1,675 1,707 1,891 1,938 1,970 2,002 2,035 2,085 2,117 2,165 2,172 2,205 2,213 2,325 2,374 2,423 2,456 2,491 2,524 2,540
KPI - Cash Levels (below)/ above minimum requirement 1,061 1,182 1,871 387 826 951 1,859 2,662 3,389 4,587 5,755 6,755 8,103 9,425 9,718 11,717 13,690 15,761 18,078 20,933 22,991
KPI - Rate Revenue as a % of Total Continuing Income 41% 38% 39% 40% 41% 41% 42% 43% 43% 44% 45% 45% 46% 46% 47% 47% 47% 48% 48% 49% 49%
Notes
3 The total Other User Fees of $230k is made up of an increase of $20k a year, as per the Budget 19 strategy, but adds a further $210k a year as identified in the Long Term Strategy above.
7 Underlying Surplus % is the Underlying Surplus divided by the Underlying Revenue ( Note the Underlying revenue includes adustments to match Grant income to the correct year.)
8 Net Cash balance include all investments as well as the BT investments
The forecast above indicates that Council is in the HIGH-RISK category for the next 9 years.
The forecast indicates that Council enter the MEDIUM -RISK period in 2028 for a further 7 years
The target position of greater than zero % is obtained in 2035.
1 - Rates Budget 2019 includes a 9% increase
2 Rates Increaseds: 10% increase in 2020, 7.5% increase 2021 and 5% increase onwards
4 - Depreciation -Assumes only inflation changes- no revaluations or increases/decreases calculated
5 Recurrent Income excludes income received specifically for new or upgraded assets, physical resources received free of charge or
other income of a capital nature
6 The Underlying Surplus or Deficit means an amount that is the recurrent income ( not including income received specifically for new or upgraded assets, physical resources
received free of charge or other income of a capital nature) of a council for a financial year less the recurrent expenses of the council for the financial year.
Annexure 7 - C1 - October 2018
Part 1 – Long Term Financial Management Strategy Plan & Policies
Asset & Financial Management Strategies & Plans – October 2018 Page 12
0% 2% 2% 2% 2% 2% 2% 2% 2% 2% 2% 2% 2% 2% 2% 2% 2% 2% 2% 2% 2%
Flinders Council 100% 102% 104% 106% 108% 110% 112% 114% 116% 118% 120% 122% 124% 126% 128% 130% 132% 134% 136% 138% 140%
BUDGET 2019 - Income and Expenditure and Other Comprehensive Income
AIRPORT ONLY Notes 2015 2016 2017 2018 2019 2020 2021 2022 2023 2024 2025 2026 2027 2028 2029 2030 2031 2032 2033 2034 2035 2036 2037 2038 2039
000's 000's 000's 000's 000's 000's 000's 000's 000's 000's 000's 000's 000's 000's 000's 000's 000's 000's 000's 000's 000's 000's 000's
1 Income from continuing operations
2 Recurrent Income
3 Rates and charges 1
4 Rates Increases 2
5 Statutory fees and fines
6 User fees 370 377 385 392 399 407 414 422 429 436 444 451 459 466 473 481 488 496 503 510 518
7 Airport Fees increases 20 41 62 84 106 128 151 174 198 222 246 271 296 322 348 374 401 428 456 484
8 Other User fees increases - AIRPORT RELATED increases3 210 218 223 227 231 235 239 244 248 252 256 260 265 269 273 277 281 286 290 294
9 Grants - Operational 107
10 Interest
11 Other income
12 Investment revenue from water corporation
13 0 0 0 0 477 608 644 677 710 743 777 812 847 882 917 953 990 1,027 1,064 1,101 1,139 1,178 1,217 1,256 1,295
14 Capital income
15 Grants Capital
Contributions - non monetary assets
16 Net gain/(loss) on disposal of property, infrastructure,
plant and equipment
17 Recognition of land under roads
18 0 0 0 0 0 0 0 0 0 0 0 0 0 0 0 0 0 0 0 0 0 0 0 0 0
19
20 Total income from continuing operations 0 0 0 0 477 608 644 677 710 743 777 812 847 882 917 953 990 1,027 1,064 1,101 1,139 1,178 1,217 1,256 1,295
21
22 Expenses
23 Employee benefits (215) (219) (224) (228) (232) (237) (241) (245) (249) (254) (258) (262) (267) (271) (275) (280) (284) (288) (292) (297) (301)
24 Materials and services (160) (163) (166) (170) (173) (176) (179) (182) (186) (189) (192) (195) (198) (202) (205) (208) (211) (214) (218) (221) (224)
25 Impairment of debts
26 Depreciation and amortisation 4 (299) (305) (311) (444) (450) (456) (462) (468) (474) (480) (486) (492) (498) (504) (603) (609) (615) (621) (627) (633) (639)
27 Finance costs
28 Other expenses
29 Net Adjustments to Future Expenses savings/(costs)
30 Total expenses from continuing operations 0 0 0 0 (674) (687) (701) (841) (855) (868) (882) (895) (909) (922) (936) (949) (963) (976) (1,083) (1,097) (1,110) (1,124) (1,137) (1,151) (1,164)
31
32 Net result for Continuing Operations (Excl
Telstra Project)
0 0 0 0 (197) (80) (57) (165) (145) (125) (104) (83) (62) (40) (18) 4 27 51 (20) 4 29 54 79 105 131
Items that will not reclassified into Surplus or deficit -
Net Asset Revaluation increment/(decrement)
Items reclassified to include in surplus or defict - Fair
Value Adjs financial assets at fair value and Fair
Value on assets available for sale assets
Comprehensive Result 0 0 0 (197) (80) (57) (165) (145) (125) (104) (83) (62) (40) (18) 4 27 51 (20) 4 29 54 79 105 131
33
34 Telstra Project Income
35 Telstra Project Expenditure
36 0 0
37
38 Net result for the year (Incl Telstra Project) 0 0 0 0 (197) (80) (57) (165) (145) (125) (104) (83) (62) (40) (18) 4 27 51 (20) 4 29 54 79 105 131
Annexure 7 - C1 - October 2018
Part 1 – Long Term Financial Management Strategy Plan & Policies
Asset & Financial Management Strategies & Plans – October 2018 Page 13
0% 2% 2% 2% 2% 2% 2% 2% 2% 2% 2% 2% 2% 2% 2% 2% 2% 2% 2% 2% 2%
Flinders Council 100% 102% 104% 106% 108% 110% 112% 114% 116% 118% 120% 122% 124% 126% 128% 130% 132% 134% 136% 138% 140%
BUDGET 2019 - Income and Expenditure and Other Comprehensive Income
AIRPORT ONLY Notes 2015 2016 2017 2018 2019 2020 2021 2022 2023 2024 2025 2026 2027 2028 2029 2030 2031 2032 2033 2034 2035 2036 2037 2038 2039
000's 000's 000's 000's 000's 000's 000's 000's 000's 000's 000's 000's 000's 000's 000's 000's 000's 000's 000's 000's 000's 000's 000's
39
40 Underlying Surplus calc:
41 Recurrent Income(13+34) 5 477 608 644 677 710 743 777 812 847 882 917 953 990 1,027 1,064 1,101 1,139 1,178 1,217 1,256 1,295
Deduct Recurrent Expenses ( 30+35+16) (674) (687) (701) (841) (855) (868) (882) (895) (909) (922) (936) (949) (963) (976) (1,083) (1,097) (1,110) (1,124) (1,137) (1,151) (1,164)
42 Plus Items that may be reclassified to surplus or
deficit -Grant Income allocated into the correct year of
use
43 Underlying Surplus 6 0 0 0 0 (197) (80) (57) (165) (145) (125) (104) (83) (62) (40) (18) 4 27 51 (20) 4 29 54 79 105 131
44 Underlying Surplus percentage % -(Underlying
Surplus 43 / Recurrent Income(13+34) plus Grant Adj
(42)
7 -41.% -13.% -9.% -24.% -20.% -17.% -13.% -10.% -7.% -5.% -2.% 0.% 3.% 5.% -2.% 0.% 3.% 5.% 7.% 8.% 10.%
45
Risk Indicator for Underlying Surplus %
Worse than negative 10%: insufficient revenue is
being generated to fund operations and assets
renewalHigh
Negative 10% to Zero %: a risk of long-term
deterioration of cash reserves and the inability to fund
asset renewals
Medium
More than Zero %: Generating surpluses consistentlyLow
46 Reconciliation to Cash Flow Forecast
47 Net Result (197) (80) (57) (165) (145) (125) (104) (83) (62) (40) (18) 4 27 51 (20) 4 29 54 79 105 131
48 Deduct Depreciation 299 305 311 444 450 456 462 468 474 480 486 492 498 504 603 609 615 621 627 633 639
49 Cashflow Timing adjustments GST
50 Cashflow Timing Adjs Telstra
51 Net Operating Cash Movement 102 225 254 279 305 331 357 384 412 439 467 496 525 554 584 614 644 675 707 738 770
52 Cashflow Statement Net OPERATING movement
53 Difference 102 225 254 279 305 331 357 384 412 439 467 496 525 554 584 614 644 675 707 738 770
CASHFLOW Including Capital Expenses and repayment of Loans
Net Cash Balance BF - positive/(negative) 8 0 (16) 205 459 (1,170) (865) (647) (289) 95 454 894 1,289 1,736 2,261 2,815 1,863 2,448 3,092 3,768 4,474 5,212
Net Operating Cash Income 102 225 254 279 305 331 357 384 412 439 467 496 525 554 584 614 644 675 707 738 770
Capital Cash Payments (118) (4) 0 (1,908) 0 (112) 0 0 (52) 0 (72) (49) 0 0 (1,536) (29) 0 0 0 0 (112)
Loans- Cash Principle Repayments
Net Cash Balance CF - positive/(negative) (16) 205 459 (1,170) (865) (647) (289) 95 454 894 1,289 1,736 2,261 2,815 1,863 2,448 3,092 3,768 4,474 5,212 5,871
Loan Balance
NET LIQUIDITY (16) 205 459 (1,170) (865) (647) (289) 95 454 894 1,289 1,736 2,261 2,815 1,863 2,448 3,092 3,768 4,474 5,212 5,871
Minimum Level - based on Depreciation roughly $300k at 2019 and changes with depnforecast 299 305 311 444 450 456 462 468 474 480 486 492 498 504 603 609 615 621 627 633 639
KPI - Cash Levels (below)/ above minimum requirement (315) (100) 148 (1,614) (1,315) (1,103) (751) (373) (19) 414 803 1,244 1,763 2,311 1,259 1,839 2,477 3,146 3,847 4,579 5,232
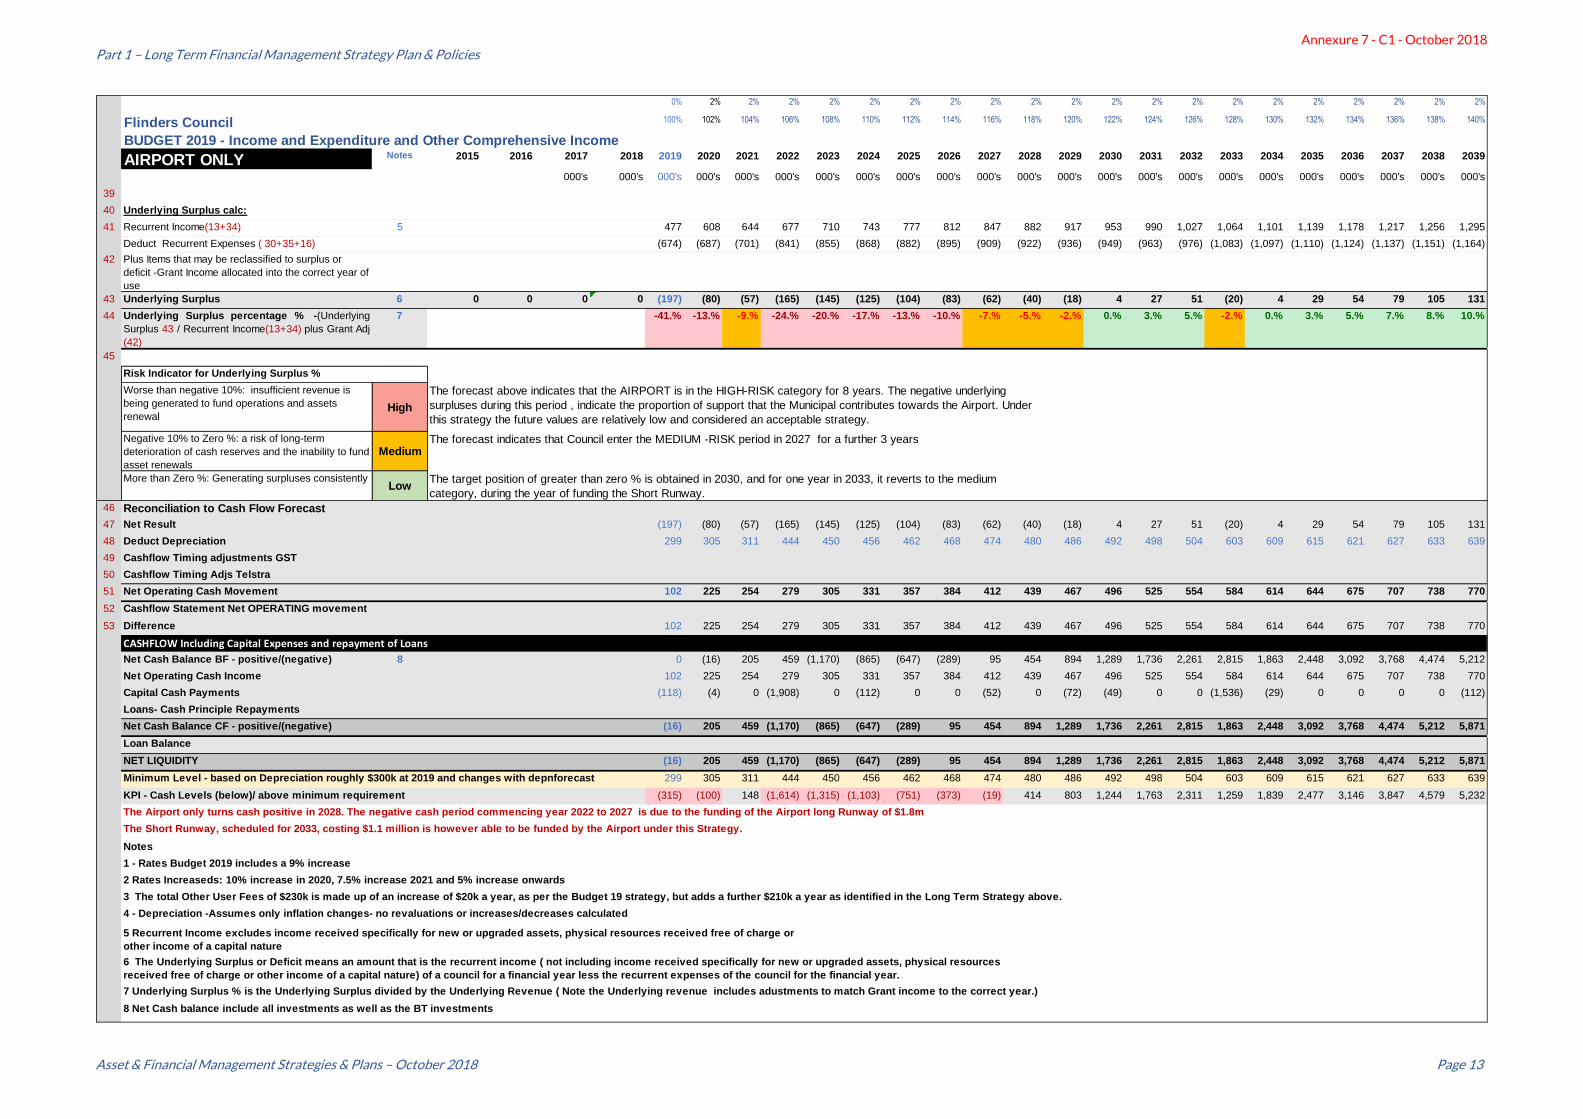
The Airport only turns cash positive in 2028. The negative cash period commencing year 2022 to 2027 is due to the funding of the Airport long Runway of $1.8m
The Short Runway, scheduled for 2033, costing $1.1 million is however able to be funded by the Airport under this Strategy.
Notes
3 The total Other User Fees of $230k is made up of an increase of $20k a year, as per the Budget 19 strategy, but adds a further $210k a year as identified in the Long Term Strategy above.
7 Underlying Surplus % is the Underlying Surplus divided by the Underlying Revenue ( Note the Underlying revenue includes adustments to match Grant income to the correct year.)
1 - Rates Budget 2019 includes a 9% increase
2 Rates Increaseds: 10% increase in 2020, 7.5% increase 2021 and 5% increase onwards
8 Net Cash balance include all investments as well as the BT investments
4 - Depreciation -Assumes only inflation changes- no revaluations or increases/decreases calculated
The forecast above indicates that the AIRPORT is in the HIGH-RISK category for 8 years. The negative underlying
surpluses during this period , indicate the proportion of support that the Municipal contributes towards the Airport. Under
this strategy the future values are relatively low and considered an acceptable strategy.
The forecast indicates that Council enter the MEDIUM -RISK period in 2027 for a further 3 years
The target position of greater than zero % is obtained in 2030, and for one year in 2033, it reverts to the medium
category, during the year of funding the Short Runway.
5 Recurrent Income excludes income received specifically for new or upgraded assets, physical resources received free of charge or
other income of a capital nature
6 The Underlying Surplus or Deficit means an amount that is the recurrent income ( not including income received specifically for new or upgraded assets, physical resources
received free of charge or other income of a capital nature) of a council for a financial year less the recurrent expenses of the council for the financial year.
Annexure 7 - C1 - October 2018

Part 1 – Long Term Financial Management Strategy Plan & Policies
Asset & Financial Management Strategies & Plans – October 2018 Page 14
0% 2% 2% 2% 2% 2% 2% 2% 2% 2% 2% 2% 2% 2% 2% 2% 2% 2% 2% 2% 2%
Flinders Council 100% 102% 104% 106% 108% 110% 112% 114% 116% 118% 120% 122% 124% 126% 128% 130% 132% 134% 136% 138% 140%
BUDGET 2019 - Income and Expenditure and Other Comprehensive Income
MUNICIPAL ONLY Notes 2015 2016 2017 2018 2019 2020 2021 2022 2023 2024 2025 2026 2027 2028 2029 2030 2031 2032 2033 2034 2035 2036 2037 2038 2039
000's 000's 000's 000's 000's 000's 000's 000's 000's 000's 000's 000's 000's 000's 000's 000's 000's 000's 000's 000's 000's 000's 000's
1 Income from continuing operations
2 Recurrent Income
3 Rates and charges 1 1,768 1,803 1,839 1,874 1,910 1,945 1,980 2,016 2,051 2,086 2,122 2,157 2,192 2,228 2,263 2,299 2,334 2,369 2,405 2,440 2,475
4 Rates Increases 2 0 180 318 412 507 605 704 804 907 1,011 1,117 1,225 1,335 1,446 1,559 1,674 1,791 1,910 2,030 2,152 2,276
5 Statutory fees and fines 41 42 43 44 45 46 46 47 48 49 50 51 51 52 53 54 55 55 56 57 58
6 User fees 350 357 364 371 378 385 392 399 406 413 420 427 434 441 448 455 462 469 476 483 490
7 Airport Fees increases 0 0 0 0 0 0 0 0 0 0 0 0 0 0 0 0 0 0 0 0 0
8 Other User fees increases 3 0 20 21 21 22 22 22 23 23 24 24 24 25 25 26 26 26 27 27 28 28
9 Grants - Operational 1,021 1,713 1,746 1,780 1,813 1,847 1,881 1,914 1,948 1,981 2,015 2,048 2,082 2,116 2,149 2,183 2,216 2,250 2,284 2,317 2,351
10 Interest 75 46 47 48 49 50 50 51 52 53 54 55 56 57 58 59 59 60 61 62 63
11 Other income 42 43 44 45 46 47 47 48 49 50 51 52 52 53 54 55 56 57 58 58 59
12 Investment revenue from water corporation 54 55 56 57 58 59 60 62 63 64 65 66 67 68 69 70 71 72 73 75 76
13 0 0 0 0 3,352 4,260 4,478 4,652 4,828 5,005 5,184 5,365 5,547 5,731 5,918 6,105 6,295 6,486 6,680 6,875 7,071 7,270 7,470 7,672 7,876
14 Capital income
15 Grants Capital 428 368 375 383 390 397 404 411 419 426 433 440 448 455 462 469 476 484 491 498 505
Contributions - non monetary assets 0 0 0 0 0 0 0 0 0 0 0 0 0 0 0 0 0 0 0 0 0
16 Net gain/(loss) on disposal of property, infrastructure,
plant and equipment
30 0 0 0 0 0 0 0 0 0 0 0 0 0 0 0 0 0 0 0 0
17 Recognition of land under roads 0 0 0 0 0 0 0 0 0 0 0 0 0 0 0 0 0 0 0 0 0
18 0 0 0 0 458 368 375 383 390 397 404 411 419 426 433 440 448 455 462 469 476 484 491 498 505
19
20 Total income from continuing operations 0 0 0 0 3,810 4,629 4,854 5,035 5,217 5,402 5,588 5,776 5,966 6,157 6,351 6,546 6,743 6,941 7,142 7,344 7,548 7,753 7,961 8,170 8,381
21
22 Expenses
23 Employee benefits (1,973) (2,012) (2,052) (2,091) (2,131) (2,170) (2,209) (2,249) (2,288) (2,328) (2,367) (2,407) (2,446) (2,486) (2,525) (2,565) (2,604) (2,643) (2,683) (2,722) (2,762)
24 Materials and services (1,937) (1,976) (2,015) (2,054) (2,092) (2,131) (2,170) (2,209) (2,247) (2,286) (2,325) (2,364) (2,402) (2,441) (2,480) (2,518) (2,557) (2,596) (2,635) (2,673) (2,712)
25 Impairment of debts 0 0 0 0 0 0 0 0 0 0 0 0 0 0 0 0 0 0 0 0 0
26 Depreciation and amortisation 4 (1,319) (1,370) (1,397) (1,447) (1,488) (1,514) (1,541) (1,567) (1,611) (1,637) (1,679) (1,681) (1,707) (1,709) (1,721) (1,765) (1,808) (1,834) (1,864) (1,890) (1,901)
27 Finance costs (101) (103) (105) (107) (109) (111) (113) (115) (117) (119) (121) (123) (125) (127) (129) (131) (133) (135) (137) (139) (141)
28 Other expenses 0 0 0 0 0 0 0 0 0 0 0 0 0 0 0 0 0 0 0 0 0
29 Net Adjustments to Future Expenses savings/(costs) 0 201 205 206 251 103 126 128 97 98 44 81 87 102 95 81 106 101 112 114 66
30 Total expenses from continuing operations 0 0 0 0 (5,330) (5,261) (5,363) (5,493) (5,569) (5,823) (5,907) (6,011) (6,167) (6,272) (6,448) (6,493) (6,594) (6,661) (6,760) (6,898) (6,997) (7,109) (7,207) (7,312) (7,450)
31
32 Net result for Continuing Operations (Excl
Telstra Project)
0 0 0 0 (1,520) (632) (509) (458) (351) (421) (319) (235) (201) (115) (98) 53 149 280 382 445 551 645 754 858 931
Items that will not reclassified into Surplus or deficit -
Net Asset Revaluation increment /(decrement)
0 0 0 0 0 0 0 0 0 0 0 0 0 0 0 0 0 0 0 0 0
Items reclassified to include in surplus or defict - Fair
Value Adjs financial assets at fair value and Fair
Value on assets available for sale assets
0 0 0 0 0 0 0 0 0 0 0 0 0 0 0 0 0 0 0 0 0
Comprehensive Result 0 0 0 (1,520) (632) (509) (458) (351) (421) (319) (235) (201) (115) (98) 53 149 280 382 445 551 645 754 858 931
33 0 0 0 0 0 0 0 0 0 0 0 0 0 0 0 0 0 0 0 0 0
34 Telstra Project Income 4,785 0 0 0 0 0 0 0 0 0 0 0 0 0 0 0 0 0 0 0 0
35 Telstra Project Expenditure (5,350) 0 0 0 0 0 0 0 0 0 0 0 0 0 0 0 0 0 0 0 0
36 0 (565)
37
38 Net result for the year (Incl Telstra Project) 0 0 0 0 (2,084) (632) (509) (458) (351) (421) (319) (235) (201) (115) (98) 53 149 280 382 445 551 645 754 858 931
Annexure 7 - C1 - October 2018
Part 1 – Long Term Financial Management Strategy Plan & Policies
Asset & Financial Management Strategies & Plans – October 2018 Page 15
0% 2% 2% 2% 2% 2% 2% 2% 2% 2% 2% 2% 2% 2% 2% 2% 2% 2% 2% 2% 2%
Flinders Council 100% 102% 104% 106% 108% 110% 112% 114% 116% 118% 120% 122% 124% 126% 128% 130% 132% 134% 136% 138% 140%
BUDGET 2019 - Income and Expenditure and Other Comprehensive Income
MUNICIPAL ONLY Notes 2015 2016 2017 2018 2019 2020 2021 2022 2023 2024 2025 2026 2027 2028 2029 2030 2031 2032 2033 2034 2035 2036 2037 2038 2039
000's 000's 000's 000's 000's 000's 000's 000's 000's 000's 000's 000's 000's 000's 000's 000's 000's 000's 000's 000's 000's 000's 000's
39
40 Underlying Surplus calc:
41 Recurrent Income(13+34) 5 8,137 4,260 4,478 4,652 4,828 5,005 5,184 5,365 5,547 5,731 5,918 6,105 6,295 6,486 6,680 6,875 7,071 7,270 7,470 7,672 7,876
Deduct Recurrent Expenses ( 30+35+16) (10,650) (5,261) (5,363) (5,493) (5,569) (5,823) (5,907) (6,011) (6,167) (6,272) (6,448) (6,493) (6,594) (6,661) (6,760) (6,898) (6,997) (7,109) (7,207) (7,312) (7,450)
42 Plus Items that may be reclassified to surplus or
deficit -Grant Income allocated into the correct year of
use
681
43 Underlying Surplus 6 0 0 0 0 (1,832) (1,000) (884) (841) (741) (818) (724) (647) (620) (541) (531) (388) (299) (174) (80) (24) 74 161 263 360 425
44 Underlying Surplus percentage % -(Underlying
Surplus 43 / Recurrent Income(13+34) plus Grant Adj
(42)
7 -21.% -23.% -20.% -18.% -15.% -16.% -14.% -12.% -11.% -9.% -9.% -6.% -5.% -3.% -1.% -0.% 1.% 2.% 4.% 5.% 5.%
45
Risk Indicator for Underlying Surplus %
Worse than negative 10%: insufficient revenue is
being generated to fund operations and assets
renewalHigh
Negative 10% to Zero %: a risk of long-term
deterioration of cash reserves and the inability to fund
asset renewals
Medium
More than Zero %: Generating surpluses consistentlyLow
46 Reconciliation to Cash Flow Forecast
47 Net Result (2,084) (632) (509) (458) (351) (421) (319) (235) (201) (115) (98) 53 149 280 382 445 551 645 754 858 931
48 Deduct Depreciation 1,319 1,370 1,397 1,447 1,488 1,514 1,541 1,567 1,611 1,637 1,679 1,681 1,707 1,709 1,721 1,765 1,808 1,834 1,864 1,890 1,901
49 Cashflow Timing adjustments GST 295
50 Cashflow Timing Adjs Telstra 645
51 Net Operating Cash Movement 174 738 888 989 1,137 1,093 1,221 1,332 1,410 1,522 1,582 1,733 1,856 1,989 2,103 2,210 2,359 2,479 2,618 2,749 2,832
52 Cashflow Statement Net OPERATING movement
53 Difference 174 738 888 989 1,137 1,093 1,221 1,332 1,410 1,522 1,582 1,733 1,856 1,989 2,103 2,210 2,359 2,479 2,618 2,749 2,832
CASHFLOW Including Capital Expenses and repayment of Loans
Net Cash Balance BF - positive/(negative) 8 5,443 4,543 4,225 4,651 3,895 4,029 3,922 4,455 4,601 5,019 5,810 6,631 7,191 8,047 8,823 10,180 11,643 13,021 14,449 16,095 18,244
Net Operating Cash Income 174 738 888 989 1,137 1,093 1,221 1,332 1,410 1,522 1,582 1,733 1,856 1,989 2,103 2,210 2,359 2,479 2,618 2,749 2,832
Capital Cash Payments (866) (781) (420) (660) (957) (1,154) (639) (881) (992) (731) (761) (1,173) (1,000) (1,214) (746) (747) (980) (1,051) (972) (599) (1,415)
Loans- Cash Principle Repayments (209) (275) (42) (1,085) (45) (47) (49) (305) 0 0 0 0 0 0 0 0 0 0 0 0 0
Net Cash Balance CF - positive/(negative) 4,543 4,225 4,651 3,895 4,029 3,922 4,455 4,601 5,019 5,810 6,631 7,191 8,047 8,823 10,180 11,643 13,021 14,449 16,095 18,244 19,661
Loan Balance (1,848) (1,573) (1,531) (445) (400) (353) (305) 0 0 0 0 0 0 0 0 0 0 0 0 0 0
NET LIQUIDITY 2,695 2,652 3,120 3,449 3,629 3,568 4,150 4,601 5,019 5,810 6,631 7,191 8,047 8,823 10,180 11,643 13,021 14,449 16,095 18,244 19,661
Minimum Level - based on Depreciation roughly $1,300k at 2019 and changes with depn forecast 1,319 1,370 1,397 1,447 1,488 1,514 1,541 1,567 1,611 1,637 1,679 1,681 1,707 1,709 1,721 1,765 1,808 1,834 1,864 1,890 1,901
KPI - Cash Levels (below)/ above minimum requirement 1,376 1,282 1,723 2,002 2,141 2,054 2,610 3,034 3,408 4,173 4,952 5,511 6,340 7,114 8,459 9,878 11,213 12,615 14,231 16,354 17,760
KPI - Rate Revenue as a % of Total Continuing Income 46% 43% 44% 45% 46% 47% 48% 49% 50% 50% 51% 52% 52% 53% 54% 54% 55% 55% 56% 56% 57%
Notes
3 The total Other User Fees of $230k is made up of an increase of $20k a year, as per the Budget 19 strategy, but adds a further $210k a year as identified in the Long Term Strategy above.
7 Underlying Surplus % is the Underlying Surplus divided by the Underlying Revenue ( Note the Underlying revenue includes adustments to match Grant income to the correct year.)
8 Net Cash balance include all investments as well as the BT investments
1 - Rates Budget 2019 includes a 9% increase
2 Rates Increaseds: 10% increase in 2020, 7.5% increase 2021 and 5% increase onwards
4 - Depreciation -Assumes only inflation changes- no revaluations or increases/decreases calculated
5 Recurrent Income excludes income received specifically for new or upgraded assets, physical resources received free of
charge or other income of a capital nature
The forecast above indicates that the Municipal is in the HIGH-RISK category for 9 years.
The forecast indicates that the Municipal enter the MEDIUM -RISK period in 2028 for a further 7 years
The target position of greater than zero % is achieved in year 2035.
6 The Underlying Surplus or Deficit means an amount that is the recurrent income ( not including income received specifically for new or upgraded assets, physical
resources received free of charge or other income of a capital nature) of a council for a financial year less the recurrent expenses of the council for the financial year.
Annexure 7 - C1 - October 2018
Part 1 – Long Term Financial Management Strategy Plan & Policies
Asset & Financial Management Strategies & Plans – October 2018 Page 16
0% 2% 2% 2% 2% 2% 2% 2% 2% 2% 2% 2% 2% 2% 2% 2% 2% 2% 2% 2% 2%
Flinders Council 100% 102% 104% 106% 108% 110% 112% 114% 116% 118% 120% 122% 124% 126% 128% 130% 132% 134% 136% 138% 140%
BUDGET 2019 - Income and Expenditure and Other Comprehensive Income
Depreciation and amortisation Asset
Value at
Acquisitio
n
Year
Commences
Asset Value at
Acquisition-
indexed to incl
inflation
Estimated
Useful
economic
Life
Annual
Depn
2019 2020 2021 2022 2023 2024 2025 2026 2027 2028 2029 2030 2031 2032 2033 2034 2035 2036 2037 2038 2039
000's 000's 000's 000's 000's 000's 000's 000's 000's 000's 000's 000's 000's 000's 000's 000's 000's 000's 000's 000's 000's 000's 000's
COUNCIL ALLDepreciation and amortisation - current level of existing asset base 1,618 1,650 1,682 1,715 1,747 1,779 1,812 1,844 1,877 1,909 1,941 1,974 2,006 2,038 2,071 2,103 2,135 2,168 2,200 2,232 2,265
Assets adding to the BASE level which will increase depreciation:
Airport Runway - long 3,600 2022 3,816 30 127 127 127 127 127 127 127 127 127 127 127 127 127 127 127 127 127 127 127
Airport Runway - Short 2,000 2033 2,560 30 85 85 85 85 85 85 85 85
Airport New - Plant - fuel facility Depn 100 2033 128 15 9 9 9 9 9 9 9 9
Waste Program Assets under asset 4 - Year 1 250 2019 250 10 25 25 25 25 25 25 25 25 25 25 25
Waste Program Assets under asset 4 - Year 2 2020 0 10 0 0 0 0 0 0 0 0 0 0 0 0
Waste Program Assets under asset 4 - Year 3 2021 10 0
Waste Program Assets under asset 4 - Year 4 230 2022 244 10 24 24 24 24 24 24 24 24 24 24 24
Waste Program Assets under asset 4 - Year 5 130 2023 140 10 14 14 14 14 14 14 14 14 14 14 14
Waste Program Assets under asset 4 - Year 9 150 2027 174 10 17 17 17 17 17 17 17 17 17 17 17
Waste Program Assets under asset 4 - Year 11 130 2029 156 10 16 16 16 16 16 16 16 16 16 16 16
Waste Program Assets under asset 4 - Year 14 0 2032 0 10 0 0 0 0 0 0 0 0 0
Waste Program Assets under asset 4 - Year 16 130 2034 169 10 17 17 17 17 17 17 17
Waste Program Assets under asset 4 - Year 17 130 2035 172 10 17 17 17 17 17 17
Waste Program Assets under asset 4 - Year 18 2036 10 0 20 20 20
Waste Program Assets under asset 4 - Year 19 150 2037 204 10 20
Waste Program Assets under asset 4 - Year 20
Depreciation and amortisation including Inflation 7,000 8,013 1,618 1,675 1,707 1,891 1,938 1,970 2,002 2,035 2,085 2,117 2,165 2,172 2,205 2,213 2,325 2,374 2,423 2,456 2,491 2,524 2,540
Assumptions
1 - Base level depreciation is set from Budget 19, and assumes that the increases and decreases of replacing assets will be stable
2 - Large NEW asset additions have been added to the depreciation calculation in the table above.
3 - Acquisitions have been indexed to include a 2% Inflation
AIRPORT ONLYBase Level Depn 299 305 311 317 323 329 335 341 347 352 358 364 370 376 382 388 394 400 406 412 418
New - Plant - fuel facility Depn 100 2033 128 15 9 9 9 9 9 9 9 9
New -Airport Runway - long Depn 3,600 2022 3,816 30 127 127 127 127 127 127 127 127 127 127 127 127 127 127 127 127 127 127 127
New -Airport Runway - Short Depn 2,000 2033 2,560 30 85 85 85 85 85 85 85 85
AIRPORT Depreciation and amortisation including Inflation 299 305 311 444 450 456 462 468 474 480 486 492 498 504 603 609 615 621 627 633 639
Municipal ONLYBase Level Depn 1,319 1,345 1,372 1,398 1,424 1,451 1,477 1,504 1,530 1,556 1,583 1,609 1,636 1,662 1,688 1,715 1,741 1,767 1,794 1,820 1,847
New -Waste Program Assets 0 25 25 49 63 63 63 63 81 81 96 71 71 47 33 50 67 67 70 70 54
Municipal Depreciation and amortisation including Inflation 1,319 1,370 1,397 1,447 1,488 1,514 1,541 1,567 1,611 1,637 1,679 1,681 1,707 1,709 1,721 1,765 1,808 1,834 1,864 1,890 1,901
Annexure 7 - C1 - October 2018
Part 1 – Long Term Financial Management Strategy Plan & Policies
Asset & Financial Management Strategies & Plans – October 2018 Page 17
S5(c) For each financial year of the plan, a statement of financial position including estimates of –
(i) Current and non-current assets; and
(ii) Current and non-current liabilities; and
(iii) Net assets; and
(iv) Equity, including reserves;
This section has not been completed. The work required in this area will be developed in future Strategic modelling, however, due to the nature of the work undertaken by the Council, this area is a low risk impact area, as the dynamics of the income and expenditure should not present any major fluctuations in future levels of current and non-current assets and liabilities i.e. for example Debtors, creditors, Inventory holdings, Capital works in progress.
S5(d) For each financial year of the plan, a cashflow statement, including estimates of
(i) Receipts, payments, dividends and net cash from operational activities, financial activities including loan borrowings, and investment activities; and
(ii) Net increases or decreases in cash held; and
(iii) Cash and cash equivalents held at the beginning of the period; and
(iv) Cash and cash equivalents held at the end of the period
This section has been completed as per the following Long-term Cashflow forecast for Budget 2019
Annexure 7 - C1 - October 2018
Part 1 – Long Term Financial Management Strategy Plan & Policies
Asset & Financial Management Strategies & Plans – October 2018 Page 18
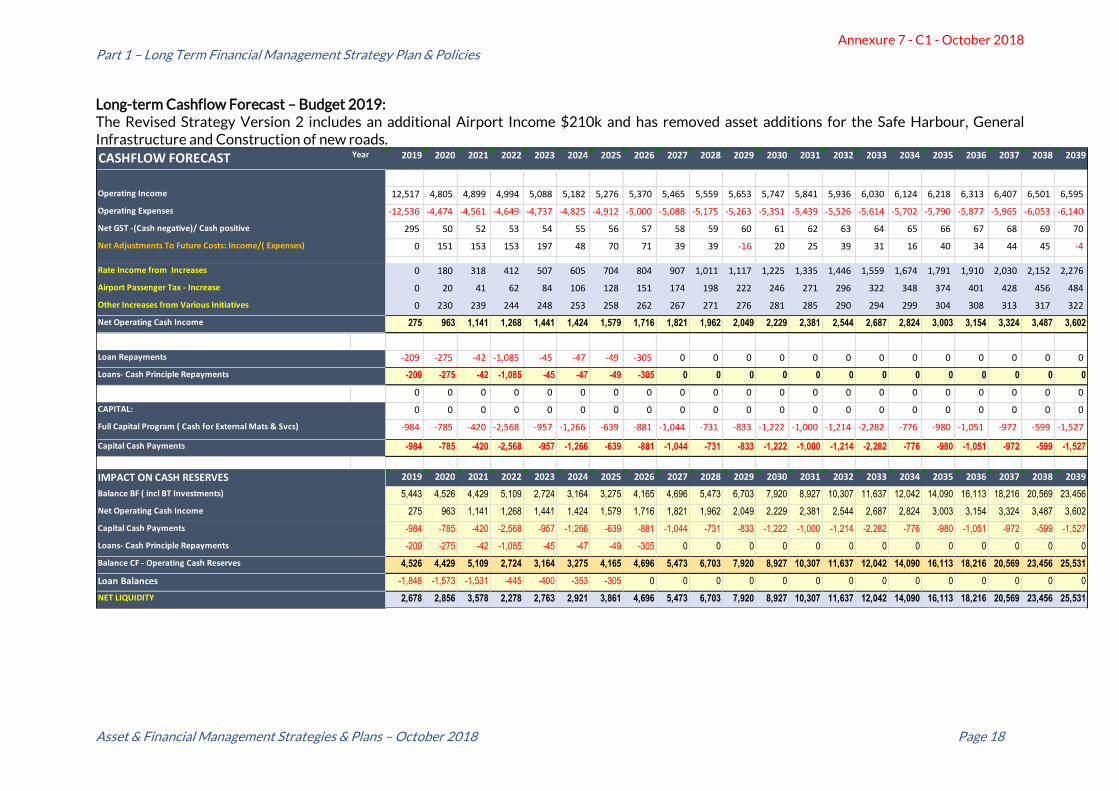
Long-term Cashflow Forecast – Budget 2019: The Revised Strategy Version 2 includes an additional Airport Income $210k and has removed asset additions for the Safe Harbour, General Infrastructure and Construction of new roads.
CASHFLOW FORECAST Year 2019 2020 2021 2022 2023 2024 2025 2026 2027 2028 2029 2030 2031 2032 2033 2034 2035 2036 2037 2038 2039
Operating Income 12,517 4,805 4,899 4,994 5,088 5,182 5,276 5,370 5,465 5,559 5,653 5,747 5,841 5,936 6,030 6,124 6,218 6,313 6,407 6,501 6,595
Operating Expenses -12,536 -4,474 -4,561 -4,649 -4,737 -4,825 -4,912 -5,000 -5,088 -5,175 -5,263 -5,351 -5,439 -5,526 -5,614 -5,702 -5,790 -5,877 -5,965 -6,053 -6,140
Net GST -(Cash negative)/ Cash positive 295 50 52 53 54 55 56 57 58 59 60 61 62 63 64 65 66 67 68 69 70
Net Adjustments To Future Costs: Income/( Expenses) 0 151 153 153 197 48 70 71 39 39 -16 20 25 39 31 16 40 34 44 45 -4
Rate Income from Increases 0 180 318 412 507 605 704 804 907 1,011 1,117 1,225 1,335 1,446 1,559 1,674 1,791 1,910 2,030 2,152 2,276
Airport Passenger Tax - Increase 0 20 41 62 84 106 128 151 174 198 222 246 271 296 322 348 374 401 428 456 484
Other Increases from Various Initiatives 0 230 239 244 248 253 258 262 267 271 276 281 285 290 294 299 304 308 313 317 322
Net Operating Cash Income 275 963 1,141 1,268 1,441 1,424 1,579 1,716 1,821 1,962 2,049 2,229 2,381 2,544 2,687 2,824 3,003 3,154 3,324 3,487 3,602
Loan Repayments -209 -275 -42 -1,085 -45 -47 -49 -305 0 0 0 0 0 0 0 0 0 0 0 0 0
Loans- Cash Principle Repayments -209 -275 -42 -1,085 -45 -47 -49 -305 0 0 0 0 0 0 0 0 0 0 0 0 0
0 0 0 0 0 0 0 0 0 0 0 0 0 0 0 0 0 0 0 0 0
CAPITAL: 0 0 0 0 0 0 0 0 0 0 0 0 0 0 0 0 0 0 0 0 0
Full Capital Program ( Cash for External Mats & Svcs) -984 -785 -420 -2,568 -957 -1,266 -639 -881 -1,044 -731 -833 -1,222 -1,000 -1,214 -2,282 -776 -980 -1,051 -972 -599 -1,527
Capital Cash Payments -984 -785 -420 -2,568 -957 -1,266 -639 -881 -1,044 -731 -833 -1,222 -1,000 -1,214 -2,282 -776 -980 -1,051 -972 -599 -1,527
IMPACT ON CASH RESERVES 2019 2020 2021 2022 2023 2024 2025 2026 2027 2028 2029 2030 2031 2032 2033 2034 2035 2036 2037 2038 2039
Balance BF ( incl BT Investments) 5,443 4,526 4,429 5,109 2,724 3,164 3,275 4,165 4,696 5,473 6,703 7,920 8,927 10,307 11,637 12,042 14,090 16,113 18,216 20,569 23,456
Net Operating Cash Income 275 963 1,141 1,268 1,441 1,424 1,579 1,716 1,821 1,962 2,049 2,229 2,381 2,544 2,687 2,824 3,003 3,154 3,324 3,487 3,602
Capital Cash Payments -984 -785 -420 -2,568 -957 -1,266 -639 -881 -1,044 -731 -833 -1,222 -1,000 -1,214 -2,282 -776 -980 -1,051 -972 -599 -1,527
Loans- Cash Principle Repayments -209 -275 -42 -1,085 -45 -47 -49 -305 0 0 0 0 0 0 0 0 0 0 0 0 0
Balance CF - Operating Cash Reserves 4,526 4,429 5,109 2,724 3,164 3,275 4,165 4,696 5,473 6,703 7,920 8,927 10,307 11,637 12,042 14,090 16,113 18,216 20,569 23,456 25,531
Loan Balances -1,848 -1,573 -1,531 -445 -400 -353 -305 0 0 0 0 0 0 0 0 0 0 0 0 0 0
NET LIQUIDITY 2,678 2,856 3,578 2,278 2,763 2,921 3,861 4,696 5,473 6,703 7,920 8,927 10,307 11,637 12,042 14,090 16,113 18,216 20,569 23,456 25,531
Annexure 7 - C1 - October 2018
Part 1 – Long Term Financial Management Strategy Plan & Policies
Asset & Financial Management Strategies & Plans – October 2018 Page 19
S5(2)(e) A description of the financial management strategies to be adopted by the council, including financial targets and their rationale;
Council is well behind in undertaking the comprehensive work that is required in relation to the financial management strategies. There is much that needs to be done in this area to establish risk and evaluate the rationale of costs in relation to income, and the ability of Council to assist in funding large projects in the future.
From the work performed in section 5.2, it is clear from the presented strategy that the Council currently does not have the ability to fund large projects.
The 2019 Budget and future projections have taken a step forward to begin to identify some of the financial targets. These include setting a minimum net cash reserve base at $1.7million, as well as an in-depth examination of the capital program which affects the cash output.
The predictions of the underlying surplus indicate the future sustainability of the Council, to assist in decision making, and the current strategy does not reflect a positive outlook.
S5(2)(f) A comparison of projected financial performance against targets (determined by the council) for financial indicators, including those indicators specified in an order made under section 84(2A) of the ACT for each financial year included in the Long-term financial plan;
This section has not been fully completed as we are yet to determine the range of key performance indicators that are relevant to improve Council’s decision making. We have however identified the following KPI’s:
KPI – minimum cash holding $1.7 million:
As a critical measure to base the financial cashflow forecast, and to provide sound decision making, the minimum cash holding KPI has been set at $1.7 million dollars. This is the minimum cash level that reaches a base of zero net profitability, after we include depreciation. Depreciation is estimated to be $1.6 million in the 2019 Budget.
KPI – Ideal Net Cash Level:
Although the graph below has identified a measure to restore Net Cash levels to the 2015 position, Council has indicated that this level is not necessarily the ideal level that Council should strive to attain. The calculation behind this KPI will need to be explored, reviewed and agreed upon in future strategic work. At present this has not been set, however its measure is not as important to target, because the basic measure of a LOW-RISK underlying surplus is the ultimate measure for future sustainability, and through achieving the underlying surplus ratio, the Ideal cash level would most likely become evident.
Annexure 7 - C1 - October 2018
Part 1 – Long Term Financial Management Strategy Plan & Policies
Asset & Financial Management Strategies & Plans – October 2018 Page 20
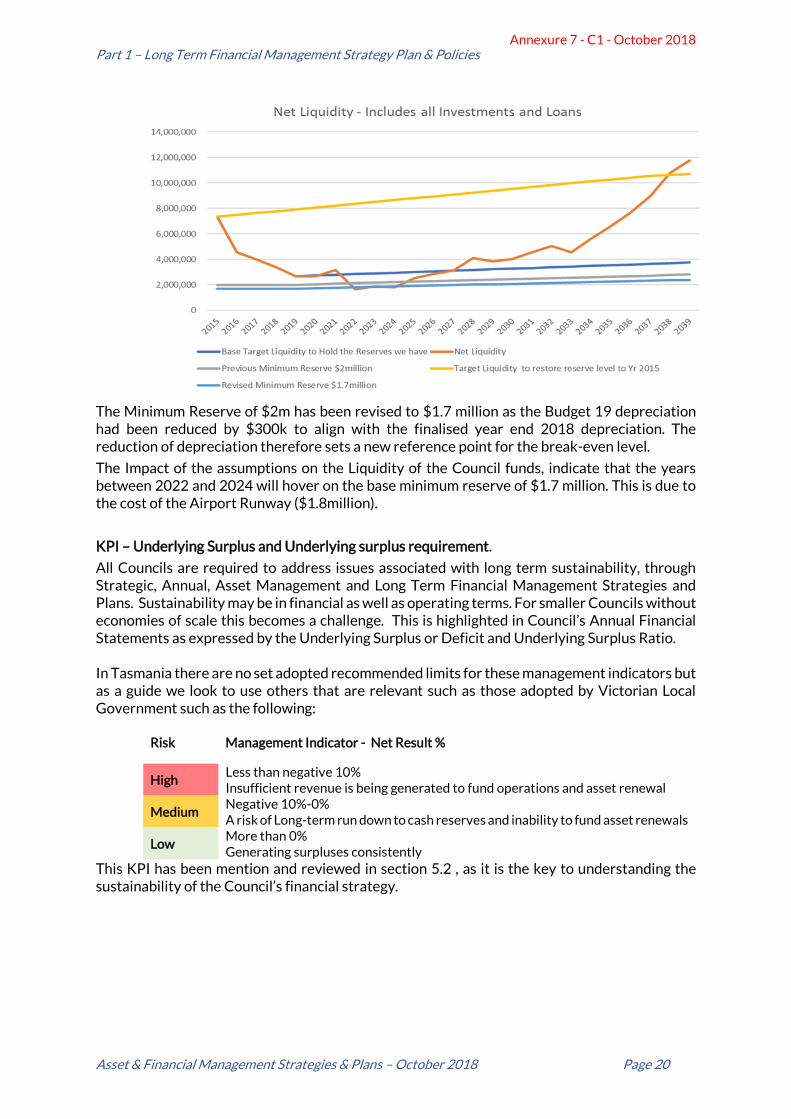
The Minimum Reserve of $2m has been revised to $1.7 million as the Budget 19 depreciation had been reduced by $300k to align with the finalised year end 2018 depreciation. The reduction of depreciation therefore sets a new reference point for the break-even level.
The Impact of the assumptions on the Liquidity of the Council funds, indicate that the years between 2022 and 2024 will hover on the base minimum reserve of $1.7 million. This is due to the cost of the Airport Runway ($1.8million).
KPI – Underlying Surplus and Underlying surplus requirement.
All Councils are required to address issues associated with long term sustainability, through Strategic, Annual, Asset Management and Long Term Financial Management Strategies and Plans. Sustainability may be in financial as well as operating terms. For smaller Councils without economies of scale this becomes a challenge. This is highlighted in Council’s Annual Financial Statements as expressed by the Underlying Surplus or Deficit and Underlying Surplus Ratio. In Tasmania there are no set adopted recommended limits for these management indicators but as a guide we look to use others that are relevant such as those adopted by Victorian Local Government such as the following:
Risk Management Indicator - Net Result %
High Less than negative 10% Insufficient revenue is being generated to fund operations and asset renewal
Medium Negative 10%-0% A risk of Long-term run down to cash reserves and inability to fund asset renewals
Low More than 0% Generating surpluses consistently
This KPI has been mention and reviewed in section 5.2 , as it is the key to understanding the sustainability of the Council’s financial strategy.
Annexure 7 - C1 - October 2018
Part 1 – Long Term Financial Management Strategy Plan & Policies
Asset & Financial Management Strategies & Plans – October 2018 Page 21
S(5)(2)(g) All assumptions used in the development of the estimates referred to in paragraphs (a), (b), (c), and (d).
Assumptions for the Long-term financial plan:
Estimated Revenues:
• Projected revenues Include a 2% inflationary rate;
• Rateable income applies 9% increase in 2019, 10% increase in 2020, 7.5% increase in 2021 and 5% increase in the years beyond to 2039;
• Airport Passenger Service Charges, applies an Increase $9 to $12 passenger tax in 2019, and thereafter a $1 increase each year over the next twenty years;
• User fees and Charges includes a $20,000 increase in Budget 2019 from various identified initiatives, but no further increases have been included in the years beyond;
• Grant Income (Operational and Capital), includes only known Grant Income in the 2019 Budget, and the years beyond 2019 recognise only the sustainable (and assumed ongoing) grants such as FAGS grant and Roads to recovery Grants;
• Grant Interest income from loan closures have been included in the projected income.
• Net GST on operational income and expenditure has been assumed to be flat at $50k a year positive and therefore does not affect the fluctuations of cash in the projections.
Estimated Expenditure – Operational:
• Projected operational expenditure Includes a 2% inflationary rate;
• One-off costs identified in 2019 have been removed from the ongoing cost projection;
• Telstra one-off costs in 2019 do not continue into the future projections.
• Additional costs have been included in the projection where increases have been identified for example the Waste Management program cost increases.
• Repairs and maintenance for the buildings section has had a full review after site visits and evaluation of each building/facility in order to predict more accurately the ongoing repairs and maintenance for this section.
Capital Expenditure:
• The Capital works program has reviewed and analysed the requirements of each class of assets in detail. It uses estimated assumptions to identify the forecasted capital replacement timescales, and though a logical approach has been employed for each category, a full asset review has not been performed to solidify the assumptions made.
• Projected capital expenditure Includes a 2% inflationary rate;
• Roads, Bridges and Traffic infrastructure includes sufficient expenditure to meet the Roads to Recovery Grant criteria over the next 5 years. It does however exclude any construction of roads until 2029 due to cash constraints;
• Plant and Equipment has had a full review and most assets have been scheduled into the program in the recommended time frame except for two large plant purchases which were pushed forward by one year, to balance cash levels;
• Building upgrades have been scheduled in the Budget 2019 program as most of the building works either have grant income attached to them and are carry overs from 2018. The period beyond 2019 has minimal capital allocated for the building upgrades;
• All other minor asset classes have been reviewed and included in the capital program.
Annexure 7 - C1 - October 2018
Part 1 – Long Term Financial Management Strategy Plan & Policies
Asset & Financial Management Strategies & Plans – October 2018 Page 22
• The Airport Runway upgrade assumes a 50% grant income will be achieved, leaving $1.8million cost to be incurred by the Council.
• The Safe Harbour capital project assumes half a million cost will be incurred by the Council and the remainder $5 million of cost is funded through grants.
Loans and Borrowings.
• The Cash projection assumes that all loans will be repaid, and no additional loans taken out in the 20-year plan.
• The principles underlying borrowings has been identified later in point 6.2 (d).
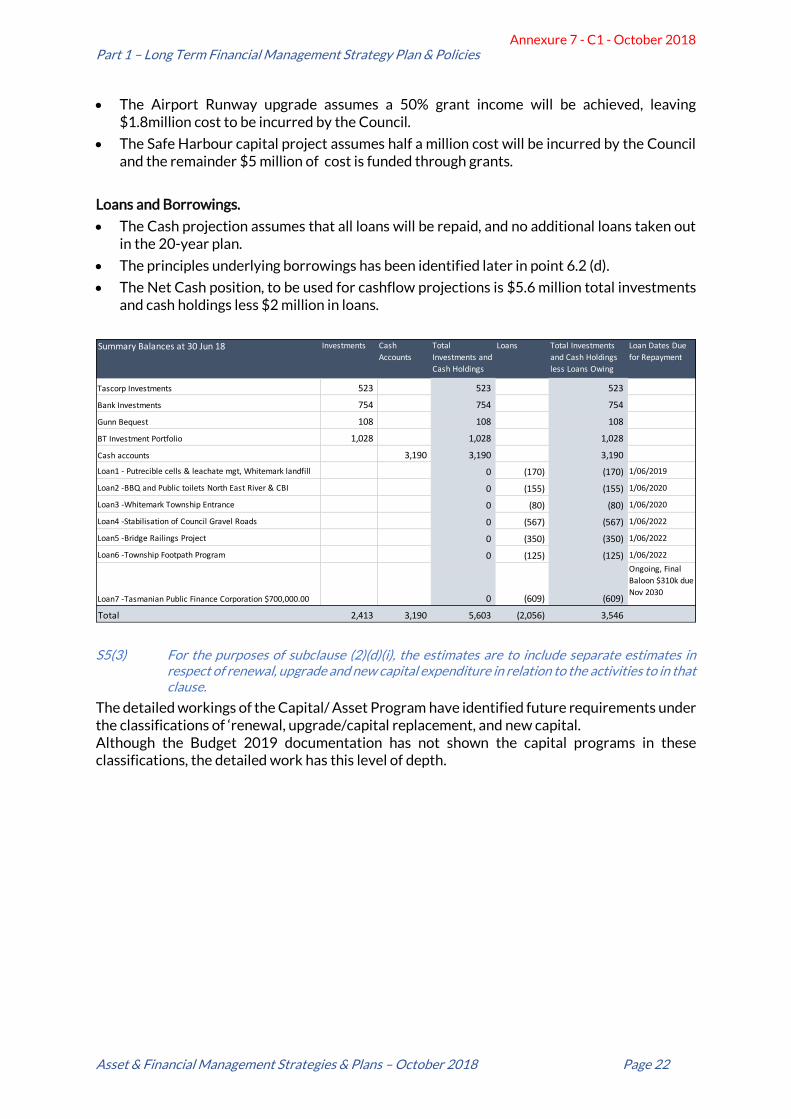
• The Net Cash position, to be used for cashflow projections is $5.6 million total investments and cash holdings less $2 million in loans.
S5(3) For the purposes of subclause (2)(d)(i), the estimates are to include separate estimates in respect of renewal, upgrade and new capital expenditure in relation to the activities to in that clause.
The detailed workings of the Capital/ Asset Program have identified future requirements under the classifications of ‘renewal, upgrade/capital replacement, and new capital. Although the Budget 2019 documentation has not shown the capital programs in these classifications, the detailed work has this level of depth.
Summary Balances at 30 Jun 18 Investments Cash
Accounts
Total
Investments and
Cash Holdings
Loans Total Investments
and Cash Holdings
less Loans Owing
Loan Dates Due
for Repayment
Tascorp Investments 523 523 523
Bank Investments 754 754 754
Gunn Bequest 108 108 108
BT Investment Portfolio 1,028 1,028 1,028
Cash accounts 3,190 3,190 3,190
Loan1 - Putrecible cells & leachate mgt, Whitemark landfill 0 (170) (170) 1/06/2019
Loan2 -BBQ and Public toilets North East River & CBI 0 (155) (155) 1/06/2020
Loan3 -Whitemark Township Entrance 0 (80) (80) 1/06/2020
Loan4 -Stabilisation of Council Gravel Roads 0 (567) (567) 1/06/2022
Loan5 -Bridge Railings Project 0 (350) (350) 1/06/2022
Loan6 -Township Footpath Program 0 (125) (125) 1/06/2022
Loan7 -Tasmanian Public Finance Corporation $700,000.00 0 (609) (609)
Ongoing, Final
Baloon $310k due
Nov 2030
Total 2,413 3,190 5,603 (2,056) 3,546
Annexure 7 - C1 - October 2018
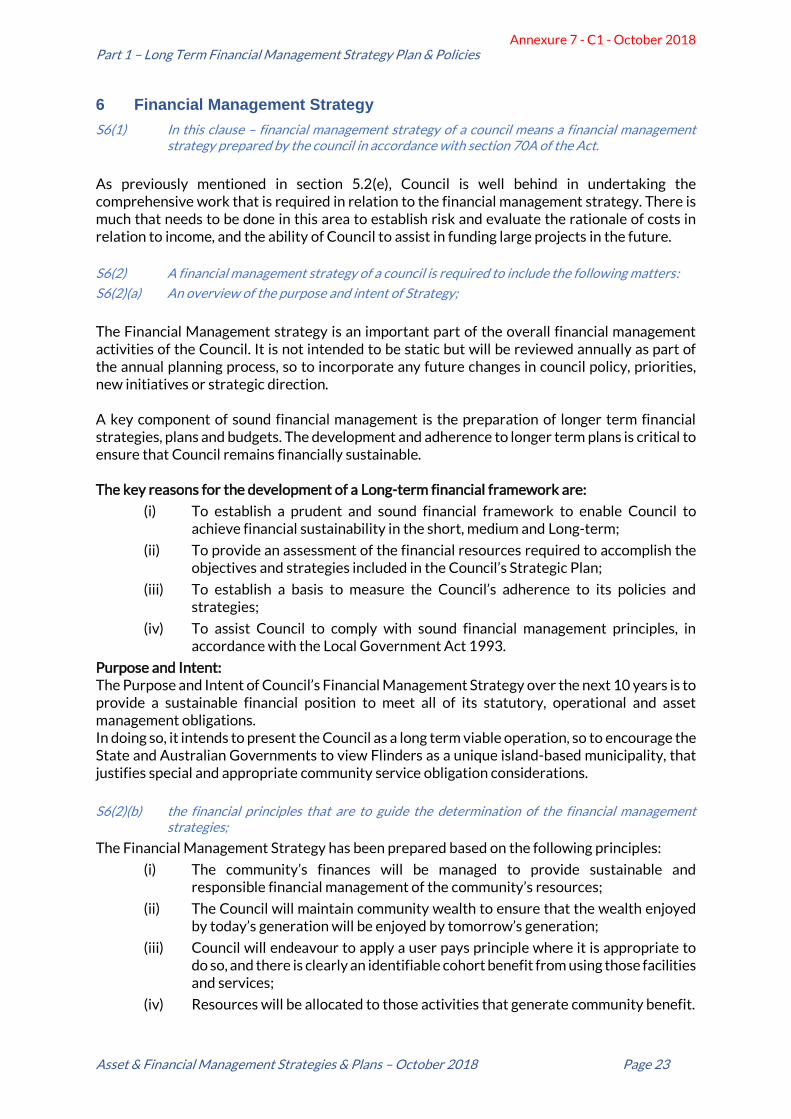
Part 1 – Long Term Financial Management Strategy Plan & Policies
Asset & Financial Management Strategies & Plans – October 2018 Page 23
6 Financial Management Strategy
S6(1) In this clause – financial management strategy of a council means a financial management strategy prepared by the council in accordance with section 70A of the Act.
As previously mentioned in section 5.2(e), Council is well behind in undertaking the comprehensive work that is required in relation to the financial management strategy. There is much that needs to be done in this area to establish risk and evaluate the rationale of costs in relation to income, and the ability of Council to assist in funding large projects in the future.
S6(2) A financial management strategy of a council is required to include the following matters:
S6(2)(a) An overview of the purpose and intent of Strategy;
The Financial Management strategy is an important part of the overall financial management activities of the Council. It is not intended to be static but will be reviewed annually as part of the annual planning process, so to incorporate any future changes in council policy, priorities, new initiatives or strategic direction. A key component of sound financial management is the preparation of longer term financial strategies, plans and budgets. The development and adherence to longer term plans is critical to ensure that Council remains financially sustainable. The key reasons for the development of a Long-term financial framework are:
(i) To establish a prudent and sound financial framework to enable Council to achieve financial sustainability in the short, medium and Long-term;
(ii) To provide an assessment of the financial resources required to accomplish the objectives and strategies included in the Council’s Strategic Plan;
(iii) To establish a basis to measure the Council’s adherence to its policies and strategies;
(iv) To assist Council to comply with sound financial management principles, in accordance with the Local Government Act 1993.
Purpose and Intent: The Purpose and Intent of Council’s Financial Management Strategy over the next 10 years is to provide a sustainable financial position to meet all of its statutory, operational and asset management obligations. In doing so, it intends to present the Council as a long term viable operation, so to encourage the State and Australian Governments to view Flinders as a unique island-based municipality, that justifies special and appropriate community service obligation considerations.
S6(2)(b) the financial principles that are to guide the determination of the financial management strategies;
The Financial Management Strategy has been prepared based on the following principles:
(i) The community’s finances will be managed to provide sustainable and responsible financial management of the community’s resources;
(ii) The Council will maintain community wealth to ensure that the wealth enjoyed by today’s generation will be enjoyed by tomorrow’s generation;
(iii) Council will endeavour to apply a user pays principle where it is appropriate to do so, and there is clearly an identifiable cohort benefit from using those facilities and services;
(iv) Resources will be allocated to those activities that generate community benefit.
Annexure 7 - C1 - October 2018
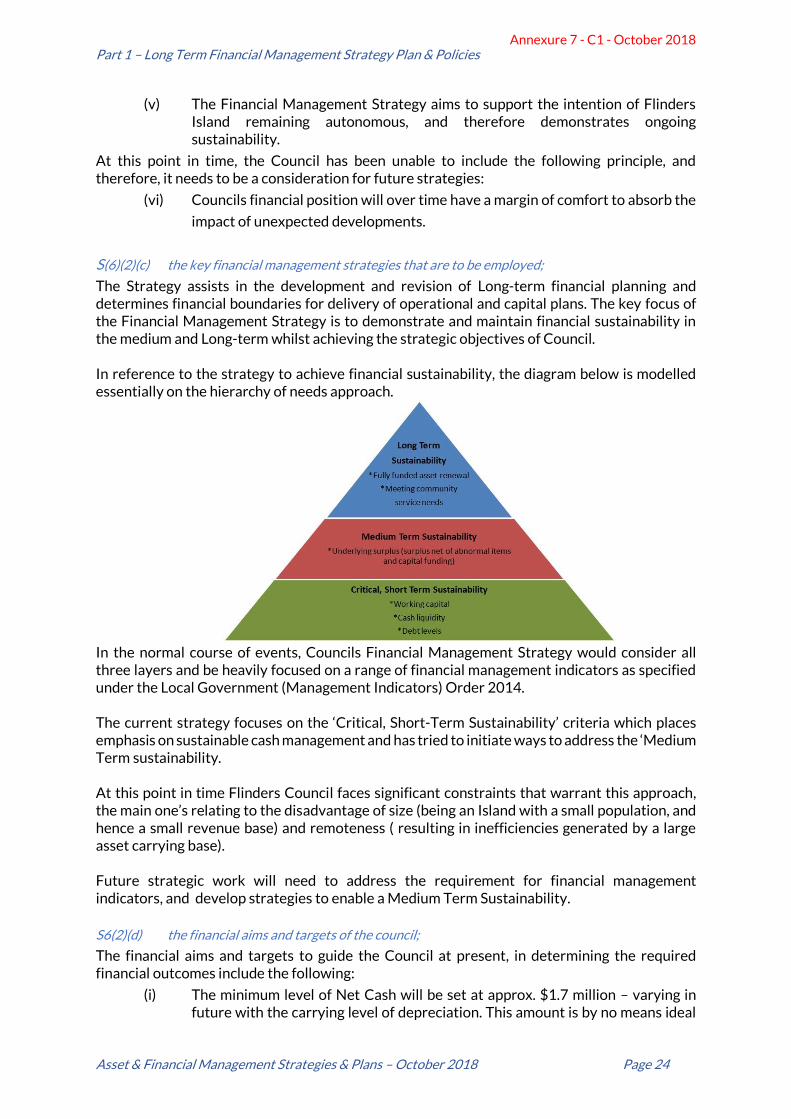
Part 1 – Long Term Financial Management Strategy Plan & Policies
Asset & Financial Management Strategies & Plans – October 2018 Page 24
(v) The Financial Management Strategy aims to support the intention of Flinders Island remaining autonomous, and therefore demonstrates ongoing sustainability.
At this point in time, the Council has been unable to include the following principle, and therefore, it needs to be a consideration for future strategies:
(vi) Councils financial position will over time have a margin of comfort to absorb the
impact of unexpected developments.
S(6)(2)(c) the key financial management strategies that are to be employed;
The Strategy assists in the development and revision of Long-term financial planning and determines financial boundaries for delivery of operational and capital plans. The key focus of the Financial Management Strategy is to demonstrate and maintain financial sustainability in the medium and Long-term whilst achieving the strategic objectives of Council. In reference to the strategy to achieve financial sustainability, the diagram below is modelled essentially on the hierarchy of needs approach.
In the normal course of events, Councils Financial Management Strategy would consider all three layers and be heavily focused on a range of financial management indicators as specified under the Local Government (Management Indicators) Order 2014. The current strategy focuses on the ‘Critical, Short-Term Sustainability’ criteria which places emphasis on sustainable cash management and has tried to initiate ways to address the ‘Medium Term sustainability. At this point in time Flinders Council faces significant constraints that warrant this approach, the main one’s relating to the disadvantage of size (being an Island with a small population, and hence a small revenue base) and remoteness ( resulting in inefficiencies generated by a large asset carrying base). Future strategic work will need to address the requirement for financial management indicators, and develop strategies to enable a Medium Term Sustainability.
S6(2)(d) the financial aims and targets of the council;
The financial aims and targets to guide the Council at present, in determining the required financial outcomes include the following:
(i) The minimum level of Net Cash will be set at approx. $1.7 million – varying in future with the carrying level of depreciation. This amount is by no means ideal
Annexure 7 - C1 - October 2018
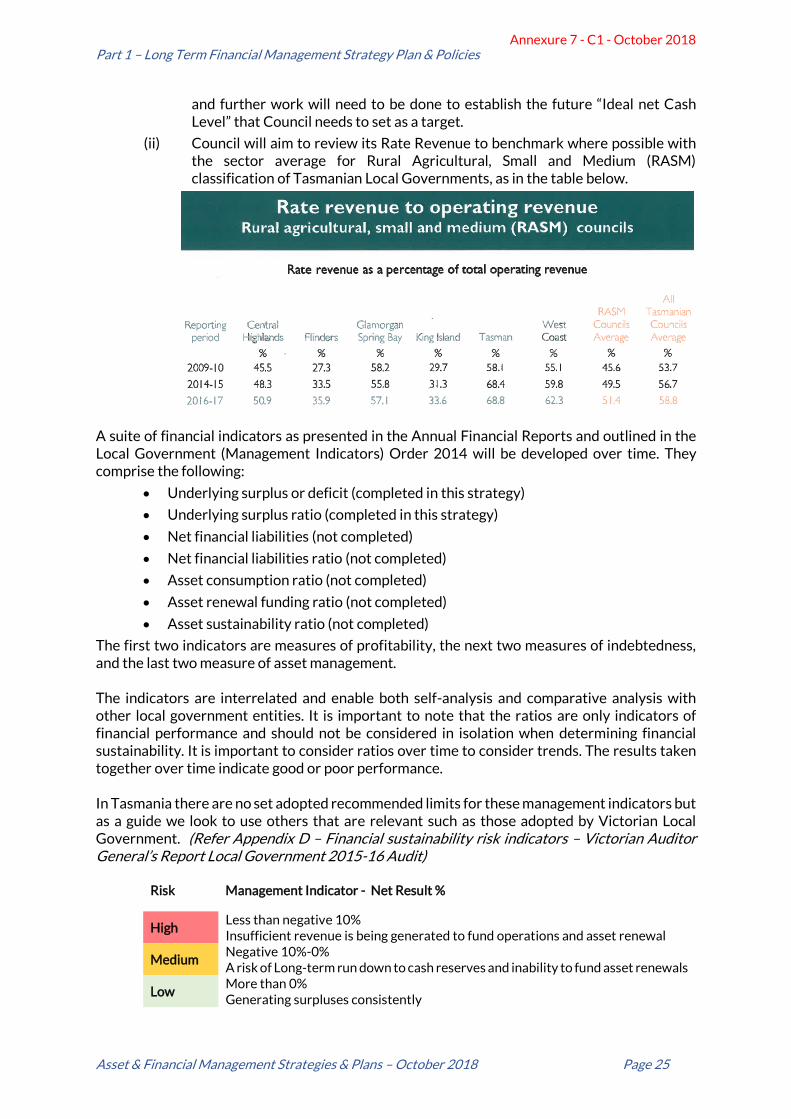
Part 1 – Long Term Financial Management Strategy Plan & Policies
Asset & Financial Management Strategies & Plans – October 2018 Page 25
and further work will need to be done to establish the future “Ideal net Cash Level” that Council needs to set as a target.
(ii) Council will aim to review its Rate Revenue to benchmark where possible with the sector average for Rural Agricultural, Small and Medium (RASM) classification of Tasmanian Local Governments, as in the table below.
A suite of financial indicators as presented in the Annual Financial Reports and outlined in the Local Government (Management Indicators) Order 2014 will be developed over time. They comprise the following:
• Underlying surplus or deficit (completed in this strategy)
• Underlying surplus ratio (completed in this strategy)
• Net financial liabilities (not completed)
• Net financial liabilities ratio (not completed)
• Asset consumption ratio (not completed)
• Asset renewal funding ratio (not completed)
• Asset sustainability ratio (not completed)
The first two indicators are measures of profitability, the next two measures of indebtedness, and the last two measure of asset management. The indicators are interrelated and enable both self-analysis and comparative analysis with other local government entities. It is important to note that the ratios are only indicators of financial performance and should not be considered in isolation when determining financial sustainability. It is important to consider ratios over time to consider trends. The results taken together over time indicate good or poor performance. In Tasmania there are no set adopted recommended limits for these management indicators but as a guide we look to use others that are relevant such as those adopted by Victorian Local Government. (Refer Appendix D – Financial sustainability risk indicators – Victorian Auditor General’s Report Local Government 2015-16 Audit)
Risk Management Indicator - Net Result %
High Less than negative 10% Insufficient revenue is being generated to fund operations and asset renewal
Medium Negative 10%-0% A risk of Long-term run down to cash reserves and inability to fund asset renewals
Low More than 0% Generating surpluses consistently
Annexure 7 - C1 - October 2018
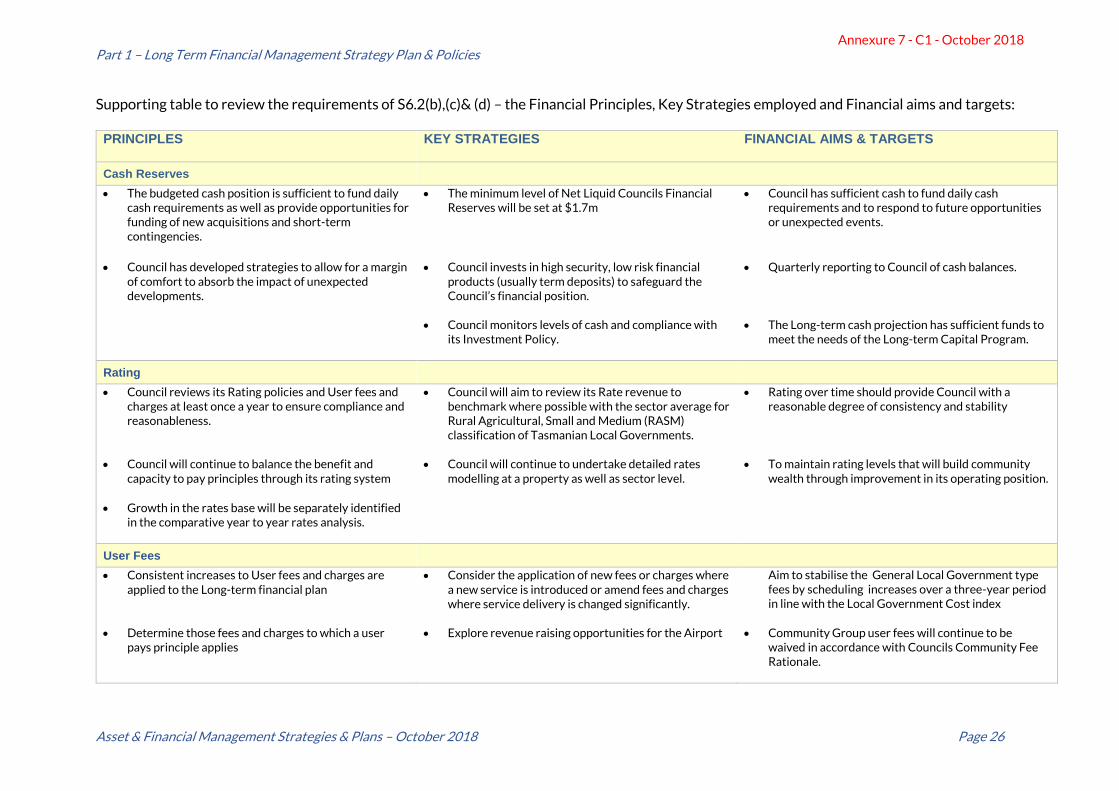
Part 1 – Long Term Financial Management Strategy Plan & Policies
Asset & Financial Management Strategies & Plans – October 2018 Page 26
Supporting table to review the requirements of S6.2(b),(c)& (d) – the Financial Principles, Key Strategies employed and Financial aims and targets:
PRINCIPLES
KEY STRATEGIES FINANCIAL AIMS & TARGETS
Cash Reserves
• The budgeted cash position is sufficient to fund daily cash requirements as well as provide opportunities for funding of new acquisitions and short-term contingencies.
• The minimum level of Net Liquid Councils Financial Reserves will be set at $1.7m
• Council has sufficient cash to fund daily cash requirements and to respond to future opportunities or unexpected events.
• Council has developed strategies to allow for a margin of comfort to absorb the impact of unexpected developments.
• Council invests in high security, low risk financial products (usually term deposits) to safeguard the Council’s financial position.
• Quarterly reporting to Council of cash balances.
• Council monitors levels of cash and compliance with its Investment Policy.
• The Long-term cash projection has sufficient funds to meet the needs of the Long-term Capital Program.
Rating
• Council reviews its Rating policies and User fees and charges at least once a year to ensure compliance and reasonableness.
• Council will aim to review its Rate revenue to benchmark where possible with the sector average for Rural Agricultural, Small and Medium (RASM) classification of Tasmanian Local Governments.
• Rating over time should provide Council with a reasonable degree of consistency and stability
• Council will continue to balance the benefit and capacity to pay principles through its rating system
• Council will continue to undertake detailed rates modelling at a property as well as sector level.
• To maintain rating levels that will build community wealth through improvement in its operating position.
• Growth in the rates base will be separately identified in the comparative year to year rates analysis.
User Fees
• Consistent increases to User fees and charges are applied to the Long-term financial plan
• Consider the application of new fees or charges where a new service is introduced or amend fees and charges where service delivery is changed significantly.
Aim to stabilise the General Local Government type fees by scheduling increases over a three-year period in line with the Local Government Cost index
• Determine those fees and charges to which a user pays principle applies
• Explore revenue raising opportunities for the Airport • Community Group user fees will continue to be waived in accordance with Councils Community Fee Rationale.
Annexure 7 - C1 - October 2018
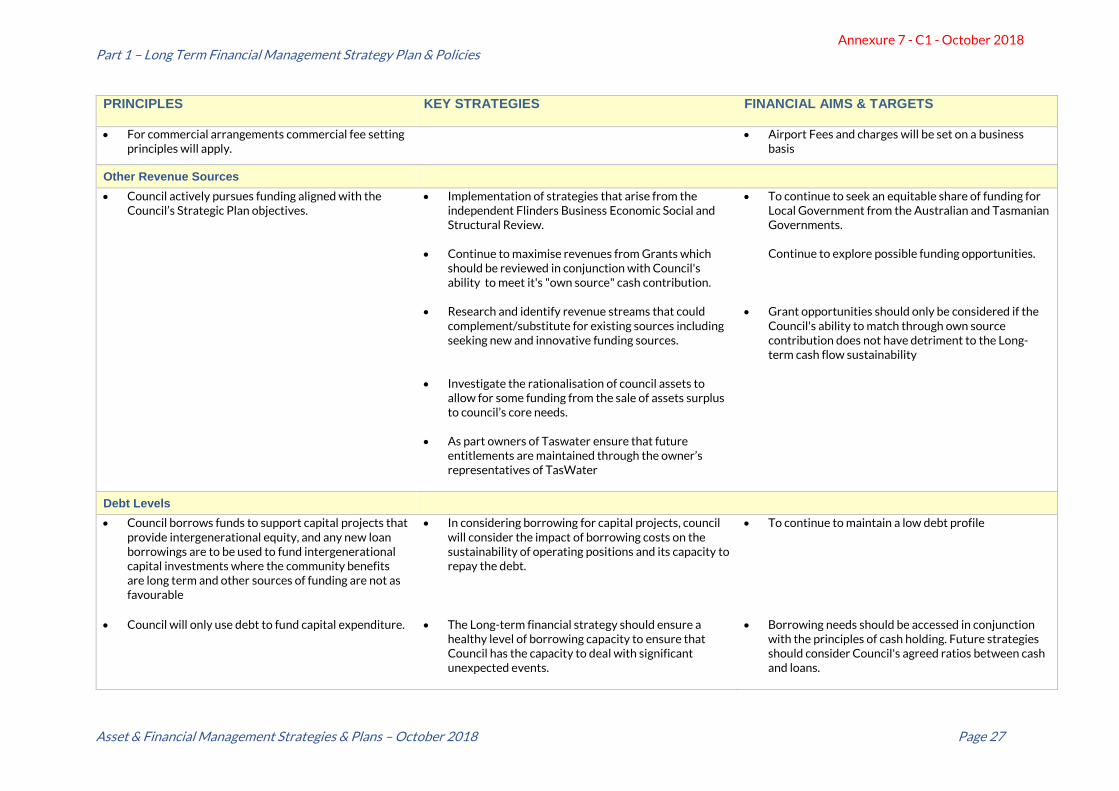
Part 1 – Long Term Financial Management Strategy Plan & Policies
Asset & Financial Management Strategies & Plans – October 2018 Page 27
PRINCIPLES
KEY STRATEGIES FINANCIAL AIMS & TARGETS
• For commercial arrangements commercial fee setting principles will apply.
• Airport Fees and charges will be set on a business basis
Other Revenue Sources
• Council actively pursues funding aligned with the Council’s Strategic Plan objectives.
• Implementation of strategies that arise from the independent Flinders Business Economic Social and Structural Review.
• To continue to seek an equitable share of funding for Local Government from the Australian and Tasmanian Governments.
• Continue to maximise revenues from Grants which should be reviewed in conjunction with Council's ability to meet it's "own source" cash contribution.
Continue to explore possible funding opportunities.
• Research and identify revenue streams that could complement/substitute for existing sources including seeking new and innovative funding sources.
• Grant opportunities should only be considered if the Council's ability to match through own source contribution does not have detriment to the Long-term cash flow sustainability
• Investigate the rationalisation of council assets to allow for some funding from the sale of assets surplus to council’s core needs.
• As part owners of Taswater ensure that future entitlements are maintained through the owner’s representatives of TasWater
Debt Levels
• Council borrows funds to support capital projects that provide intergenerational equity, and any new loan borrowings are to be used to fund intergenerational capital investments where the community benefits are long term and other sources of funding are not as favourable
• In considering borrowing for capital projects, council will consider the impact of borrowing costs on the sustainability of operating positions and its capacity to repay the debt.
• To continue to maintain a low debt profile
• Council will only use debt to fund capital expenditure. • The Long-term financial strategy should ensure a healthy level of borrowing capacity to ensure that Council has the capacity to deal with significant unexpected events.
• Borrowing needs should be accessed in conjunction with the principles of cash holding. Future strategies should consider Council's agreed ratios between cash and loans.
Annexure 7 - C1 - October 2018
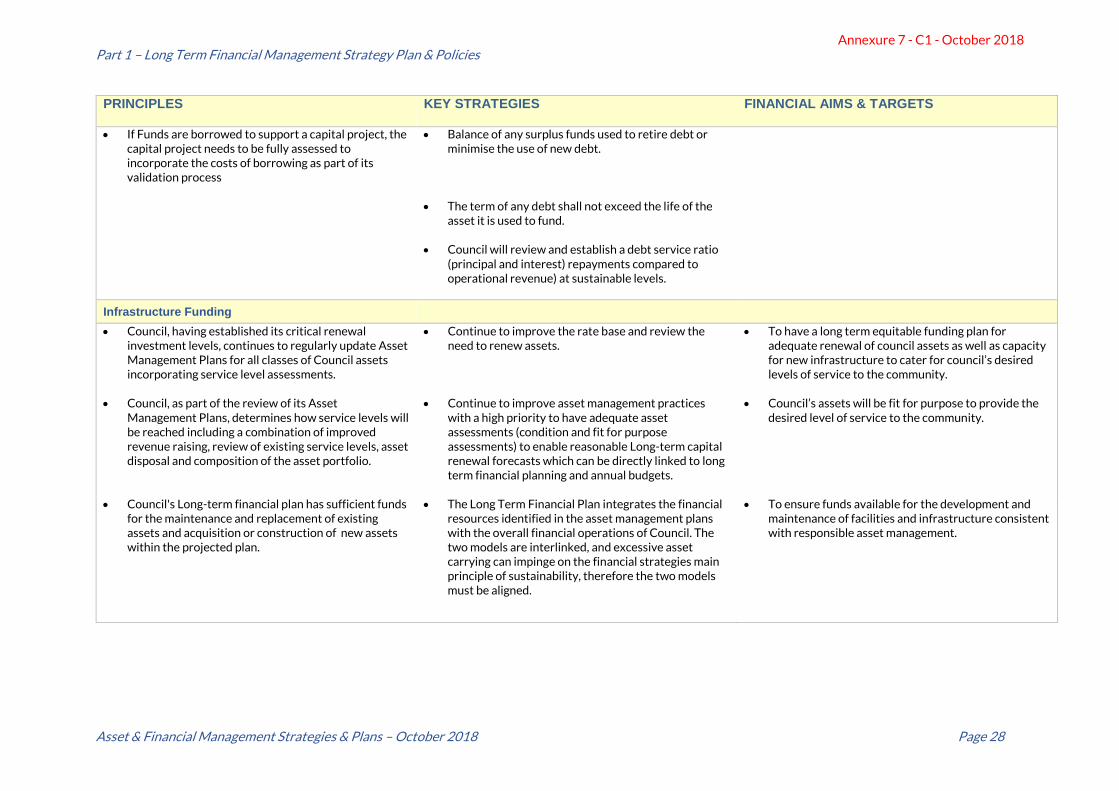
Part 1 – Long Term Financial Management Strategy Plan & Policies
Asset & Financial Management Strategies & Plans – October 2018 Page 28
PRINCIPLES
KEY STRATEGIES FINANCIAL AIMS & TARGETS
• If Funds are borrowed to support a capital project, the capital project needs to be fully assessed to incorporate the costs of borrowing as part of its validation process
• Balance of any surplus funds used to retire debt or minimise the use of new debt.
• The term of any debt shall not exceed the life of the asset it is used to fund.
• Council will review and establish a debt service ratio (principal and interest) repayments compared to operational revenue) at sustainable levels.
Infrastructure Funding
• Council, having established its critical renewal investment levels, continues to regularly update Asset Management Plans for all classes of Council assets incorporating service level assessments.
• Continue to improve the rate base and review the need to renew assets.
• To have a long term equitable funding plan for adequate renewal of council assets as well as capacity for new infrastructure to cater for council’s desired levels of service to the community.
• Council, as part of the review of its Asset Management Plans, determines how service levels will be reached including a combination of improved revenue raising, review of existing service levels, asset disposal and composition of the asset portfolio.
• Continue to improve asset management practices with a high priority to have adequate asset assessments (condition and fit for purpose assessments) to enable reasonable Long-term capital renewal forecasts which can be directly linked to long term financial planning and annual budgets.
• Council’s assets will be fit for purpose to provide the desired level of service to the community.
• Council's Long-term financial plan has sufficient funds for the maintenance and replacement of existing assets and acquisition or construction of new assets within the projected plan.
• The Long Term Financial Plan integrates the financial resources identified in the asset management plans with the overall financial operations of Council. The two models are interlinked, and excessive asset carrying can impinge on the financial strategies main principle of sustainability, therefore the two models must be aligned.
• To ensure funds available for the development and maintenance of facilities and infrastructure consistent with responsible asset management.
Annexure 7 - C1 - October 2018
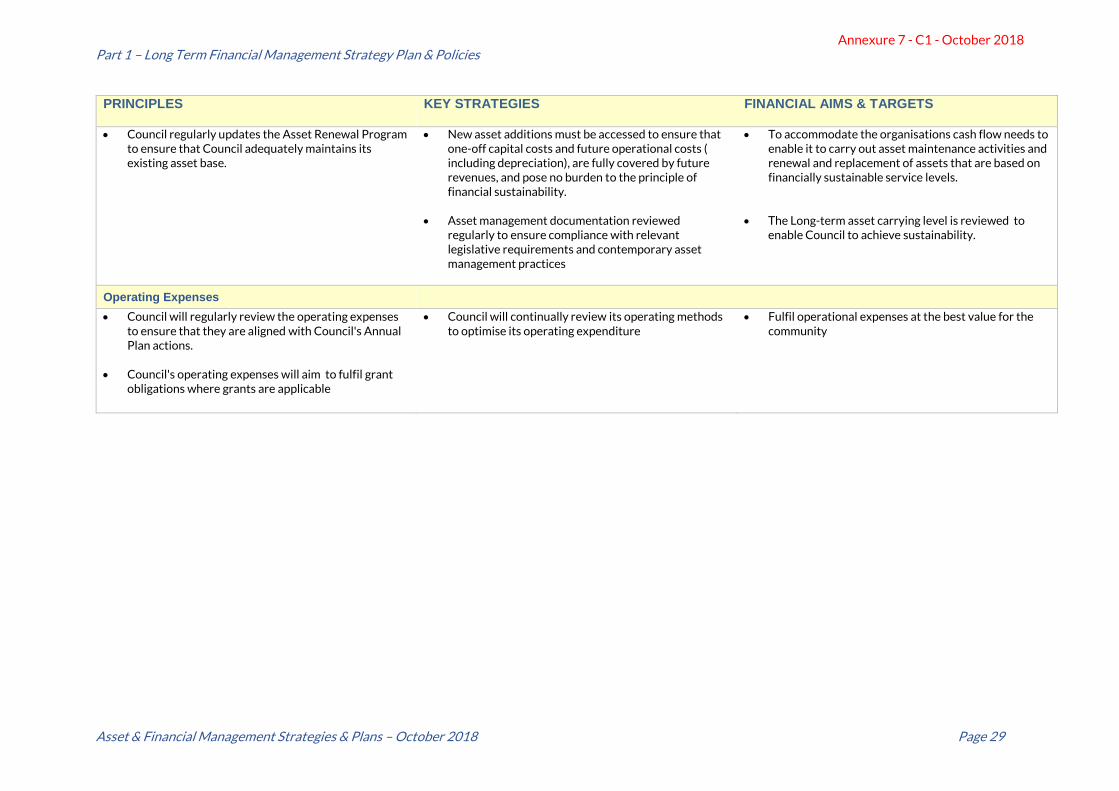
Part 1 – Long Term Financial Management Strategy Plan & Policies
Asset & Financial Management Strategies & Plans – October 2018 Page 29
PRINCIPLES
KEY STRATEGIES FINANCIAL AIMS & TARGETS
• Council regularly updates the Asset Renewal Program to ensure that Council adequately maintains its existing asset base.
• New asset additions must be accessed to ensure that one-off capital costs and future operational costs ( including depreciation), are fully covered by future revenues, and pose no burden to the principle of financial sustainability.
• To accommodate the organisations cash flow needs to enable it to carry out asset maintenance activities and renewal and replacement of assets that are based on financially sustainable service levels.
• Asset management documentation reviewed regularly to ensure compliance with relevant legislative requirements and contemporary asset management practices
• The Long-term asset carrying level is reviewed to enable Council to achieve sustainability.
Operating Expenses
• Council will regularly review the operating expenses to ensure that they are aligned with Council's Annual Plan actions.
• Council will continually review its operating methods to optimise its operating expenditure
• Fulfil operational expenses at the best value for the community
• Council's operating expenses will aim to fulfil grant obligations where grants are applicable
Annexure 7 - C1 - October 2018
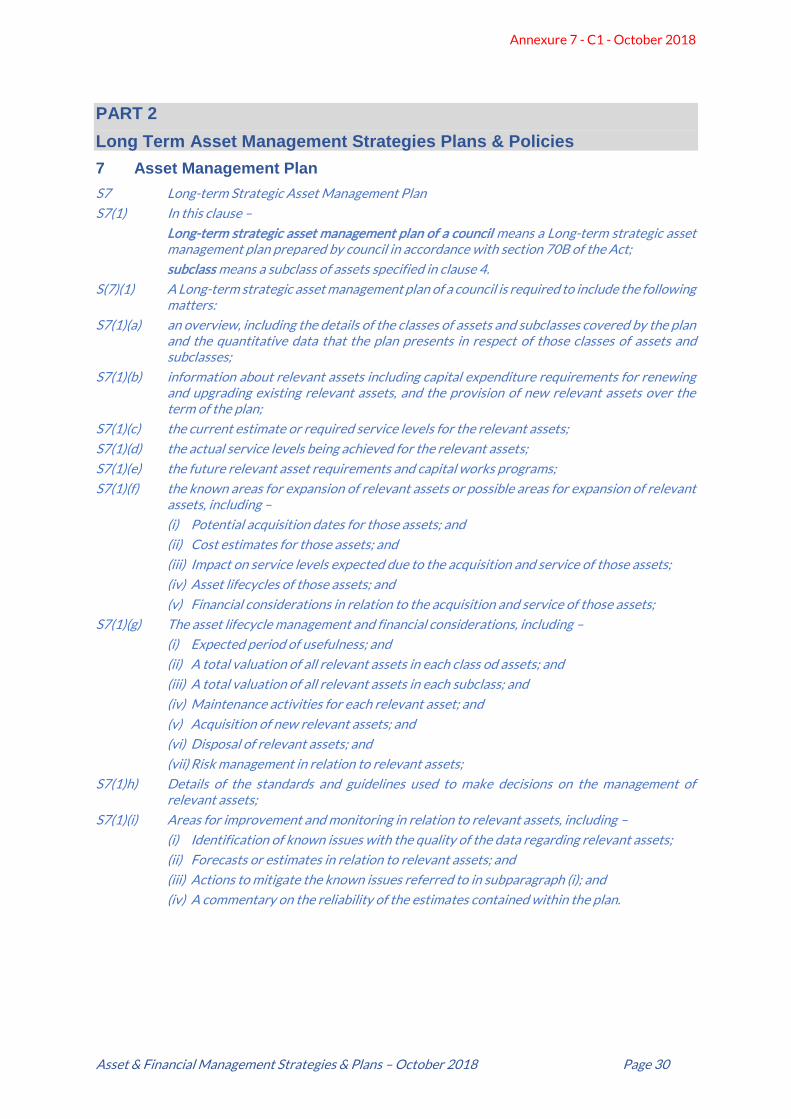
Asset & Financial Management Strategies & Plans – October 2018 Page 30
PART 2
Long Term Asset Management Strategies Plans & Policies
7 Asset Management Plan
S7 Long-term Strategic Asset Management Plan
S7(1) In this clause –
Long-term strategic asset management plan of a council means a Long-term strategic asset management plan prepared by council in accordance with section 70B of the Act;
subclass means a subclass of assets specified in clause 4.
S(7)(1) A Long-term strategic asset management plan of a council is required to include the following matters:
S7(1)(a) an overview, including the details of the classes of assets and subclasses covered by the plan and the quantitative data that the plan presents in respect of those classes of assets and subclasses;
S7(1)(b) information about relevant assets including capital expenditure requirements for renewing and upgrading existing relevant assets, and the provision of new relevant assets over the term of the plan;
S7(1)(c) the current estimate or required service levels for the relevant assets;
S7(1)(d) the actual service levels being achieved for the relevant assets;
S7(1)(e) the future relevant asset requirements and capital works programs;
S7(1)(f) the known areas for expansion of relevant assets or possible areas for expansion of relevant assets, including –
(i) Potential acquisition dates for those assets; and
(ii) Cost estimates for those assets; and
(iii) Impact on service levels expected due to the acquisition and service of those assets;
(iv) Asset lifecycles of those assets; and
(v) Financial considerations in relation to the acquisition and service of those assets;
S7(1)(g) The asset lifecycle management and financial considerations, including –
(i) Expected period of usefulness; and
(ii) A total valuation of all relevant assets in each class od assets; and
(iii) A total valuation of all relevant assets in each subclass; and
(iv) Maintenance activities for each relevant asset; and
(v) Acquisition of new relevant assets; and
(vi) Disposal of relevant assets; and
(vii) Risk management in relation to relevant assets;
S7(1)h) Details of the standards and guidelines used to make decisions on the management of relevant assets;
S7(1)(i) Areas for improvement and monitoring in relation to relevant assets, including –
(i) Identification of known issues with the quality of the data regarding relevant assets;
(ii) Forecasts or estimates in relation to relevant assets; and
(iii) Actions to mitigate the known issues referred to in subparagraph (i); and
(iv) A commentary on the reliability of the estimates contained within the plan.
Annexure 7 - C1 - October 2018
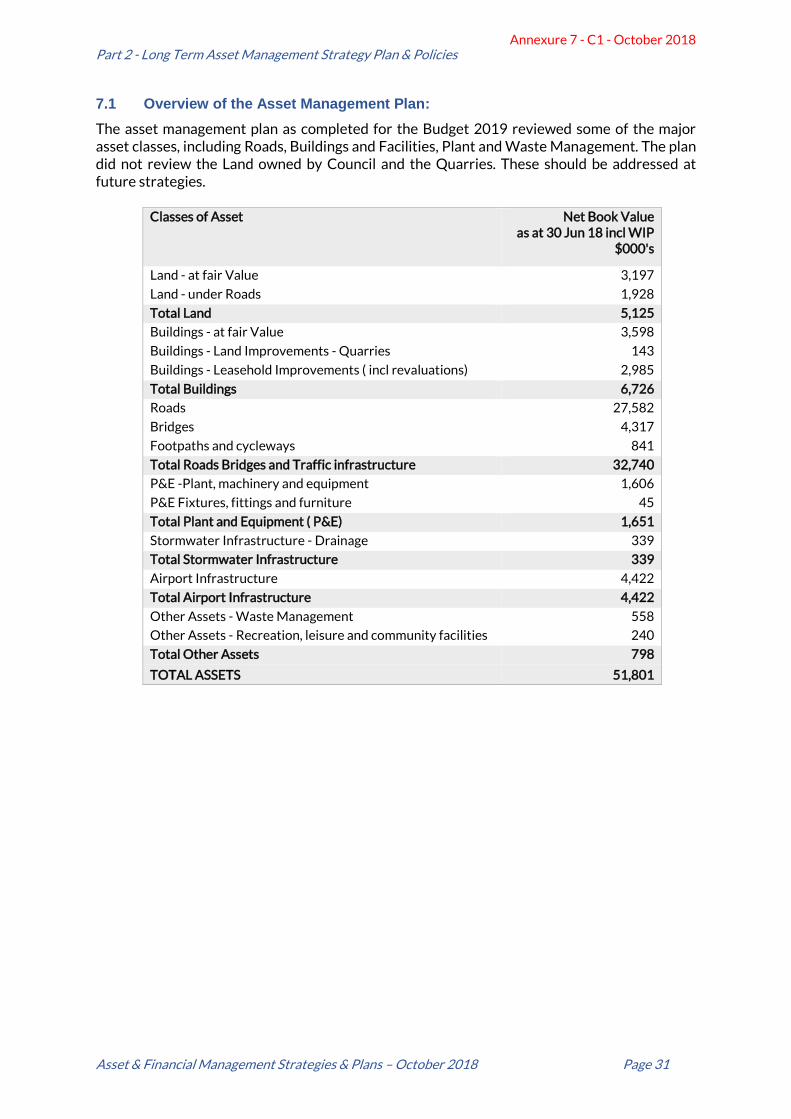
Part 2 - Long Term Asset Management Strategy Plan & Policies
Asset & Financial Management Strategies & Plans – October 2018 Page 31
7.1 Overview of the Asset Management Plan:
The asset management plan as completed for the Budget 2019 reviewed some of the major asset classes, including Roads, Buildings and Facilities, Plant and Waste Management. The plan did not review the Land owned by Council and the Quarries. These should be addressed at future strategies.
Classes of Asset Net Book Value as at 30 Jun 18 incl WIP
$000's
Land - at fair Value 3,197
Land - under Roads 1,928
Total Land 5,125
Buildings - at fair Value 3,598
Buildings - Land Improvements - Quarries 143
Buildings - Leasehold Improvements ( incl revaluations) 2,985
Total Buildings 6,726
Roads 27,582
Bridges 4,317
Footpaths and cycleways 841
Total Roads Bridges and Traffic infrastructure 32,740
P&E -Plant, machinery and equipment 1,606
P&E Fixtures, fittings and furniture 45
Total Plant and Equipment ( P&E) 1,651
Stormwater Infrastructure - Drainage 339
Total Stormwater Infrastructure 339
Airport Infrastructure 4,422
Total Airport Infrastructure 4,422
Other Assets - Waste Management 558
Other Assets - Recreation, leisure and community facilities 240
Total Other Assets 798
TOTAL ASSETS 51,801
Annexure 7 - C1 - October 2018
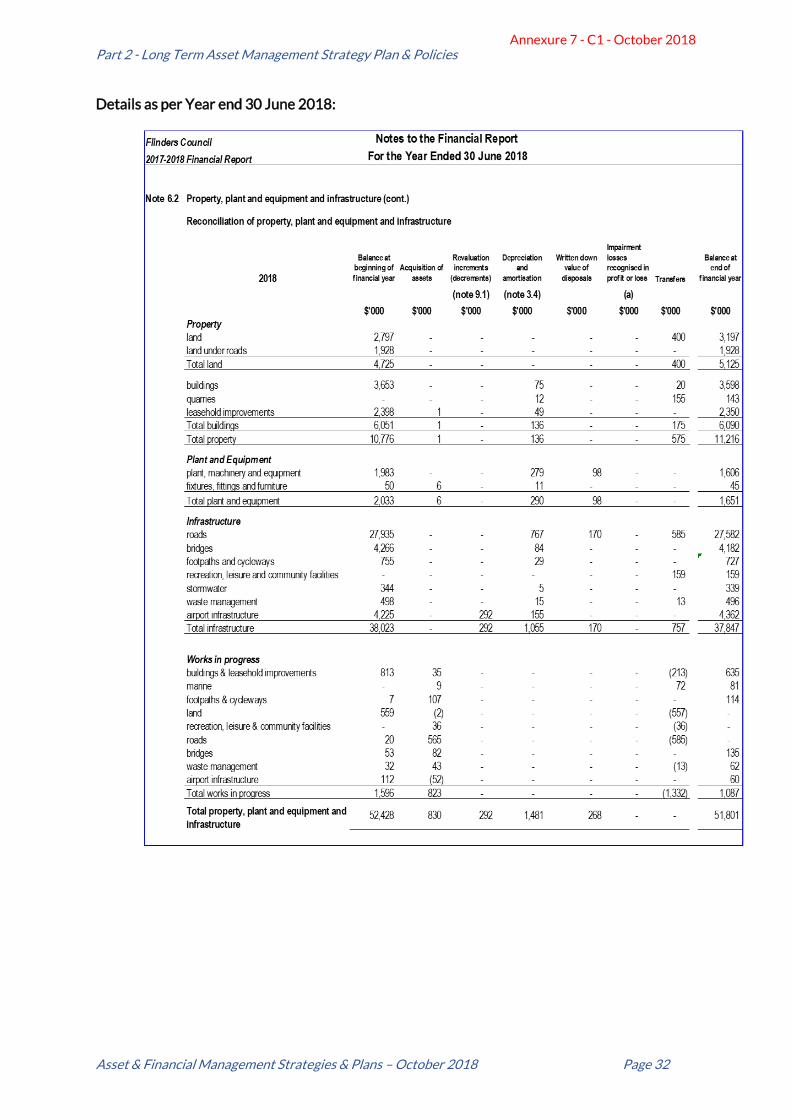
Part 2 - Long Term Asset Management Strategy Plan & Policies
Asset & Financial Management Strategies & Plans – October 2018 Page 32
Details as per Year end 30 June 2018:
Annexure 7 - C1 - October 2018
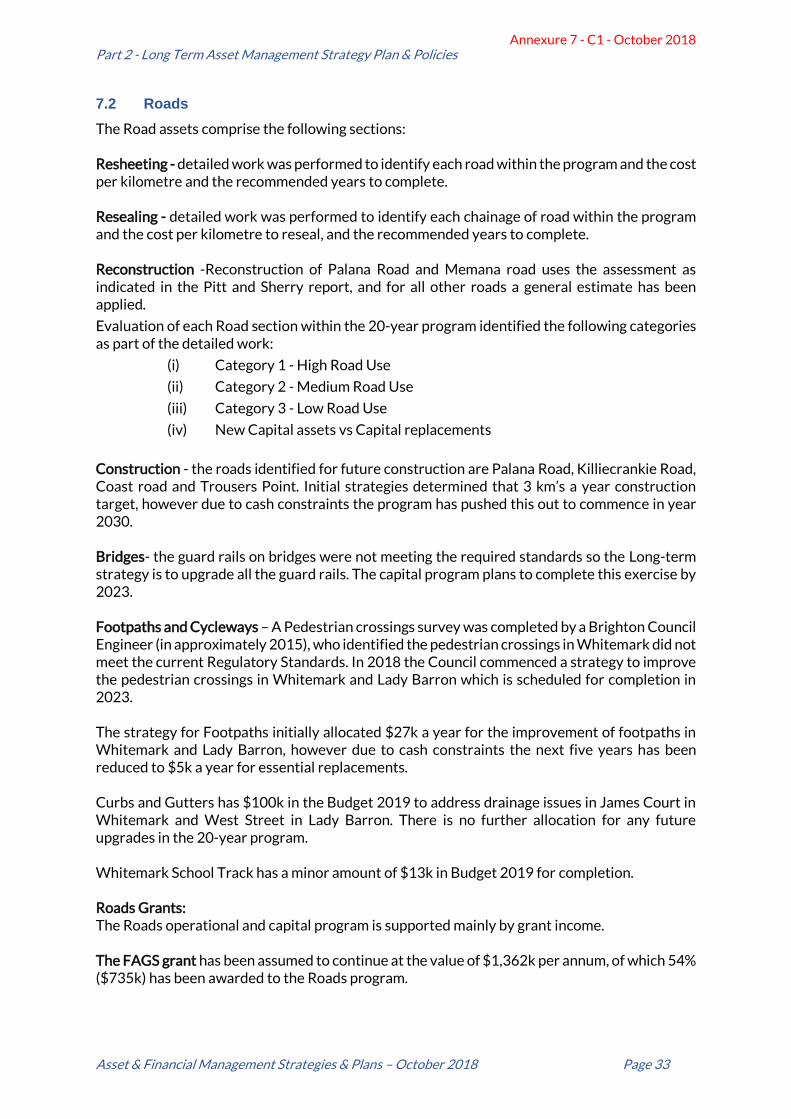
Part 2 - Long Term Asset Management Strategy Plan & Policies
Asset & Financial Management Strategies & Plans – October 2018 Page 33
7.2 Roads
The Road assets comprise the following sections: Resheeting - detailed work was performed to identify each road within the program and the cost per kilometre and the recommended years to complete. Resealing - detailed work was performed to identify each chainage of road within the program and the cost per kilometre to reseal, and the recommended years to complete. Reconstruction -Reconstruction of Palana Road and Memana road uses the assessment as indicated in the Pitt and Sherry report, and for all other roads a general estimate has been applied.
Evaluation of each Road section within the 20-year program identified the following categories as part of the detailed work:
(i) Category 1 - High Road Use
(ii) Category 2 - Medium Road Use
(iii) Category 3 - Low Road Use
(iv) New Capital assets vs Capital replacements
Construction - the roads identified for future construction are Palana Road, Killiecrankie Road, Coast road and Trousers Point. Initial strategies determined that 3 km’s a year construction target, however due to cash constraints the program has pushed this out to commence in year 2030. Bridges- the guard rails on bridges were not meeting the required standards so the Long-term strategy is to upgrade all the guard rails. The capital program plans to complete this exercise by 2023. Footpaths and Cycleways – A Pedestrian crossings survey was completed by a Brighton Council Engineer (in approximately 2015), who identified the pedestrian crossings in Whitemark did not meet the current Regulatory Standards. In 2018 the Council commenced a strategy to improve the pedestrian crossings in Whitemark and Lady Barron which is scheduled for completion in 2023. The strategy for Footpaths initially allocated $27k a year for the improvement of footpaths in Whitemark and Lady Barron, however due to cash constraints the next five years has been reduced to $5k a year for essential replacements. Curbs and Gutters has $100k in the Budget 2019 to address drainage issues in James Court in Whitemark and West Street in Lady Barron. There is no further allocation for any future upgrades in the 20-year program. Whitemark School Track has a minor amount of $13k in Budget 2019 for completion. Roads Grants: The Roads operational and capital program is supported mainly by grant income.
The FAGS grant has been assumed to continue at the value of $1,362k per annum, of which 54% ($735k) has been awarded to the Roads program.
Annexure 7 - C1 - October 2018
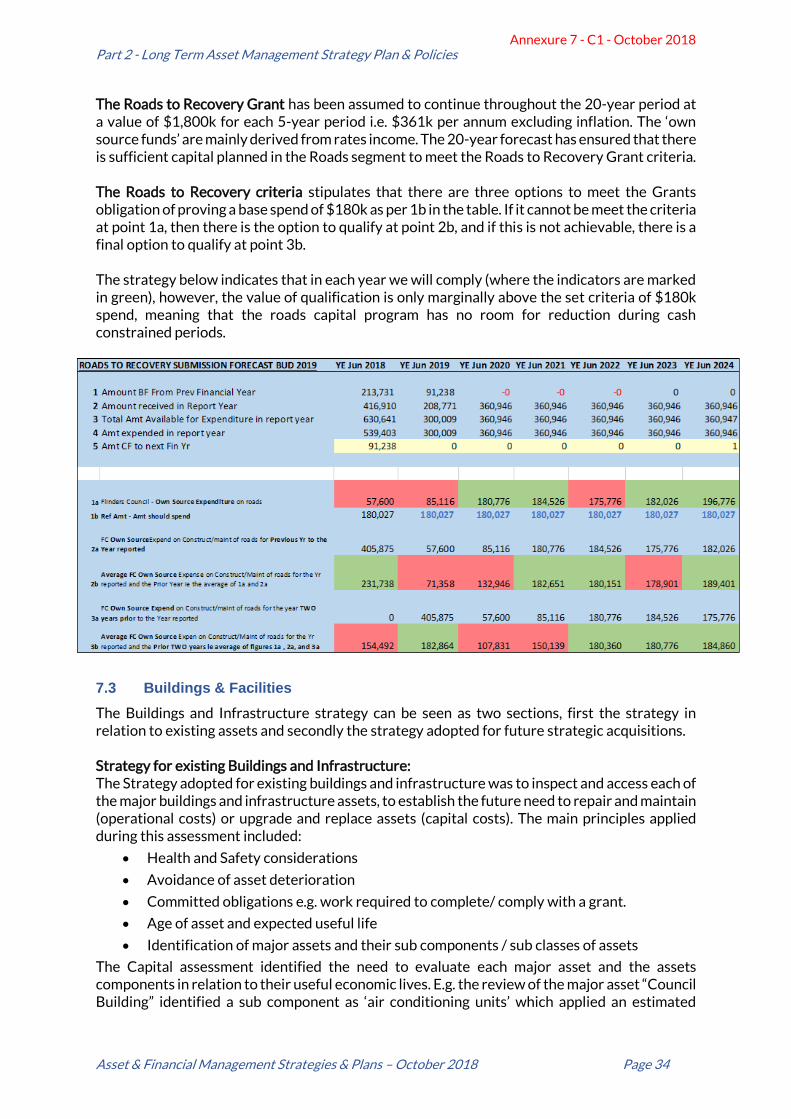
Part 2 - Long Term Asset Management Strategy Plan & Policies
Asset & Financial Management Strategies & Plans – October 2018 Page 34
The Roads to Recovery Grant has been assumed to continue throughout the 20-year period at a value of $1,800k for each 5-year period i.e. $361k per annum excluding inflation. The ‘own source funds’ are mainly derived from rates income. The 20-year forecast has ensured that there is sufficient capital planned in the Roads segment to meet the Roads to Recovery Grant criteria.
The Roads to Recovery criteria stipulates that there are three options to meet the Grants obligation of proving a base spend of $180k as per 1b in the table. If it cannot be meet the criteria at point 1a, then there is the option to qualify at point 2b, and if this is not achievable, there is a final option to qualify at point 3b.
The strategy below indicates that in each year we will comply (where the indicators are marked in green), however, the value of qualification is only marginally above the set criteria of $180k spend, meaning that the roads capital program has no room for reduction during cash constrained periods.
7.3 Buildings & Facilities
The Buildings and Infrastructure strategy can be seen as two sections, first the strategy in relation to existing assets and secondly the strategy adopted for future strategic acquisitions. Strategy for existing Buildings and Infrastructure: The Strategy adopted for existing buildings and infrastructure was to inspect and access each of the major buildings and infrastructure assets, to establish the future need to repair and maintain (operational costs) or upgrade and replace assets (capital costs). The main principles applied during this assessment included:
• Health and Safety considerations
• Avoidance of asset deterioration
• Committed obligations e.g. work required to complete/ comply with a grant.
• Age of asset and expected useful life
• Identification of major assets and their sub components / sub classes of assets
The Capital assessment identified the need to evaluate each major asset and the assets components in relation to their useful economic lives. E.g. the review of the major asset “Council Building” identified a sub component as ‘air conditioning units’ which applied an estimated
Annexure 7 - C1 - October 2018
Part 2 - Long Term Asset Management Strategy Plan & Policies
Asset & Financial Management Strategies & Plans – October 2018 Page 35
useful economic life of 10 years, and therefore were scheduled into the capital replacement as such – depending on their approximate date of acquisition. Strategy for future building and infrastructure acquisitions: In this category, several categories were identified and initially planned for. However due to a restrictive cashflow projection, many of these were amended and either pushed out into further time periods or the values were reduced, so as to present a financially viable projection. The following programs have been identified in the 20-year strategy.
• Safe Harbour – The Safe Harbour project at Lady Baron is subject to receiving grant funding. At present the grant has been declined, however Council are hopeful to resubmit an application in future and achieve a successful outcome. The total cost is estimated to be $5.5m, with two Grants - BBR Grant $4.1m and a State Government Grant $900k. The balance of $469k will need to be funded by Flinders Council.
• General Community Infrastructure - this was pushed out from 2023 to 2029 and the amount reduced from $2815k to $1000k. The amount represents a strategic view to set aside a proportion of funds to assist in the development of community infrastructure, which would hopefully be majority grant supported.
• Whitemark Foreshores and Streetscape – this program was pushed out to commence in 2023 and was significantly reduced. It consists of Whitemark Foreshore Development $90k to commence in 2023; Whitemark Street Scape Development $100k to commence in 2023; and Whitemark Lagoon Road development $150k to commence in 2029.
7.4 Waste Management Program
The regulatory requirements in relation to environmental management and pollution control have become stricter over the last few years. The Council has therefore developed a strategy to comply with the regulations, to avoid heavy fines and adverse consequences of running out of landfill sites. Four options were identified, and the adopted strategy at Budget 19 was option four. The Strategic reasonings underpinning the choice of option 4 include:
• The most optimum choice was Option 2, which is the collection of mobile garbage bins from households. This allows for waste sorting prior to collection, therefore minimising the area to bury waste. The Strategy places its greatest importance on minimising waste to landfill, and this option estimates the current landfill would be sufficient until 2050. Though this was one of the costlier options it gave the maximum life expectancy of our current landfill site. The downside of commencing with this option immediately is the inability of Council to deliver this option within the short term by doing it inhouse, and in an affordable way. In addition, communicating and educating the community will take time.
• Option 3 was the second choice which aimed to keep the transfer stations and bale all waste to landfill, apart from the cardboard. This option although very similar in cost structure, showing marginal benefits in cost, indicated that the same landfill would only be sufficient until 2039 (11 years less than option 2). The advantage of this option was the ease of transitioning from current practices.
• Option 4 was chosen as a bridge between the most optimal Option 2 and the second Option 3. This plans to use option 3 for a four-year period, to allow time to shift to option 2.
Below is a snapshot of the options presented in the strategy.
Annexure 7 - C1 - October 2018
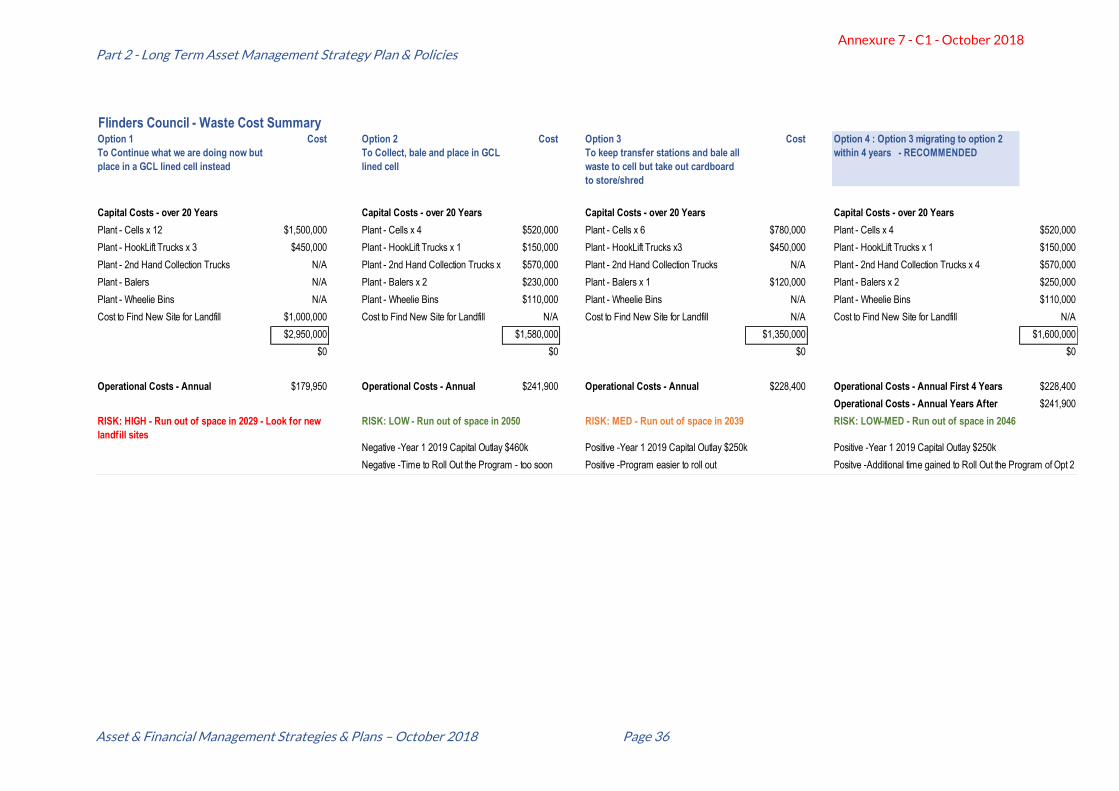
Part 2 - Long Term Asset Management Strategy Plan & Policies
Asset & Financial Management Strategies & Plans – October 2018 Page 36
Flinders Council - Waste Cost SummaryOption 1
To Continue what we are doing now but
place in a GCL lined cell instead
Cost Option 2
To Collect, bale and place in GCL
lined cell
Cost Option 3
To keep transfer stations and bale all
waste to cell but take out cardboard
to store/shred
Cost Option 4 : Option 3 migrating to option 2
within 4 years - RECOMMENDED
Capital Costs - over 20 Years Capital Costs - over 20 Years Capital Costs - over 20 Years Capital Costs - over 20 Years
Plant - Cells x 12 $1,500,000 Plant - Cells x 4 $520,000 Plant - Cells x 6 $780,000 Plant - Cells x 4 $520,000
Plant - HookLift Trucks x 3 $450,000 Plant - HookLift Trucks x 1 $150,000 Plant - HookLift Trucks x3 $450,000 Plant - HookLift Trucks x 1 $150,000
Plant - 2nd Hand Collection Trucks N/A Plant - 2nd Hand Collection Trucks x 4 $570,000 Plant - 2nd Hand Collection Trucks N/A Plant - 2nd Hand Collection Trucks x 4 $570,000
Plant - Balers N/A Plant - Balers x 2 $230,000 Plant - Balers x 1 $120,000 Plant - Balers x 2 $250,000
Plant - Wheelie Bins N/A Plant - Wheelie Bins $110,000 Plant - Wheelie Bins N/A Plant - Wheelie Bins $110,000
Cost to Find New Site for Landfill $1,000,000 Cost to Find New Site for Landfill N/A Cost to Find New Site for Landfill N/A Cost to Find New Site for Landfill N/A
$2,950,000 $1,580,000 $1,350,000 $1,600,000
$0 $0 $0 $0
Operational Costs - Annual $179,950 Operational Costs - Annual $241,900 Operational Costs - Annual $228,400 Operational Costs - Annual First 4 Years $228,400
Operational Costs - Annual Years After $241,900
RISK: LOW - Run out of space in 2050 RISK: MED - Run out of space in 2039 RISK: LOW-MED - Run out of space in 2046
Negative -Year 1 2019 Capital Outlay $460k Positive -Year 1 2019 Capital Outlay $250k Positive -Year 1 2019 Capital Outlay $250k
Negative -Time to Roll Out the Program - too soon Positive -Program easier to roll out Positve -Additional time gained to Roll Out the Program of Opt 2
RISK: HIGH - Run out of space in 2029 - Look for new
landfill sites
Annexure 7 - C1 - October 2018
Part 2 - Long Term Asset Management Strategy Plan & Policies
Asset & Financial Management Strategies & Plans – October 2018 Page 37
7.5 Plant and Machinery
Plant replacement and maintenance is affected by the Island’s ‘Small and Remote disadvantage’ – where we are required to hold and maintain expensive, under-utilised plant and machinery. Hiring locally does not present as an option, for there is nowhere to hire machinery that is suitable for Council works on the Island. Hiring from mainland Tasmania is not a viable option - though no detailed work has been performed to establish the credibility of the following assumption, it is believed that constraints with high transport costs and unreliable weather patterns would make this option unviable. It is believed that the ability to service the community (especially on the Roads program) would result in an adverse impact through our inability to respond in a timely manner. Leasing options, few gains to be achieved – For larger equipment, it is believed that there are few gains to be achieved in this area as most of the more expensive machines are purchased second hand (realising cost savings) because of the lower utilisation of assets of Flinders Island. For the small to medium sized assets like vehicles and smaller trucks, the option to Lease has not yet been explored and may be considered for future strategies if they are more cost effective.
7.6 Land – Council owned Land
Flinders Council has identified that there is a need to review the use of land assets held by Council, and whether some of these assets may be released for public sale, to aid future funding or achieve better utilisation of community resources. The strategy to evaluate Council Owned Land has not been performed at this time and requires further analysis of the principles that need to be adopted to provide objectivity and clear decision making. Such a strategy would need to be in alignment with the overarching financial and asset management principles which are the framework of the Long-term plans.
7.7 Airport Infrastructure
The Airport Infrastructure has been included under the various classes of Roads, Buildings & Infrastructure or Plant when completing the 20-year capital program. For this strategy, an exercise has been undertaken in the Financial Management Plan to segment the activities of the Airport as separate to the Municipality in order to evaluate the impacts of the Airports asset management requirements on its financial sustainability. The Current Strategy does not present the Airport as a sustainable operation and therefore needs to identify ways of increasing future revenue, to meet the large capital outlays for the Airport Runways.
Reconstruction – Airport Runways:
• Reconstruction - Runway 14-32 -Stabilise and Upgrade long runway at airport. This is subject to External funding. The estimated cost totals $3.6 million with an assumption that a 50% grant of $1.8million will be received, leaving a balance of $1.8million to be funded by Council in year 2022.
• Reconstruction Runway 05-23 -Stabilise and Upgrade short runway at airport. This is subject to External funding. The estimated cost totals $2.2 million with an assumption that a 50% grant of $1.1million will be received, leaving a balance of $1.1million to be funded by Council in year 2033
Annexure 7 - C1 - October 2018
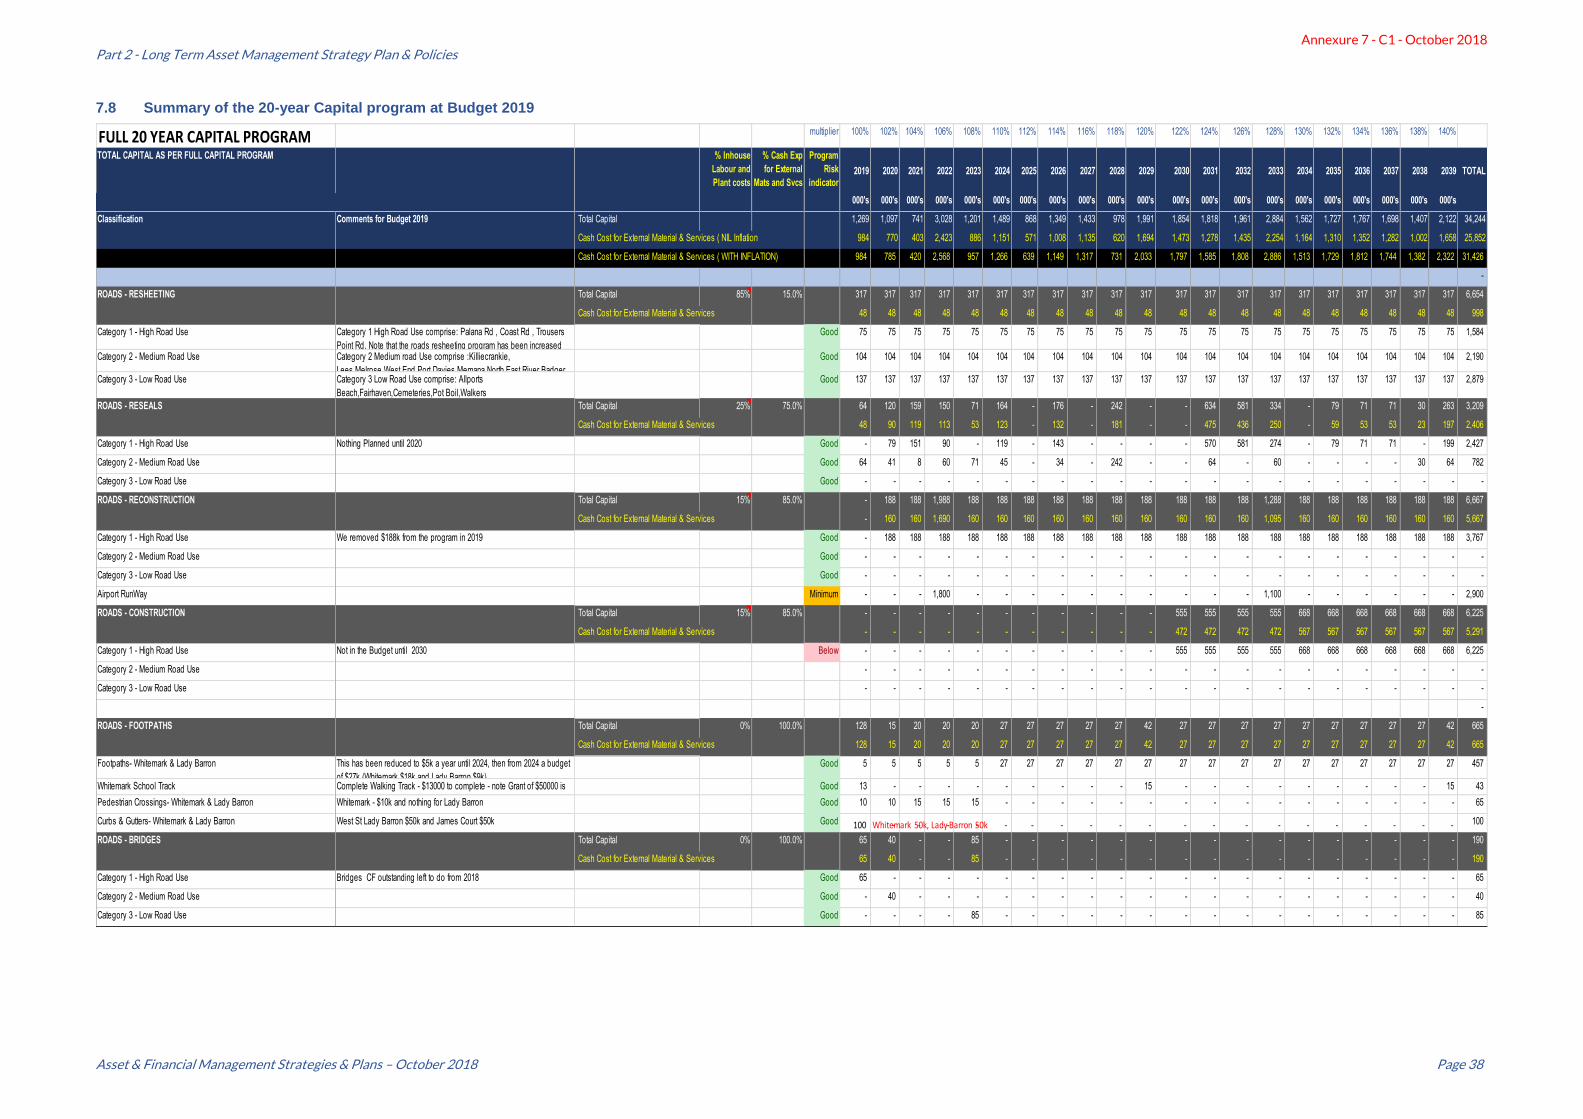
Part 2 - Long Term Asset Management Strategy Plan & Policies
Asset & Financial Management Strategies & Plans – October 2018 Page 38
7.8 Summary of the 20-year Capital program at Budget 2019
FULL 20 YEAR CAPITAL PROGRAM multiplier 100% 102% 104% 106% 108% 110% 112% 114% 116% 118% 120% 122% 124% 126% 128% 130% 132% 134% 136% 138% 140%
TOTAL CAPITAL AS PER FULL CAPITAL PROGRAM % Inhouse
Labour and
Plant costs
% Cash Exp
for External
Mats and Svcs
Program
Risk
indicator2019 2020 2021 2022 2023 2024 2025 2026 2027 2028 2029 2030 2031 2032 2033 2034 2035 2036 2037 2038 2039 TOTAL
000's 000's 000's 000's 000's 000's 000's 000's 000's 000's 000's 000's 000's 000's 000's 000's 000's 000's 000's 000's 000's
Classification Comments for Budget 2019 Total Capital 1,269 1,097 741 3,028 1,201 1,489 868 1,349 1,433 978 1,991 1,854 1,818 1,961 2,884 1,562 1,727 1,767 1,698 1,407 2,122 34,244
Cash Cost for External Material & Services ( NIL Inflation 984 770 403 2,423 886 1,151 571 1,008 1,135 620 1,694 1,473 1,278 1,435 2,254 1,164 1,310 1,352 1,282 1,002 1,658 25,852
Cash Cost for External Material & Services ( WITH INFLATION) 984 785 420 2,568 957 1,266 639 1,149 1,317 731 2,033 1,797 1,585 1,808 2,886 1,513 1,729 1,812 1,744 1,382 2,322 31,426
-
ROADS - RESHEETING Total Capital 85% 15.0% 317 317 317 317 317 317 317 317 317 317 317 317 317 317 317 317 317 317 317 317 317 6,654
Cash Cost for External Material & Services 48 48 48 48 48 48 48 48 48 48 48 48 48 48 48 48 48 48 48 48 48 998
Category 1 - High Road Use Category 1 High Road Use comprise: Palana Rd , Coast Rd , Trousers
Point Rd. Note that the roads resheeting program has been increased
Good 75 75 75 75 75 75 75 75 75 75 75 75 75 75 75 75 75 75 75 75 75 1,584
Category 2 - Medium Road Use Category 2 Medium road Use comprise :Killiecrankie,
Lees,Melrose,West End,Port Davies,Memana,North East River,Badger
Good 104 104 104 104 104 104 104 104 104 104 104 104 104 104 104 104 104 104 104 104 104 2,190
Category 3 - Low Road Use Category 3 Low Road Use comprise: Allports
Beach,Fairhaven,Cemeteries,Pot Boil,Walkers
Good 137 137 137 137 137 137 137 137 137 137 137 137 137 137 137 137 137 137 137 137 137 2,879
ROADS - RESEALS Total Capital 25% 75.0% 64 120 159 150 71 164 - 176 - 242 - - 634 581 334 - 79 71 71 30 263 3,209
Cash Cost for External Material & Services 48 90 119 113 53 123 - 132 - 181 - - 475 436 250 - 59 53 53 23 197 2,406
Category 1 - High Road Use Nothing Planned until 2020 Good - 79 151 90 - 119 - 143 - - - - 570 581 274 - 79 71 71 - 199 2,427
Category 2 - Medium Road Use Good 64 41 8 60 71 45 - 34 - 242 - - 64 - 60 - - - - 30 64 782
Category 3 - Low Road Use Good - - - - - - - - - - - - - - - - - - - - - -
ROADS - RECONSTRUCTION Total Capital 15% 85.0% - 188 188 1,988 188 188 188 188 188 188 188 188 188 188 1,288 188 188 188 188 188 188 6,667
Cash Cost for External Material & Services - 160 160 1,690 160 160 160 160 160 160 160 160 160 160 1,095 160 160 160 160 160 160 5,667
Category 1 - High Road Use We removed $188k from the program in 2019 Good - 188 188 188 188 188 188 188 188 188 188 188 188 188 188 188 188 188 188 188 188 3,767
Category 2 - Medium Road Use Good - - - - - - - - - - - - - - - - - - - - - -
Category 3 - Low Road Use Good - - - - - - - - - - - - - - - - - - - - - -
Airport RunWay Minimum - - - 1,800 - - - - - - - - - - 1,100 - - - - - - 2,900
ROADS - CONSTRUCTION Total Capital 15% 85.0% - - - - - - - - - - - 555 555 555 555 668 668 668 668 668 668 6,225
Cash Cost for External Material & Services - - - - - - - - - - - 472 472 472 472 567 567 567 567 567 567 5,291
Category 1 - High Road Use Not in the Budget until 2030 Below - - - - - - - - - - - 555 555 555 555 668 668 668 668 668 668 6,225
Category 2 - Medium Road Use - - - - - - - - - - - - - - - - - - - - - -
Category 3 - Low Road Use - - - - - - - - - - - - - - - - - - - - - -
-
ROADS - FOOTPATHS Total Capital 0% 100.0% 128 15 20 20 20 27 27 27 27 27 42 27 27 27 27 27 27 27 27 27 42 665
Cash Cost for External Material & Services 128 15 20 20 20 27 27 27 27 27 42 27 27 27 27 27 27 27 27 27 42 665
Footpaths- Whitemark & Lady Barron This has been reduced to $5k a year until 2024, then from 2024 a budget
of $27k (Whitemark $18k and Lady Barron $9k)
Good 5 5 5 5 5 27 27 27 27 27 27 27 27 27 27 27 27 27 27 27 27 457
Whitemark School Track Complete Walking Track - $13000 to complete - note Grant of $50000 is
due to be received in 2019. -Total cost of Track 78000 over 2018 and
Good 13 - - - - - - - - - 15 - - - - - - - - - 15 43
Pedestrian Crossings- Whitemark & Lady Barron Whitemark - $10k and nothing for Lady Barron Good 10 10 15 15 15 - - - - - - - - - - - - - - - - 65
Curbs & Gutters- Whitemark & Lady Barron West St Lady Barron $50k and James Court $50k Good 100 - - - - - - - - - - - - - - - - - - - - 100
ROADS - BRIDGES Total Capital 0% 100.0% 65 40 - - 85 - - - - - - - - - - - - - - - - 190
Cash Cost for External Material & Services 65 40 - - 85 - - - - - - - - - - - - - - - - 190
Category 1 - High Road Use Bridges CF outstanding left to do from 2018 Good 65 - - - - - - - - - - - - - - - - - - - - 65
Category 2 - Medium Road Use Good - 40 - - - - - - - - - - - - - - - - - - - 40
Category 3 - Low Road Use Good - - - - 85 - - - - - - - - - - - - - - - - 85
Whitemark 50k, Lady Barron 50k
Annexure 7 - C1 - October 2018
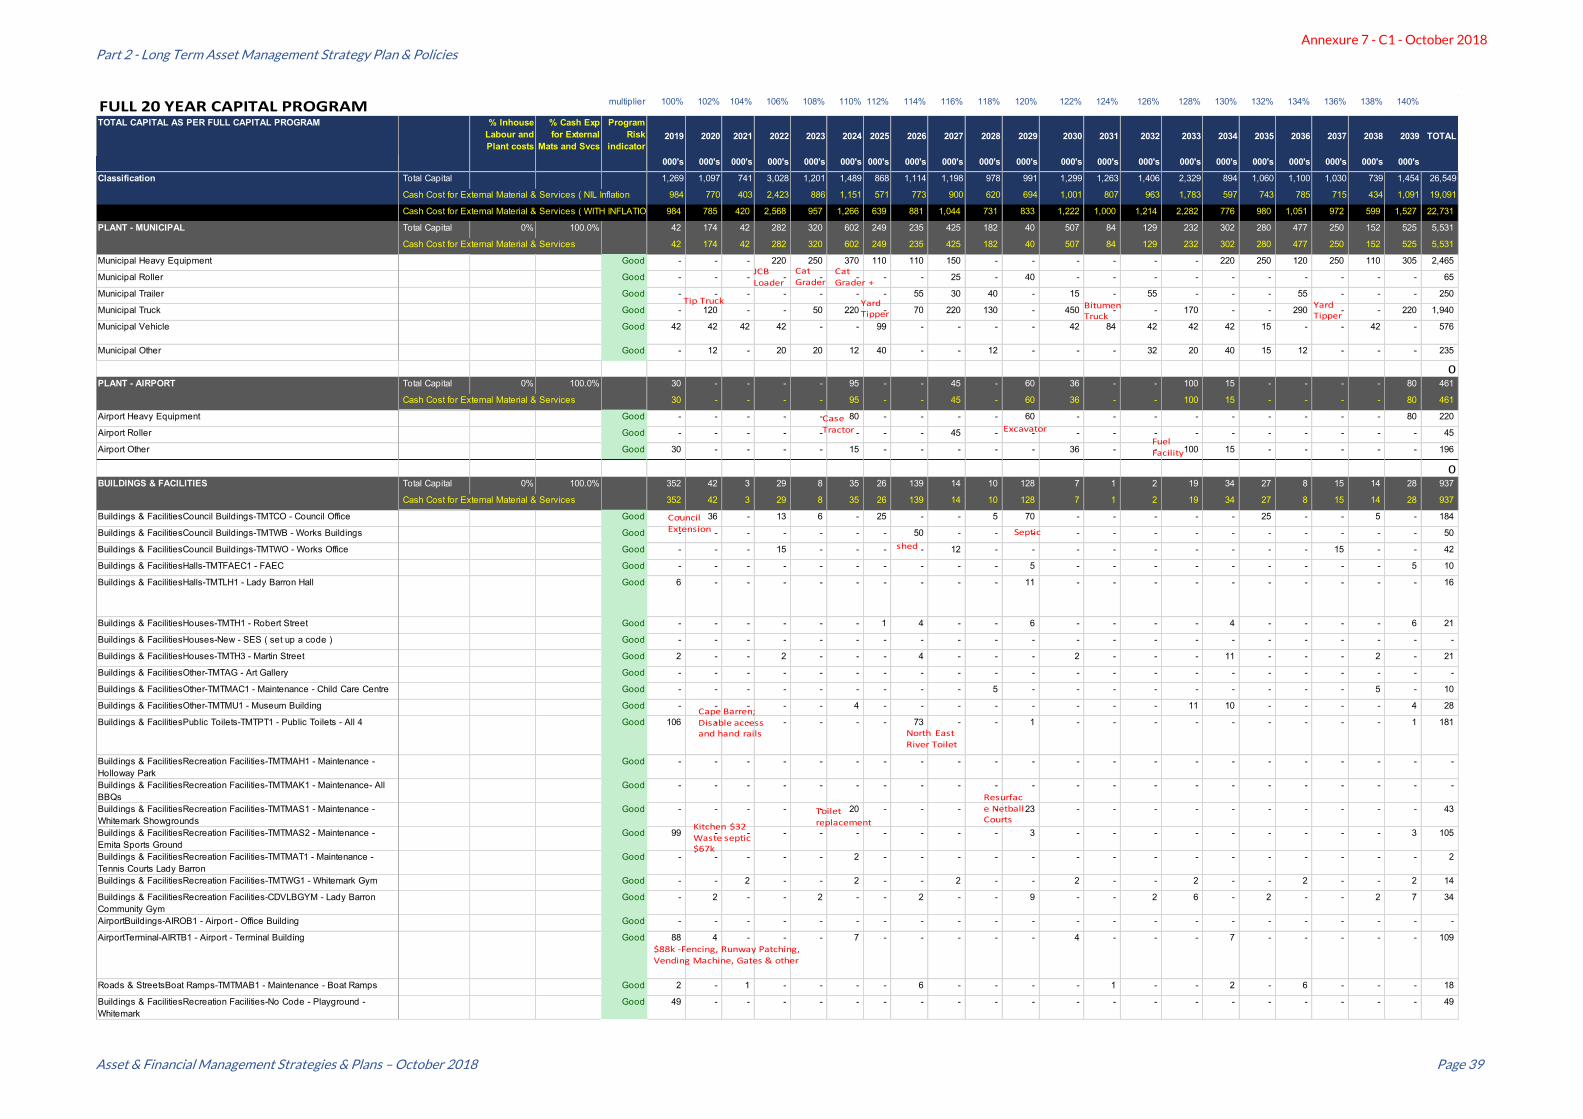
Part 2 - Long Term Asset Management Strategy Plan & Policies
Asset & Financial Management Strategies & Plans – October 2018 Page 39
FULL 20 YEAR CAPITAL PROGRAM multiplier 100% 102% 104% 106% 108% 110% 112% 114% 116% 118% 120% 122% 124% 126% 128% 130% 132% 134% 136% 138% 140%
TOTAL CAPITAL AS PER FULL CAPITAL PROGRAM % Inhouse
Labour and
Plant costs
% Cash Exp
for External
Mats and Svcs
Program
Risk
indicator2019 2020 2021 2022 2023 2024 2025 2026 2027 2028 2029 2030 2031 2032 2033 2034 2035 2036 2037 2038 2039 TOTAL
000's 000's 000's 000's 000's 000's 000's 000's 000's 000's 000's 000's 000's 000's 000's 000's 000's 000's 000's 000's 000's
Classification Total Capital 1,269 1,097 741 3,028 1,201 1,489 868 1,114 1,198 978 991 1,299 1,263 1,406 2,329 894 1,060 1,100 1,030 739 1,454 26,549
Cash Cost for External Material & Services ( NIL Inflation 984 770 403 2,423 886 1,151 571 773 900 620 694 1,001 807 963 1,783 597 743 785 715 434 1,091 19,091
Cash Cost for External Material & Services ( WITH INFLATION) 984 785 420 2,568 957 1,266 639 881 1,044 731 833 1,222 1,000 1,214 2,282 776 980 1,051 972 599 1,527 22,731
PLANT - MUNICIPAL Total Capital 0% 100.0% 42 174 42 282 320 602 249 235 425 182 40 507 84 129 232 302 280 477 250 152 525 5,531
Cash Cost for External Material & Services 42 174 42 282 320 602 249 235 425 182 40 507 84 129 232 302 280 477 250 152 525 5,531
Municipal Heavy Equipment Good - - - 220 250 370 110 110 150 - - - - - - 220 250 120 250 110 305 2,465
Municipal Roller Good - - - - - - - - 25 - 40 - - - - - - - - - - 65
Municipal Trailer Good - - - - - - - 55 30 40 - 15 - 55 - - - 55 - - - 250
Municipal Truck Good - 120 - - 50 220 - 70 220 130 - 450 - - 170 - - 290 - - 220 1,940
Municipal Vehicle Good 42 42 42 42 - - 99 - - - - 42 84 42 42 42 15 - - 42 - 576
Municipal Other Good - 12 - 20 20 12 40 - - 12 - - - 32 20 40 15 12 - - - 235
0PLANT - AIRPORT Total Capital 0% 100.0% 30 - - - - 95 - - 45 - 60 36 - - 100 15 - - - - 80 461
Cash Cost for External Material & Services 30 - - - - 95 - - 45 - 60 36 - - 100 15 - - - - 80 461
Airport Heavy Equipment Good - - - - - 80 - - - - 60 - - - - - - - - - 80 220
Airport Roller Good - - - - - - - - 45 - - - - - - - - - - - - 45
Airport Other Good 30 - - - - 15 - - - - - 36 - - 100 15 - - - - - 196
0BUILDINGS & FACILITIES Total Capital 0% 100.0% 352 42 3 29 8 35 26 139 14 10 128 7 1 2 19 34 27 8 15 14 28 937
Cash Cost for External Material & Services 352 42 3 29 8 35 26 139 14 10 128 7 1 2 19 34 27 8 15 14 28 937
Buildings & FacilitiesCouncil Buildings-TMTCO - Council Office Good - 36 - 13 6 - 25 - - 5 70 - - - - - 25 - - 5 - 184
Buildings & FacilitiesCouncil Buildings-TMTWB - Works Buildings Good - - - - - - - 50 - - - - - - - - - - - - - 50
Buildings & FacilitiesCouncil Buildings-TMTWO - Works Office Good - - - 15 - - - - 12 - - - - - - - - - 15 - - 42
Buildings & FacilitiesHalls-TMTFAEC1 - FAEC Good - - - - - - - - - - 5 - - - - - - - - - 5 10
Buildings & FacilitiesHalls-TMTLH1 - Lady Barron Hall Good 6 - - - - - - - - - 11 - - - - - - - - - - 16
Buildings & FacilitiesHouses-TMTH1 - Robert Street Good - - - - - - 1 4 - - 6 - - - - 4 - - - - 6 21
Buildings & FacilitiesHouses-New - SES ( set up a code ) Good - - - - - - - - - - - - - - - - - - - - - -
Buildings & FacilitiesHouses-TMTH3 - Martin Street Good 2 - - 2 - - - 4 - - - 2 - - - 11 - - - 2 - 21
Buildings & FacilitiesOther-TMTAG - Art Gallery Good - - - - - - - - - - - - - - - - - - - - - -
Buildings & FacilitiesOther-TMTMAC1 - Maintenance - Child Care Centre Good - - - - - - - - - 5 - - - - - - - - - 5 - 10
Buildings & FacilitiesOther-TMTMU1 - Museum Building Good - - - - - 4 - - - - - - - - 11 10 - - - - 4 28
Buildings & FacilitiesPublic Toilets-TMTPT1 - Public Toilets - All 4 Good 106 - - - - - - 73 - - 1 - - - - - - - - - 1 181
Buildings & FacilitiesRecreation Facilities-TMTMAH1 - Maintenance -
Holloway Park
Good - - - - - - - - - - - - - - - - - - - - - -
Buildings & FacilitiesRecreation Facilities-TMTMAK1 - Maintenance- All
BBQs
Good - - - - - - - - - - - - - - - - - - - - - -
Buildings & FacilitiesRecreation Facilities-TMTMAS1 - Maintenance -
Whitemark Showgrounds
Good - - - - - 20 - - - - 23 - - - - - - - - - - 43
Buildings & FacilitiesRecreation Facilities-TMTMAS2 - Maintenance -
Emita Sports Ground
Good 99 - - - - - - - - - 3 - - - - - - - - - 3 105
Buildings & FacilitiesRecreation Facilities-TMTMAT1 - Maintenance -
Tennis Courts Lady Barron
Good - - - - - 2 - - - - - - - - - - - - - - - 2
Buildings & FacilitiesRecreation Facilities-TMTWG1 - Whitemark Gym Good - - 2 - - 2 - - 2 - - 2 - - 2 - - 2 - - 2 14
Buildings & FacilitiesRecreation Facilities-CDVLBGYM - Lady Barron
Community Gym
Good - 2 - - 2 - - 2 - - 9 - - 2 6 - 2 - - 2 7 34
AirportBuildings-AIROB1 - Airport - Office Building Good - - - - - - - - - - - - - - - - - - - - - -
AirportTerminal-AIRTB1 - Airport - Terminal Building Good 88 4 - - - 7 - - - - - 4 - - - 7 - - - - - 109
Roads & StreetsBoat Ramps-TMTMAB1 - Maintenance - Boat Ramps Good 2 - 1 - - - - 6 - - - - 1 - - 2 - 6 - - - 18
Buildings & FacilitiesRecreation Facilities-No Code - Playground -
Whitemark
Good 49 - - - - - - - - - - - - - - - - - - - - 49
shed
Cape Barren; Disable access and hand rails
Kitchen $32 Waste septic $67k
$88k -Fencing, Runway Patching,
Vending Machine, Gates & other
JCBLoader
CatGrader
North East River Toilet
CatGrader +
Yard Tipper
Tip Truck
Case Tractor Excavator
Council Extension Septic
Toiletreplacement
Resurface Netball Courts
FuelFacility
BitumenTruck
Yard Tipper
Annexure 7 - C1 - October 2018
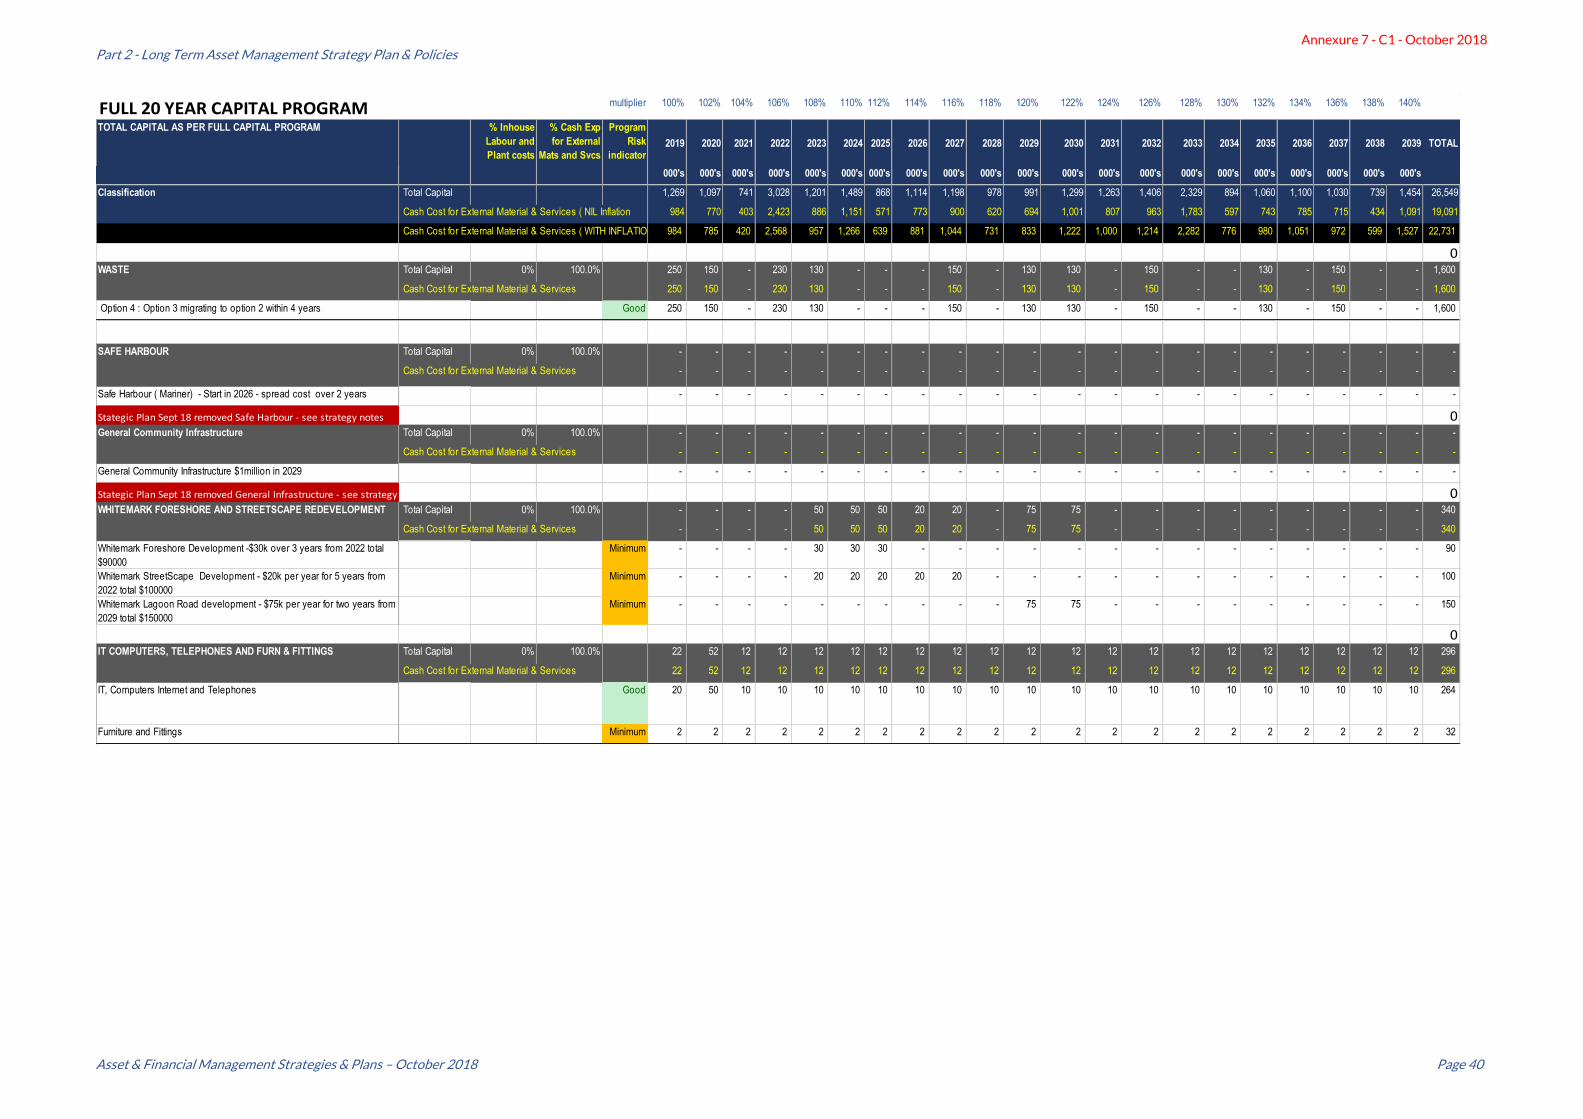
Part 2 - Long Term Asset Management Strategy Plan & Policies
Asset & Financial Management Strategies & Plans – October 2018 Page 40
FULL 20 YEAR CAPITAL PROGRAM multiplier 100% 102% 104% 106% 108% 110% 112% 114% 116% 118% 120% 122% 124% 126% 128% 130% 132% 134% 136% 138% 140%
TOTAL CAPITAL AS PER FULL CAPITAL PROGRAM % Inhouse
Labour and
Plant costs
% Cash Exp
for External
Mats and Svcs
Program
Risk
indicator2019 2020 2021 2022 2023 2024 2025 2026 2027 2028 2029 2030 2031 2032 2033 2034 2035 2036 2037 2038 2039 TOTAL
000's 000's 000's 000's 000's 000's 000's 000's 000's 000's 000's 000's 000's 000's 000's 000's 000's 000's 000's 000's 000's
Classification Total Capital 1,269 1,097 741 3,028 1,201 1,489 868 1,114 1,198 978 991 1,299 1,263 1,406 2,329 894 1,060 1,100 1,030 739 1,454 26,549
Cash Cost for External Material & Services ( NIL Inflation 984 770 403 2,423 886 1,151 571 773 900 620 694 1,001 807 963 1,783 597 743 785 715 434 1,091 19,091
Cash Cost for External Material & Services ( WITH INFLATION) 984 785 420 2,568 957 1,266 639 881 1,044 731 833 1,222 1,000 1,214 2,282 776 980 1,051 972 599 1,527 22,731
0WASTE Total Capital 0% 100.0% 250 150 - 230 130 - - - 150 - 130 130 - 150 - - 130 - 150 - - 1,600
Cash Cost for External Material & Services 250 150 - 230 130 - - - 150 - 130 130 - 150 - - 130 - 150 - - 1,600
Option 4 : Option 3 migrating to option 2 within 4 years Good 250 150 - 230 130 - - - 150 - 130 130 - 150 - - 130 - 150 - - 1,600
SAFE HARBOUR Total Capital 0% 100.0% - - - - - - - - - - - - - - - - - - - - - -
Cash Cost for External Material & Services - - - - - - - - - - - - - - - - - - - - - -
Safe Harbour ( Mariner) - Start in 2026 - spread cost over 2 years - - - - - - - - - - - - - - - - - - - - - -
Stategic Plan Sept 18 removed Safe Harbour - see strategy notes 0General Community Infrastructure Total Capital 0% 100.0% - - - - - - - - - - - - - - - - - - - - - -
Cash Cost for External Material & Services - - - - - - - - - - - - - - - - - - - - - -
General Community Infrastructure $1million in 2029 - - - - - - - - - - - - - - - - - - - - - -
Stategic Plan Sept 18 removed General Infrastructure - see strategy notes 0WHITEMARK FORESHORE AND STREETSCAPE REDEVELOPMENT Total Capital 0% 100.0% - - - - 50 50 50 20 20 - 75 75 - - - - - - - - - 340
Cash Cost for External Material & Services - - - - 50 50 50 20 20 - 75 75 - - - - - - - - - 340
Whitemark Foreshore Development -$30k over 3 years from 2022 total
$90000
Minimum - - - - 30 30 30 - - - - - - - - - - - - - - 90
Whitemark StreetScape Development - $20k per year for 5 years from
2022 total $100000
Minimum - - - - 20 20 20 20 20 - - - - - - - - - - - - 100
Whitemark Lagoon Road development - $75k per year for two years from
2029 total $150000
Minimum - - - - - - - - - - 75 75 - - - - - - - - - 150
0IT COMPUTERS, TELEPHONES AND FURN & FITTINGS Total Capital 0% 100.0% 22 52 12 12 12 12 12 12 12 12 12 12 12 12 12 12 12 12 12 12 12 296
Cash Cost for External Material & Services 22 52 12 12 12 12 12 12 12 12 12 12 12 12 12 12 12 12 12 12 12 296
IT, Computers Internet and Telephones Good 20 50 10 10 10 10 10 10 10 10 10 10 10 10 10 10 10 10 10 10 10 264
Furniture and Fittings Minimum 2 2 2 2 2 2 2 2 2 2 2 2 2 2 2 2 2 2 2 2 2 32
Annexure 7 - C1 - October 2018

Part 2 - Long Term Asset Management Strategy Plan & Policies
Asset & Financial Management Strategies & Plans – October 2018 Page 41
8 Asset Management Policy
S8(1) In this clause –
Asset management policy of a council means an asset management policy prepared by the council in accordance with section 70C of the Act;
Whole of life costing means the calculation of the total cost of an asset throughout its life including planning, design, construction, acquisition, operation, maintenance, rehabilitation and disposal costs.
S8(2) An asset management policy of a council is required to include the following matters:
S8(2)(a) The council’s goals and objectives for asset management to facilitate delivery of services;
S8(2)(b) The principles, requirements and other matters relating to the management of relevant assets including –
(i) Agreed service levels; and
(ii) Information on those assets; and
(iii) Resourcing for those assets; and
(iv) Compliance improvement of the management of those assets; and
(v) Planning for climate change adaption and mitigation; and
(vi) The adoption of whole of life costing;
S8(2)(c) The assignment of responsibility for service delivery and for the management of relevant assets.
The Asset management policy has not been fully assessed to meet the guidelines as stipulated by the Local Government Act. This area requires greater in-depth evaluation of the asset classes to ascertain the goals and objectives that Council wish to adopt for each class so to develop future strategies. The current strategy, however has identified the accounting practices that govern these areas and highlights the principles that were applied while preparing the 20 year Long-term asset management plan.
8.1 Principles
The main principles applied for the 20-year Long-term Asset Management plan:
• Health and safety considerations
• Avoidance of asset deterioration for existing assets
• Committed obligations e.g. work required to complete/ comply with a grant.
• Replacement of existing assets based on realistic expected useful economic lives
• Asset condition – based on physical assessments, historical evidence-based assumptions and third-party assessment (such as Pitt and Sherry report on the Roads).
• Categorising asset additions into “new capital acquisitions” and “capital replacement of existing assets”
• Inflation of 2% has been applied for future asset acquisitions.
• Identification of major assets and sub components/ sub classes
Principles applied to each major class of asset for the 20-year Long-term Asset Management Plan:
Roads Principles:
• Roads -Resheeting - Category 1 - High Road Use comprise: Palana Rd, Coast Rd , Trousers Point Rd.. - Recommended Years to complete is 8 years. The program applies 10 years due to cash constraints. This needs to be reviewed in future strategies;
Annexure 7 - C1 - October 2018
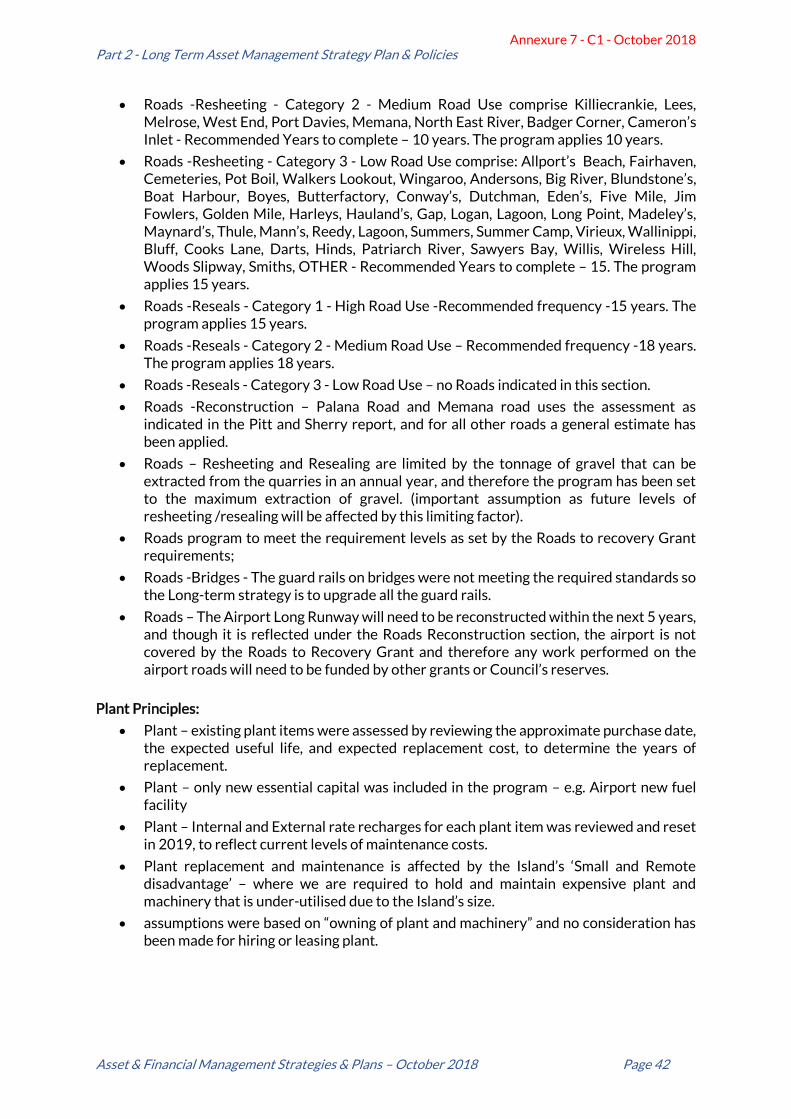
Part 2 - Long Term Asset Management Strategy Plan & Policies
Asset & Financial Management Strategies & Plans – October 2018 Page 42
• Roads -Resheeting - Category 2 - Medium Road Use comprise Killiecrankie, Lees, Melrose, West End, Port Davies, Memana, North East River, Badger Corner, Cameron’s Inlet - Recommended Years to complete – 10 years. The program applies 10 years.
• Roads -Resheeting - Category 3 - Low Road Use comprise: Allport’s Beach, Fairhaven, Cemeteries, Pot Boil, Walkers Lookout, Wingaroo, Andersons, Big River, Blundstone’s, Boat Harbour, Boyes, Butterfactory, Conway’s, Dutchman, Eden’s, Five Mile, Jim Fowlers, Golden Mile, Harleys, Hauland’s, Gap, Logan, Lagoon, Long Point, Madeley’s, Maynard’s, Thule, Mann’s, Reedy, Lagoon, Summers, Summer Camp, Virieux, Wallinippi, Bluff, Cooks Lane, Darts, Hinds, Patriarch River, Sawyers Bay, Willis, Wireless Hill, Woods Slipway, Smiths, OTHER - Recommended Years to complete – 15. The program applies 15 years.
• Roads -Reseals - Category 1 - High Road Use -Recommended frequency -15 years. The program applies 15 years.
• Roads -Reseals - Category 2 - Medium Road Use – Recommended frequency -18 years. The program applies 18 years.
• Roads -Reseals - Category 3 - Low Road Use – no Roads indicated in this section.
• Roads -Reconstruction – Palana Road and Memana road uses the assessment as indicated in the Pitt and Sherry report, and for all other roads a general estimate has been applied.
• Roads – Resheeting and Resealing are limited by the tonnage of gravel that can be extracted from the quarries in an annual year, and therefore the program has been set to the maximum extraction of gravel. (important assumption as future levels of resheeting /resealing will be affected by this limiting factor).
• Roads program to meet the requirement levels as set by the Roads to recovery Grant requirements;
• Roads -Bridges - The guard rails on bridges were not meeting the required standards so the Long-term strategy is to upgrade all the guard rails.
• Roads – The Airport Long Runway will need to be reconstructed within the next 5 years, and though it is reflected under the Roads Reconstruction section, the airport is not covered by the Roads to Recovery Grant and therefore any work performed on the airport roads will need to be funded by other grants or Council’s reserves.
Plant Principles:
• Plant – existing plant items were assessed by reviewing the approximate purchase date, the expected useful life, and expected replacement cost, to determine the years of replacement.
• Plant – only new essential capital was included in the program – e.g. Airport new fuel facility
• Plant – Internal and External rate recharges for each plant item was reviewed and reset in 2019, to reflect current levels of maintenance costs.
• Plant replacement and maintenance is affected by the Island’s ‘Small and Remote disadvantage’ – where we are required to hold and maintain expensive plant and machinery that is under-utilised due to the Island’s size.
• assumptions were based on “owning of plant and machinery” and no consideration has been made for hiring or leasing plant.
Annexure 7 - C1 - October 2018
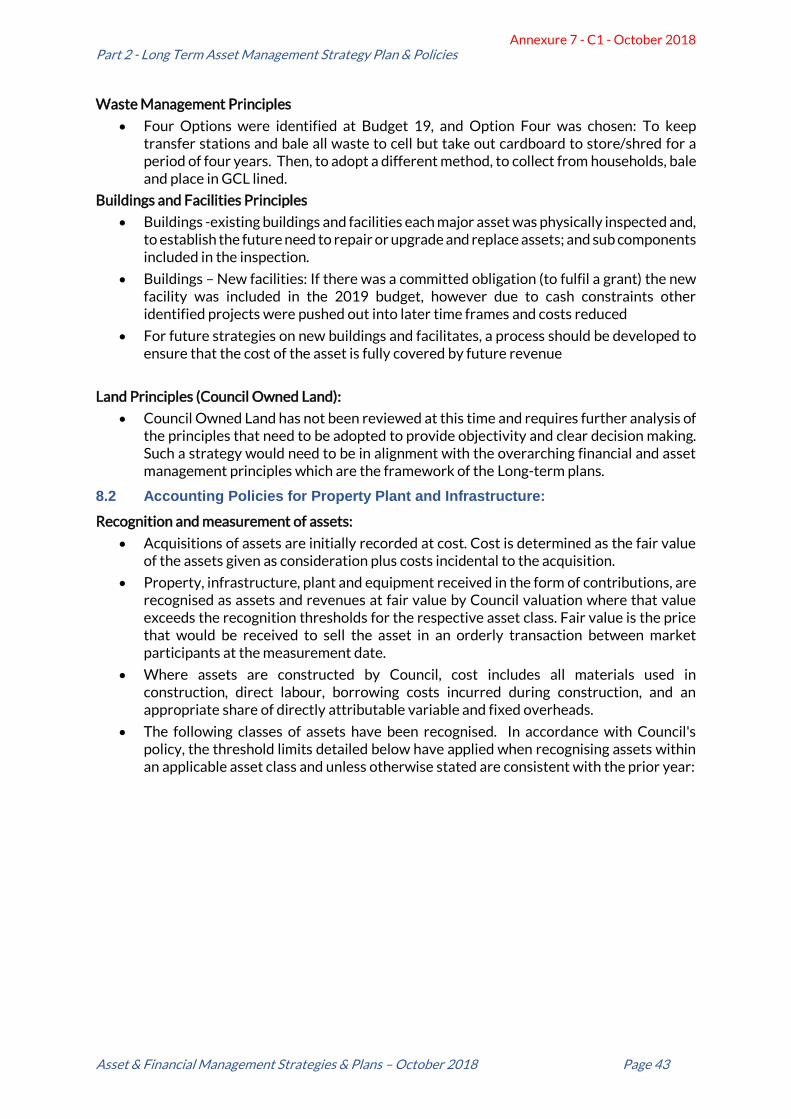
Part 2 - Long Term Asset Management Strategy Plan & Policies
Asset & Financial Management Strategies & Plans – October 2018 Page 43
Waste Management Principles
• Four Options were identified at Budget 19, and Option Four was chosen: To keep transfer stations and bale all waste to cell but take out cardboard to store/shred for a period of four years. Then, to adopt a different method, to collect from households, bale and place in GCL lined.
Buildings and Facilities Principles
• Buildings -existing buildings and facilities each major asset was physically inspected and, to establish the future need to repair or upgrade and replace assets; and sub components included in the inspection.
• Buildings – New facilities: If there was a committed obligation (to fulfil a grant) the new facility was included in the 2019 budget, however due to cash constraints other identified projects were pushed out into later time frames and costs reduced
• For future strategies on new buildings and facilitates, a process should be developed to ensure that the cost of the asset is fully covered by future revenue
Land Principles (Council Owned Land):
• Council Owned Land has not been reviewed at this time and requires further analysis of the principles that need to be adopted to provide objectivity and clear decision making. Such a strategy would need to be in alignment with the overarching financial and asset management principles which are the framework of the Long-term plans.
8.2 Accounting Policies for Property Plant and Infrastructure:
Recognition and measurement of assets:
• Acquisitions of assets are initially recorded at cost. Cost is determined as the fair value of the assets given as consideration plus costs incidental to the acquisition.
• Property, infrastructure, plant and equipment received in the form of contributions, are recognised as assets and revenues at fair value by Council valuation where that value exceeds the recognition thresholds for the respective asset class. Fair value is the price that would be received to sell the asset in an orderly transaction between market participants at the measurement date.
• Where assets are constructed by Council, cost includes all materials used in construction, direct labour, borrowing costs incurred during construction, and an appropriate share of directly attributable variable and fixed overheads.
• The following classes of assets have been recognised. In accordance with Council's policy, the threshold limits detailed below have applied when recognising assets within an applicable asset class and unless otherwise stated are consistent with the prior year:
Annexure 7 - C1 - October 2018
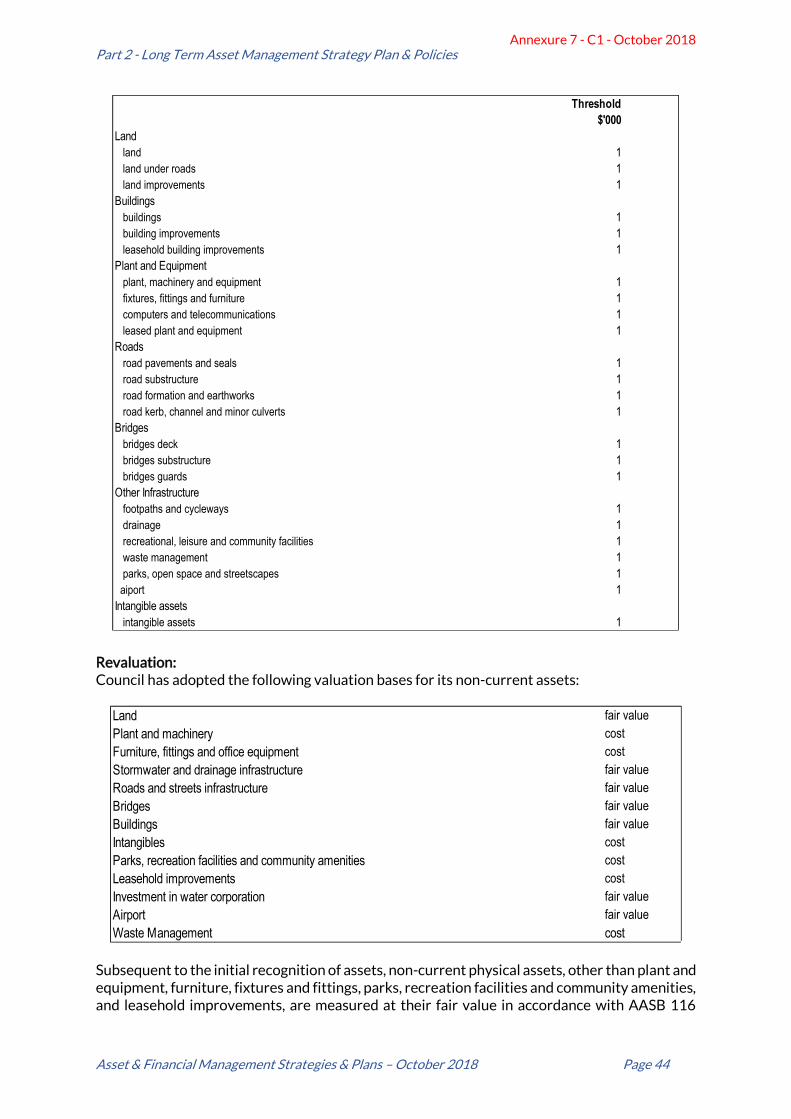
Part 2 - Long Term Asset Management Strategy Plan & Policies
Asset & Financial Management Strategies & Plans – October 2018 Page 44
Revaluation: Council has adopted the following valuation bases for its non-current assets:
Subsequent to the initial recognition of assets, non-current physical assets, other than plant and equipment, furniture, fixtures and fittings, parks, recreation facilities and community amenities, and leasehold improvements, are measured at their fair value in accordance with AASB 116
Threshold
$'000
Land
land 1
land under roads 1
land improvements 1
Buildings
buildings 1
building improvements 1
leasehold building improvements 1
Plant and Equipment
plant, machinery and equipment 1
fixtures, fittings and furniture 1
computers and telecommunications 1
leased plant and equipment 1
Roads
road pavements and seals 1
road substructure 1
road formation and earthworks 1
road kerb, channel and minor culverts 1
Bridges
bridges deck 1
bridges substructure 1
bridges guards 1
Other Infrastructure
footpaths and cycleways 1
drainage 1
recreational, leisure and community facilities 1
waste management 1
parks, open space and streetscapes 1
aiport 1
Intangible assets
intangible assets 1
Land fair value
Plant and machinery cost
Furniture, fittings and office equipment cost
Stormwater and drainage infrastructure fair value
Roads and streets infrastructure fair value
Bridges fair value
Buildings fair value
Intangibles cost
Parks, recreation facilities and community amenities cost
Leasehold improvements cost
Investment in water corporation fair value
Airport fair value
Waste Management cost
Annexure 7 - C1 - October 2018
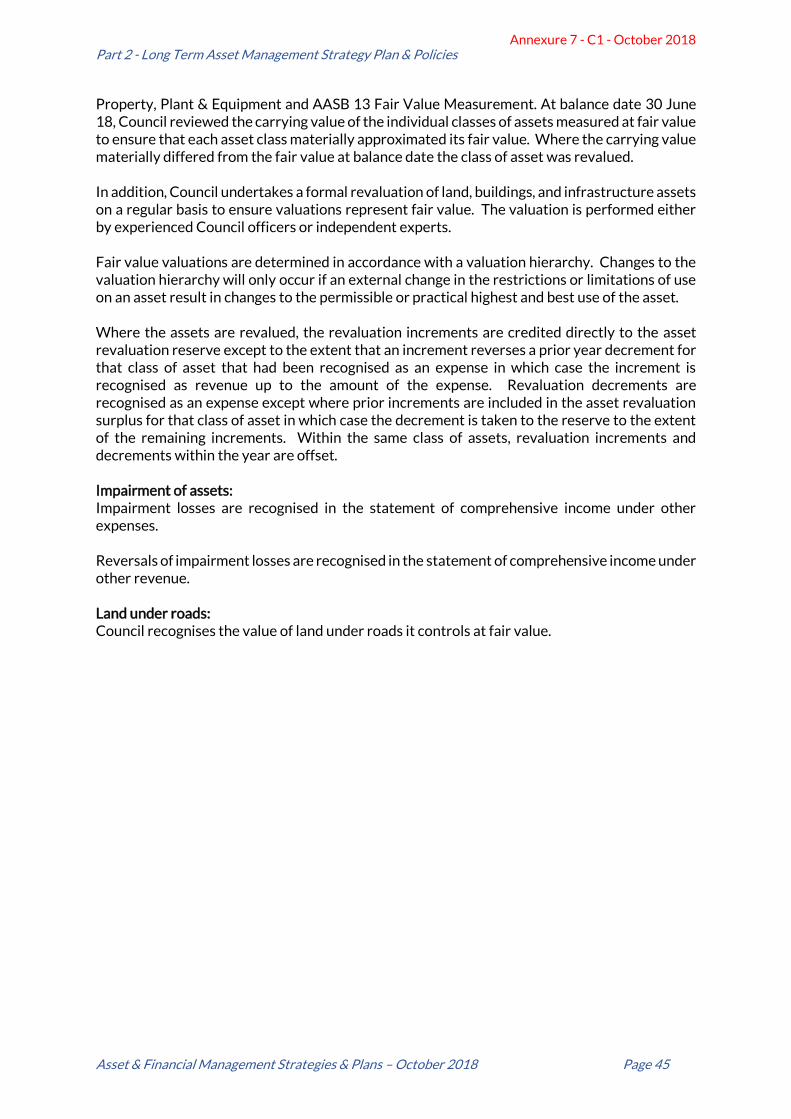
Part 2 - Long Term Asset Management Strategy Plan & Policies
Asset & Financial Management Strategies & Plans – October 2018 Page 45
Property, Plant & Equipment and AASB 13 Fair Value Measurement. At balance date 30 June 18, Council reviewed the carrying value of the individual classes of assets measured at fair value to ensure that each asset class materially approximated its fair value. Where the carrying value materially differed from the fair value at balance date the class of asset was revalued. In addition, Council undertakes a formal revaluation of land, buildings, and infrastructure assets on a regular basis to ensure valuations represent fair value. The valuation is performed either by experienced Council officers or independent experts. Fair value valuations are determined in accordance with a valuation hierarchy. Changes to the valuation hierarchy will only occur if an external change in the restrictions or limitations of use on an asset result in changes to the permissible or practical highest and best use of the asset. Where the assets are revalued, the revaluation increments are credited directly to the asset revaluation reserve except to the extent that an increment reverses a prior year decrement for that class of asset that had been recognised as an expense in which case the increment is recognised as revenue up to the amount of the expense. Revaluation decrements are recognised as an expense except where prior increments are included in the asset revaluation surplus for that class of asset in which case the decrement is taken to the reserve to the extent of the remaining increments. Within the same class of assets, revaluation increments and decrements within the year are offset. Impairment of assets: Impairment losses are recognised in the statement of comprehensive income under other expenses. Reversals of impairment losses are recognised in the statement of comprehensive income under other revenue. Land under roads: Council recognises the value of land under roads it controls at fair value.
Annexure 7 - C1 - October 2018
Part 2 - Long Term Asset Management Strategy Plan & Policies
Asset & Financial Management Strategies & Plans – October 2018 Page 46
9 Asset Management Strategy
S9(1) In this clause –
Asset management policy of council means an asset management policy prepared by the council in accordance with section 70C of the ACT;
Asset management strategy of a council means an asset management strategy prepared by the council in accordance with section 70D of the ACT;
Minimum core level of asset maturity and competence means the minimum level of maturity and competence in respect of an asset required for the purposes of the Local Government Financial Sustainability Nationally Consistent Frameworks published by the Local Government and Planning Ministers’ Council in May 2007, as amended from time to time;
Strategic plan of a council means a strategic plan prepared by the council in accordance with section 66 of the ACT.
S9(2) An asset management strategy of a council is required to include the following matters: S9(2)(a) An outline of all existing assets and the services provided by the use of those assets; S9(2)(b) an outline of the condition of each existing asset, including financial status and the estimated
costs related to the acquisition and use of the asset during its lifecycle; S9(2)(c) details of the goals and objectives of the council relating to the delivery of services provided
by the use of its assets; S9(2)d) details of the asset management strategies of the council to be implemented to enable the
objectives of the strategic plan of the council and the assets management policy of the council to be achieved
S9(2)(e) a plan for the improvement of asset management, detailing the program of tasks to be completed and the resources required to achieve the relevant minimum core level of asset maturity and competence required in respect of the asset.
This area has not been completed to the requirements of the ACT and requires further work for future strategies. Prior to and as part of the 2018/19 budget preparation a more rigorous inspection and review was undertaken in the preparation of the asset Long-term plan. Whilst this does not address all the legislated requirements, all major classes of Council’s assets have been assessed based on visual inspection, experience and local knowledge and a program of replacement has been initiated, and many of the sub assets related to the Buildings and infrastructure.
The largest asset carrying relates to the Roads: In February 2013 Council completed some of the tasks required in adopting Transport Asset Management Plan for the Flinders Council Transport Network. Overall Flinders Council owns and maintains approximately 351 kilometres of road throughout the Municipality. The Flinders Council road network contains 71 kilometres of sealed road and 279 kilometres of unsealed road. Other assets included within the transport network are bridges and footpaths. Flinders Council roads are recognised using three separate asset components road formation, road pavement and road surface. Whilst Council has a data base of its Road Assets and regularly has this assessed for valuation purposes up until 2018/19 no detailed program of tasks to be completed and resources required. In 2017 however, Council commissioned Pitt and Sherry to perform an independent pavement deflectograph review of a major part of its road network and Airport Runways. Councils other major assets such as the Airport, buildings and community infrastructure, have had a thorough visual inspection, and the future program has identified the major assets and segmented component parts, to provide a projection of repairs and maintenance and capital replacements.
Annexure 7 - C1 - October 2018
Asset & Financial Management Strategies & Plans – October 2018 Page 47
PART 3
Budget 2019 Commentary in Context to the Long-Term Financial & Asset Management Strategies
10 2019 Budget & Rating Commentary
The Budget 2019 has been prepared under a separate document. The Long-term financial strategy has used the detailed work performed for the Budget 19 to provide the basic framework, so therefore the Budget 19 and subsequent assumptions are a major corner stone for the Long-term financial and asset management plans.
10.1 Background
Past actions should also be considered if for no other reason than to put the current situation into context. Notwithstanding there have been many positive actions undertaken that have improved the performance of the Council, equally several opportunities have not eventuated, in part through lack of sufficient information. Previous Actions – Capital Works Over recent years there has been an acceleration in new and replacement infrastructure, plant and equipment as well as some strategic land purchases. These have been important and credible initiatives, and they include but are not limited to the following:
(a) Upgrades of the Flinders Arts and Entertainment Centre, Lady Barron Hall and Emita Hall, in part through successful grant applications.
These have been well received and now patronised with increased community use. Through Council’s policy of not charging community users, little revenue has been derived. Council’s operational expenditure has however increased, without any additional revenue created to fund this additional expense.
(b) Construction of new playgrounds and improved BBQ’s and public toilets facilities.
Again, projects have been well received and welcomed by the Community and enhance Flinders as a tourist destination, but Council’s operational expenditure has increased without any additional revenue created to fund this additional expense.
(c) Strategic purchase of key plant and equipment such a new bituminous sprayer.
Council borrowed for this item which effectively repaid for itself inside 18 months through Council being able to undertake its own bituminous sealing works instead of using external contractors. Although this has not seen a reduction in Council’s overall expenses on Capital Works, the net result is that Council has been able to undertake more roadmaking, including for the first time in over 30 years extending the sealed road network. Local employment has also benefited. Repayment of the loan is still required.
(d) Purchases of land associated with two quarries and land at the entrance to Whitemark.
All have strategic value with two securing valuable sources of quarry material with reductions in ongoing expenses which will be realised in the Long-term. However there has been no allocation of additional revenue to restore the level of these financial reserves.
(e) Northern Tasmanian Economic Stimulus Loan package to advance $1.447m in infrastructure with all loan interest payments to be refunded
Whilst a sound strategic and cost-effective decision, Council’s Net Financial Reserves are effectively overstated as these loans need to be repaid; some at the end of the life of the loan.
Annexure 7 - C1 - October 2018
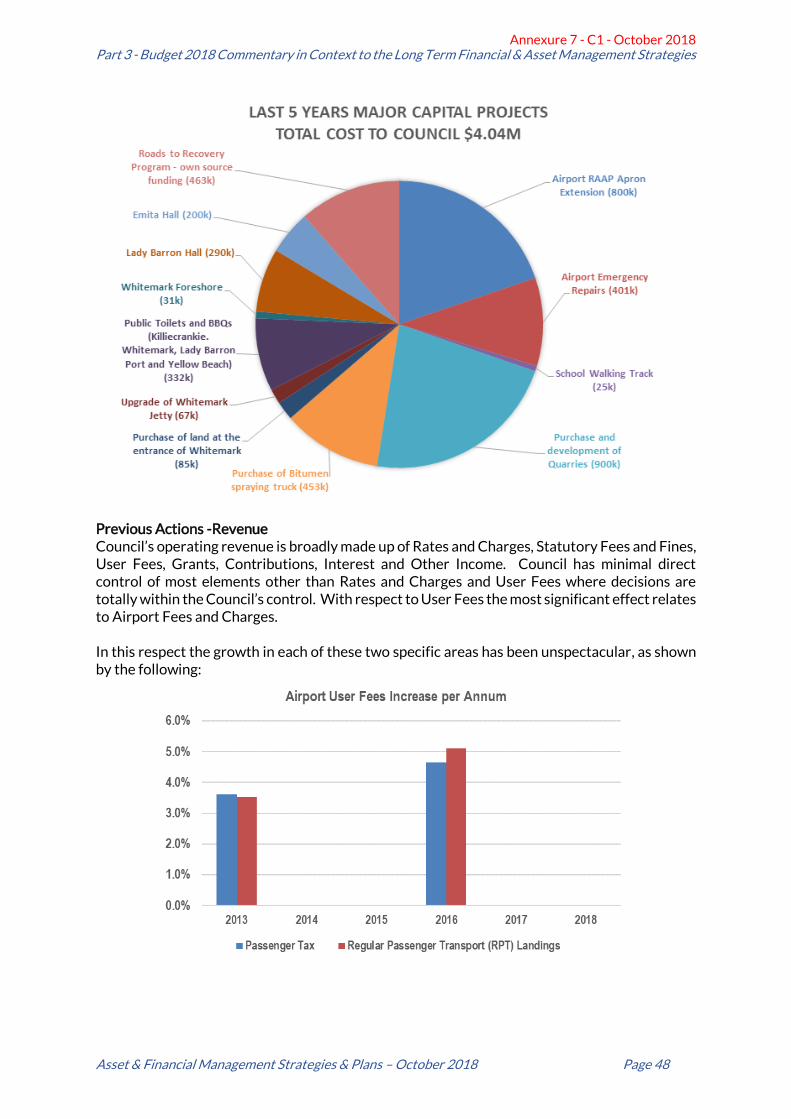
Part 3 - Budget 2018 Commentary in Context to the Long Term Financial & Asset Management Strategies
Asset & Financial Management Strategies & Plans – October 2018 Page 48
Previous Actions -Revenue Council’s operating revenue is broadly made up of Rates and Charges, Statutory Fees and Fines, User Fees, Grants, Contributions, Interest and Other Income. Council has minimal direct control of most elements other than Rates and Charges and User Fees where decisions are totally within the Council’s control. With respect to User Fees the most significant effect relates to Airport Fees and Charges. In this respect the growth in each of these two specific areas has been unspectacular, as shown by the following:
Annexure 7 - C1 - October 2018
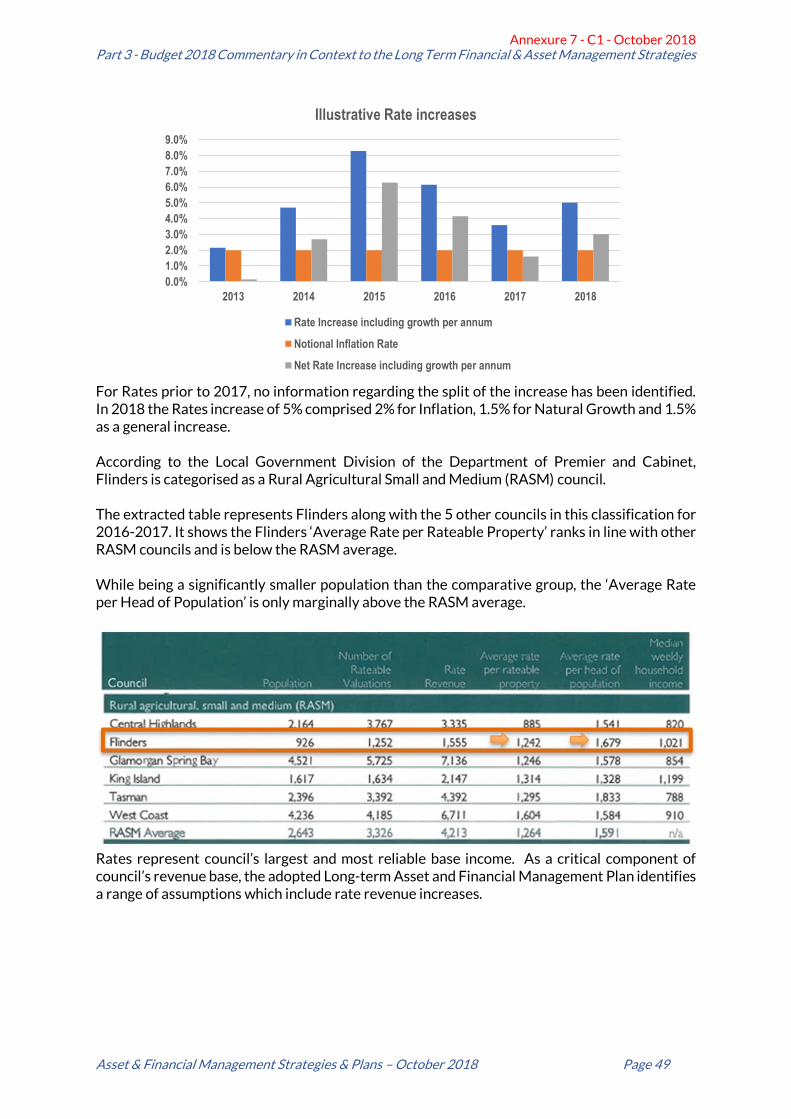
Part 3 - Budget 2018 Commentary in Context to the Long Term Financial & Asset Management Strategies
Asset & Financial Management Strategies & Plans – October 2018 Page 49
For Rates prior to 2017, no information regarding the split of the increase has been identified. In 2018 the Rates increase of 5% comprised 2% for Inflation, 1.5% for Natural Growth and 1.5% as a general increase. According to the Local Government Division of the Department of Premier and Cabinet, Flinders is categorised as a Rural Agricultural Small and Medium (RASM) council. The extracted table represents Flinders along with the 5 other councils in this classification for 2016-2017. It shows the Flinders ‘Average Rate per Rateable Property’ ranks in line with other RASM councils and is below the RASM average. While being a significantly smaller population than the comparative group, the ‘Average Rate per Head of Population’ is only marginally above the RASM average.
Rates represent council’s largest and most reliable base income. As a critical component of council’s revenue base, the adopted Long-term Asset and Financial Management Plan identifies a range of assumptions which include rate revenue increases.
0.0%
1.0%
2.0%
3.0%
4.0%
5.0%
6.0%
7.0%
8.0%
9.0%
2013 2014 2015 2016 2017 2018
Illustrative Rate increases
Rate Increase including growth per annum
Notional Inflation Rate
Net Rate Increase including growth per annum
Annexure 7 - C1 - October 2018
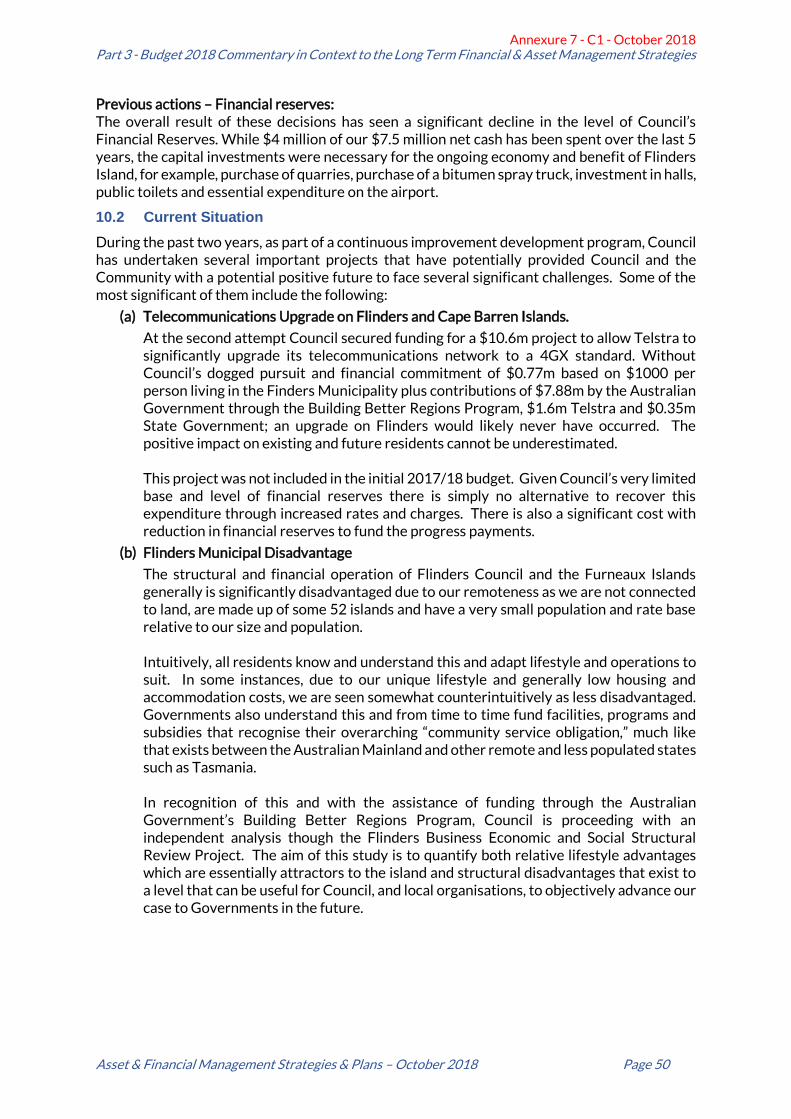
Part 3 - Budget 2018 Commentary in Context to the Long Term Financial & Asset Management Strategies
Asset & Financial Management Strategies & Plans – October 2018 Page 50
Previous actions – Financial reserves: The overall result of these decisions has seen a significant decline in the level of Council’s Financial Reserves. While $4 million of our $7.5 million net cash has been spent over the last 5 years, the capital investments were necessary for the ongoing economy and benefit of Flinders Island, for example, purchase of quarries, purchase of a bitumen spray truck, investment in halls, public toilets and essential expenditure on the airport.
10.2 Current Situation
During the past two years, as part of a continuous improvement development program, Council has undertaken several important projects that have potentially provided Council and the Community with a potential positive future to face several significant challenges. Some of the most significant of them include the following:
(a) Telecommunications Upgrade on Flinders and Cape Barren Islands.
At the second attempt Council secured funding for a $10.6m project to allow Telstra to significantly upgrade its telecommunications network to a 4GX standard. Without Council’s dogged pursuit and financial commitment of $0.77m based on $1000 per person living in the Finders Municipality plus contributions of $7.88m by the Australian Government through the Building Better Regions Program, $1.6m Telstra and $0.35m State Government; an upgrade on Flinders would likely never have occurred. The positive impact on existing and future residents cannot be underestimated. This project was not included in the initial 2017/18 budget. Given Council’s very limited base and level of financial reserves there is simply no alternative to recover this expenditure through increased rates and charges. There is also a significant cost with reduction in financial reserves to fund the progress payments.
(b) Flinders Municipal Disadvantage
The structural and financial operation of Flinders Council and the Furneaux Islands generally is significantly disadvantaged due to our remoteness as we are not connected to land, are made up of some 52 islands and have a very small population and rate base relative to our size and population. Intuitively, all residents know and understand this and adapt lifestyle and operations to suit. In some instances, due to our unique lifestyle and generally low housing and accommodation costs, we are seen somewhat counterintuitively as less disadvantaged. Governments also understand this and from time to time fund facilities, programs and subsidies that recognise their overarching “community service obligation,” much like that exists between the Australian Mainland and other remote and less populated states such as Tasmania. In recognition of this and with the assistance of funding through the Australian Government’s Building Better Regions Program, Council is proceeding with an independent analysis though the Flinders Business Economic and Social Structural Review Project. The aim of this study is to quantify both relative lifestyle advantages which are essentially attractors to the island and structural disadvantages that exist to a level that can be useful for Council, and local organisations, to objectively advance our case to Governments in the future.
Annexure 7 - C1 - October 2018
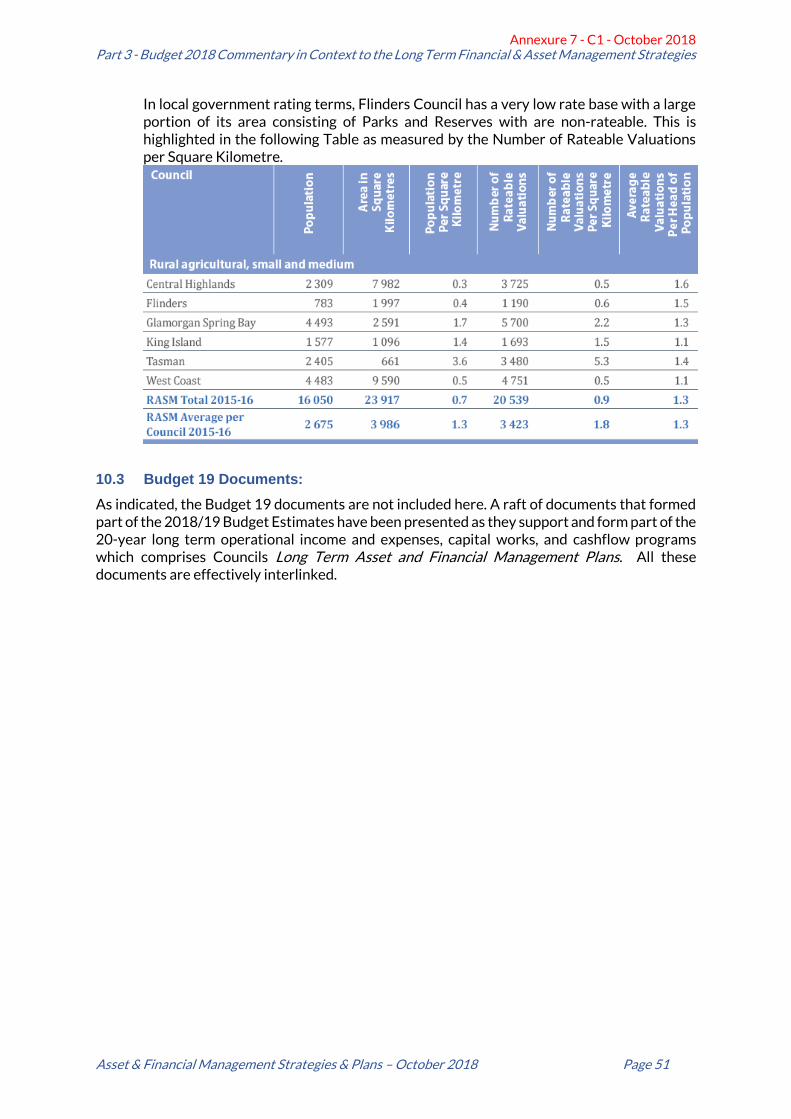
Part 3 - Budget 2018 Commentary in Context to the Long Term Financial & Asset Management Strategies
Asset & Financial Management Strategies & Plans – October 2018 Page 51
In local government rating terms, Flinders Council has a very low rate base with a large portion of its area consisting of Parks and Reserves with are non-rateable. This is highlighted in the following Table as measured by the Number of Rateable Valuations per Square Kilometre.
10.3 Budget 19 Documents:
As indicated, the Budget 19 documents are not included here. A raft of documents that formed part of the 2018/19 Budget Estimates have been presented as they support and form part of the 20-year long term operational income and expenses, capital works, and cashflow programs which comprises Councils Long Term Asset and Financial Management Plans. All these documents are effectively interlinked.
Annexure 7 - C1 - October 2018
Asset & Financial Management Strategies & Plans – October 2018 Page 52
References
The following separate Council reference documents are considered relevant to content of this document.
• 2018/19 Budget Estimates – 16 August 2018
• Annual Plan Year ending 30 June 2019 – 16 August 2018
• Rating Strategy Overview – 16 August 2018
These are located on Council’s website www.flinders.tas.gov.au
Annexure 7 - C1 - October 2018
Flinders Council
4 Davies Street PO Box 40
Whitemark Tas 7255
T: 03 6359 5000 E: [email protected]
www.flinders.tas.gov.au
Annexure 7 - C1 - October 2018