Asset allocation report - intl.assets.vgdynamic.info
18
Asset allocation report June quarter 2021
Transcript of Asset allocation report - intl.assets.vgdynamic.info

Asset allocationreportJune quarter 2021

Contents
Why U.S. value stocks are poised to outperform growth 3
A better but still bumpy road ahead 6
Market outlook 10
Long-term market outlook 11
Asset allocation 14
Is the 60/40 portfolio dead? 16

Vanguard Asset allocation report – June 2021 3
Why U.S. value stocks are poised to outperform growth
Brighter days are ahead for U.S. value stocks
1 For example, as of April 27, 2021, the Russell 1000 Value Index had returned 15.51% year-to-date, while the Russell 1000 Growth Index returned 8.65%.
2 A short sale occurs when an investor borrows and then sells a stock in anticipation of its price declining. If the price does decline, the investor can repurchase the shares to return them to the lender at a lower price, thereby profiting. If the price rises, however, losses ensue. Regulations limit short sales.
This might seem a relatively safe prediction. After all, shares in U.S. companies with relatively low valuations and high dividend yields have outperformed their growth counterparts so far this year1. And as our recent research shows, the coming reversal of fortunes would restore the decades-long performance edge that academic
researchers have ascribed to value stocks.
Investors, younger ones especially, may be skeptical. Powered by a relentless rise in technology share prices, growth stocks have handily outpaced value—the province of financial, utility, energy, and basic materials companies, among others—since the 2008 global financial crisis.
What drives the relative performance of value and growth stocks?To better understand past results and provide estimates of future returns, we identified fundamental forces—some secular, others cyclical—that drive changes in the value-growth relationship and constructed a related fair-value model. Our model suggests that value stocks’ underperformance in recent years owes mainly to fundamental drivers, particularly low inflation rates, which boost the relative attractiveness of growth stocks’
more-distant cash flows. But investor behavior has played a role as well.
We expect value to outperform growth over the next ten years by five to seven percentage points, annualised, and perhaps by an even wider margin over the next five years.
To be clear, our outlook is for the style factors, or what might be termed “pure” value and growth portfolios. These differ from both the academic value-growth data presented in the first chart and style-specific market indexes that serve as benchmarks for many real-world investment portfolios.
An explanation of our methodologyThe Fama-French data have the virtue of a long history, dating to the Great Depression. But few investors are in position to implement the academic definition of value, which includes holding the cheapest stocks while selling short the most expensive stocks2. To assess the performance of investable value and growth portfolios, we constructed market-capitalisation-weighted indexes of companies in the bottom and top thirds of the Russell 1000 Index, sorted by price/book ratios and reconstituted monthly.
Why not simply examine the Russell-style indexes? Arguably, the indexes do a good job of representing active managers’ security selection. But that doesn’t make them ideal representations of the style factors themselves. Roughly 30% of Russell 1000
Kevin DiCiurcio, CFAHead of the Vanguard Capital Markets Model® research team, Vanguard USA

Vanguard Asset allocation report – June 2021 4
Index constituents appear in both the growth and value indexes, while the remaining 70% are classified exclusively as growth or value.
In our view, a stock thought to represent a style factor should, for analytical purposes at least, represent only one style. In our model, a company can be deemed only value or growth in any given month, though its classification may vary from month to month.
Why value stocks are poised to top growth stocksIt’s well-known that asset prices can stray meaningfully from perceived fair values for extended periods. So why should investors expect value to outpace growth in the years ahead? For one, we believe the growth trade is overdone.
Our research found that deviations from fair value and future relative returns share an inverse and statistically significant relationship over five- and ten-year periods. The relationship is an affirmation that, ultimately, valuations matter—the price we pay influences our return. That’s intuitive, right? So, too, is the imperfection of our model: While it reveals a relationship between fair-value deviations and future results, its predictions for relative performance are imprecise. That’s
consistent with investment risk enabling but not guaranteeing potential returns. Put another way, if valuations perfectly presaged performance, there’d be no risk. Fortunately, that’s not how markets work.
Asset bubbles and the investment road aheadThe large current deviation of growth- stock valuations relative to our fair-value estimates also helps make our case. The size of the deviation is similar to the one at the height of the dot-com bubble. When the bubble popped, value proceeded to outperform growth by 16%, annualised, over the next five years. We can’t be certain that growth stocks represent a bubble, but Vanguard’s global chief economist, Joe Davis, recently wrote about the pitfalls of low-quality growth stocks.
We believe that cyclical value-growth rotations are rooted in investor behaviour and that investors become more price-conscious when profit growth is abundant. Since 2008, corporate profit growth has been insufficient to sustain value stocks.
Vanguard expects inflation to normalise and eventually exceed the Federal Reserve’s 2% target this year and next. Corporate profits should strengthen amid economic recovery from the pandemic. Still, their impact
Figure 1. The unprecedented outperformance of growth over value
−6
−3
0
3
6
9
12
15%
Jun '36 Jun '46 Jun '56 Jun '66 Jun '76 Jun '86 Jun '96 Jun '06 Jun '16
10 y
ear
annu
alis
ed r
etur
n
Growth outperforms
Value outperforms
Notes: The chart displays annualized ten-year trailing returns on the risk free rate, market index – risk free rate, and a long short value vs growth portfolio over the period of June 1936 to January 2021 constructed using Fama/French methodology mba.tuck.dartmouth.edu/pages/faculty/ken.french/Data_Library/f-f_5_factors_2x3.html. Source: The Vanguard Group, Inc., May 2021. Fama/French research returns: mba.tuck.dartmouth.edu/pages/faculty/ken.french/data_library.html#Research outlined here

Vanguard Asset allocation report – June 2021 5
on the “fair value of value” may be modest. The ultimate driver of the coming rotation to value stocks, then, is apt to be a change in investors’ appetite for risk.
For investors with sufficient risk tolerance, time horizons, and patience, an overweight to value stocks could help offset the lower broad-market returns we expect over the next decade.
Figure 2. Returns from changes in fair value are possible, but don’t expect it to look like the past
0.05
0.10
0.15
0.20
0.25
0.30
0.35
1979 1983 1987 1991 1995 1999 2003 2007 2011 2015 2019 2023 2027 2031
rati
o of
val
ue p
rice
/boo
kto
gro
wth
pri
ce/b
ook
Value/Growth BP historical ratio Value/Growth BP ratio prediction
Fair value of value/growth price/book ratio prediction
Convergence of the current ratio to fair value
Convergence of the current ratio to fair value
Notes: The valuation ratio is projected based on a Vector Error Correction Model (VECM) describing the statistical relationship between cointegrated time series. The VECM is a dynamic model of the first differences of the variables used in the cointegrating regression that includes a disequilibrium term to correct deviations from the long-term equilibrium.Sources: The Vanguard Group, Inc., May 2021; Vanguard calculations, based on data from FactSet.

Vanguard Asset allocation report – June 2021 6
Quarter in reviewDespite concerns about rising inflation, global equity markets capped off the financial year with yet another strong quarter as economic activity rebounded, corporate earnings strengthened, and policy support remained accommodative (Figure 3). The rollout of vaccinations remains critical to the reopening of economies and continued to gain pace over the quarter, particularly in the euro area. The percentage of its population receiving at least one dose of the vaccine increased from just 12% at the start of the quarter to 53% in June.
The progress on health outcomes saw European equity indices retain their year-to-date lead, while the U.S. outperformed in its Q2 performance as economic optimism continued to be fuelled by a strong earnings season and the Biden administration’s announcement of an additional USD 1.2 trillion infrastructure stimulus plan. Meanwhile, strong economic data in Australia saw the S&P/ASX 300 reach new highs, closing the
quarter 8.5% higher as investors cheered on the quick normalisation in the labour market and gross domestic product (GDP). A dovish Reserve Bank of Australia (RBA) helped to support a weaker Australian dollar, which ultimately saw international equity investments outperform the local market in AUD terms.
In fixed income markets, total returns for most bond classes were positive as yields declined modestly by 29 bps, marking a reversal from the first quarter. The decline in yields was driven by the market’s view that recent increases in inflation are likely to be temporary and should moderate once pent-up demand fades and supply-chain issues are resolved. Australian yields also ended the quarter around 26 bps lower after an 81 bp rise in Q1 as real yields were capped by the RBA’s commitment to keep the cash rate on hold until 2024.
A better but still bumpy road ahead
Figure 3. Local currency returns for global indices
0
5
10
15
20%
S&P 500 ASX 300 MSCI AC World
Stoxx 600 FTSE 100 MSCI EM AustralianAggregate
GlobalAggregate(Hedged
AUD)
AustralianCash
2021 year to date Second quarter 2021
Notes: Returns are cumulative total returns. Global Aggregate hedged to AUD, other indices in local currency terms.Source: Vanguard, July 2021 using data from FactSet, Refinitiv

Vanguard Asset allocation report – June 2021 7
Figure 4a. % of population with at least one dose
20
40
60
80
100%
Dec'20
Feb'21
Apr'21
Jun'21
Aug'21
Oct'21
Dec'21
EU-27 UK USWorld China Australia
Source: Vanguard,July 2021 using data from Our World in Data.
Economic outlook As vaccinations ramp up across the world, health risks are expected to gradually decline over the next few months, which could pave the way for a more robust recovery in face-to-face service sectors. We note, however, that differences in vaccination rates and varied levels of policy support (Figure 4a and 4b) are likely to produce a bifurcation of economic results in the near term. The U.S., for instance, with its leading vaccination efforts and strong fiscal support, is likely to lead the global economic recovery with full-year growth of at least 7%. By contrast, China, which was first to enter and first to emerge from the pandemic and an outperformer in 2020, is likely to experience a sequential deceleration in economic momentum in the second half of the year as support from the export sector wanes and consumption growth normalises gradually given sporadic virus outbreaks and an initially slow vaccination rollout.
A strong U.S. economic recovery, coupled with ongoing supply constraints, has in our view increased the likelihood of moderately higher inflation in the coming years. In our baseline scenario of USD 500 billion in additional fiscal spending (above the existing USD 1.9 trillion American Rescue Plan Act), a 10 bp increase in inflation expectations, and 7% GDP growth in 2021, core PCE would average 2.4% in 2021 and 1.9% in 2022 (Figure 5a, overleaf), both of which are higher than the pre-COVID five-year average of 1.6%. Sustained inflationary pressures will eventually call for the Federal Reserve to taper stimulus and raise interest rates from near zero. Figure 5b (overleaf) illustrates our outlook for monetary policy in the U.S., where we foresee conditions for an interest rate lift-off—namely full employment and the inflation outlook sustainably above 2%—to be met in the second half of 2023. Notably, while we expect labour market dynamics to normalise by the second half of 2022, the fading of base effects and eventual normalisation of supply-demand imbalances mean that modest reflation, rather than runaway inflation, is more likely in the near term.
Figure 4b. US is expected to deliver the most fiscal support in 2021
5
10
15
20%
0% 5% 10% 15%
Fisc
al s
tim
ulus
(%
of
GD
P)
Monetary stimulus (% of GDP)
US
EuroArea
UK
Aust.
Notes: Monetary stimulus refers to the expected change in central bank balance sheets, as a % of 2019 GDP. Source: Vanguard,July 2021 using data from the Congressional Budget Office, European Commission, UK Government and Australia’s Federal Budget.

Vanguard Asset allocation report – June 2021 8
In Australia, the RBA has adopted a more conservative approach by committing to keep the cash rate on hold until 2024 given weaker inflation dynamics and a slower vaccination rollout. The latter increases the risks of sporadic outbreaks and lockdowns in the second half of this year and could further delay consumption normalisation. Despite a relatively faster economic recovery to date, with overall GDP having returned to its pre-COVID level in Q1 (Figure 6a, overleaf), Australian household consumption is still below its pre-COVID level and weaker than that of other markets such as the U.S., where herd immunity is closer in sight (Figure 6b, overleaf). The recent lockdowns in Victoria and New South Wales will only serve to delay normalisation and could detract around 0.2% from GDP, depending on the length of the lockdown and the strength of the subsequent rebound.
An unsustainable economic reopening, together with ongoing competitive cost pressures in the labour market depressing wage growth, suggests that inflation will continue to undershoot the 2% target in the near term (Figure 7, overleaf). In our baseline scenario, where unemployment falls to around 4.5% over the next two years, core inflation will average around 1.7% and end 2023 just slightly under the RBA’s 2% target band. Against this backdrop, we expect the RBA to keep the cash rate at 0.1% until at least 2023 and maintain a tapered form of quantitative easing until the end of 2022.
Figure 5a. U.S. Core PCE forecast
0.5
1.0
1.5
2.0
2.5
3.0
3.5
Jan'19
Jul'19
Jan'20
Jul'20
Jan'21
Jul'21
Jan'22
Jul'22
YoY%
%YoY Core PCE ActualBaselineUpside scenario
Source: Vanguard, July 2021
Figure 5b. U.S. is expected to deliver the most fiscal support in 2021
10
20
30
40
50
60
70
80
Q2'21
Q4'21
Q2'22
Q4'22
Q2'23
Q4'23
Prob
abili
ty o
f mee
ting
thre
shol
d cr
iteria
Full employment thresholdInflation threshold
Federal reservelift-offrangeband
Both thresholdsmeet Fed li-off
Source: Vanguard, July 2021

Vanguard Asset allocation report – June 2021 9
Figure 7. Inflation likely to undershoot 2% target in the near-term
2
4
6
Jun '03 Oct '06 Feb '10 Jun '13 Oct '16 Feb '20 Jun '23
Core CPI % YoY Forecast baseline (unemployment at 4.5% by 2023)Forecast upside (unemployment at 3.75% by 2023) Forecast downside (unemployment at 5.5% by 2023)RBA's target band
Source: Vanguard Investments Australia Ltd, July 2021, using data from Refinitiv.
Figure 6a. Cumulative % GDP since Q4 2019 Figure 6b. % change from pre-COVID Q4 2019 levels, Australia vs U.S.
−6.0
−4.0
−2.0
0.0
2.0
4.0
6.0
8.0%
Dec'19
Apr'20
Aug'20
Dec'20
Apr'21
Aug'21
Dec'21
Apr'22
Aug'22
Dec'22
Pre-COVID trend Actual Baseline
−10
−5
0
5%
Q1 '20 Q2 '20 Q3 '20 Q4 '20 Q1 '21
Australia United States
Source: Vanguard, July 2021using data from Refinitiv. Source: Vanguard, July 2021using data from Refinitiv.

Vanguard Asset allocation report – June 2021 10
Market outlook
The rally in global risk assets picked up where the previous quarter left off, seeing valuations continue to rise amid firming economic data, additional fiscal stimulus, and the assurances of central banks that they will keep interest rates lower for longer. Advancing valuations have led to a mild downgrade in the equity outlook moving forward, with expectations for global equities decreasing to a range of 3.6% to 5.6% over the next ten years, 30 bps lower compared to our March projections (Figure 8). Meanwhile, the fixed income outlook remains in line with our March forecast, as yields only retreated slightly towards the end of the quarter.
As a divergence in economic trajectories between regions is expected to persist over the near term, it is a timely opportunity to remind investors of the benefits of holding
a globally diversified portfolio. Having exposure to a variety of asset classes, sectors and regions can help manage concentration risks and navigate the unpredictability of markets. Meanwhile, despite historically low yields, high-quality fixed income retains an important role in the portfolio as a ballast and diversifier of risk, as we show in our recent paper Hedging Equity Downside Risk With Bonds in the Low-Yield Environment.
With volatility expected to remain elevated in the near term as economies continue to navigate the policy- and health-related uncertainties of the road ahead, investors would be encouraged to tune out the noise and focus on what they can control—keeping sight of long-term investment goals, appropriately aligning their portfolios, and maintaining the discipline to stick to their plans.
Figure 8. Ten-year outlook: setting reasonable expectations
95th
75th
25th
5th
Optimistic
Pessimistic
Centralexpectation
Latest median return
March 2021median
4.8% 4.6%1.6% 2.0%
4.2%
5.2% 4.9%
1.7% 2.1%4.4%
0
5
10
15
20%
AustralianEquity
Global Equity(unhedged)
AustralianBonds
Global Bonds(hedged)
60/40 GlobalEquity/Bond
Portfolio
Ann
ualis
ed 1
0-y
ear
nom
inal
ret
urn
Source: Vanguard, July 2021, using 31 May 2021 and 31 March 2021 VCMM simulations.
Vanguard Asset allocation report – June 2021 11
Long-term market outlook
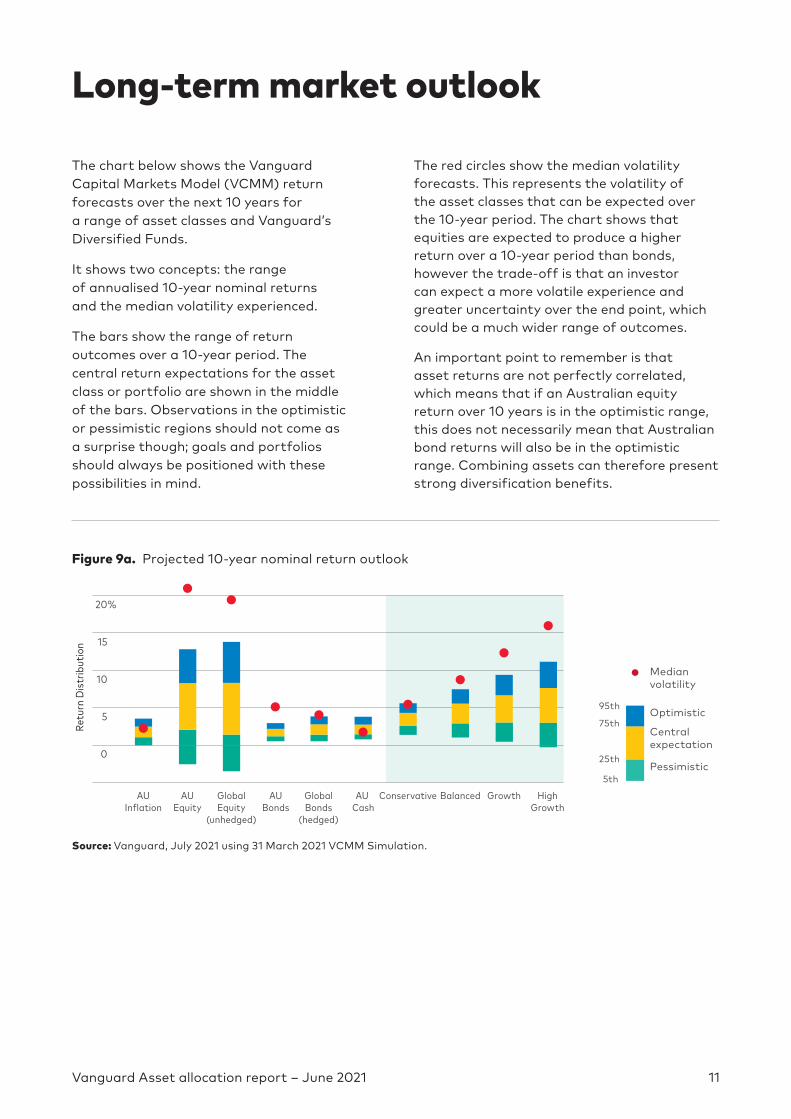
The chart below shows the Vanguard Capital Markets Model (VCMM) return forecasts over the next 10 years for a range of asset classes and Vanguard’s Diversified Funds.
It shows two concepts: the range of annualised 10-year nominal returns and the median volatility experienced.
The bars show the range of return outcomes over a 10-year period. The central return expectations for the asset class or portfolio are shown in the middle of the bars. Observations in the optimistic or pessimistic regions should not come as a surprise though; goals and portfolios should always be positioned with these possibilities in mind.
The red circles show the median volatility forecasts. This represents the volatility of the asset classes that can be expected over the 10-year period. The chart shows that equities are expected to produce a higher return over a 10-year period than bonds, however the trade-off is that an investor can expect a more volatile experience and greater uncertainty over the end point, which could be a much wider range of outcomes.
An important point to remember is that asset returns are not perfectly correlated, which means that if an Australian equity return over 10 years is in the optimistic range, this does not necessarily mean that Australian bond returns will also be in the optimistic range. Combining assets can therefore present strong diversification benefits.
Figure 9a. Projected 10-year nominal return outlook
0
5
10
15
20%
AUInflation
AUEquity
GlobalEquity
(unhedged)
AUBonds
GlobalBonds
(hedged)
AU Cash
Conservative Balanced Growth HighGrowth
Retu
rn D
istr
ibut
ion
95th
75th
25th
5th
Optimistic
Pessimistic
Centralexpectation
Medianvolatility
Source: Vanguard, July 2021 using 31 March 2021 VCMM Simulation.
Vanguard Asset allocation report – June 2021 12
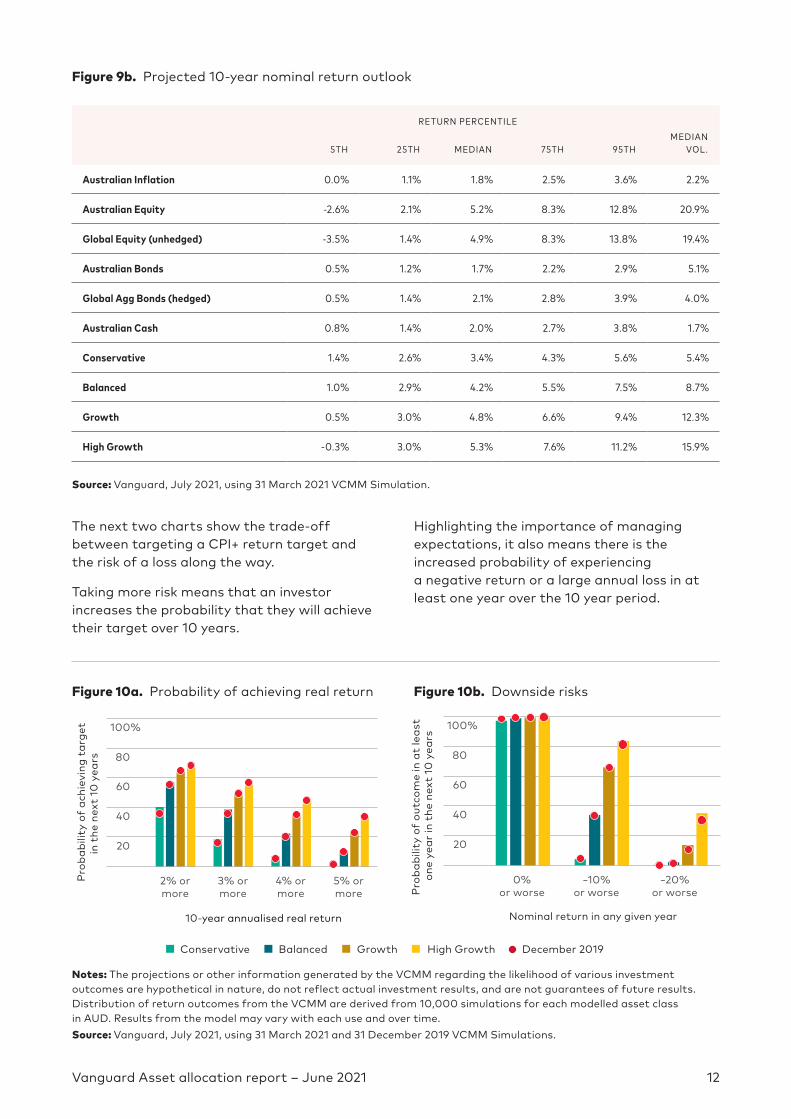
Figure 9b. Projected 10-year nominal return outlook
RETURN PERCENTILE
5TH 25TH MEDIAN 75TH 95THMEDIAN
VOL.
Australian Inflation 0.0% 1.1% 1.8% 2.5% 3.6% 2.2%
Australian Equity -2.6% 2.1% 5.2% 8.3% 12.8% 20.9%
Global Equity (unhedged) -3.5% 1.4% 4.9% 8.3% 13.8% 19.4%
Australian Bonds 0.5% 1.2% 1.7% 2.2% 2.9% 5.1%
Global Agg Bonds (hedged) 0.5% 1.4% 2.1% 2.8% 3.9% 4.0%
Australian Cash 0.8% 1.4% 2.0% 2.7% 3.8% 1.7%
Conservative 1.4% 2.6% 3.4% 4.3% 5.6% 5.4%
Balanced 1.0% 2.9% 4.2% 5.5% 7.5% 8.7%
Growth 0.5% 3.0% 4.8% 6.6% 9.4% 12.3%
High Growth -0.3% 3.0% 5.3% 7.6% 11.2% 15.9%
Source: Vanguard, July 2021, using 31 March 2021 VCMM Simulation.
The next two charts show the trade-off between targeting a CPI+ return target and the risk of a loss along the way.
Taking more risk means that an investor increases the probability that they will achieve their target over 10 years.
Highlighting the importance of managing expectations, it also means there is the increased probability of experiencing a negative return or a large annual loss in at least one year over the 10 year period.
Figure 10a. Probability of achieving real return Figure 10b. Downside risks
20
40
60
80
100%
2% ormore
3% ormore
4% ormore
5% ormore
Prob
abili
ty o
f ac
hiev
ing
targ
etin
the
nex
t 10
yea
rs
10-year annualised real return
20
40
60
80
100%
0%or worse
−10%or worse
−20%or worsePr
obab
ility
of
outc
ome
in a
t le
ast
one
year
in t
he n
ext
10 y
ears
Nominal return in any given year
Balanced Growth High Growth December 2019Conservative
Notes: The projections or other information generated by the VCMM regarding the likelihood of various investment outcomes are hypothetical in nature, do not reflect actual investment results, and are not guarantees of future results. Distribution of return outcomes from the VCMM are derived from 10,000 simulations for each modelled asset class in AUD. Results from the model may vary with each use and over time. Source: Vanguard, July 2021, using 31 March 2021 and 31 December 2019 VCMM Simulations.

Vanguard Asset allocation report – June 2021 13
About Vanguard’s Investment Strategy GroupVanguard’s Investment Strategy Group is a global team of economists and investment and portfolio construction strategists with a wide variety of specialties, ranging from monetary policy to index construction to market trends. Their research serves as the basis for Vanguard’s investment principles and methodology, guides Vanguard’s global leadership and influences decisions about our investment offerings and portfolio construction.
Research-based investment approachAs part of Vanguard’s broader Investment Management Group, ISG plays an essential role in developing Vanguard’s investment methodology, which is carried through in the implicit and explicit advice solutions available to our clients. Our global chief economist and head of ISG reports directly to Vanguard’s global chief investment officer. We work closely with Vanguard’s in-house portfolio managers. Notably, our global chief economist is integrated into Vanguard Fixed Income Group through our portfolio management process. Through that process, ISG advises our fixed income investment managers on the macroeconomic outlook, expected monetary policy and other factors to support day-to-day portfolio management. Vanguard’s investors around the world benefit from our collaborative approach to investment management, research and thought leadership.
Vanguard Capital Markets ModelThe Vanguard Capital Markets Model® (VCMM) projections are based on a statistical analysis of historical data. Future returns may behave differently from the historical patterns captured in the VCMM. More important, the VCMM may be underestimating extreme negative scenarios unobserved in the historical period on which the model estimation is based. The VCMM is a proprietary financial simulator developed and maintained by Vanguard’s Investment Strategy Group. It is a long-term tool that takes into account current macroeconomic conditions and equity and bond valuations to forecast distributions of future returns for a wide range of asset classes and portfolios. The primary value of the VCMM is in its application to analysing potential client portfolios. VCMM asset-class forecasts – comprising distributions of expected returns, volatilities, and correlations — are key to the evaluation of potential downside risks, various risk-return trade-offs, and diversification benefits of various asset classes.
Vanguard Asset allocation report – June 2021 14
Asset allocation
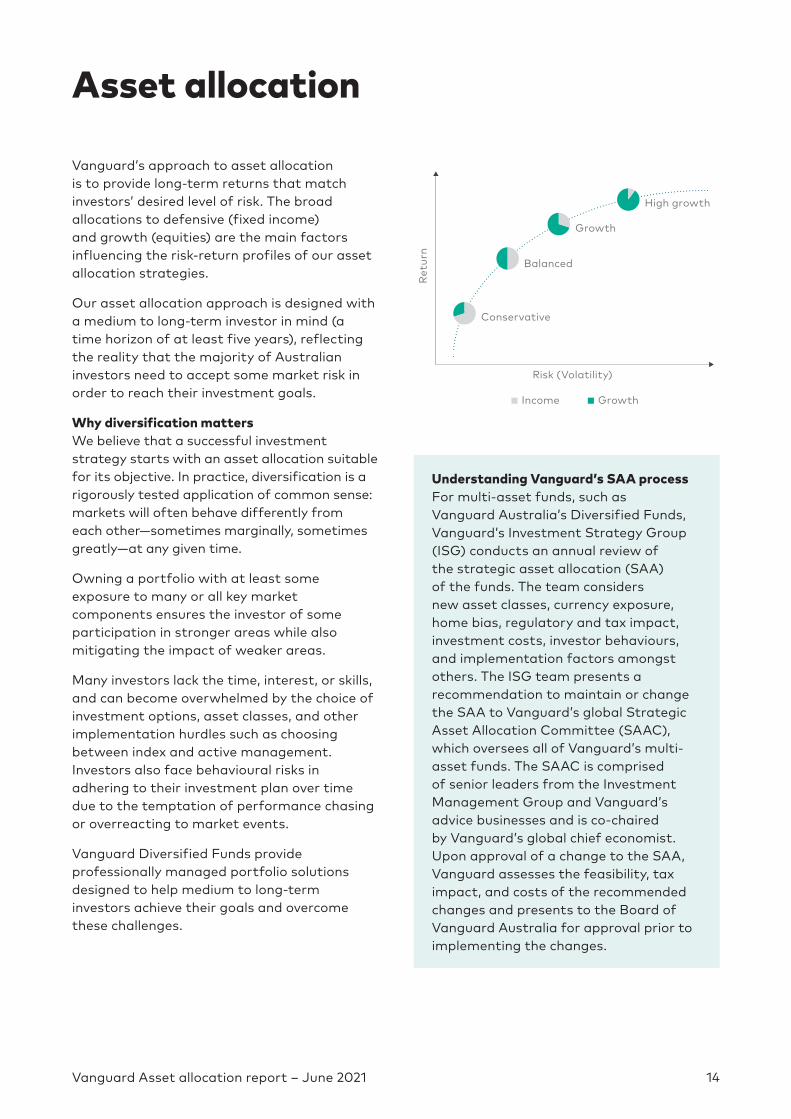
Vanguard’s approach to asset allocation is to provide long-term returns that match investors’ desired level of risk. The broad allocations to defensive (fixed income) and growth (equities) are the main factors influencing the risk-return profiles of our asset allocation strategies.
Our asset allocation approach is designed with a medium to long-term investor in mind (a time horizon of at least five years), reflecting the reality that the majority of Australian investors need to accept some market risk in order to reach their investment goals.
Why diversification matters We believe that a successful investment strategy starts with an asset allocation suitable for its objective. In practice, diversification is a rigorously tested application of common sense: markets will often behave differently from each other—sometimes marginally, sometimes greatly—at any given time.
Owning a portfolio with at least some exposure to many or all key market components ensures the investor of some participation in stronger areas while also mitigating the impact of weaker areas.
Many investors lack the time, interest, or skills, and can become overwhelmed by the choice of investment options, asset classes, and other implementation hurdles such as choosing between index and active management. Investors also face behavioural risks in adhering to their investment plan over time due to the temptation of performance chasing or overreacting to market events.
Vanguard Diversified Funds provide professionally managed portfolio solutions designed to help medium to long-term investors achieve their goals and overcome these challenges.
Conservative
Balanced
Risk (Volatility)
Ret
urn
Growth
High growth
GrowthIncome
Understanding Vanguard’s SAA processFor multi-asset funds, such as Vanguard Australia’s Diversified Funds, Vanguard’s Investment Strategy Group (ISG) conducts an annual review of the strategic asset allocation (SAA) of the funds. The team considers new asset classes, currency exposure, home bias, regulatory and tax impact, investment costs, investor behaviours, and implementation factors amongst others. The ISG team presents a recommendation to maintain or change the SAA to Vanguard’s global Strategic Asset Allocation Committee (SAAC), which oversees all of Vanguard’s multi-asset funds. The SAAC is comprised of senior leaders from the Investment Management Group and Vanguard’s advice businesses and is co-chaired by Vanguard’s global chief economist. Upon approval of a change to the SAA, Vanguard assesses the feasibility, tax impact, and costs of the recommended changes and presents to the Board of Vanguard Australia for approval prior to implementing the changes.

Vanguard Asset allocation report – June 2021 15
The shaded boxes display the total return percentile rank of the Vanguard fund within its peer group*, as shown by the colour code, with the number reflecting the Vanguard fund return in excess of the peer group median return (%). The numbers below the shaded boxes indicate the number of funds in the peer groups across each time period.
Figure 12. Vanguard diversified funds peer group comparison as at 30 June 2021
VAN GUARD FU N D ASSET WEIGHTED PEER GROUP
MER (% P. A .) 3 MTHS 6 MTHS 1 YR 3 YRS 5 YRS 7 YRS 10 YRS
Conservative
0.660.10 –0.57 –0.26 1.59 0.95 1.39 1.14
47 47 46 43 40 39 34
Balanced
0.800.19 –0.98 –0.99 1.69 0.91 1.41 1.24
56 56 54 50 45 41 33
Growth
0.790.28 0.00 0.17 1.91 1.30 1.54 1.36
74 73 73 67 64 61 55
High Growth
0.840.44 –0.06 0.18 1.94 1.00 1.39 1.27
54 54 53 50 45 42 39
PEER GROUP PERCENTILE
Top 5%
1st quartile
2nd quartile
3rd quartile
4th quartile
Sources: Vanguard, July 2021. Calculations using data from Morningstar Inc. Past performance is not an indication of future performance. All returns are net of fees and assume reinvestment of income distributions. Returns greater than 12 months are annualised. There has been no adjustment for survivorship bias.* The peer groups were constructed by first sourcing a universe of funds from Morningstar having the same category
as the Vanguard Funds, but excluding Vanguard strategies. An automated filter was then applied to these original peer groups with the aim of removing identified duplicate investment strategies and retain unique strategies.
Figure 13. Vanguard diversified funds return contributions for the quarter as at 30 June 2021
3 MONTH GROSS RETURN (%)
3 MONTH RETURN CONTRIBUTION (%)
FUND VCIF VBIF VGIF VHIF
Vanguard Cash Reserve Fund 0.03 0.0 0.0 0.0 0.0
Vanguard Australian Fixed Interest Index Fund 1.51 0.3 0.2 0.1 0.0
Vanguard Australian Shares Index Fund 8.48 1.0 1.7 2.3 3.0
Vanguard International Shares Index Fund 9.39 0.8 1.3 1.9 2.5
Vanguard International Small Companies Index Fund 6.51 0.1 0.2 0.3 0.4
Vanguard Emerging Markets Shares Index Fund 6.57 0.1 0.2 0.3 0.3
Vanguard International Shares Index Fund (Hedged) – AU
Class7.59 0.4 0.7 0.9 1.2
Vanguard Global Aggregate Bond Index Fund (Hedged) 1.12 0.5 0.4 0.2 0.1
Total Return Contribution (%) 3.2 4.7 6.2 7.6
* Figures in the return contribution table are calculated as the product of the monthly gross return and the corresponding actual asset allocation.

Vanguard Asset allocation report – June 2021 16
Given the low yield environment, is there still a role for traditional diversifiers (such as bonds) in today’s balanced portfolio?
A recent narrative questioning the merit of a diversified portfolio of traditional equities and bonds has had many in the investment management industry asking: “Is the 60/40 portfolio dead?”.
Generally referred to as a balanced portfolio, “60/40” refers to a mix of 60% equities and 40%
bonds. It is a universal portfolio construct designed to deliver sufficient returns for a range of investor goals while providing adequate diversification to satisfy the risk tolerance of the investor. Importantly, 60/40 is a guide only, with the exact mix of equities and bonds driven by the investor’s return requirements, risk tolerance, time frame and other factors that a qualified financial adviser is well placed to assess.
At the heart of the debate however is a question more fundamental than the exact asset allocation mix. And that is whether or not there is still a role for traditional diversifiers, such as bonds, in today’s balanced portfolio, given the low yield environment we are expecting for years to come.
The 60/40 portfolio is not dead, and nor is it on life support. What should be put to bed however are unrealistic expectations of returns from a well-diversified portfolio given current market conditions.
Over the past decade, downward pressure on inflation and unprecedented levels of central bank stimulus have seen 10-year government
bond yields fall from 5% to just 1.6%. Similarly, the stellar performance of riskier assets (such as shares, property and infrastructure) over this same period cannot last forever, and may likely see reduced returns in the future.
But while the outlook for both equities and bonds is likely lower from here, it doesn’t invalidate the principles of diversification that remain well-served by an allocation to high quality government and corporate bonds.
Lower return expectations have resulted in some investors, both professional and non-professional, migrating up the risk spectrum to chase returns at the expense of portfolio risk. While the market volatility that unsettled investors in March and April last year was relatively short lived, it served to underscore the importance of maintaining bonds in the portfolio. Holding an allocation to high quality bonds during the period of volatility enabled disciplined investors to maintain their target asset allocation by selling a portion of their bonds to purchase shares, which fell as much as 37% during the first quarter of 2020.
Take for example two identical diversified funds with a 60/40 asset allocation, where one was regularly rebalanced during the 6-month period from the start of March 2020, and the other wasn’t rebalanced at all. The cumulative return difference of the rebalanced portfolio was more than 1% above that of the non-rebalanced portfolio – which is “low hanging fruit”, particularly for investors nearing or already in retirement.
For professionally managed diversified funds, asset allocation is monitored daily and the portfolio rebalanced regularly to ensure
Is the 60/40 portfolio dead?
Aidan GeysenSenior Investment Strategist and Manager, Vanguard Australia

Vanguard Asset allocation report – June 2021 17
the risk in the portfolio remains consistent. During periods of volatility, the portfolio will be well placed to capitalise on any future recovery in shares.
And while bond yields have recently risen following expectations of a pick-up in inflation as global economies recover from the depths of the pandemic, return expectations remain well below historic levels. Given lower expected returns, it is important that investors see the role of bonds as a diversifier of portfolio risk, with shares still likely to do the heavy lifting when it comes to delivering return requirements.
The temptation can exist to over-extend portfolio risk to achieve a goal quicker but investors should be forewarned that taking on excessive risk can often result in poor decision making. Instead of rebalancing, as in the earlier example, investors can often cave in on their goal and sell out at the bottom, sometimes sacrificing years of potential returns in the process. In the prior example, the non-rebalanced portfolio lost 1% compared to the rebalanced portfolio but in a scenario where an investor moved all of their portfolio to cash at the bottom of the market during April 2020, the cumulative cost thus far would have been just shy of 40%!
And so, while the 60/40 portfolio may require some extra patience to achieve your financial goals, whether that be retirement, a first home or a post-pandemic holiday, the consequences of taking on excessive risk could jeopardise achievement of your goal entirely—a hefty long-term penalty to pay for a short-term gain.

Vanguard Capital Markets Model IMPORTANT: The projections or other information generated by the Vanguard Capital Markets Model regarding the likelihood of various investment outcomes are hypothetical in nature, do not reflect actual investment results, and are not guarantees of future results. VCMM results will vary with each use and over time.The Vanguard Capital Markets Model forecasts distributions of future returns for a wide array of broad asset classes. Those asset classes include Australian and international equity markets, several maturities of the Australian Treasury and corporate fixed income markets, international fixed income markets, money markets, commodities, and certain alternative investment strategies. The theoretical and empirical foundation for the Vanguard Capital Markets Model is that the returns of various asset classes reflect the compensation investors require for bearing different types of systematic risk (beta). At the core of the model are estimates of the dynamic statistical relationship between risk factors and asset returns, obtained from statistical analysis based on available monthly financial and economic data from as early as 1960. Using a system of estimated equations, the model then applies a Monte Carlo simulation method to project the estimated interrelationships among risk factors and asset classes as well as uncertainty and randomness over time. The model generates a large set of simulated outcomes for each asset class over several time horizons. Forecasts are obtained by computing measures of central tendency in these simulations. Results produced by the tool will vary with each use and over time.Although central tendencies are generated in any return distribution, Vanguard stresses that focusing on the full range of potential outcomes for the assets considered, such as the data presented in this paper, is the most effective way to use VCMM output. The VCMM seeks to represent the uncertainty in the forecast by generating a wide range of potential outcomes. It is important to recognise that the VCMM does not impose “normality” on the return distributions, but rather is influenced by the so-called fat tails and skewness in the empirical distribution of modelled asset class returns. Within the range of outcomes, individual experiences can be quite different, underscoring the varied nature of potential future paths. Indeed, this is a key reason why we approach asset-return outlooks in a distributional framework.© 2021 Morningstar, Inc. All rights reserved. Neither Morningstar, its affiliates, nor the content providers guarantee the data or content contained herein to be accurate, complete or timely nor will they have any liability for its use or distribution. Any general advice or ‘regulated financial advice’ under New Zealand law has been prepared by Morningstar Australasia Pty Ltd (ABN: 95 090 665 544, AFSL: 240892) and/or Morningstar Research Ltd, subsidiaries of Morningstar, Inc, without reference to your objectives, financial situation or needs. For more information refer to our Financial Services Guide (AU) or Financial Advice Provider Disclosure Statement (NZ) at www.morningstar.com.au/s/fsg.pdf and www.morningstar.au/s/fapds.pdf. You should consider the advice in light of these matters and if applicable, the relevant Product Disclosure Statement before making any decision to invest. Our publications, ratings and products should be viewed as an additional investment resource, not as your sole source of information. Past performance does not necessarily indicate a financial product’s future performance. To obtain advice tailored to your situation, contact a professional financial adviser. The Morningstar Rating is an assessment of a fund’s past performance – based on both return and risk – which shows how similar investments compare with their competitors. A high rating alone is insufficient basis for an investment decision.Vanguard Investments Australia Ltd (ABN 72 072 881 086 / AFS Licence 227263) is the product issuer. We have not taken yours or your clients’ circumstances into account when preparing [the information] so it may not be applicable to the particular situation you are considering. You should consider yours and your clients’ circumstances, and our Product Disclosure Statements (“PDSs”), before making any investment decision or recommendation. You can access our PDSs at vanguard.com.au or by calling 1300 655 205. Past performance is not an indication of future performance. This publication was prepared in good faith and we accept no liability for any errors or omissions. © 2021 Vanguard Australia Investments Ltd. All rights reserved. VAAR_072021
Connect with Vanguard™www.vanguard.com.au1300 655 205