Asset Allocation in a Low Interest Rate World
27
1 © 2016 Windham Capital Management, LLC. All rights reserved. Confidential. Not for redistribution. October 2016 1 Asset Allocation in a Low Interest Rate World Lucas Turton Windham Capital Management, LLC Managing Partner & Chief Investment Officer
-
Upload
windham-labs -
Category
Economy & Finance
-
view
71 -
download
1
Transcript of Asset Allocation in a Low Interest Rate World

1© 2016 Windham Capital Management, LLC. All rights reserved.
Confidential. Not for redistribution.
October 2016 1
Asset Allocation in a Low
Interest Rate World
Lucas TurtonWindham Capital Management, LLC
Managing Partner & Chief Investment Officer

2© 2016 Windham Capital Management, LLC. All rights reserved.
AGENDA
Defining the opportunity set
Estimating risk
Estimating return
Constructing portfolios
Portfolio Analysis

3© 2016 Windham Capital Management, LLC. All rights reserved.
AGENDA
Defining the opportunity set
Estimating risk
Estimating return
Constructing portfolios
Portfolio Analysis

4© 2016 Windham Capital Management, LLC. All rights reserved.
DEFINING THE OPPORTUNITY SET
Criterion for including asset classes
1. Independent
2. Improve Utility
3. Non-overlapping
4. Capacity
5. Representative of a broad factor

5© 2016 Windham Capital Management, LLC. All rights reserved.
DEFINING THE OPPORTUNITY SET
US Equity
Foreign Equity
Emerging Equity
US Bonds
Foreign Bonds
US Real Estate
Foreign Real Estate
Commodities
Major Asset Classes

6© 2016 Windham Capital Management, LLC. All rights reserved.
DEFINING THE OPPORTUNITY SET
Hedge Funds?
• Hedge Funds are intended to generate alpha by allocating to stocks, bonds,
commodities, and currencies.
• Return forecast should be above those estimated using a global CAPM
framework to incorporate manager skill
Private Equity?
• Private equity should represent similar risk characteristics to public equities.
• Return forecast should be above those estimated for equities due to the
illiquidity that an investor accepts.
• The global capitalization of private equity is small relative to public equities

7© 2016 Windham Capital Management, LLC. All rights reserved.
AGENDA
Defining the opportunity set
Estimating risk
Estimating return
Constructing portfolios
Portfolio Analysis

8© 2016 Windham Capital Management, LLC. All rights reserved.
ESTIMATING RISK
Asset Class Historical Exponential Turbulent Regime
US Equities 16.97% 13.54% 18.81%
Foreign Equities 19.69% 15.75% 22.86%
Emerging Equities 25.52% 20.36% 34.13%
Global Real Estate 23.06% 16.53% 28.67%
Commodities 17.49% 14.85% 23.91%
US Bonds 3.34% 2.90% 4.91%
US Floating Rate Bonds 0.51% 0.21% 0.56%
Foreign Bonds 9.32% 8.33% 13.16%
Cash 0.46% 0.18% 0.55%
October 2006 through September 2016

9© 2016 Windham Capital Management, LLC. All rights reserved.
AGENDA
Defining the opportunity set
Estimating risk
Estimating return
Constructing portfolios
Portfolio Analysis
10© 2016 Windham Capital Management, LLC. All rights reserved.
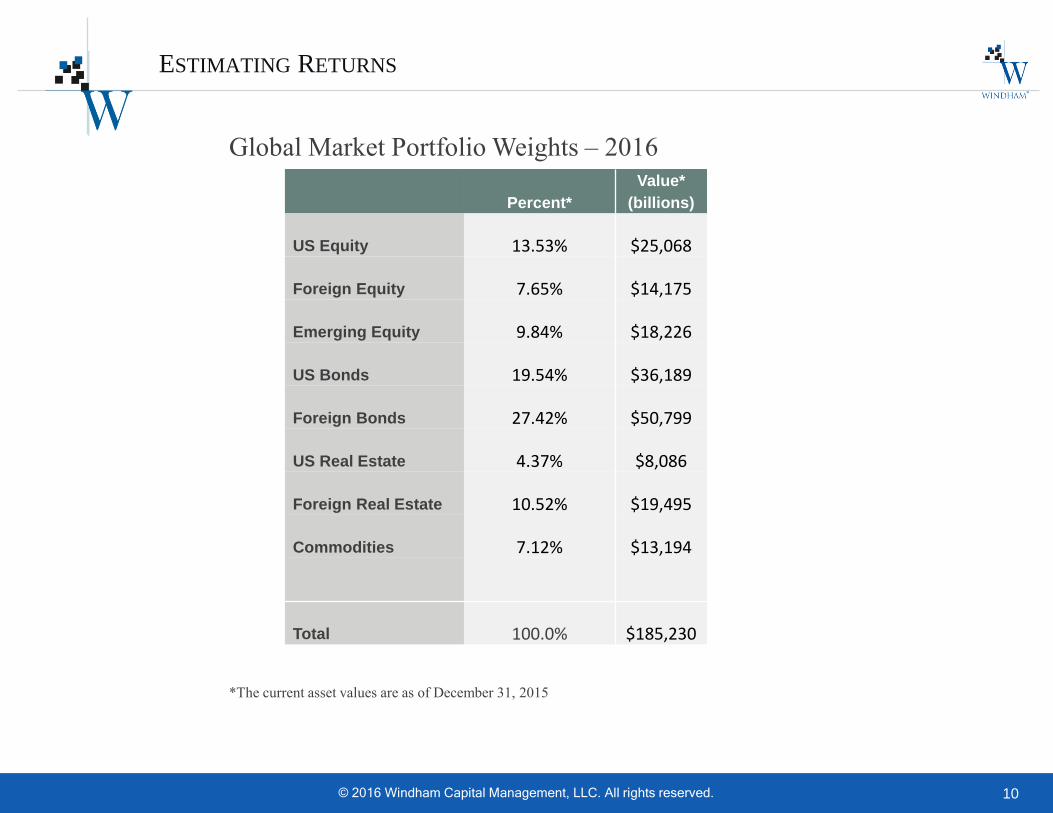
ESTIMATING RETURNS
Percent*
Value*
(billions)
US Equity 13.53% $25,068
Foreign Equity 7.65% $14,175
Emerging Equity 9.84% $18,226
US Bonds 19.54% $36,189
Foreign Bonds 27.42% $50,799
US Real Estate 4.37% $8,086
Foreign Real Estate 10.52% $19,495
Commodities 7.12% $13,194
Total 100.0% $185,230
*The current asset values are as of December 31, 2015
Global Market Portfolio Weights – 2016

11© 2016 Windham Capital Management, LLC. All rights reserved.
ESTIMATING RETURN
Asset Class Historical CAPM View Confidence Bayesian Blend
US Equities 8.77% 7.26% 7.00% 50.00% 7.13%
Foreign Equities 4.46% 9.02% 8.00% 50.00% 8.51%
Emerging Equities 7.62% 10.74% 10.00% 50.00% 10.37%
Global Real Estate 6.67% 9.86% 9.00% 50.00% 9.43%
Commodities -4.50% 6.95% 5.00% 50.00% 5.97%
US Bonds 4.84% 2.18% 1.50% 50.00% 1.84%
US Floating Rate Bonds 1.28% 1.74% 1.25% 50.00% 1.49%
Foreign Bonds 5.59% 3.82% 3.00% 50.00% 3.41%
Cash 0.84% 1.75% 0.25% 100.00% 0.25%
October 2006 through September 2016

12© 2016 Windham Capital Management, LLC. All rights reserved.
AGENDA
Defining the opportunity set
Estimating risk
Estimating return
Constructing portfolios
Portfolio Analysis

13© 2016 Windham Capital Management, LLC. All rights reserved.
CONSTRUCTING PORTFOLIOS
Mean-variance optimization remains

14© 2016 Windham Capital Management, LLC. All rights reserved.
CONSTRUCTING PORTFOLIOS
Asset Class 60/40
US Equities 13%
Foreign Equities 14%
Emerging Equities 11%
Global Real Estate 14%
Commodities 8%
US Bonds 10%
US Floating Rate Bonds 14%
Foreign Bonds 15%
Cash 1%
Expected Return 6%
Expected Risk 12%

15© 2016 Windham Capital Management, LLC. All rights reserved.
CONSTRUCTING PORTFOLIOS
Asset Class 60/40
US Equities 13%
Foreign Equities 14%
Emerging Equities 11%
Global Real Estate 14%
Commodities 8%
US Bonds 10%
US Floating Rate Bonds 14%
Foreign Bonds 15%
Cash 1%
Expected Return 6%
Expected Risk 12%
- Foreign equity exposure
- Hedged foreign bonds

16© 2016 Windham Capital Management, LLC. All rights reserved.
EQUITIES
* Source: An Old Friend: Cliff Asness, PHD, “The Stock Market’s Shiller P/E”, AQR 3rd quarter 2012 letter to investors
Starting P/E Average Real Worst Real Best Real Standard
Low High 10 Yr Return 10 Yr Return 10 Yr Return Deviation
5.2 9.6 10.3% 4.8% 17.5% 2.5%
9.6 10.8 10.4% 3.8% 17.0% 3.5%
10.8 11.9 10.4% 2.8% 15.1% 3.3%
11.9 13.8 9.1% 1.2% 14.3% 3.8%
13.8 15.7 8.0% -0.9% 15.1% 4.6%
15.7 17.3 5.6% -2.3% 14.3% 5.0%
17.3 18.9 5.3% -3.9% 15.1% 5.1%
18.9 21.1 3.9% -3.2% 15.1% 3.9%
21.1 25.1 0.9% -4.4% 13.8% 3.8%
25.1 46.1 0.5% -6.1% 6.3% 3.6%
Results For S&P 500 From Different Starting Shiller P/Es 1926‐2012

17© 2016 Windham Capital Management, LLC. All rights reserved.
EQUITIES
* Source: An Old Friend: Cliff Asness, PHD, “The Stock Market’s Shiller P/E”, AQR 3rd quarter 2012 letter to investors
Starting P/E Average Real Worst Real Best Real Standard
Low High 10 Yr Return 10 Yr Return 10 Yr Return Deviation
5.2 9.6 10.3% 4.8% 17.5% 2.5%
9.6 10.8 10.4% 3.8% 17.0% 3.5%
10.8 11.9 10.4% 2.8% 15.1% 3.3%
11.9 13.8 9.1% 1.2% 14.3% 3.8%
13.8 15.7 8.0% -0.9% 15.1% 4.6%
15.7 17.3 5.6% -2.3% 14.3% 5.0%
17.3 18.9 5.3% -3.9% 15.1% 5.1%
18.9 21.1 3.9% -3.2% 15.1% 3.9%
21.1 25.1 0.9% -4.4% 13.8% 3.8%
25.1 46.1 0.5% -6.1% 6.3% 3.6%
Results For S&P 500 From Different Starting Shiller P/Es 1926‐2012
As of 9/30/2016 CAPE is 26.5

18© 2016 Windham Capital Management, LLC. All rights reserved.
BONDS
5 Year Rate
ChangeYear 5 Rate
3 Year Annualized
Return
5 Year Annualized
Return
4% Rise 6.5% -2.1% -1.1%
3% Rise 5.5% -0.8% -0.1%
2% Rise 4.5% 0.4% 0.9%
1% Rise 3.5% 1.8% 2.0%
Flat 2.5% 3.1% 3.1%
1% Decline 1.5% 4.6% 4.4%
2% Decline 0.5% 6.1% 5.8%
2.5% Decline 0.0% 6.9% 6.5%
Hypothetical Returns for 10 year Treasuries*
* Assumes initial rate of 2.5% and linear rate changes and long term average yield curve slope

19© 2016 Windham Capital Management, LLC. All rights reserved.
BONDS
5 Year Rate
ChangeYear 5 Rate
3 Year Annualized
Return
5 Year Annualized
Return
4% Rise 6.5% -2.1% -1.1%
3% Rise 5.5% -0.8% -0.1%
2% Rise 4.5% 0.4% 0.9%
1% Rise 3.5% 1.8% 2.0%
Flat 2.5% 3.1% 3.1%
1% Decline 1.5% 4.6% 4.4%
2% Decline 0.5% 6.1% 5.8%
2.5% Decline 0.0% 6.9% 6.5%
Hypothetical Returns for 10 year Treasuries*
* Assumes initial rate of 2.5% and linear rate changes and long term average yield curve slope
Since 1871, 77% of 5yr
rolling changes are within
this range
(of 1652 observations)

20© 2016 Windham Capital Management, LLC. All rights reserved.
BONDS
5 Year Rate
ChangeYear 5 Rate
3 Year Annualized
Return
5 Year Annualized
Return
4% Rise 6.5% -2.1% -1.1%
3% Rise 5.5% -0.8% -0.1%
2% Rise 4.5% 0.4% 0.9%
1% Rise 3.5% 1.8% 2.0%
Flat 2.5% 3.1% 3.1%
1% Decline 1.5% 4.6% 4.4%
2% Decline 0.5% 6.1% 5.8%
2.5% Decline 0.0% 6.9% 6.5%
Hypothetical Returns for 10 year Treasuries*
* Assumes initial rate of 2.5% and linear rate changes and long term average yield curve slope
When rates are 2.65% or
below they have risen
69% of the time and
never fallen more than
1%
(of 180 observations)

21© 2016 Windham Capital Management, LLC. All rights reserved.
AGENDA
Defining the opportunity set
Estimating risk
Estimating return
Constructing portfolios
Portfolio Analysis

22© 2016 Windham Capital Management, LLC. All rights reserved.
PORTFOLIO ANALYSIS
3 year horizon, 10% absolute loss, 10% relative loss
to 60/40 US equity/US bond

23© 2016 Windham Capital Management, LLC. All rights reserved.
PORTFOLIO ANALYSIS
$1,000,000 portfolio over 3 year horizon

24© 2016 Windham Capital Management, LLC. All rights reserved.
PORTFOLIO ANALYSIS
$1,000,000 portfolio over 3 year horizon

25© 2016 Windham Capital Management, LLC. All rights reserved.
SUMMARY
Low return environment
Downside risk to equities and bonds
Valuations do matter
Know your risk

26© 2016 Windham Capital Management, LLC
Upcoming Windham Webinars
Windham Software Overview
Tomorrow, October 21st at 11am
Portfolio Simulation to Meet Client Goals
with Benjamin Eischen
Tuesday, November 15th
www.windhamlabs.com/webinars/

27© 2016 Windham Capital Management, LLC
Disclaimer
The information contained in this presentation (the “Presentation”) is prepared solely for informational purposes. The Presentation is neither an offer
to buy or sell nor a solicitation of an offer to buy or sell any security, or interests or shares in any fund or strategy. Historical data and other
information contained herein is believed to be reliable but no representation is made as to its accuracy or completeness or suitability for any specific
purpose. Past performance is not indicative of future performance, which may vary. There can be no assurance that the strategies’ investment
objectives will be achieved. All strategies in this Presentation place investor capital at risk. Future returns are not guaranteed and a loss of principal
may occur.
References to market or composite indices, benchmarks or other measures of relative market performance over a specified period of time are
provided for your information only. Reference to an index does not imply that the Windham portfolio will achieve returns, volatility or other results
similar to the index. The composition of a benchmark index may not reflect the manner in which a Windham portfolio is constructed in relation to
expected or achieved returns, investment holdings, portfolio guidelines, correlations or tracking error targets, all of which are subject to change over
time.
Prospective investors should not rely on this Presentation in making any investment decisions. Windham’s portfolio risk management includes a
process for managing and monitoring risk, but should not be confused with, and does not imply, low risk. Asset classes and proportional weightings
in Windham portfolios may change at any time without notice. Windham does not provide tax advice to its clients and all investors are urged to
consult with their tax advisors with respect to any potential investment.
Please refer to Windham’s ADV Part 2A for additional information. Windham and its owners disclaim any and all liability relat ing to this Presentation,
including without limitation any express or implied representations or warranties for statements contained in, and omissions from, this information.