Asset Allocation Fund · Central Depository Company of Pakistan Limited, Chief Financial Officer...
33
Condensed Interim Financial Information for the Nine Months & Quarter Ended March 31, 2017 Asset Allocation Fund
Transcript of Asset Allocation Fund · Central Depository Company of Pakistan Limited, Chief Financial Officer...

Condensed Interim Financial Information for theNine Months & Quarter EndedMarch 31, 2017
Asset Allocation Fund

Fund Information
Mission Statement
Report of the Directors of the Management Company
Condensed Interim Statement of Assets and Liabilities
Condensed Interim Income Statement
Condensed Interim Distribution Statement
Condensed Interim Cash Flow Statement
Condensed Interim Statement of Movement in Unit Holders’ Fund
Notes to the Condensed Interim Financial Information
04
05
06
10
11
12
13
14
15
31

Deloitte Yousuf Adil, Chartered Accountants
JS Bank Limited
Faysal Asset Management Limited
Mr. Nauman Ansari, ChairmanMr. Osman Khan, DirectorSyed Ibad-Ur-Rehman Chishti, DirectorMr. Mohammad Zahid Ahmed, DirectorMr. Razi-Ur-Rahman Khan, Director/CEO
Mr. Naved Hanif
Mr. Osman Khan, ChairmanSyed Ibad-ur-Rehman Chisti, Member
Central Depository Company of Pakistan Limited,
Chief Financial Officerand Company Secretary of theManagement Company
Mr. Osman Khan, ChairmanSyed Ibad-Ur-Rehman Chishti, MemberMr. Razi-Ur-Rahman Khan, Member
HR Comittee


Quarter Ended March 31
2017 2016
32.88(1.88)
31.00-
31.0080.53
42.53
(5.87)
36.66
-
36.66
65.63
Nine Months Ended
March 312017 2016
34.07 (7.64)
26.43-
26.4380.53
(35.02)
(19.35)
(54.37)
-
(54.37)
65.63
Quarter Ended March 31
2017 2016
32.88(1.88)
31.00-
31.0080.53
42.53
(5.87)
36.66
-
36.66
65.63
Nine Months Ended
March 312017 2016
34.07 (7.64)
26.43-
26.4380.53
(35.02)
(19.35)
(54.37)
-
(54.37)
65.63
Current account deficit increased to $ 5.5 billion in Jul-Feb FY17, which was largely due to a sizable increase in imports of capital goods, along with delayed receipts of Coalition Support Fund (CSF). The rise in overall import payments was mainly driven by increased purchases and higher prices of fuel. However, there was significant increase in capital goods imports, which will lead the economy to a higher growth path.
Till March 31 2017, Pakistan’s total liquid foreign exchange reserves amounted to $21.550 billion for the period ended March 31, 2017. Forex reserves held by the State Bank of Pakistan (SBP) stood at $16.466 billion, while the net foreign exchange reserves held by commercial banks equaled at $5.084 billion. However, the external front constraints pose immense risk to country’s long term sustainable growth evident from the monthly import bill that crossed $5 billion for the first time in March, which took the nine-month trade deficit to $23.4 billion – also a new record. The gap between imports and exports stood at $23.38 billion in the July-March period of current fiscal year, which was 38.8% or $6.53 billion more than the comparative period of previous year. The main reason behind the ballooning deficit was constant double-digit growth in imports and contraction in exports. The nine-month trade gap was $2.9 billion more than the fiscal year’s annual deficit target of $20.5 billion, set by the Ministry of Finance. Exports fell 3.1% to only $15.1 billion during July-March 2016-17, which were $478 million less than the shipments made in the comparative period of last year. Imports, however, increased 18.7% to $38.5 billion in the same period. In absolute terms, the import bill was $6.6 billion higher than the previous year.
Remittances play a major role in stabilizing Pakistan’s external sector, as they make up almost half the import bill and cover the deficit in the trade of goods account. Nevertheless, in recent times, they have come under pressure due to global economic slowdown on the back of low crude oil prices. Overseas Pakistani workers sent remittances amounting to $1.69 billion in March, an increase of 19% from February when it stood at $1.42 billion. However, cumulatively, the figure fails to convey the whole picture as remittances during the first nine months (July-March) of the current fiscal year declined to $14.06 billion from $14.39 billion in the same period of previous fiscal year – a fall of 2.29%.
Analysts have warned that the country’s foreign reserves might deplete fast in the coming months unless its policymakers take serious steps in increasing exports on sustainable basis. However, the SBP is confident that the country faces no immediate threat from the slowdown in remittances and it is in a much better position to repay debts in the next four to five years.
All in all, Pakistan has entered into a new era of development whereby overseas investors have acknowledged it as land of unlimited opportunities offering investment friendly environment in diverse sectors as prided by board of Investment (BOI) achieving $ 1.3 billion foreign investment target set for first three quarters of current fiscal year. Consequently, despite constraints on country’s balance of payments position, improvements in investors’ confidence as reflected in an uptick in private sector credit, especially for fixed investment purposes; foreign interests in Pakistani companies; and increased production of consumer durables are indeed laudable. Similarly, a surge in import of machinery and raw materials also points to a robust industrial activity and buildup of future productive capacity. The fact that Pakistan is growing and enjoys the trust of the lender agencies will go on to act as a catalyst in redoubling its successes in the years to come.
The Board of Directors of the Faysal Asset Management Limited, the management company of the Faysal Asset Allocation Fund (FAAF), is pleased to present the un-audited condensed interim financial information of FAAF for the nine months and quarter ended March 31, 2017.
FINANCIAL HIGHLIGHTS
ECONOMIC REVIEW:
Pakistan's economy is out of the woods. It is now on a winning streak. Irrespective of inherent weaknesses, its private and public sectors have made great strides. Our country’s economy has strengthened following successful completion of its three-year program with International Monetary Fund (IMF) where the economy is expected to grow by 5% over the next two years because of China Pakistan Economic Corridor (CPEC) projects as infrastructure gaps may reduce through increased investment in transportation and power. This is quite a healthy trend, keeping in view the economic turmoil on an international stage since 2008. In terms of purchasing power, Pakistan's economy is ranked 24th in the world. Its 200 million population, with an enterprising youth, are the decisive factors for social mobility, growth and productivity. At the macro-economic level, Pakistan has made immense progress irrespective of bottlenecks. Inflow of capital in the last few years has helped in the development of infrastructure, especially in the sectors of health, education and civic amenities.
Average CPI-based inflation in three quarters of the current fiscal year (July-March) increased 4.01% compared to 2.64% the same period of previous year reflecting higher domestic demand and increase in global commodity prices. The large scale manufacturing (LSM) sector continues to grow at 3.5% with increase in production of cement, steel, pharmaceuticals, automobiles, paper & board and electronics.
FBR had collected PKR 2258 billion during July-March of the current fiscal year. the FBR is facing shortfall due to the pro growth incentives offered to various sectors of the economy particularly exports and agriculture; major item of revenue gap amounting to PKR 100 billion was due to not passing the full impact of the POL prices to the common man. Pakistan has also revised the budget deficit target to 4.1% of the GDP from budgetary estimates of 3.8% of the GDP due to lower tax collection and soaring expenditures.
Total Income / (loss)
Operating Expenses
Profit / (loss) Before Tax
Taxation
Profit/ (loss) After Tax
NAV per unit (Rs. Per unit)
Quarter Ended March 31
2017 2016
32.88(1.88)
31.00-
31.0080.53
42.53
(5.87)
36.66
-
36.66
65.63
Nine Months Ended
March 312017 2016
34.07 (7.64)
26.43-
26.4380.53
(35.02)
(19.35)
(54.37)
-
(54.37)
65.63
EQUITY REVIEW
Equity Market ended the nine months period of FY17 at 48,155.93 levels remarkably returning 27.45% in 9MFY17, while KMI 30 generated a staggering return of 24%.
The month of March’17 however, persisted on dull note as the index remained almost flat compared to previous month’s closing level as PSX 100 index slipped 0.78% MoM to take CYTD return to merely 0.73%.
In the nine months of FY17 (July-March 2016-17), foreign investors have sold stocks worth $483 mn. Foreign selling was majorly absorbed by mutual funds which cumulatively bought $419 mn worth shares in those eight months.
In this depressing scenario, mutual funds have come to the rescue that have scaled up PSX by 27% in 9MFYTD (till March 31, 2017), which is reasonably healthy as index is trajecting upward with a huge arbitrage standing in view of upcoming MSCI EM inclusion due next month.
During the 3rd quarter 2017 (January 2017- March 2017) foreigners & local banks were net sellers of US$163.3mn/US$66.9mn, while local mutual funds and insurance companies were net buyers of US$111.1mn/US$35.7mn. Average volume/value surged 154%/132% partially due to low base effect of last year, as volumes were thin due to low oil prices & a global equities sell-off.
During the period ended on March 31 2017, Automobile Assemblers, Chemicals, Engineering, Oil & Gas Marketing, Paper & Board, Refinery, and Transport sectors performed better than the market while, Fertilizer, Oil & Gas Exploration, Power Generation & Distribution sectors lagged behind. Healthy earnings announcements and improving future outlook amid strong volumetric growth and robust profit margins resulted in the out-performance of the Automobile & Assembler sector. Gas distribution companies led the upside of OMC sector amid improving earnings outlook. Investors accumulated position in Paper & Board sector on the back of better than expected corporate results by a select company and improving earnings outlook considering likely imposition of anti-dumping duty on imports. We attribute the abysmal performance of the Fertilizer sector to the weak global price outlook of urea amid supply glut. Owing to un-impressive earnings announcements and lower than expected payouts the Power Generation & Distribution sector failed to draw investors’ interest. Driven by renewed fall in the global oil prices, the Oil & Gas Exploration sector depicted subdued performance.
All in all, positivity on the market direction cannot be ruled out as future events (results, upcoming upgrade, Budget) may help the market shade off its underperformance. PSX stake sale & MSCI EM-upgrade’s bullish sentiments are likely to be checked by political & regulatory uncertainty along with a prelude to MSCI flows in the form of foreign funds rebalancing new FTSE scrips between themselves overseas.
Going forward, we still see substantial upside potential for equities driven by reasonable valuations as captured in forward P/E multiples of 10.4x; benign near-term inflation and interest rates; improving macro-economic outlook; buoyant business and consumer
sentiment; and expectation of healthy foreign inflows from funds tracking MSCI EM Index. That said, we may see bouts of volatility amid domestic political liquidity and global policy uncertainty. Investors are advised to stay the course unfazed by the confusing headlines, keeping long-term objective in mind.
PSX-100 is currently trading at a PER of 9.3x (2017) against Asia Pac regional average of 12.9x while offering twice as better dividend yield of ~5.2 % versus ~2.7% offered by the region.
FUND PERFORMANCE
Faysal Asset Allocation Fund yielded an absolute return of 16.96% for the nine months period ended on March 31, 2017. At the end of 9MFY17, your fund aggregated its equity exposure to 80.84% to buffer and hedge against on-going volatility in the market. Going forward, your fund will devise its portfolio strategy whilst keeping in view the dynamics of different asset classes available.
FUND RANKING
The Pakistan Credit Agency Limited (PACRA) has assigned a "Mutual Fund Performance Ranking 2 - Star" (3 years), (Below, Average) fund ranking to FAAF.
ACKNOWLEDGEMENT
The Board of Directors of the Management Company thanks the unit holders for their confidence in the Management, the Securities and Exchange Commission of Pakistan for its valuable support, assistance and guidance. The Board also thanks the employees of the Management Company and the Trustee for their dedication and hard work.
For and on behalf of the Board
Razi ur Rahman KhanKarachi: April 28, 2017 Chief Executive Officer
Current account deficit increased to $ 5.5 billion in Jul-Feb FY17, which was largely due to a sizable increase in imports of capital goods, along with delayed receipts of Coalition Support Fund (CSF). The rise in overall import payments was mainly driven by increased purchases and higher prices of fuel. However, there was significant increase in capital goods imports, which will lead the economy to a higher growth path.
Till March 31 2017, Pakistan’s total liquid foreign exchange reserves amounted to $21.550 billion for the period ended March 31, 2017. Forex reserves held by the State Bank of Pakistan (SBP) stood at $16.466 billion, while the net foreign exchange reserves held by commercial banks equaled at $5.084 billion. However, the external front constraints pose immense risk to country’s long term sustainable growth evident from the monthly import bill that crossed $5 billion for the first time in March, which took the nine-month trade deficit to $23.4 billion – also a new record. The gap between imports and exports stood at $23.38 billion in the July-March period of current fiscal year, which was 38.8% or $6.53 billion more than the comparative period of previous year. The main reason behind the ballooning deficit was constant double-digit growth in imports and contraction in exports. The nine-month trade gap was $2.9 billion more than the fiscal year’s annual deficit target of $20.5 billion, set by the Ministry of Finance. Exports fell 3.1% to only $15.1 billion during July-March 2016-17, which were $478 million less than the shipments made in the comparative period of last year. Imports, however, increased 18.7% to $38.5 billion in the same period. In absolute terms, the import bill was $6.6 billion higher than the previous year.
Remittances play a major role in stabilizing Pakistan’s external sector, as they make up almost half the import bill and cover the deficit in the trade of goods account. Nevertheless, in recent times, they have come under pressure due to global economic slowdown on the back of low crude oil prices. Overseas Pakistani workers sent remittances amounting to $1.69 billion in March, an increase of 19% from February when it stood at $1.42 billion. However, cumulatively, the figure fails to convey the whole picture as remittances during the first nine months (July-March) of the current fiscal year declined to $14.06 billion from $14.39 billion in the same period of previous fiscal year – a fall of 2.29%.
Analysts have warned that the country’s foreign reserves might deplete fast in the coming months unless its policymakers take serious steps in increasing exports on sustainable basis. However, the SBP is confident that the country faces no immediate threat from the slowdown in remittances and it is in a much better position to repay debts in the next four to five years.
All in all, Pakistan has entered into a new era of development whereby overseas investors have acknowledged it as land of unlimited opportunities offering investment friendly environment in diverse sectors as prided by board of Investment (BOI) achieving $ 1.3 billion foreign investment target set for first three quarters of current fiscal year. Consequently, despite constraints on country’s balance of payments position, improvements in investors’ confidence as reflected in an uptick in private sector credit, especially for fixed investment purposes; foreign interests in Pakistani companies; and increased production of consumer durables are indeed laudable. Similarly, a surge in import of machinery and raw materials also points to a robust industrial activity and buildup of future productive capacity. The fact that Pakistan is growing and enjoys the trust of the lender agencies will go on to act as a catalyst in redoubling its successes in the years to come.
The Board of Directors of the Faysal Asset Management Limited, the management company of the Faysal Asset Allocation Fund (FAAF), is pleased to present the un-audited condensed interim financial information of FAAF for the nine months and quarter ended March 31, 2017.
FINANCIAL HIGHLIGHTS
ECONOMIC REVIEW:
Pakistan's economy is out of the woods. It is now on a winning streak. Irrespective of inherent weaknesses, its private and public sectors have made great strides. Our country’s economy has strengthened following successful completion of its three-year program with International Monetary Fund (IMF) where the economy is expected to grow by 5% over the next two years because of China Pakistan Economic Corridor (CPEC) projects as infrastructure gaps may reduce through increased investment in transportation and power. This is quite a healthy trend, keeping in view the economic turmoil on an international stage since 2008. In terms of purchasing power, Pakistan's economy is ranked 24th in the world. Its 200 million population, with an enterprising youth, are the decisive factors for social mobility, growth and productivity. At the macro-economic level, Pakistan has made immense progress irrespective of bottlenecks. Inflow of capital in the last few years has helped in the development of infrastructure, especially in the sectors of health, education and civic amenities.
Average CPI-based inflation in three quarters of the current fiscal year (July-March) increased 4.01% compared to 2.64% the same period of previous year reflecting higher domestic demand and increase in global commodity prices. The large scale manufacturing (LSM) sector continues to grow at 3.5% with increase in production of cement, steel, pharmaceuticals, automobiles, paper & board and electronics.
FBR had collected PKR 2258 billion during July-March of the current fiscal year. the FBR is facing shortfall due to the pro growth incentives offered to various sectors of the economy particularly exports and agriculture; major item of revenue gap amounting to PKR 100 billion was due to not passing the full impact of the POL prices to the common man. Pakistan has also revised the budget deficit target to 4.1% of the GDP from budgetary estimates of 3.8% of the GDP due to lower tax collection and soaring expenditures.
EQUITY REVIEW
Equity Market ended the nine months period of FY17 at 48,155.93 levels remarkably returning 27.45% in 9MFY17, while KMI 30 generated a staggering return of 24%.
The month of March’17 however, persisted on dull note as the index remained almost flat compared to previous month’s closing level as PSX 100 index slipped 0.78% MoM to take CYTD return to merely 0.73%.
In the nine months of FY17 (July-March 2016-17), foreign investors have sold stocks worth $483 mn. Foreign selling was majorly absorbed by mutual funds which cumulatively bought $419 mn worth shares in those eight months.
In this depressing scenario, mutual funds have come to the rescue that have scaled up PSX by 27% in 9MFYTD (till March 31, 2017), which is reasonably healthy as index is trajecting upward with a huge arbitrage standing in view of upcoming MSCI EM inclusion due next month.
During the 3rd quarter 2017 (January 2017- March 2017) foreigners & local banks were net sellers of US$163.3mn/US$66.9mn, while local mutual funds and insurance companies were net buyers of US$111.1mn/US$35.7mn. Average volume/value surged 154%/132% partially due to low base effect of last year, as volumes were thin due to low oil prices & a global equities sell-off.
During the period ended on March 31 2017, Automobile Assemblers, Chemicals, Engineering, Oil & Gas Marketing, Paper & Board, Refinery, and Transport sectors performed better than the market while, Fertilizer, Oil & Gas Exploration, Power Generation & Distribution sectors lagged behind. Healthy earnings announcements and improving future outlook amid strong volumetric growth and robust profit margins resulted in the out-performance of the Automobile & Assembler sector. Gas distribution companies led the upside of OMC sector amid improving earnings outlook. Investors accumulated position in Paper & Board sector on the back of better than expected corporate results by a select company and improving earnings outlook considering likely imposition of anti-dumping duty on imports. We attribute the abysmal performance of the Fertilizer sector to the weak global price outlook of urea amid supply glut. Owing to un-impressive earnings announcements and lower than expected payouts the Power Generation & Distribution sector failed to draw investors’ interest. Driven by renewed fall in the global oil prices, the Oil & Gas Exploration sector depicted subdued performance.
All in all, positivity on the market direction cannot be ruled out as future events (results, upcoming upgrade, Budget) may help the market shade off its underperformance. PSX stake sale & MSCI EM-upgrade’s bullish sentiments are likely to be checked by political & regulatory uncertainty along with a prelude to MSCI flows in the form of foreign funds rebalancing new FTSE scrips between themselves overseas.
Going forward, we still see substantial upside potential for equities driven by reasonable valuations as captured in forward P/E multiples of 10.4x; benign near-term inflation and interest rates; improving macro-economic outlook; buoyant business and consumer
sentiment; and expectation of healthy foreign inflows from funds tracking MSCI EM Index. That said, we may see bouts of volatility amid domestic political liquidity and global policy uncertainty. Investors are advised to stay the course unfazed by the confusing headlines, keeping long-term objective in mind.
PSX-100 is currently trading at a PER of 9.3x (2017) against Asia Pac regional average of 12.9x while offering twice as better dividend yield of ~5.2 % versus ~2.7% offered by the region.
FUND PERFORMANCE
Faysal Asset Allocation Fund yielded an absolute return of 16.96% for the nine months period ended on March 31, 2017. At the end of 9MFY17, your fund aggregated its equity exposure to 80.84% to buffer and hedge against on-going volatility in the market. Going forward, your fund will devise its portfolio strategy whilst keeping in view the dynamics of different asset classes available.
FUND RANKING
The Pakistan Credit Agency Limited (PACRA) has assigned a "Mutual Fund Performance Ranking 2 - Star" (3 years), (Below, Average) fund ranking to FAAF.
ACKNOWLEDGEMENT
The Board of Directors of the Management Company thanks the unit holders for their confidence in the Management, the Securities and Exchange Commission of Pakistan for its valuable support, assistance and guidance. The Board also thanks the employees of the Management Company and the Trustee for their dedication and hard work.
For and on behalf of the Board
Razi ur Rahman KhanKarachi: April 28, 2017 Chief Executive Officer

Current account deficit increased to $ 5.5 billion in Jul-Feb FY17, which was largely due to a sizable increase in imports of capital goods, along with delayed receipts of Coalition Support Fund (CSF). The rise in overall import payments was mainly driven by increased purchases and higher prices of fuel. However, there was significant increase in capital goods imports, which will lead the economy to a higher growth path.
Till March 31 2017, Pakistan’s total liquid foreign exchange reserves amounted to $21.550 billion for the period ended March 31, 2017. Forex reserves held by the State Bank of Pakistan (SBP) stood at $16.466 billion, while the net foreign exchange reserves held by commercial banks equaled at $5.084 billion. However, the external front constraints pose immense risk to country’s long term sustainable growth evident from the monthly import bill that crossed $5 billion for the first time in March, which took the nine-month trade deficit to $23.4 billion – also a new record. The gap between imports and exports stood at $23.38 billion in the July-March period of current fiscal year, which was 38.8% or $6.53 billion more than the comparative period of previous year. The main reason behind the ballooning deficit was constant double-digit growth in imports and contraction in exports. The nine-month trade gap was $2.9 billion more than the fiscal year’s annual deficit target of $20.5 billion, set by the Ministry of Finance. Exports fell 3.1% to only $15.1 billion during July-March 2016-17, which were $478 million less than the shipments made in the comparative period of last year. Imports, however, increased 18.7% to $38.5 billion in the same period. In absolute terms, the import bill was $6.6 billion higher than the previous year.
Remittances play a major role in stabilizing Pakistan’s external sector, as they make up almost half the import bill and cover the deficit in the trade of goods account. Nevertheless, in recent times, they have come under pressure due to global economic slowdown on the back of low crude oil prices. Overseas Pakistani workers sent remittances amounting to $1.69 billion in March, an increase of 19% from February when it stood at $1.42 billion. However, cumulatively, the figure fails to convey the whole picture as remittances during the first nine months (July-March) of the current fiscal year declined to $14.06 billion from $14.39 billion in the same period of previous fiscal year – a fall of 2.29%.
Analysts have warned that the country’s foreign reserves might deplete fast in the coming months unless its policymakers take serious steps in increasing exports on sustainable basis. However, the SBP is confident that the country faces no immediate threat from the slowdown in remittances and it is in a much better position to repay debts in the next four to five years.
All in all, Pakistan has entered into a new era of development whereby overseas investors have acknowledged it as land of unlimited opportunities offering investment friendly environment in diverse sectors as prided by board of Investment (BOI) achieving $ 1.3 billion foreign investment target set for first three quarters of current fiscal year. Consequently, despite constraints on country’s balance of payments position, improvements in investors’ confidence as reflected in an uptick in private sector credit, especially for fixed investment purposes; foreign interests in Pakistani companies; and increased production of consumer durables are indeed laudable. Similarly, a surge in import of machinery and raw materials also points to a robust industrial activity and buildup of future productive capacity. The fact that Pakistan is growing and enjoys the trust of the lender agencies will go on to act as a catalyst in redoubling its successes in the years to come.
The Board of Directors of the Faysal Asset Management Limited, the management company of the Faysal Asset Allocation Fund (FAAF), is pleased to present the un-audited condensed interim financial information of FAAF for the nine months and quarter ended March 31, 2017.
FINANCIAL HIGHLIGHTS
ECONOMIC REVIEW:
Pakistan's economy is out of the woods. It is now on a winning streak. Irrespective of inherent weaknesses, its private and public sectors have made great strides. Our country’s economy has strengthened following successful completion of its three-year program with International Monetary Fund (IMF) where the economy is expected to grow by 5% over the next two years because of China Pakistan Economic Corridor (CPEC) projects as infrastructure gaps may reduce through increased investment in transportation and power. This is quite a healthy trend, keeping in view the economic turmoil on an international stage since 2008. In terms of purchasing power, Pakistan's economy is ranked 24th in the world. Its 200 million population, with an enterprising youth, are the decisive factors for social mobility, growth and productivity. At the macro-economic level, Pakistan has made immense progress irrespective of bottlenecks. Inflow of capital in the last few years has helped in the development of infrastructure, especially in the sectors of health, education and civic amenities.
Average CPI-based inflation in three quarters of the current fiscal year (July-March) increased 4.01% compared to 2.64% the same period of previous year reflecting higher domestic demand and increase in global commodity prices. The large scale manufacturing (LSM) sector continues to grow at 3.5% with increase in production of cement, steel, pharmaceuticals, automobiles, paper & board and electronics.
FBR had collected PKR 2258 billion during July-March of the current fiscal year. the FBR is facing shortfall due to the pro growth incentives offered to various sectors of the economy particularly exports and agriculture; major item of revenue gap amounting to PKR 100 billion was due to not passing the full impact of the POL prices to the common man. Pakistan has also revised the budget deficit target to 4.1% of the GDP from budgetary estimates of 3.8% of the GDP due to lower tax collection and soaring expenditures.
8
EQUITY REVIEW
Equity Market ended the nine months period of FY17 at 48,155.93 levels remarkably returning 27.45% in 9MFY17, while KMI 30 generated a staggering return of 24%.
The month of March’17 however, persisted on dull note as the index remained almost flat compared to previous month’s closing level as PSX 100 index slipped 0.78% MoM to take CYTD return to merely 0.73%.
In the nine months of FY17 (July-March 2016-17), foreign investors have sold stocks worth $483 mn. Foreign selling was majorly absorbed by mutual funds which cumulatively bought $419 mn worth shares in those eight months.
In this depressing scenario, mutual funds have come to the rescue that have scaled up PSX by 27% in 9MFYTD (till March 31, 2017), which is reasonably healthy as index is trajecting upward with a huge arbitrage standing in view of upcoming MSCI EM inclusion due next month.
During the 3rd quarter 2017 (January 2017- March 2017) foreigners & local banks were net sellers of US$163.3mn/US$66.9mn, while local mutual funds and insurance companies were net buyers of US$111.1mn/US$35.7mn. Average volume/value surged 154%/132% partially due to low base effect of last year, as volumes were thin due to low oil prices & a global equities sell-off.
During the period ended on March 31 2017, Automobile Assemblers, Chemicals, Engineering, Oil & Gas Marketing, Paper & Board, Refinery, and Transport sectors performed better than the market while, Fertilizer, Oil & Gas Exploration, Power Generation & Distribution sectors lagged behind. Healthy earnings announcements and improving future outlook amid strong volumetric growth and robust profit margins resulted in the out-performance of the Automobile & Assembler sector. Gas distribution companies led the upside of OMC sector amid improving earnings outlook. Investors accumulated position in Paper & Board sector on the back of better than expected corporate results by a select company and improving earnings outlook considering likely imposition of anti-dumping duty on imports. We attribute the abysmal performance of the Fertilizer sector to the weak global price outlook of urea amid supply glut. Owing to un-impressive earnings announcements and lower than expected payouts the Power Generation & Distribution sector failed to draw investors’ interest. Driven by renewed fall in the global oil prices, the Oil & Gas Exploration sector depicted subdued performance.
All in all, positivity on the market direction cannot be ruled out as future events (results, upcoming upgrade, Budget) may help the market shade off its underperformance. PSX stake sale & MSCI EM-upgrade’s bullish sentiments are likely to be checked by political & regulatory uncertainty along with a prelude to MSCI flows in the form of foreign funds rebalancing new FTSE scrips between themselves overseas.
Going forward, we still see substantial upside potential for equities driven by reasonable valuations as captured in forward P/E multiples of 10.4x; benign near-term inflation and interest rates; improving macro-economic outlook; buoyant business and consumer
sentiment; and expectation of healthy foreign inflows from funds tracking MSCI EM Index. That said, we may see bouts of volatility amid domestic political liquidity and global policy uncertainty. Investors are advised to stay the course unfazed by the confusing headlines, keeping long-term objective in mind.
PSX-100 is currently trading at a PER of 9.3x (2017) against Asia Pac regional average of 12.9x while offering twice as better dividend yield of ~5.2 % versus ~2.7% offered by the region.
FUND PERFORMANCE
Faysal Asset Allocation Fund yielded an absolute return of 16.96% for the nine months period ended on March 31, 2017. At the end of 9MFY17, your fund aggregated its equity exposure to 80.84% to buffer and hedge against on-going volatility in the market. Going forward, your fund will devise its portfolio strategy whilst keeping in view the dynamics of different asset classes available.
FUND RANKING
The Pakistan Credit Agency Limited (PACRA) has assigned a "Mutual Fund Performance Ranking 2 - Star" (3 years), (Below, Average) fund ranking to FAAF.
ACKNOWLEDGEMENT
The Board of Directors of the Management Company thanks the unit holders for their confidence in the Management, the Securities and Exchange Commission of Pakistan for its valuable support, assistance and guidance. The Board also thanks the employees of the Management Company and the Trustee for their dedication and hard work.
For and on behalf of the Board
Razi ur Rahman KhanKarachi: April 28, 2017 Chief Executive Officer
Current account deficit increased to $ 5.5 billion in Jul-Feb FY17, which was largely due to a sizable increase in imports of capital goods, along with delayed receipts of Coalition Support Fund (CSF). The rise in overall import payments was mainly driven by increased purchases and higher prices of fuel. However, there was significant increase in capital goods imports, which will lead the economy to a higher growth path.
Till March 31 2017, Pakistan’s total liquid foreign exchange reserves amounted to $21.550 billion for the period ended March 31, 2017. Forex reserves held by the State Bank of Pakistan (SBP) stood at $16.466 billion, while the net foreign exchange reserves held by commercial banks equaled at $5.084 billion. However, the external front constraints pose immense risk to country’s long term sustainable growth evident from the monthly import bill that crossed $5 billion for the first time in March, which took the nine-month trade deficit to $23.4 billion – also a new record. The gap between imports and exports stood at $23.38 billion in the July-March period of current fiscal year, which was 38.8% or $6.53 billion more than the comparative period of previous year. The main reason behind the ballooning deficit was constant double-digit growth in imports and contraction in exports. The nine-month trade gap was $2.9 billion more than the fiscal year’s annual deficit target of $20.5 billion, set by the Ministry of Finance. Exports fell 3.1% to only $15.1 billion during July-March 2016-17, which were $478 million less than the shipments made in the comparative period of last year. Imports, however, increased 18.7% to $38.5 billion in the same period. In absolute terms, the import bill was $6.6 billion higher than the previous year.
Remittances play a major role in stabilizing Pakistan’s external sector, as they make up almost half the import bill and cover the deficit in the trade of goods account. Nevertheless, in recent times, they have come under pressure due to global economic slowdown on the back of low crude oil prices. Overseas Pakistani workers sent remittances amounting to $1.69 billion in March, an increase of 19% from February when it stood at $1.42 billion. However, cumulatively, the figure fails to convey the whole picture as remittances during the first nine months (July-March) of the current fiscal year declined to $14.06 billion from $14.39 billion in the same period of previous fiscal year – a fall of 2.29%.
Analysts have warned that the country’s foreign reserves might deplete fast in the coming months unless its policymakers take serious steps in increasing exports on sustainable basis. However, the SBP is confident that the country faces no immediate threat from the slowdown in remittances and it is in a much better position to repay debts in the next four to five years.
All in all, Pakistan has entered into a new era of development whereby overseas investors have acknowledged it as land of unlimited opportunities offering investment friendly environment in diverse sectors as prided by board of Investment (BOI) achieving $ 1.3 billion foreign investment target set for first three quarters of current fiscal year. Consequently, despite constraints on country’s balance of payments position, improvements in investors’ confidence as reflected in an uptick in private sector credit, especially for fixed investment purposes; foreign interests in Pakistani companies; and increased production of consumer durables are indeed laudable. Similarly, a surge in import of machinery and raw materials also points to a robust industrial activity and buildup of future productive capacity. The fact that Pakistan is growing and enjoys the trust of the lender agencies will go on to act as a catalyst in redoubling its successes in the years to come.
The Board of Directors of the Faysal Asset Management Limited, the management company of the Faysal Asset Allocation Fund (FAAF), is pleased to present the un-audited condensed interim financial information of FAAF for the nine months and quarter ended March 31, 2017.
FINANCIAL HIGHLIGHTS
ECONOMIC REVIEW:
Pakistan's economy is out of the woods. It is now on a winning streak. Irrespective of inherent weaknesses, its private and public sectors have made great strides. Our country’s economy has strengthened following successful completion of its three-year program with International Monetary Fund (IMF) where the economy is expected to grow by 5% over the next two years because of China Pakistan Economic Corridor (CPEC) projects as infrastructure gaps may reduce through increased investment in transportation and power. This is quite a healthy trend, keeping in view the economic turmoil on an international stage since 2008. In terms of purchasing power, Pakistan's economy is ranked 24th in the world. Its 200 million population, with an enterprising youth, are the decisive factors for social mobility, growth and productivity. At the macro-economic level, Pakistan has made immense progress irrespective of bottlenecks. Inflow of capital in the last few years has helped in the development of infrastructure, especially in the sectors of health, education and civic amenities.
Average CPI-based inflation in three quarters of the current fiscal year (July-March) increased 4.01% compared to 2.64% the same period of previous year reflecting higher domestic demand and increase in global commodity prices. The large scale manufacturing (LSM) sector continues to grow at 3.5% with increase in production of cement, steel, pharmaceuticals, automobiles, paper & board and electronics.
FBR had collected PKR 2258 billion during July-March of the current fiscal year. the FBR is facing shortfall due to the pro growth incentives offered to various sectors of the economy particularly exports and agriculture; major item of revenue gap amounting to PKR 100 billion was due to not passing the full impact of the POL prices to the common man. Pakistan has also revised the budget deficit target to 4.1% of the GDP from budgetary estimates of 3.8% of the GDP due to lower tax collection and soaring expenditures.
EQUITY REVIEW
Equity Market ended the nine months period of FY17 at 48,155.93 levels remarkably returning 27.45% in 9MFY17, while KMI 30 generated a staggering return of 24%.
The month of March’17 however, persisted on dull note as the index remained almost flat compared to previous month’s closing level as PSX 100 index slipped 0.78% MoM to take CYTD return to merely 0.73%.
In the nine months of FY17 (July-March 2016-17), foreign investors have sold stocks worth $483 mn. Foreign selling was majorly absorbed by mutual funds which cumulatively bought $419 mn worth shares in those eight months.
In this depressing scenario, mutual funds have come to the rescue that have scaled up PSX by 27% in 9MFYTD (till March 31, 2017), which is reasonably healthy as index is trajecting upward with a huge arbitrage standing in view of upcoming MSCI EM inclusion due next month.
During the 3rd quarter 2017 (January 2017- March 2017) foreigners & local banks were net sellers of US$163.3mn/US$66.9mn, while local mutual funds and insurance companies were net buyers of US$111.1mn/US$35.7mn. Average volume/value surged 154%/132% partially due to low base effect of last year, as volumes were thin due to low oil prices & a global equities sell-off.
During the period ended on March 31 2017, Automobile Assemblers, Chemicals, Engineering, Oil & Gas Marketing, Paper & Board, Refinery, and Transport sectors performed better than the market while, Fertilizer, Oil & Gas Exploration, Power Generation & Distribution sectors lagged behind. Healthy earnings announcements and improving future outlook amid strong volumetric growth and robust profit margins resulted in the out-performance of the Automobile & Assembler sector. Gas distribution companies led the upside of OMC sector amid improving earnings outlook. Investors accumulated position in Paper & Board sector on the back of better than expected corporate results by a select company and improving earnings outlook considering likely imposition of anti-dumping duty on imports. We attribute the abysmal performance of the Fertilizer sector to the weak global price outlook of urea amid supply glut. Owing to un-impressive earnings announcements and lower than expected payouts the Power Generation & Distribution sector failed to draw investors’ interest. Driven by renewed fall in the global oil prices, the Oil & Gas Exploration sector depicted subdued performance.
All in all, positivity on the market direction cannot be ruled out as future events (results, upcoming upgrade, Budget) may help the market shade off its underperformance. PSX stake sale & MSCI EM-upgrade’s bullish sentiments are likely to be checked by political & regulatory uncertainty along with a prelude to MSCI flows in the form of foreign funds rebalancing new FTSE scrips between themselves overseas.
Going forward, we still see substantial upside potential for equities driven by reasonable valuations as captured in forward P/E multiples of 10.4x; benign near-term inflation and interest rates; improving macro-economic outlook; buoyant business and consumer
9
sentiment; and expectation of healthy foreign inflows from funds tracking MSCI EM Index. That said, we may see bouts of volatility amid domestic political liquidity and global policy uncertainty. Investors are advised to stay the course unfazed by the confusing headlines, keeping long-term objective in mind.
PSX-100 is currently trading at a PER of 9.3x (2017) against Asia Pac regional average of 12.9x while offering twice as better dividend yield of ~5.2 % versus ~2.7% offered by the region.
FUND PERFORMANCE
Faysal Asset Allocation Fund yielded an absolute return of 16.96% for the nine months period ended on March 31, 2017. At the end of 9MFY17, your fund aggregated its equity exposure to 80.84% to buffer and hedge against on-going volatility in the market. Going forward, your fund will devise its portfolio strategy whilst keeping in view the dynamics of different asset classes available.
FUND RANKING
The Pakistan Credit Agency Limited (PACRA) has assigned a "Mutual Fund Performance Ranking 2 - Star" (3 years), (Below, Average) fund ranking to FAAF.
ACKNOWLEDGEMENT
The Board of Directors of the Management Company thanks the unit holders for their confidence in the Management, the Securities and Exchange Commission of Pakistan for its valuable support, assistance and guidance. The Board also thanks the employees of the Management Company and the Trustee for their dedication and hard work.
For and on behalf of the Board
Razi ur Rahman KhanKarachi: April 28, 2017 Chief Executive Officer

10
Condensed Interim Statement of Assets and LiabilitiesAs at March 31, 2017
(Un- Audited) (Audited)March 31, June 30,
2017 2016Note
Assets
Bank balances 4 27,747,461 347,436,656 Investments 5 155,098,908 488,081,582 Prepayments, deposits and other receivables 4,462,318 16,312,114 Receivable against sale of investments 4,605,226 - Total assets 191,913,913 851,830,352
Liabilities
Payable to the Management Company 581,270 912,126 Remuneration payable to the Trustee 67,181 148,215 Payable against redemption of units - 59,840,000 Accrued and other liabilities 6 6,856,116 11,910,259 Payable against purchase of investments 2,457,025 40,220,505 Total liabilities 9,961,592 113,031,105
Net assets 181,952,321 738,799,247
Unit holders’ fund (as per the statement attached) 181,952,321 738,799,247
Contingencies and Commitments 7
Number of units in issue 2,259,527 10,731,241
Net asset value per unit 80.53 68.85
The annexed notes from 1 to 15 form an integral part of this condensed interim financial information.
For Faysal Asset Management Limited(Management Company)
FAYSAL ASSET ALLOCATION FUNDCONDENSED INTERIM STATEMENT OF ASSETS AND LIABILITIES
AS AT MARCH 31, 2017
-------------- (Rupees) --------------
--------- (Number of units) ---------
-------------- (Rupees) --------------
____________________ ___________________ ___________________Chief Executive Officer Director Director

11
Condensed Interim Income StatementFOR THE NINE MONTHS AND QUARTER ENDED MARCH 31, 2017 (Un-Audited)
March 31, March 31, March 31, March 31,2017 2016 2017 2016
NoteIncome
Income from Margin Trading System (MTS) - 1,502,390 - - Dividend income on investment classified
as at fair value through profit or loss' - held-for-trading 3,645,050 4,884,000 2,129,050 1,432,891 Income from participation in purchase of shares - 2,000,000 - 2,000,000 Return on bank balances 3,345,206 5,641,516 1,631,597 4,028,463 Net gain / (loss) on investments classified as 'at fair value
- Net capital gain / (loss) on sale of investments 61,219,428 (12,854,821) 27,089,077 4,891,399 - Net unrealised (loss) / gain on revaluation of investments (53,131) (37,393,153) 9,543,501 27,108,003
61,166,297 (50,247,974) 36,632,578 31,999,402
Total income / (loss) 68,156,553 (36,220,068) 40,393,225 39,460,756
Expenses
Remuneration of the Management Company 4,612,691 9,597,544 1,976,238 3,162,456 Reimbursement of expenses to Management Company 215,672 - 83,849 - Provision for individual taxes & duties 6.2 - 1,750,590 - 578,903 Sales tax on management fee 599,650 1,343,657 256,911 442,743 Remuneration of the Trustee 621,800 959,816 353,876 316,265 Sales tax on Trustee fee 80,833 134,374 46,004 43,686 Brokerage charges 2,187,289 2,947,864 789,033 429,648 Bank charges 56,605 63,938 39,362 20,350 Auditors' remuneration 444,016 480,455 320,950 218,794 SECP non refundable annual fee 219,459 454,465 94,226 148,974 Fees and subscriptions 127,135 117,214 84,034 41,825 Settlement charges, federal excise duty and capital value tax 1,083,845 1,353,960 496,641 410,855 Printing and other expenses 164,907 147,532 115,483 29,417 Reversal against provision of Worker's Welfare Fund 6.1 (3,314,208) - (3,314,208) 29,417 Provision for Sindh Workers' Welfare Fund 6.1 539,399 - 539,399 -
Total expenses 7,639,093 19,351,409 1,881,798 5,873,333
Net income / (loss) from operating activities 60,517,460 (55,571,477) 38,511,427 33,587,423
Element of (loss) / income and capital gains / (losses) includedin prices of units sold less those in units redeemed - net (34,086,880) 1,199,332 (7,511,747) 3,064,747
Net income / (loss) for the period before taxation 26,430,580 (54,372,145) 30,999,680 36,652,170
Taxation 8 - - - -
Net income / (loss) for the period after taxation 26,430,580 (54,372,145) 30,999,680 36,652,170
Other comprehensive income for the period - - - -
Total comprehensive income / (loss) for the period 26,430,580 (54,372,145) 30,999,680 36,652,170
Earnings per unit 9
The annexed notes from 1 to 15 form an integral part of this condensed interim financial information.
through profit or loss'-held for trading:
For Faysal Asset Management Limited(Management Company)
FAYSAL ASSET ALLOCATION FUNDCONDENSED INTERIM INCOME STATEMENT
FOR THE NINE MONTHS AND QUARTER ENDED MARCH 31, 2017 (Un-Audited)
Nine months ended Quarter ended
------------ (Rupees) ------------ ------------ (Rupees) ------------
____________________ ___________________ ___________________Chief Executive Officer Director Director

12
Condensed Interim Distribution StatementFOR THE NINE MONTHS AND QUARTER ENDED MARCH 31, 2017 (Un-Audited)
March 31, March 31,2017 2016
Accumulated loss brought forward [includes unrealised loss on investments of Rs. 50,300,274(2015: unrealised gain of Rs. 7,411,743)] (178,167,320) (159,427,430)
Net income / (loss) for the period after taxation 26,430,580 (54,372,145)
Accumulated loss carried forward (151,736,740) (213,799,575) [includes unrealised loss on investments of Rs. 743,448(2016 : unrealised loss of Rs 31,057,027)]
The annexed notes from 1 to 15 form an integral part of this condensed interim financial information.
(Management Company)
FAYSAL ASSET ALLOCATION FUNDCONDENSED INTERIM DISTRIBUTION STATEMENT
FOR THE NINE MONTHS AND QUARTER ENDED MARCH 31, 2017 (Un-Audited)
Nine months ended
-------------- (Rupees) --------------
For Faysal Asset Management Limited
____________________ ___________________ ___________________Chief Executive Officer Director Director

13
Condensed Interim Cash Flow StatementFOR THE NINE MONTHS AND QUARTER ENDED MARCH 31, 2017 (Un-Audited)
March 31, March 31,2017 2016
NoteCASH FLOWS FROM OPERATING ACTIVITIESNet income / (loss) for the period before taxation 26,430,580 (54,372,145)
Adjustments for non-cash and other items:Income on Margin Trading System (MTS) - (1,502,390) Dividend income on investment classified as
'at fair value through profit or loss' - held-for-trading (3,645,050) (4,884,000) Return on bank balances (3,345,206) (5,641,516) Net (gain) / loss on investments classified as
'at fair value through profit or loss'-held for trading:- Net capital (gain) / loss on sale of investments (61,219,428) 12,854,821 - Net unrealised loss on revaluation of investments 53,131 37,393,153
Element of loss / (income) and capital losses / (gains) included in prices of units sold less those in units redeemed - net 34,086,880 (1,199,332)
(7,639,093) (17,351,409) Increase / (decrease) in assetsPrepayments, deposits and other receivables 10,515,627 (502,109)
(Decrease) /increase in liabilitiesPayable to the Management Company (330,856) 511,012 Remuneration payable to the Trustee (81,034) 62,191 Contingencies and Commitments (59,840,000) - Accrued and other liabilities (5,054,143) (527,896)
(65,306,033) 45,307 (62,429,499) (17,808,211)
Proceeds from sale of investments 1,624,270,538 1,448,616,576 Proceeds from redemption of preference shares - 3,771,510 Payments made against purchase of investments (1,272,490,273) (1,768,128,781) Receipts against Margin Trading System (MTS) - 76,585,764 Income received on Margin Trading System (MTS) - 1,569,042 Markup received on preference shares - 97,441 Dividend received 4,014,000 4,097,735 Return received on bank balances 4,310,425 5,664,063 Net cash generated from / (used in) operating activities 297,675,191 (245,534,861)
CASH FLOWS FROM FINANCING ACTIVITIESAmounts received against issue of units 677,022,289 771,488,335 Payments made against redemption of units (1,294,386,675) (584,664,647) Net cash (used in) / generated from financing activities (617,364,386) 186,823,688
Net decrease in cash and cash equivalents during the period (319,689,195) (58,711,173) Cash and cash equivalents at the beginning of the period 347,436,656 207,426,860
Cash and cash equivalents at the end of the period 4 27,747,461 148,715,687
The annexed notes from 1 to 15 form an integral part of this condensed interim financial information.
For Faysal Asset Management Limited(Management Company)
FAYSAL ASSET ALLOCATION FUNDCONDENSED INTERIM CASH FLOW STATEMENT
FOR THE NINE MONTHS AND QUARTER ENDED MARCH 31, 2017 (Un-Audited)
Nine months ended
-------------- (Rupees) --------------
____________________ ___________________ ___________________Chief Executive Officer Director Director

14
Condensed Interim Statement of Movement in Unit Holders’ Fund FOR THE NINE MONTHS AND QUARTER ENDED MARCH 31, 2017 (Un-Audited)
March 31, March 31,2017 2016
Net asset value per unit at the beginning of the period 68.85 70.59
Net asset value per unit at the end of the period 80.53 65.63
Net assets at the beginning of the period 738,799,247 587,687,268
Amounts received on issue of units * 677,022,289 771,488,335
Amounts paid on redemption of units ** (1,294,386,675) (584,664,647)
(617,364,386) 186,823,688 Element of loss / (income) and capital losses / (gains) included
in prices of units sold less those in units redeemed - net 34,086,880 (1,199,332)
Net capital gain / (loss) on sale of investments 61,219,428 (12,854,821)Net unrealised lesson revaluation (53,131) (37,393,153) Other net loss for the period (34,735,717) (4,124,171) Total comprehensive income / (loss) for the period 26,430,580 (54,372,145)
Net assets at the end of the period 181,952,321 718,939,479
* Number of units issued (including Nil bonus units issued during the periods ended March 31, 2017 and March 31, 2016) 9,228,000 11,258,033
** Number of units redeemed 17,699,714 8,628,259
The annexed notes from 1 to 15 form an integral part of this condensed interim financial information.
For Faysal Asset Management Limited(Management Company)
FAYSAL ASSET ALLOCATION FUNDCONDENSED INTERIM STATEMENT OF MOVEMENT IN UNIT HOLDERS' FUNDFOR THE NINE MONTHS AND QUARTER ENDED MARCH 31, 2017 (Un-Audited)
Nine months ended
--------- (Rupees) ----------
-------- (Number of units) --------
____________________ ___________________ ___________________Chief Executive Officer Director Director

15
Notes to the Condensed Interim Financial Information FOR THE NINE MONTHS AND QUARTER ENDED MARCH 31, 2017 (Un-Audited)
1. LEGAL STATUS AND NATURE OF BUSINESS
The policy of the Fund is to invest in a mix of equity securities, fixed income and money market instruments.
2. BASIS OF PREPARATION
The disclosures made in this interim financial information have, however, been limited based on the requirements of the International Accounting Standard 34 - Interim Financial Reporting.
The condensed interim financial information is presented in Pakistani Rupees which is the Fund's functional andpresentation currency.
The Pakistan Credit Rating Agency Limited (PACRA) has assigned a "long term rating 2-Stars" to Faysal AssetAllocation Fund as of December 07, 2016.
JCR - VIS has awarded an "AM3++" asset manager rating to the Management Company as of May 04, 2016.
This condensed interim financial information has been prepared in accordance with the requirements of InternationalAccounting Standard 34: ‘Interim Financial Reporting’, the Trust Deed, the NBFC Rules, Non-Banking FinanceCompanies and Notified Entities Regulations, 2008 (NBFC Regulations) and directives issued by SECP. In case where the requirements differ, the requirements of the Trust Deed, the NBFC Rules, the NBFC Regulations or the directivesissued by the SECP shall prevail.
This condensed interim financial information does not include all the information and disclosures required in the annualfinancial statements, and should be read in conjunction with the annual financial statements of the Fund for the yearended June 30, 2016.
The Fund is categorised as an "Asset Allocation Scheme" as per the circular 07 of 2009 issued by SECP.
FAYSAL ASSET ALLOCATION FUNDNOTES TO THE CONDENSED INTERIM FINANCIAL INFORMATIONFOR THE NINE MONTHS AND QUARTER ENDED MARCH 31, 2017 (Un-Audited)
Faysal Asset Allocation Fund (the Fund) has been established under the Non-Banking Finance Companies(Establishment and Regulation) Rules, 2003 (the NBFC Rules) and has been authorised as a unit trust scheme by theSecurities and Exchange Commission of Pakistan (SECP) on September 21, 2005. It has been constituted under aTrust Deed, dated January 31, 2006, between AMZ Asset Management Limited (former Management Company) andCentral Depository Company of Pakistan Limited (CDC) as the Trustee till February 24, 2010 and thereafter betweenFaysal Asset Management Limited (the Management Company), a company incorporated under the CompaniesOrdinance, 1984 and CDC as the Trustee, also a company incorporated under the Companies Ordinance, 1984.
The Fund is an open-end asset allocation fund and is listed on the Pakistan Stock Exchange Limited (formerly LahoreStock Exchange Limited). Units are offered for public subscription on a continuous basis and the units are transferableand can be redeemed by surrendering them to the Fund.
Notes to the Condensed Interim Financial Information FOR THE NINE MONTHS AND QUARTER ENDED MARCH 31, 2017 (Un-Audited)
3. ACCOUNTING POLICIES,ESTIMATES AND RISK MANAGEMENT PRINCIPLES
3.1 New / Revised Standards, Interpretations and Amendments
IFRS 11 - Joint Arrangements (Revised 2011)-Investments in Associates and Joint VenturesIFRS 12 - Disclosure of Interests in Other EntitiesIAS 1 - Presentation of Financial Statements - Disclosure Initiative (Amendment)IAS 28 - Investment in Associates
3.2
(Un-Audited) (Audited)March 31, June 30,
2017 2016
Note
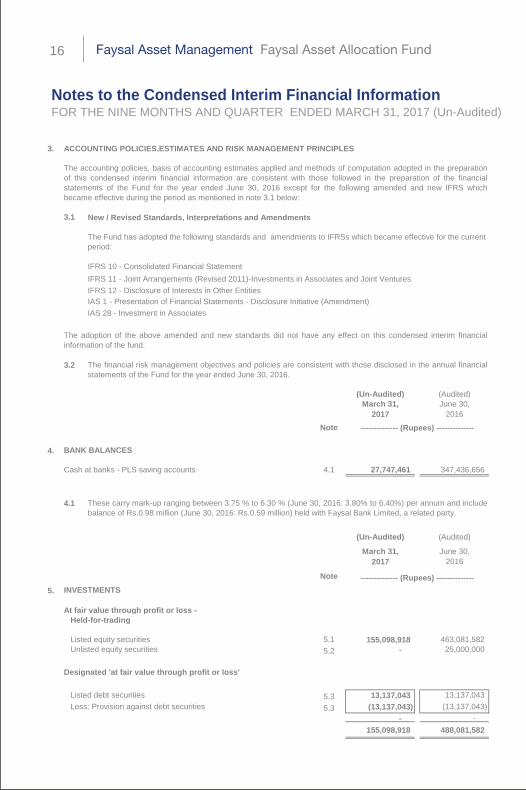
4. BANK BALANCES
Cash at banks - PLS saving accounts 4.1 27,747,461 347,436,656
4.1
(Un-Audited) (Audited)
March 31, June 30,2017 2016
Note
5. INVESTMENTS
At fair value through profit or loss -Held-for-trading
Listed equity securities 5.1 155,098,918 463,081,582 Unlisted equity securities 5.2 - 25,000,000
Designated 'at fair value through profit or loss'
Listed debt securities 5.3 13,137,043 13,137,043 Less: Provision against debt securities 5.3 (13,137,043) (13,137,043)
- - 155,098,918 488,081,582
The accounting policies, basis of accounting estimates applied and methods of computation adopted in the preparationof this condensed interim financial information are consistent with those followed in the preparation of the financialstatements of the Fund for the year ended June 30, 2016 except for the following amended and new IFRS whichbecame effective during the period as mentioned in note 3.1 below:
These carry mark-up ranging between 3.75 % to 6.30 % (June 30, 2016: 3.80% to 6.40%) per annum and includebalance of Rs.0.98 million (June 30, 2016: Rs.0.59 million) held with Faysal Bank Limited, a related party.
-------------- (Rupees) --------------
The Fund has adopted the following standards and amendments to IFRSs which became effective for the current period:
IFRS 10 - Consolidated Financial Statement
The adoption of the above amended and new standards did not have any effect on this condensed interim financialinformation of the fund.
The financial risk management objectives and policies are consistent with those disclosed in the annual financialstatements of the Fund for the year ended June 30, 2016.
-------------- (Rupees) --------------
16

17
Notes to the Condensed Interim Financial Information FOR THE NINE MONTHS AND QUARTER ENDED MARCH 31, 2017 (Un-Audited)
5.1
List
ed e
quity
sec
uriti
es -
held
for t
radi
ng
As
at J
uly
01, 2
016
Pur
chas
ed
durin
g th
e pe
riod
Tra
nsfe
rred
fr
om
unlis
ted
secu
ritie
s
Bon
us /
right
sh
ares
re
ceiv
ed
durin
g th
e pe
riod
Dis
pose
d of
f dur
ing
the
perio
d
As
at
Mar
ch 3
1,
2017
Car
ryin
g Va
lue
as a
t M
arch
31,
201
7
Mar
ket V
alue
as
at M
arch
31,
20
17
Net
ass
ets
Tota
l in
vest
men
ts
Inve
stee
co
mpa
ny
paid
-up
capi
tal
* O
rdin
ary
shar
es h
avin
g a
face
val
ue o
f Rs.
10 e
ach
unle
ss s
tate
d ot
herw
ise.
OIL
& G
AS E
XPLO
RAT
ION
CO
MPA
NIE
SO
il an
d G
as D
evel
opm
ent C
ompa
ny L
imite
d-
84
7,40
0
-
847,
400
-
-
-
-
-
-
P
akis
tan
Oilf
ield
s Li
mite
d50
,000
20
,000
-
69,5
00
50
0
264,
438
222,
525
0.15
%0.
14%
-
M
ari P
etro
leum
Com
pany
Lim
ited
6,20
0
57
,770
-
60,9
70
3,
000
4,08
4,00
2
4,56
1,41
0
3.14
%2.
94%
-
4,
348,
439
4,
783,
935
3.
29%
3.08
%0.
00%
OIL
AN
D G
AS M
ARK
ETIN
G C
OM
PAN
IES
Pak
ista
n S
tate
Oil
Com
pany
Lim
ited
22,4
00
75,0
00
-
97
,400
-
-
-
-
-
-
H
asco
l Pet
role
um L
imite
d5.
1.1
-
70,0
00
-
50
,000
20,0
00
6,98
2,30
4
5,99
8,00
0
4.13
%3.
87%
0.02
%A
ttock
Pet
role
um L
imite
d-
10
,000
-
10,0
00
-
-
-
-
-
-
Atto
ck R
efin
ery
Lim
ited
-
5,00
0
-
-
5,
000
2,30
5,00
0
2,24
4,05
0
1.55
%1.
45%
0.01
%N
atio
nal R
efin
ery
Lim
ited
-
1,35
0
-
-
1,
350
985,
082
962,
485
0.66
%0.
62%
-
10
,272
,386
9,20
4,53
5
6.34
%5.
94%
0.03
%R
EFIN
ERY
Pak
ista
n R
efin
ery
Lim
ited
250,
000
1,
200,
000
-
1,45
0,00
0
-
-
-
-
-
-
-
-
PO
WER
GEN
ERAT
ION
AN
D D
ISTR
IBU
TIO
NK
-Ele
ctric
Lim
ited
-
800,
000
-
50
0,00
0
30
0,00
0
2,
450,
000
2,
454,
000
1.
69%
1.58
%0.
03%
Kot
Add
u P
ower
Com
pany
Ltd
-
100,
000
-
15
,000
85,0
00
7,01
2,24
9
6,81
7,85
0
4.70
%4.
40%
0.01
%N
isha
t Pow
er L
imite
d-
35
,000
-
-
35
,000
2,
244,
990
1,
786,
750
1.
23%
1.15
%0.
01%
Hub
Pow
er C
ompa
ny L
td-
60
,000
-
10,0
00
50
,000
6,
726,
090
6,
553,
000
4.
52%
4.23
%-
18,4
33,3
29
17
,611
,600
12
.14%
11.3
6%0.
05%
CO
MM
ERC
IAL
BAN
KS
Hab
ib B
ank
Lim
ited
25,0
00
95,6
00
-
11
4,60
0
6,
000
1,68
7,44
0
1,61
7,66
0
1.11
%1.
04%
-
M
CB
Ban
k Li
mite
d-
58
,600
-
58,6
00
-
-
-
-
-
-
Uni
ted
Ban
k Li
mite
d50
,000
82
,900
-
122,
900
10,0
00
2,42
4,09
6
2,27
6,30
0
1.57
%1.
47%
-
N
atio
nal B
ank
of P
akis
tan
-
50,0
00
-
50
,000
-
-
-
-
-
-
B
ank
Alfa
lah
Lim
ited
-
100,
000
-
50
,000
50,0
00
1,87
5,50
0
1,80
7,00
0
1.25
%1.
17%
-
S
umm
it B
ank
Lim
ited
-
425,
000
-
-
425,
000
1,79
2,40
0
1,84
0,25
0
1.27
%1.
19%
0.02
%7,
779,
436
7,
541,
210
5.
20%
4.87
%0.
02%
FER
TILI
ZER
Fauj
i Fer
tiliz
er B
in Q
asim
Lim
ited
130,
500
10
0,00
0
-
230,
500
-
-
-
-
-
-
E
ngro
Cor
pora
tion
Lim
ited
25,0
00
196,
000
-
20
1,00
0
20
,000
7,
389,
921
7,
360,
400
5.
07%
4.75
%-
Eng
ro F
ertil
izer
s Li
mit e
d5.
1.1
-
1,10
5,00
0
-
1,
016,
500
88
,500
6,
160,
158
5,
545,
410
3.
82%
3.58
%0.
01%
Fauj
i Fer
tiliz
er C
ompa
ny L
imite
d-
65
,000
-
65,0
00
-
-
-
-
-
-
Daw
ood
Her
cule
s C
orpo
ratio
n Li
mite
d-
16
0,00
0
-
160,
000
-
-
-
-
-
-
E
ngro
Pol
ymer
& C
hem
ical
s Lt
d-
15
0,00
0
-
50,0
00
10
0,00
0
2,
517,
390
2,
528,
000
1.
74%
1.63
%0.
02%
16,0
67,4
68
15
,433
,810
10
.63%
9.96
%0.
03%
-----
Inve
stm
ent a
s %
of -
----
Nam
e of
the
Inve
stee
Com
pany
Not
e
------
------
------
------
---- N
umbe
r of s
hare
s ---
------
------
------
------
-- --
------
-- R
upee
s ---
------
-

Notes to the Condensed Interim Financial Information FOR THE NINE MONTHS AND QUARTER ENDED MARCH 31, 2017 (Un-Audited)
18
As
at J
uly
01, 2
016
Pur
chas
ed
durin
g th
e pe
riod
Tra
nsfe
rred
fr
om
unlis
ted
secu
ritie
s
Bon
us /
right
sh
ares
re
ceiv
ed
durin
g th
e pe
riod
Dis
pose
d of
f dur
ing
the
perio
d
As
at
Mar
ch 3
1,
2017
Car
ryin
g Va
lue
as a
t M
arch
31,
201
7
Mar
ket V
alue
as
at M
arch
31,
20
17
Net
ass
ets
Tota
l in
vest
men
ts
Inve
stee
co
mpa
ny
paid
-up
capi
tal
-----
Inve
stm
ent a
s %
of -
----
Nam
e of
the
Inve
stee
Com
pany
Not
e
------
------
------
------
---- N
umbe
r of s
hare
s ---
------
------
------
------
-- --
------
-- R
upee
s ---
------
-
CH
EMIC
ALS
ICI P
akis
tan
Lim
ited
63,5
00
27,5
00
-
85
,000
6,00
0
6,
572,
922
6,
695,
160
4.
61%
4.32
%0.
01%
6,57
2,92
2
6,69
5,16
0
4.61
%4.
32%
0.01
%C
EMEN
TD
.G.K
han
Cem
ent C
ompa
ny L
imite
d-
13
5,00
0
-
110,
000
25,0
00
5,72
5,43
5
5,81
0,00
0
4.00
%3.
75%
0.01
%M
aple
Lea
f Cem
ent F
acto
ry L
imite
d46
,500
10
0,00
0
-
146,
500
-
-
-
-
-
-
K
ohat
Cem
ent C
ompa
ny L
imite
d-
60
,000
-
35,0
00
25
,000
6,
799,
650
6,
584,
750
4.
54%
4.25
%0.
02%
Pio
neer
Cem
ent L
imite
d-
55
,500
-
20,5
00
35
,000
4,
863,
898
5,
005,
000
3.
45%
3.23
%0.
02%
Che
rat C
emen
t Com
pany
Lim
ited
-
300,
000
-
27
5,00
0
25
,000
4,
464,
774
4,
780,
250
3.
29%
3.08
%0.
01%
Luck
y C
emen
t Lim
ited
-
55,0
00
-
51
,000
4,00
0
3,
457,
842
3,
349,
560
2.
31%
2.16
%-
Dew
an C
emen
t Lim
ited
-
25,0
00
-
25
,000
-
-
-
-
-
-
25
,311
,599
25,5
29,5
60
17.5
9%16
.47%
0.06
%FO
OD
& P
ERSO
NAL
CAR
E PR
OD
UC
TSFa
uji F
oods
Lim
ited
(Non
-Vot
ing)
(for
mer
ly No
on P
akist
an L
imite
d)13
2,70
0
250,
500
-
35
3,20
0
30
,000
2,
564,
451
3,
078,
300
2.
12%
1.98
%0.
15%
Fauj
i Foo
ds L
imite
d37
5,00
0
100,
000
-
45
0,00
0
25
,000
2,
737,
970
2,
764,
750
1.
91%
1.78
%-
Eng
ro F
oods
Lim
ited
-
225,
000
-
20
0,00
0
25
,000
4,
412,
444
4,
061,
000
2.
80%
2.62
%-
9,71
4,86
5
9,90
4,05
0
6.83
%6.
38%
0.15
%TE
XTIL
E C
OM
POSI
TEN
isha
t Mill
s Li
mite
d38
9,00
0
50,0
00
-
42
4,00
0
15
,000
2,
387,
451
2,
478,
000
1.
71%
1.60
%-
Gad
oon
Text
ile M
ills
Ltd
-
8,00
0
-
-
8,
000
2,10
6,54
0
1,91
2,00
0
1.32
%1.
23%
0.03
%N
isha
t (C
huni
an) L
imite
d-
80
,000
-
70,0
00
10
,000
63
1,46
0
60
5,70
0
0.
42%
0.39
%-
5,12
5,45
1
4,99
5,70
0
3.45
%3.
22%
0.03
%AU
TOM
OB
ILE
ASSE
MB
LER
Pak
Suz
uki M
otor
Com
pany
Lim
ited
51,9
00
5,00
0
-
51,9
00
5,
000
3,54
0,99
8
3,09
9,85
0
2.14
%2.
00%
0.01
%In
dus
Mot
or C
ompa
ny L
imite
d-
6,
000
-
3,
000
3,
000
4,85
0,84
0
4,77
4,68
0
3.29
%3.
08%
-
D
ewan
Far
ooqu
e M
otor
s Li
mite
d-
55
2,00
0
-
552,
000
-
-
-
-
-
-
A
tlas
Hon
da L
td-
3,
000
-
1,
850
1,
150
858,
204
864,
708
0.60
%0.
56%
-
M
illat
Tra
ctor
s Li
mite
d11
0,00
0
-
-
11
0,00
0
-
-
-
-
-
-
9,25
0,04
2
8,73
9,23
8
6.03
%5.
64%
0.01
%O
IL A
ND
GAS
MAR
KET
ING
CO
MPA
NIE
SS
ui N
orth
ern
Gas
Pip
elin
es L
imite
d-
4,
063,
000
-
3,97
3,00
0
90,0
00
10,9
98,5
92
12
,849
,300
8.
85%
8.28
%0.
01%
Sui
Sou
ther
n G
as C
ompa
ny L
imite
d2,
686,
000
690,
000
-
3,
376,
000
-
-
-
-
-
-
10,9
98,5
92
12
,849
,300
8.
85%
8.28
%0.
01%
TRAN
SPO
RT
Pak
ista
n In
tern
atio
nal A
irlin
es C
orpo
rtatio
n Li
mite
d-
20
0,00
0
-
200,
000
-
-
-
-
-
-
P
akis
tan
Nat
iona
l Shi
ppin
g C
orpo
ratio
n-
20
0,00
0
-
200,
000
-
-
-
-
-
-
-
-
-
-
-

Notes to the Condensed Interim Financial Information FOR THE NINE MONTHS AND QUARTER ENDED MARCH 31, 2017 (Un-Audited)
19
As
at J
uly
01, 2
016
Pur
chas
ed
durin
g th
e pe
riod
Tra
nsfe
rred
fr
om
unlis
ted
secu
ritie
s
Bon
us /
right
sh
ares
re
ceiv
ed
durin
g th
e pe
riod
Dis
pose
d of
f dur
ing
the
perio
d
As
at
Mar
ch 3
1,
2017
Car
ryin
g Va
lue
as a
t M
arch
31,
201
7
Mar
ket V
alue
as
at M
arch
31,
20
17
Net
ass
ets
Tota
l in
vest
men
ts
Inve
stee
co
mpa
ny
paid
-up
capi
tal
-----
Inve
stm
ent a
s %
of -
----
Nam
e of
the
Inve
stee
Com
pany
Not
e
------
------
------
------
---- N
umbe
r of s
hare
s ---
------
------
------
------
-- --
------
-- R
upee
s ---
------
-
CAB
LE A
ND
ELE
CTR
ICAL
GO
OD
SP
akis
tan
Cab
les
Lim
ited
-
11,8
00
-
11
,800
-
-
-
-
-
-
S
inge
r Pak
ista
n Li
mite
d-
10
0,00
0
-
19,5
00
80
,500
5,
736,
148
5,
145,
560
3.
55%
3.32
%0.
18%
Pak
Ele
ktro
n Li
mite
d-
11
5,00
0
-
115,
000
-
-
-
-
-
5,
736,
148
5,
145,
560
3.
55%
3.32
%0.
18%
MIS
CEL
LAN
EOU
SP
ace
(Pak
ista
n) L
imite
d2,
000,
000
275,
000
-
2,
275,
000
-
-
-
-
-
-
TPL
Pro
perti
es L
imite
d-
-
2,
000,
000
-
2,
000,
000
-
-
-
-
-
-
-
-
-
-
-
PA
PER
AN
D B
OAR
DP
acka
ges
Lim
ited
16,0
00
60,7
00
-
71
,200
5,50
0
4,
431,
616
4,
773,
890
3.
29%
3.05
%0.
01%
Che
rat P
acka
ging
Lim
ited
-
5,00
0
-
5,00
0
-
-
-
-
-
-
4,
431,
616
4,
773,
890
3.
29%
3.05
%0.
01%
ENG
INEE
RIN
GM
ugha
l Iro
n an
d S
teel
Indu
strie
s Li
mite
d24
1,50
0
79,0
00
-
31
0,50
0
10
,000
1,
163,
381
1,
410,
300
0.
97%
0.91
%0.
01%
Cre
scen
t Ste
el &
Alli
ed P
rodu
cts
Lim
ited
626,
600
20
0,00
0
-
820,
600
6,00
0
1,
427,
723
1,
501,
800
1.
03%
0.97
%0.
01%
Am
reli
Ste
els
Lim
ited
-
125,
000
-
12
5,00
0
-
-
-
-
-
-
Inte
rnat
iona
l Ind
ustri
es L
td-
5,
000
-
-
5,00
0
1,
348,
780
1,
212,
450
0.
84%
0.78
%-
Inte
rnat
iona
l Ste
els
Lim
ited
-
101,
000
-
81
,000
20,0
00
2,43
8,28
0
2,57
8,80
0
1.78
%1.
66%
-
6,
378,
164
6,
703,
350
4.
62%
4.32
%0.
02%
PHAR
MAC
EUTI
CAL
STh
e S
earle
Com
pany
Lim
ited
-
15,0
00
1,00
0
5,00
0
11,0
00
6,95
2,88
5
6,95
1,12
0
4.79
%4.
48%
0.01
%6,
952,
885
6,
951,
120
4.
79%
4.48
%0.
01%
TEC
HN
OLO
GY
& C
OM
MU
NIC
ATIO
NA
vanc
eon
Lim
ited
-
143,
500
-
10
8,50
0
35
,000
1,
605,
396
1,
921,
500
1.
32%
1.24
%0.
03%
1,60
5,39
6
1,92
1,50
0
1.32
%1.
24%
0.03
%AU
TOM
OB
ILE
PAR
TS &
AC
CES
SOR
IES
Gen
eral
Tyr
e &
Rub
ber C
o. o
f Pak
-
10,0
00
-
-
10,0
00
2,84
1,98
0
2,71
0,80
0
1.87
%1.
75%
0.02
%2,
841,
980
2,
710,
800
1.
87%
1.75
%0.
02%
INSU
RAN
CE
IGI I
nsur
ance
Ltd
-
10,0
00
-
-
10,0
00
4,02
1,64
7
3,60
4,60
0
2.48
%2.
32%
0.01
%4,
021,
647
3,
604,
600
2.
48%
2.32
%0.
01%
As a
t Mar
ch 3
1, 2
017
1,72
4,50
0
155,
842,
366
155,
098,
918
106.
88%
100.
00%
0.68
%
As a
t Jun
e 30
, 201
651
3,38
1,85
6
46
3,08
1,58
2
5.1.
1
Mar
ch
31,2
017
June
30,
2016
Mar
ch 3
1,20
17Ju
ne
30,2
016
Sui
Sou
ther
n G
as C
ompa
ny L
imite
d
-
2,0
00,0
00
-
6
8,12
5,60
0 E
ngro
Fer
tiliz
ers
Lim
ited
50,
000
-
3,13
3,00
0
-
Has
col P
etro
leum
Lim
ited
15,
000
-
4,49
8,50
0
-
65,
000
2,0
00,0
00
7,
631,
500
68,
125,
600
Follo
win
g sh
ares
hav
e be
en p
ledg
ed w
ith N
atio
nal C
lear
ing
Com
pany
of P
akis
tan
limite
d se
curit
y ag
ains
t set
tlem
ent o
f the
Fun
d's
trade
s in
term
s of
Circ
ular
No.
11 d
ated
Oct
ober
23,
2007
issu
ed b
y S
EC
P
------
-----(
Num
ber o
f sha
res)
-----
------
------
-(Rup
ees)
------
------
-

Notes to the Condensed Interim Financial Information FOR THE NINE MONTHS AND QUARTER ENDED MARCH 31, 2017 (Un-Audited)
20
5.2 Unlisted equity securities
As at July 01, 2016
Purchased during the
period
As at March 31, 2017
Carrying Value as at March 31,
2017
Market Value as at March
31, 2017
Net assets
TPL Properties Limited 2,000,000 - - - - -
As at March 31, 2017 2,000,000 - 2,000,000 - - - -
As at June 30, 2016 - 2,000,000 - 2,000,000 25,000,000 25,000,000 3.00%
5.3 Listed debt securities - designated 'at fair value through profit or loss'
As at July 01, 2016
Purchased during the
period
Redeemed during the
period
Disposed off during the period
As at March
31, 2017
Carrying Value as at March
31, 2017
Market Value as at
March 31, 2017
Net assets
Total investmen
ts
Size of issue
Term Finance Certificates (TFCs)
Financial ServicesTrust Investment Bank Limited 7,000 - - - 7,000 13,137,043 - - - - Less: Provision (13,137,043)
As at March 31, 2017 7,000 - - - 7,000 - - - - -
As at June 30, 2016 7,000 - - - 7,000 - - - - -
5.3.1 Significant terms and conditions of listed debt securities are as follows:
Note Number of certificates
Face Value (Rupees) Maturity Secured /
Unsecured Rating
Trust Investment Bank Limited 5.3.1.1 7,000 1,874 July 2013 Secured Withdrawn
5.3.1.1
5.4 Detail of non-compliant investment with the investment criteria assigned category
Net assets Gross assets
Trust Investment Bank Limited 5.3.1 TFCs 13,137,043 (13,137,043) - - -
5.4.1
2,000,000
Total investments
-
-
5.00%
Name of the Investee Company
---------------------------- Number of shares ----------------------------- ----- Investment as % of -----
Trasferrred to listed securities during the
period
-------Rupees -------
Name of the Investee Company
---------------------------- Number of certificates ----------------------------- ----- Investment as % of ----- -------Rupees -------
Circular No.7 of 2009 issued by the SECP requires that the rating of any debt security in the portfolio shall not be lower than the investment grade. However, the ratings of above mentioneddebt security is withdrawn and, hence, it is lower than investment grade.
Name of the Investee Company Mark - up rate (per annum)
6 months KIBOR +1.85%
Due to financial difficulties, Trust Investment Bank Limited (the Issuer) was unable to make payment of principal amounting to Rs.8.746 million due on July 04, 2012, January 04, 2013 andJuly 04, 2013 and, accordingly, the Fund has recognised provision of Rs.13.137 million against its exposure in TFCs issued by the issuer as per Circular 33 of 2012 of SECP and hassuspended the accrual of mark-up accordingly.
Name of non-compliant investments Note Type of investment
Value of investment
before provision
Provision held (if any)
Investment as % of Value of investment after provisio
n

Notes to the Condensed Interim Financial Information FOR THE NINE MONTHS AND QUARTER ENDED MARCH 31, 2017 (Un-Audited)
21
(Un-Audited) (Audited)March 31, June 30,
2017 2016
6. ACCRUED AND OTHER LIABILITIES
SECP non refundable annual fee payable 219,434 639,306 Brokerage payable 171,930 1,961,963 Accrued liabilities 1,592,442 1,982,103 Auditors Remuneration Payable 280,385 - Zakat payable 9,753 9,753 Provision for Workers' Welfare Fund 6.1 1,044,866 3,819,675 Provision for indirect taxes and duties 6.2 3,537,306 3,497,459
6,856,116 11,910,259
6.1 The Finance Act, 2008 had introduced an amendment to the Workers' Welfare Fund Ordinance, 1971 (WWFOrdinance) as a result of which it was construed that all Collective Investment Schemes (CISs) / mutual fundswhose income exceeded Rs 0.5 million in a tax year were brought within the scope of the WWF Ordinance, thusrendering them liable to pay contribution to WWF at the rate of two percent of their accounting or taxableincome, whichever was higher. In light of this, the Mutual Funds Association of Pakistan (MUFAP) filed aconstitutional petition in the Honourable Sindh High Court (SHC) challenging the applicability of WWF on CISswhich is pending adjudication. Similar cases were disposed of by the Peshawar and the Lahore High Courts inwhich these amendments were declared unlawful and unconstitutional. However, these decisions werechallenged in the Supreme Court of Pakistan.
Subsequently, the Finance Act, 2015 introduced an amendment under which CISs / mutual funds have beenexcluded from the definition of “industrial establishment” subject to WWF under the WWF Ordinance.Consequently, mutual funds are not subject to this levy after the introduction of this amendment which isapplicable from tax year 2016. Accordingly, no further provision in respect of WWF was made with effect fromJuly 1, 2015.
On November 10, 2016 the Supreme Court of Pakistan (SCP) has passed a judgment declaring theamendments made in the Finance Acts 2006 and 2008 pertaining to WWF as illegal citing that WWF was not inthe nature of tax and could, therefore, not have been introduced through money bills. Accordingly, the aforesaidamendments have been struck down by the SCP. The Federal Board of Revenue has filed a petition in the SCPagainst the said judgment, which is pending for hearing. While the petitions filed by the CISs on the matter arestill pending before the SHC, the Mutual Funds Association of Pakistan (MUFAP) (collectively on behalf of theasset management companies and their CISs) has taken legal and tax opinions on the impact of the SCPjudgement on the CISs petition before the SHC. Both legal and tax advisors consulted were of the view that thejudgment has removed the very basis on which the demands were raised against the CISs. Therefore, therewas no longer any liability against the CISs under the WWF Ordinance and that all cases pending in the SHC orlower appellate forums will now be disposed of in light of the earlier judgement of the SCP.
Furthermore, as a consequence of the 18th amendment to the Constitution of Pakistan, in May 2015 the SindhWorkers’ Welfare Fund Act, 2014 (SWWF Act) had been passed by the government of Sindh as a result ofwhich every industrial establishment located in the Province of Sindh, the total income of which in anyaccounting year is not less than Rs 0.50 million, is required to pay Sindh Workers’ Welfare Fund (SWWF) inrespect of that year a sum equal to two percent of such income. The matter was taken up by the MUFAP withthe Sindh Revenue Board (SRB) collectively on behalf of various asset management companies (including theManagement Company of the Fund) whereby it was contested that mutual funds should be excluded from theambit of the SWWF Act as these were not industrial establishments but were pass through investment vehiclesand did not employ workers. The SRB held that mutual funds were included in the definition of financialinstitutions as per the Financial Institution (Recovery of Finances) Ordinance, 2001 and were, hence, required toregister and pay SWWF under the SWWF Act. Thereafter, MUFAP has taken up the matter with the SindhFinance Ministry to have mutual funds excluded from the applicability of SWWF.

Notes to the Condensed Interim Financial Information FOR THE NINE MONTHS AND QUARTER ENDED MARCH 31, 2017 (Un-Audited)
-
-
6.2
7. COMMITMENTS
7.1 Contingencies
There are no commitments at the period end
8. TAXATION
In view of the above developments regarding the applicability of Federal and SWWF on Mutual Funds andconsidering the legal opinion obtained on these matters, MUFAP has recommended the following to all itsmembers on January 12, 2017:
The above decisions were communicated to the SECP and the Pakistan Stock Exchange Limited on January12, 2017. The SECP vide its letter dated February 1, 2017 has advised MUFAP that the adjustments relating tothe above should be prospective and supported by adequate disclosures in the financial statements of the CISs/mutual funds. Accordingly, necessary adjustments in this respect have been recorded in the books of the Fundson January 12, 2017.
The cumulative net effect of the above two adjustments if these had not been made on March 31, 2017 wouldhave resulted in a decrease in the net asset value per unit of the Fund by Rs 1.23 (1.52%).
Accordingly, the provision for SWWF is being made by the Funds on a daily basis going forward.
There were no contingencies as at March 31, 2017 and June 30, 2016 except as disclosed in relevant notes tothe financial statements.
Furthermore, the Federal Government vide Finance Act, 2016 has excluded Asset Management Companies and other Non Banking Finance Companies from charge of Federal Excise Duty (FED) on their services.
In view of the pending decision and as a matter of abundant caution, the Management Company of the Fund has maintained a provision for FED in the books of accounts of the Fund with effect from June 13, 2013 to June 30, 2016 aggregating to Rs. 3.54 million (June 30, 2016: Rs. 3.54 million). Had the said provision of FED and related taxes not been recorded in the books of account of the Fund, the net assets value per unit of the Fund would have been higher by Rs.1.57 (1.94%) per unit as at March 31, 2017 (June 30, 2016: Rs.0.33 (0.48%) per unit).
the entire provision against the Federal WWF held by the CISs till June 30, 2015, to be reversed onJanuary 12, 2017; and
the provision in respect of SWWF should be made on a prudent basis with effect from the date ofenactment of the SWWF Act, 2014 (i.e. starting from May 21, 2015) on January 12, 2017.
The income of the fund is exempt from income tax under Clause (99) of Part 1 of the Second Schedule to the IncomeTax Ordinance, 2001 (Clause 99) subject to the condition that not less than 90 percent of the accounting income for theyear, as reduced by capital gains, whether realized or unrealized, is distributed amongst the unit holders. TheManagement Company has intends to distribute not less than 90 percent of its annual accounting income to avail thetax exemption. Accordingly, no provision for current and deferred tax has been made in this condensed interim financialinformation.
There is no change in the status of petition with Honorable Sind High Court as reported in note 15.3 to theannual financial statements of the Fund for the year ended June 30, 2016.
22

9. EARNING PER UNIT
Earning per unit (EPU) has not been disclosed as in the opinion of the management, determination of cumulativeweighted average number of outstanding units for calculating EPU is not practiceable.
10. TRANSACTIONS WITH CONNECTED PERSONS / RELATED PARTIES
10.1
10.2
10.3
March 31, March 31,2017 2016
Transactions during the period
Faysal Asset Management Limited (Management Company)
Remuneration of the Management Company 4,612,691 9,597,544 Sales tax on management fee 599,650 1,343,657 Redemption of 559,759 units (2016: 896,851 units) 39,073,708 63,000,000 Issuance of 188,374 units (2016: Nil units) 13,999,242 - Bonus issue of Nil units in lieu of 5% paymentof with holding tax (2016: 2,971 units) - 209,954 Reimbursement of expenses to the Management Company 215,672 -
Faysal Bank Limited (Group / Associated Company)
Profit on PLS savings accounts 46,656 50,779 Bank charges 9,146 6,930 Redemption of 1,046,130 units (2016: 406,945 units) 76,204,391 30,000,000
Central Depository Company of Pakistan Limited (Trustee of the Fund)
Remuneration of the Trustee 621,800 959,816 Settlement charges 211,096 207,148 Sales tax on Trustee fee 80,833 134,374
Directors and Key Management personnel(Management Company)
Issue of Nil units (2016: 3,635 units) - 245,000 Redemption of 5,503 units (2016: 43,786) 400,001 2,938,619
Connected persons / related parties include Faysal Asset Management Limited being the ManagementCompany, Central Depository Company of Pakistan Limited being the Trustee, other collective investmentschemes managed by the Management Company, Faysal Asset Management Limited - Staff Provident Fund,Faysal Asset Management Limited - Staff Gratuity Fund, Faysal Bank Limited, Faysal Bank Limited - StaffProvident Fund, Faysal Bank Limited - Staff Gratuity Fund and other entities under common management and /or directorship and the directors and officers of the Management Company and the Trustee.
The transactions with connected persons are in the normal course of business, at contracted rates.
The details of significant transactions carried out by the Fund with connected persons / related parties andbalances with them at period end are as follows:
----------(Un-Audited)------------
-------------- (Rupees) --------------
Notes to the Condensed Interim Financial Information FOR THE NINE MONTHS AND QUARTER ENDED MARCH 31, 2017 (Un-Audited)
23

Notes to the Condensed Interim Financial Information FOR THE NINE MONTHS AND QUARTER ENDED MARCH 31, 2017 (Un-Audited)
Unit holders holding 10% or more unitsMarch 31, March 31,
2017 2016
Naveena Exports Limited
Issue of 68,766 units (2016: Nil units) 5,000,000 - Redemption of 687,845 units (2016: Nil units) 49,593,601
Pakistan Mobile Communications-
Redemption of 1,513,957 units (2016: Nil units) 110,699,618 -
(Un-Audited) (Audited)March 31, June 30,
2017 2016
Outstanding BalancesCentral Depository Company of Pakistan Limited -
(Trustee of the Fund)Remuneration payable to the Trustee 59,452 130,013 Sales tax on Trustee fee payable 7,729 18,202
Faysal Asset Management Limited - (Management Company)Remuneration payable to the Management Company 323,538 443,994 Sales tax on management fee payable 42,060 62,159 Reimbursement of expenses 215,672 405,973 Units in issue 188,374 units (June 30, 2016: 559,759) 15,169,758 38,539,407
Faysal Bank Limited - (Group / Associated Company)Unit in issue Nil units (June 30, 2016: 1,046,130 units) - 72,026,050 Balance in PLS savings account 977,504 589,200 Profit receivable on PLS savings account 3,520 1,651
Directors and Key Management personnel(Management Company)Units in issue 2,511 units (June 30, 2016: 8,014 units) 202,211 551,764
Unit holders holding 10% or more units in issuePakistan Mobile Communication Limited - Provident Fund
Units in issue nil unit (June 30, 2016: 1,513,957 units) - 104,235,939
11. FAIR VALUE OF FINANCIAL INSTRUMENTS
Level 1: Quoted prices in active markets for identical assets or liabilities;
Level 2:
Level 3:
As at March 31, 2017, the Fund held the following financial instruments which were measure at fair value:
----------(Un-Audited)------------
-------------- (Rupees) --------------
-------------- (Rupees) --------------
IFRS 13 establishes a single source of guidance under IFRS for all fair value measurements and disclosures about fair valuemeasurement where such measurements are required as permitted by other IFRSs. It defines fair value as the price thatwould be received to sell an asset or paid to transfer a liability in an orderly transaction between market participants at themeasurement date (i.e. an exit price). Adoption of IFRS 13, has not affected the condensed interim financial information.
Financial assets which are tradable in an open market are revalued at the market prices prevailing on the statement of assetsand liabilities date. The estimated fair value of all other financial assets and financial liabilities is considered not significantlydifferent from book value.
The following table shows financial instruments recognized at fair value, analyzed between those whose fair value is based on:
Those involving inputs other than quoted prices included in Level 1 that are observable for the asset or liability,either directly (as prices) or indirectly (derived from prices); and
Those with inputs for the asset or liability that are not based on observable market data (unobservable inputs).
24

Leve
l 1Le
vel 2
Leve
l 3To
tal
Fina
ncia
l ass
ets
mea
sure
d at
fair
valu
e
Inve
stm
ents
'at f
air v
alue
thro
ugh
prof
it or
loss
' - H
eld-
for-
trad
ing
List
ed e
quity
sec
uriti
es
155,
098,
908
-
-
155,
098,
908
155,
098,
908
-
-
155,
098,
908
Fina
ncia
l ass
ets
not m
easu
red
at fa
ir va
lue
Bank
bal
ance
s
-
-
27,7
47,4
61
27
,747
,461
-
-
-
-
D
epos
its a
nd o
ther
rece
ivab
les
-
3,73
9,58
6
-
3,73
9,58
6
-
-
-
-
R
ecei
vabl
e ag
ains
t sal
e of
inve
stm
ents
-
4,60
5,22
6
-
4,60
5,22
6
-
-
-
-
155,
098,
908
8,
344,
812
27,7
47,4
61
19
1,19
1,18
1
155,
098,
908
-
-
15
5,09
8,90
8
Leve
l 1Le
vel 2
Leve
l 3To
tal
Fina
ncia
l ass
ets
mea
sure
d at
fair
valu
e
Inve
stm
ents
'at f
air v
alue
thro
ugh
prof
it or
loss
' - h
eld-
for-
trad
ing
List
ed e
quity
sec
uriti
es46
3,08
1,58
2
-
-
463,
081,
582
46
3,08
1,58
2
-
-
463,
081,
582
Fina
ncia
l ass
ets
not m
easu
red
at fa
ir va
lue
Bank
bal
ance
s-
-
34
7,43
6,65
6
347,
436,
656
-
-
-
-
D
epos
its a
nd o
ther
rece
ivab
les
-
16
,312
,114
-
16,3
12,1
14
-
-
-
-
U
nlis
ted
pref
eren
ce s
hare
s25
,000
,000
-
-
25,0
00,0
00
-
-
-
-
488,
081,
582
16
,312
,114
34
7,43
6,65
6
851,
830,
352
46
3,08
1,58
2
-
-
463,
081,
582
Mar
ch 3
1, 2
017
Car
ryin
g am
ount
Fair
valu
e
Inve
stm
ents
Dep
osits
and
ot
her
rece
ivab
les
Cas
h an
d ca
sh
equi
vale
nts
Tota
l
Tota
l---
------
------
------
------
-- (R
upee
s) --
------
------
------
------
------
------
------
------
------
-- (R
upee
s) --
------
------
------
------
---
------
------
------
------
-----
(Rup
ees)
-----
------
------
------
------
------
------
------
------
-----
(Rup
ees)
-----
------
------
------
------
June
30,
201
6C
arry
ing
amou
ntFa
ir va
lue
Inve
stm
ents
Dep
osits
and
ot
her
rece
ivab
les
Cas
h an
d ca
sh
equi
vale
nts
25
Notes to the Condensed Interim Financial Information FOR THE NINE MONTHS AND QUARTER ENDED MARCH 31, 2017 (Un-Audited)

Notes to the Condensed Interim Financial Information FOR THE NINE MONTHS AND QUARTER ENDED MARCH 31, 2017 (Un-Audited)
Carrying amountLevel 1 Level 2 Level 3 Total
Financial liabilities not measured at fair value
Payable to the Management Company 581,270 - - - - Remuneration payable to the Trustee 67,181 - - - - Accrued and other liabilities 6,856,116 - - - - Payable against purchase of investments 2,457,025 - - - -
9,961,592 - - - -
Carrying amountLevel 1 Level 2 Level 3 Total
---------- (Rupees) ----------
Financial liabilities not measured at fair value
Payable to the Management Company 912,126 - - - - Remuneration payable to the Trustee 148,215 - - - - Accrued and other liabilities 11,910,259 - - - - Payable against redemption of units 59,840,000 - - - - Payable against purchase of investments 40,220,505 - - - -
113,031,105 - - - -
12. Expense Ratio
13. RECLASSIFICATION
June 30, 2016Fair value
----------------------------- (Rupees) -----------------------------
March 31, 2017
SECP has introduced "expense ratio" vide amendments in NBFC Regulations dated November 25, 2015,whereby, the total expense ratio of an asset allocation scheme shall be capped at 4% of average daily net assetsvalue of the scheme. The regulation further states that for the purpose of expense ratio, expenses incurred inrelation to any government levy on funds such as sales tax, federal excise duty, SECP fee, etc. shall be excludedwhile calculating expense ratio. Furthermore, under NBFC Regulation 60(3)(s), wherein the ManagementCompany is allowed to charge their cost to Collective Investment Schemes (CIS) in respect of fees andexpenses related to registrar services, accounting, operations and valuation services related to that CIS, themaximum cost that can be charged in this regard is up to 0.1% of the average annual net assets of that CIS oractual, whichever is less. Accordingly, this represents the amount receivable from the Management Company tomaintain the expense ratio of the Fund within the prescribed limits. The total expense ratio of the Fund is 4.75%which includes 0.86% representing government levies and SECP fee.
Comparative information has been re-classified, re-arranged or additionally incorporated in these financialstatements, wherever necessary, to facilitate comparison and to conform with changes in presentation in thecurrent year.
Fair value
26
14. GENERAL
Figures are rounded off to the nearest rupee.
15. DATE OF AUTHORISATION FOR ISSUE
This condensed interim financial information was authorised for issue on _______________ by the Board ofDirectors of the Management Company.
For Faysal Asset Management Limited(Management Company)
____________________ ___________________ ___________________Chief Executive Officer Director Director
April 28, 2017
27
Notes to the Condensed Interim Financial Information FOR THE NINE MONTHS AND QUARTER ENDED MARCH 31, 2017 (Un-Audited)

28

29

30

32.88(1.88)
31.00-
31.0080.53
42.53
(5.87)
36.66
-
36.66
65.63
34.07 (7.64)
26.43-
26.4380.53
(35.02)
(19.35)
(54.37)
-
(54.37)
65.63
March 312016 2017
March 312016 2017
31