
assessment paper TRADE BARRIERS - Copenhagen … · TRADE BARRIERS Kym Anderson assessment paper....
45
TRADE BARRIERS Kym Anderson assessment paper
Transcript of assessment paper TRADE BARRIERS - Copenhagen … · TRADE BARRIERS Kym Anderson assessment paper....

TRADE BARRIERSKym Anderson
assessment paper

Trade Barriers Costing Global Trade Barriers, 1900 to 2050
Kym Anderson, George Gollin Professor of Economics, School of Economics,University of Adelaide Assessment Paper Copenhagen Consensus on Human Challenges 2011

2
Acknowledgements: Paper for the Copenhagen Consensus on Human Challenges 2011 Project. This draws to some extent on the author’s earlier CC04 chapter and Anderson and Winters’ CC08 chapter which appear in Global Crises, Global Solutions, edited by B. Lomborg, Cambridge University Press, 2004 and 2009. Research assistance by Signe Nelgen is gratefully acknowledged.
Author contact: Kym Anderson School of Economics University of Adelaide Adelaide SA 5005 Australia Phone +61 8 8303 4712 Fax +61 8 8223 1460 [email protected]

3
Abstract By how much have the costs of governmental barriers to trade changed over the past
century or so, and how might they change by the middle of the present century? This paper
addresses that question by first reviewing evidence on the changing extent of global trade
restrictions since 1900, particularly for agricultural and manufactured goods. It then assesses
prospects for trade policy changes over the coming four decades by drawing on current
political economy theory and evidence. Those estimates and projections of the extent of
price distortions due to trade policy measures are then drawn on to provide as lower-bound
estimate of the annual cost, in terms of economic welfare foregone in high-income and
developing countries, of those trade-restricting policies. A global economy-wide model
(Linkage) is used to provide precise estimates for 2004 plus a pair of projections for 2050
and a backcast for the early 1980s. Those results for recent years plus the measures of the
extent of past price distortions allow inferences to be drawn for costs of distortions to goods
trade in earlier decades of the 20th century. Those costs grew after World War I and peaked
in the early 1930s before declining from the 1960s and especially since the 1980s. The paper
also provides a sense of by how much those costs understate the real welfare foregone by
trade barriers because of not being able to include distortions to markets for services and a
wide range of phenomena raised by the “new” trade theory and the empirical literature that
is being stimulated by it. When informed guesses as to how much those additional features
multiply the cost of trade barriers are included in the calculus, the estimated cost escalates
to several times the standard calculated lower-bound estimates of around 1 percent of
global GDP.

Introduction The potential net economic and social benefits available to almost every country if they were to open their
economies to international trade have been well known and clearly articulated since at least the 18th
century (Irwin 1996). Yet national governments continue to intervene in markets for goods, services, capital
and labor in ways that alter the location of production, consumer expenditure and thus also international
commerce. Certainly transport and communication costs of doing business across borders have fallen
enormously over the centuries, lowering natural barriers to trade. Governmental barriers to trade,
however, have fluctuated widely around both upward and downward long-run trends.
The objectives of this paper are three-fold: to review evidence on the changing extent of global
trade restrictions resulting from government policies over the past 100+ years; to assess prospects for
trade policy changes over coming decades, drawing on current political economy theory and evidence; and
to estimate the annual cost in terms of economic welfare foregone in high-income and developing
countries of those trade-restricting policies at various points in time retrospectively from 1900 and
prospectively to 2050.
To keep the task manageable, attention is initially confined to restrictions on goods trade, leaving
aside until the end the less-certain effects of barriers to trade in services including financial flows.1 This is
necessary because methods for estimating the extent of (let alone the market and welfare effects of)
barriers to services and capital flows between countries are far less developed than methodologies
applicable to trade in goods. Preliminary studies to date to fill these lacunae suggest, however, that
potential gains from just goods trade reform today are very much lower than the gains that could come
from removing barriers for all products and financial flows. A sample of these studies is reviewed in the
Appendix, and the penultimate section of the chapter provides an indication of how much greater the
global cost of trade barriers could have been at different points in time with this more-comprehensive
coverage of trade barriers.
There is a paucity of detailed historical data even on goods trade restrictions. There are also
virtually no global economy-wide models capable of estimating costs of distortions through most of the
previous century. Precision about the past is therefore impossible. Also, there is a broad range of
projections of the world economy available for coming decades, and each of them depends on explicit or
(most commonly) implicit assumptions about future trade and other economic policies. Hence even
baseline shares of different countries in global GDP and trade in 2050, let alone projected trade barriers,
1 How large the international movement of labor would be without restrictive immigration laws is impossible to guess,
so it is ignored even though preliminary studies suggest the developing country and global economic welfare gains from even a modest expansion in access to jobs in high-income countries could be far greater than the gains from goods trade liberalization (Anderson and Winters 2009).

2
have an unmeasurable but wide confidence band around them. The use of global economy-wide models in
estimating the costs of trade-distorting policies has grown considerably in recent years though (Anderson
2003, Francois and Martin 2010), so estimates of the cost of at least recent policies are available. They will
be drawn on for their own sake, and also for providing guidance in estimating past and future costs.
The chapter begins, by way of background, with a brief history of trade policy and institutions. It
then examines the changing extent of barriers to international trade in various parts of the world from the
late 19th century to the present. That survey reveals the ups and downs of trade taxation over the past 100+
years. In the following section, a series of estimates of the global cost of trade barriers is presented: for
2004, for 2050 under two alternative scenarios (high and low protection) for 1980-84, and for earlier
decades of the 20th century. The penultimate section of the chapter then explores how much those
estimates might need to be adjusted to account for missing elements of the calculus, which are identified in
the review of recent literature summarized in the Appendix. Those two sections provide the basis for the
estimates reported in the final section of the costs of those changing trade barriers, expressed as a
percentage of GDP in high-income countries, developing countries and globally.
The results suggest that while their cost may have come down over the past six decades, they are
still high compared with those in 1900 (when transport costs were a more-important barrier to trade – see
Jacks, Meissner and Novy 2010 and Jacks and Pendakur 2010). The results also reveal that their cost may
not fall significantly over the next four decades unless a comprehensive liberalization is agreed to under the
current Doha round of multilateral trade negotiations by member countries of the World Trade
Organization (WTO). The chapter therefore concludes by exploring possible strategies to reduce remaining
distortions over the next four decades. The most obvious of them is unilateral reform, but governments
find it difficult politically to ignore protectionist lobbies unless there are counter-lobbies from other groups,
such as exporters. Hence the on-going effort to reform in concert with other countries, including
multilaterally via the WTO’s Doha Development Agenda but also via new or expanding preferential trading
agreements.
Trade policies and institutions since the 19th century2 During the 17th, 18th and early 19th centuries, trade negotiations were ‘ever pending, never ending’.
Frustration with that state of affairs set the stage for unilateral tariff cuts by the major economic power in
the 19th century, namely Britain, with the repeal of its Corn Laws in 1846. British policymakers hoped that
their European trading partners would see the benefits of unilateral liberalization and follow their example.
2 This section draws on the Introduction in Anderson and Hoekman (2006).

3
That was not immediately forthcoming but, by 1860, with war clouds gathering over Austria’s involvement
in Italy, the governments of Britain and France felt a commercial treaty was needed to diffuse tensions and
improve diplomatic relations. The resulting Cobden-Chevalier Treaty of 1860 contained a most-favoured-
nation (MFN) clause. This required that the agreed cut in the tariff on each item in their bilateral trade was
to be applied also to their imports from other countries. It also meant that every European country that
subsequently signed a trade treaty with either Britain or France (and most had done so by 1867) signed
onto MFN. Especially important was the Treaty of Frankfurt concluded by Bismarck with France in 1871: its
Article XI provided for permanent, unconditional MFN and was thereby a key stabilizer of European
commercial policy. The systemic effect of the 1860 Anglo-French accord was thus of much greater
significance than its importance to either country alone, as it led to a network of treaties that lowered
hugely both the average level of tariff protection and the extent of trade discrimination in Europe.
During the years from 1860 to 1913 the world enjoyed relative serenity in terms of international
trade and monetary relations. Even though economic growth then was proceeding at less than half the
post-World War II pace, it was very rapid by previous standards. In contrast to Europe, the United States
during this period sought mainly exclusive reciprocity agreements or, at best, conditional MFN treaties.
While those agreements freed up some trade, they explicitly retained a degree of discrimination and meant
America entered the 20th century with among the highest tariffs of today’s high-income countries.
When many of those European trade treaties were reaching their expiry date (nearly fifty of them
were to expire in the first half of the 1890s), economic difficulties were making their renegotiation more
contentious than earlier. Tariff wars ensued, so that the threat of retaliation – which had served as a
deterrent to raising tariffs – was no longer a constraint on reform reversal. Even so, MFN was retained, and
there was no recourse to anti-dumping3 or countervailing duties or to export subsidies, despite the
appearance of a ‘fair trade’ movement in Europe in the 1890s.
Great though that trade policy achievement of the period from 1860 to 1913 was, including the
establishment of non-discrimination in Europe via the widespread use of the unconditional MFN clause,
problems remained. One was the absence of bindings on tariffs (to prevent backsliding), and of constraints
on non-tariff trade-distorting measures. Another was that there was no legal means of resolving trade
disputes. Furthermore, the unwillingness of America or others to adopt the unconditional MFN principle
(see Viner 1924) meant the sustainability of the European commercial policy achievements of that period
was far from certain. Indeed, the bilateral treaty regime ended abruptly with the outbreak of World War I
in 1914.
3 The first anti-dumping legislation was not introduced until Canada did so in 1904. It was soon followed by similar
legislation in most of the major trading nations prior to and just after World War I (Deardorff 2005).

4
Following that war, efforts to restore liberal trade centred on international conferences. However,
despite the rhetoric in support of open markets, those meetings did not lead to renewed trade treaties
with binding commitments to openness based on MFN. With no country willing or able to replace Britain as
the hegemon, there was trade policy anarchy (Kindleberger 1989). When economic recession and low
agricultural prices hit in the late 1920s, and the US introduced the Smoot-Hawley tariff hikes of June 1930,
governments elsewhere responded with beggar-thy-neighbor protectionist trade policies that together
helped drive the world economy into depression. The volume of world trade shrunk by one-quarter
between 1929 and 1932, and its value fell by 40 percent.
The first attempts to reverse that growth in protection were discriminatory, benefitting colonies at
the expense of other trading partners. Thus between 1929 and 1938 the share of imports from colonies
rose from 30 to 42 percent for Britain, from 12 to 27 percent for France, and from 20 to 41 percent for
Japan (League of Nations 1939, Anderson and Norheim 1993). By the end of the 1930s protectionism was
far more entrenched than in the late 19th century when only non-discriminatory tariffs had to be grappled
with. Indeed nontariff trade barriers were so rife as to make tariffs redundant and hence a return to MFN
irrelevant unless and until ‘tariffication’ of those barriers occurred.
Out of the inter-war experience came the conviction that a return to the beneficent
noncooperative equilibrium of the 19th century was highly unlikely. Instead, Britain and the United States
were convinced that liberal world trade required a set of multilaterally agreed rules and binding
commitments based on non-discriminatory principles. A proposal for such an agreement was put to the
British War Cabinet in 1942 by Meade (1942), and was developed further at the Bretton Woods conference
in 1944 out of which grew also the IMF and World Bank. In the Anglo-American view, the postwar
international economic system was to be constructed in such a way as to remove the economic causes of
friction that were believed to have been at the origin of the Second World War. An important element in
this vision was the establishment of a stable world economy that would provide all trading nations with
nondiscriminatory access to markets, supplies and investment opportunities. There was a strong
perception that there was a positive correlation between trade and peace, and, as important, between
nondiscrimination and good foreign relations.
As it happened, the efforts in the latter 1940s to create an International Trade Organization (ITO) to
complement the International Monetary Fund and World Bank were unsuccessful (Diebold 1952).
Nonetheless, many of the key elements of the ITO proposal were encapsulated in a General Agreement on
Tariffs and Trade (GATT) that was signed in 1947 by 23 trading countries—12 developed and 11
developing— who at the time accounted for nearly two-thirds of the world’s international trade. The GATT
provided not only a set of multilateral rules and disciplines but also a forum to negotiate tariff reductions

5
and changes in rules, plus a mechanism to help settle trade disputes. Eight so-called rounds of negotiations
took place in the subsequent 46 years, as a result of which many tariffs on at least manufactured goods
were progressively lowered in most high-income countries. The last of those rounds culminating in
numerous Uruguay Round agreements to further reduce trade barriers over the subsequent decade
including – for the first time – in agriculture and services. Another of those agreements involved the GATT
Secretariat being converted into the World Trade Organization (WTO) in January 1995, the membership of
which now accounts for more than 95 percent of world trade.
Methodology for estimating the cost of trade-distorting policies The key trade-distorting policies include import or export taxes or subsidies, quantitative restrictions such
as import or export quotas or licences or bans (so-called non-tariff trade barriers or NTBs), or domestic
policies that affect the price facing producers or consumers of tradable products. Multiple exchange rates
also have been used in ways that effectively alter both exports and imports. The net effect of those
measures on the domestic price of a tradable good is usually expressed in ad valorem terms as the
percentage by which that domestic price exceeds the border price (ignoring domestic policies that may
drive a wedge between the producer and consumer prices of a good, which are relatively minor apart from
such generic and therefore less-distortionary measures as taxes on consumption or value added). That
percentage is often referred to as the nominal rate of assistance to producers and the consumer tax
equivalent affecting buyers (NRA and CTE, which are equal if the only distortions are trade measures). It will
be negative if an export tax or import subsidy or equivalent is the sole trade distortion. In the absence of
externalities and market failures, maximizing national economic welfare for a small economy typically
requires those NRAs/CTEs to be zero.4
Import restrictions are the most common trade distortion, predominantly tariffs but also NTBs from
time to time. Export restrictions have been less common, but certainly were used widely to tax exports of
primary products in many (especially newly independent) developing countries in the 1960s and 1970s. At
the same time those countries also protected some of their import-competing farm industries, just as in
high-income countries. Production restrictions are even less common, the most notable exception being
their use by members of the Organization of the Petroleum Exporting Countries (OPEC) since 1973. Trade
subsidies are least-commonly used, apart from some farm export subsidies by high-income countries in the
1980s and 1990s.
4 See Bhagwati (1971) or Corden (1997). The national welfare calculus is more complex than in simple international
economic textbooks but is fundamentally based on the sum of changes in consumer surplus, in producer surplus, in government tax revenues and in the country’s terms of trade as a result of introducing or changing a trade-related policy (Martin 1997).

6
Raising the price of importables relative to nontradables and exportables would appreciate the
currency and draw mobile resources from the export sector. An export subsidy of the same size as the tariff
could neutralize the trade- and welfare-reducing effects of the latter, whereas an export tax would
exacerbate them. Thus it is important to have estimates not only of the tariff rate on imports but also of
any trade taxes (or subsidies) applying to exportables.
It is not only the mean trade tax rates that matter though. Also relevant is their dispersion across
industries/products within each sector. The greater the dispersion in price distortions within any sector in
which productive factors are mobile, or within any group of products that are substitutes in consumption,
the more production and consumption patterns will have been affected and so the greater will be the
welfare cost (Lloyd 1974; Laborde, Martin and van der Mensbrugghe 2011). In the longer term, when non-
natural resources (labor and capital) are more mobile between sectors, it also matters if there is a
divergence of NRAs inter-sectorally.
If one had access to a global economy-wide model for each year of interest, with a great deal of
individual country coverage and industry and product detail, and for which NRA and CTE estimates were
available, the task of estimating the cost of trade-related policies that distort product prices would be
straightforward. Such models have become increasingly common in recent years, although most rely on a
single database, including for price distortion estimates, that has been compiled by the GTAP (Global Trade
Analysis Project) consortium. Those models are being used not only for contemporary trade policy analysis
but also to project forward to obtain cost estimates of prospective policies under specified assumptions
about growth rates. However, they are not available for the earlier part of the 20th century, for which
cruder ‘guesstimates’ based on sectoral average trade tax equivalent rates are relied upon.
Estimates of trade tax equivalents in the 20th century The potential importance of various economies to global trade distortions is reflected not only in their
trade tax equivalent rates but also in their shares of global GDP and trade (which are candidates for
calculating weighted average trade tax rates across countries). Table 2 shows that Europe and North
America accounted for around two-thirds of global GDP and international trade through most of the 1900s,
with Asia’s importance growing only in the last quarter of the century5 and other developing countries
accounting for barely one-sixth of world GDP and trade throughout that period.
Manufacturing and agriculture are the two main sectors producing tradables, with trade in
minerals, energy raw materials and services being relatively minor until their trade costs began falling and
5 China was almost completely closed for all but the last two decades of the 20
th century (Keller, Li, and Hua Shiue
2010). In 1900 it accounted for 11 percent of global GDP (and a low of 5 percent in 1953), but up until the mid-1980s it accounted for only 1 percent of global trade (Table 2).

7
fossil fuel prices rose in the last quarter of the 20thcentury.6 Thus agricultural and industrial price distortions
matter most and will be the focus here.
Most distortions in manufacturing since 1900 can be captured by tariffs plus (especially from the
early 1930s to the 1950s) the tariff equivalent of non-tariff import barriers. Unfortunately there are no
comprehensive time series of those NTBs, so reliance will be on tariffs while keeping in mind that these
provide a lower-bound estimate of overall import protection to manufacturing, particularly in the middle
one-third of the 20th century. Even the available tariff estimates are imprecise, for several reasons
associated with the differing methodologies adopted by those compiling and averaging them (see Lloyd
2008): unweighted vs trade-weighted vs production- or consumption-weighted averaging across tariff lines,
the inclusion of all or only dutiable lines, whether tariffs serving as excise taxes on imported product are
included (as with alcohol and tobacco, for example), the way specific tariffs are converted to ad valorem
rates (that is, from a volumetric to a percentage-of-border-price basis), and whether account is taken of
differing rates for different supplying countries (due to preferential trading agreements, for example).
When seeking a sectoral average rate of tariff protection, ideally the dispersion of rates across the
import-competing industries in the sector should be taken into account, since the welfare cost of a barrier
is proportional to the square of the tariff rate. The best way to capture that for obtaining a stand-alone
measure is to estimate a trade restrictiveness index (TRI), as has been done recently for the United States
by Irwin (2010) using the Anderson and Neary (2005) methodology as adapted by Feenstra (1995).
Typically such an index will exceed the trade-weighted average tariff on dutiable items, which in turn will
exceed the average over all tariff lines. TRIs are not available for other countries over the time period being
considered here though, and they are not needed when an economy-wide model is available since the
latter takes into account the dispersion in rates across the products in that model.7
Bearing those caveats in mind, Table 3 suggests that Europe’s manufacturing import tariffs were
mostly in the range 12-34 percent as of 1902 (and 9-20 percent as of 1913, key exceptions being Spain and
Russia. The United States had very high industrial tariffs around that time (54 percent in 1902, 30 percent in
1913), but they were cut far more than Europe’s by 1955 when they were slightly below those in the
countries that formed Europe’s Common Market (later to become the European Union). By contrast,
industrial tariffs in Australia, New Zealand and many developing countries had been rising over that period
and by the mid-1950s/early 1960s were two or three times those of Europe and North America.
6 Services and non-agricultural primary products each accounted for less than one-sixth of global trade prior to the
1960s, while manufactured products accounted for less than one-half, the rest being agricultural products (Haberler 1958, GATT 1978). 7 Such a model requires tariffs to be aggregated to the product categories identified in the model though, and for that
it is important to use the TRI concept in aggregating up from, say, the 6- or 10-digit tariff lines (Laborde, Martin and van der Mensbrugghe 2011).

8
In the middle of that period, however, was a rapid escalation of trade barriers that contributed
non-trivially to the Great Depression of the early 1930s. That sudden beggar-thy-neighbor protectionism is
not evident on the tariff estimates for 1925 and 1937 in Table 3, but can be seen in Table 4: between 1927
and 1931 the unweighted average across European countries of their tariffs on manufactures rose from 33
to 39 percent, while it rose in the United States from 26 to a peak of 35 percent and in Australia from 33 to
63 percent. Tariffs on foods rose even more, almost doubling in Europe to 65 percent. They gradually came
down through the latter 1930s though, before war interrupted trade; and by 1950 those rates were only
about one-third of their peaks in the early 1930s.
Import tariffs in developing countries are less well documented, but Clemens and Williamson
(2010) generate an index of them for 17 of the largest developing countries (accounting for 76 percent of
developing country GDP in 1900), for the period from 1870 to 1938. Their index is simply import tariff
revenue as a percentage of the value of total imports, and so may understate considerably the true tariff
average. For those developing countries in that period, most tariffs and imports were manufactured goods.
The estimates, reported in Table 5, suggest Asia has been much less protectionist of its manufacturing
sector than Latin America before 1940, just as it was in the post-war period. Those rates for Latin America
are well above those for the higher-income countries reported in Table 3.
As for primary agriculture, there has been a general tendency for poor agrarian economies to tax
the farm sector relative to other sectors but, as nations industrialize, to gradually change from negatively to
positively assisting farmers relative to other producers (and from subsidizing to taxing food consumers).
Following the famous repeal of Britain’s Corn Laws in the mid-1840s and the passage of the 1860 Anglo-
French Treaty of Commerce, Britain moved close to freer trade in farm (and other) products followed by
France and gradually other European countries. However, agricultural protection returned before the end
of the 19th century to some European countries, and became widespread in the early 1930s (Kindleberger
1975, 1989; Swinnen 2010). In contrast to tariffs on manufactures, however, agricultural protectionism
increased further over the next five decades.
Japan provides a striking example of the tendency to switch from taxing to increasingly
assisting agriculture relative to other industries. Its industrialization began later than Europe’s,
after the opening up of the economy following the Meiji Restoration in 1868. By 1900 Japan had
switched from being a small net exporter of food to becoming increasingly dependent on imports
of rice (its main staple food and responsible for more than half the value of domestic food
production). This led to calls from farmers and their supporters for rice import controls. Those calls
were matched by equally vigorous calls from manufacturing and commercial groups for

9
unrestricted food trade, since the price of rice at that time was a major determinant of real wages
and hence profitability in the nonfarm sector. The heated debates were not unlike those that led
to the repeal of the Corn Laws in Britain six decades earlier. In Japan, however, the forces of
protection triumphed, and a tariff was imposed on rice imports from 1904. That tariff then
gradually rose over time, raising the domestic price of rice to more than 30 per cent above the
import price during World War I. The Japanese government then extended its protection to its
colonies of Korea and Taiwan, shifting from a national to an imperial rice self-sufficiency policy. By
the latter 1930s imperial rice prices were more than 60 per cent above those in international
markets (Anderson and Tyers 1992).
After the Pacific War ended and Japan lost its colonies, its agricultural protection growth
resumed and spread from rice to an ever-wider range of farm products. In South Korea and
Taiwan in the 1950s, as in many newly independent developing countries, an import-substituting
industrialization strategy was initially adopted, which harmed agriculture. But in those two
economies – unlike in most other developing countries – that policy was replaced in the early
1960s with a more-neutral trade policy and then from the 1970s with ever-higher levels of
protection of farmers from import protection (Anderson and Hayami 1986, Ch. 2).
The other high-income countries that were settled by Europeans are far less-densely
populated. They therefore have had a strong comparative advantage in farm products for most of
their history following Caucasian settlement, and so have felt less need to protect their farmers
than Europe or Northeast Asia.
Many less-advanced and less-rapidly growing developing countries not only adopted
import-substituting industrialization strategies from the 1930s and especially in the 1950s and
1960s (Little, Scitovsky and Scott 1970; Balassa and Associates 1971) but also imposed direct taxes
on their exports of farm products.8 It was common in the 1950s and 1960s and in some cases
through to the 1980s for developing countries to use dual or multiple exchange rates as well,
thereby indirectly taxing both exporters and importers (Bhagwati 1978, Krueger 1978). This added
to the anti-trade bias of developing countries’ trade policies. By the early 1980s, however, both
8 The precise extent of taxation of agriculture in developing countries as a group prior to the 1950s is not yet well
documented, but is at least hinted at in Lindert (1991). Certainly it was occurring in Latin America (Bulmer-Thomas 1994, Bértola and Williamson 2006), Africa (Bates 1981), as well as in the Soviet Union and China where farmers were squeezed more than urban dwellers to fund State activities and the industrialization drive (Sah and Stiglitz 1992, Lin, Cai and Li 1996).

10
high-income and developing countries began to lower their barriers to agricultural trade, including
not just import tariffs but also export restrictions that were imposed in the 1960s and 1970s on
numerous farm products in developing countries.
A recent World Bank project has captured the extent of those changes since 1955 for a
sample of 75 countries accounting for more than 90 percent of the global economy, and for both
agricultural and non-agricultural tradable goods (Anderson 2009). That study suggests industrial
tariffs by the first half of the 1980s were already low in high-income countries, while they had
risen to quite high levels in developing countries (NRAs of 3 percent versus 35 percent). Table 6
shows that two decades later, however, they not only were reduced further in high-income
countries but also were substantially lowered in developing countries (to just 6 percent). As for
agricultural trade distortions, high-income countries lowered their export subsidies (a two-thirds
drop, from 22 to 7 percent) but retained high barriers to imports so their overall agricultural NRA
fell, from 56 to 34 percent.9 Meanwhile developing countries since the mid-1980s have lowered
their export taxes (from 41 to 3 percent) but raised their tariffs on farm imports (from 17 to 23
percent), and Europe’s transition economies’ rates are converging on those in the European Union
for both agriculture and manufacturing.
Even though these average NRAs for recent years may not seem very high, it needs to be
kept in mind that within each sector of each country there is a great deal of dispersion in rates of
assistance across various farm and nonfarm industries. There is also a wide range of sectoral NRAs
across the sample of 75 countries – and an even wider range when the relatively high distortions
of many small least-developed countries not in that sample are taken into account (Anderson
2010, Ch. 2). The only feasible way to estimate the global welfare effects of that cross-product and
cross-country dispersion of NRAs (and CTEs) is to employ global computable general equilibrium
modeling. Such modelling can correctly capture the welfare effects of not only the intra-and inter-
sectoral dispersion of price distortions within a country, but also of the effects of those and other
countries’ policies on each country’s international terms of trade.
Before turning to such modelling, one final point needs to be made about price-distorting
policies. It relates not to their longer-run trends but rather to their NRA changes from year to year
9 Domestic producer subsidies also were rife in high-income countries, but made a relatively small contribution to
trade distortions compared with border measures (Anderson, Martin and Valenzuela 2006; Anderson and Croser 2011).

11
as international product prices fluctuate. This is not a major issue for manufactured goods, apart
from occasional use of anti-dumping duties on select products by a small (albeit growing) number
of countries (Finger 2002). For agricultural products, by contrast, their annual changes in NRAs
tend to be negatively correlated with movements in their international price, especially for food
staples of developing countries. This is particularly evident when prices suddenly spike up or
down, but it applies more broadly as well. It results from countries varying their trade barrier in
the hope of not transmitting an international price shock to their domestic market: when the
international price rises, importers lower their tariff and exporters raise their export tax (as
happened in 2008), and when the international price falls the opposite tends to occur (Anderson
and Nelgen 2010). The irony is that if both exporting and importing countries sought thereby to
fully insulate their domestic market from the exogenous shock such as a crop shortfall, neither
would succeed as the world trade volume would be the same as if neither country altered their
trade barrier; yet both would cause the international price to spike more, so there would be an
even larger transfer of welfare between importing and exporting countries than that due just to
the initial external shock (Martin and Anderson 2012).10 This is especially so for products in which
most key countries are close to self-sufficient and so the share of global production traded
internationally is small, as with rice. Large though the welfare transfer effects can be in any price
spike year, they tend to be short-lived and to be offset by transfers in the opposite direction when
the international price of the product spikes the other way. For that reason such fluctuations in
NRAs around their longer-term trends will be ignored in the analysis below.
Modeling the welfare effects of trade barriers The easiest years to estimate the welfare effects of trade-distorting policies are recent ones to which the
databases of global economy-wide models have been calibrated. We therefore begin with that period. Such
models have also been used to project prospective effects in future decades under various assumptions, so
they will be considered next, before turning to the earlier decades of the 20th century.
10
Large welfare transfers also occur between countries that are net exporters and net importers of fossil fuels. The transfer has been predominantly from importers to exporters since OPEC introduced production quotas in 1973, which caused petroleum prices to quadruple (and to double again in 1979-80). But net-importing countries that are unilaterally taxing carbon emissions explicitly or implicitly for local and global pollution reasons are causing the opposite terms of trade effect. Since OPEC’s quotas are not subject to international disciplines in the same way tariffs are under the GATT, and since without OPEC quotas other countries may have raised their consumption taxes on petroleum products earlier for pollution reasons, this distortion will not be considered below.

12
The so-called GTAP database is by far the most widely used by global economic modelers, providing
data for more than 100 countries and country groups spanning the world. Its current version is for 2004
(Narayanan and Walmsley 2008). The price distortions in that database have been carefully compiled from
6-digit applied bilateral tariff data, thereby taking account of preferential tariffs due to regional and other
sub-global trade agreements that have grown so much over recent years. They also incorporate the
production and export subsidy estimates for high-income countries, as compiled by OECD (2006). They do
not, however, capture the other measures that distort developing country production and consumption of
farm products, most notably export taxes and various NTBs that can only be estimated by careful
comparison of domestic and border prices. Thus in the case of agriculture in developing countries, the
distortion levels in the GTAP database have been replaced with an alternative set based on the NRAs
estimated for 2004 that have come from the recent World Bank project (Anderson and Valenzuela 2008), as
calibrated by Valenzuela and Anderson (2008). For comparison purposes Valenzuela and Anderson also
show the distortions as they were in 1980-84 on average, to get a sense of the reform that has taken place
since then and allow modelers to use backcasting to estimate the effects of those reforms.
According to this amended dataset, the weighted average applied tariff in 2004 for agriculture and
lightly processed food was 21.8 percent for developing countries and 22.3 percent for high-income
countries, while for nonfarm goods it was
7.5 percent for developing countries and just 1.2 percent for high-income countries.
Though export subsidies for farm products for a few high-income regions and export taxes in a few
developing countries were still in place in 2004, these measures are generally small in their impact
compared with tariffs, as are production subsidies and taxes (Valenzuela, van der Mensbrugghe and
Anderson 2009, Table 13.1). While those average rates obscure large variations across countries and
commodities, the effects of the dispersion are captured in the economy-wide models used because of the
detailed country and commodity disaggregation in such models.
The model whose results are to be drawn on for the contemporary period (and also prospectively,
for 2050, and retrospectively, for 1980-84) is the World Bank’s global model known as Linkage (van der
Mensbrugghe 2005). For more than a decade, this publicly available model has formed the basis for the
World Bank’s standard long-term projections of the world economy and for much of its trade (and more
recently migration) policy analysis. In the application summarized below, the full database has been
aggregated to 24 sectors and 52 regions to make computations and reporting more manageable.
Linkage is a relatively straightforward CGE model but with some characteristics that distinguish it
from other comparative static models such as the GTAP model (described in Hertel 1997). Factor stocks are
fixed, which means in the case of labor that the extent of unemployment (if any) in the baseline remains

13
unchanged. Producers minimize costs subject to constant returns to scale in production technology,
consumers maximize utility, and all markets—including for labor—are cleared with flexible prices. There are
three types of production structures. Crop sectors reflect the substitution possibilities between extensive
and intensive farming; livestock sectors reflect the substitution possibilities between pasture and intensive
feeding; and all other sectors reflect standard capital and labor substitution. There are two types of labor,
skilled and unskilled, and the total employment of each is assumed to be fixed (meaning no change in their
unemployment levels). There is a single representative household per modeled region, allocating income to
consumption using the extended linear expenditure system. Trade is modeled using a nested structure in
which aggregate import demand is the outcome of allocating domestic absorption between domestic goods
and aggregate imports, and then aggregate import demand is allocated across source countries to
determine the bilateral trade flows (Armington 1969).
Government fiscal balances are fixed in U.S. dollar terms in Linkage, with the fiscal objective being
met by changing the level of lump sum taxes on households. This implies that losses of tariff revenues are
replaced by higher direct taxes on households. The current account balance also is fixed. Given that other
external financial flows are fixed, this implies that ex ante changes to the trade balance are reflected in ex
post changes to the real exchange rate. For example, if import tariffs are reduced, the propensity to import
increases and additional imports are financed by increasing export revenues. The latter typically is achieved
by a depreciation of the real exchange rate. Finally, investment is driven by savings. With fixed public and
foreign saving, investment comes from changes in the savings behavior of households and from changes in
the unit cost of investment. The model solves only for relative prices, with the numeraire, or price anchor,
being the export price index of manufactured exports from high-income countries. This price is fixed at
unity in the base year.
Only comparative static results are reported in this section, so it needs to be kept in mind that they
do not include the (often much larger) dynamic gains that result from an acceleration in investment that
would accompany a reduction in trade barriers. And because the version of the Linkage model reported
here assumes perfect competition and constant returns to scale, it captures none of the benefits of freeing
markets that came from accelerated productivity growth, scale economies, product variety and the
creation of new markets. There is also a dampening effect on estimates of welfare gains from trade
because of product and regional aggregation, which hides many of the differences in NRAs and CTEs across
products and countries. The results therefore should be treated as providing lower-bound estimates of the
net economic welfare benefits from policy reform, as is true of most currently available models (see
Anderson and Winters 2009, Francois and Martin 2010). An attempt is made in the chapter’s penultimate

14
section to provide an order of magnitude of the extent to which the reported estimates should be raised to
account for these missing elements in the calculus.
Cost of trade barriers as of 2004 What do the results show? Valenzuela, van der Mensbrugghe and Anderson (2009) estimate that the gains
from the removal of trade barriers as of 2004 could have added $168 billion per year to the global
economy. That is equivalent to 0.6 percent of the world’s real income that year. They find that developing
economies were being harmed by those policies nearly twice as much as were high-income economies on a
percent of real income basis in 2004 (0.9 versus 0.5 percent). They also find that 70 percent of those costs
globally, and 72 percent of those to developing countries, are due to agricultural policies, thanks to the
huge price distortions that remain in markets for farm products as compared with those in manufacturing.
For developing countries, 57 percent of the costs stem from policies of developing countries themselves,
and the other 43 percent from policies of high-income countries.
Cost of trade barriers in 2050 if policies as of 2004 are unchanged If policies as of 2004 were to remain in place until 2050, and given the projected faster growth of
developing than high-income countries, liberalization of those trade barriers in 2050 would generate an
even larger proportional gain to developing countries. According to results using the same global Linkage
model as Valenzuela, van der Mensbrugghe and Anderson (2009), a new study by van der Mensbrugghe
and Rosen (2010) estimates that the gain to developing countries would amount to a real income
improvement of 1.4 percent per year, compared with again 0.5 percent for high-income countries and thus
0.9 percent globally.11 This global number is slightly larger than in 2004, even though rates of price
distortions are assumed to be unchanged, because the developing countries are projected to grow in
relative importance in the global economy and they were suffering relatively more in 2004 from trade
barriers at that time, particularly as it affected South-South trade.
However, it is unlikely trade-related policies will not change over the next four decades. We
therefore consider two alternative scenarios in the next sub-section. They provide an opportunity to amend
the above numbers for 2050 down or up, according to whether one assumes policies will distort prices of
tradables less or more in four decades than now. A key uncertainly is the WTO’s Doha round of multilateral
trade negotiations
11
That projections study is based on 2004 US dollars. The developing country shares of global GDP on that basis are shown in Table 2 to differ from those based on Geary-Khamis dollars, but the proportional changes in developing country shares between the present decade and four decades hence are very similar and so no adjustment is made to the van der Mensbrugghe and Rosen (2010) estimates.
15
Cost of trade barriers in 2050 if policies become more liberal (low protection case) If the WTO’s Doha Development Agenda were to be revived and eventually come to a successful conclusion
such that the most comprehensive set of policy reform proposals as of 2008 were to be implemented, it
would lock in recent reforms through lowered bindings on tariffs and subsidies and possibly lead to further
opening of markets for services. The lower legal bindings would prevent temporary or long-term
backsliding into protectionism (Francois and Martin 2004), and in addition there would be net gains from
the phased liberalization itself. A study by Anderson, Martin and van der Mensbrugghe (2006), again using
the global Linkage Model and hence again ignoring pro-competitive and dynamic gains from trade reform,
suggests economic welfare in both developing and high-income countries would be around 0.2 percent
higher after full implementation of the agreement (which would take until the early 2020s at least). A
similar number has emerged from a forthcoming update of that study projected to 2025 (Martin and
Mattoo 2011).
If the Doha round did conclude so successfully, it would be reason to expect yet another WTO
round of reform commitments to be concluded and implemented by 2050. There would not be much
liberalization of trade in manufactures to be done by high-income countries, but there would be ample
scope for gains from reducing regulations in their services sectors as well as from providing greater market
access in farm products. Hence another 0.2 percent of GDP gain could be expected for those countries. The
scope for further gains from a successor to Doha is much greater for developing countries. Large middle-
income countries in particular might be expected to forego the ‘Special and Differential Treatment’ still
afforded developing country members of WTO, especially those also seeking membership of the OECD.
That could lead to the gains (reduced costs) to developing countries of perhaps twice that estimated for the
Doha round, that is, an extra 0.4 percent of GDP from 2025 or a total of 0.6 percent of developing country
GDP between 2004 and 2050.
In this liberal (low protection) scenario, the van der Mensbrugghe and Rosen (2010) estimates of
the cost of barriers in 2050 could be adjusted downwards by the extent of those gains from trade reform,
that is, to 0.8 percent for developing countries, 0.1 percent for high-income countries and 0.5 percent
globally (penultimate column of Table 7(b)).
Cost of trade barriers in 2050 if policies become less liberal (high protection case) Alternatively, what if the Doha round of multilateral trade negotiations were to collapse and there were no
other external trade barrier disciplines placed on national governments? The trade policy counterfactual in
that case may not be the status quo. Manufacturing tariffs may not change a lot, especially in middle- and

16
high-income countries where applied tariffs are close to the relatively low rates at which countries bound
them as part of the Uruguay Round. Even in lower-income countries there is now a broad consensus that
industrial openness is sensible in today’s globalized world of fragmented production processes. As for
agricultural distortions, export restrictions are likely to remain low apart from their sporadic use in times of
upward spikes in international prices, and export subsidies may well be used less as high-income countries
continue their move towards more-targeted forms of farm income support (particularly in the EU as it
gradually absorbs the new East European members). That same political force may restrain high-income
countries from raising their agricultural import tariffs, even if it is insufficient, without external pressure
from a new WTO agreement, to lower them. In rapidly growing developing countries, by contrast, their
continuing industrial and service sector growth and urbanization is in many cases being accompanied by
social tensions as rural areas feel left behind. Such countries may therefore follow the earlier example of
today’s high-income countries in allowing agricultural protection rates to rise (Anderson and Nelgen 2011).
Since the per capita income of developing countries is projected by 2050 to be similar to that of high-
income countries in the early 1980s, the latter’s NRA for import-competing agriculture at that time (58
percent) might provide a guide as to what to expect. However, developing countries already have binding
commitments in the WTO that prevent their average tariff from legally rising much above 45 percent
(Bouët and Laborde 2010). We therefore have chosen the high-income countries’ NRA for import-
competing agriculture in 1960-64 (46 percent) as the counterfactual for developing countries in 2050 in the
event of no further disciplines being agreed to in the WTO before then.
With those assumed distortions rates for 2050 (see final column of Table 7(a)), the van der
Mensbrugghe and Rosen (2010) estimates of the cost of developing countries’ barriers in 2050 need to be
adjusted upwards to some extent. Bearing in mind that in 2004 agricultural policies were responsible for no
less than 70 percent of the cost of all goods market distortions for developing countries and for the world,
the doubling of the agricultural distortions in developing countries by 2050 would add substantially to the
cost of distortions to those countries. For present purposes we assume it would rise from 1.4 to 1.8
percent. It would also add a little to the cost to high-income countries that are net exporters of farm
products, but we assume that would be exactly offset by the improved terms of trade for high-income
food-importing countries. That is, the cost of barriers in this case would be 0.5 percent for high-income
countries (as in 2004) and thus 1.2 percent globally (final column of Table 7(b)).
Cost in 2004 if price-distorting policies had not changed since 1980-84 According to the global distortions dataset as amended Valenzuela and Anderson (2008), in 1980–84
developing countries had an average agricultural export tax of 11 percent compared with almost zero on

17
average in 2004, while high-income countries had an average farm export subsidy of 21 percent in 1980–84
compared with just 7 percent in 2004. The average agricultural import tariff was lower for developing
countries (16 percent) in 1980–84 than for high-income countries (26 percent), as opposed to the situation
in 2004 when the two groups of countries had equivalent average tariffs on farm products of 22 percent. In
addition, tariffs on non-agricultural imports were more than three times higher in 1980–84 than in 2004 for
developing countries (26 versus 8 percent), and twice as high for high-income countries but still small at an
average of 2.4 percent as compared with 1.2 percent in 2004 (Valenzuela, van der Mensbrugghe and
Anderson 2009, Table 13.1).
How much higher would have been the cost of trade barriers if the national policies in 2004 had
instead been those that were in place in 1980-84? The Linkage model results reported in Valenzuela, van
der Mensbrugghe and Anderson (2009, Table 13.2) suggest that global welfare would have been lower by
US$233 billion
per year, or by 0.8 percent. Again, developing countries would have been hurt disproportionately, by 1.0
percent compared with 0.7 percent for high-income countries. These numbers, in conjunction with the
earlier ones for 2004 policies, suggest that between 1980-84 and 2004 the world had come about three-
fifths of the way towards free markets for goods. They imply that in 1980-84 the cost of global distortions
would have been around 1.4 percent of global income, made up of 1.9 percent for developing countries
and 1.2 percent for high-income countries. These higher numbers reflect not only the much higher rates of
price distortion in the early 1980s than recently but also the facts that (a) welfare costs are proportional to
the square of the price distortion rates and (b) developing countries accounted for just 32 percent of global
GDP in 1982 (the proxy for 1980-84) compared with 46 percent in 2004.
Cost of price-distorting policies prior to 1980 According to Table 7(a), the extent of import protection in 1962 was slightly less than in 1982 for
agriculture but much higher for manufacturing in both rich and poor countries. That would have been even
more hampering for both North-North and South-North trade in manufactures. We therefore assume it
would have raised the proportional cost of trade barriers by one-seventh for both groups of countries
compared with 1982, hence to 1.6 percent of GDP globally for 1962.
The high-income countries’ agricultural distortions in 1937 were similar to those in 1962, while
their manufacturing tariffs averaged about twice those of 1962 (the latter having been lowered following
the first few rounds of multilateral trade negotiations under the GATT). In developing countries, protection
rates in 1937 were around half those of 1962, but the heavy taxation of agricultural exports, that followed
in the wake of those countries’ independence around 1960, was also much less prior to World War II. That

18
lesser export taxation helped high-income countries via better international terms of trade, offsetting
somewhat the welfare-reducing effect for high-income countries of their higher manufacturing protection.
The cost of global trade barriers in 1937 is thus assumed to be one-quarter lower for developing countries,
and one-third higher for high-income countries, than in 1962.
The assumed agricultural distortion rates in 1925 were only one-third those in 1937 for high-
income countries, while developing country manufacturing protection was only half that of 1937. That
meant productive resources were far more efficiently employed globally in that earlier year, and so the
welfare costs are assumed to be barely half as large in 1925 as in 1937 as a share of GDP. In 1900
manufacturing protection was higher in rich countries and lower in developing countries than in 1925 while
agricultural distortions on average appear to have been similar. That would suggest a slightly greater
welfare cost for high-income countries and a slightly smaller one for developing countries.
The worst year of the Great Depression, 1931, was an outlier. Agricultural protection rates were
more than three times, and manufacturing protection as much as double, their 1925 rates. Export taxation
evaporated temporarily though, as is commonly the case when international food prices slump (Anderson
and Nelgen 2010). Since the welfare cost is proportional to the square of the distortion rate, the welfare
cost for both developing and high-income countries would have briefly spiked at nearly three times the
1925 cost as a percent of GDP.
Adjusting for elements missing from the calculus The above estimates of the costs of global trade barriers are based on the estimates for 2004 using a
standard global economy-wide model (GTAP). That standard calculus is known to underestimate trade
barrier costs for several reasons that relate to the following:12
the measurement of the tariff equivalent of non-tariff barriers to goods trade,
the averaging of tariffs at the detailed tariff line level for use at a more-aggregated level by CGE
modelers,
the measurement of distortions in markets for services and their incorporation in CGE models,
the effect of allowing financial market integration,
the inclusion of economies of scale and imperfect competition in some sectors,
allowing for product quality and variety differences, and for the emergence of new products,
12 If trade reforms were to be accompanied by reforms to domestic markets, the gains from trade opening would be
further magnified, but this is ignored here. So too is greater freedom of movement for workers through less-restrictive immigration policies (but see Anderson and Winters 2009).

19
administration, compliance and lobbying costs and, perhaps most importantly,
the growth-enhancing impacts of trade openness.
When lower-bound guesstimates for all but the last of these are used to multiply the costs of global trade
barriers in Table 7(b) – as discussed in the remainder of this section – they become those shown in Table
7(c). Adding the dynamic gains is problematic, though, because they involve an increase in the annual rate
of growth of capital and outputs, not just a permanent one-off increase in the level of GDP. Its continued
omission almost certainly ensures that even the adjusted numbers in Table 7(c) are still very much lower-
bound estimates of the retrospective and prospective costs of the world’s trade barriers.
Measuring the costs of trade barriers/benefits of trade liberalization is still an inexact science,
despite the improvements since the 1950s in quantifying the extent of price distortions due to trade-
related policies and the huge amount of progress made over the past two decades in global economy-wide
(CGE) modelling. The remainder of this section illustrates how the progress made is drawn upon to adjust
the estimates in Table 7.
Non-tariff barriers (NTBs) to goods trade It has long been recognised that the only practical way for NTBs to be incorporated comprehensively in
global economic models is for their ad valorem tariff equivalent to be estimated through comparing
domestic and border prices of like products (Baldwin 1991). This is inherently difficult and enormously time
consuming, which is why it tends to have been done only for a small sample of countries or products (Laird
1997). Fortunately there is now a set of NRA estimates from 1955 to 2007 for global agriculture that is
based on price comparisons and so includes NTBs (Anderson and Valenzuela 2008), and those estimates
have been incorporated in the Linkage model that is drawn on for the present study. Hence NRA
adjustments need to be made only for manufacturing and for pre-1955 agriculture.
A study for four high-income countries by Roningen and Yeats (1976) suggests that the average
tariff equivalents of NTBs on manufactures in 1973 were at least twice the average tariffs at that time,
making the latter largely redundant other than for revenue collecting. The difference would have been at
least as high in 1962 because NTBs were still being used for balance of payment reasons under fixed
exchange rates, and could have even higher in the beggar-thy-neighbor period of the 1930s, if not earlier. A
more comprehensive study of 16 high-income countries, accounting for 60 percent of world imports,
reveals that NTBs became more-extensively used in the early 1980s. This followed the conclusion of the
GATT’s Tokyo Round in 1979 when those countries’ tariffs had been lowered to an average of less than 8
percent, compared with five times that in the mid-1930s (Nogues, Olechowski and Winters 1986). The most
prevalent were probably the import quotas and ‘voluntary’ export restraints on textiles and clothing trade,
20
but trade in cars and steel also were commonly restricted with quantitative measures. Since the mid-1980s
many of these measures have gradually disappeared in high-income countries and to a lesser extent in
developing countries.
Adjustments to the NRAs in Table 7(a) to include the tariff equivalent of NTBs might involve
doubling those for manufactured goods from 1930 with more modest rises before that, and doubling those
for import-competing farm products prior to 1940. The anti-agricultural bias of policies in the pre-World
War II era might thereby not be altered greatly. As for the post-war era (for which NTBs on farm products
are already incorporated in the NRAs in Table 7), the boost to manufacturing protection from NTBs would
exacerbate the anti-agricultural bias in developing countries but reduce the pro-agricultural bias in high-
income countries. These two effects might be offsetting. However, the anti-trade bias of policies in 1962
and 1982 would increase within sectors in both sets of countries.
Averaging of tariffs for including in models In the Linkage model application cited in this study, the world economy has been aggregated to just 24
sectors or product groups and 52 countries or country groups. This has a number of consequences. One is
that it restricts the extent to which the model can capture the reality that firms in a policy-reforming
environment could exploit the increasing opportunities to lower costs through the recent fragmentation of
the production process into ever-more pieces whose location is footloose internationally (Hanson, Mataloni
and Slaughter 2005). A more-fundamental consequence is that it requires the averaging of price distortions
from trade policy measures. This matters because trade barriers vary enormously across 10-digit tariff lines
and across countries, and the cost of protection increases with the square of the tariff. Hiding that variation
thereby leads to underestimation of the true cost of any given ‘average’ level of protection.
Necessarily, some degree of aggregation is unavoidable in modelling the real world because the
available information on the structure of production and consumption is at a much higher level of
aggregation than information on tariffs and trade. Further aggregation is necessarily employed for
computational reasons too.
Commonly tariffs are averaged using import values as weights. This adds an additional problem
because, as protection rates rise, the weights associated with these measures decline, so that a tariff that
completely blocks trade has the same measured impact as a zero tariff.
A relatively new approach to tariff aggregation provides a possible means of dealing with the
aggregation problem (Anderson and Neary 2005). Anderson (2009) has since developed a superior tariff
aggregator that captures the welfare impacts of a non-uniform tariff regime. Building on this approach,
Laborde, Martin and van der Mensbrugghe (2011) generate a set of national tariff aggregates at the level

21
used by CGE modelers in which the aggregate tariff for a product group is that which, if applied uniformly
to all the tariff lines in that group, would allow the same level of expenditure on imported commodities in
the group as the actual tariff structure. They then use the global Linkage model to see how much difference
that method of aggregating makes to the results from liberalizing global goods trade as of 2004. They find
that the global economic welfare cost of trade barriers is 46 percent greater than that generated using the
standard tariff database (one-quarter larger for high-income countries, twice as large for developing
countries). It may have been of more significance in the past – especially when NTBs are included – because
there was probably more dispersion of tariff equivalents of border measures in the 20th century, especially
prior to the 1950s (including for agriculture).
A conservative adjustment to compensate for this missing effect and the NTB phenomenon is to
raise the estimated welfare cost for both sets of countries by 50 percent in 2004 and 2050, 40 percent in
1982, 30 percent in 1962 and 20 percent pre-World War II.
Barriers to trade in services The potential gains from trade liberalization in services are rarely considered in CGE models, or at best are
included only in rather rudimentary ways. This is because of a lack of good data on bilateral services trade,
and methodological difficulties in modelling distortions in services markets. This is a serious omission, since
there are indications that the costs of barriers to trade in services may be several times larger than the
barriers presented by conventional trade measures such as merchandise tariffs and subsidies (Dee,
Hanslow and Pham 2003; Brown, Kiyota and Stern 2005; Jensen, Rutherford and Tarr 2007; Francois and
Hoekman 2010).
Konan and Maskus (2006) point out that the costs of services distortions are likely to be larger than
those affecting merchandize trade because they typically involve restrictions not only on cross-border trade
(Mode 1 of GATS), but also on supply by establishing enterprises in the country or by the movement of
service suppliers (Modes 3 and 4 of GATS). That is, they raise the domestic cost of production of services,
including those that are nontradable internationally.
In the absence of reliable estimates of the welfare cost of services trade barriers, a conservative
adjustment to compensate for this missing effect – after amending to include the influences of NTBs and
tariff aggregation issues – is to raise by 50 percent the estimated welfare cost for 2004 and beyond. For
earlier eras, when costs of trading services were higher and so provided more of a natural barrier, the cost
of government regulation of the service sector was probably lower. We therefore raise the estimated
welfare cost of goods trade barriers by 20 percent pre-World War II, 30 percent in 1962 and 40 percent in
1982 to account for policies inhibiting services trade of both developing and high-income countries.

22
Allowing financial market integration International trade requires international financial services to transfer the required payments and often to
provide temporary credit to traders. Trade reform thus expands also the markets for financial services,
which contributes to the long-term stability of financial markets. Openness also tends to reduce inflation. It
can do so not only by increasing competition in domestic markets but also by providing more options for
people to hold savings in foreign currencies, which reduces the ability of governments to inflate savings
away (Rogoff 2003). Yet CGE models typically ignore financial markets. This is unfortunate also because
their inclusion would allow an additional set of influences on real exchange rates (see, e.g., McKibbin and
Stegman 2005).
A recent study by Hoxha, Kalemli-Ozcan and Vollrath (2009) examines potential gains from financial
integration and find that a move from autarky to full integration of financial markets globally could boost
real consumption by 7.5 percent permanently, even assuming no productivity dividend. We therefore raise
the amended welfare cost of goods and services trade barriers by 7.5 percent for both sets of countries and
all years.
Allowing economies of scale and imperfect competition We have assumed constant returns to scale and perfect competition rather than allowing firms to enjoy
increasing returns and some degree of monopoly power for their differentiated product. The so-called
‘new’ trade theory has shown how this can lead to underestimating the welfare gains from trade reform
(Krugman 2009). Empirical case studies suggest that if opening an economy exposes monopolistic firms to
greater competition and allows greater exploitation of scale economies, it generates additional gains from
trade reform that could be several times the standard estimates based on constant returns to scale and
perfect competition (see, e.g., Harris (1984) on Canada, Krishna and Mitra (1998) on India, Pavcnik (2002)
on Chile).
A study by Francois, van Meijl and van Tongeren (2005) used the comparative static global GTAP
model without and then with scale economies and imperfect competition and found that the estimated
gains from freeing global trade as of 1997 were about half as large again in the latter case. Since small
economies are more likely to benefit in this way than larger economies, other things equal, this difference
may well have been larger in earlier decades. A conservative adjustment to the amended welfare cost of
goods and services trade barriers and restrictions on financial integration is to add for both groups of
countries a further 50 percent for each of the years considered in the present study.

23
Allowing for product quality and variety differences, and new product emergence Another product aggregation issue has to do with the fact that, within any product classification, there is a
wide range of qualities and varieties available. The only way product quality or variety differences enter
most CGE models is by distinguishing between a product’s country of origin. This is done using so-called
Armington elasticities which can ensure domestically produced goods are imperfect substitutes for
imported goods in aggregate, and imports from one country are an imperfect substitute for goods
imported from any other country (Armington 1969).
In the real world, however, there is an ever-increasing array of qualities and varieties available for
any product from each supplying country. It appears consumers (including producers using those products
as intermediate inputs) are willing to pay for a greater variety of different quality products, even though
that product differentiation may be costly in terms of shorter production runs and more advertising.
Hummels and Klenow (2005) suggest that these improvements in quality are sufficiently rapid that the
prices received by countries for the products that they continue to export—as distinct from their new
exports—actually rise by 0.09 percent for each increase of 1 percent in national income. This result is at
variance with traditional Armington models, which generate a reduction in export prices when economies
grow and exports expand.
In a study of US import data from 1972 to 2001, Broda and Weinstein (2006) find that the upward
bias in the conventional import price index, because of not accounting for the growth in varieties of
products, is approximately 1.2 percent per year. Feenstra, Markusen and Zeile (1992) suggest the welfare
cost of tariff protection can be underestimated by as much as a factor of ten when this consideration is not
included in the analysis.
Also, standard models used to assess the implications of trade reforms are based on the
assumption that expansion of exports following liberalization involves increasing the volume of the
products initially being exported, but not of any other products. The Armington assumption also rules out
expanding the markets to which goods are being supplied: if exports to a particular country are initially
zero, then in most CGE models they remain zero following reform.
Recent research, however, highlights the key role of the “extensive” margin, where export
expansion involves increases in the range of products exported (Hummels and Klenow 2005) and expansion
in the range of markets supplied (Evenett and Venables 2002). Hummels and Klenow conclude that only
about one-third of the export expansion associated with economic growth comes from the “intensive
margin” where greater quantities of the same products are exported. And Evenett and Venables find that
about one-third of the expansion of exports from developing countries was obtained by exporting products
to countries to which they had not previously exported.

24
In a world where importers exhibit a preference for variety in the goods they purchase, these
observations on the importance of extensive-margin growth have major implications. Increasing the
volumes of the same products, as under the Armington assumption, has the inevitable consequence of
driving down the price of exports and causing income losses to the exporter from deterioration in the terms
of trade. Where exports are characterized by an expansion in the range of products supplied, the
preference for variety exerts a counteracting force—helping to increase the demand for exports. In
simulations introducing the Hummels-Klenow preference for variety in exports from China and India,
Dimaranan, Ianchovichina and Martin (2007) found that the terms of trade for these exporters need not
deteriorate significantly, despite very high projected rates of export growth.
Common treatments of new varieties, such as those based on monopolistic competition and a love-
of-variety inspired by Krugman (1980), typically assume they apply mainly to manufacturing. However, as
Rodrik (2004) notes, the process of discovering efficient new exports is just as important and difficult in
primary and service sectors as in manufacturing. It may be even more important in emerging economies
than in than in high-income countries. So too might issues of product quality. Jensen, Rutherford and Tarr
(2007), for example, find that the benefits of reform in services trade, when allowing for productivity
growth in trading a wider range of qualities of goods as the quality of business services rise (following
Markusen, Rutherford and Tarr 2005), completely dominate as a source of potential benefits from reforms
likely to follow Russia’s eventual accession to the WTO.
To take account of these additional three missing elements, we raise the amended welfare cost of
barriers to economic and financial integration for both groups of countries by a further 50 percent for 2004
and beyond and by 20 percent pre-World War II, 30 percent in 1962 and 40 percent in 1982.
Administration, compliance and lobbying costs Savings in bureaucratic costs of administering trade barriers, in traders’ costs of circumventing barriers
(Bhagwati and Hansen 1973), and in lobbyists costs of rent-seeking to secure or maintain trade-distorting
policies are all non-trivial elements of gains that can come from removing trade barriers, none of which are
captured in most global economic modeling. Lobbying costs potentially could absorb all of the rents
received by private agents from trade barriers, for example (Krueger 1974). For want of reliable estimates,
these costs will be assumed to add just another 10 percent each year to the amended welfare cost of
barriers to economic and financial integration.

25
Growth-enhancing impacts of reform The comparative static GTAP model used here does not measure any of the dynamic gains that come from
trade reform. Yet economists have long been convinced that participation in international trade provides a
growth dividend additional to standard improvements in allocative efficiency. Dynamic gains arise in
numerous ways. One of the more important is through encouragement of the more-efficient firms to take
over from the less efficient in each country (Melitz 2003, Trefler 2004, Bernard et al. 2007, Melitz and
Ottaviano 2008). Another way is through multinational firms sharing technologies and knowledge across
countries within the firm (Markusen 2002). Offshoring is yet another mechanism through which
heterogeneous firms are affected by trade liberalization, including via re-locating from small to larger
nations (Baldwin and Okuba 2011). The greater competition that accompanies trade reform also can
stimulate more innovation (Aghion and Griffith 2005), leading to higher rates of capital accumulation and
productivity growth (Lumenga-Neso, Olarreaga and Schiff 2005).
Based loosely on Arrow’s (1962) concept of learning-by-doing, major empirical contributions to this
literature include Feder (1983), Dollar (1992) and Sachs and Warner (1995), all of which find strong links
between export performance and economic growth. Rodriguez and Rodrik (2001) raised concerns about
the robustness of the estimated relationship between aggregate exports and productivity growth. During
the same period, Clerides, Lach and Tybout (1998) questioned the learning-by-doing framework based on
firm-level findings that exporting firms were more efficient before entering export markets, rather than
because of learning-by-doing after entering these markets. However, more-recent research on the
aggregate links between exports and productivity growth has carefully re-examined the potential
endogeneity of the relationship, and continues to find an aggregate positive relationship (Frankel and
Romer 1999). A number of subsequent firm-level studies find evidence of productivity growth associated
with learning-by-doing after firms enter exporting. Blalock and Gertler (2004) find an increase in firm
productivity of between 2 and 5 percent after Indonesian firms enter export markets. Fernandes and Isgut
(2007) find evidence of an increase in productivity from learning-by-exporting when Colombian firms
entered export markets. Van Biesebrock (2005) finds that African exporting firms had higher productivity
before entering export markets, and that their productivity levels, and their subsequent rates of
productivity growth, increased after entering export markets. Girma, Greenaway and Kneller (2004) also
find both higher initial levels of productivity and higher productivity growth rates after entry into exporting.
In a more macro study, Wacziarg and Welch (2008) estimate that countries that have liberalized
their trade (defined as raising their trade-to-GDP ratio by 5+ percentage points) enjoyed 1.5 percentage
points higher GDP growth compared with their pre-reform rate. Liberalizing international financial flows

26
also has been shown to have boosted economic growth, especially in the first wave of globalization up to
1913 (Schularick and Steger 2010).
Synopsis A single paper that brings several of the above omissions together using a numerical open economy growth
model is that by Rutherford and Tarr (2002). Its simulation model allows for product variety, imperfect
competition, economies of scale and international capital flows. It is also dynamic, so it can trace out an
adjustment path to trade reform. Furthermore, it is stochastic in that it draws randomly from uniform
probability distributions for eight key parameters of the model. The authors simulate a halving of the only
policy intervention (a 20 percent tariff on imports) and, in doing so, fully replace the government’s lost
tariff revenue with a lump-sum tax. That modest trade reform produces a welfare increase (in terms of
Hicksian equivalent variation) of 10.6 percent of the present value of consumption in their central model.
Systematic sensitivity analysis with 34,000 simulations showed that there is virtually no chance of a welfare
gain of less than 3 percent, and a 7 percent chance of a welfare gain larger than 18 percent of consumption.
Several modeling variants and sensitivity analysis on all the key parameters found that the welfare
estimates for the same ten percentage point tariff cut ranged up to 37 percent when international capital
flows are allowed, and down to 4.7 percent when using the most inefficient replacement tax (a tax of
capital). The latter result shows that even a very inefficient tax on capital is superior to the tariff as a
revenue raiser. Increasing the size of the tariff cuts beyond 50 percent results in roughly proportional
increases in the estimated welfare gains.
Those results suggest the amendments proposed for each of the omissions discussed in this section
are modest. In summary, the multipliers are the following, not including any amendment for dynamic gains
from trade:
Table 1. Summary of multipliers
Source of multiplier to trade reform gain:
1900-37 1962 1982 2004-50
NTBs and tariff averaging 1.5 1.4 1.3 1.2 Services 1.2 1.3 1.4 1.5 Financial market integration 1.075 1.075 1.075 1.075 Scale economies & imperfect competition 1.5 1.5 1.5 1.5 Product quality, variety and newness 1.2 1.3 1.4 1.5 Admin., compliance & lobbying costs 1.1 1.1 1.1 1.1
Total 3.83 4.19 4.52 4.79
When the above Total multipliers are used to reduce the under-estimates in Table 7(b) they become those
shown in Table 7(c). Combining these effects in this way may overstate the required adjustments, because
of interactions between them (that is, econometricians focusing on one or only a subset at a time may have

27
spuriously captured the effects of some of the others). However, by not including an adjustment for the
dynamic gains from trade we are still omitting what is probably the most important of the missing effects
discussed above. Adding the dynamic gains is problematic, though, because they involve an increase in the
annual rate of growth of capital and outputs, not just a permanent one-off increase in the level of GDP. Its
continued omission almost certainly ensures that even the adjusted numbers in Table 7(c) are still lower-
bound estimates of the retrospective and prospective costs of the world’s trade barriers.
Figure 1. Cost of price-distorting trade barriers as a percent of GDP, developing and high-income countries, 1900 to 2050 (percent)
high
low
high
low
02
46
81
0
190
0
205
0
192
5
193
1
193
7
196
2
198
2
200
4
High-income countries
Developing countries
Note: Low’ and ‘High’ scenarios refer to whether it is assumed that price distortions from trade barriers fall or rise
between 2004 and 2050. Source: see Table 7.

28
Figure 2. Cost of price-distorting trade barriers as a percent of GDP, the world, 1900 to 2050 (percent)
high
low
24
68
10
0
190
0
205
0
193
1
193
7
192
5
196
2
198
2
200
4
World
Note: Low’ and ‘High’ scenarios refer to whether it is assumed that price distortions from trade barriers fall or rise
between 2004 and 2050. Source: see Table 7.
Summary and conclusion The above estimates of the cost of trade barriers to developing and high-income countries are summarized
in Figure 1 and 2. If one leaves aside the spike in the Great Depression of the early 1930s, the pattern
begins with relatively low costs at the start of the 20th century, which was the tail end of the world’s first
great policy reform-driven globalization wave. Those costs did not change greatly up to the late 1920s,
were nearly three times as high in the early 1930s before falling back to two times as high by the latter
1930s, fell for high-income countries but rose further for developing countries after World War II
(associated with the transition to independence for many former colonies), before falling rapidly during the
second great globalization wave that began around the mid-1980s. Whether that fall continues over the
next four decades is by no means certain. The difficulties WTO members are having in bringing the Doha
round of multilateral trade negotiations to a successful conclusion is worrying. A collapse of those talks
means more than just not reaping the gains they are estimated to be able to provide, for two reasons: it
would diminish the chances of completing and implementing yet another round before 2050; and it would
leave open the possibility for countries whose WTO-bound tariffs and subsidies are above currently applied
rates to raise their trade barriers. Clearly a great deal hangs on the WTO membership finding the political
will to fulfil the expectations of its Doha Development Agenda. Certainly countries have the additional

29
option of creating or joining preferential trading blocs or even broader economic integration agreements –
and they will proliferate even more if Doha fails. However, they are typically choked with exceptions such
that they are poor substitutes for a comprehensive multilateral agreement from a global welfare viewpoint.
Three points need reiterating by way of conclusion. The first is to keep in mind the paucity of
historical data available to estimate the extent of price-distorting trade barriers prior to the 1960s. It means
that any estimates of the costs of trade barriers that are dependent on them necessarily are subject to a
considerable degree of uncertainty. The second is that, despite huge progress being made in building global
economy-wide models capable of analysing trade policy issues, the type of model used in the present study
still grossly under-estimates the global cost of trade barriers/benefits from trade policy reform, since
dynamic gains from trade are still omitted. And thirdly, such models are best suited to analyse situations for
which their database is pertinent. Using them to forecast or backcast many decades is necessarily an
imprecise exercise, so the results for the outlying decades especially should be viewed with that in mind as
well.

30
References Aghion, P. and R. Griffith (2005), Competition and Growth: Reconciling Theory and Evidence, Cambridge
MA: MIT Press. Anderson, J.E. (2009), ‘Consistent Trade Policy Aggregation’, International Economic Review 50(3):903-27,
August. Anderson, J.E. and J.P. Neary (2005), Measuring the Restrictiveness of International Trade Policy, Cambridge
MA: MIT Press. Anderson, K. (2003), ‘Measuring Effects of Trade Policy Distortions: How Far Have We Come?’ The World
Economy 26(4): 413-40, April. Anderson, K. (2004), ‘Subsidies and Trade Barriers’, Ch. 10 in Global Crises, Global Solutions, edited by B.
Lomborg, Cambridge and New York: Cambridge University Press. Anderson, K. (ed.) (2009), Distortions to Agricultural Incentives: A Global Perspective, 1955-2007, London:
Palgrave Macmillan and Washington DC: World Bank. Anderson, K. (ed.) (2010), The Political Economy of Agricultural Price Distortions, Cambridge and New York:
Cambridge University Press. Anderson, K. and J.L. Croser (2011), ‘Changing Contributions of Different Agricultural Policy Instruments to
Global Reductions in Trade and Welfare’, World Trade Review 10 (forthcoming). Anderson, K. and Y. Hayami (1986), The Political Economy of Agricultural Protection: East Asia in
International Perspective, Boston, London and Sydney: Allen and Unwin. Anderson, K. and B. Hoekman (eds.) (2006), The WTO’s Core Rules and Disciplines, London: Edward Elgar. Anderson, K., W. Martin and E. Valenzuela (2006), ‘The Relative Importance of Global Agricultural Subsidies
and Market Access’, World Trade Review 5(3): 357-76, November. Anderson, K., W. Martin and D. van der Mensbrugghe (2006), ‘Market and Welfare Implications of the Doha
Reform Scenarios’, Ch. 12 in Agricultural Trade Reform and the Doha Development Agenda, edited by K. Anderson and W. Martin, London: Palgrave Macmillan (co-published with the World Bank).
Anderson, K. and S. Nelgen (2010), ‘Trade Barrier Volatility and Agricultural Price Stabilization’, CEPR Discussion Paper 8102, London, November.
Anderson, K. and S. Nelgen (2011), ‘Projecting Agricultural Distortions for a 2030 GTAP database”, Contributed Paper for the 14th Annual Conference on Global Economic Analysis, Venice, 16-18 June.
Anderson, K. and H. Norheim (1993), ‘History, Geography and Regional Economic Integration’, Ch. 2 in Regional Integration and the Global Trading System, edited by K. Anderson and R. Blackhurst, London: Harvester Wheatsheaf and New York: St. Martins Press.
Anderson, K. and R. Tyers (1992), ‘Japanese Rice Policy in the Interwar Period: Some Consequences of Imperial Self Sufficiency’. Japan and the World Economy 4(2): 103-27, September.
Anderson, K. and E. Valenzuela (2008), Global Estimates of Distortions to Agricultural Incentives, 1955 to 2007, data spreadsheets at www.worldbank.org/agdistortions
Anderson, K. and L.A. Winters (2009), ‘The Challenge of Reducing International Trade and Migration Barriers’, Ch. 8 in Global Crises, Global Solutions (2nd edition), edited by B. Lomborg, Cambridge: Cambridge University Press.
Armington, P. (1969), ‘A Theory of Demand for Products Distinguished by Place of Production’, IMF Staff Papers 16(1): 159-78, March.
Arrow, K. (1962) ‘The Economic Implications of Learning by Doing’, Review of Economic Studies 29(3):155-173. June.
Balassa, B. and Associates (1971), The Structure of Protection in Developing Countries, Baltimore: Johns Hopkins University Press.
Baldwin, R.E. (1991), ‘Measuring the Effects of Nontariff Trade-Distorting Policies’, in J. De Melo and A. Sapir (eds.), Trade Theory and Economic Reform: North, South and East: Essays in Honour of Bela Balassa, Cambridge MA: Basil Blackwell.

31
Baldwin, R. and T. Okuba (2011), ‘International Trade, Offshoring and Heterogeneous Firms’, NBER Working Paper 16660, Cambridge MA, January.
Bates, R. (1981), Markets and States in Tropical Africa: The Political Basis of Agricultural Policies, Berkeley: University of California Press.
Bernard, A.B., J.B. Jensen, S.J. Redding and P.K. Schott (2007), ‘Firms in International Trade’, Journal of Economic Perspectives 21(3): 105-30, Summer.
Bértola, L. and J.G. Williamson (2006), ‘Globalization in Latin America Before 1940’, Ch. 1 in The Cambridge Economic History of Latin America, Vol. II, edited by V. Bulmer-Thomas, J.H. Coatsworth and R. Cortés Conde, Cambridge and New York: Cambridge University Press.
Bhagwati, J.N. (1971), ‘The Generalized Theory of Distortions and Welfare’, in Trade, Balance of Payments and Growth, edited by J.N. Bhagwati et al., Amsterdam: North-Holland.
Bhagwati, J.N. (1978), Foreign Trade Regimes and Economic Development: Anatomy and Consequences of Exchange Control Regimes, Cambridge, MA: Ballinger.
Bhagwati, J.N. and B. Hansen (1973), 'A Theoretical Analysis of Smuggling', Quarterly Journal of Economics 87(2): 172-87, May.
Blalock, G. and P. Gertler (2004), ‘Learning from Exporting Revisited in a Less Developed Setting’, Journal of Development Economics 75: 397–416.
Bouët, A. and D. Laborde (2010), ‘Assessing the Potential Cost of a Failed Doha Round’, World Trade Review 9(2): 319–351.
Broda, C.M. and D.E. Weinstein (2006), ‘Globalization and the Gains from Variety’, Quarterly Journal of Economics, 121(2): 541-85.
Brown, D.K., K. Kiyota and R.M. Stern (2005), ‘Computational Analysis of the Free Trade Area of the Americas (FTAA)’, North American Journal of Economics and Finance 16: 153-85.
Bulmer-Thomas, V. (1994), The Economic History of Latin America Since Independence, Cambridge and New York: Cambridge University Press.
Clemens, M.A. and J.G. Williamson (2010), ‘Endogenous Tariffs and Growth: Asia versus Latin America, 1870-1940’, mimeo, Harvard University, Cambridge MA, June.
Clerides, S., Lach, S. and Tybout, J. (1998), ‘Is Learning by Exporting Important? Micro-dynamic Evidence from Colombia, Mexico and Morocco’, Quarterly Journal of Economics 113(3): 903-47.
Corden, W.M. (1997), Trade Policy and Economic Welfare, (revised edition), Oxford: Clarendon Press. Deardorff, A.V. (2005), ‘A Centennial of Anti-dumping Legislation and Implementation: Introduction and
Overview’, The World Economy 28(5): 633-40, May. Dee, P., Hanslow, K. and D.T. Pham (2003), ‘Measuring the Cost of Barriers to Trade in Services’, in T. Ito
and A.O. Krueger (eds.), Services Trade in the Asia-Pacific Region, Chicago: University of Chicago Press for the NBER.
Diebold, W., Jr. (1952), The End of the ITO, International Finance Section, Essays in International Finance No. 16, Princeton NJ: Princeton University Press.
Dimaranan, B., E. Ianchovichina and W. Martin (2007), Competing with Giants: Wwho Wins, Who Loses? Ch. 3 in L.A. Winters and S. Yusuf (eds.), Dancing with Giants: China, India and the Global Economy, Washington DC: World Bank.
Dollar, D. (1992), Outward-oriented developing economies really do grow more rapidly: evidence from 95 LDCs, 1976–1985, Economic Development and Cultural Change 40(3): 523–44.
Evenett, S. and A. Venables (2002), ‘Export Growth in Developing Countries: Market Entry and Bilateral Trade Flows’, mimeo, November. Available at www.alexandria.unisg.ch/Publikationen/22177
Feder, G. (1983), ‘On Exports and Economic Growth’, Journal of Development Economics 12: 59-73. Feenstra, R.C. (1995), ‘Estimating the Effects of Trade Policy’, in G.N. Grossman and K. Rogoff (eds.),
Handbook of International Economics, Vol. 3, Amsterdam: Elsevier. Feenstra, R.C., J.R. Markusen and W. Zeile (1992), ‘Accounting for Growth with New Inputs’, American
Economic Review 82(2): 415-21, May.

32
Fernandes, A. and A. Isgut (2007), ‘Learning-by-Exporting Effects: Are They for Real?’ MPRA Working Paper No. 3121, http://mpra.ub.uni-muenchen.de/3121/.
Finger, J.M. (2002), ‘Safeguards: Making Sense of GATT/WTO Provisions Allowing Import Restrictions’, Ch. 22 in Development, Trade and the WTO: A Handbook, edited by B. Hoekman, A. Mattoo and P. English, Washington DC: World Bank.
Francois, J.F. and B. Hoekman (2010), ‘Services Trade and Policy’, Journal of Economic Literature 48(3): 642-92, September.
Francois, J.F. and W. Martin (2004), ‘Commercial Policy, Bindings and Market Access’, European Economic Review 48: 665-79, June.
Francois, J.F. and W. Martin (2010), ‘Ex Ante Assessments of the Welfare Impacts of Trade Reforms with Numerical Models’, Ch. 13 (pp. 379-434) in New Developments in Computable General Equilibrium Analysis for Trade Policy, edited by H. Beladi and E.K. Choi, London: Emerald Group Publishing.
Francois, J.F., van Meijl, H. and van Tongeren, F. (2005), ‘Trade Liberalization in the Doha Development Round’, Economic Policy 20 (42): 349-91.
Frankel, J.A. and D. Romer (1999), ‘Does Trade Cause Growth?’ American Economic Review 89(3): 379-99, June.
GATT (1972), Basic Documentation of the Tariff Study, Geneva: GATT Secretariat. GATT (1978), Network of World Trade by Areas and Commodity Classes, 1955 to 1976, GATT Studies in
International Trade No. 7, Geneva: GATT Secretariat. Girma, S., D. Greenaway and R. Kneller (2004), ‘Does Exporting Increase Productivity? A Microeconometric
Analysis of Matched Firms’, Review of International Economics 12(5): 855–866. Gootiiz, B. and A. Mattoo (2009), ‘Restrictions on Services Trade and FDI in Developing Countries’, mimeo,
World Bank, Washington DC. Haberler, G. (1958), Trends in International Trade: A Report by a Panel of Experts, Geneva: General
Agreement on Tariffs and Trade, October. Harris, R.G. (1984), ‘Applied General Equilibrium Analysis of Small Open Economies with Scale Economies and
Imperfect Competition’, American Economic Review 74(5): 1016–32, December. Hertel, T.W. (ed.) (1997), Global Trade Analysis: Modeling and Applications, Cambridge and New York:
Cambridge University Press. Hoxha, I., S. Kalemli-Ozcan and D. Vollrath (2009), ‘How Big are the Gains from International Financial
Integration?’, NBER Working Paper 14636, Cambridge MA, January. Hummels, D. and P. Klenow (2005), ‘The Variety and Quality of a Nation’s Exports’, American Economic
Review 95(3): 704-23. Irwin, D. (1996), Against the Tide: An Intellectual History of Free Trade, Princeton NJ: Princeton University
Press. Irwin, D. (2010), ‘Trade Restrictiveness and Deadweight Losses from U.S. Tariffs, 1859-1961’, American
Economic Journal: Economic Policy 2(3): 111–133, August. Jacks, D.S., C. Meissner and D. Novy (2010), ‘Trade Booms, Trade Busts, and Trade Costs’, Journal of
International Economics 83: 185-201, November. Jacks, D.S. and K. Pendakur (2010), ‘Global Trade and the Maritime Transport Revolution’, Review of
Economics and Statistics 92(4): 745-55, November. Jensen, J., T. Rutherford and D. Tarr (2007), ‘The Impact of Liberalizing Barriers to Foreign Direct Investment
in Services: The Case of Russian Accession to the World Trade Organization’, Review of Development Economics 11(3): 482-506, August.
Keller, W., B. Li, and C. Hua Shiue (2010), ‘China’s Foreign Trade: Perspectives from the Past 150 Years’, CEPR Discussion Paper 8118, Centre for Economic Policy Research, London, November.
Kindleberger, C.P. (1975), ‘The Rise of Free Trade in Western Europe, 1820-1875’, Journal of Economic History 35(1): 20-55, March.
Kindleberger, C.P. (1989), ‘Commercial Policy Between the Wars’, in P. Mathias and S. Pollard (eds.), The Cambridge Economic History of Europe, vol. 8. Cambridge: Cambridge University Press.

33
Konan, D. and K. Maskus (2006), ‘Quantifying the Impact of Services Liberalization in a Developing Country’, Journal of Development Economics 81(1): 142-62.
Krishna, P., and D. Mitra (1998), ‘Trade Liberalization, Market Discipline and Productivity Growth: New Evidence from India’, Journal of Development Economics 56: 447-62.
Krueger, A.O. (1974), ‘The Political Economy of the Rent-seeking Society’, American Economic Review 64(3): 291–303.
Krueger, A.O. (1978), Foreign Trade Regimes and Economic Development: Liberalization Attempts and Consequences, Cambridge, MA: Ballinger.
Krugman, P. (1980), ‘Scale Economies, Product Differentiation, and the Pattern of Trade’, American Economic Review 70(5): 950-59.
Krugman, P. (2009), ‘The Increasing Returns Revolution in Trade and Geography’, American Economic Review 99(3): 561-71, June.
Laborde, D., W. Martin and D. van der Mensbrugghe (2011), ‘Measuring the Benefits of Global Trade Reform with Optimal Aggregators of Distortions’, Ch. 11 in W. Martin and A. Mattoo (eds.), The Doha Development Agenda, Washington DC: World Bank (forthcoming).
Laird, S. (1997), ‘Quantifying Commercial Policies’, Ch. 2 in Francois, J.F. and K.A. Reinert (eds.), Applied Methods in Trade Policy Analysis: A Handbook, Cambridge and New York: Cambridge University Press.
League of Nations (1927), Tariff Level Indices, Geneva: League of Nations. League of Nations (1939), Review of World Trade 1938, Geneva: League of Nations. Liepmann, H. (1938), Tariff Levels and the Economic Unity of Europe, London: Allen and Unwin. Lin, J.Y., F. Cai and Z. Li (1996), The China Miracle: Development Strategy and Economic Reform, Hong Kong: The
Chinese University Press for the International Center for Economic Growth. Lindert, P.H. (1991), ‘Historical Patterns of Agricultural Policy’, in C. Timmer (ed.), Agriculture and the State:
Growth, Employment, and Poverty, Ithaca NY: Cornell University Press. Little, I.M., T. Scitovsky and M. Scott (1970), Industry and Trade in Some Developing Countries: A
Comparative Study, London: Oxford University Press for the OECD. Lloyd, P.J. (1974), ‘A More General Theory of Price Distortions in an Open Economy’, Journal of
International Economics 4(4): 365-86, November. Lloyd, P.J. (2008), ‘100 Years of Tariff Protection in Australia’, Australian Economic History Review 48(2): 99-
145, July. Lumenga-Neso, O., M. Olarreaga and M. Schiff (2005), ‘On ‘Indirect’ Trade-Related R&D Spillovers’,
European Economic Review 49(7): 1785-98, October. Maddison, A. (2008), Historical Statistics of the World Economy: 1-2008 AD, available at
http://www.ggdc.net/maddison/ Maizels, A. (1963), Industrial Growth and World Trade, Cambridge: Cambridge University Press. Markusen, J., T. Rutherford and D. Tarr (2005), ‘Foreign Direct Investment in Services and the Domestic
Market for Expertise’, Canadian Journal of Economics 38(3): 758-77. Martin, W. (1997), ‘Measuring Welfare Changes with Distortions’, Ch. 3 in Francois, J.F. and K.A. Reinert
(eds.), Applied Methods in Trade Policy Analysis: A Handbook, Cambridge and New York: Cambridge University Press.
Martin, W. and K. Anderson (2012), ‘Export Restrictions and Price Insulation During Commodity Price Booms’, American Journal of Agricultural Economics 94(1), January (forthcoming).
Martin, W. and A. Mattoo (eds.) (2011), The Doha Development Agenda, Washington DC: World Bank (forthcoming).
McKibbin W. and A. Stegman (2005) ‘Asset Markets and Financial Flows in General Equilibrium Models’, pp. 3-16 in Quantitative Tools for Microeconomic Policy Analysis, Canberra: Productivity Commission.

34
Meade, J. (1942), ‘A Proposal for an International Commercial Union’, unpublished Cabinet paper reproduced in The World Economy 10: 399-407, 1987, and in S. Meade (ed.), The Collected Papers of James Meade, Volume III: International Economics, London: Unwin Hyman, 1988.
Melitz, M.J. (2003), ‘The Impact of Trade on Intra-industry Reallocations and Aggregate Industry Productivity’, Econometrica 71(6): 1692-1725.
Melitz, M.J. and G.I.P. Ottaviano (2008), ‘Market Size, Trade and Productivity’, Review of Economic Studies 75(1): 295-316, January.
Narayanan, G., and T.L. Walmsley (eds.) (2008), Global Trade, Assistance, and Production: The GTAP 7 Data Base. West Lafayette, IN: Center for Global Trade Analysis, Purdue University. http://www.gtap.org.
Nogues, J.J., A. Olechowski, and L.A. Winters (1986), ‘The Extent of Nontariff Barriers to Industrial Countries' Imports’, World Bank Economic Review 1(1): 181-99.
OECD (2006), Producer and Consumer Support Estimates, OECD Database 1986-2005. http://www.oecd.org.
Pavcnik, N. (2002), ‘Trade Liberalization, Exit, and Productivity Improvements: Evidence from Chilean Plants’, Review of Economic Studies 69: 245-76.
Rodrigeuz, F. and D. Rodrik (2001), ‘Trade Policy and Economic Growth: A Skeptic’s Guide to Cross-National Evidence’, in B.S. Bernanke and K.S. Rogoff (eds.), NBER Macroeconomics Annual 2000, Cambridge MA: MIT Press.
Rogoff, K.S. (2003), ‘Disinflation: An Unsung Benefit of Globalization,’ Finance and Development 40(4): 54-55, December.
Roningen, V. and A Yeats (1976), ‘Nontariff Distortions of International Trade: Some Preliminary Empirical Evidence’, Weltwirtschaftliches Archiv 122(4): 613-25, December.
Rutherford, T.F. and D.G. Tarr (2002), ‘Trade Liberalization, Product Variety and Growth in a Small Open Economy: A Quantitative Assessment’, Journal of International Economics 56(2): 247-72.
Sachs, J.D. and A. Warner (1995), ‘Economic Reform and the Process of Global Integration’, Brookings Papers on Economic Activity 1: 1-95.
Sah, R. and J.E. Stiglitz (1992), Peasants versus City-Dwellers: Taxation and the Burden of Economic Development, London: Oxford University Press.
Schularick, M. and T.M. Steger (2010), ‘Financial Integration, Investment, and Economic Growth: Evidence from Two Eras of Financial Globalization’, Review of Economics and Statistics 92(4): 756-68, November.
Swinnen, J.F.M. (2010), ‘Agricultural Protection Growth in Europe, 1870 to 1969’, Ch. 6 in The Political Economy of Agricultural Price Distortions, edited by K. Anderson, Cambridge and New York: Cambridge University Press.
Trefler, D. (2004), ‘The Long and Short of the Canada-US Free Trade Agreement’, American Economic Review 94(4): 870-895, September.
Tyers, R. and K. Anderson (1992), Disarray in World Food Markets: A Quantitative Assessment, Cambridge and New York: Cambridge University Press.
van Biesebrock, J. (2005), ‘Exporting Raises Productivity in Sub-Saharan African Manufacturing Firms’, Journal of International Economics 67: 373-91.
Valenzuela, E. and K. Anderson (2008), ‘Alternative Agricultural Price Distortions for CGE Analysis of Developing Countries, 2004 and 1980-84’, GTAP Research Memorandum No 13, December. Available at www.gtap.agecon.purdue.edu/resources
Valenzuela, E., D. van der Mensbrugghe and K. Anderson (2009), ‘General Equilibrium Effects of Price Distortions on Global markets, Farm Incomes and Welfare’, Ch. 13 in Distortions to Agricultural Incentives: A Global Perspective, 1955-2007, edited by K. Anderson, London: Palgrave Macmillan and Washington DC: World Bank.
van der Mensbrugghe, D. (2005), ‘LINKAGE Technical Reference Document: Version 6.0’, mimeo, World Bank, Washington DC, January and at www.worldbank.org/prospects/linkagemodel

35
van der Mensbrugghe, D. and R. Rosen (2010), ‘Climate, Trade and Development’, Paper presented at the 13th Global Economic Analysis Conference, Penang, 9-11 June.
Venables, A.J. (2004), ‘Small, Remote and Poor’, World Trade Review 3(3): 453-57, November. Venables, A.J. and N. Limao (2002), ‘Geographic Disadvantage: a Heckscher-Ohlin-von Thunen Model of
International Specialization’, Journal of International Economics 58: 239-63. Viner, J. (1924), ‘The Most-Favored-Nation Clause in American Economic Treaties’, Journal of Political
Economy 32(1), February. (Reprinted as Ch. 1 in his International Economics: Studies by Jacob Viner, Glencoe IL: The Free Press.)
Wacziarg, R. and K.H. Welch (2008), ‘Trade Liberalization and Growth: New Evidence’, World Bank Economic Review 15(3): 393-429, October.
Woytinsky, W.S. and E.S. Woytinsky (1955), World Commerce and Governments: Trends and Outlook, New York: Twentieth Century Fund.
WTO (2010), World Trade Statistics 2009, Geneva: World Trade Organization.
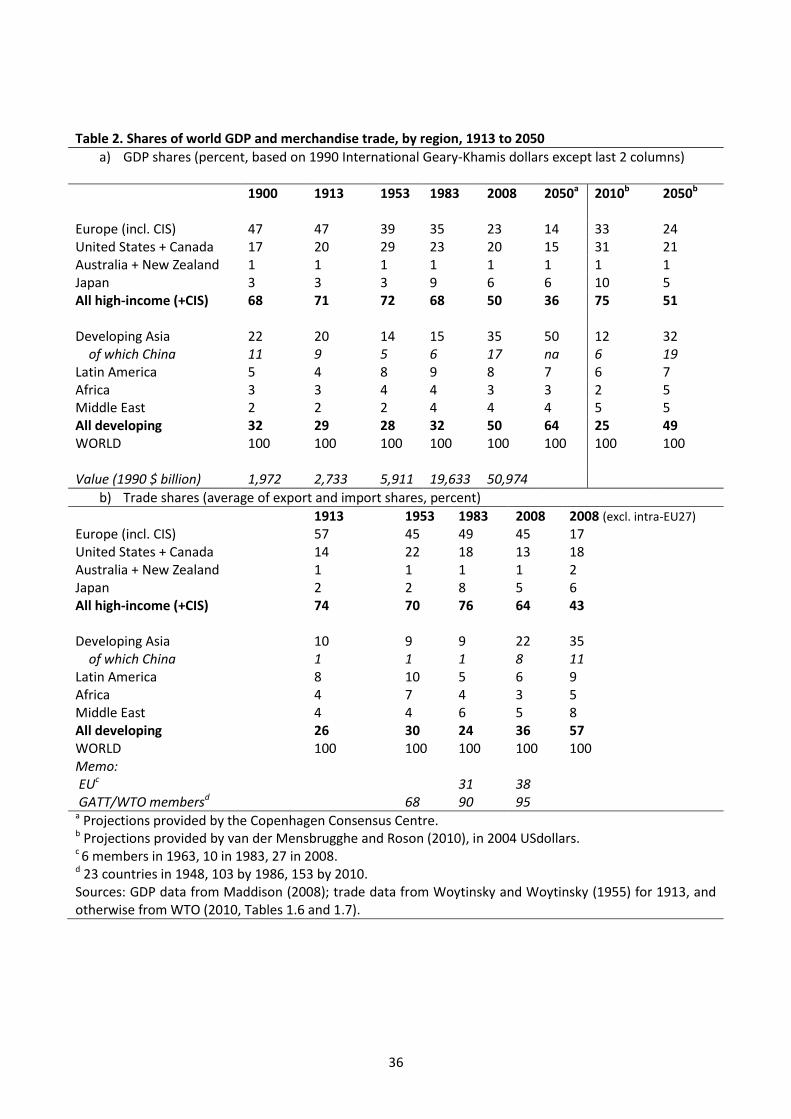
36
Table 2. Shares of world GDP and merchandise trade, by region, 1913 to 2050
a) GDP shares (percent, based on 1990 International Geary-Khamis dollars except last 2 columns)
1900 1913 1953 1983 2008 2050a
2010b
2050b
Europe (incl. CIS) 47 47 39 35 23 14 33 24 United States + Canada 17 20 29 23 20 15 31 21 Australia + New Zealand 1 1 1 1 1 1 1 1 Japan 3 3 3 9 6 6 10 5 All high-income (+CIS) 68 71 72 68 50 36 75 51 Developing Asia 22 20 14 15 35 50 12 32 of which China 11 9 5 6 17 na 6 19 Latin America 5 4 8 9 8 7 6 7 Africa 3 3 4 4 3 3 2 5 Middle East 2 2 2 4 4 4 5 5 All developing 32 29 28 32 50 64 25 49 WORLD 100 100 100 100 100 100 100 100 Value (1990 $ billion) 1,972 2,733 5,911 19,633 50,974
b) Trade shares (average of export and import shares, percent)
1913 1953 1983 2008 2008 (excl. intra-EU27)
Europe (incl. CIS) 57 45 49 45 17 United States + Canada 14 22 18 13 18 Australia + New Zealand 1 1 1 1 2 Japan 2 2 8 5 6 All high-income (+CIS) 74 70 76 64 43 Developing Asia 10 9 9 22 35 of which China 1 1 1 8 11 Latin America 8 10 5 6 9 Africa 4 7 4 3 5 Middle East 4 4 6 5 8 All developing 26 30 24 36 57 WORLD 100 100 100 100 100 Memo: EUc 31 38 GATT/WTO membersd 68 90 95 a Projections provided by the Copenhagen Consensus Centre. b Projections provided by van der Mensbrugghe and Roson (2010), in 2004 USdollars. c 6 members in 1963, 10 in 1983, 27 in 2008. d 23 countries in 1948, 103 by 1986, 153 by 2010. Sources: GDP data from Maddison (2008); trade data from Woytinsky and Woytinsky (1955) for 1913, and otherwise from WTO (2010, Tables 1.6 and 1.7).

37
Table 3. Import tariffs on manufactures, key trading countries, 1902 to 1970 (percent)
1902 1913 1925 1937 1950 1955 1962 1970
Europe Austria 16 27 18 Belgium 13 9 15 11 11 7 11 6 Czechoslovakia 18 27 Denmark 19 14 10 3 France 34 20 21 17 18 19b 11 6 Germany 25 13 20 14 26 16b 11 6 Greece 39 Hungary 18 27 Italy 27 18 22 25 24b 11 6 Netherlands 3 4 6 11 6 Norway 12 14 11 10 11 Poland 32 Portugal 18 Russia 131 Spain 76 41 41 Sweden 23 20 16 13 9 6 7 7 Switzerland 7 9 14 13 8 3 United Kingdom 17a 23 17b Yugoslavia 23 Other high-income countries
Australia 32c 31 31 45 25 22 22 24 New Zealand 21 22 23 Japan 1 20 13 11 14b 16 12 United States 54 30 24 28 12 11 12 9 Canada 17 26 23 16 12b 12 14 Developing countries
Argentina 28 29 Brazild 40e 70 29 Chile 34 39 India 3 4 16 29 30
Notes: a 1931 b 1952 c 1903-04 d Import duties as a % of the value of imports were (often well) above 30
percent in 1913 also for Paraguay, Peru, Uruguay and Venezuela, according to Bulmer-Thomas (1994, pp. 141-42). Sources: League of Nations (1927), Little, Scitovsky and Scott (1970), Woytinsky and Woytinsky (1955), Maizels (1963), Irwin (2010, Table A1) for the United States, Lloyd (2008, Table 5) for Australia and, for other 1970 estimates, GATT (1972)
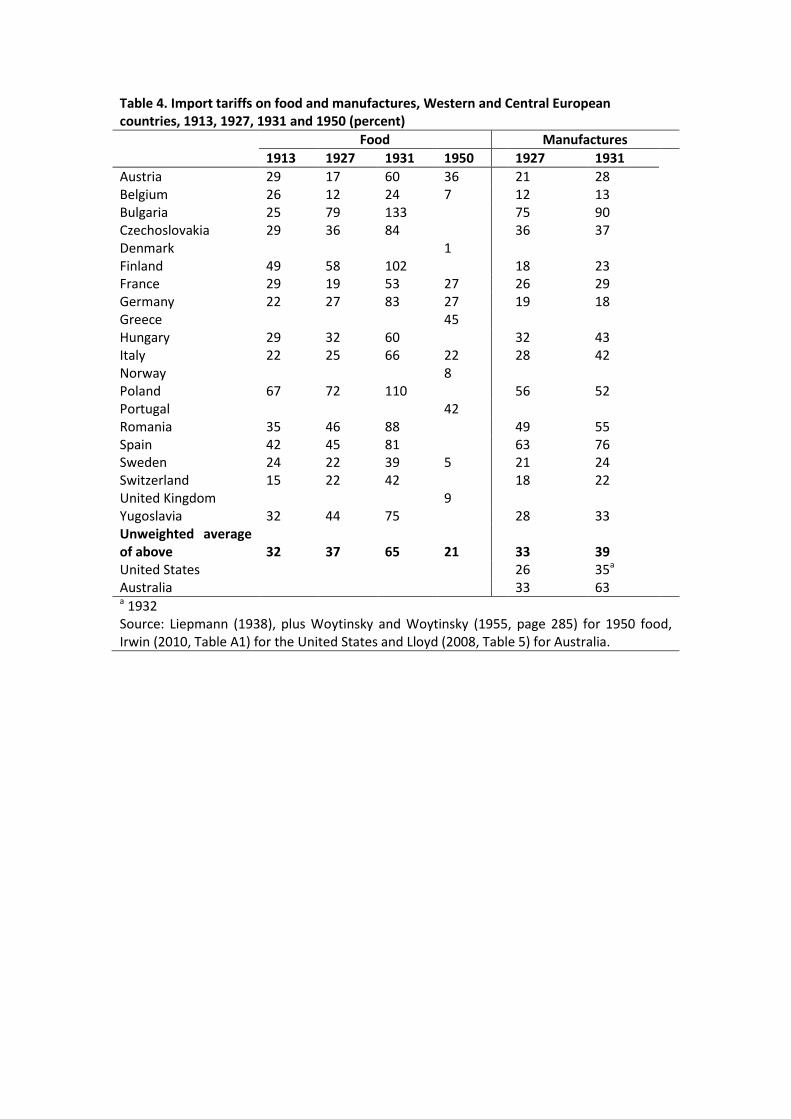
Table 4. Import tariffs on food and manufactures, Western and Central European countries, 1913, 1927, 1931 and 1950 (percent)
Food Manufactures
1913 1927 1931 1950 1927 1931
Austria 29 17 60 36 21 28 Belgium 26 12 24 7 12 13 Bulgaria 25 79 133 75 90 Czechoslovakia 29 36 84 36 37 Denmark 1 Finland 49 58 102 18 23 France 29 19 53 27 26 29 Germany 22 27 83 27 19 18 Greece 45 Hungary 29 32 60 32 43 Italy 22 25 66 22 28 42 Norway 8 Poland 67 72 110 56 52 Portugal 42 Romania 35 46 88 49 55 Spain 42 45 81 63 76 Sweden 24 22 39 5 21 24 Switzerland 15 22 42 18 22 United Kingdom 9 Yugoslavia 32 44 75 28 33 Unweighted average of above
32
37
65
21
33
39
United States 26 35a Australia 33 63 a 1932 Source: Liepmann (1938), plus Woytinsky and Woytinsky (1955, page 285) for 1950 food, Irwin (2010, Table A1) for the United States and Lloyd (2008, Table 5) for Australia.

2
Table 5. Import tariffs on manufactures, major developing countries, 1870 to 1938 (import duties as a percent of total imports)
1870-99 1900-13 1913-38 Weight, based on GDP in 1900
Asia China 3 3 11 41.1 India 3 5 17 32.1 Indonesia 5 5 10 6.0 Mynmar 4 11 23 1.5 Philippines 10 21 8 0.9 Sri Lanka 6 7 13 0.9 Thailand 4 7 15 1.1 Average, Asiaa 4 5 13 83.6 Latin America Argentina 26 23 18 2.5 Brazil 35 40 23 2.3 Chile 19 18 22 1.1 Colombia 34 47 29 0.8 Cuba 23 26 26 0.4 Mexico 17 22 21 3.5 Peru 32 23 16 0.6 Uruguay 30 33 20 0.4 Average, LAa 25 28 21 11.5 Egypt 11 14 26 1.9 Turkey 7 10 31 2.8 Average, all 17a 7 8 15 100 a Averages are weighted by this chapter’ author, using 1900 GDP as weights (see final column), from Maddison (2008). This set of countries accounts for 76 percent of all of today’s developing country GDP in 1900, which in turn is 35 percent of global GDP o 1900. Source: Clemens and Williamson (2010, Table 8).

3
Table 6. Nominal rates of assistance to agricultural and nonagricultural tradables, by region, 1955 to 2004 (percent)
1955-59
1960-64
1965-69
1970-74
1975-79
1980-84
1985-89
1990-94
1995-99
2000-04
Developing countriesa
NRA agriculture na -24 -27 -32 -26 -21 -16 -4 4 7
- exportables na -47 -45 -45 -44 -41 -36 -19 -6 -3
- import-competing na 13 14 8 13 17 38 23 22 23
NRA non-agric. tradables na 58 60 46 37 35 27 17 10 6
European transition econs. NRA agriculture na na na na na na na 10 18 16
- exportables na na na na na na na -3 -1 -1
- import-competing na na na na na na na 33 35 36
NRA non-agric. tradables na na na na na na na 10 6 5
High-income countries NRA agriculture 23 31 37 27 35 43 56 48 37 34
- exportables 4 7 14 10 11 12 22 16 8 7
- import-competing 31 46 50 37 47 58 71 62 54 51
NRA non-agric. tradables 7.5 8.5 7.7 5.4 3.6 3.4 3.2 2.5 1.7 1.3
Worlda
NRA agriculture na 6 8 1 3 6 19 20 18 19
- exportables na -23 -20 -23 -25 -24 -17 -7 -1 0
- import-competing na 35 37 27 34 38 57 43 38 36
NRA non-agric. tradables na 19 21 16 14 10 10 8 6 4 a Estimates for China pre-1981 and India pre-1965 are based on the assumption that the agricultural NRAs in
those years were the same as the average NRA estimates for those countries for 1981-84 and 1965-69, respectively, and that the value of production in those missing years is that which gives the same average share of value of production in total world production in 1981-84 and 1965-69, respectively. Source: Author’s derivation, using data in Anderson and Valenzuela (2008), based on a sample of more than 40 developing countries and more than a dozen of Europe’s transition economies in addition to all OECD member countries.

4
Table 7. Assumed NRAs and their estimated welfare cost to developing and high-income countries,a 1900 to 2050
a) NRAs (percent)
1900 1925 1931 1937 1962 1982 2004 2050 Low
2050 High
Developing countries NRA agriculture -15 -15 5 -14 -24 -21 9 6 19
- exportables -20 -20 0 -20 -47 -41 0 0 0
- import-competing 5 5 20 10 13 17 22 16 46
NRA non-agric. tradables 10 15 30 30 58 35 8 4 8
High-income countriesb
NRA agriculture 10 10 30 30 31 43 16 9 15
- exportables 0 0 0 0 7 12 7 0 5
- import-competing 15 15 50 45 46 58 22 14 22
NRA non-agric. tradables 30 23 37 21 11 3 1 1 1
b) Lower-bound estimates of welfare cost (percent of GDP), extrapolated from simplest global economy-wide model for 2004
1900 1925 1931 1937 1962 1982 2004 2050 Low
2050 High
Developing countries 0.8 0.9 2.8 1.7 2.2 1.9 0.9 0.8 1.8 High-income countriesb 1.1 1.0 2.7 1.9 1.4 1.2 0.5 0.1 0.5 World 1.0 1.0 2.7 1.8 1.6 1.4 0.6 0.5 1.2
c) Amended estimates of welfare cost (percent of GDP), after adjusting for some elementsc missing from the simplest global economy-wide modeling
1900 1925 1931 1937 1962 1982 2004 2050 Low
2050 High
Developing countries 3.1 3.4 10.7 6.5 9.2 8.6 4.3 3.8 8.6
High-income countriesb 4.2 3.8 10.3 7.3 5.9 5.4 2.4 0.5 2.4
World 3.8 3.8 10.3 6.9 6.7 6.3 2.9 2.4 5.7 a
The weights used to obtain regional and global averages for 1900 to 1937 are as follows: exportables are four-fifths of agriculture in developing countries and one-third in high-income countries; and developing countries are one-quarter of both global agriculture and global non-agricultural tradables. The NRAs for 1962 and 1982 are the averages for the 5-year periods 1960-64 and 1980-84, respectively. The ‘Low’ and ‘High’ in the final two columns refer to whether it is assumed that price distortions from trade barriers fall or rise between 2004 and 2050, as shown in the final two columns of part (a) above. b
High-income countries include Eastern Europe and the former Soviet Union (whose NRAs are assumed to equal the averages for high-income countries). c Based on guesstimates of the impact of missing elements discussed in the text, from which on the cost of
trade barriers are made so as to be able to multiply the estimates in part (b) to obtain those in part (c) above (which do not include any adjustment for the growth dividend expected to result from openness). Source: Author’s compilation from Tables 2 and 3 and from global Linkage model results and as described in text.


![Barriers to Trade[1]](https://static.fdocuments.in/doc/165x107/577d240c1a28ab4e1e9b7c83/barriers-to-trade1.jpg)