Assessment of WIC Cost- Containment Practices
342
Economic Research Service Electronic Publications from the Food Assistance & Nutrition Research Program Assessment of WIC Cost- Containment Practices Final Report By John A. Kirlin, Nancy Cole, and Christopher Logan, Abt Associates Inc. ERS project representative: Phil Kaufman Abstract The Special Supplemental Nutrition Program for Women, Infants, and Children (WIC) pro- vides both nutrition education and supplemental foods for pregnant, breastfeeding, and post- partum women, infants, and children. These supplemental foods contain nutrients that nutri- tional research has found may otherwise be lacking in the diets of WIC recipients. State WIC agencies have implemented practices designed to reduce the cost of food packages containing these prescribed foods. For instance, one of the WIC program’s primary cost-saving practices is negotiating rebate contracts with manufacturers of infant formula. Additional practices include limiting authorized vendors to stores with lower food prices; limiting approved brands, package sizes, forms, or prices; and negotiating rebates with food manufacturers or suppliers. There is concern that these practices may inadvertently counter the program’s goal of providing supplemental foods and nutrition education. Based on a review of cost-contain- ment practices in six States, including interviews with the various stakeholders and analysis of WIC administrative files, the study draws three major conclusions: (1) cost-containment practices reduced average food package costs by 0.2 to 21.4 percent, depending on practices implemented and local conditions; (2) the cost-containment practices had few adverse out- comes for WIC participants; and (3) administrative costs of the practices were low, averaging about 1.5 percent of food package savings. A summary of this report, Assessment of WIC Cost-Containment Practices: Executive Summary, is also available online at www.ers.usda.gov/publications/efan03004. Keywords: WIC Program, cost-containment, food-item restrictions, vendor restrictions, man- ufacturers’ rebates, food package costs E-FAN-03-005 February 2003
Transcript of Assessment of WIC Cost- Containment Practices
EconomicResearchService
Electronic Publications from the Food Assistance & Nutrition Research Program
Assessment of WIC Cost-Containment Practices
Final Report
By John A. Kirlin, Nancy Cole, and Christopher Logan, Abt Associates Inc.
ERS project representative: Phil Kaufman
Abstract
The Special Supplemental Nutrition Program for Women, Infants, and Children (WIC) pro-vides both nutrition education and supplemental foods for pregnant, breastfeeding, and post-partum women, infants, and children. These supplemental foods contain nutrients that nutri-tional research has found may otherwise be lacking in the diets of WIC recipients. State WICagencies have implemented practices designed to reduce the cost of food packages containingthese prescribed foods. For instance, one of the WIC program’s primary cost-saving practicesis negotiating rebate contracts with manufacturers of infant formula. Additional practicesinclude limiting authorized vendors to stores with lower food prices; limiting approvedbrands, package sizes, forms, or prices; and negotiating rebates with food manufacturers orsuppliers. There is concern that these practices may inadvertently counter the program’s goalof providing supplemental foods and nutrition education. Based on a review of cost-contain-ment practices in six States, including interviews with the various stakeholders and analysisof WIC administrative files, the study draws three major conclusions: (1) cost-containmentpractices reduced average food package costs by 0.2 to 21.4 percent, depending on practicesimplemented and local conditions; (2) the cost-containment practices had few adverse out-comes for WIC participants; and (3) administrative costs of the practices were low, averagingabout 1.5 percent of food package savings.
A summary of this report, Assessment of WIC Cost-Containment Practices: ExecutiveSummary, is also available online at www.ers.usda.gov/publications/efan03004.
Keywords: WIC Program, cost-containment, food-item restrictions, vendor restrictions, man-ufacturers’ rebates, food package costs
E-FAN-03-005
February 2003
Acknowledgments
The other authors and I would like to thank the many individuals who helped with this study andassisted with preparation of this final report.
At the U.S. Department of Agriculture, Economic Research Service, Phil Kaufman served as ProjectOfficer for the study. In this capacity, he played a major role in developing the study’s statement ofwork and its overall research design. He coordinated all contacts with the Food and Nutrition Serviceof USDA, and offered valuable assistance during data collection and analysis. Finally, he led andcoordinated the technical review of this final report; the scope and content of the report bear hisimprint in many ways.
Also at ERS, David Smallwood, Betsey Kuhn, and James Blaylock provided important support andoversight. Gerald Plato assisted in the early stages of the study with its research design. Both he andElizabeth Frazao served as technical reviewers for numerous drafts of the report and providedvaluable comments. Linda Hatcher and Courtney Knauth provided editorial assistance. At FNS,Dawn Aldridge provided important input into both the contract award and technical review of drafts.
A great appreciation goes to the WIC program directors and staff in the six States that participated inthis study: California, Connecticut, North Carolina, Ohio, Oklahoma, and Texas. In addition toparticipating in lengthy interviews about their cost-containment practices, they provided data files andother critical information needed for the study. We thank them for their full cooperation and assist-ance, and for the comments they provided on a draft of this report.
We also wish to thank the many WIC participants, vendors, and other stakeholders who responded toour requests for information during the course of the study. We interviewed nearly 1,300 WIC parti-cipants, collected price data from over 100 WIC vendors, collected detailed point-of-sale informationon WIC transactions in nearly 600 supermarkets, and conducted focus groups with participants whohad dropped out of WIC. We also conducted interviews with representatives of the Food MarketingInstitute, the Grocery Manufacturers of America, the National Grocers Association, the National WICAssociation, the Private Label Manufacturers Association, and the national and regional offices of theFNS. To all these individuals, vendors, and groups, we extend our heartfelt thanks.
Many individuals at Abt Associates and its subcontractors for the study helped with the analysis orpreparation of the final report. Charles Pappas of SmartSource Direct recruited the supermarkets thatprovided WIC transaction data, and Terry Stewart of Marketing Resources International conductedthe focus groups with WIC dropouts. At Abt Associates, John Straubinger and Michael Harnett weresurvey directors for the study. Nancy McGarry and Ellie Lee served as the study’s programmers, andMary Kay Crepinsek, Dave Rodda, Joanna Golding, and Lisa Litin helped with the analyses. ChrisHolm participated in the interviews with State and local officials. Finally, Fred Glantz and NancyBurstein helped review the final report, and Susan Byers Paxson directed its production, with assist-ance from Jan Nicholson. Our thanks go to all our colleagues who worked with us on this project.
John A. KirlinProject DirectorAbt Associates Inc.
Summary
The Food and Nutrition Service of the U.S. Department of Agriculture (USDA), together with desig-nated State agencies, administers the Special Supplemental Nutrition Program for Women, Infants,and Children (WIC). The WIC program provides both nutrition education and supplemental foodscontaining nutrients determined by nutritional research to be lacking in the diets of pregnant, breast-feeding, and postpartum women, infants, and children. Funding is provided by FNS to State WICagencies through annual appropriations from Congress. Each State’s cash grant includes a food grantand a Nutrition Services and Administration (NSA) grant. In FY2001, food grants totaled $3.0billion, or approximately 73 percent of the total cash grant. Cost savings through infant formularebates provided an additional $1.5 billion in funding; FNS estimates that the rebates would supportabout 28 percent of the WIC caseload.
In an effort to ensure the best use of available funds and to provide for participation by all eligibleindividuals, State WIC agencies have implemented practices designed to reduce the cost of foodpackages containing these prescribed foods. For instance, one of the WIC program’s primary cost-saving practices is negotiating rebate contracts with manufacturers of infant formula. Additionalpractices include limiting authorized food vendors (such as supermarkets and grocery stores) tooutlets with lower food prices; limiting food-item selection according to brand, package size, form, orprice (for instance, requiring purchase of least cost items); and negotiating rebates with foodmanufacturers or suppliers.
Concerns have been raised that State cost-containment practices may have adverse effects on WICparticipants. As part of the William F. Goodling Child Nutrition Reauthorization Act of 1998, theU.S. Congress directed the Economic Research Service, USDA, to assess the impacts of WIC cost-containment practices on the following outcome measures: program participation; access andavailability of prescribed foods; voucher redemption rates and actual food selections by participants;participants on special diets or specific food allergies; participant use and satisfaction of prescribedfoods; achievement of positive health outcomes; and program costs.
To estimate and understand the relationships between State WIC cost-containment practices, programcosts, and WIC participant outcomes, the study selected six States for detailed examination: Cali-fornia, Connecticut, North Carolina, Ohio, Oklahoma, and Texas. These States represented a mixtureof practices. Throughout this study, outcomes in States with specific practices are compared withoutcomes in States without those practices. Information on practices and outcomes was collectedfrom program administrative data, interviews with State and local officials, interviews with WICparticipants, a survey of WIC food prices and item availability, supermarket transaction data, andfocus groups of WIC dropouts.
Three major findings resulted from this study: (1) cost-containment practices implemented in Cali-fornia, Connecticut, Oklahoma, and Texas were successful in reducing average food package costs bysubstantial amounts; (2) cost-containment practices were associated with few adverse outcomes forWIC participants, and (3) State and local office administrative costs attributed to cost-containmentpractices were relatively minor compared with associated food cost savings.
Although the case study States represent the range of cost-containment practices in use, these findingsmay not apply to all States. Outcomes may differ depending on ongoing efforts by States to findthose restrictions that both reduce food package costs and are acceptable to participants. Selecting

and managing appropriate cost-containment practices is therefore a dynamic process, requiringongoing attention to price and availability of approved food items, as well as participant preferences.States therefore need the flexibility to find the right balance between food cost reductions and limitson participant choice and use.
vii
Contents
Summary
Chapter 1: Introduction.................................................................................................................1Purpose of Study...........................................................................................................1Study Approach ............................................................................................................2Data Sources .................................................................................................................5
State WIC Administrative Data.........................................................................5Interviews with State and Local WIC Officials..................................................6Survey of WIC Participants ..............................................................................6Survey of the Price and Availability of WIC Food Items ...................................7WIC Transaction Data from Supermarkets........................................................7Focus Group Discussions with WIC Program Dropouts ....................................8Interviews with Concerned Stakeholders...........................................................8
Report Organization ......................................................................................................9
Chapter 2: State Cost-Containment Practices and Their Administrative Costs ....................... 11Introduction ................................................................................................................ 11Summary of Findings .................................................................................................. 12
Vendor Restrictions ........................................................................................ 12Food-Item Restrictions ................................................................................... 12Manufacturer Rebates ..................................................................................... 13Administrative Costs ...................................................................................... 13
Data Sources ............................................................................................................... 13Interview Topics............................................................................................. 14
Overview of Vendor Authorization Process and Criteria.............................................. 15Use of Food Prices in Vendor Authorization................................................................ 16
Collecting Price Information........................................................................... 16Standards for Vendor Prices............................................................................ 17Response to Excessive Vendor Prices ............................................................. 19Summary of Vendor Restrictions Based on Prices........................................... 20Use of Food Price Information to Limit Payments to Vendors......................... 20
Food-Item Restrictions ................................................................................................ 21Restrictions on Authorized Food Types........................................................... 23Least Expensive Brand Requirements ............................................................. 23Private-Label or Store-Brand Restrictions ....................................................... 24Package-Size Restrictions ............................................................................... 26Summary of Food-Item Restrictions................................................................ 26Communicating and Enforcing Food-Item Restrictions ................................... 26
Manufacturer Rebates ................................................................................................. 28Administrative Costs of Cost-Containment Practices ................................................... 30
viii
Chapter 3: Approved Foods and Food Selection.........................................................................33WIC-Approved Foods .................................................................................................33Actual Food Selections................................................................................................37
Survey Data on Purchases ...............................................................................37WIC Transaction Data ....................................................................................42
Chapter 4: Food Costs and Food Cost Savings ...........................................................................49Research Approach......................................................................................................50
Overview........................................................................................................50Standardized and Nonstandardized Estimates ..................................................53Estimation Procedure......................................................................................54
Analysis Results ..........................................................................................................57Milk................................................................................................................59Eggs ...............................................................................................................60Cheese............................................................................................................61Legumes .........................................................................................................61Cereal .............................................................................................................61Infant Cereal ...................................................................................................62Juice ...............................................................................................................62Infant Juice .....................................................................................................63Estimates of State Savings ..............................................................................63
Chapter 5: Access to WIC Vendors and Availability of Prescribed Foods ................................67Research Approach......................................................................................................67Participant Access to WIC Vendors .............................................................................68Availability of Prescribed Foods..................................................................................72
Availability of Different Types or Varieties of WIC Foods..............................76Nonpurchase of WIC Items Due to Their Being Out of Stock..........................86
Chapter 6: Participant Satisfaction With and Use of Prescribed Foods ....................................89Research Approach......................................................................................................89Participant Preferences and Binding Constraints ..........................................................91Cheese .......................................................................................................................92Cereal .......................................................................................................................97Summary of Findings ................................................................................................101
Cheese..........................................................................................................102Cereal ...........................................................................................................102Dried Beans or Peas......................................................................................103Milk..............................................................................................................103Eggs .............................................................................................................103Infant Cereal .................................................................................................103Juice .............................................................................................................104Peanut Butter ................................................................................................104
ix
Chapter 7: WIC Participants with Special Diets or Food Allergies ......................................... 105Possible Effects of Cost-Containment Practices ......................................................... 105Research Approach ................................................................................................... 106Special Diets ............................................................................................................. 106
Health-Related Special Diets............................................................................ 107Religious and Vegetarian Diets ........................................................................ 108
Food Allergies .......................................................................................................... 109Problems Finding Appropriate Food Items ................................................................ 112Satisfaction With and Use of Prescribed Foods.......................................................... 113Summary .................................................................................................................. 115
Chapter 8: Food Instrument Redemption................................................................................. 117Research Approach ................................................................................................... 117Issuance and Redemption Process ............................................................................. 118Rate of Food Instrument Pickup ................................................................................ 120Rate of Food Instrument Redemption ........................................................................ 122Effects of Food-Item Restrictions on Redemption...................................................... 122
Theory............................................................................................................. 123Data................................................................................................................. 124Model Specification......................................................................................... 126Analysis Results .............................................................................................. 128
Partial Redemption of Food Instruments.................................................................... 128Conclusions .............................................................................................................. 130
Chapter 9: Program Participation ............................................................................................ 131Research Approach ................................................................................................... 131WIC Program Dropouts............................................................................................. 131
Milk................................................................................................................. 134Eggs ................................................................................................................ 134Cereal .............................................................................................................. 134Juice ................................................................................................................ 135Cheese............................................................................................................. 135
Conclusions .............................................................................................................. 137
Chapter 10: Health Outcomes ................................................................................................... 139Research Approach.................................................................................................. 140
Overview......................................................................................................... 140Outcome Measures .......................................................................................... 141Relationship Between Outcome Measures and Definitions of Analysis Sample 142Analysis Samples............................................................................................. 144Estimation Procedures ..................................................................................... 146
Results .................................................................................................................... 147Birthweight...................................................................................................... 147Change in Height-for-Age................................................................................ 148Anemia............................................................................................................ 149Underweight .................................................................................................... 149
Conclusions............................................................................................................. 150
x
Chapter 11: Summary and Conclusions ....................................................................................151Summary of Findings...............................................................................................151Main Findings by Outcome Measure........................................................................152
Food Costs and Food Cost Savings ...............................................................152Administrative Costs of Cost-Containment Practices.....................................153Access to Vendors ........................................................................................153Availability of Prescribed Foods ...................................................................154Participant Satisfaction With and Use of Prescribed Foods ............................154Impacts on Participants with Special Diets or Food Allergies ........................157Food Instrument Redemption ........................................................................157Program Participation ...................................................................................159Health Outcomes ..........................................................................................159
Main Findings by Cost-Containment Practice...........................................................160Competitive Pricing at Application ...............................................................160Requiring Purchase of Least Expensive Brands .............................................161Limiting Approved Brands............................................................................162Limiting Approved Types of Foods...............................................................162Limiting the Allowed Packaging of Foods.....................................................163Manufacturer Rebates ...................................................................................164Multiple Food-Item Restrictions....................................................................164
Implications of the Findings for Other States............................................................165
xi
List of Appendices
Appendix A: Survey of WIC Participants
Appendix B: Survey of Food Prices and Item Availability
Appendix C: WIC Transaction Data
Appendix D: Interviews With Stakeholders
Appendix E: State Cost-Containment Practices
Appendix F: Administrative Costs of Cost-Containment
Appendix G: Use of Food Price Information to Limit Payments to Vendors
Appendix H: WIC Food Packages, as Defined in the Code of Federal Regulations
Appendix I: Participant Satisfaction With and Use of Prescribed Foods, Selected FoodCategories
Appendix J: Models of Participant Satisfaction With and Use of Prescribed Foods
Appendix K: Models of Health Outcomes
xii
List of Tables
Chapter 1: IntroductionTable 1-1—Summary of State cost-containment practices in FY2001 ............................3
Chapter 2: State Cost-Containment Practices and Their Administrative CostsTable 2-1—Vendor authorization criteria and frequency in the study States .................16Table 2-2—Use of food prices in vendor authorization ................................................18Table 2-3—Summary of food-item restrictions, spring 2001........................................27Table 2-4—Dollar value of manufacturer rebates (nonformula) ...................................30Table 2-5—Administrative costs of cost-containment in the study States .....................32
Chapter 3: Approved Foods and Food SelectionTable 3-1—WIC-approved foods as of January 2001...................................................34Table 3-2—Distribution of WIC family purchases, by food category ...........................39Table 3-3—Expenditure distribution of scanned WIC purchases, by major food
category....................................................................................................43Table 3-4—Quantity distribution of scanned WIC purchases, by food category ...........45
Chapter 4: Food Costs and Food Cost SavingsTable 4-1—Distribution of WIC participants in the six case study States .....................57Table 4-2—Average standardized food category costs per participant month (PPM) ....58Table 4-3—Estimated food cost savings per participant month, based on standardized
food packages and a standard distribution of participants amongcertification categories..............................................................................59
Table 4-4—Estimated food cost savings per participant month, based on actual foodpackages prescribed and actual distribution of participants amongcertification categories..............................................................................64
Table 4-5—Estimates of food package savings ............................................................66
Chapter 5: Access to WIC Vendors and Availability of Prescribed FoodsTable 5-1—Participant access to store where they usually used their WIC food
instruments ...............................................................................................69Table 5-2—Comparison of access to regular and WIC stores .......................................71Table 5-3—Same versus different stores for regular and WIC shopping.......................73Table 5-4—Minimum variety requirements for WIC inventory....................................75Table 5-5—Availability of approved milk in WIC stores .............................................77Table 5-6—Availability of approved cheese in WIC stores ..........................................79Table 5-7—Availability of approved eggs in WIC stores .............................................80Table 5-8—Availability of approved infant cereals in WIC stores................................81Table 5-9—Availability of approved juices in WIC stores ...........................................82Table 5-10—Availability of approved dried beans or peas in WIC stores .....................84Table 5-11—Availability of approved breakfast cereals in WIC stores.........................85Table 5-12—Respondents giving “store ran out” as the main reason for not buying a
food item.................................................................................................87
xiii
Chapter 6: Participant Satisfaction With and Use of Prescribed FoodsTable 6-1—Major food-item restrictions imposed, by State and food category............. 90Table 6-2—WIC families facing binding constraints on food choices .......................... 92Table 6-3—Satisfaction with, purchase, and consumption of cheese ............................ 94Table 6-4—Reasons for not purchasing or consuming prescribed cheese ..................... 96Table 6-5—Binding constraints and participant satisfaction with and use of prescribed
cheese ...................................................................................................... 97Table 6-6—Satisfaction with, purchase, and consumption of cereal ............................. 99Table 6-7—Reasons for not purchasing or consuming prescribed cereal .................... 100Table 6-8—Binding constraints and participant satisfaction with and use of prescribed
cereal ..................................................................................................... 101
Chapter 7: WIC Participants with Special Diets or Food AllergiesTable 7-1—WIC families with special diets............................................................... 107Table 7-2—WIC families with food allergies or intolerances ..................................... 110Table 7-3—WIC families with food allergies ............................................................ 111Table 7-4—WIC families with dietary restrictions who report problems finding
appropriate foods when shopping for WIC.............................................. 112
Chapter 8: Food Instrument RedemptionTable 8-1—Average number of food instruments issued per participant per month .... 118Table 8-2—Distribution of most common food instruments in each State .................. 119Table 8-3—Rate of food instrument pickup by month of certification period ............. 121Table 8-4—Rate of food instrument pickup by certification category......................... 121Table 8-5—Food instruments redeemed .................................................................... 122Table 8-6—Food category restrictions by State ......................................................... 124Table 8-7—Redemption rates by number of restrictions ............................................ 125Table 8-8—Redemption rates by food category ......................................................... 126Table 8-9—Partial redemptions of WIC food instruments by food category (not
buying “all” items) ................................................................................. 129
Chapter 9: Program ParticipationTable 9-1—Program dropout rates............................................................................. 132
Chapter 10: Health OutcomesTable 10-1—Sample sizes for health outcomes analyses .......................................... 146Table 10-2—Estimated relationship between food instrument redemption and health
outcomes............................................................................................. 148
Chapter 11: Summary and ConclusionsTable 11-1—WIC families facing binding constraints on food choices..................... 156Table 11-2—Use of WIC food instruments .............................................................. 158Table 11-3—Health outcomes ................................................................................. 160Table 11-4—Estimated savings per participant per month from requiring purchase
of least expensive brands ..................................................................... 162Table 11-5—Estimated savings per participant per month from restrictions on
allowed types of food .......................................................................... 163

xiv
List of Figures
Chapter 1: IntroductionFigure 1-1—Impacts of cost-containment practices ......................................................4
Chapter 10: Health OutcomesFigure 10-1—Definition of WIC participant cohorts for health outcomes analysis ....144
1
Chapter 1Introduction
The Food and Nutrition Service (FNS) of the U.S. Department of Agriculture (USDA), together withdesignated State agencies, administers the Special Supplemental Nutrition Program for Women,Infants, and Children (WIC). The WIC program provides both nutrition education and supplementalfoods containing nutrients determined by nutritional research to be lacking in the diets of pregnant,breastfeeding, and postpartum women, infants, and children. Funding is provided by FNS to StateWIC agencies through annual appropriations from Congress. Each State’s cash grant includes a foodgrant and a Nutrition Services and Administration (NSA) grant. In FY2001, food grants totaled $3.0billion, or approximately 73 percent of the total cash grant. Cost savings through infant formularebates provided an additional $1.5 billion in funding; FNS estimates that the rebates would supportabout 28 percent of the WIC caseload.
In an effort to ensure the best use of available funds and to provide for participation by all eligibleindividuals, State WIC agencies have implemented practices designed to reduce the cost of foodpackages containing these prescribed foods. For instance, one of the WIC program’s primary cost-saving practices is negotiating rebate contracts with manufacturers of infant formula. Additionalpractices include limiting authorized food vendors (such as supermarkets and grocery stores) tooutlets with lower food prices; limiting food-item selection according to brand, package size, form, orprice (for instance, requiring purchase of least cost items); and negotiating rebates with foodmanufacturers or suppliers.
Concerns have been raised that vendor-selection practices may reduce WIC participants’ access toauthorized vendors, and that item-selection practices and manufacturers’ rebates may reduce partici-pant satisfaction with allowed food items. Lower satisfaction may lead to lower consumption ofcertain foods or a decision to leave the program. In either case, the cost-containment practices mayhave the inadvertent effect of countering the program’s goal: to provide supplemental foods andnutrition education in order to safeguard and improve nutritional intake, birth outcomes, childdevelopment, and health outcome measures.
Purpose of Study
As part of the William F. Goodling Child Nutrition Reauthorization Act of 1998, the U.S. Congressdirected the Economic Research Service (ERS), USDA, to assess the impacts of WIC cost-contain-ment practices on the following outcome measures: 1
• Program participation• Access and availability of prescribed foods• Voucher redemption rates and actual food selections by participants• Participants on special diets or specific food allergies• Participant use and satisfaction of prescribed foods
1 In accordance with the legislation authorizing this study, the impacts of infant formula rebates were not assessed duringthis research.
2
• Achievement of positive health outcomes• Program costs
In a competitive bidding process, ERS contracted with Abt Associates Inc. in September 1999 toconduct this research study. This report presents the findings of the study.
Study Approach
The study examines the relationships between State WIC cost-containment practices, program costs,and WIC participant outcomes. Prior research has identified possible practices to lower WICprogram food costs,2 but little is known about the specific impacts, both on participants and StateWIC agencies, of various measures taken to ensure benefits to all eligible mothers and children.
There is considerable variation in cost-containment practices used by State WIC agencies. Becauseof the potential differences in the use and implementation of these practices by States, ERS decidedupon a case study research design that would serve to identify the linkages between various types ofcost-containment and Agency and participant outcomes. After a detailed State-by-State review ofWIC cost-containment practices, six States were selected for case study: California, Connecticut,North Carolina, Ohio, Oklahoma, and Texas.3 These States represent a mixture of practices and, inparticular, they had practices that were thought to be restrictive enough to have measurable outcomes.Throughout this study, those outcomes in States with specific practices are compared with outcomesin States without those practices.
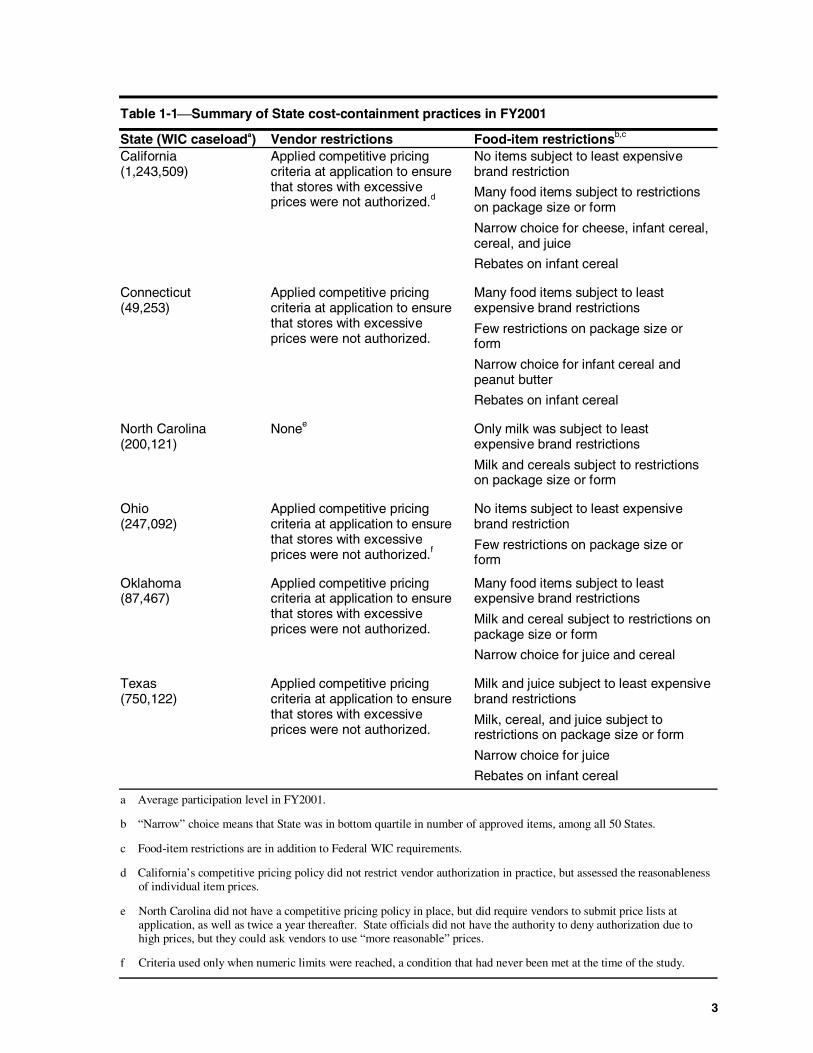
As displayed in table 1-1, five of the six States (all but North Carolina) applied competitive pricingcriteria at vendor application to ensure that stores with excessive prices were not authorized to partici-pate. Connecticut, Oklahoma, and Texas, however, were the only States with explicit thresholds forprice above which stores could not be authorized; the study treats these three States as the “restric-tive” States (with respect to vendor restrictions) when comparing outcomes between restrictive andnonrestrictive States.4
All six States imposed food-item restrictions according to price, brand, package size or form, ornumber of allowed types within a food category. North Carolina and Ohio, however, had relativelyfew food-item restrictions; they were selected for the study to represent States without such restric-tions. The States imposing specific restrictions varied by food category, so the “restricted” group ofStates also varies by food category in the analyses.
California, Connecticut, and Texas contracted with a single manufacturer for rebates on infant cereal.From a participant’s perspective, such rebates are similar to State limits on allowed brands, and thestudy treats these two cost-containment practices similarly with regard to their impact on participants.
2 Food Assistance: A Variety of Practices May Lower the Cost of WIC, GAO/RCED-97-225, September 17, 1997.
3 The study’s interim report describes the process followed in selecting the six case study States. See John A. Kirlin andNancy Cole, Assessment of WIC Cost-Containment Practices: An Interim Report to Congress, Economic ResearchService, Washington, DC, February 2001 (electronic publication E-FAN-01-005).
4 In California, price thresholds were used to identify excessive prices for individual items, not to deny authorization tovendors. Ohio’s use of competitive pricing applied only when numeric limits were reached, a condition that had neverbeen met at the time of the study.
3
Table 1-1Summary of State cost-containment practices in FY2001
State (WIC caseloada) Vendor restrictions Food-item restrictionsb,c
California(1,243,509)
Applied competitive pricingcriteria at application to ensurethat stores with excessiveprices were not authorized.d
No items subject to least expensivebrand restriction
Many food items subject to restrictionson package size or form
Narrow choice for cheese, infant cereal,cereal, and juice
Rebates on infant cereal
Connecticut(49,253)
Applied competitive pricingcriteria at application to ensurethat stores with excessiveprices were not authorized.
Many food items subject to leastexpensive brand restrictions
Few restrictions on package size orform
Narrow choice for infant cereal andpeanut butter
Rebates on infant cereal
North Carolina(200,121)
Nonee Only milk was subject to leastexpensive brand restrictions
Milk and cereals subject to restrictionson package size or form
Ohio(247,092)
Applied competitive pricingcriteria at application to ensurethat stores with excessiveprices were not authorized.f
No items subject to least expensivebrand restriction
Few restrictions on package size orform
Oklahoma(87,467)
Applied competitive pricingcriteria at application to ensurethat stores with excessiveprices were not authorized.
Many food items subject to leastexpensive brand restrictions
Milk and cereal subject to restrictions onpackage size or form
Narrow choice for juice and cereal
Texas(750,122)
Applied competitive pricingcriteria at application to ensurethat stores with excessiveprices were not authorized.
Milk and juice subject to least expensivebrand restrictions
Milk, cereal, and juice subject torestrictions on package size or form
Narrow choice for juice
Rebates on infant cereal
a Average participation level in FY2001.
b “Narrow” choice means that State was in bottom quartile in number of approved items, among all 50 States.
c Food-item restrictions are in addition to Federal WIC requirements.
d California’s competitive pricing policy did not restrict vendor authorization in practice, but assessed the reasonablenessof individual item prices.
e North Carolina did not have a competitive pricing policy in place, but did require vendors to submit price lists atapplication, as well as twice a year thereafter. State officials did not have the authority to deny authorization due tohigh prices, but they could ask vendors to use “more reasonable” prices.
f Criteria used only when numeric limits were reached, a condition that had never been met at the time of the study.
4
This study does not provide national estimates of the impacts of WIC cost-containment practicesbecause the six case study States were not randomly selected. In addition, the results of this study, forany of the six case study States, cannot be considered representative of any State outside of the study.Instead, as the case study approach allows, the focus is on understanding the linkages betweenspecific cost-containment practices, or combinations of practices, and their outcomes.
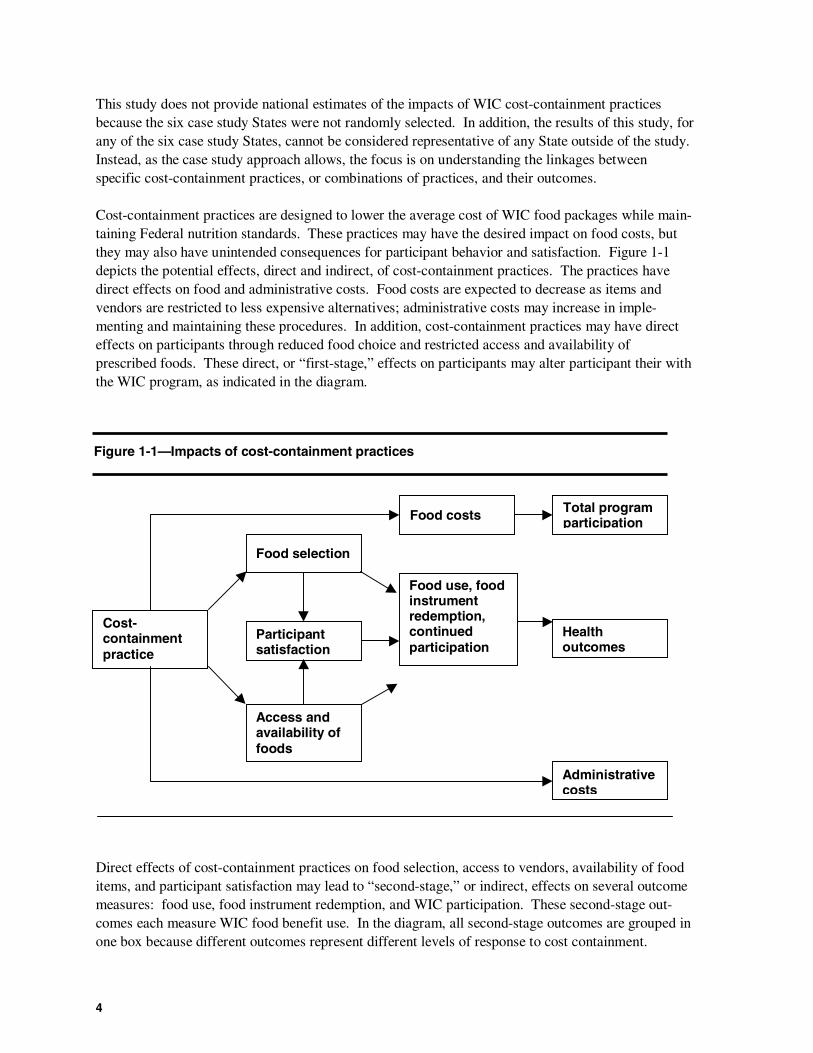
Cost-containment practices are designed to lower the average cost of WIC food packages while main-taining Federal nutrition standards. These practices may have the desired impact on food costs, butthey may also have unintended consequences for participant behavior and satisfaction. Figure 1-1depicts the potential effects, direct and indirect, of cost-containment practices. The practices havedirect effects on food and administrative costs. Food costs are expected to decrease as items andvendors are restricted to less expensive alternatives; administrative costs may increase in imple-menting and maintaining these procedures. In addition, cost-containment practices may have directeffects on participants through reduced food choice and restricted access and availability ofprescribed foods. These direct, or “first-stage,” effects on participants may alter participant their withthe WIC program, as indicated in the diagram.
Direct effects of cost-containment practices on food selection, access to vendors, availability of fooditems, and participant satisfaction may lead to “second-stage,” or indirect, effects on several outcomemeasures: food use, food instrument redemption, and WIC participation. These second-stage out-comes each measure WIC food benefit use. In the diagram, all second-stage outcomes are grouped inone box because different outcomes represent different levels of response to cost containment.
Cost-containmentpractice
Food selection
Participantsatisfaction
Access andavailability offoods
Food use, foodinstrumentredemption,continuedparticipation
Food costs Total programparticipation
Healthoutcomes
Administrativecosts
Figure 1-1—Impacts of cost-containment practices
5
Finally, figure 1-1 shows how cost-containment practices may have an effect on health outcomes. Ifcost-containment practices cause WIC participants to leave the program or to reduce their consump-tion of WIC foods, then potential health benefits of WIC supplemental foods may be lost. WICfoods, however, are only one of many factors that affect health, and it is beyond the scope of thisstudy to isolate the singular impacts of changes in consumption of WIC foods on participants’health.5 The study instead examines whether health outcomes are correlated with food instrumentredemption rates, which in turn may be affected by cost-containment practices. If cost-containmentpractices are found to impact redemption rates, and if changes in health outcomes are correlated withredemption rates, then the possible link between cost-containment practices and health outcomescould be further explored in a separate study.
Data Sources
The analysis of the impacts of WIC cost-containment practices relies on a variety of data sources,including both extant data and data collected from the case study States specifically for this study.These data include:
• State WIC administrative data• Interviews with State and local WIC officials• A survey of WIC participants• A store survey of the price and availability of WIC food items• WIC transaction data collected from supermarkets• Focus groups with participants who dropped out of the WIC program• Interviews with other concerned stakeholders
Each data source is summarized below.
State WIC Administrative Data
Two types of State administrative data were collected: participant certification records and foodinstrument data.
Statewide administrative records for WIC participants were obtained from the six case study States attwo points in time: November 2000 and April 2001. These files contain demographic characteristicsof WIC participants and certification information such as nutritional risks, health status, food packageprescription, and income level.
Statewide food instrument data were collected from each State for a 4-month period, from November2000 through February 2001. The data typically include one record for each WIC food instrumentissued, with data elements indicating its status (issued, paid, rejected, or void), date paid, and paymentamount.
Administrative data on participants from November 2000 provided the sampling frame for the study.Three geographic areas were selected for primary data collection within each State, representingurban, suburban, and rural areas. Selection of geographic areas was based on caseload counts, with
5 It is important to note that WIC is designed to supplement the diet and does not provide for all dietary needs.
6
selection proportionate to caseload size. Primary data collections in the three geographic areas werethe Survey of WIC Participants, the store survey, and the interviews with State and local WICagencies.
Administrative data were also used for several lines of analyses. Statewide participant records wereused to characterize participants for the analyses of food instrument redemption and to explore theassociation between redemption and change in health status (as measured from the November andApril certification files). Food instrument data were used to measure food instrument redemptionrates for each State and to examine the relationship between food instrument redemption and healthoutcomes.
Interviews with State and Local WIC Officials
Interviews were conducted with representatives of all six State WIC Agencies selected for the study.These interviews, held between May and August 2001, provided information on the procedures forapplying cost-containment measures, the results of the measures, staff time and other costs devoted tomaintenance of the measures, and views of State staff on the impacts of cost-containment measureson program costs and participant outcomes.
In addition, three local agencies representing urban, suburban, and rural areas were selected in eachState for telephone interviews. These agencies provided information on local agency involvement in,and experience with, cost-containment measures—principally the provision of training and assistanceto participants about food-item restrictions. The local agency interviews were conducted betweenJuly and September 2001.
Survey of WIC Participants
The Survey of WIC Participants interviewed a total of 1,285 WIC families in the six States.6 Allrespondents were sampled from the same study sites selected for the interviews with local WIC offi-cials. Interviews were conducted between February and June 2001. For the 12.3 percent of sampledparticipants who could not be reached by telephone, interviews were conducted by field staff at parti-cipants’ homes. The overall survey response rate was 77 percent.
The Survey of WIC Participants collected information about the following topics:
• Satisfaction with WIC food items• Food instrument pickup• Food item purchase, consumption, and preferences• Participant access to WIC vendors• Program participation• Presence of special diets or food allergies• Health referrals• Participant demographics
6 The Survey of WIC Participants was designed and conducted specifically for this study. It is not to be confused withUSDA’s National Survey of WIC Participants and Their Local Agencies (NSWP), conducted in 1998.
7
Appendix A presents information about sampling for the survey, as well as response rates bysampling stratum. A copy of the survey instrument is included at the end of the appendix.
Survey of the Price and Availability of WIC Food Items
The Survey of Food Prices and Item Availability collected price information and data on food itemavailability from a sample of 150 food stores in the six case study States. Eighteen WIC-authorizedvendors were sampled in each State, and up to 12 non-WIC food stores were sampled in four Stateswith vendor restrictions: California, Connecticut, Ohio, and Texas.7 WIC and non-WIC stores weresampled separately from two different population universes.8
Data collectors visited each sampled store and checked on the price and availability of over 400 fooditems approved for WIC under Federal guidelines. Differences in food prices between State-approved and nonapproved food items are used to estimate cost savings from food-item restrictions.
Sampling procedures for the Survey of Food Prices and Item Availability and a copy of the surveyinstrument are included in appendix B.
WIC Transaction Data from Supermarkets
In retail food stores that scan food item bar codes at the checkout, the store’s point-of-sale (POS)system automatically creates a record of the scanned item. The record typically includes a descriptorof the scanned item, the price paid for the item, the dollar amount of any manufacturer or storecoupons/discounts applied to the item, the method of payment (for instance, cash, check, or creditcard), the date and time of the transaction, and a store and checkout lane identifier. In many POSsystems, the individual item records also contain a unique transaction identifier, enabling users toidentify all items purchased during a single transaction.
The study contacted all the large supermarket chains in the six case study States to inquire whethertheir POS systems could identify food items paid for with WIC checks or vouchers. A number ofPOS systems could not, either because transaction identifiers were not used or the system groupedWIC checks with all other checks when identifying mode of tender. Supermarket chains whose POSsystems could identify WIC transactions and the items included in those transactions were invited toparticipate in the study by providing copies of their WIC transaction data for a 5- to 6-week period inearly 2001. Six supermarket chains agreed to provide data from some or all of their stores.9 Toge-ther, these scanner data provide information for over one-half million WIC transactions in five of thesix States; no supermarkets in Oklahoma were able to participate in the study.
7 Two States, Connecticut and Ohio, did not have enough non-WIC stores in the study areas to sample 12 stores in eachState. At the time the survey was designed, it was not clear that Oklahoma also had a policy restricting high-costvendors.
8 WIC-authorized stores were sampled from lists of WIC vendors obtained from each State WIC agency. The sampleframe includes all WIC vendors, except pharmacies and WIC-only stores, located in the three study sites in each State.Non-WIC stores are defined as supermarkets and grocery stores authorized to participate in the Food Stamp Programbut not the WIC program. The FNS Store Tracking and Redemption Subsystem (STARS) database, which includesrecords for all FSP-authorized retailers, was used to draw the sample of non-WIC stores.
9 These WIC transaction data cannot be matched to individual participants or food instruments because the store POSsystems do not capture the serial number of the WIC check or voucher. For this reason the scanned food item datacannot be used to examine whether WIC participants fully redeem their food prescriptions.
8
Because most supermarket chains either could not provide the requested data or decided not to parti-cipate in the study, the WIC transaction data cannot be viewed as a representative data set. The dataare used to inform the study about WIC participants’ shopping patterns, especially the distribution ofpurchased types and brands of food items in States with and without food item restrictions. AppendixC describes the WIC transaction data.
Focus Group Discussions with WIC Program Dropouts
Focus groups were conducted with WIC participants who did not pick up their WIC food instrumentsand who indicated, during a screener survey, that this was related to dissatisfaction with either WICfood items or access to WIC vendors.
Six focus groups were conducted in five States, collecting in-depth, qualitative information on thereasons WIC participants fail to make full use of their WIC food benefits.10 Abt Associatescontracted with Marketing Resources International (MRI) to recruit WIC participants for focusgroups, provide facilities for focus group sessions, conduct the sessions, and report on the results.
A focus group moderator used the same topic guide in all States. Topics were broadly focused onWIC participants’ satisfaction with the selection of WIC-approved foods, access to WIC vendors, andease of using WIC food instruments (that is, WIC checks or vouchers). The goal of the focus groupswas to determine the extent to which cost-containment practices affected these participants’ decisionsto stop picking up their WIC checks and vouchers.
Although focus groups do not provide data that can be compared across States in a quantitative way,they provide in-depth qualitative insights about WIC participants’ satisfaction. The stories told by thefocus group members allow the study to determine whether particular aspects of cost-containmentpractices are singled out by WIC participants when they describe their experiences with the program.
Interviews with Concerned Stakeholders
In addition to collecting information from WIC agencies, the study contacted representatives fromfood industry associations and from the National WIC Association (NWA), formerly the NationalAssociation of WIC Directors (NAWD). These organizations, listed in appendix D, have expressedconcerns in the past about WIC cost-containment practices. Many of these concerns, summarizedbelow, were investigated as part of the study:
• The NWA is a voluntary membership organization representing State and local WICagencies nationwide. NWA members expressed two main concerns about cost-contain-ment practices: (1) the negative impact of food-item restrictions on program participa-tion; and (2) obstacles to States’ utilization of food cost savings to increase Federal NSAfunds in support of higher WIC participation levels.11 They stressed that States neededflexibility in designing food packages to attract and retain program participants.
10 A planned focus group in Hartford, Connecticut was cancelled because not enough participants who met the screeningcriteria could be recruited.
11 NWA’s concern with States’ use of food cost savings has been addressed by FNS since the interview was conducted.In December 1999, FNS published a rule expanding conversion authority for cost-containment savings to NSA funds.According to the rule, a State WIC agency “may now convert food funds to NSA funds based on projected increases in
9
• The Grocery Manufacturers of America (GMA) is a trade organization representingcompanies that manufacture and market most of the best known national brand products.Their biggest concern with cost-containment efforts is those practices that reduce WICparticipants’ choices among brands of WIC-approved products, especially breakfastcereals. They believe that such restrictions reduce participant satisfaction and can lead todecreased participation in WIC.
• Members of the Private Label Manufacturers Association (PLMA) are pleased thatprivate-label, or store-brand, items are being added to WIC-approved food lists in manyStates. They perceive, however, that some State WIC agencies are biased against private-label foods. Members also are concerned with policies that require WIC-approved fooditems to be available statewide, because not all food chains operate throughout a State.Finally, PLMA members believe that limiting vendors may (unintentionally) eliminatemany private-label products from the WIC program and lead to increased costs andreduced product availability for the WIC program and participants.
• The Food Marketing Institute (FMI) and the National Grocers Association (NGA) aretrade associations representing food retailers and wholesalers. These groups do not likecost-containment practices designed to limit the number of WIC-authorized vendors,arguing that such practices are inefficient and expensive to implement. These groupsbelieve that the practices tend to reduce participation of smaller neighborhood stores,which in turn affects WIC participants’ accessibility to WIC-authorized stores. Theassociations also do not like price ceilings, which they claim are unfair to small retailerswhose cost structures are higher, and least expensive brand policies, which they claimconfuse store clerks and WIC customers.
Report Organization
This report on WIC cost-containment practices contains 11 chapters, including this introduction.Chapter 2 provides a description of the cost-containment practices used in each of the six case studyStates, as well as of their administrative costs. Chapters 3 and 4 then present the estimated relation-ships between cost-containment practices, food selection, and WIC food package costs.
The estimated relationships between WIC cost-containment practices and participant access to WICvendors, and the availability of prescribed foods, are presented in chapter 5. Chapter 6 describesparticipant satisfaction with and use of prescribed foods. Chapter 7 provides information on thepercentage of WIC participants in the six States who have food allergies or are on special diets, toge-ther with evidence on the extent of problems these participants encounter when shopping for WICfoods.
Chapters 8 and 9 present the study’s findings on, respectively, food instrument redemption rates andprogram participation. Chapter 10 discusses the relationship between redemption rates and changesin participant health measures. Based on findings on all of the outcome measures specified in theauthorizing legislation, chapter 11 summarizes what has been learned about each cost-containment
participation instead of just actual participation increases.” The NSA expenditure standard was reduced to 10 percentto improve accountability for the new conversion authority and to prevent this expanded conversion authority frombeing used to substantially shift food money to NSA spending without increased cost-containment savings andparticipation.

10
practice implemented by the case study States. Technical appendixes are found at the end of thereport.
11
Chapter 2State Cost-Containment Practices
and Their Administrative Costs
Introduction
This chapter describes the cost-containment practices in the six case study States and presents esti-mates of their associated administrative costs. The information was obtained from State WICprogram documents and interviews with officials of State and local WIC agencies in the six States.The interviews were conducted in spring and summer 2001. All data refer to practices in place inSpring 2001, when other data were collected for the study.1
State WIC agencies use three main types of cost-containment practices: vendor restrictions, food-item restrictions, and manufacturer rebates. These practices consist of various policies, depending onthe State, as follows:
• Vendor restrictions:
−Using competitive price comparisons to select stores for authorization andreauthorization as WIC vendors.
• Food-item restrictions:
−Limiting the choice of WIC foods within certain categories to brands or types that meetboth cost and nutritional standards.
−Requiring the purchase of the least expensive brand of certain WIC foods.−Requiring the purchase of private-label or store-brand items for certain WIC foods.−Specifying minimum package sizes or forms for WIC foods.
• Manufacturer rebates
−Contracting with manufacturers to obtain rebates on WIC sales in exchange forexclusive use of the manufacturer’s product.
Cost-containment practices not addressed by this study include infant formula rebates and substitutionof food package items. All States have rebate contracts governing the purchase of infant formula.The mandate for this study explicitly excluded this practice from consideration. States may alsosubstitute food packages items to contain costs, particularly when experiencing unexpected increasesin food prices. These adjustments in the types of foods prescribed must be made in a way that isconsistent with the nutritional needs of participants, as required by FNS regulations. Tailoring offood quantities for individuals or categories of participants (i.e., prescribing less than the maximumauthorized amount) is permitted only for nutritional reasons.
1 Appendix E provides general information on the cost-containment practices used by all State WIC agencies, as of late1999. This information is not discussed in the chapter, because the report focuses on the six States selected for the casestudies. The information is useful, however, for placing the selected States in the broader context of State cost-contain-ment practices.
12
Summary of Findings
The principal findings on the patterns of cost-containment practices in the six States covered by thisstudy are described below.
Vendor Restrictions
• All six States collected price data from retailers applying for authorization or reauthoriza-tion as WIC vendors. The States used this information for vendor management and, insome States, to ensure that retailers with excessive prices were not authorized as WICvendors.
• Four of the six States (all except North Carolina and Ohio) used competitive pricecomparisons when they determine whether to authorize or reauthorize stores as WICvendors.2
• In practice, States using competitive price comparisons rarely denied vendor authoriza-tion based on price. Instead, the States required a modest number of stores to reduceexcessive prices in order to obtain or maintain authorization.
• North Carolina and Ohio also notified vendors if WIC item prices were consideredexcessive and encouraged the vendors to reduce these prices.
• All six States also collected data on the prices of participating vendors between authori-zation cycles. This practice was used for monitoring vendors and did not directly affectvendor authorization. Thus, although it was intended to reduce food costs, it is notconsidered a cost-containment practice that might limit participants’ choice of WICvendors.
Food-Item Restrictions
• Four States required purchase of the least expensive brand of item for certain foodcategories, as follows: Connecticut (milk, eggs, cheese, citrus juice, and peanut butter);North Carolina (milk); Oklahoma (milk, cheese, eggs, and dried beans/peas); and Texas(milk and juice).
• Oklahoma was the only State that required purchase of private-label or store-brand itemsfor cereal and juice (with some exceptions).
• California and Oklahoma had relatively narrow ranges of participant choice amongcereals, as a result of price criteria and other factors considered when authorizing cerealsfor WIC use. California authorized 11 cereals, Oklahoma authorized 12, and the otherStates authorized 18 or more cereals.
• California also offered narrow ranges of choice among authorized juices (five types) andcheeses (four types), as the result of price and other food selection criteria. Oklahomaoffered a narrow range of choice among authorized cheeses (five types). Texas offered anarrow range of choice among authorized juices (eight types).
2 North Carolina adopted WIC regulations requiring vendors to meet competitive price criteria effective July 1, 2002.All States are required to use competitive pricing as a criterion for WIC authorization as of October 1, 2002.
13
• All six States set minimum package sizes for at least one WIC food group, mostcommonly milk. California, Oklahoma, and Texas had the most package-size restric-tions.
Manufacturer Rebates
• California, Connecticut, and Texas received rebates on sales of infant cereal throughcontracts that specified a single authorized brand. Ohio received a voluntary grant from anational juice manufacturer equal to $1 for each 46-ounce can of the manufacturer’s juicesold in the State.
Administrative Costs
• Cost-containment practices were quite inexpensive to operate, compared with the overallcost of program operations. Estimated total administrative costs ranged from $0.14 perparticipant per year (PPY) to $1.03 PPY, with a cross-State average of $0.58 PPY.3
• On average, the administrative cost of cost-containment practices was about 0.4 percentof the total FY2001 nutritional services and administrative (NSA) cost in the study States.The range was from 0.1 percent to 0.6 percent.
This chapter describes the policies and procedures of the six States as of Spring 2001. Some Statesindicated during the interviews that they planned changes to cost-containment policies. For example,after June 2001, Oklahoma added four national-brand cereals to its food list in July 2001, and Cali-fornia increased its number of authorized juice labels to 84. Changes after June 2001 are not reflectedin this chapter.
Data Sources
Basic information on cost-containment practices was obtained by reviewing State WIC programdocuments, including the following: the WIC State plan submitted annually to FNS; vendor applica-tion forms, handbooks, and other communication materials; and food lists and buying guides forparticipants. The review followed a standard guide for abstracting specific information. Materials forthe six study States were collected in March and April 2001.4
Interviews were conducted with representatives of all six State WIC agencies selected for the study.Connecticut interviews were held in person at the State’s offices in Hartford in May 2001. All otherinterviews were conducted between June and August 2001 through a combination of telephone inter-views (using a detailed questionnaire) and written correspondence.
Additional interviews were conducted with local WIC agency officials regarding the impact of costcontainment on their operations. In each State, three local agencies were selected for telephone inter-
3 These totals are affected by missing values, as discussed in the text.
4 Earlier versions of some of these materials had been collected from all WIC State agencies in the fall of 1999 for use inplanning the study and selecting the sample. That information is summarized in the interim report. (See Assessment ofWIC Cost-Containment Practices: An Interim Report to Congress. USDA, Economic Research Service, E-FAN-01-005, February 2001.)
14
views, representing one “urban,” one “suburban,” and one “rural” site.5 Local agency interviewswere conducted between July and September 2001.
Interview Topics
The topics of the State agency questionnaire were:
• Vendor selection and management practices
• Food-item selection practices
• Administration of manufacturer rebates
• Food cost savings and their utilization
• Opinions and evidence regarding the impacts of cost-containment practices onparticipants.
Appropriate respondents were identified in each State, based on which staff had responsibility for theareas to be covered in the interview. Respondents were asked about their current cost-containmentpractices, including procedures and associated staff roles, changes in policies and procedures overtime, and reasons for using or not using various cost-containment practices. To guide the interviews,a structured, open-ended questionnaire was used.6 The researchers identified a comprehensive list oftasks associated with each cost-containment practice. States were also asked for quantitative data onadministrative costs associated with cost containment, but generally were unable to provide thesedata.
State agency respondents estimated the staff time and other costs devoted to the administration ofcost-containment practices. The respondents provided estimates to the extent that they were able toseparate these costs from related program management functions (for example, to separate the use ofprice in vendor selection from other application-processing activities). In some cases, respondentsestimated staff time for each individual task associated with one of the major cost-containment prac-tices. More often, the respondents provided overall time estimates for the administration of each cost-containment practice.
The local agency interviews included questions about local responsibilities and administrative costsassociated with orienting WIC participants about cost-containment restrictions. In North Carolina,these interviews included local agency roles in vendor training and food-instrument processing, activ-ities that were centralized in the other States. The local agency respondents were also asked theirviews on the effects of cost-containment on participants and on the impediments to using savings infood costs to maintain or increase participation. In addition, these interviews gathered backgroundinformation on the local agency to help understand the respondent’s perspective.
The descriptive data collected in the interviews with State and local WIC staff are summarized in thetext of this chapter and in tables showing key similarities and differences among States. Quantitativedata on staff time and other costs related to cost-containment were used to estimate administrativecosts associated with each cost-containment practice. The chapter gives only an overall summary of
5 Appendix A describes sampling procedures and provides a list of the sampled offices.
6 See appendix F for further information on these interviews.
15
the administrative cost results because of data limitations. Appendix F presents administrative costestimates by State for each cost-containment practice.
Overview of Vendor Authorization Process and Criteria
Under WIC regulations, food retailers must apply for authorization from the State WIC agency beforeredeeming WIC food instruments.7 When a store changes ownership, the new owner must apply forauthorization. For new stores and new owners, WIC regulations require a written application, a visitby State WIC personnel to the store, and a written agreement setting forth the terms of the store’sparticipation as a WIC vendor. After authorization is received, WIC vendors must apply every 1 to 3years, depending on the State’s policies, to renew this agreement.
In the vendor authorization process, the State seeks to promote several WIC program objectives:participant access to prescribed foods, vendor integrity, conservation of administrative resources, andcontainment of food costs. Other participant service considerations include the availability of anadequate inventory of WIC foods and the quality of service. In addition to these objectives, Stateshave reason to be selective, where possible, in authorizing WIC vendors, because they have limitedadministrative resources for vendor-management activities.
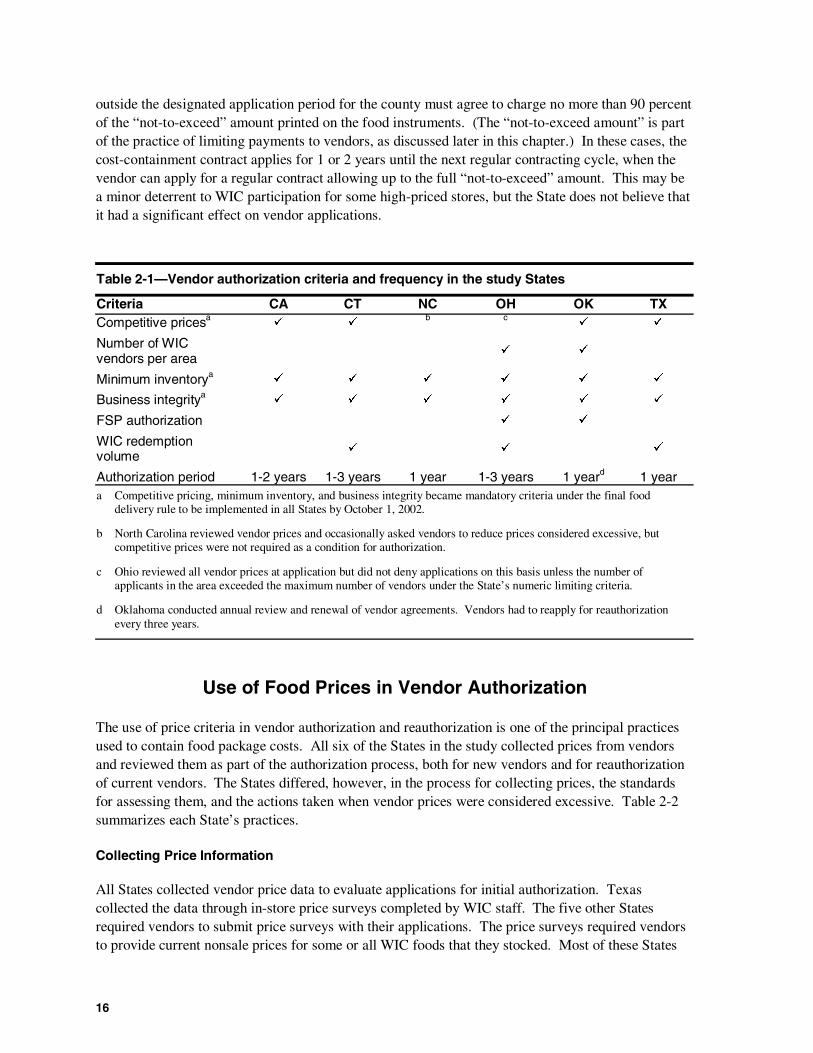
Table 2-1 summarizes the criteria used for vendor authorization in the six States in this study. All theStates examined retailers’ prices, inventories of WIC foods, and business integrity. At the time of thestudy, North Carolina and Ohio did not require competitive prices as a condition of authorization.Under USDA regulations effective October 1, 2002, however, all States are required to use competi-tive prices as a condition of authorization. Ohio and Oklahoma restricted the number of WIC vendorsin each county.8 Ohio, Oklahoma, and Texas required WIC vendors to be authorized by the FSP.Ohio and Texas also required WIC vendors to maintain minimum levels of WIC redemption volumeas a condition for renewal of agreements. In North Carolina, Oklahoma, and Texas the vendor agree-ment is valid for 1 year. In California, the agreement is valid for 1 to 2 years, and in Connecticut andOhio the agreement period is 1 to 3 years, depending on the vendor’s record of program participationand compliance.
Ohio and Oklahoma restricted the number of WIC vendors in each county. According to FNS, thispolicy of numeric limitation of vendor authorizations is not a cost-containment practice, because it isintended to conserve vendor-management resources, not to reduce food costs. The policy appears tohave had little or no impact in the two States that used it. Numeric vendor limits in Oklahomaresulted in only about three denials per year from 1999 to 2001. Ohio had not denied any vendorapplications based on numeric limits, although one county had reached its designated vendor totalwhen data for the study were collected.
Ohio had a unique system of “cost-containment” vendor contracts, not reflected in table 2-1. In Ohio,each county has a designated application period every 3 years. A vendor entering the WIC program
7 The food delivery regulations (7 CFR 246.12) include rules on WIC vendor authorization and management. A finalrule amending these regulations was published on December 12, 2000. All States must comply with the amendedregulations by October 1, 2002.
8 The number of vendors authorized per county is based on minimum ratios of participants to vendors for different typesof counties, with more participants per vendor expected in urban areas.
16
outside the designated application period for the county must agree to charge no more than 90 percentof the “not-to-exceed” amount printed on the food instruments. (The “not-to-exceed amount” is partof the practice of limiting payments to vendors, as discussed later in this chapter.) In these cases, thecost-containment contract applies for 1 or 2 years until the next regular contracting cycle, when thevendor can apply for a regular contract allowing up to the full “not-to-exceed” amount. This may bea minor deterrent to WIC participation for some high-priced stores, but the State does not believe thatit had a significant effect on vendor applications.
Table 2-1—Vendor authorization criteria and frequency in the study States
Criteria CA CT NC OH OK TXCompetitive pricesa
� �b c
� �
Number of WICvendors per area
� �
Minimum inventorya� � � � � �
Business integritya� � � � � �
FSP authorization � �
WIC redemptionvolume
� � �
Authorization period 1-2 years 1-3 years 1 year 1-3 years 1 yeard 1 yeara Competitive pricing, minimum inventory, and business integrity became mandatory criteria under the final food
delivery rule to be implemented in all States by October 1, 2002.
b North Carolina reviewed vendor prices and occasionally asked vendors to reduce prices considered excessive, butcompetitive prices were not required as a condition for authorization.
c Ohio reviewed all vendor prices at application but did not deny applications on this basis unless the number ofapplicants in the area exceeded the maximum number of vendors under the State’s numeric limiting criteria.
d Oklahoma conducted annual review and renewal of vendor agreements. Vendors had to reapply for reauthorizationevery three years.
Use of Food Prices in Vendor Authorization
The use of price criteria in vendor authorization and reauthorization is one of the principal practicesused to contain food package costs. All six of the States in the study collected prices from vendorsand reviewed them as part of the authorization process, both for new vendors and for reauthorizationof current vendors. The States differed, however, in the process for collecting prices, the standardsfor assessing them, and the actions taken when vendor prices were considered excessive. Table 2-2summarizes each State’s practices.
Collecting Price Information
All States collected vendor price data to evaluate applications for initial authorization. Texascollected the data through in-store price surveys completed by WIC staff. The five other Statesrequired vendors to submit price surveys with their applications. The price surveys required vendorsto provide current nonsale prices for some or all WIC foods that they stocked. Most of these States
17
checked vendor prices through onsite review by WIC staff (for example, during preauthorizationvisits).
Between authorizations, five of the States monitored vendor prices through surveys or store visits.Four of the States—Connecticut, North Carolina, Ohio, and Oklahoma—required authorized vendorsto submit price surveys two to four times a year.9 In California, Ohio, and Oklahoma, WIC staffmembers checked prices during annual monitoring visits. Texas used redemption item prices insteadof price surveys to monitor vendor pricing, as described below.
Vendor prices were also examined at reauthorization. Ohio and Oklahoma used their quarterly pricesurveys to check prices of stores applying for reauthorization. California, Connecticut, and NorthCarolina conducted separate price surveys for vendor reauthorization. WIC staff members checkedprices during reauthorization visits in California, Connecticut, Ohio, and Oklahoma.
The food instrument redemption process also provided information about price. All of the Statesmonitored redemptions for a variety of purposes, but two of the States explicitly used the prices ofredeemed food instruments for vendor reauthorization. Oklahoma used redemption data along withvendor surveys in its price review for reauthorization.10 Texas required vendors to record the price ofeach item on each food instrument, and the State analyzed the price information twice a year to iden-tify vendors with excessive prices.11 These vendors received warnings and risked nonrenewal of theirWIC contracts.
Standards for Vendor Prices
States examined vendor prices to determine whether prices were in an acceptable range. The standardfor the acceptable range, however, varied by State (table 2-2). Three States used well-defined stan-dards, whereas three relied primarily on analysts’ judgment. 12
Connecticut, Oklahoma, and Texas compared a vendor’s prices for a standard combination of items tothe average for the vendor’s peer group. The standard combination of items typically includedselected items from each category of WIC foods (such as a gallon of whole milk, a dozen large whiteeggs, and so on). These “food baskets” for price comparisons included infant formula and infantcereal, as well as the foods prescribed for women and children. The peer group was defined by area(county or other geographic unit served by the local WIC agency) and store type (defined by numberof registers or monthly food sales). The threshold for excessive prices was 5 percent above the peergroup average in Oklahoma, 7.5 percent in Connecticut, and 8 percent in Texas.
9 These surveys were used both to monitor individual vendors’ prices and to set limits on the value of food instruments.
10 Connecticut examined food instrument redemptions if it suspected a vendor to be overcharging. The State comparedthe vendor’s redemptions against the expected cost of food instruments, based on the vendor’s reported prices. If over-charges were found, the State billed the vendor for the excess. This practice, however, did not directly affect thevendor’s continued participation.
11 Texas was the only State that obtained item prices on food instruments; the other States obtained only the total cost ofthe combination of items on the food instrument.
12 “Analyst” is the typical job category for WIC vendor-management staff members who review applications.
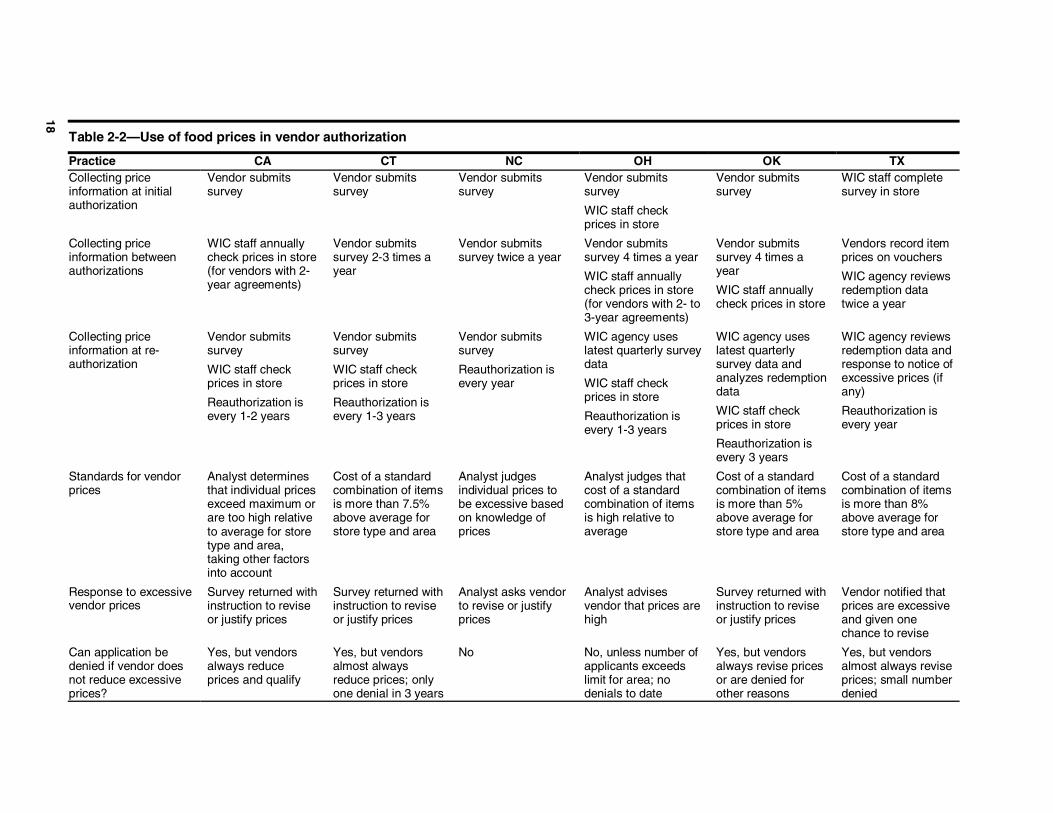
18
Table 2-2—Use of food prices in vendor authorization
Practice CA CT NC OH OK TXCollecting priceinformation at initialauthorization
Vendor submitssurvey
Vendor submitssurvey
Vendor submitssurvey
Vendor submitssurvey
WIC staff checkprices in store
Vendor submitssurvey
WIC staff completesurvey in store
Collecting priceinformation betweenauthorizations
WIC staff annuallycheck prices in store(for vendors with 2-year agreements)
Vendor submitssurvey 2-3 times ayear
Vendor submitssurvey twice a year
Vendor submitssurvey 4 times a year
WIC staff annuallycheck prices in store(for vendors with 2- to3-year agreements)
Vendor submitssurvey 4 times ayear
WIC staff annuallycheck prices in store
Vendors record itemprices on vouchers
WIC agency reviewsredemption datatwice a year
Collecting priceinformation at re-authorization
Vendor submitssurvey
WIC staff checkprices in store
Reauthorization isevery 1-2 years
Vendor submitssurvey
WIC staff checkprices in store
Reauthorization isevery 1-3 years
Vendor submitssurvey
Reauthorization isevery year
WIC agency useslatest quarterly surveydata
WIC staff checkprices in store
Reauthorization isevery 1-3 years
WIC agency useslatest quarterlysurvey data andanalyzes redemptiondata
WIC staff checkprices in store
Reauthorization isevery 3 years
WIC agency reviewsredemption data andresponse to notice ofexcessive prices (ifany)
Reauthorization isevery year
Standards for vendorprices
Analyst determinesthat individual pricesexceed maximum orare too high relativeto average for storetype and area,taking other factorsinto account
Cost of a standardcombination of itemsis more than 7.5%above average forstore type and area
Analyst judgesindividual prices tobe excessive basedon knowledge ofprices
Analyst judges thatcost of a standardcombination of itemsis high relative toaverage
Cost of a standardcombination of itemsis more than 5%above average forstore type and area
Cost of a standardcombination of itemsis more than 8%above average forstore type and area
Response to excessivevendor prices
Survey returned withinstruction to reviseor justify prices
Survey returned withinstruction to reviseor justify prices
Analyst asks vendorto revise or justifyprices
Analyst advisesvendor that prices arehigh
Survey returned withinstruction to reviseor justify prices
Vendor notified thatprices are excessiveand given onechance to revise
Can application bedenied if vendor doesnot reduce excessiveprices?
Yes, but vendorsalways reduceprices and qualify
Yes, but vendorsalmost alwaysreduce prices; onlyone denial in 3 years
No No, unless number ofapplicants exceedslimit for area; nodenials to date
Yes, but vendorsalways revise pricesor are denied forother reasons
Yes, but vendorsalmost always reviseprices; small numberdenied
19
In California, North Carolina, and Ohio, a WIC staff analyst reviewed vendors’ prices and appliedjudgment and experience rather than a fixed standard. Ohio compared a vendor’s total price for acombination of foods with an average, but the determination that a vendor’s prices were high wasbased on the analyst’s judgment. Vendors would be ranked by price if the number of applicantsexceeded the State’s limit on the number of vendors in the county, but this did not happen. In Cali-fornia, the analyst checked individual item prices against a standard based on location and store type,but the State’s policy required the analyst to consider several other factors when determining whetherprices were excessive.13 In North Carolina, an analyst identified a problem only when a vendor sub-mitted a price that was exceptionally high, based on the analyst’s knowledge of prices for the item.
Response to Excessive Vendor Prices
When excessive prices were found, four of the six States (California, Connecticut, Oklahoma, andTexas) returned the price survey forms and instructed the vendor to reduce the excessive prices or riskexclusion from the WIC program. In these cases, the vendor had the opportunity to justify high priceson the basis of high wholesale prices or other considerations, but the States rarely granted exceptionsto their price standards.
The incidence of excessive-price determinations appears to vary among these four States, but none ofthem could quantify it. California estimated that, aside from chain stores, the vast majority of newvendor applicants had at least one or two prices identified as high. (The State finds that most chainstores have competitive prices for all WIC items.) Connecticut estimated that a small but nontrivialproportion of applications had excessive prices (approximately 10 to 30 of a total of 100 to 200applications a year). Oklahoma indicated that high prices on vendor applications were not common.In contrast, Texas indicated that it was not uncommon for even chain stores to have some prices “outof line” when they first submitted their applications.14
Actual denials of applications based on price criteria occurred rarely in these States, because vendorscooperated and reduced their prices. California and Oklahoma had never denied an application onthis basis, and Connecticut had denied only one, in 1998. Texas indicated that denials of vendorapplications were rare, but that excessive prices were the most frequent reason when denials occurred.(The State agency was unable to identify the number of denials for this or other reasons at the time ofthe study.) Texas also declined to renew vendor agreements if the vendor had failed to reduce pricesafter a warning (based on semiannual analyses of redemption data), but no count of these cases wasavailable.
State policies in North Carolina and Ohio, as implemented, did not permit the denial of authorizationor reauthorization due to high prices. Ohio would have used price criteria if the number of vendors ina county exceeded specified limits, but these limits were never reached. Instead, Ohio remindedvendors that they would not be reimbursed for more than the maximum value specified by the State
13 In California, if a store’s prices were high relative to its peers, the analyst considered whether the store had high trans-portation costs, low WIC volume, an extreme rural setting, or current wholesale costs that justified the prices. TheCalifornia WIC agency plans to implement a system with more fixed criteria for vendor prices based on peer groupaverages, which will also be used to set maximum reimbursement levels for food instruments. At the time of the datacollection, the State expected to implement this system by October 2002.
14 Texas revised the criteria for categorizing vendors between 1996 and 2001 so that independent stores would not becompared with chain stores having much lower wholesale costs.
20
on WIC food instruments.15 When high prices were identified in North Carolina, WIC officials triedto persuade the vendors to reduce them. North Carolina WIC staff indicated that these situations wererare, and that vendors usually agreed to lower prices or provided justification for existing prices.
Summary of Vendor Restrictions Based on Prices
Among the States in the study, Connecticut, Oklahoma, and Texas had the most stringent policiesregarding competitive pricing as a condition of vendor authorization. These States had quantitativeprice standards for new applicants and renewals. Retailers clearly could be excluded from WIC inthese States based on excessive prices, although the incidence of such denials was very low.
California, North Carolina, and Ohio either did not use price criteria for authorizations or had lessstringent policies regarding competitive pricing. North Carolina did not apply price criteria forauthorizations. Ohio’s price criteria were not actually applied, because they depended on numericlimits that had not been reached. California asked some retailers to adjust prices when they appearedhigh, but the State’s relatively flexible price criteria were used solely to obtain adjustments in indi-vidual prices. None of these three States had ever denied vendor authorizations based on price.
For the purpose of this study, Connecticut, Oklahoma and Texas have been categorized as “restric-tive” with respect to requiring competitive prices as a condition of vendor authorization, whereasCalifornia, North Carolina, and Ohio have been categorized as “nonrestrictive”. The differencebetween the “restrictive” and “nonrestrictive” States in the number of actual denials of vendorauthorization is quite small. The principal effect of the competitive pricing policy appears to be thatmodest numbers of vendors reduce some of their prices. Nevertheless, the competitive pricing policyin the “restrictive” States might conceivably influence vendor participation, because of the explicitstandards applied by these States with the known possibility of the State denying vendor authoriza-tion. It does not seem likely that vendor participation would be influenced by the more limited use ofprice information in the “nonrestrictive” States.
Use of Food Price Information to Limit Payments to Vendors
Under USDA regulations effective October 1, 2002, all State WIC agencies are required to establishprice limitations on the amount that they will pay vendors. Prior to that date, the use of price limita-tions was at the discretion of the individual States. As described below, all six States in the studyused price limitations when data for the study were collected in the spring and summer 2001.
As a practice for managing authorized vendors and ensuring the integrity of the food delivery system,all six States in the study used price standards for individual WIC foods to set limits on allowablepayments for redeemed food instruments, otherwise known as maximum, or “not-to-exceed,” values.In all of these States except Texas, each food instrument had a maximum total value that depended onthe items on the instrument. Texas, on the other hand, set a maximum price for each item on the foodinstrument.
Maximum values for food instruments have two purposes. First, the process catches errors and delib-erate overcharging by vendors. For example, if a clerk enters an extra zero on the price, so that the
15 All six States specified maximum values for food instruments, but Ohio relied more on this policy to restrain vendorprices than the States with the authority to deny vendor applications based on prices.
21
vendor deposits a WIC check for two gallons of milk for $45.00 instead of $4.50, this error will bedetected if the State has a maximum value of $6.00 for the check. Second, the maximum value limitsthe charges by vendors whose actual prices are high relative to the standard used by the State. Thispractice allows the State to ensure that food package costs are consistent with competitive pricesamong WIC vendors, particularly under the Texas model.
The “maximum value” policy is closely related to the use of food prices in vendor selection. Asnoted in the previous section, States notified vendors if the prices they submitted at the time ofapplication exceeded the standards used by the State to set maximum values for food instruments.Price surveys of vendors and redemption data were the principal sources of market data for settingmaximum values. The use of maximum values, in turn, provided feedback to the vendors: if theirprices were high, the State rejected or reduced their requests for reimbursement.
The use of maximum values was not among the cost-containment restrictions on which this studyfocused. Maximum values are not intended to affect vendor participation or participants’ choice ofWIC foods. Therefore, the study did not look for any such effects or compare participant outcomeson the basis of differences in the implementation of this practice.
Nevertheless, the study collected information on the use of maximum values in the study Statesbecause of the possibility that this practice could have an impact on vendor participation. A stringentset of maximum values might have the effect of discouraging participation by small independentstores whose prices are high because of high costs for wholesale food and other expenses. This effectwould help hold down food costs, but it could also reduce access to WIC foods for participantslacking access to large chain stores, including those in inner-city and rural communities. Thus, use ofstringent maximum values could result in the State failing to comply with Federal rules requiringadequate geographic dispersion of WIC vendors.
Evidence suggested that limits to store participation in WIC were minimal or nonexistent. Very fewfood instruments were rejected or adjusted because they exceeded the maximum values. Further-more, a high proportion of broad-line retailers were authorized as WIC vendors in the six States. TheStates regularly adjusted their maximum values when rejection rates rose or when they had evidenceof wholesale price increases. Further information on the practices of the six States regarding maxi-mum values and on the incidence of rejected food instruments appears in appendix G.
Food-Item Restrictions
To contain food package costs, the six States in the study used a variety of restrictions on the fooditems authorized for purchase with WIC benefits. These restrictions were in addition to the Federaland State requirements for the nutritional content of WIC foods and the restrictions related to theStates’ contracts for infant formula rebates. Thus, each State’s list of WIC-authorized foods reflecteda combination of nutritional and cost considerations. This section describes how the six Statesapplied cost criteria when establishing their WIC food lists and how they implemented each of theserestrictions.
All six States take the cost of foods into account when they choose products for their food lists. Costcriteria were put in place in the early 1990s (or earlier in some of the States). The importance of foodcost has varied over time, as program growth has slowed and issues of outreach and participant
22
retention have become more important. Other criteria applied to WIC food lists include nutritionalstandards, participant satisfaction, and ease of administration. Some States impose more stringentnutritional standards than the Federal WIC standards. For example, California does not authorize anycereals containing fruit and has a preference for cereals with higher folic acid content. Participantsatisfaction is important for two reasons: first, ensuring that participants will buy and consume theprescribed foods, and second, maintaining interest in the WIC program so that participants get itsother benefits. States also seek to keep their food lists manageable in size, because they must educatelocal staff members, vendors, and participants about the lists on an ongoing basis. Another adminis-trative factor is limited space on food instruments to specify prescribed foods.
The formulation of WIC food lists focuses mainly on breakfast cereal and juice. These food cate-gories have much more variety, both in formulation and in price, than the categories of milk, eggs,peanut butter, and dried beans/peas. Consumers are believed to have stronger brand loyalties andtaste preferences in cereals and juices than in the other categories. (Cheese is another food categorywith considerable variety in types of products and preferences, but Federal WIC regulations authorizeonly nine specific types of cheese.) Cereals and juices vary considerably in their nutrient content, byboth brand and type, so the States have to check that each product meets WIC standards.16
The cycle for reviewing and revising food lists varied among the study States. All six Statesreviewed and updated their food lists at least every 2 years. Connecticut and Ohio had a regular 2-year cycle for their entire food lists. California did a review every 2 years of food selection criteria,market share of WIC foods, nutrient contents, and cereal costs. Oklahoma revised its food list every1 to 2 years, and North Carolina revised its food list every year. Texas did a full review every year.
In addition to the regular review cycle, the States made changes if needed during the year. Forexample, when orange juice prices rose several years ago, several States temporarily took orangejuice off their food lists. California made two revisions to its list of authorized juices within a periodof several months as it made the transition from its exclusive rebate contracts for juice to havingseveral authorized brands of each type (as discussed later in this section).
The basic process for reviewing and revising the food lists was quite similar in the six States. WICstaff reviewed the prices, nutritional content, and popularity of the currently authorized foods andother products that might be added. All of the States except Texas used data from vendor pricesurveys to identify the current prices of authorized WIC foods; Texas used the prices on redeemedWIC food instruments for this purpose. Other resources used by the States to determine food costsand sales volume included manufacturers’ suggested retail prices, wholesalers’ prices, marketresearch data, and redemption data. Manufacturers’ and suppliers’ specifications and review ofsample product labels were used to check nutritional contents. California, Connecticut, Ohio, andTexas used participant surveys, focus groups, or taste tests to provide input on food preferences andacceptability. This review could be done exclusively by State staff, with separate local office input,or by a joint team of State and local staff. For example, California solicited input from local agenciesvia regional meetings and a task force.
The six States differed in their approaches to incorporating cost considerations in their food lists.Oklahoma and Texas relied primarily on broad policies requiring least expensive or store brands,
16 WIC regulations set a minimum level of vitamin C in juice and iron in cereal. The regulations also limit the amount ofsucrose and other sugars in cereals (see appendix H).
23
although Texas also set minimum package sizes for different cereals based on cost. Connecticutwould not authorize foods that exceeded 125 percent of the average cost for foods of the same type.(For example, the State’s food list excluded foil-packet tuna, because the cost per ounce was morethan 125 percent of the cost per ounce of canned tuna in water.) North Carolina ranked products byprice within each food category and set a price limit for the category, although particularly popularbrands or types that were considered important (such as rice cereals) might have been included evenif they exceeded the limit. North Carolina described its price limits as “very liberal” because theState had not found it necessary to manage closely the average food package cost. In an effort tocreate a list with the best balance of cost, nutrition, and acceptance, California assembled alternativecombinations of cereals and projected costs of these combinations, including both popular but moreexpensive products and less expensive ones. Ohio ranked food costs as the least important criterionfor selecting foods for the WIC program; the State found that its vendor management practicesensured adequate control of food costs.
Restrictions on Authorized Food Types
California and Texas were more restrictive than the other States with regard to the types of foodsauthorized on the WIC food list. In California, considerations of cost, nutrition and ease of adminis-tration led the State to offer the fewest types of cereal (11), cheese (4), and juice (6).17 Oklahomaauthorized fewer types of cheese (5) than any other State besides California. The State conductedmore extensive cost analysis of cereals than cheese and juice. Texas authorized relatively few typesof juice (8) as part of its multifaceted approach to containing juice costs.
The States varied in the types of eggs they allowed. Only North Carolina permitted purchase ofbrown eggs as well as white, and four States—California, Connecticut, Oklahoma, and Texas—prohibited purchase of extra large eggs.
Least Expensive Brand Requirements
Connecticut, North Carolina, Oklahoma, and Texas required participants to select the least expensivebrand of milk. Except for North Carolina, these States also required the purchase of the least expen-sive brand of one or more other foods. Connecticut applied this restriction to the most foods: milk,eggs, cheese, citrus juice, and peanut butter. Oklahoma had four categories in which the least expen-sive brand was required: milk, eggs, cheese, and dried beans/peas.18 Texas required purchase of theleast expensive brands of juice and milk. These policies had been in place in the four States since theearly 1990s or before.
The foods for which these States had established least expensive brand requirements are generallycommodity items that are quite similar across brands. For this reason, the States view the least expen-sive brand as a reasonable substitute for more expensive brands that participants may prefer. Thedifferences among the States in the range of foods subjected to this policy reflect, in part, differencesin the State’s assessment of the acceptability of least expensive brands. For example, negative parti-cipant reactions to least expensive brand restrictions on peanut butter led Oklahoma and Texas todrop these restrictions. Concern about participation satisfaction was a major reason that officials inCalifornia and Ohio cited for not adopting these restrictions.
17 An important administrative factor in California was the challenge of educating a linguistically diverse population.
18 The “dried beans/peas” category includes dry beans, peas, lentils and other legumes.
24
California had a policy of requiring the least expensive brand of milk from 1999 to 2000, adoptedwhen milk prices were rising. Both participants and cashiers were often confused by the policy, sothe State switched to using monthly data to set maximum prices for milk and dairy food instrumentsas a way to control costs while responding to changes in the market.
When these States require a participant to select the least expensive brand of a WIC food, the partici-pant always has the choice of the type or flavor, as long as it is included in the WIC food prescription.For example, participants can generally choose among whole, reduced-fat, and low-fat fluid milk.The participant may also have a choice of form or package size, such as gallons versus half-gallons ofmilk. Within the participant’s choice of authorized types and package sizes or forms, she must thenchoose the item that represents the least expensive brand (such as the brand with the least expensivegallon of whole milk). This distinction sometimes causes confusion for participants or store cashierswho may think that the participant must choose the least expensive type offered. (Such confusionwas a factor in California’s decision to drop its least expensive brand policy for milk.) 19
Texas authorized both store brands and national brands in numerous categories of juice. The partici-pant chose the type and form of juice (for example, frozen orange juice) and then had to select theitem that represented the least expensive authorized brand. This might be a store brand or nationalbrand, depending on the brands authorized by the State and offered by the vendor.
The rules for identifying the least expensive brand varied somewhat among the States. Most often,this was a store-brand or private-label product (unless the vendor carried only national brands). Manyof the States’ food lists equated “least expensive” with “store brand.” Nevertheless, most of theStates technically defined the least expensive brand as the one that cost least at the time of purchase,taking into account sale prices, coupons, and availability. Thus, the participant might have had tocheck prices to determine the least expensive brand, although the cashier was ultimately responsiblefor making sure the item was allowable. A national brand might have been the least expensive brandif it was on sale, if the participant had a manufacturer’s coupon, or if it was the only brand available.For example, a manufacturer’s coupon might have made Kraft American cheese less expensive thanthe store brand of this product, allowing a participant to choose the national brand while meeting theState’s requirement.
In Texas, each vendor declared the “traditionally least expensive brand” for each type of WIC foodsubject to this requirement as part of the application process. This brand was the one that wasnormally least expensive, but it could have occasionally cost more than another brand that was onsale. To facilitate WIC shopping, the vendor marked the designated brand as “WIC authorized” onthe shelf. If the designated brand was out of stock, the vendor was supposed to identify the leastexpensive brand that was in stock.
Private-Label or Store-Brand Restrictions
“Private-label” or “store” brands are marketed exclusively by specific retailers or wholesalers.20 Theyare usually offered as a less expensive alternative to a similar “national” brand, that is, a product
19 An unbranded generic food might be the least expensive “brand,” but none of the States identified such generic foodson their WIC food lists.
20 Another term for these products is “controlled brands.”
25
branded by the manufacturer and marketed nationally in a variety of competing outlets. In contrast,the availability of private-label or store-brand products depends on the locations served by the retaileror wholesaler. Within a State, a retailer may operate in only selected areas, so the retailer’s store-brand products may not be available statewide. State WIC agencies may require a brand to be avail-able statewide to keep the number of authorized products manageable.
The proliferation of store-brand and private-label products provides both an opportunity and a chal-lenge in compiling food lists. On the one hand, these products often provide significant cost savingsover national-brand products. On the other hand, in considering a store-brand version of a product(such as toasted oat circles), the State needs to review all store-brand or private-label productsoffered, to assure equity among the many vendors. The State must determine that each brand of theseproducts meets WIC nutritional standards, which is not always true even if the equivalent national-brand product is WIC-approved. The State also needs to be sure that the product is widely available,to avoid participant confusion and to keep the food list manageable. For these reasons, Ohio chosenot to authorize store-brand or private-label cereals, but the State did authorize some store-brand andprivate-label juices. Only Oklahoma and North Carolina had extensive lists of authorized store-brandor private-label cereals.
Oklahoma had the broadest policy of restricting WIC food purchases to store-brand or private-labelfoods, with nearly all cereals and most adult juices subject to this policy. (Oklahoma did allow somenational brands of frozen or shelf-stable concentrated juices, and also some full-strength canned juiceblends.)21 There were instances of this type of restriction, however, in two of the other States. Cali-fornia and Texas allowed only store-brand or private-label crispy rice cereals. (The discussion thatfollows uses the term “store brand” to include both store brands that are exclusive to a single retailingfirm and private-label brands owned by a wholesaler that may supply them to several retailing firms.)
In practice, the least expensive brand is often the store brand, particularly in the supermarkets wheremost WIC participants shop. Therefore, the least expensive brand policy is similar in outcome to thestore brand policy, but there is an important difference between the two. In States with the leastexpensive brand policy, the State authorizes national as well as store brands. Vendors can count thenational brands towards the WIC food inventory requirements, and participants can choose nationalbrands if they are the least expensive in that store. When the State authorizes only store brands,vendors must carry them as a condition of authorization, and participants can never purchase anational brand.
Texas removed national brands of cereals from its WIC food list in 1990, but began adding them backin 1995. The balance of store and national brands gradually shifted in later years, so that the 2001food list had 17 national brands and 14 store brands. According to State officials, the original deci-sion to drop the national brands was intended to reduce food package costs at a time when they wererising and the State was trying to stretch its food grant farther. The State began adding back nationalbrands when it became clear that participants were dissatisfied with receiving only the store brands,although the State also found that nutritional formulations were better in the national brands (forinstance, with folic acid added). To hold down the cost of adding the national brands, the State set
21 At the time of the study, Oklahoma had authorized two national brands of cereal, one for hot cereal and one that was aless popular competitor to the dominant national brand in its category. In July 2001, Oklahoma added four nationalbrands to its list of authorized cereals. One reason for this decision was declining WIC participation, which the Statethought might be influenced by the lack of national brand cereals.
26
minimum package sizes to take advantage of discounts on large packages, while still seeking to leavethe participant flexibility in filling this part of the food prescription. Each year, the State evaluates itslist of cereals for nutritional content, cost per ounce, and participant acceptance (the latter based onsurveys). Thus, the list continues to evolve as the State tracks changes in available cereals and moni-tors participant satisfaction and costs.
Package-Size Restrictions
The six States varied in their use of package-size restrictions to hold down the unit costs of WICfoods. The most notable variations were in the minimum package sizes for fluid cow’s milk, cheese,and eggs. Three States—North Carolina, Ohio, and Texas—required at least half-gallon containers offluid cow’s milk, and two States—California and Oklahoma—required gallon containers.22 Cali-fornia, North Carolina, and Texas had minimum package sizes for cheese.
The six States had similar minimum package sizes for juice, dried beans/peas, and infant cereal, withsome exceptions. Texas restricted single-strength fluid juice purchases to 46-ounce cans (excludingthe more expensive plastic bottles), and California restricted single-strength juice purchases to 64-ounce bottles (as discussed in the preceding text). Four States (all except Ohio and Oklahoma) had an18-ounce minimum package size for peanut butter.
California, Connecticut and North Carolina had standardized minimum packages sizes for all brandsof cereal, while Ohio and Oklahoma did not have minimum package sizes for cereal. Texas setdifferent minimum package sizes for cereal, depending on the type and brand, so that the minimumpackage sizes were larger for the more expensive types or brands.
Summary of Food-Item Restrictions
Table 2-3 summarizes the food-item restrictions used by each State. As the table shows, the mostcommon restrictions were minimum package sizes (used in all six States), least expensive brandrequirements (used in four States), and limits on allowed types (used in four States). Store-brandrestrictions were used in three States. Texas used all four types of food-item restrictions, whereasOhio used only one type. Chapter 3 provides detailed information on the restrictions for each WICfood group.
Communicating and Enforcing Food-Item Restrictions
The list of allowed WIC foods is the primary medium for documenting and communicating food-itemrestrictions to participants and vendors. Each State distributes a list of authorized foods to all partici-pants and vendors when they enter the WIC program. In addition, current participants and vendorsreceive updated lists when changes are made. Producing and distributing the food list is an importantand resource-intensive activity, particularly when major changes are being made.
The food lists provide information on authorized food categories, food types, and package types orsizes. When the State has a policy limiting food choices to least expensive or store brands, this isspecified on the food list. For ease of recognition by participants and vendors, several of the States
22 Different minimum package sizes applied to less commonly prescribed forms of milk, such as nonfat dry milk andlactose-reduced milk.
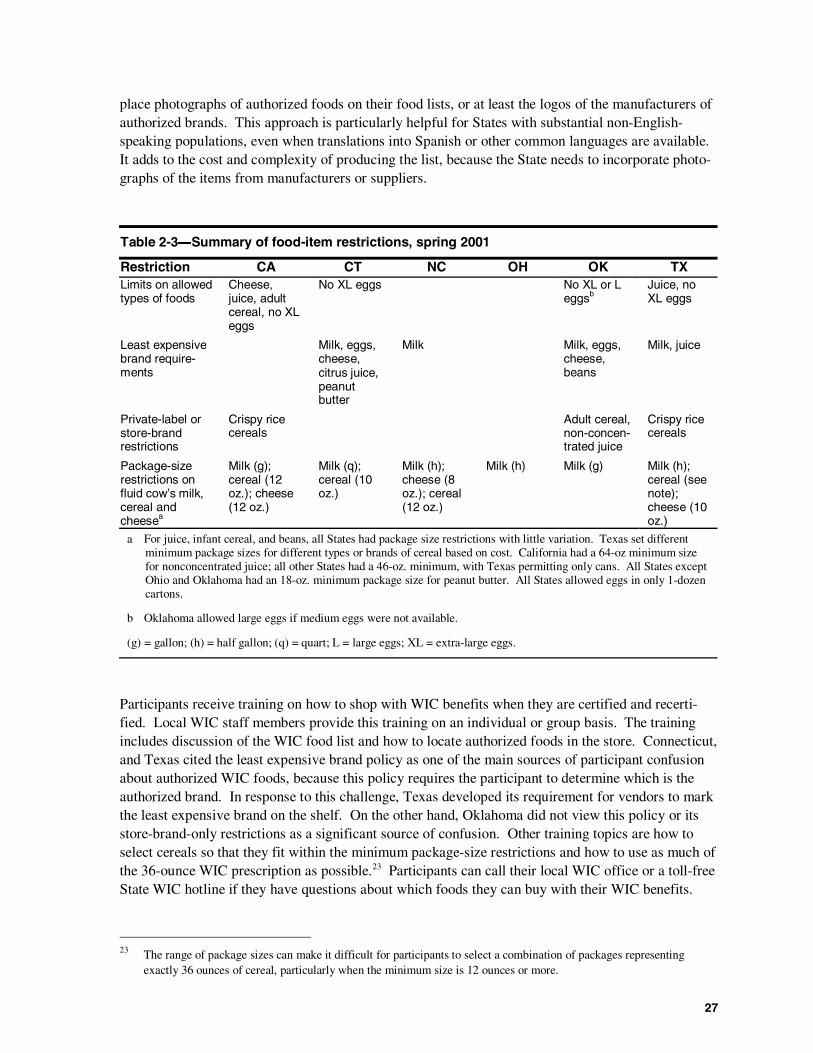
27
place photographs of authorized foods on their food lists, or at least the logos of the manufacturers ofauthorized brands. This approach is particularly helpful for States with substantial non-English-speaking populations, even when translations into Spanish or other common languages are available.It adds to the cost and complexity of producing the list, because the State needs to incorporate photo-graphs of the items from manufacturers or suppliers.
Table 2-3―Summary of food-item restrictions, spring 2001
Restriction CA CT NC OH OK TXLimits on allowedtypes of foods
Cheese,juice, adultcereal, no XLeggs
No XL eggs No XL or Leggsb
Juice, noXL eggs
Least expensivebrand require-ments
Milk, eggs,cheese,citrus juice,peanutbutter
Milk Milk, eggs,cheese,beans
Milk, juice
Private-label orstore-brandrestrictions
Crispy ricecereals
Adult cereal,non-concen-trated juice
Crispy ricecereals
Package-sizerestrictions onfluid cow’s milk,cereal andcheesea
Milk (g);cereal (12oz.); cheese(12 oz.)
Milk (q);cereal (10oz.)
Milk (h);cheese (8oz.); cereal(12 oz.)
Milk (h) Milk (g) Milk (h);cereal (seenote);cheese (10oz.)
a For juice, infant cereal, and beans, all States had package size restrictions with little variation. Texas set differentminimum package sizes for different types or brands of cereal based on cost. California had a 64-oz minimum sizefor nonconcentrated juice; all other States had a 46-oz. minimum, with Texas permitting only cans. All States exceptOhio and Oklahoma had an 18-oz. minimum package size for peanut butter. All States allowed eggs in only 1-dozencartons.
b Oklahoma allowed large eggs if medium eggs were not available.
(g) = gallon; (h) = half gallon; (q) = quart; L = large eggs; XL = extra-large eggs.
Participants receive training on how to shop with WIC benefits when they are certified and recerti-fied. Local WIC staff members provide this training on an individual or group basis. The trainingincludes discussion of the WIC food list and how to locate authorized foods in the store. Connecticut,and Texas cited the least expensive brand policy as one of the main sources of participant confusionabout authorized WIC foods, because this policy requires the participant to determine which is theauthorized brand. In response to this challenge, Texas developed its requirement for vendors to markthe least expensive brand on the shelf. On the other hand, Oklahoma did not view this policy or itsstore-brand-only restrictions as a significant source of confusion. Other training topics are how toselect cereals so that they fit within the minimum package-size restrictions and how to use as much ofthe 36-ounce WIC prescription as possible.23 Participants can call their local WIC office or a toll-freeState WIC hotline if they have questions about which foods they can buy with their WIC benefits.
23 The range of package sizes can make it difficult for participants to select a combination of packages representingexactly 36 ounces of cereal, particularly when the minimum size is 12 ounces or more.
28
All of the States provide in-person training on WIC program rules and procedures to new vendors,and periodically to current vendors. This training typically includes discussion of the WIC foodcategories and careful review of the food list. The training may be one-on-one or in a group setting,depending on the number of vendors to be trained and the available staff. The States notify vendorswhenever the WIC food list or a food package is changed.
Like the participants, vendor personnel appear to have more difficulty understanding least expensivebrand policies than other cost-containment restrictions. Checkout clerks tend to assume that the storebrand is always the authorized brand, but some of the States with this policy allow participants toselect a national brand if it is priced lower than the store brand or if the participant has a coupon toachieve this result. In Texas, the “traditionally least expensive brand” policy avoids this problem, andthe declaration of least-expensive brands helps to draw out any questions when the vendor first entersthe program. In general, the States do not view food-item restrictions as difficult to communicate tovendors, although the States with fewer restrictions reported fewer problems. Vendors can getinformation by calling WIC vendor management staff at the State level or, in North Carolina, at thelocal level.
Routinely available information does not exist to help the States enforce food-item restrictions.Vendors do not provide information on the brands or types of foods selected by participants, and onlyTexas obtains the prices of individual items. Unless a WIC representative observes a violation offood-item restrictions or receives a complaint, there is no way for the State to know that a violationhas occurred.
The States rely on preventive vendor-management practices, including training and monitoring visits,to promote compliance with food-item restrictions. None of the six States devotes substantialresources to enforcing participant and vendor compliance with food-item restrictions. They willinvestigate complaints and apply sanctions when violations are reported, but their complianceenforcement efforts focus on trafficking, overcharging, and other more serious violations. When theyattempt purchases of unauthorized items during undercover compliance investigations, they usuallychoose blatantly ineligible items such as sugar-coated cereals or sodas. Some States have found thatadministrative hearing officers are reluctant to uphold vendor sanctions based on more technicalrequirements, such as specified brands. Investigators sometimes test compliance with package sizelimits, which are viewed as easy to understand. The States, however, do remind vendors periodicallyof the potential penalties if they are found to have sold unauthorized items. Texas indicated that ithopes to begin testing for compliance with item restrictions after other enforcement priorities havebeen met.
Manufacturer Rebates
Three of the six States—California, Connecticut, and Texas—had contracts to secure rebates fromGerber Foods, a manufacturer of infant cereal. As a condition of these contracts, the States exclu-sively prescribed this brand of infant cereal. The Gerber brand was specified on the States’ WIC foodlists, and vendors were required to carry it. These contracts were established in the early 1990s, andthe States have repeated the contracting cycle several times since then.
California had rebate contracts with several juice manufacturers in FY1998 through FY2000. Underthese contracts, the State limited participant choice to the contract brand for each type of juice, and
29
the manufacturers paid rebates that reflected WIC’s impact on their sales. (California issues separateWIC checks for juice, so the total volume of WIC juice sales was known, but additional market datawere used to determine the rebate under each contract.) These contracts yielded a total of$40,554,426 in rebates over 3 years, but the State determined they were not cost-effective and did notseek a second round of bids. Despite the magnitude of the rebates, these contracts did not yield netsavings in the unit cost of juice, while imposing burdens on both participants and agency administra-tive staff. The 46-ounce container size specified in the WIC contracts was not popular among non-WIC consumers, who were buying 64-ounce containers. As a result, the cost per ounce of the 46-ounce containers after the rebate was higher than the market price per ounce of the more popular 64-ounce containers. Thus, the State determined that it could reduce juice costs by prescribing multiplesof 64-ounce containers (for participants preferring shelf-stable juice to frozen juice) and requiring aminimum package size of 64 ounces.24
The States that did not have rebates for infant cereal or other foods did not believe that the yield fromthe rebates would justify the effort to establish them and obtain reimbursement. In North Carolinaand Ohio, State officials indicated that food costs, particularly for infant cereal, did not pose a seriousproblem. Oklahoma’s choice not to pursue rebates was based in part on the State’s assessment that aninfant cereal manufacturer would not find it worthwhile to contract with a small State for thispurpose. These arguments highlight the tradeoff between the food cost savings to be realized by cost-containment practices and the WIC staff effort to administer these practices. In the case of infantcereal, three of the six States found that the scales were tipped by the potential administrative costsand the opportunity cost of not spending staff time on higher priorities.
The infant cereal rebate contracts are modeled on the States’ contracts for infant formula rebates, andthe procurement process is similar. Every 2 to 3 years, the State issues a request for proposals toqualified manufacturers of infant cereals. Interested manufacturers submit bids with specifiedrebates, and the State follows its procurement rules to select the winning bidder. Since thesecontracts were first established in the early 1990s, these States have often had only one bid. Texashad no infant cereal rebate contract for one year because it received no bids.
As specified in the rebate contracts, the States bill the selected manufacturer for rebates on a monthlybasis. The State issues a separate food instrument for infant cereal and uses redemption data to deter-mine the quantity purchased. Using the established formula for computing the rebate, the Stategenerates an invoice and sends it to the manufacturer with supporting documentation. The manufac-turer sends back the payment, which the State reviews and records in its financial records.
In addition to these exclusive rebate contracts, some of the States in the study had nonexclusiveagreements to obtain rebates or reimbursements from manufacturers or suppliers. Ohio received agrant from a national juice manufacturer equal to $1 for each 46-ounce can of the manufacturer’sjuice sold in the State. The manufacturer computed the grant amount and sent it without any billingby the State.
Connecticut received a reimbursement from milk producers under the terms of the Northeast DairyCompact. This payment was designed to offset the impact of the Compact on wholesale milk prices,so that the WIC program’s net cost for milk was the same as it would be without the compact.
24 California’s practices regarding juice prescriptions and package sizes are discussed further in Chapter 4.
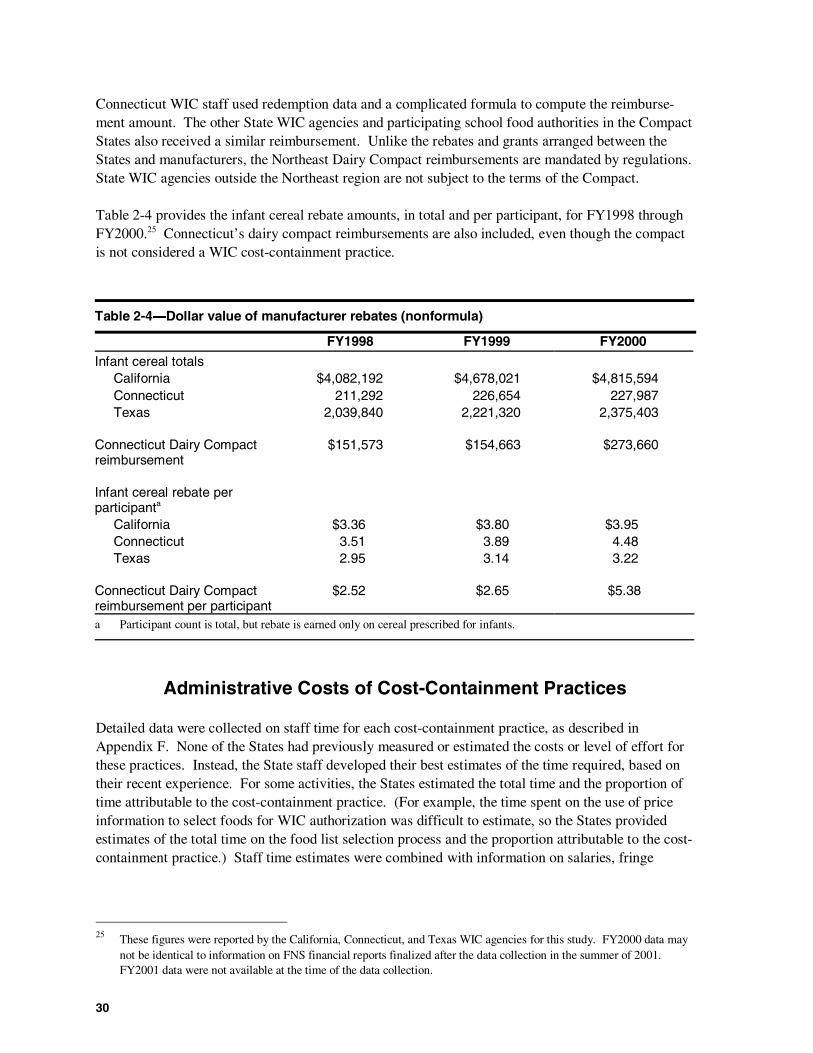
30
Connecticut WIC staff used redemption data and a complicated formula to compute the reimburse-ment amount. The other State WIC agencies and participating school food authorities in the CompactStates also received a similar reimbursement. Unlike the rebates and grants arranged between theStates and manufacturers, the Northeast Dairy Compact reimbursements are mandated by regulations.State WIC agencies outside the Northeast region are not subject to the terms of the Compact.
Table 2-4 provides the infant cereal rebate amounts, in total and per participant, for FY1998 throughFY2000.25 Connecticut’s dairy compact reimbursements are also included, even though the compactis not considered a WIC cost-containment practice.
Table 2-4―Dollar value of manufacturer rebates (nonformula)
FY1998 FY1999 FY2000
Infant cereal totalsCalifornia $4,082,192 $4,678,021 $4,815,594Connecticut 211,292 226,654 227,987Texas 2,039,840 2,221,320 2,375,403
Connecticut Dairy Compactreimbursement
$151,573 $154,663 $273,660
Infant cereal rebate perparticipanta
California $3.36 $3.80 $3.95Connecticut 3.51 3.89 4.48Texas 2.95 3.14 3.22
Connecticut Dairy Compactreimbursement per participant
$2.52 $2.65 $5.38
a Participant count is total, but rebate is earned only on cereal prescribed for infants.
Administrative Costs of Cost-Containment Practices
Detailed data were collected on staff time for each cost-containment practice, as described inAppendix F. None of the States had previously measured or estimated the costs or level of effort forthese practices. Instead, the State staff developed their best estimates of the time required, based ontheir recent experience. For some activities, the States estimated the total time and the proportion oftime attributable to the cost-containment practice. (For example, the time spent on the use of priceinformation to select foods for WIC authorization was difficult to estimate, so the States providedestimates of the total time on the food list selection process and the proportion attributable to the cost-containment practice.) Staff time estimates were combined with information on salaries, fringe
25 These figures were reported by the California, Connecticut, and Texas WIC agencies for this study. FY2000 data maynot be identical to information on FNS financial reports finalized after the data collection in the summer of 2001.FY2001 data were not available at the time of the data collection.
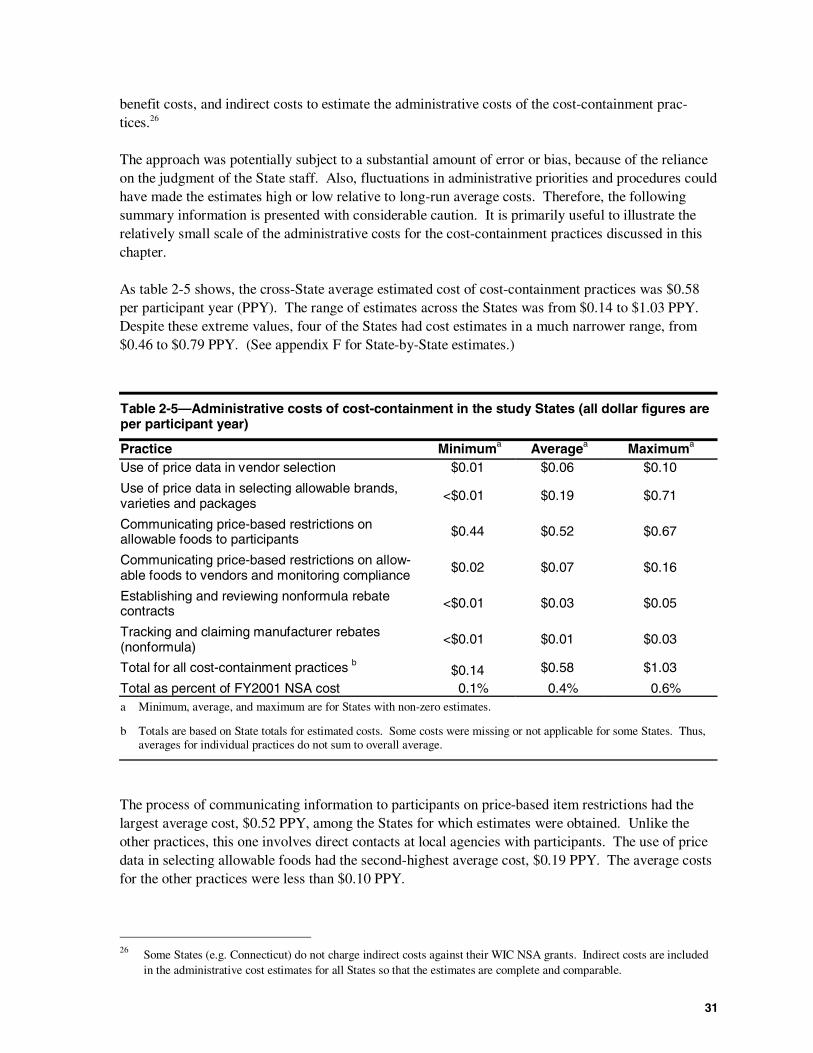
31
benefit costs, and indirect costs to estimate the administrative costs of the cost-containment prac-tices.26
The approach was potentially subject to a substantial amount of error or bias, because of the relianceon the judgment of the State staff. Also, fluctuations in administrative priorities and procedures couldhave made the estimates high or low relative to long-run average costs. Therefore, the followingsummary information is presented with considerable caution. It is primarily useful to illustrate therelatively small scale of the administrative costs for the cost-containment practices discussed in thischapter.
As table 2-5 shows, the cross-State average estimated cost of cost-containment practices was $0.58per participant year (PPY). The range of estimates across the States was from $0.14 to $1.03 PPY.Despite these extreme values, four of the States had cost estimates in a much narrower range, from$0.46 to $0.79 PPY. (See appendix F for State-by-State estimates.)
Table 2-5—Administrative costs of cost-containment in the study States (all dollar figures areper participant year)
Practice Minimuma Averagea Maximuma
Use of price data in vendor selection $0.01 $0.06 $0.10
Use of price data in selecting allowable brands,varieties and packages
<$0.01 $0.19 $0.71
Communicating price-based restrictions onallowable foods to participants
$0.44 $0.52 $0.67
Communicating price-based restrictions on allow-able foods to vendors and monitoring compliance
$0.02 $0.07 $0.16
Establishing and reviewing nonformula rebatecontracts
<$0.01 $0.03 $0.05
Tracking and claiming manufacturer rebates(nonformula)
<$0.01 $0.01 $0.03
Total for all cost-containment practices b$0.14 $0.58 $1.03
Total as percent of FY2001 NSA cost 0.1% 0.4% 0.6%a Minimum, average, and maximum are for States with non-zero estimates.
b Totals are based on State totals for estimated costs. Some costs were missing or not applicable for some States. Thus,averages for individual practices do not sum to overall average.
The process of communicating information to participants on price-based item restrictions had thelargest average cost, $0.52 PPY, among the States for which estimates were obtained. Unlike theother practices, this one involves direct contacts at local agencies with participants. The use of pricedata in selecting allowable foods had the second-highest average cost, $0.19 PPY. The average costsfor the other practices were less than $0.10 PPY.
26 Some States (e.g. Connecticut) do not charge indirect costs against their WIC NSA grants. Indirect costs are includedin the administrative cost estimates for all States so that the estimates are complete and comparable.
32
In the context of the overall costs of program administration, the cost-containment practices imple-mented by the case study States were inexpensive to operate. The estimated total administrative costsranged from $0.01 per participant per month (PPM) in Oklahoma to $0.09 PPM in Connecticut.These estimates may under- or overstate actual costs because the States could not always provideinformation needed to estimate costs for specific functions. Even allowing for a considerable marginof error, however, costs related to cost-containment were small. The estimated costs represented, onaverage, about 0.4 percent of the States’ FY2001 NSA costs, with range from 0.1 to 0.6 percent ofNSA costs.
33
Chapter 3Approved Foods and Food Selection
The food-item restrictions described in the preceding chapter result in a list of approved WIC foodsthat is unique for each State in the study. The variations in approved foods may lead to differences inaverage food package costs, availability of items in the store, participant satisfaction with andconsumption of available foods, and redemption of food instruments—topics discussed in subsequentchapters. This chapter presents details about the State lists of approved foods that will contribute tounderstanding the empirical results presented later. The chapter also gives information about the fooditems that participants purchase in each State.
WIC-Approved Foods
Chapter 2 described the types of food-item restrictions that the six States in the study used in 2001 toreduce food package costs: requiring participants to purchase the least expensive brand available forcertain prescribed foods; limiting foods to specified types and brands; and restricting packaging orpackage sizes. Table 3-1 provides a detailed listing of the foods allowed in each State in January2001, at the start of the study’s data collection period. The information was gathered through areview of each State’s list of allowed foods. These lists are usually printed in a format that can beused by WIC participants as a guide when they do their WIC shopping.
Table 3-1 is divided first by food category, with separate sections for milk, cheese, eggs, infant cereal,juice, dried beans or peas, peanut butter, and breakfast cereal. Within each section, information isprovided on allowed brands, types (or flavors), and package sizes or forms. Several sections also listtypes and package forms that are not allowed. State lists of approved WIC foods frequently identifyfoods that are often mistakenly believed (or desired) to be approved, but are not.
State lists of approved foods must conform to Federal regulations, which specify maximum quantitiesof prescribed food for seven standard food packages: two for infants that are age-dependent (foodpackages I and II); one for children or women with special dietary needs (package III); one for chil-dren aged one to five years (IV); one for pregnant and breastfeeding women (V); one for nonbreast-feeding postpartum women (VI); and an enhanced package for breastfeeding women (VII). AppendixH presents the regulation governing WIC food packages (7 CFR 246.10).
Of special note in table 3-1 is the allowed package size/form for juice in California and Connecticut.These are the only two States in the study that allow purchase of 64-ounce containers of juice; inCalifornia, these are the only allowed containers for shelf-stable, single-strength adult juice. In theregulations, however, the maximum allowable quantity for juice is not divisible by 64 (for example,92 fluid ounces for infants aged 4 through 12 months, 276 ounces for children and pregnant/breast-feeding women, and 184 ounces for nonbreastfeeding postpartum women). These maximum quanti-ties are divisible by 46, which is an allowed container size for shelf-stable juice in Connecticut andthe other States. Thus, one effect of the California restriction on package size for juice is thatmaximum allowable quantities cannot be prescribed for participants who select shelf-stable juice.1 InConnecticut, participants can purchase the maximum quantity allowed if they select 46-ounce
1 Participants in California wishing the maximum allowable amount of juice may select frozen juice.
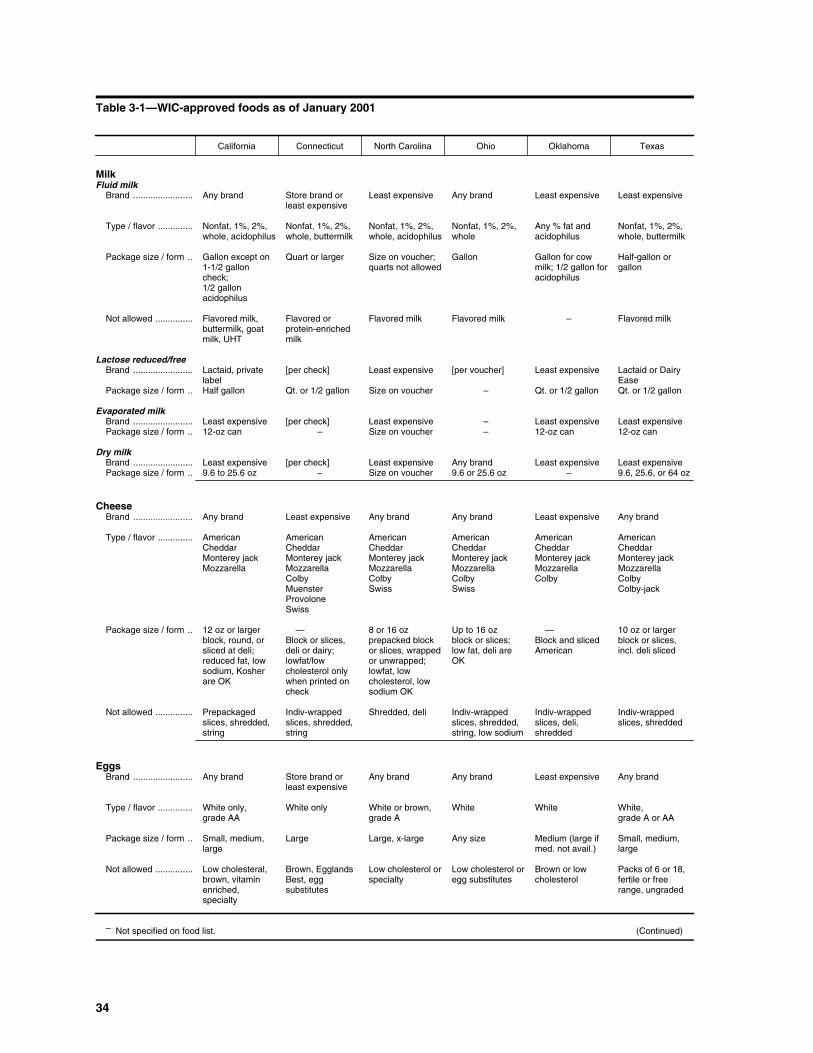
34
Table 3-1—WIC-approved foods as of January 2001
California Connecticut North Carolina Ohio Oklahoma Texas
Milk Fluid milk
Brand ........................ Any brand Store brand orleast expensive
Least expensive Any brand Least expensive Least expensive
Type / flavor .............. Nonfat, 1%, 2%,whole, acidophilus
Nonfat, 1%, 2%,whole, buttermilk
Nonfat, 1%, 2%,whole, acidophilus
Nonfat, 1%, 2%,whole
Any % fat andacidophilus
Nonfat, 1%, 2%,whole, buttermilk
Package size / form .. Gallon except on1-1/2 galloncheck;1/2 gallonacidophilus
Quart or larger Size on voucher;quarts not allowed
Gallon Gallon for cowmilk; 1/2 gallon foracidophilus
Half-gallon orgallon
Not allowed ............... Flavored milk,buttermilk, goatmilk, UHT
Flavored orprotein-enrichedmilk
Flavored milk Flavored milk – Flavored milk
Lactose reduced/freeBrand ........................ Lactaid, private
label[per check] Least expensive [per voucher] Least expensive Lactaid or Dairy
EasePackage size / form .. Half gallon Qt. or 1/2 gallon Size on voucher – Qt. or 1/2 gallon Qt. or 1/2 gallon
Evaporated milkBrand ........................ Least expensive [per check] Least expensive – Least expensive Least expensivePackage size / form .. 12-oz can – Size on voucher – 12-oz can 12-oz can
Dry milkBrand ........................ Least expensive [per check] Least expensive Any brand Least expensive Least expensivePackage size / form .. 9.6 to 25.6 oz – Size on voucher 9.6 or 25.6 oz – 9.6, 25.6, or 64 oz
Cheese Brand ........................ Any brand Least expensive Any brand Any brand Least expensive Any brand
Type / flavor .............. AmericanCheddarMonterey jackMozzarella
AmericanCheddarMonterey jackMozzarellaColbyMuensterProvoloneSwiss
AmericanCheddarMonterey jackMozzarellaColbySwiss
AmericanCheddarMonterey jackMozzarellaColbySwiss
AmericanCheddarMonterey jackMozzarellaColby
AmericanCheddarMonterey jackMozzarellaColbyColby-jack
Package size / form .. 12 oz or largerblock, round, orsliced at deli; reduced fat, lowsodium, Kosherare OK
—Block or slices,deli or dairy;lowfat/lowcholesterol onlywhen printed oncheck
8 or 16 ozprepacked blockor slices, wrappedor unwrapped;lowfat, lowcholesterol, lowsodium OK
Up to 16 ozblock or slices;low fat, deli areOK
—Block and slicedAmerican
10 oz or largerblock or slices,incl. deli sliced
Not allowed ............... Prepackagedslices, shredded,string
Indiv-wrappedslices, shredded,string
Shredded, deli Indiv-wrappedslices, shredded,string, low sodium
Indiv-wrappedslices, deli,shredded
Indiv-wrappedslices, shredded
Eggs Brand ........................ Any brand Store brand or
least expensiveAny brand Any brand Least expensive Any brand
Type / flavor .............. White only,grade AA
White only White or brown,grade A
White White White,grade A or AA
Package size / form .. Small, medium,large
Large Large, x-large Any size Medium (large ifmed. not avail.)
Small, medium,large
Not allowed ............... Low cholesteral,brown, vitaminenriched,specialty
Brown, EgglandsBest, eggsubstitutes
Low cholesterol orspecialty
Low cholesterol oregg substitutes
Brown or lowcholesterol
Packs of 6 or 18,fertile or freerange, ungraded
– Not specified on food list. (Continued)
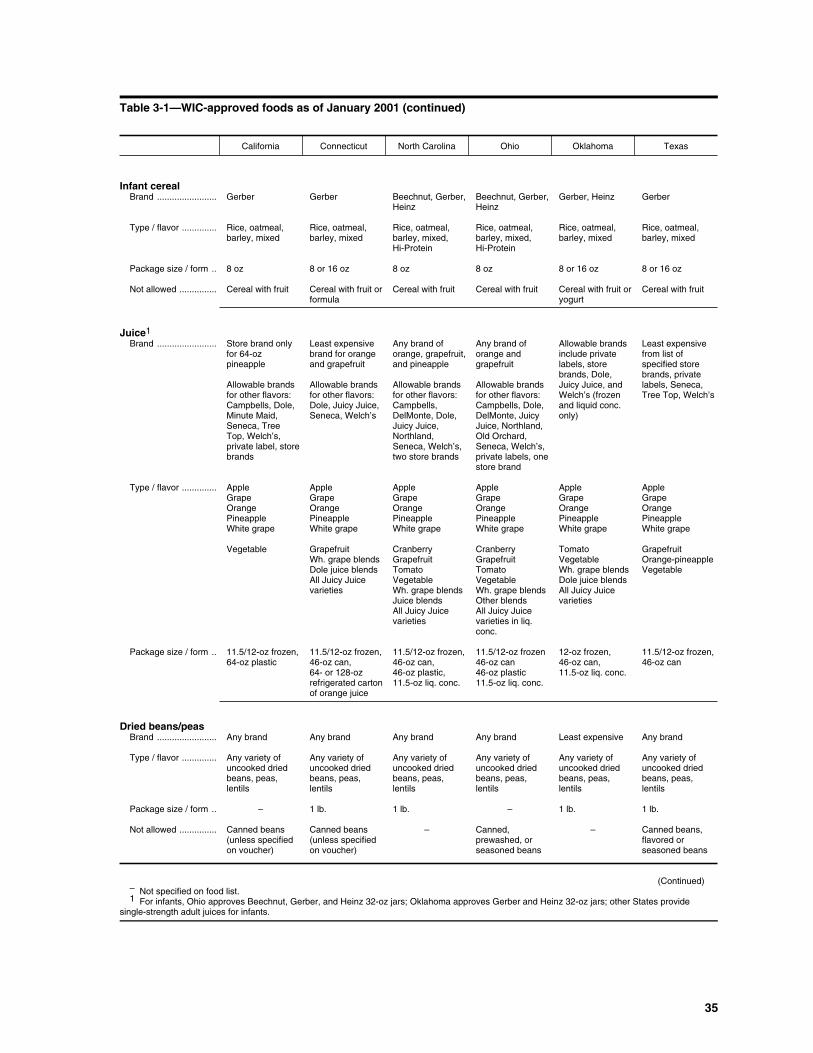
35
Table 3-1—WIC-approved foods as of January 2001 (continued)
California Connecticut North Carolina Ohio Oklahoma Texas
Infant cerealBrand ........................ Gerber Gerber Beechnut, Gerber,
HeinzBeechnut, Gerber,Heinz
Gerber, Heinz Gerber
Type / flavor .............. Rice, oatmeal,barley, mixed
Rice, oatmeal,barley, mixed
Rice, oatmeal,barley, mixed,Hi-Protein
Rice, oatmeal,barley, mixed,Hi-Protein
Rice, oatmeal,barley, mixed
Rice, oatmeal,barley, mixed
Package size / form .. 8 oz 8 or 16 oz 8 oz 8 oz 8 or 16 oz 8 or 16 oz
Not allowed ............... Cereal with fruit Cereal with fruit orformula
Cereal with fruit Cereal with fruit Cereal with fruit oryogurt
Cereal with fruit
Juice1Brand ........................ Store brand only
for 64-ozpineapple
Allowable brandsfor other flavors: Campbells, Dole,Minute Maid,Seneca, TreeTop, Welch’s,private label, storebrands
Least expensivebrand for orangeand grapefruit
Allowable brandsfor other flavors:Dole, Juicy Juice,Seneca, Welch’s
Any brand oforange, grapefruit,and pineapple
Allowable brandsfor other flavors: Campbells,DelMonte, Dole,Juicy Juice,Northland,Seneca, Welch’s,two store brands
Any brand oforange andgrapefruit
Allowable brandsfor other flavors: Campbells, Dole,DelMonte, JuicyJuice, Northland,Old Orchard,Seneca, Welch’s,private labels, onestore brand
Allowable brandsinclude privatelabels, storebrands, Dole,Juicy Juice, andWelch’s (frozenand liquid conc.only)
Least expensivefrom list ofspecified storebrands, privatelabels, Seneca,Tree Top, Welch’s
Type / flavor .............. AppleGrapeOrangePineappleWhite grape
Vegetable
AppleGrapeOrangePineappleWhite grape
GrapefruitWh. grape blendsDole juice blendsAll Juicy Juicevarieties
AppleGrapeOrangePineappleWhite grape
CranberryGrapefruitTomatoVegetableWh. grape blendsJuice blendsAll Juicy Juicevarieties
AppleGrapeOrangePineappleWhite grape
CranberryGrapefruitTomatoVegetableWh. grape blendsOther blendsAll Juicy Juicevarieties in liq.conc.
AppleGrapeOrangePineappleWhite grape
TomatoVegetableWh. grape blendsDole juice blendsAll Juicy Juicevarieties
AppleGrapeOrangePineappleWhite grape
GrapefruitOrange-pineappleVegetable
Package size / form .. 11.5/12-oz frozen,64-oz plastic
11.5/12-oz frozen,46-oz can,64- or 128-ozrefrigerated cartonof orange juice
11.5/12-oz frozen,46-oz can,46-oz plastic,11.5-oz liq. conc.
11.5/12-oz frozen46-oz can46-oz plastic11.5-oz liq. conc.
12-oz frozen,46-oz can,11.5-oz liq. conc.
11.5/12-oz frozen,46-oz can
Dried beans/peasBrand ........................ Any brand Any brand Any brand Any brand Least expensive Any brand
Type / flavor .............. Any variety ofuncooked driedbeans, peas,lentils
Any variety ofuncooked driedbeans, peas,lentils
Any variety ofuncooked driedbeans, peas,lentils
Any variety ofuncooked driedbeans, peas,lentils
Any variety ofuncooked driedbeans, peas,lentils
Any variety ofuncooked driedbeans, peas,lentils
Package size / form .. – 1 lb. 1 lb. – 1 lb. 1 lb.
Not allowed ............... Canned beans(unless specifiedon voucher)
Canned beans(unless specifiedon voucher)
– Canned,prewashed, orseasoned beans
– Canned beans,flavored orseasoned beans
(Continued)– Not specified on food list.1 For infants, Ohio approves Beechnut, Gerber, and Heinz 32-oz jars; Oklahoma approves Gerber and Heinz 32-oz jars; other States provide
single-strength adult juices for infants.
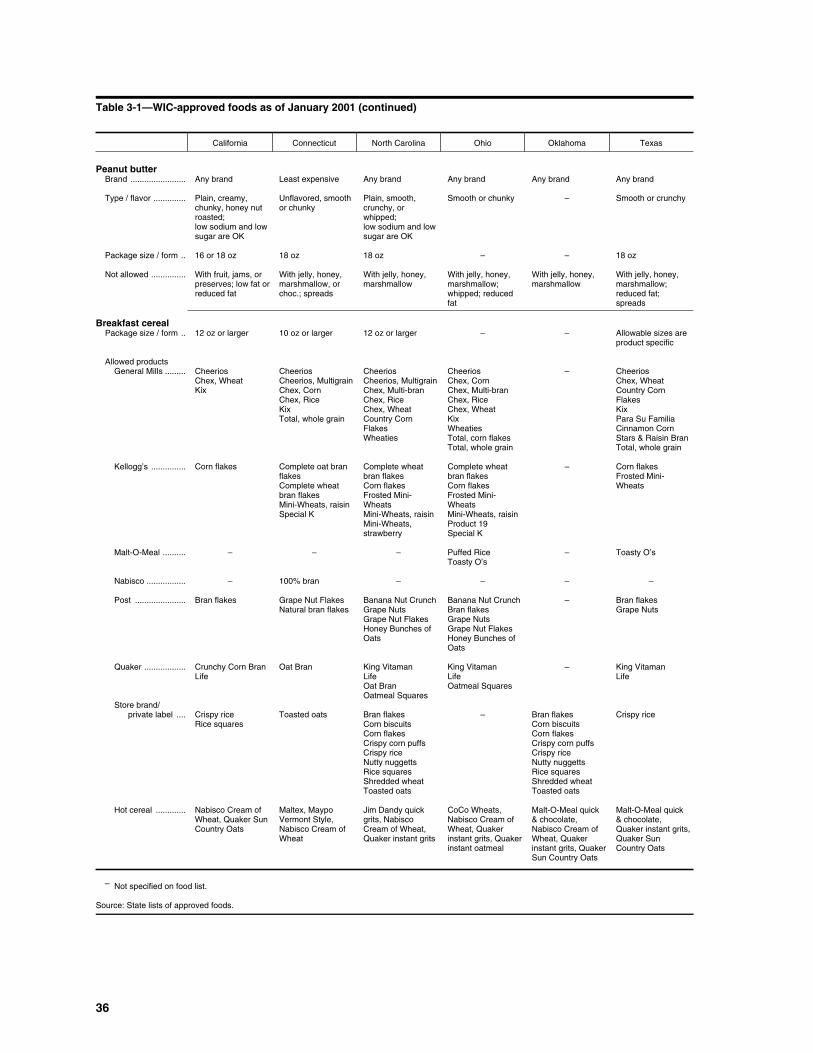
36
Table 3-1—WIC-approved foods as of January 2001 (continued)
California Connecticut North Carolina Ohio Oklahoma Texas
Peanut butterBrand ........................ Any brand Least expensive Any brand Any brand Any brand Any brand
Type / flavor .............. Plain, creamy,chunky, honey nutroasted; low sodium and lowsugar are OK
Unflavored, smoothor chunky
Plain, smooth,crunchy, orwhipped;low sodium and lowsugar are OK
Smooth or chunky – Smooth or crunchy
Package size / form .. 16 or 18 oz 18 oz 18 oz – – 18 oz
Not allowed ............... With fruit, jams, orpreserves; low fat orreduced fat
With jelly, honey,marshmallow, orchoc.; spreads
With jelly, honey,marshmallow
With jelly, honey,marshmallow;whipped; reducedfat
With jelly, honey,marshmallow
With jelly, honey,marshmallow;reduced fat;spreads
Breakfast cerealPackage size / form .. 12 oz or larger 10 oz or larger 12 oz or larger – – Allowable sizes are
product specific
Allowed productsGeneral Mills ......... Cheerios
Chex, WheatKix
CheeriosCheerios, MultigrainChex, CornChex, RiceKixTotal, whole grain
CheeriosCheerios, MultigrainChex, Multi-branChex, RiceChex, WheatCountry CornFlakesWheaties
CheeriosChex, CornChex, Multi-branChex, RiceChex, WheatKixWheatiesTotal, corn flakesTotal, whole grain
– CheeriosChex, WheatCountry CornFlakesKixPara Su FamiliaCinnamon CornStars & Raisin BranTotal, whole grain
Kellogg’s ............... Corn flakes Complete oat branflakesComplete wheatbran flakesMini-Wheats, raisinSpecial K
Complete wheatbran flakesCorn flakesFrosted Mini-WheatsMini-Wheats, raisinMini-Wheats,strawberry
Complete wheatbran flakesCorn flakesFrosted Mini-WheatsMini-Wheats, raisin Product 19Special K
– Corn flakesFrosted Mini-Wheats
Malt-O-Meal .......... – – – Puffed RiceToasty O’s
– Toasty O’s
Nabisco ................. – 100% bran – – – –
Post ...................... Bran flakes Grape Nut FlakesNatural bran flakes
Banana Nut CrunchGrape NutsGrape Nut FlakesHoney Bunches ofOats
Banana Nut CrunchBran flakesGrape NutsGrape Nut FlakesHoney Bunches ofOats
– Bran flakesGrape Nuts
Quaker .................. Crunchy Corn BranLife
Oat Bran King VitamanLifeOat BranOatmeal Squares
King VitamanLifeOatmeal Squares
– King VitamanLife
Store brand/private label .... Crispy rice
Rice squaresToasted oats Bran flakes
Corn biscuitsCorn flakesCrispy corn puffsCrispy riceNutty nuggettsRice squaresShredded wheatToasted oats
– Bran flakesCorn biscuitsCorn flakesCrispy corn puffsCrispy riceNutty nuggettsRice squaresShredded wheatToasted oats
Crispy rice
Hot cereal ............. Nabisco Cream ofWheat, Quaker SunCountry Oats
Maltex, MaypoVermont Style,Nabisco Cream ofWheat
Jim Dandy quickgrits, NabiscoCream of Wheat,Quaker instant grits
CoCo Wheats,Nabisco Cream ofWheat, Quakerinstant grits, Quakerinstant oatmeal
Malt-O-Meal quick& chocolate,Nabisco Cream ofWheat, Quakerinstant grits, QuakerSun Country Oats
Malt-O-Meal quick& chocolate,Quaker instant grits,Quaker SunCountry Oats
– Not specified on food list.
Source: State lists of approved foods.
37
containers of juice, but they restrict the amount they can purchase if they select 64- or 128-ouncecontainers.
The information in table 3-1 is the basis of much of the analyses reported in following chapters. Forinstance, the Survey of WIC Participants asked respondents which nonapproved food items theywould buy with their WIC benefits if allowed. The State lists were then used to determine which ofthese preferred items were actually approved.
Actual Food Selections
This study uses information about the actual food selections of WIC participants from two differentsources: the Survey of WIC Participants, and scanner data on WIC transactions collected from super-market chains in five of the six case study States. As discussed below, these data sources provide twodifferent perspectives on WIC food purchases.
Survey Data on Purchases
The Survey of WIC Participants provides information on the percentage of respondents in each Statewho purchased different food items using their WIC food instruments. The survey first asked, fordifferent categories of WIC foods, whether the food was prescribed for the respondent or her child. Ifit was, detailed information was collected about the items purchased, for example, the types of cheese(e.g., American, Cheddar, Colby, and Monterey jack) and their brands. For each item, the surveyasked how it was packaged (e.g., blocked, sliced and prepackaged, sliced and individually wrapped,sliced and not individually wrapped). These data give a very detailed picture of what WIC partici-pants in each study State were buying with their WIC benefits. Table 3-2 presents the survey-basedinformation on WIC-purchased foods.
Table 3-2 is organized into sections for different food categories. Within each category, surveyrespondents’ purchases are broken out by type or flavor, brand (summarized primarily as national,private label, or store brand), and package size. The percentages within each column section total tomore than 100 percent when respondents reported buying more than one type of food within a cate-gory. For instance, 86.0 percent of Connecticut respondents said they purchased whole milk withtheir WIC instrument, and 19.9 percent said they bought 2% reduced-fat milk, implying that at least5.9 percent of respondents purchased both milk types.
The information in table 3-2 provides several interesting facts about the WIC buying habits of partici-pants in the six States. One is that the survey respondents occasionally reported buying food itemsthat were not approved for WIC purchase in their State. An example is milk in quart containers,which is approved only in Connecticut. For the most part, however, few respondents reportedpurchases of nonapproved items, and later evidence on actual purchases suggests some reporting erroramong the respondents.
38
The data in table 3-2 can also be used to examine the extent to which survey respondents in Stateswithout restrictions purchase food items restricted in other States. As an example, Ohio and Okla-homa restrict milk purchases to gallon containers. By contrast, in States where participants canchoose between half-gallon and gallon containers, sizeable proportions of survey respondents saidthey purchased half-gallons (70.1 percent in Connecticut and 78.5 percent in Texas). Variationsacross States in consumer demand, WIC prescriptions, and market supply mean the State-levelpercentages in table 3-2 are not directly comparable, but it does appear that a sizeable percentage ofWIC participants in Ohio and Oklahoma might prefer to buy milk in half-gallon containers if allowed.Other notable examples where participant choice may be affected by food-item restrictions includethe following:
• Large percentages of respondents in Ohio and Oklahoma (19.4 and 18.7 percent,respectively) reported buying Colby cheese, which is not approved for purchase inCalifornia.
• North Carolina is the only State within the group that allows purchase of individuallywrapped, sliced cheese. Its popularity within the State is apparent, with 45.2 percent ofsurvey respondents with cheese in their WIC prescription saying they purchased thewrapped singles.
• North Carolina and Oklahoma were the only States in the study that included significantnumbers of store-brand or private-label cereals on their lists of approved foods. UnlikeOklahoma, North Carolina also allowed national cereal brands. When given the choice,survey respondents in North Carolina overwhelmingly preferred the national brands ofcereal, suggesting that Oklahoma’s policy may have affected participant choice there.
Of course, the fact that a restricted item in one State is purchased frequently in another does notnecessarily mean that WIC participants in the State with restrictions are dissatisfied with their array ofapproved food items. There may not be a strong demand for the restricted item, or close substitutesmay be available. For example, relatively few respondents in Connecticut, North Carolina, and Texassaid they purchased Colby cheese, even though it was approved in all three States. The topics ofsatisfaction with approved foods and preferences for restricted foods are examined in chapter 6.
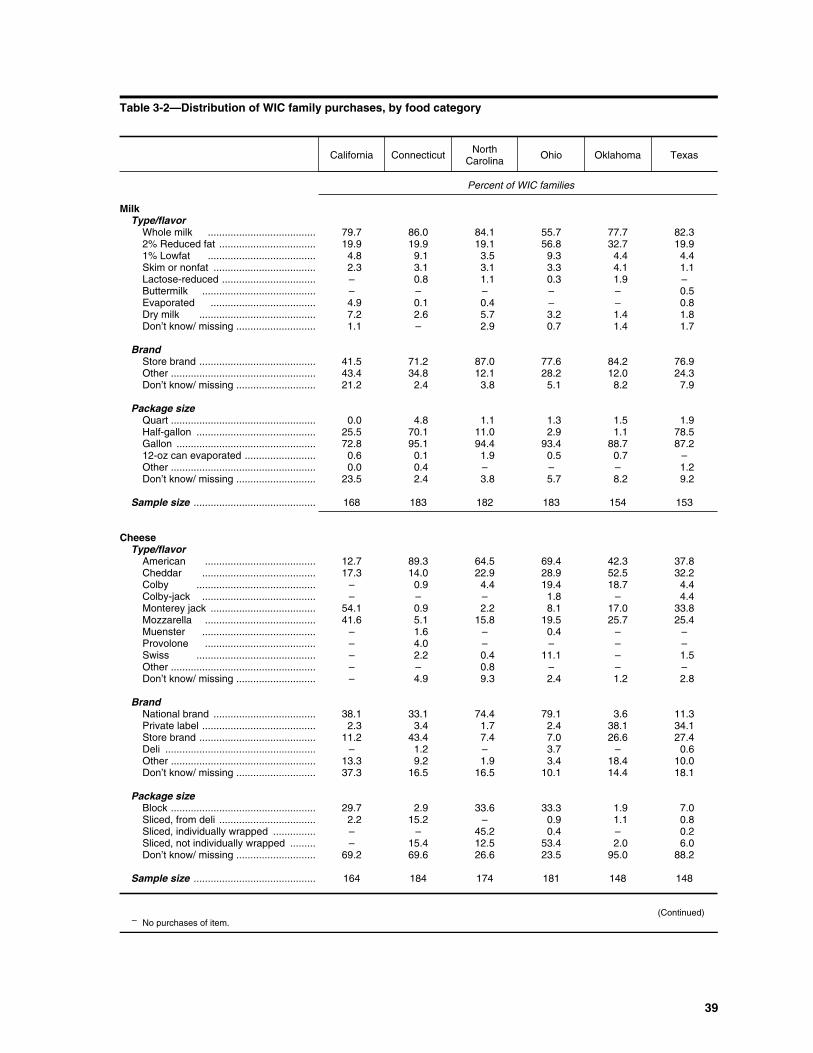
39
Table 3-2—Distribution of WIC family purchases, by food category
California Connecticut NorthCarolina Ohio Oklahoma Texas
Percent of WIC families
Milk Type/flavor
Whole milk ...................................... 79.7 86.0 84.1 55.7 77.7 82.32% Reduced fat .................................. 19.9 19.9 19.1 56.8 32.7 19.91% Lowfat ...................................... 4.8 9.1 3.5 9.3 4.4 4.4Skim or nonfat .................................... 2.3 3.1 3.1 3.3 4.1 1.1Lactose-reduced ................................. – 0.8 1.1 0.3 1.9 –Buttermilk ........................................ – – – – – 0.5Evaporated ..................................... 4.9 0.1 0.4 – – 0.8Dry milk ......................................... 7.2 2.6 5.7 3.2 1.4 1.8Don’t know/ missing ............................ 1.1 – 2.9 0.7 1.4 1.7
BrandStore brand ......................................... 41.5 71.2 87.0 77.6 84.2 76.9Other ................................................... 43.4 34.8 12.1 28.2 12.0 24.3Don’t know/ missing ............................ 21.2 2.4 3.8 5.1 8.2 7.9
Package sizeQuart ................................................... 0.0 4.8 1.1 1.3 1.5 1.9Half-gallon .......................................... 25.5 70.1 11.0 2.9 1.1 78.5Gallon ................................................. 72.8 95.1 94.4 93.4 88.7 87.212-oz can evaporated ......................... 0.6 0.1 1.9 0.5 0.7 –Other ................................................... 0.0 0.4 – – – 1.2Don’t know/ missing ............................ 23.5 2.4 3.8 5.7 8.2 9.2
Sample size ........................................... 168 183 182 183 154 153
Cheese Type/flavor
American ....................................... 12.7 89.3 64.5 69.4 42.3 37.8Cheddar ........................................ 17.3 14.0 22.9 28.9 52.5 32.2Colby .......................................... – 0.9 4.4 19.4 18.7 4.4Colby-jack ........................................ – – – 1.8 – 4.4Monterey jack ..................................... 54.1 0.9 2.2 8.1 17.0 33.8Mozzarella ....................................... 41.6 5.1 15.8 19.5 25.7 25.4Muenster ........................................ – 1.6 – 0.4 – –Provolone ....................................... – 4.0 – – – –Swiss .......................................... – 2.2 0.4 11.1 – 1.5Other ................................................... – – 0.8 – – –Don’t know/ missing ............................ – 4.9 9.3 2.4 1.2 2.8
BrandNational brand .................................... 38.1 33.1 74.4 79.1 3.6 11.3Private label ........................................ 2.3 3.4 1.7 2.4 38.1 34.1Store brand ......................................... 11.2 43.4 7.4 7.0 26.6 27.4Deli ..................................................... – 1.2 – 3.7 – 0.6Other ................................................... 13.3 9.2 1.9 3.4 18.4 10.0Don’t know/ missing ............................ 37.3 16.5 16.5 10.1 14.4 18.1
Package sizeBlock ................................................... 29.7 2.9 33.6 33.3 1.9 7.0Sliced, from deli .................................. 2.2 15.2 – 0.9 1.1 0.8Sliced, individually wrapped ............... – – 45.2 0.4 – 0.2Sliced, not individually wrapped ......... – 15.4 12.5 53.4 2.0 6.0Don’t know/ missing ............................ 69.2 69.6 26.6 23.5 95.0 88.2
Sample size ........................................... 164 184 174 181 148 148
(Continued)– No purchases of item.
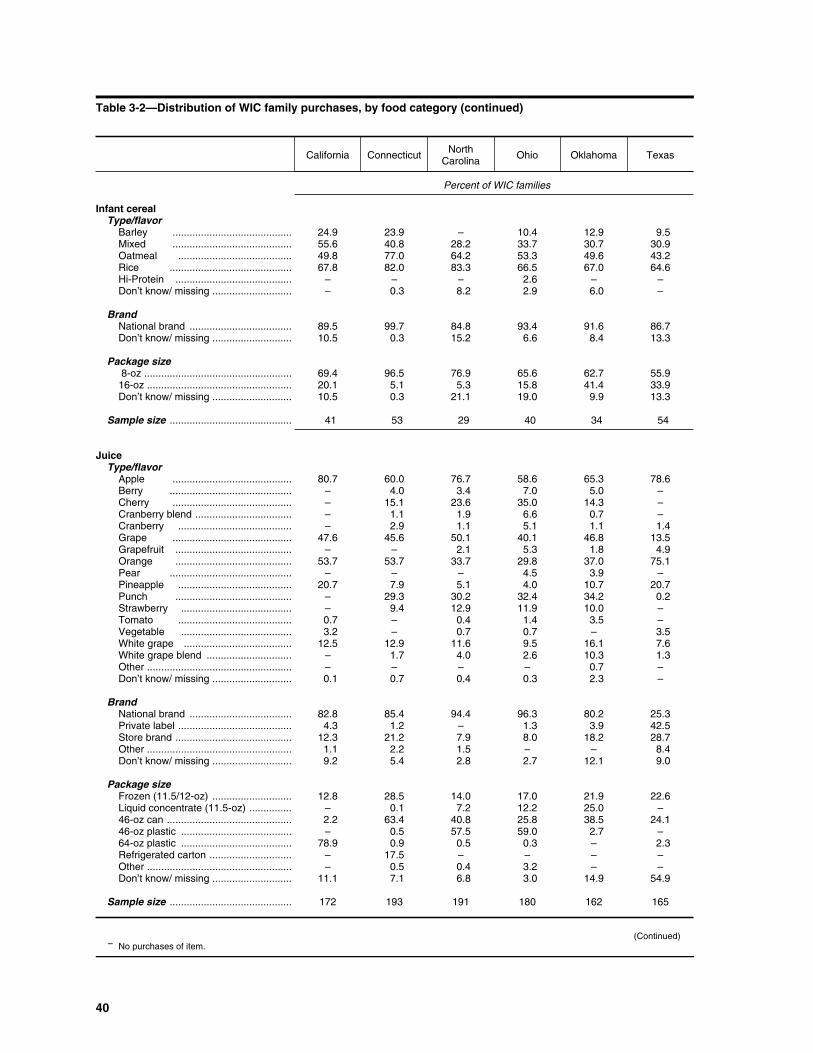
40
Table 3-2—Distribution of WIC family purchases, by food category (continued)
California Connecticut NorthCarolina Ohio Oklahoma Texas
Percent of WIC families
Infant cerealType/flavor
Barley .......................................... 24.9 23.9 – 10.4 12.9 9.5Mixed .......................................... 55.6 40.8 28.2 33.7 30.7 30.9Oatmeal ........................................ 49.8 77.0 64.2 53.3 49.6 43.2Rice ........................................... 67.8 82.0 83.3 66.5 67.0 64.6Hi-Protein ......................................... – – – 2.6 – –Don’t know/ missing ............................ – 0.3 8.2 2.9 6.0 –
BrandNational brand .................................... 89.5 99.7 84.8 93.4 91.6 86.7Don’t know/ missing ............................ 10.5 0.3 15.2 6.6 8.4 13.3
Package size 8-oz .................................................... 69.4 96.5 76.9 65.6 62.7 55.916-oz ................................................... 20.1 5.1 5.3 15.8 41.4 33.9Don’t know/ missing ............................ 10.5 0.3 21.1 19.0 9.9 13.3
Sample size ........................................... 41 53 29 40 34 54
Juice Type/flavor
Apple .......................................... 80.7 60.0 76.7 58.6 65.3 78.6Berry ........................................... – 4.0 3.4 7.0 5.0 –Cherry .......................................... – 15.1 23.6 35.0 14.3 –Cranberry blend .................................. – 1.1 1.9 6.6 0.7 –Cranberry ........................................ – 2.9 1.1 5.1 1.1 1.4Grape .......................................... 47.6 45.6 50.1 40.1 46.8 13.5Grapefruit ......................................... – – 2.1 5.3 1.8 4.9Orange ......................................... 53.7 53.7 33.7 29.8 37.0 75.1Pear ........................................... – – – 4.5 3.9 –Pineapple ........................................ 20.7 7.9 5.1 4.0 10.7 20.7Punch ......................................... – 29.3 30.2 32.4 34.2 0.2Strawberry ....................................... – 9.4 12.9 11.9 10.0 –Tomato ........................................ 0.7 – 0.4 1.4 3.5 –Vegetable ....................................... 3.2 – 0.7 0.7 – 3.5White grape ...................................... 12.5 12.9 11.6 9.5 16.1 7.6White grape blend .............................. – 1.7 4.0 2.6 10.3 1.3Other ................................................... – – – – 0.7 –Don’t know/ missing ............................ 0.1 0.7 0.4 0.3 2.3 –
BrandNational brand .................................... 82.8 85.4 94.4 96.3 80.2 25.3Private label ........................................ 4.3 1.2 – 1.3 3.9 42.5Store brand ......................................... 12.3 21.2 7.9 8.0 18.2 28.7Other ................................................... 1.1 2.2 1.5 – – 8.4Don’t know/ missing ............................ 9.2 5.4 2.8 2.7 12.1 9.0
Package sizeFrozen (11.5/12-oz) ............................ 12.8 28.5 14.0 17.0 21.9 22.6Liquid concentrate (11.5-oz) ............... – 0.1 7.2 12.2 25.0 –46-oz can ............................................ 2.2 63.4 40.8 25.8 38.5 24.146-oz plastic ....................................... – 0.5 57.5 59.0 2.7 –64-oz plastic ....................................... 78.9 0.9 0.5 0.3 – 2.3Refrigerated carton ............................. – 17.5 – – – –Other ................................................... – 0.5 0.4 3.2 – –Don’t know/ missing ............................ 11.1 7.1 6.8 3.0 14.9 54.9
Sample size ........................................... 172 193 191 180 162 165
(Continued)– No purchases of item.
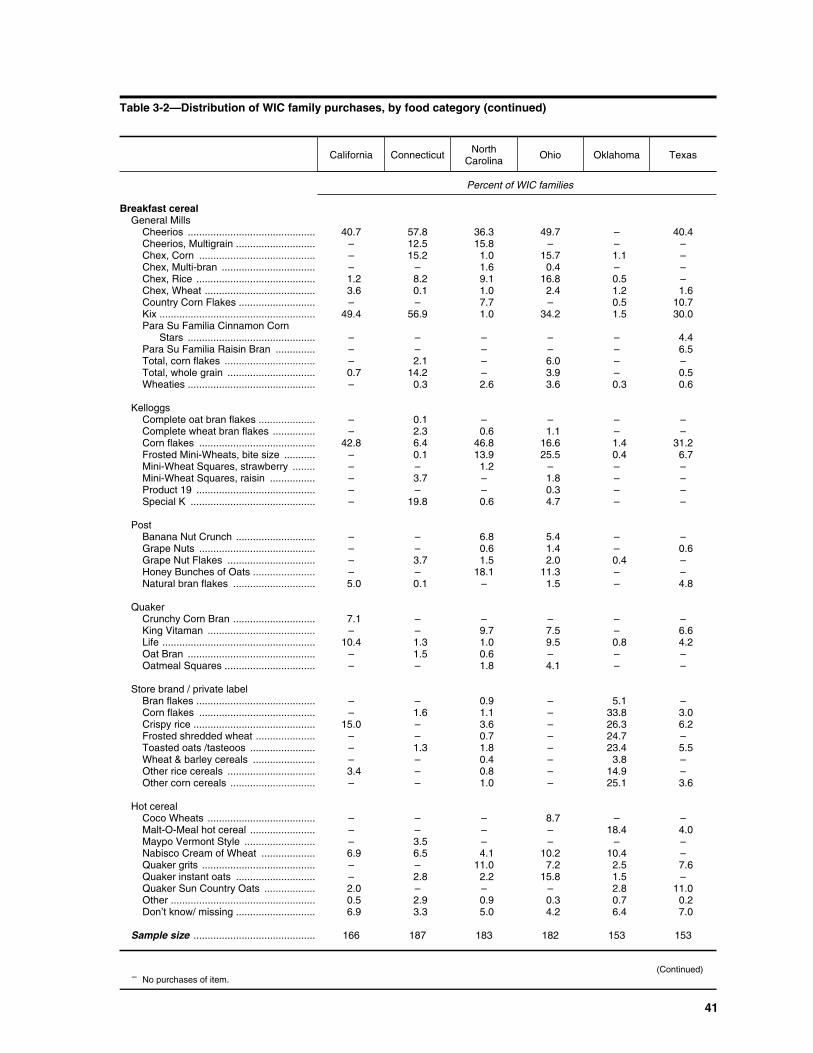
41
Table 3-2—Distribution of WIC family purchases, by food category (continued)
California Connecticut NorthCarolina Ohio Oklahoma Texas
Percent of WIC families
Breakfast cerealGeneral Mills
Cheerios ............................................. 40.7 57.8 36.3 49.7 – 40.4Cheerios, Multigrain ............................ – 12.5 15.8 – – –Chex, Corn ......................................... – 15.2 1.0 15.7 1.1 –Chex, Multi-bran ................................. – – 1.6 0.4 – –Chex, Rice .......................................... 1.2 8.2 9.1 16.8 0.5 –Chex, Wheat ....................................... 3.6 0.1 1.0 2.4 1.2 1.6Country Corn Flakes ........................... – – 7.7 – 0.5 10.7Kix ....................................................... 49.4 56.9 1.0 34.2 1.5 30.0Para Su Familia Cinnamon Corn
Stars ............................................. – – – – – 4.4Para Su Familia Raisin Bran .............. – – – – – 6.5Total, corn flakes ................................ – 2.1 – 6.0 – –Total, whole grain ............................... 0.7 14.2 – 3.9 – 0.5Wheaties ............................................. – 0.3 2.6 3.6 0.3 0.6
KelloggsComplete oat bran flakes .................... – 0.1 – – – –Complete wheat bran flakes ............... – 2.3 0.6 1.1 – –Corn flakes ......................................... 42.8 6.4 46.8 16.6 1.4 31.2Frosted Mini-Wheats, bite size ........... – 0.1 13.9 25.5 0.4 6.7Mini-Wheat Squares, strawberry ........ – – 1.2 – – –Mini-Wheat Squares, raisin ................ – 3.7 – 1.8 – –Product 19 .......................................... – – – 0.3 – –Special K ............................................ – 19.8 0.6 4.7 – –
PostBanana Nut Crunch ............................ – – 6.8 5.4 – –Grape Nuts ......................................... – – 0.6 1.4 – 0.6Grape Nut Flakes ............................... – 3.7 1.5 2.0 0.4 –Honey Bunches of Oats ...................... – – 18.1 11.3 – –Natural bran flakes ............................. 5.0 0.1 – 1.5 – 4.8
QuakerCrunchy Corn Bran ............................. 7.1 – – – – –King Vitaman ...................................... – – 9.7 7.5 – 6.6Life ...................................................... 10.4 1.3 1.0 9.5 0.8 4.2Oat Bran ............................................. – 1.5 0.6 – – –Oatmeal Squares ................................ – – 1.8 4.1 – –
Store brand / private labelBran flakes .......................................... – – 0.9 – 5.1 –Corn flakes ......................................... – 1.6 1.1 – 33.8 3.0Crispy rice ........................................... 15.0 – 3.6 – 26.3 6.2Frosted shredded wheat ..................... – – 0.7 – 24.7 –Toasted oats /tasteoos ....................... – 1.3 1.8 – 23.4 5.5Wheat & barley cereals ...................... – – 0.4 – 3.8 –Other rice cereals ............................... 3.4 – 0.8 – 14.9 –Other corn cereals .............................. – – 1.0 – 25.1 3.6
Hot cerealCoco Wheats ...................................... – – – 8.7 – –Malt-O-Meal hot cereal ....................... – – – – 18.4 4.0Maypo Vermont Style ......................... – 3.5 – – – –Nabisco Cream of Wheat ................... 6.9 6.5 4.1 10.2 10.4 –Quaker grits ........................................ – – 11.0 7.2 2.5 7.6Quaker instant oats ............................ – 2.8 2.2 15.8 1.5 –Quaker Sun Country Oats .................. 2.0 – – – 2.8 11.0Other ................................................... 0.5 2.9 0.9 0.3 0.7 0.2Don’t know/ missing ............................ 6.9 3.3 5.0 4.2 6.4 7.0
Sample size ........................................... 166 187 183 182 153 153
(Continued)– No purchases of item.
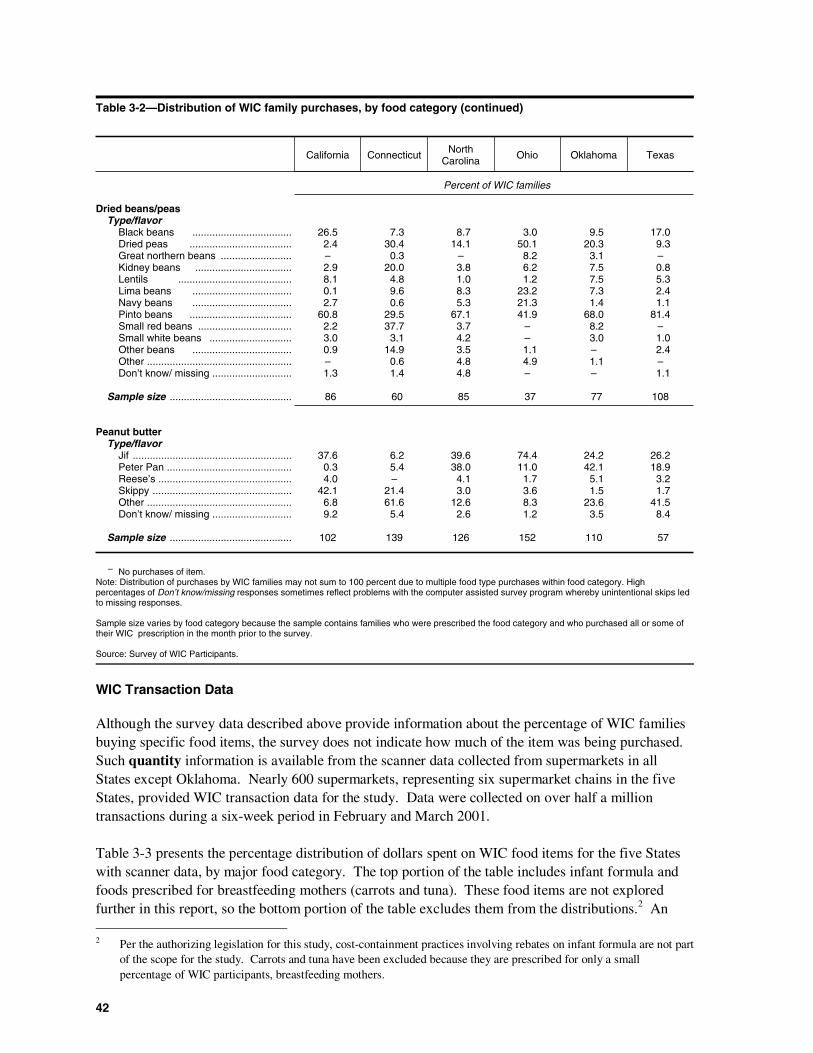
42
Table 3-2—Distribution of WIC family purchases, by food category (continued)
California Connecticut NorthCarolina Ohio Oklahoma Texas
Percent of WIC families
Dried beans/peasType/flavor
Black beans ................................... 26.5 7.3 8.7 3.0 9.5 17.0Dried peas .................................... 2.4 30.4 14.1 50.1 20.3 9.3Great northern beans ......................... – 0.3 – 8.2 3.1 –Kidney beans .................................. 2.9 20.0 3.8 6.2 7.5 0.8Lentils ........................................ 8.1 4.8 1.0 1.2 7.5 5.3Lima beans ................................... 0.1 9.6 8.3 23.2 7.3 2.4Navy beans ................................... 2.7 0.6 5.3 21.3 1.4 1.1Pinto beans .................................... 60.8 29.5 67.1 41.9 68.0 81.4Small red beans ................................. 2.2 37.7 3.7 – 8.2 –Small white beans ............................. 3.0 3.1 4.2 – 3.0 1.0Other beans ................................... 0.9 14.9 3.5 1.1 – 2.4Other ................................................... – 0.6 4.8 4.9 1.1 –Don’t know/ missing ............................ 1.3 1.4 4.8 – – 1.1
Sample size ........................................... 86 60 85 37 77 108
Peanut butterType/flavor
Jif ........................................................ 37.6 6.2 39.6 74.4 24.2 26.2Peter Pan ............................................ 0.3 5.4 38.0 11.0 42.1 18.9Reese’s ............................................... 4.0 – 4.1 1.7 5.1 3.2Skippy ................................................. 42.1 21.4 3.0 3.6 1.5 1.7Other ................................................... 6.8 61.6 12.6 8.3 23.6 41.5Don’t know/ missing ............................ 9.2 5.4 2.6 1.2 3.5 8.4
Sample size ........................................... 102 139 126 152 110 57
– No purchases of item.Note: Distribution of purchases by WIC families may not sum to 100 percent due to multiple food type purchases within food category. Highpercentages of Don’t know/missing responses sometimes reflect problems with the computer assisted survey program whereby unintentional skips ledto missing responses.
Sample size varies by food category because the sample contains families who were prescribed the food category and who purchased all or some oftheir WIC prescription in the month prior to the survey.
Source: Survey of WIC Participants.
WIC Transaction Data
Although the survey data described above provide information about the percentage of WIC familiesbuying specific food items, the survey does not indicate how much of the item was being purchased.Such quantity information is available from the scanner data collected from supermarkets in allStates except Oklahoma. Nearly 600 supermarkets, representing six supermarket chains in the fiveStates, provided WIC transaction data for the study. Data were collected on over half a milliontransactions during a six-week period in February and March 2001.
Table 3-3 presents the percentage distribution of dollars spent on WIC food items for the five Stateswith scanner data, by major food category. The top portion of the table includes infant formula andfoods prescribed for breastfeeding mothers (carrots and tuna). These food items are not exploredfurther in this report, so the bottom portion of the table excludes them from the distributions.2 An
2 Per the authorizing legislation for this study, cost-containment practices involving rebates on infant formula are not partof the scope for the study. Carrots and tuna have been excluded because they are prescribed for only a smallpercentage of WIC participants, breastfeeding mothers.
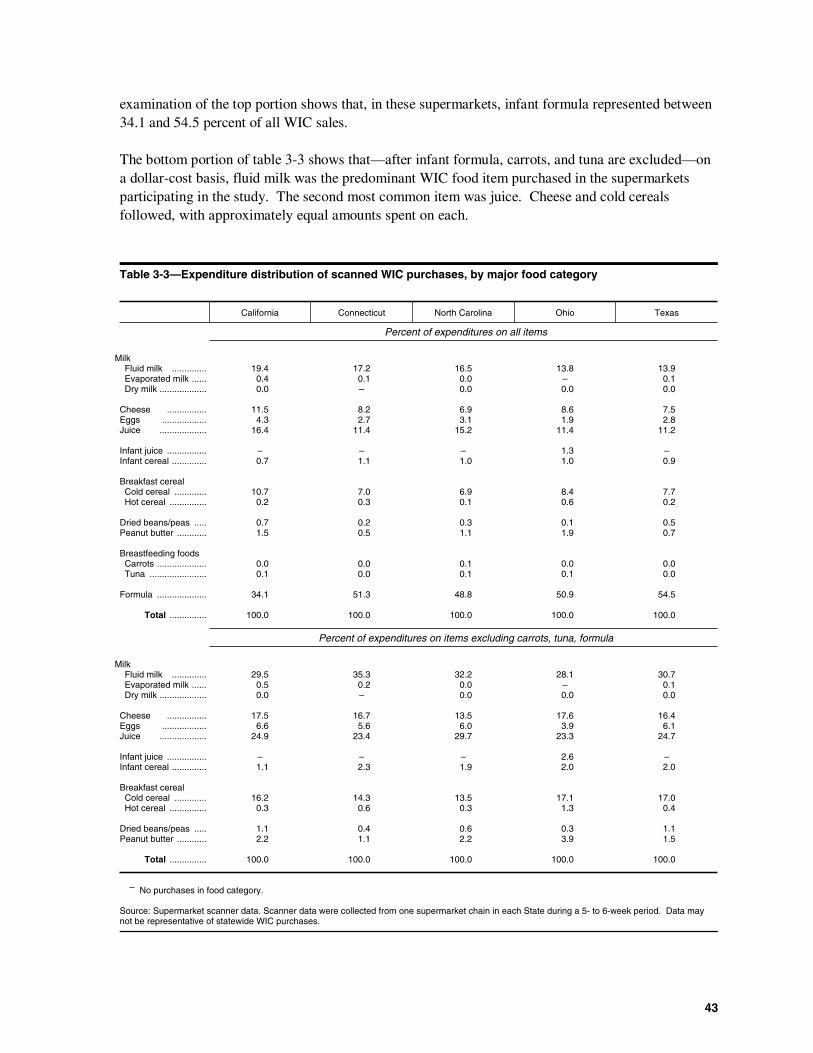
43
examination of the top portion shows that, in these supermarkets, infant formula represented between34.1 and 54.5 percent of all WIC sales.
The bottom portion of table 3-3 shows that—after infant formula, carrots, and tuna are excluded—ona dollar-cost basis, fluid milk was the predominant WIC food item purchased in the supermarketsparticipating in the study. The second most common item was juice. Cheese and cold cerealsfollowed, with approximately equal amounts spent on each.
Table 3-3—Expenditure distribution of scanned WIC purchases, by major food category
California Connecticut North Carolina Ohio Texas
Percent of expenditures on all items
MilkFluid milk .............. 19.4 17.2 16.5 13.8 13.9Evaporated milk ...... 0.4 0.1 0.0 – 0.1Dry milk ................... 0.0 – 0.0 0.0 0.0
Cheese ................ 11.5 8.2 6.9 8.6 7.5Eggs .................. 4.3 2.7 3.1 1.9 2.8Juice ................... 16.4 11.4 15.2 11.4 11.2
Infant juice ................ – – – 1.3 –Infant cereal .............. 0.7 1.1 1.0 1.0 0.9
Breakfast cerealCold cereal ............. 10.7 7.0 6.9 8.4 7.7Hot cereal ............... 0.2 0.3 0.1 0.6 0.2
Dried beans/peas ..... 0.7 0.2 0.3 0.1 0.5Peanut butter ............ 1.5 0.5 1.1 1.9 0.7
Breastfeeding foodsCarrots .................... 0.0 0.0 0.1 0.0 0.0Tuna ....................... 0.1 0.0 0.1 0.1 0.0
Formula .................... 34.1 51.3 48.8 50.9 54.5
Total ............... 100.0 100.0 100.0 100.0 100.0
Percent of expenditures on items excluding carrots, tuna, formula
MilkFluid milk .............. 29.5 35.3 32.2 28.1 30.7Evaporated milk ...... 0.5 0.2 0.0 – 0.1Dry milk ................... 0.0 – 0.0 0.0 0.0
Cheese ................ 17.5 16.7 13.5 17.6 16.4Eggs .................. 6.6 5.6 6.0 3.9 6.1Juice ................... 24.9 23.4 29.7 23.3 24.7
Infant juice ................ – – – 2.6 –Infant cereal .............. 1.1 2.3 1.9 2.0 2.0
Breakfast cerealCold cereal ............. 16.2 14.3 13.5 17.1 17.0Hot cereal ............... 0.3 0.6 0.3 1.3 0.4
Dried beans/peas ..... 1.1 0.4 0.6 0.3 1.1Peanut butter ............ 2.2 1.1 2.2 3.9 1.5
Total ............... 100.0 100.0 100.0 100.0 100.0
– No purchases in food category.
Source: Supermarket scanner data. Scanner data were collected from one supermarket chain in each State during a 5- to 6-week period. Data maynot be representative of statewide WIC purchases.
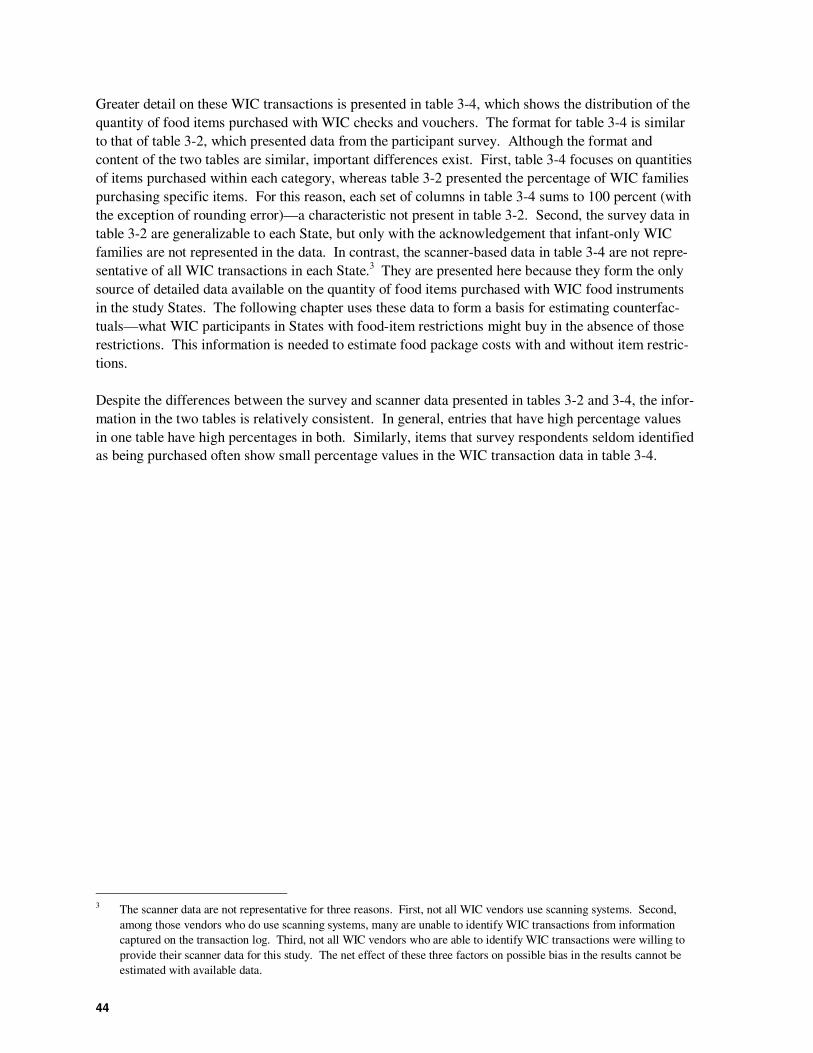
44
Greater detail on these WIC transactions is presented in table 3-4, which shows the distribution of thequantity of food items purchased with WIC checks and vouchers. The format for table 3-4 is similarto that of table 3-2, which presented data from the participant survey. Although the format andcontent of the two tables are similar, important differences exist. First, table 3-4 focuses on quantitiesof items purchased within each category, whereas table 3-2 presented the percentage of WIC familiespurchasing specific items. For this reason, each set of columns in table 3-4 sums to 100 percent (withthe exception of rounding error)—a characteristic not present in table 3-2. Second, the survey data intable 3-2 are generalizable to each State, but only with the acknowledgement that infant-only WICfamilies are not represented in the data. In contrast, the scanner-based data in table 3-4 are not repre-sentative of all WIC transactions in each State.3 They are presented here because they form the onlysource of detailed data available on the quantity of food items purchased with WIC food instrumentsin the study States. The following chapter uses these data to form a basis for estimating counterfac-tuals—what WIC participants in States with food-item restrictions might buy in the absence of thoserestrictions. This information is needed to estimate food package costs with and without item restric-tions.
Despite the differences between the survey and scanner data presented in tables 3-2 and 3-4, the infor-mation in the two tables is relatively consistent. In general, entries that have high percentage valuesin one table have high percentages in both. Similarly, items that survey respondents seldom identifiedas being purchased often show small percentage values in the WIC transaction data in table 3-4.
3 The scanner data are not representative for three reasons. First, not all WIC vendors use scanning systems. Second,among those vendors who do use scanning systems, many are unable to identify WIC transactions from informationcaptured on the transaction log. Third, not all WIC vendors who are able to identify WIC transactions were willing toprovide their scanner data for this study. The net effect of these three factors on possible bias in the results cannot beestimated with available data.
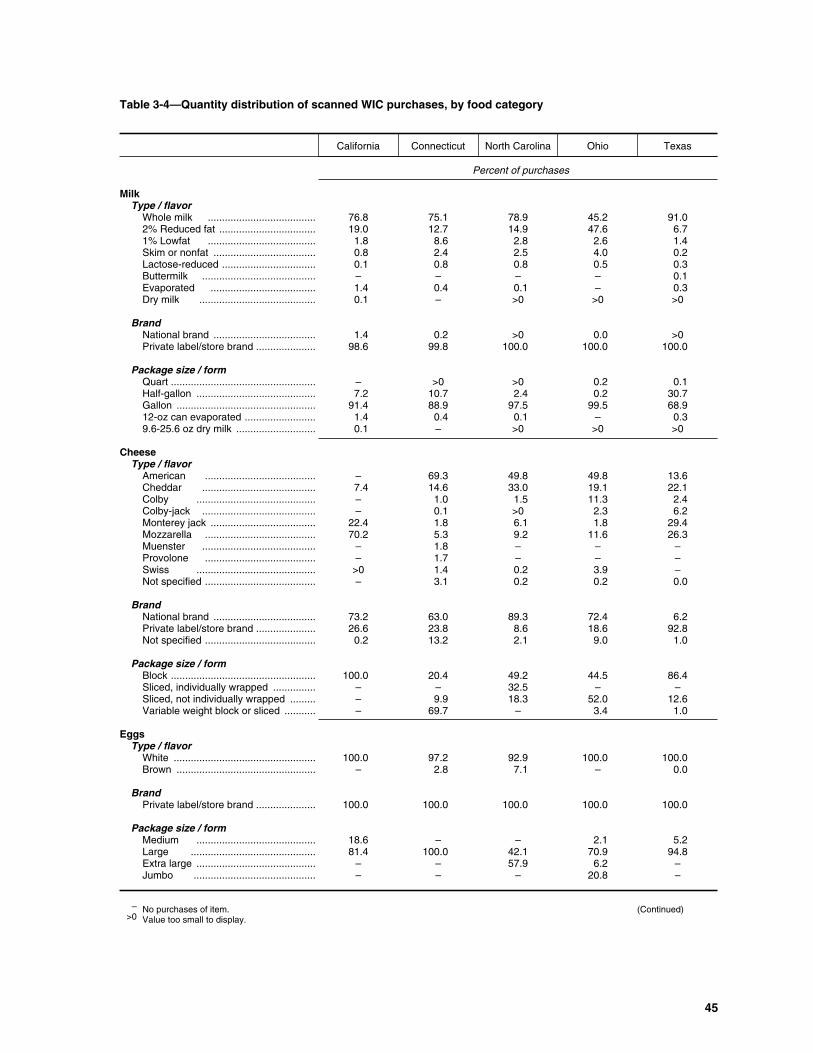
45
Table 3-4—Quantity distribution of scanned WIC purchases, by food category
California Connecticut North Carolina Ohio Texas
Percent of purchases
Milk Type / flavor
Whole milk ...................................... 76.8 75.1 78.9 45.2 91.02% Reduced fat .................................. 19.0 12.7 14.9 47.6 6.71% Lowfat ...................................... 1.8 8.6 2.8 2.6 1.4Skim or nonfat .................................... 0.8 2.4 2.5 4.0 0.2Lactose-reduced ................................. 0.1 0.8 0.8 0.5 0.3Buttermilk ........................................ – – – – 0.1Evaporated ..................................... 1.4 0.4 0.1 – 0.3Dry milk ......................................... 0.1 – >0 >0 >0
BrandNational brand .................................... 1.4 0.2 >0 0.0 >0Private label/store brand ..................... 98.6 99.8 100.0 100.0 100.0
Package size / formQuart ................................................... – >0 >0 0.2 0.1Half-gallon .......................................... 7.2 10.7 2.4 0.2 30.7Gallon ................................................. 91.4 88.9 97.5 99.5 68.912-oz can evaporated ......................... 1.4 0.4 0.1 – 0.39.6-25.6 oz dry milk ............................ 0.1 – >0 >0 >0
Cheese Type / flavor
American ....................................... – 69.3 49.8 49.8 13.6Cheddar ........................................ 7.4 14.6 33.0 19.1 22.1Colby .......................................... – 1.0 1.5 11.3 2.4Colby-jack ........................................ – 0.1 >0 2.3 6.2Monterey jack ..................................... 22.4 1.8 6.1 1.8 29.4Mozzarella ....................................... 70.2 5.3 9.2 11.6 26.3Muenster ........................................ – 1.8 – – –Provolone ....................................... – 1.7 – – –Swiss .......................................... >0 1.4 0.2 3.9 –Not specified ....................................... – 3.1 0.2 0.2 0.0
BrandNational brand .................................... 73.2 63.0 89.3 72.4 6.2Private label/store brand ..................... 26.6 23.8 8.6 18.6 92.8Not specified ....................................... 0.2 13.2 2.1 9.0 1.0
Package size / formBlock ................................................... 100.0 20.4 49.2 44.5 86.4Sliced, individually wrapped ............... – – 32.5 – –Sliced, not individually wrapped ......... – 9.9 18.3 52.0 12.6Variable weight block or sliced ........... – 69.7 – 3.4 1.0
Eggs Type / flavor
White .................................................. 100.0 97.2 92.9 100.0 100.0Brown ................................................. – 2.8 7.1 – 0.0
BrandPrivate label/store brand ..................... 100.0 100.0 100.0 100.0 100.0
Package size / formMedium .......................................... 18.6 – – 2.1 5.2Large ............................................ 81.4 100.0 42.1 70.9 94.8Extra large .......................................... – – 57.9 6.2 –Jumbo ........................................... – – – 20.8 –
– No purchases of item.>0 Value too small to display.
(Continued)
46
Table 3-4—Quantity distribution of scanned WIC purchases, by food category (continued)
California Connecticut North Carolina Ohio Texas
Percent of purchases
Infant cerealType / flavor
Barley .......................................... 13.6 12.0 0.2 7.4 –Mixed .......................................... 24.3 17.9 31.7 23.9 15.1Oatmeal ........................................ 25.3 34.6 31.2 33.7 35.8Rice ........................................... 36.9 35.5 36.9 35.0 49.1
BrandNational brand .................................... 100.0 100.0 100.0 100.0 100.0
Package size / form 8 oz .................................................... 100.0 100.0 100.0 100.0 55.316 oz ................................................... – – – – 44.7
Infant juiceType / flavor
Mixed .......................................... – – – 22.1 –Apple .......................................... – – – 34.3 –Pear ........................................... – – – 18.1 –White grape ...................................... – – – 25.4 –
BrandNational brand .................................... – – – 100.0 –
Package size / form32 oz ................................................... – – – 100.0 –
JuiceType / flavor
Apple .......................................... 51.5 13.4 17.7 15.3 38.9Apple/grape ...................................... – 5.4 1.3 – –Berry ........................................... – 9.3 7.7 9.7 –Cherry .......................................... – 4.7 6.7 9.9 –Cranberry blend .................................. – – >0 1.2 –Cranberry ........................................ – – 1.6 3.3 –Grape .......................................... 18.4 18.6 19.7 20.6 6.0Grapefruit ......................................... – >0 0.7 0.4 2.0Orange ......................................... 19.8 19.0 8.7 10.3 22.8Pineapple ........................................ 9.7 2.8 3.9 5.0 28.6Punch ......................................... – 13.8 12.4 12.0 –Strawberry ....................................... – 5.9 8.8 3.8 –Tomato ........................................ – – 0.0 – –Tropical .......................................... – 3.7 1.8 – –Vegetable ....................................... 0.5 – 1.2 1.4 1.7White grape blend .............................. – 3.4 7.7 7.1 –
BrandNational brand .................................... 87.7 81.4 95.4 97.3 2.4Private label/store brand ..................... 12.3 18.6 4.6 2.7 97.6
Package size / formFrozen (11.5/12 oz) ............................ 17.6 25.2 15.9 21.4 22.446-oz can ............................................ – 64.7 19.4 3.0 77.646-oz plastic ....................................... – – 61.2 67.4 –64-oz plastic ....................................... 82.4 – – – –Liquid concentrate (11.5 oz) ............... – – 3.6 8.3 –Refrigerated carton ............................. – 10.1 – – –
– No purchases of item.>0 Value too small to display.
(Continued)
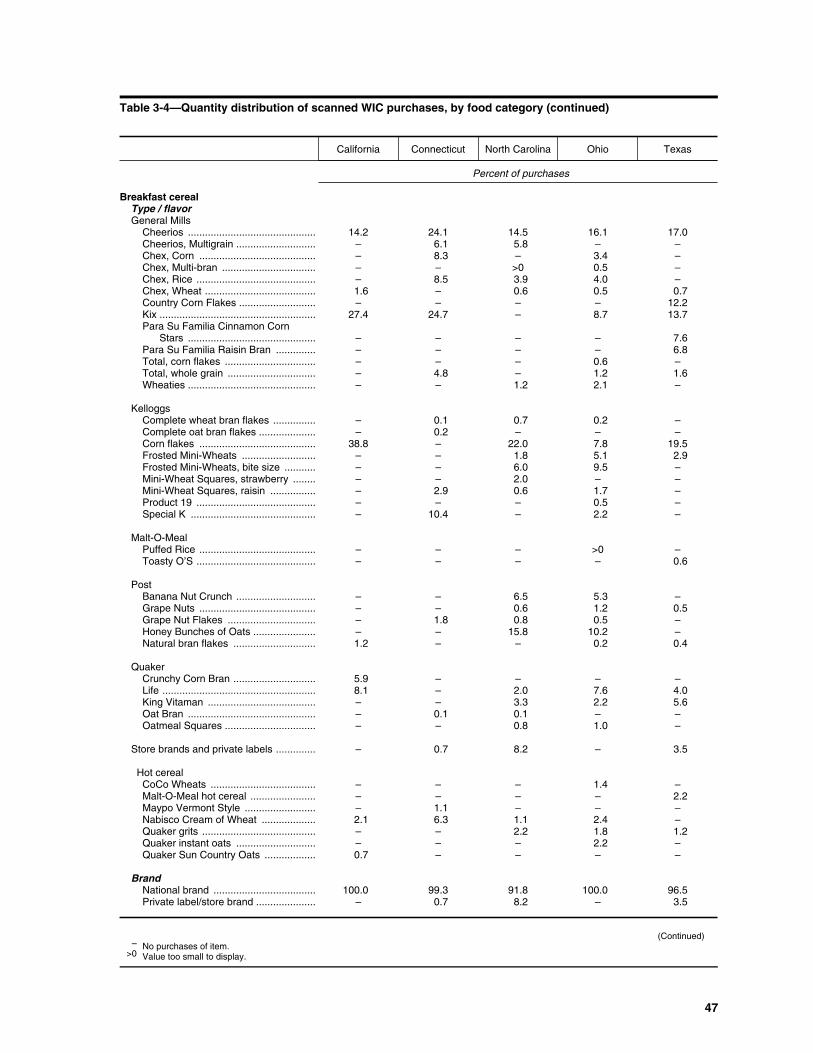
47
Table 3-4—Quantity distribution of scanned WIC purchases, by food category (continued)
California Connecticut North Carolina Ohio Texas
Percent of purchases
Breakfast cerealType / flavorGeneral Mills
Cheerios ............................................. 14.2 24.1 14.5 16.1 17.0Cheerios, Multigrain ............................ – 6.1 5.8 – –Chex, Corn ......................................... – 8.3 – 3.4 –Chex, Multi-bran ................................. – – >0 0.5 –Chex, Rice .......................................... – 8.5 3.9 4.0 –Chex, Wheat ....................................... 1.6 – 0.6 0.5 0.7Country Corn Flakes ........................... – – – – 12.2Kix ....................................................... 27.4 24.7 – 8.7 13.7Para Su Familia Cinnamon Corn
Stars ............................................. – – – – 7.6Para Su Familia Raisin Bran .............. – – – – 6.8Total, corn flakes ................................ – – – 0.6 –Total, whole grain ............................... – 4.8 – 1.2 1.6Wheaties ............................................. – – 1.2 2.1 –
KelloggsComplete wheat bran flakes ............... – 0.1 0.7 0.2 –Complete oat bran flakes .................... – 0.2 – – –Corn flakes ......................................... 38.8 – 22.0 7.8 19.5Frosted Mini-Wheats .......................... – – 1.8 5.1 2.9Frosted Mini-Wheats, bite size ........... – – 6.0 9.5 –Mini-Wheat Squares, strawberry ........ – – 2.0 – –Mini-Wheat Squares, raisin ................ – 2.9 0.6 1.7 –Product 19 .......................................... – – – 0.5 –Special K ............................................ – 10.4 – 2.2 –
Malt-O-MealPuffed Rice ......................................... – – – >0 –Toasty O’S .......................................... – – – – 0.6
PostBanana Nut Crunch ............................ – – 6.5 5.3 –Grape Nuts ......................................... – – 0.6 1.2 0.5Grape Nut Flakes ............................... – 1.8 0.8 0.5 –Honey Bunches of Oats ...................... – – 15.8 10.2 –Natural bran flakes ............................. 1.2 – – 0.2 0.4
QuakerCrunchy Corn Bran ............................. 5.9 – – – –Life ...................................................... 8.1 – 2.0 7.6 4.0King Vitaman ...................................... – – 3.3 2.2 5.6Oat Bran ............................................. – 0.1 0.1 – –Oatmeal Squares ................................ – – 0.8 1.0 –
Store brands and private labels .............. – 0.7 8.2 – 3.5
Hot cerealCoCo Wheats ..................................... – – – 1.4 –Malt-O-Meal hot cereal ....................... – – – – 2.2Maypo Vermont Style ......................... – 1.1 – – –Nabisco Cream of Wheat ................... 2.1 6.3 1.1 2.4 –Quaker grits ........................................ – – 2.2 1.8 1.2Quaker instant oats ............................ – – – 2.2 –Quaker Sun Country Oats .................. 0.7 – – – –
BrandNational brand .................................... 100.0 99.3 91.8 100.0 96.5Private label/store brand ..................... – 0.7 8.2 – 3.5
(Continued)– No purchases of item.
>0 Value too small to display.
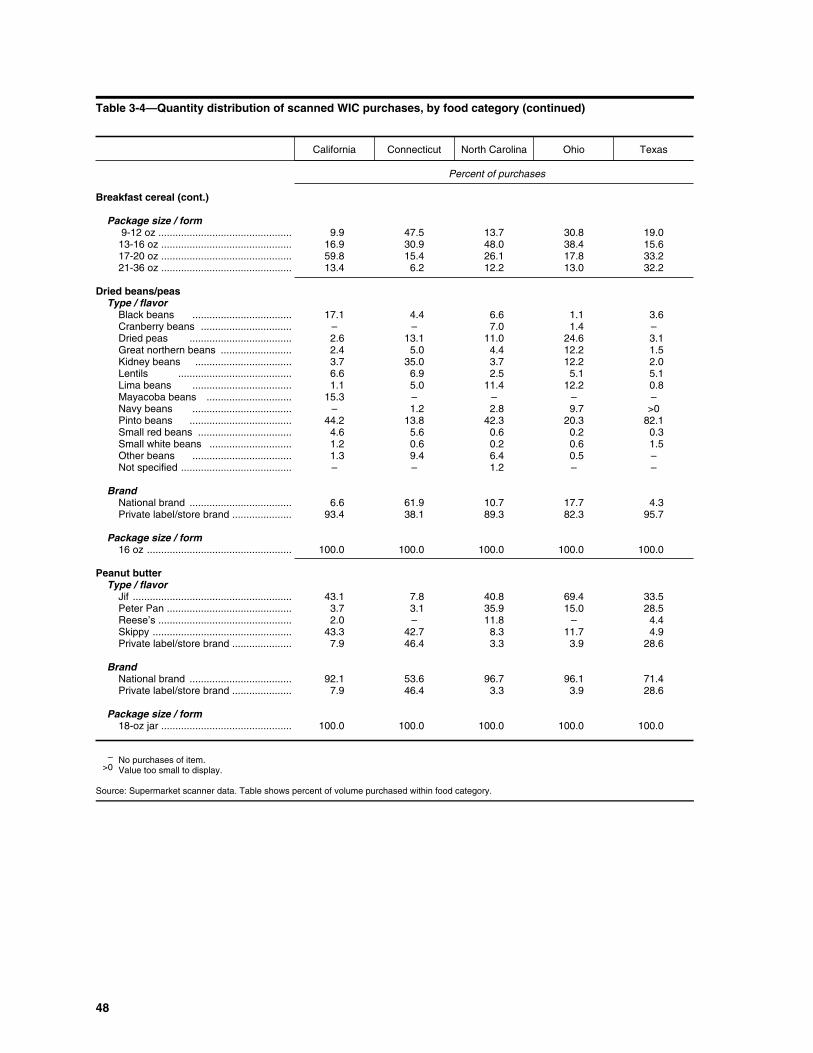
48
Table 3-4—Quantity distribution of scanned WIC purchases, by food category (continued)
California Connecticut North Carolina Ohio Texas
Percent of purchases
Breakfast cereal (cont.)
Package size / form 9-12 oz ............................................... 9.9 47.5 13.7 30.8 19.013-16 oz .............................................. 16.9 30.9 48.0 38.4 15.617-20 oz .............................................. 59.8 15.4 26.1 17.8 33.221-36 oz .............................................. 13.4 6.2 12.2 13.0 32.2
Dried beans/peasType / flavor
Black beans ................................... 17.1 4.4 6.6 1.1 3.6Cranberry beans ................................ – – 7.0 1.4 –Dried peas .................................... 2.6 13.1 11.0 24.6 3.1Great northern beans ......................... 2.4 5.0 4.4 12.2 1.5Kidney beans .................................. 3.7 35.0 3.7 12.2 2.0Lentils ........................................ 6.6 6.9 2.5 5.1 5.1Lima beans ................................... 1.1 5.0 11.4 12.2 0.8Mayacoba beans .............................. 15.3 – – – –Navy beans ................................... – 1.2 2.8 9.7 >0Pinto beans .................................... 44.2 13.8 42.3 20.3 82.1Small red beans ................................. 4.6 5.6 0.6 0.2 0.3Small white beans ............................. 1.2 0.6 0.2 0.6 1.5Other beans ................................... 1.3 9.4 6.4 0.5 –Not specified ....................................... – – 1.2 – –
BrandNational brand .................................... 6.6 61.9 10.7 17.7 4.3Private label/store brand ..................... 93.4 38.1 89.3 82.3 95.7
Package size / form16 oz ................................................... 100.0 100.0 100.0 100.0 100.0
Peanut butterType / flavor
Jif ........................................................ 43.1 7.8 40.8 69.4 33.5Peter Pan ............................................ 3.7 3.1 35.9 15.0 28.5Reese’s ............................................... 2.0 – 11.8 – 4.4Skippy ................................................. 43.3 42.7 8.3 11.7 4.9Private label/store brand ..................... 7.9 46.4 3.3 3.9 28.6
BrandNational brand .................................... 92.1 53.6 96.7 96.1 71.4Private label/store brand ..................... 7.9 46.4 3.3 3.9 28.6
Package size / form18-oz jar .............................................. 100.0 100.0 100.0 100.0 100.0
– No purchases of item.>0 Value too small to display.
Source: Supermarket scanner data. Table shows percent of volume purchased within food category.
49
Chapter 4Food Costs and Food Cost Savings
The primary purpose of imposing restrictions on allowed WIC foods is to lower costs while main-taining nutrient benefits set by Federal standards. Little is known, however, about the magnitude offood cost savings resulting from cost-containment practices. Program officials in the six States in thisstudy had very limited financial information on the savings from the food-item restrictions they hadimplemented. (Many of these restrictions have been in effect for some years, so information on foodcosts before their implementation is no longer available.) Nevertheless, the estimates provided by theprogram officials are included in this chapter, both to provide context for the systematic analysesconducted for this study and to fill in a few gaps in available data.
Food-item restrictions limit, to varying degrees, the types, brands, or package forms of food items thatWIC participants may purchase with their food instruments. The savings from food-item restrictionsare equal to the difference between food costs that would be incurred in the absence of restrictionsand the actual food costs incurred with restrictions. The food costs that would be incurred withoutrestrictions (the counterfactual), however, cannot be observed directly.
To illustrate the problem, consider the Connecticut practice requiring purchase of the least expensivebrand of orange and grapefruit juice. WIC participants purchasing orange or grapefruit juice mustselect the least cost brand in the store where they shop; for other types of juice (apple, grape, pine-apple, juice blends) they select from the national brands listed on the WIC food list. For any givenWIC participant, the savings from this restriction depends on four factors. Does their WIC prescrip-tion include juice (and, if so, how much is prescribed)? Do they purchase orange or grapefruit juice?What brand of orange juice would they purchase if unrestrained? What is the price differencebetween the preferred brand and the least cost brand in the store where they shop?
Three of these four factors are observable: food prescriptions, current juice selections, and prices.State WIC agency administrative data contain information about food package prescriptions for eachWIC participant. Supermarket scanner data collected for this study indicate the percent of WIC juiceselections that were orange or grapefruit juice, and the Survey of Food Prices and Item Availabilityconducted for this study collected prices of all juice brands stocked by a sample of WIC-authorizedvendors in each of the six States.1
One cannot, however, observe the juice preferences of Connecticut WIC participants in a world inwhich they are not constrained by the State’s least expensive restriction on orange and grapefruitjuice. This restriction affects the brands of orange and grapefruit juice purchased with WIC foodinstruments, and also the types of juice purchased. Presence of a restriction on orange juice does notshift all orange juice purchases to the least cost orange juice; it may shift some orange juice purchasesto national-brand apple juice and other types of juice.2
1 The final sample includes 17 to 18 WIC-authorized vendors in each State, including supermarkets and smaller grocerystores. In each State, prices were collected for all juice brands approved for WIC purchase in any of the six States (aswell as prices for other WIC foods).
2 For example, a person may rank their preferred juices as: national-brand orange (#1), national-brand apple (#2), store-brand orange (#3).
50
Estimation of the food cost savings from food-item restrictions on juice requires some assumptionsabout the counterfactual distribution of juices that would be purchased if there were no restrictions.This study used information about juice selections by WIC participants in study States that did notimpose restrictions on juice (North Carolina and Ohio) as a proxy for the counterfactual distributionof purchases (and likewise for all other food categories). Admittedly, use of out-of-State data on foodpreferences poses problems that may introduce error in the estimates of food cost savings. First, ifpreferences vary significantly across States because of differences in demographics or food markets,the proxy distribution may not adequately represent what participants in the restricted State wouldhave purchased in the absence of restrictions. Second, compared to foods allowed under Federalregulations, even “nonrestricted” States limit the number of food items allowed (to reduce themanagement task of periodically confirming that allowed foods meet nutrient standards). Thus, thecounterfactual may not represent the full array of allowed foods in the absence of restrictions.
The study compensates for both problems by using as many of the study States as possible whenconstructing the counterfactual, thereby broadening the base of participants (and States) whose prefer-ences (food lists) are used. Nevertheless, these two problems are likely to introduce some error in thestudy’s estimates of food cost savings. The size and direction of any possible error are unknown, andthey are likely to vary by food category because different States form the nonrestricted group for eachfood category.
It is important to recognize that potential errors in estimating food cost savings cannot be avoidedwithout conducting an experiment that relaxes current restrictions in a State and observes theresulting changes in food item selection. Otherwise, it is not possible to know what foods and quan-tities participants would buy in the absence of food-item restrictions. It was not possible to conductan experiment as part of this study, so using data on actual WIC purchases from nonrestricted Statesprovided the best available approach to developing the needed counterfactual distribution of foodpurchases.
The next section of this chapter presents the research approach in detail. The final section presentsanalysis results.
Research Approach
Overview
Food-item restrictions yield food cost savings equal to the difference in food costs incurred withoutthose item restrictions (the counterfactual) and food costs incurred with those restrictions. Asdiscussed in previous chapters, the States in this study implemented different numbers and combina-tions of restrictions across food categories. Table 3-1 in chapter 3 summarized the item restrictions.
For a given food category, the total monthly savings from item restrictions can be expressed as:
−′= ∑ ∑+
= =
RI
i
i
I
iiiiFFF PPQNgTotalSavin
1 1
αα (1)
where: F = food category,
NF = number of WIC participants prescribed food in category F
51
FQ = average monthly quantity prescribed for food category F
I = number of food items on the State WIC-approved food list in category F
R = number of restricted food items (Federally approved items not on food list) in category F
iα ′ = percent of food selections in category F of item i, when unrestricted (unobservable)
iα = percent of food selections in category F of item i, when restricted (observable)
iP = average price of item i
The first component in the square brackets is the average price of all items within a food category,including items on the State food list (I) and restricted items (R)—this term is the counterfactual, andit represents all Federal (unrestricted) WIC food items within a food category. The second compo-nent in the brackets is the average price of items on the State food list (I). Thus, the quantity withinthe brackets is the average price differential resulting from food-item restrictions within a food cate-gory. In States with no restrictions R = 0, and the price differential from restrictions is zero. Thesavings estimated by equation (1) are monthly savings because the quantity term QF is expressed asthe monthly quantity prescribed for category F.
Total savings from food-item restrictions within a State are equal to the sum of savings in all foodcategories. The food categories examined are milk, eggs, cheese, breakfast cereal, infant cereal,single-strength juice, infant juice, and legumes (peanut butter and dried beans or peas). As specifiedin the study’s authorizing legislation, savings from infant formula rebates are not examined. In addi-tion, none of the case study States imposed food-item restrictions on tuna or carrots, so these foodcategories are not included in the analysis.
Equation (1) is a simplified form of the estimation equation, because there is no accounting for theweighting necessary to calculate average food prices and average food quantities. Nonetheless, it isuseful for discussing the data sources used in this analysis:
• WIC administrative data provide information on the number of WIC participantsprescribed each food category (NF), and the quantity of food of each food categoryprescribed to each participant (QF). Administrative data reflect WIC caseloads inNovember 2000.
• The Survey of Food Prices and Item Availability provides food price data (Pi). Foodprices were collected from a sample of 106 WIC vendors (17 or 18 stores in each of sixstates) during a single store visit in March or April 2001. Prices were collected for thesame list of WIC food items in each State, with the list containing items approved byWIC in any of the six States. As a result, price data from each State include both itemson the State’s WIC food list and not on the list, but Federally approved (restricted items).
• Supermarket scanner data provide information on WIC participants’ preferences overfood items within each food category, conditional on the list of WIC-approved foods intheir State (αi). Scanner data were collected from six supermarket chains in five States
52
over a 6-week period in late February through mid-March 2001.3 The scanner dataprovide the percentage distribution of food item selections (the αi vector) for five of thesix States; this distribution of items was presented in chapter 3 (table 3-4).4
• The Survey of WIC Participants provides information on WIC participants’ preferencesover food items within each food category, conditional on the list of WIC-approved foodsin their State (αi). In Oklahoma, where scanner data were not available, survey data areused to construct the percentage distribution of item selections (table 3-2).5
The one element of equation (1) that is not observable from existing data is α′ithe preferences ofWIC participants over an unconstrained list of WIC-approved food items. For example, the studydoes not know the number (or percent) of Connecticut WIC participants who would have purchasedother brands of orange juice if the State’s least expensive policy did not exist.
The study therefore assumes that the α′i vector for each food category, although not directly observedwithin each State, can be approximated by the αi vector from States without restrictions on the foodcategory. For example, North Carolina and Ohio do not have item restrictions on juiceboth Statesallow a large number of juice types and a wide array of brands, with no least expensive policies. Theαi vector from these two States provides the counterfactual α′i vector for juice in Connecticut (andother States with juice restrictions).
Additional assumptions are made in estimating food cost savings. First, the estimated costs for thisstudy exclude the costs of infant formula, tuna, and carrots. Formula was specifically excluded fromthe study by the authorizing legislation; tuna and carrots are not subject to cost-containment itemrestrictions in any State and do not contribute to food cost savings.
Second, the estimated costs assume that all food instruments are redeemed. As discussed later inchapter 8, an average of about 16 percent of all food instruments issued for November 2000 in the sixStates were never redeemed, and this acts to lower actual average food package costs.
Third, the estimated costs assume full redemption of each food instrument. Survey data and anec-dotal evidence suggest that participants sometimes purchase only some of the items listed on a foodinstrument, but empirically based estimates of the frequency of partial redemptions or their impact onfood package costs are not available. As with the assumption that all food instruments wereredeemed, this assumption of full redemption of each instrument results in estimated food packagecosts that exceed actual food package costs.
3 The number of WIC transactions in the collected scanner data range from 4,700 in Connecticut to over 225,000 in bothNorth Carolina and Texas. The total number of selected food items observed in the scanner data range from 18,300 inConnecticut to over 400,000 in Texas and over 900,000 in North Carolina. No scanner data were available for Okla-homa.
4 Table 3-4 presents the percentage distribution of item selections aggregated into subcategories. The unaggregateddistribution was used for the analyses in this chapter.
5 The Survey of WIC Participants asked respondents to recall the brand, type, and package size of items purchased “lastmonth” with WIC food instruments. The number of respondents per State varied from 203 (Texas) to 231 (Connec-ticut). The survey data have the limitation, however, of indicating only the items that were purchased, not the quantit-ies. The analysis therefore used only a respondent’s first reported item in each food category when building thedistribution of items purchased.
53
This chapter presents estimates of food costs and the savings from food-item restrictions for eachfood category and overall, for each of the six States in the study. Total savings are not estimatedseparately by type of item restriction when multiple restrictions affect the same food category becausemultiple item restrictions do not have independent impacts on the distribution of items selected withina food category (αi).
An example of a food category with multiple item restrictions is juice in Connecticut. Connecticuthas a least expensive policy for orange and grapefruit juice, as discussed above. Connecticut alsolimits the types of juice that may be purchased: three types of juice are not permitted in Connecticut(cranberry, tomato, vegetable), although these juices meet Federal WIC regulations and are allowedin other States. Only the combined impact of both restrictions is estimated because the restrictionsare not independent. The least expensive restriction on orange juice has two effects relative to uncon-strained item selections: (1) a shift in selections of orange and grapefruit juice from high-costnational brands to low-cost store brands and private labels, and (2) a shift in juice selections fromorange and grapefruit to other juice types. The shift toward other juice types, however, may bedampened by the restriction on juice types: participants who like cranberry juice cannot choosecranberry juice instead of low-cost orange juice. The actual overall distribution of juice purchases isdetermined by all restrictions on the food category.
Standardized and Nonstandardized Estimates
The goal in analyzing WIC food costs (and food cost savings) is to obtain estimates of average foodcosts that vary across States due only to variation in food prices, allowable foods, and participantpreferences among allowable foods. To allow comparison of food costs and savings across States,estimates in this chapter are standardized to remove cross-State differences in costs unrelated toprices, preferences, or food-item restrictions. Specifically, as described below, the estimates arestandardized to remove three sources of cross-State variation: caseload size, differences in thedistribution of WIC participants across certification category and food package, and differences in theamount of food package tailoring used by the State.
1. All estimates in this chapter are presented as food costs and food cost savings per partici-pant per month (PPM), using the entire caseload as the denominator. This may seemstrange when looking at restrictions on infant cereal, because the savings per infant are“diluted” when spread over all participants. This standardization, however, allowsmeaningful comparison (and summation) of food costs and savings among food cate-gories. It also facilitates comparison across States with different numbers of WICparticipants.
2. Estimates of food costs are calculated for a standard distribution of WIC participants ineach State, with the standard distribution equal to the average distribution of participantsacross certification categories in all six States. This removes cross-State differences infood costs due to different distributions of WIC participants across certification category.
3. Estimates of food costs are calculated based on the standard food packages prescribed byFederal WIC regulations for participants in each certification category. This removescross-State differences in food costs due to different amounts of food package tailoring.
Standardization #2 is applied because prescribed food quantities depend on the distribution of WICparticipants across certification categories. Federal WIC regulations specify seven food packages:
54
two for infants that are age-dependent (Food Packages I and II); one for children or women withspecial dietary needs (package III); one for children aged 1 to 5 years (IV); one for pregnant andbreastfeeding women (V); one for nonbreastfeeding postpartum women (VI); and an enhancedpackage for breastfeeding women (VII).6 Six of the seven food packages correspond closely tocertification category, with food package III prescribed to a very small fraction of women and chil-dren.
Standardization # 3 is applied because State and local WIC agencies sometimes tailor food packagesto meet the nutritional needs of individual WIC clients. Tailoring may reduce the amounts or types offood prescribed, and can thereby affect food package costs.
Application of these standardizations in the estimation procedure is discussed in the next section.
Estimation Procedure
According to equation (1), food cost savings in each food category are calculated as the differencebetween unconstrained (counterfactual) food costs and actual food costs. Equation (1) is a simplifiedform of the estimation equation, because there is no accounting for the weighting necessary to calcu-late average food prices and average food quantities. Price data are obtained from a weighted sampleof 17 to 18 WIC retailers in each State; average food quantities are obtained by weighting the foodquantities prescribed in each food package by the distribution of WIC participants across food pack-ages.
A full representation of the estimation of average food costs per participant month is shown in equa-tion (2). This representation includes appropriate weights.
[ ( )]∑ ∑∑∑= ===
⋅=FP
fp
I
isiifpfp
S
ss
ccF PQtsAvgFoodCos
c1 11
5
1
αγωδ (2)
where: F = food category,
c = 1 to 5, denotes certification category7
cδ = percent of WIC participants in certification category c
S = number of stores sampled in the State for the Survey of Food Prices and ItemAvailability
ωs = sampling weight for store s
FP = number of different food packages
cfpγ = percent of WIC participants in certification category c, prescribed food package
fp
fpQ = prescribed monthly quantity of food category F in food package fp
I = number of food items in category F on the State WIC food list (approved items)
6 The content of the seven food packages is shown in appendix H.
7 Infants aged 0 to 3 months are excluded from the analysis because their prescriptions contain only infant formula.
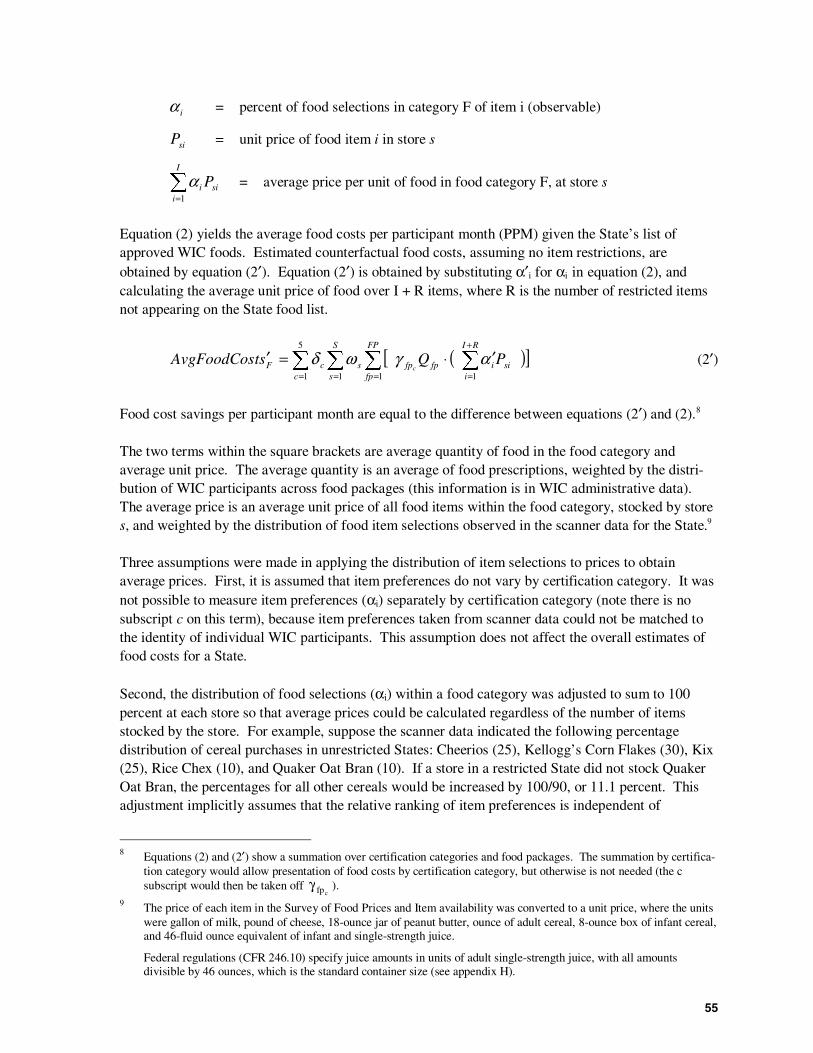
55
iα = percent of food selections in category F of item i (observable)
siP = unit price of food item i in store s
si
I
ii P∑
=1
α = average price per unit of food in food category F, at store s
Equation (2) yields the average food costs per participant month (PPM) given the State’s list ofapproved WIC foods. Estimated counterfactual food costs, assuming no item restrictions, areobtained by equation (2′). Equation (2′) is obtained by substituting α′i for αi in equation (2), andcalculating the average unit price of food over I + R items, where R is the number of restricted itemsnot appearing on the State food list.
[ ( )]∑ ∑∑∑=
+
===
′⋅=′FP
fp
RI
isiifpfp
S
ss
ccF PQstAvgFoodCos
c1 11
5
1
αγωδ (2′)
Food cost savings per participant month are equal to the difference between equations (2′) and (2).8
The two terms within the square brackets are average quantity of food in the food category andaverage unit price. The average quantity is an average of food prescriptions, weighted by the distri-bution of WIC participants across food packages (this information is in WIC administrative data).The average price is an average unit price of all food items within the food category, stocked by stores, and weighted by the distribution of food item selections observed in the scanner data for the State.9
Three assumptions were made in applying the distribution of item selections to prices to obtainaverage prices. First, it is assumed that item preferences do not vary by certification category. It wasnot possible to measure item preferences (αi) separately by certification category (note there is nosubscript c on this term), because item preferences taken from scanner data could not be matched tothe identity of individual WIC participants. This assumption does not affect the overall estimates offood costs for a State.
Second, the distribution of food selections (αi) within a food category was adjusted to sum to 100percent at each store so that average prices could be calculated regardless of the number of itemsstocked by the store. For example, suppose the scanner data indicated the following percentagedistribution of cereal purchases in unrestricted States: Cheerios (25), Kellogg’s Corn Flakes (30), Kix(25), Rice Chex (10), and Quaker Oat Bran (10). If a store in a restricted State did not stock QuakerOat Bran, the percentages for all other cereals would be increased by 100/90, or 11.1 percent. Thisadjustment implicitly assumes that the relative ranking of item preferences is independent of
8 Equations (2) and (2′) show a summation over certification categories and food packages. The summation by certifica-tion category would allow presentation of food costs by certification category, but otherwise is not needed (the csubscript would then be taken off
cfpγ ).9 The price of each item in the Survey of Food Prices and Item availability was converted to a unit price, where the units
were gallon of milk, pound of cheese, 18-ounce jar of peanut butter, ounce of adult cereal, 8-ounce box of infant cereal,and 46-fluid ounce equivalent of infant and single-strength juice.
Federal regulations (CFR 246.10) specify juice amounts in units of adult single-strength juice, with all amountsdivisible by 46 ounces, which is the standard container size (see appendix H).
56
alternatives. The assumption provides for comparisons of average prices in smaller grocery storesthat lack a full range of products.
Third, it was assumed that item preferences for cheese and juice are hierarchical; in other words,when separately applying the restricted item distribution (αi) and the unrestricted item distribution(α′i) to store prices, an individual’s preference for type (Cheddar vs. Colby vs. Swiss) took prece-dence over the preference for brand. This assumption was applied to cheese and juice because of thelarge variety of specific brands in these categories. Cheese and juice are available in a large numberof national and regional brands, but any single store typically stocks a limited number of brands. As aresult, the items observed in the scanner data (the αi vector) do not coincide perfectly with the itemsobserved on the food price survey for individual stores. In order to provide weights to the itemsstocked in stores, the item distribution observed in the scanner data was allocated in a hierarchicalfashion.10
Finally, it should be noted that the impact of a cost-containment item restriction on food costs couldnot be evaluated if the restriction was present in all six case study States. For example, all Statesprohibited purchase of cheese in shredded, cubed, and string forms. This restriction could not beevaluated because a counterfactual distribution of item selections (α′i) including these package formsdid not exist among the six States.
The estimated cost of all food packages (total term in the square brackets) was determined for eachstore, and the average cost across stores was weighted by the sampling weights from the Survey ofFood Prices and Item Availability (ωs).
Equations (2) and (2′) were each calculated twice for each food category in each State to obtain:
• Standardized average food costsusing standard food package contents and standarddistribution of participants across certification categories
• Nonstandardized average food costsusing actual food package contents and actualdistribution of participants across certification categories (δc)
Differences across States in standardized average food costs reflect prices, allowable foods, andpreferences over allowable foods. Differences across States in nonstandardized average food costsreflect prices, allowable foods, preferences over allowable foods, differences in the distribution ofparticipants across certification category, and differences across States in food package tailoring.
When calculating standardized food costs, the standard distribution of participants across certificationcategories (δc ) is the average distribution among the six case study States, as shown in table 4-1.11
The standard food package contents are taken from Federal regulations (see appendix H). For bothstandardized and nonstandardized food costs, estimated food costs are based on all WIC foods except
10 For example, suppose the scanner data showed that 25 percent of juice purchases in Connecticut were apple juice.Further, among apple juice purchases, 25 percent were store brand, 25 percent were Minute Maid, 15 percent wereSeneca, and 35 percent were Juicy Juice. If a Connecticut store in the survey did not stock Minute Maid apple juice,the weight of Minute Maid apple juice was reallocated to all other apple juices, not all other juices of any type.
11 Components of the average distribution shown in table 4-1 were rounded to the nearest whole number whenstandardizing estimates.
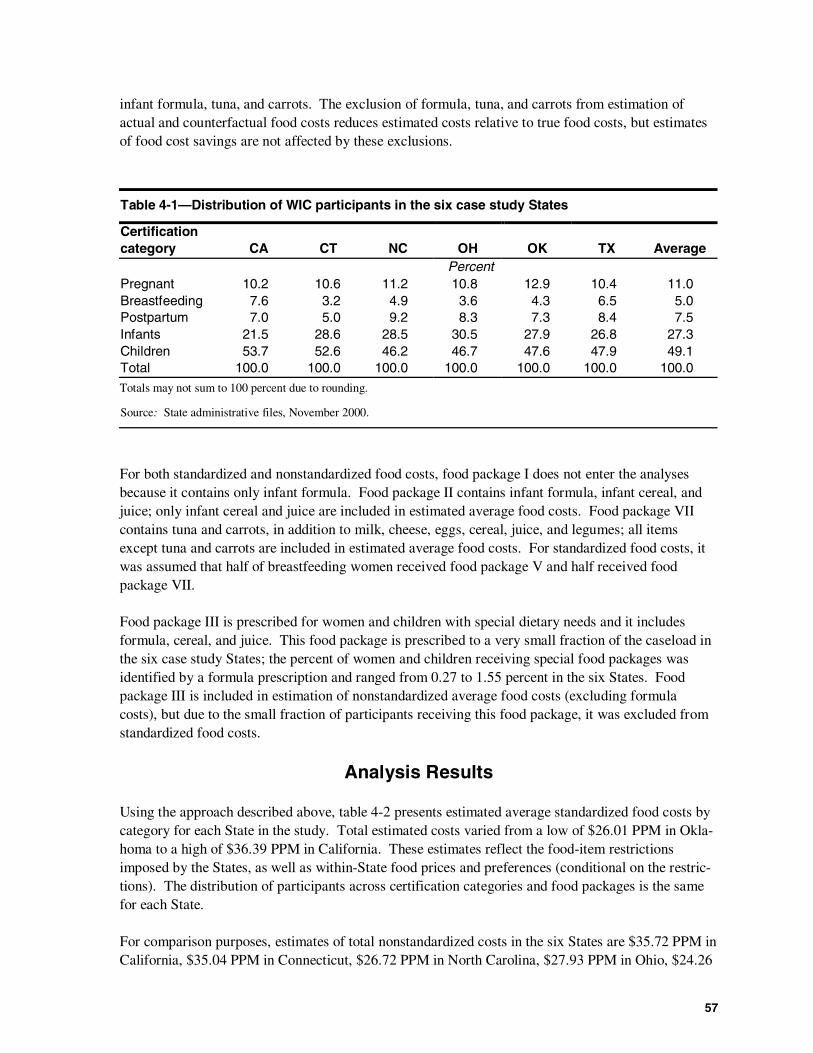
57
infant formula, tuna, and carrots. The exclusion of formula, tuna, and carrots from estimation ofactual and counterfactual food costs reduces estimated costs relative to true food costs, but estimatesof food cost savings are not affected by these exclusions.
Table 4-1—Distribution of WIC participants in the six case study States
Certificationcategory CA CT NC OH OK TX Average
PercentPregnant 10.2 10.6 11.2 10.8 12.9 10.4 11.0Breastfeeding 7.6 3.2 4.9 3.6 4.3 6.5 5.0Postpartum 7.0 5.0 9.2 8.3 7.3 8.4 7.5Infants 21.5 28.6 28.5 30.5 27.9 26.8 27.3Children 53.7 52.6 46.2 46.7 47.6 47.9 49.1Total 100.0 100.0 100.0 100.0 100.0 100.0 100.0
Totals may not sum to 100 percent due to rounding.
Source: State administrative files, November 2000.
For both standardized and nonstandardized food costs, food package I does not enter the analysesbecause it contains only infant formula. Food package II contains infant formula, infant cereal, andjuice; only infant cereal and juice are included in estimated average food costs. Food package VIIcontains tuna and carrots, in addition to milk, cheese, eggs, cereal, juice, and legumes; all itemsexcept tuna and carrots are included in estimated average food costs. For standardized food costs, itwas assumed that half of breastfeeding women received food package V and half received foodpackage VII.
Food package III is prescribed for women and children with special dietary needs and it includesformula, cereal, and juice. This food package is prescribed to a very small fraction of the caseload inthe six case study States; the percent of women and children receiving special food packages wasidentified by a formula prescription and ranged from 0.27 to 1.55 percent in the six States. Foodpackage III is included in estimation of nonstandardized average food costs (excluding formulacosts), but due to the small fraction of participants receiving this food package, it was excluded fromstandardized food costs.
Analysis Results
Using the approach described above, table 4-2 presents estimated average standardized food costs bycategory for each State in the study. Total estimated costs varied from a low of $26.01 PPM in Okla-homa to a high of $36.39 PPM in California. These estimates reflect the food-item restrictionsimposed by the States, as well as within-State food prices and preferences (conditional on the restric-tions). The distribution of participants across certification categories and food packages is the samefor each State.
For comparison purposes, estimates of total nonstandardized costs in the six States are $35.72 PPM inCalifornia, $35.04 PPM in Connecticut, $26.72 PPM in North Carolina, $27.93 PPM in Ohio, $24.26
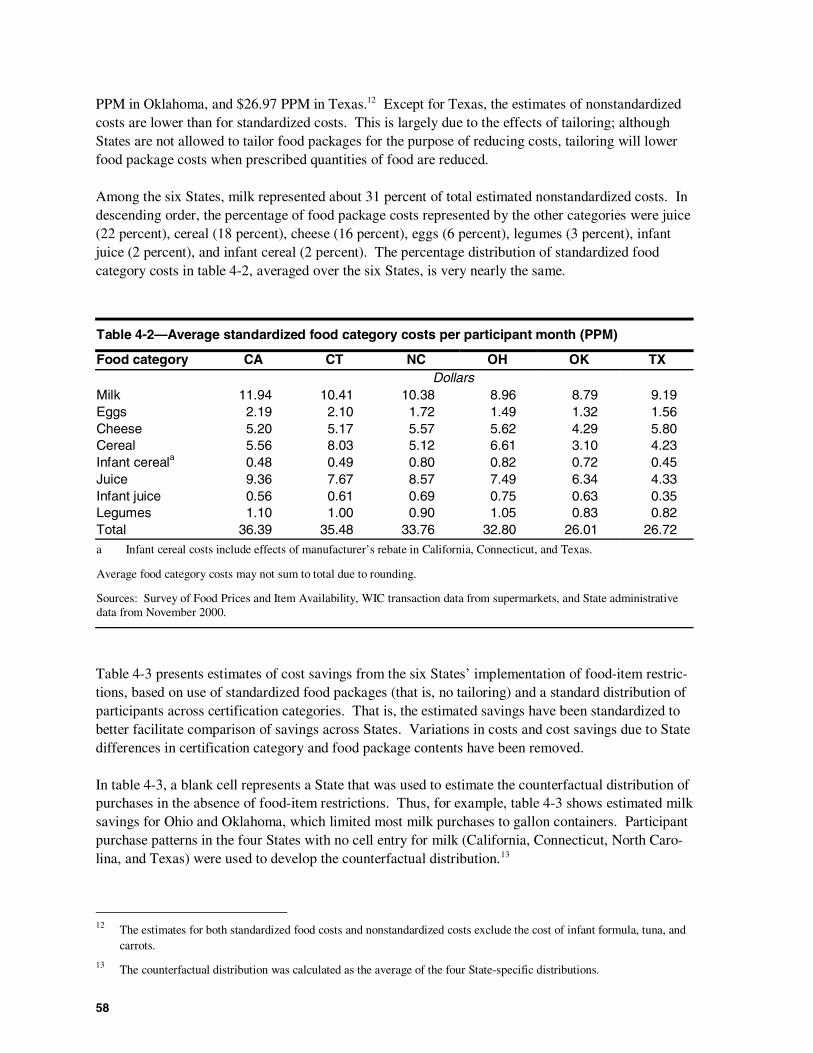
58
PPM in Oklahoma, and $26.97 PPM in Texas.12 Except for Texas, the estimates of nonstandardizedcosts are lower than for standardized costs. This is largely due to the effects of tailoring; althoughStates are not allowed to tailor food packages for the purpose of reducing costs, tailoring will lowerfood package costs when prescribed quantities of food are reduced.
Among the six States, milk represented about 31 percent of total estimated nonstandardized costs. Indescending order, the percentage of food package costs represented by the other categories were juice(22 percent), cereal (18 percent), cheese (16 percent), eggs (6 percent), legumes (3 percent), infantjuice (2 percent), and infant cereal (2 percent). The percentage distribution of standardized foodcategory costs in table 4-2, averaged over the six States, is very nearly the same.
Table 4-2—Average standardized food category costs per participant month (PPM)
Food category CA CT NC OH OK TXDollars
Milk 11.94 10.41 10.38 8.96 8.79 9.19Eggs 2.19 2.10 1.72 1.49 1.32 1.56Cheese 5.20 5.17 5.57 5.62 4.29 5.80Cereal 5.56 8.03 5.12 6.61 3.10 4.23Infant cereala 0.48 0.49 0.80 0.82 0.72 0.45Juice 9.36 7.67 8.57 7.49 6.34 4.33Infant juice 0.56 0.61 0.69 0.75 0.63 0.35Legumes 1.10 1.00 0.90 1.05 0.83 0.82Total 36.39 35.48 33.76 32.80 26.01 26.72a Infant cereal costs include effects of manufacturer’s rebate in California, Connecticut, and Texas.
Average food category costs may not sum to total due to rounding.
Sources: Survey of Food Prices and Item Availability, WIC transaction data from supermarkets, and State administrativedata from November 2000.
Table 4-3 presents estimates of cost savings from the six States’ implementation of food-item restric-tions, based on use of standardized food packages (that is, no tailoring) and a standard distribution ofparticipants across certification categories. That is, the estimated savings have been standardized tobetter facilitate comparison of savings across States. Variations in costs and cost savings due to Statedifferences in certification category and food package contents have been removed.
In table 4-3, a blank cell represents a State that was used to estimate the counterfactual distribution ofpurchases in the absence of food-item restrictions. Thus, for example, table 4-3 shows estimated milksavings for Ohio and Oklahoma, which limited most milk purchases to gallon containers. Participantpurchase patterns in the four States with no cell entry for milk (California, Connecticut, North Caro-lina, and Texas) were used to develop the counterfactual distribution.13
12 The estimates for both standardized food costs and nonstandardized costs exclude the cost of infant formula, tuna, andcarrots.
13 The counterfactual distribution was calculated as the average of the four State-specific distributions.
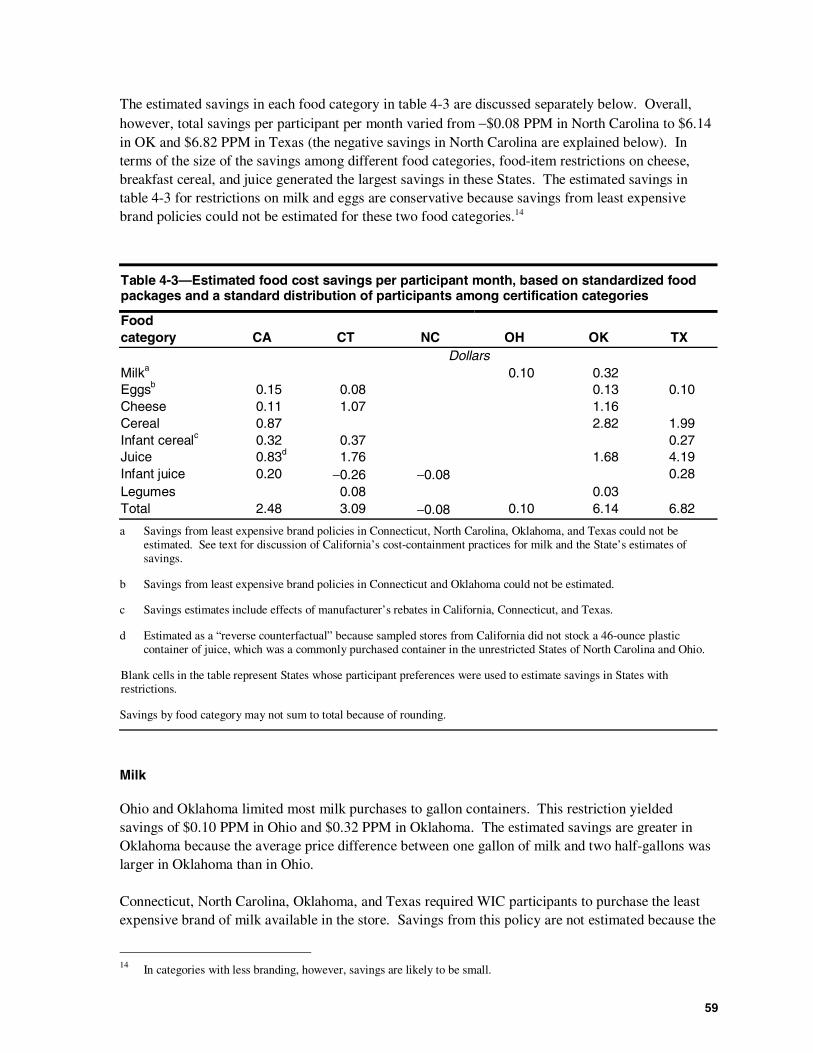
59
The estimated savings in each food category in table 4-3 are discussed separately below. Overall,however, total savings per participant per month varied from −$0.08 PPM in North Carolina to $6.14in OK and $6.82 PPM in Texas (the negative savings in North Carolina are explained below). Interms of the size of the savings among different food categories, food-item restrictions on cheese,breakfast cereal, and juice generated the largest savings in these States. The estimated savings intable 4-3 for restrictions on milk and eggs are conservative because savings from least expensivebrand policies could not be estimated for these two food categories.14
Table 4-3—Estimated food cost savings per participant month, based on standardized foodpackages and a standard distribution of participants among certification categories
Foodcategory CA CT NC OH OK TX
DollarsMilka 0.10 0.32Eggsb 0.15 0.08 0.13 0.10Cheese 0.11 1.07 1.16Cereal 0.87 2.82 1.99Infant cerealc 0.32 0.37 0.27Juice 0.83d 1.76 1.68 4.19Infant juice 0.20 −0.26 −0.08 0.28Legumes 0.08 0.03Total 2.48 3.09 −0.08 0.10 6.14 6.82
a Savings from least expensive brand policies in Connecticut, North Carolina, Oklahoma, and Texas could not beestimated. See text for discussion of California’s cost-containment practices for milk and the State’s estimates ofsavings.
b Savings from least expensive brand policies in Connecticut and Oklahoma could not be estimated.
c Savings estimates include effects of manufacturer’s rebates in California, Connecticut, and Texas.
d Estimated as a “reverse counterfactual” because sampled stores from California did not stock a 46-ounce plasticcontainer of juice, which was a commonly purchased container in the unrestricted States of North Carolina and Ohio.
Blank cells in the table represent States whose participant preferences were used to estimate savings in States withrestrictions.
Savings by food category may not sum to total because of rounding.
Milk
Ohio and Oklahoma limited most milk purchases to gallon containers. This restriction yieldedsavings of $0.10 PPM in Ohio and $0.32 PPM in Oklahoma. The estimated savings are greater inOklahoma because the average price difference between one gallon of milk and two half-gallons waslarger in Oklahoma than in Ohio.
Connecticut, North Carolina, Oklahoma, and Texas required WIC participants to purchase the leastexpensive brand of milk available in the store. Savings from this policy are not estimated because the
14 In categories with less branding, however, savings are likely to be small.
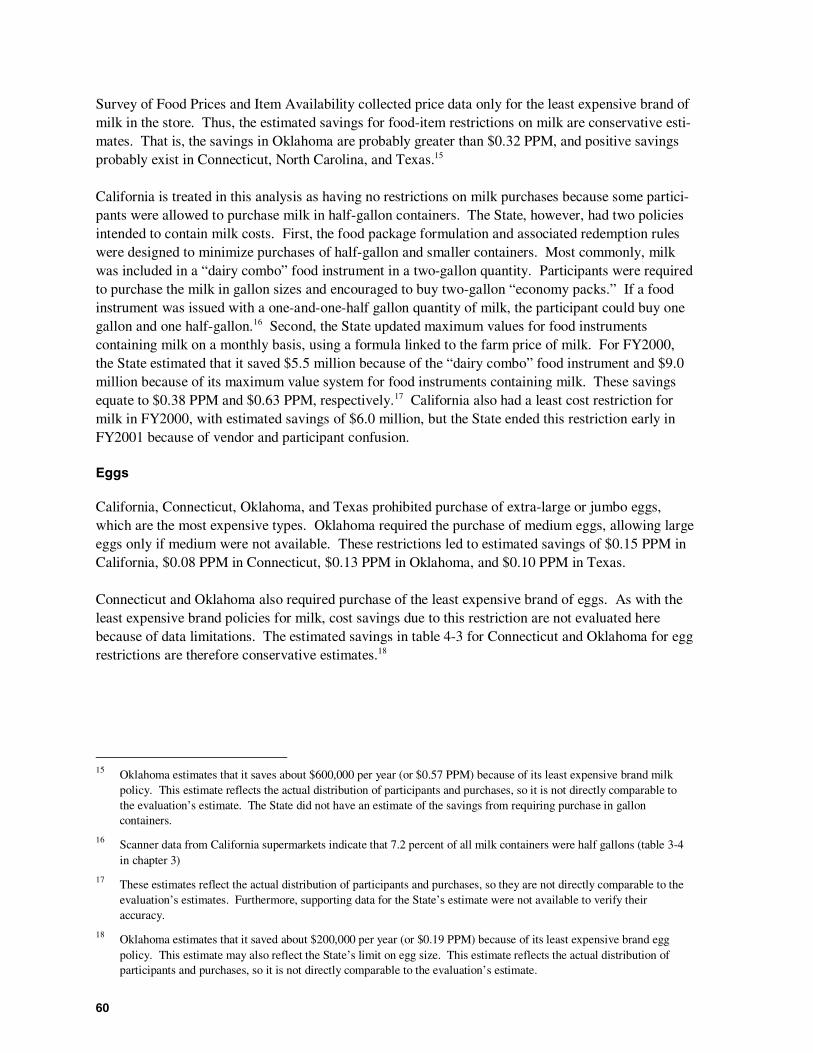
60
Survey of Food Prices and Item Availability collected price data only for the least expensive brand ofmilk in the store. Thus, the estimated savings for food-item restrictions on milk are conservative esti-mates. That is, the savings in Oklahoma are probably greater than $0.32 PPM, and positive savingsprobably exist in Connecticut, North Carolina, and Texas.15
California is treated in this analysis as having no restrictions on milk purchases because some partici-pants were allowed to purchase milk in half-gallon containers. The State, however, had two policiesintended to contain milk costs. First, the food package formulation and associated redemption ruleswere designed to minimize purchases of half-gallon and smaller containers. Most commonly, milkwas included in a “dairy combo” food instrument in a two-gallon quantity. Participants were requiredto purchase the milk in gallon sizes and encouraged to buy two-gallon “economy packs.” If a foodinstrument was issued with a one-and-one-half gallon quantity of milk, the participant could buy onegallon and one half-gallon.16 Second, the State updated maximum values for food instrumentscontaining milk on a monthly basis, using a formula linked to the farm price of milk. For FY2000,the State estimated that it saved $5.5 million because of the “dairy combo” food instrument and $9.0million because of its maximum value system for food instruments containing milk. These savingsequate to $0.38 PPM and $0.63 PPM, respectively.17 California also had a least cost restriction formilk in FY2000, with estimated savings of $6.0 million, but the State ended this restriction early inFY2001 because of vendor and participant confusion.
Eggs
California, Connecticut, Oklahoma, and Texas prohibited purchase of extra-large or jumbo eggs,which are the most expensive types. Oklahoma required the purchase of medium eggs, allowing largeeggs only if medium were not available. These restrictions led to estimated savings of $0.15 PPM inCalifornia, $0.08 PPM in Connecticut, $0.13 PPM in Oklahoma, and $0.10 PPM in Texas.
Connecticut and Oklahoma also required purchase of the least expensive brand of eggs. As with theleast expensive brand policies for milk, cost savings due to this restriction are not evaluated herebecause of data limitations. The estimated savings in table 4-3 for Connecticut and Oklahoma for eggrestrictions are therefore conservative estimates.18
15 Oklahoma estimates that it saves about $600,000 per year (or $0.57 PPM) because of its least expensive brand milkpolicy. This estimate reflects the actual distribution of participants and purchases, so it is not directly comparable tothe evaluation’s estimate. The State did not have an estimate of the savings from requiring purchase in galloncontainers.
16 Scanner data from California supermarkets indicate that 7.2 percent of all milk containers were half gallons (table 3-4in chapter 3)
17 These estimates reflect the actual distribution of participants and purchases, so they are not directly comparable to theevaluation’s estimates. Furthermore, supporting data for the State’s estimate were not available to verify theiraccuracy.
18 Oklahoma estimates that it saved about $200,000 per year (or $0.19 PPM) because of its least expensive brand eggpolicy. This estimate may also reflect the State’s limit on egg size. This estimate reflects the actual distribution ofparticipants and purchases, so it is not directly comparable to the evaluation’s estimate.
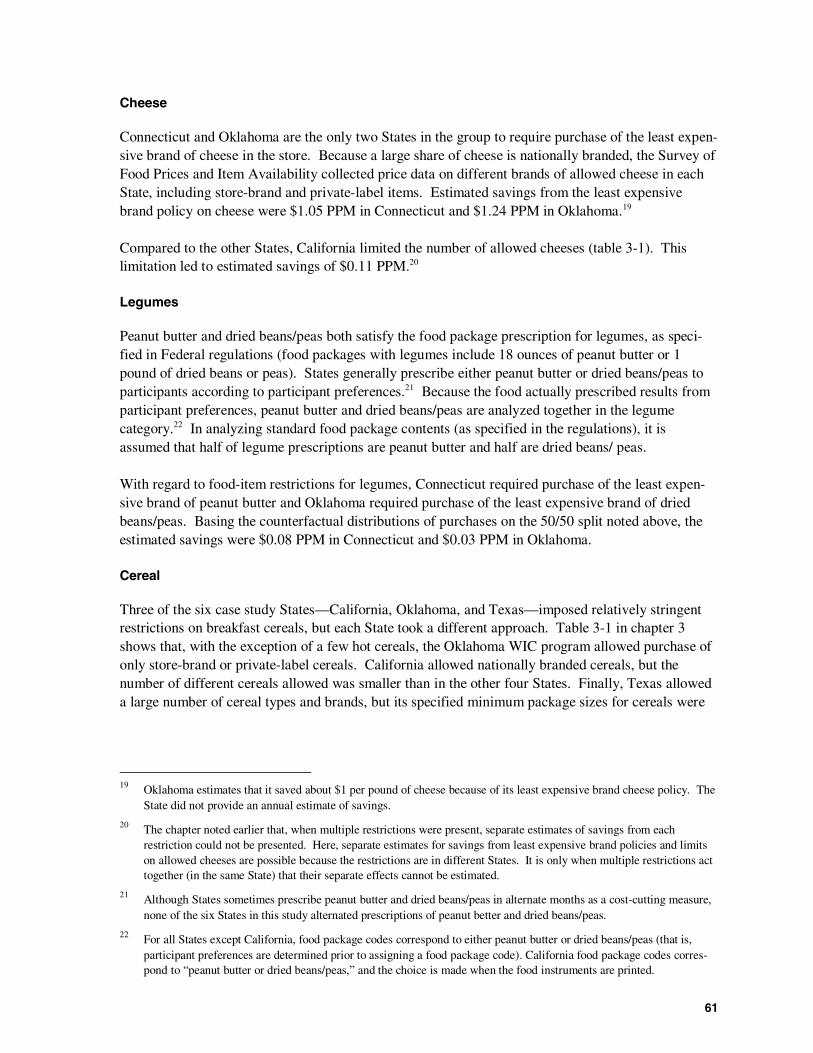
61
Cheese
Connecticut and Oklahoma are the only two States in the group to require purchase of the least expen-sive brand of cheese in the store. Because a large share of cheese is nationally branded, the Survey ofFood Prices and Item Availability collected price data on different brands of allowed cheese in eachState, including store-brand and private-label items. Estimated savings from the least expensivebrand policy on cheese were $1.05 PPM in Connecticut and $1.24 PPM in Oklahoma.19
Compared to the other States, California limited the number of allowed cheeses (table 3-1). Thislimitation led to estimated savings of $0.11 PPM.20
Legumes
Peanut butter and dried beans/peas both satisfy the food package prescription for legumes, as speci-fied in Federal regulations (food packages with legumes include 18 ounces of peanut butter or 1pound of dried beans or peas). States generally prescribe either peanut butter or dried beans/peas toparticipants according to participant preferences.21 Because the food actually prescribed results fromparticipant preferences, peanut butter and dried beans/peas are analyzed together in the legumecategory.22 In analyzing standard food package contents (as specified in the regulations), it isassumed that half of legume prescriptions are peanut butter and half are dried beans/ peas.
With regard to food-item restrictions for legumes, Connecticut required purchase of the least expen-sive brand of peanut butter and Oklahoma required purchase of the least expensive brand of driedbeans/peas. Basing the counterfactual distributions of purchases on the 50/50 split noted above, theestimated savings were $0.08 PPM in Connecticut and $0.03 PPM in Oklahoma.
Cereal
Three of the six case study States—California, Oklahoma, and Texas—imposed relatively stringentrestrictions on breakfast cereals, but each State took a different approach. Table 3-1 in chapter 3shows that, with the exception of a few hot cereals, the Oklahoma WIC program allowed purchase ofonly store-brand or private-label cereals. California allowed nationally branded cereals, but thenumber of different cereals allowed was smaller than in the other four States. Finally, Texas alloweda large number of cereal types and brands, but its specified minimum package sizes for cereals were
19 Oklahoma estimates that it saved about $1 per pound of cheese because of its least expensive brand cheese policy. TheState did not provide an annual estimate of savings.
20 The chapter noted earlier that, when multiple restrictions were present, separate estimates of savings from eachrestriction could not be presented. Here, separate estimates for savings from least expensive brand policies and limitson allowed cheeses are possible because the restrictions are in different States. It is only when multiple restrictions acttogether (in the same State) that their separate effects cannot be estimated.
21 Although States sometimes prescribe peanut butter and dried beans/peas in alternate months as a cost-cutting measure,none of the six States in this study alternated prescriptions of peanut better and dried beans/peas.
22 For all States except California, food package codes correspond to either peanut butter or dried beans/peas (that is,participant preferences are determined prior to assigning a food package code). California food package codes corres-pond to “peanut butter or dried beans/peas,” and the choice is made when the food instruments are printed.
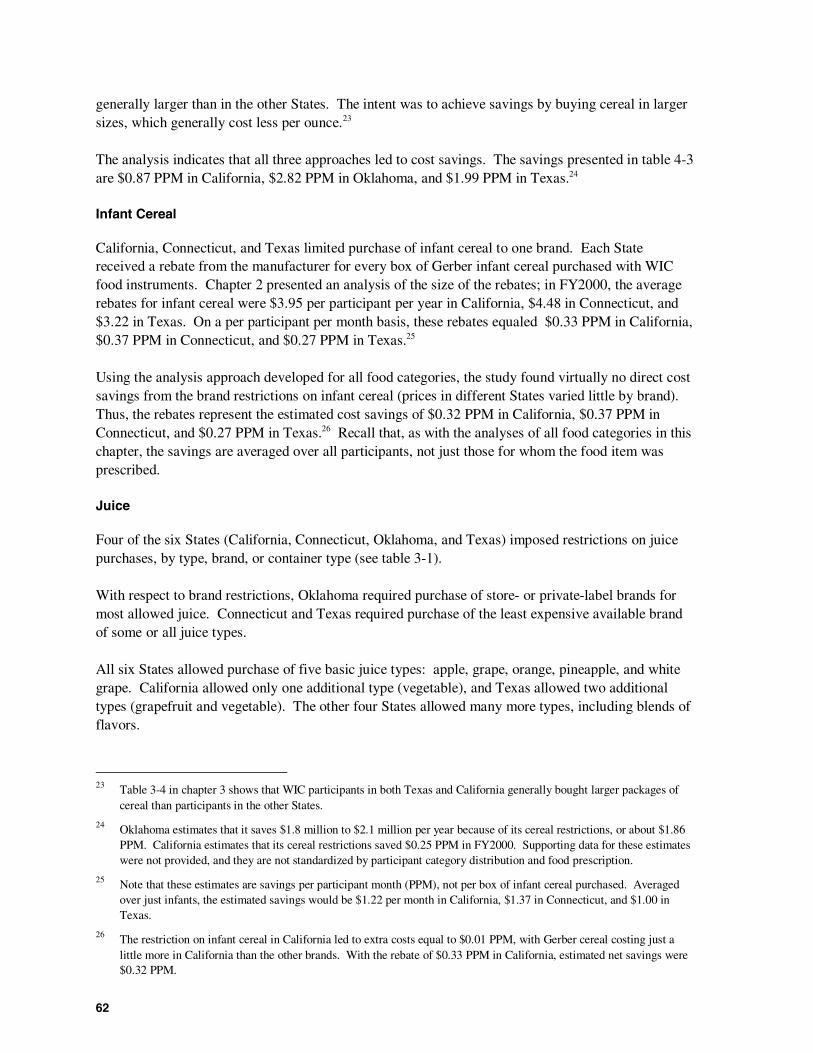
62
generally larger than in the other States. The intent was to achieve savings by buying cereal in largersizes, which generally cost less per ounce.23
The analysis indicates that all three approaches led to cost savings. The savings presented in table 4-3are $0.87 PPM in California, $2.82 PPM in Oklahoma, and $1.99 PPM in Texas.24
Infant Cereal
California, Connecticut, and Texas limited purchase of infant cereal to one brand. Each Statereceived a rebate from the manufacturer for every box of Gerber infant cereal purchased with WICfood instruments. Chapter 2 presented an analysis of the size of the rebates; in FY2000, the averagerebates for infant cereal were $3.95 per participant per year in California, $4.48 in Connecticut, and$3.22 in Texas. On a per participant per month basis, these rebates equaled $0.33 PPM in California,$0.37 PPM in Connecticut, and $0.27 PPM in Texas.25
Using the analysis approach developed for all food categories, the study found virtually no direct costsavings from the brand restrictions on infant cereal (prices in different States varied little by brand).Thus, the rebates represent the estimated cost savings of $0.32 PPM in California, $0.37 PPM inConnecticut, and $0.27 PPM in Texas.26 Recall that, as with the analyses of all food categories in thischapter, the savings are averaged over all participants, not just those for whom the food item wasprescribed.
Juice
Four of the six States (California, Connecticut, Oklahoma, and Texas) imposed restrictions on juicepurchases, by type, brand, or container type (see table 3-1).
With respect to brand restrictions, Oklahoma required purchase of store- or private-label brands formost allowed juice. Connecticut and Texas required purchase of the least expensive available brandof some or all juice types.
All six States allowed purchase of five basic juice types: apple, grape, orange, pineapple, and whitegrape. California allowed only one additional type (vegetable), and Texas allowed two additionaltypes (grapefruit and vegetable). The other four States allowed many more types, including blends offlavors.
23 Table 3-4 in chapter 3 shows that WIC participants in both Texas and California generally bought larger packages ofcereal than participants in the other States.
24 Oklahoma estimates that it saves $1.8 million to $2.1 million per year because of its cereal restrictions, or about $1.86PPM. California estimates that its cereal restrictions saved $0.25 PPM in FY2000. Supporting data for these estimateswere not provided, and they are not standardized by participant category distribution and food prescription.
25 Note that these estimates are savings per participant month (PPM), not per box of infant cereal purchased. Averagedover just infants, the estimated savings would be $1.22 per month in California, $1.37 in Connecticut, and $1.00 inTexas.
26 The restriction on infant cereal in California led to extra costs equal to $0.01 PPM, with Gerber cereal costing just alittle more in California than the other brands. With the rebate of $0.33 PPM in California, estimated net savings were$0.32 PPM.
63
With respect to package size and form, all States allowed purchase of both frozen and shelf-stablejuices. North Carolina, Ohio, and Oklahoma also allowed shelf-stable liquid concentrate. All Statesexcept California required most shelf-stable, regular-strength juice to be purchased in 46-ouncecontainers,27 whereas California limited purchases of shelf-stable juices to 64-ounce containers.North Carolina and Ohio were the only two States to allow purchase of shelf-stable juice in eithercans or plastic bottles. Oklahoma and Texas limited purchases of shelf-stable juices to cans; Cali-fornia required purchase of 64-ounce bottles, and Connecticut required cans for all juices exceptorange juice, which had to be purchased in carton form.
For Connecticut and Oklahoma, the restrictions yielded similar savings: $1.76 PPM in Connecticutand $1.68 in Oklahoma. The estimated savings in Texas were considerably higher at $4.19 PPM.These large savings were the result of the State using several types of restrictions on juice in combi-nation: a least expensive brand policy; limits on the types of juice that could be purchased; and aprohibition on the purchase of 46-ounce plastic bottles, which are more expensive than cans.
The savings from juice restrictions in California are estimated as $0.83 PPM. A different estimationapproach, however, had to be used in California. North Carolina and Ohio (the unrestricted States)allowed purchase of either 46-ounce cans or 46-ounce plastic containers of juice, and scanner datarevealed a strong preference in these States for plastic containers. Few of the sampled stores inCalifornia carried 46-ounce plastic containers of juice, so the counterfactual purchase could not bepriced in California stores. Instead, the savings in California are based on a “reverse counterfactual”estimation approach. This approach estimated costs for juice in North Carolina and Ohio byimposing California juice restrictions on allowed types and packaging. These costs were thensubtracted from estimated actual costs in the two States to estimate savings related to these restric-tions (that is, the savings that would accrue in North Carolina and Ohio if they adopted California’srestrictions on juice). These estimated savings averaged $0.83 PPM, and they serve as the estimatedsavings for California.
Infant Juice
Ohio and Oklahoma were the only two States in the study that prescribed infant juice. The otherStates prescribed single-strength adult juices to save money. Substitution of single-strength for infantjuice yielded estimated savings in California and Texas of $0.20 PPM and $0.28 PPM, respectively.In Connecticut and North Carolina, however, juice costs increased by $0.26 PPM and $0.08 PPM,respectively. By requiring 46-ounce adult juice containers instead of 32-ounce infant juicecontainers, these two States paid slightly higher costs, but they distributed more juice. Variationsacross markets in the relative costs of single-strength and infant juices, and in allowable containersfor single-strength juice, account for the differences in estimated savings for the four States.
Estimates of State Savings
By design, the estimates of food cost savings presented above and in table 4-3 do not account forvariation among the States in food package tailoring and the distribution of participants across WICcertification categories. For those who desire State-level estimates that are closer to the actualsavings arising from food-item restrictions (but less comparable among States), table 4-4 presents
27 Federal regulations specify juice prescriptions in multiples of 46 ounces.
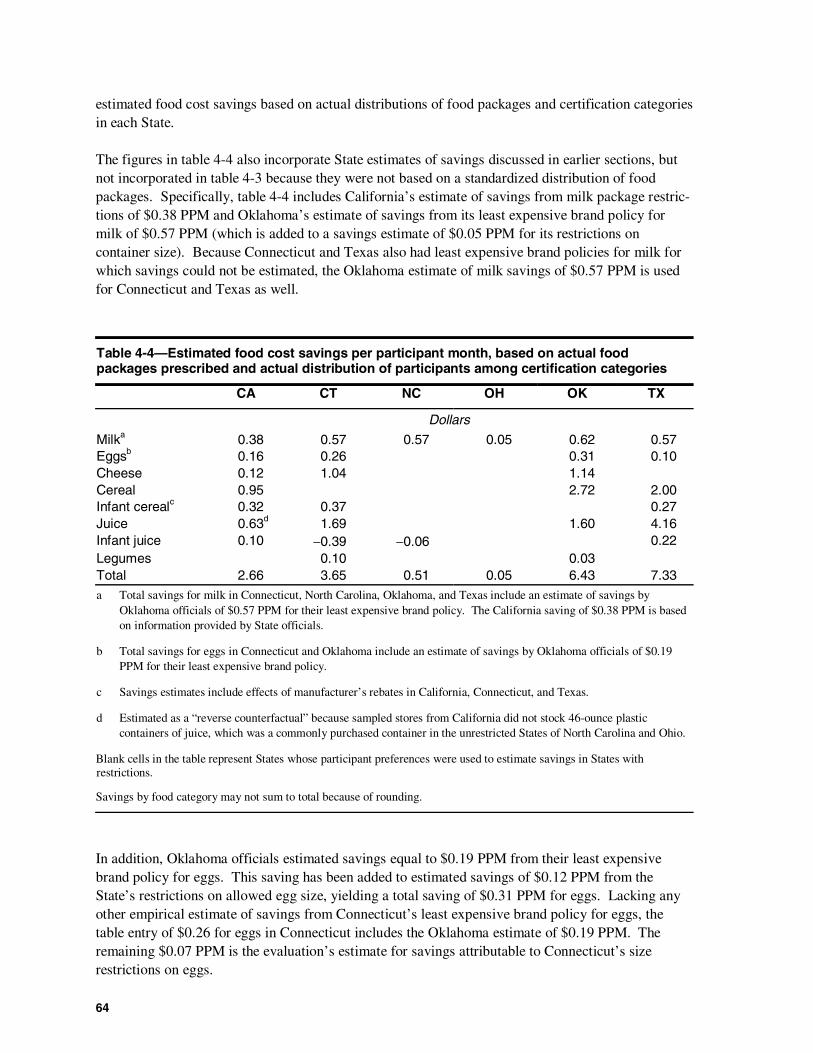
64
estimated food cost savings based on actual distributions of food packages and certification categoriesin each State.
The figures in table 4-4 also incorporate State estimates of savings discussed in earlier sections, butnot incorporated in table 4-3 because they were not based on a standardized distribution of foodpackages. Specifically, table 4-4 includes California’s estimate of savings from milk package restric-tions of $0.38 PPM and Oklahoma’s estimate of savings from its least expensive brand policy formilk of $0.57 PPM (which is added to a savings estimate of $0.05 PPM for its restrictions oncontainer size). Because Connecticut and Texas also had least expensive brand policies for milk forwhich savings could not be estimated, the Oklahoma estimate of milk savings of $0.57 PPM is usedfor Connecticut and Texas as well.
Table 4-4—Estimated food cost savings per participant month, based on actual foodpackages prescribed and actual distribution of participants among certification categories
CA CT NC OH OK TX
Dollars
Milka 0.38 0.57 0.57 0.05 0.62 0.57Eggsb 0.16 0.26 0.31 0.10Cheese 0.12 1.04 1.14Cereal 0.95 2.72 2.00Infant cerealc 0.32 0.37 0.27Juice 0.63d 1.69 1.60 4.16Infant juice 0.10 −0.39 −0.06 0.22Legumes 0.10 0.03Total 2.66 3.65 0.51 0.05 6.43 7.33a Total savings for milk in Connecticut, North Carolina, Oklahoma, and Texas include an estimate of savings by
Oklahoma officials of $0.57 PPM for their least expensive brand policy. The California saving of $0.38 PPM is basedon information provided by State officials.
b Total savings for eggs in Connecticut and Oklahoma include an estimate of savings by Oklahoma officials of $0.19PPM for their least expensive brand policy.
c Savings estimates include effects of manufacturer’s rebates in California, Connecticut, and Texas.
d Estimated as a “reverse counterfactual” because sampled stores from California did not stock 46-ounce plasticcontainers of juice, which was a commonly purchased container in the unrestricted States of North Carolina and Ohio.
Blank cells in the table represent States whose participant preferences were used to estimate savings in States withrestrictions.
Savings by food category may not sum to total because of rounding.
In addition, Oklahoma officials estimated savings equal to $0.19 PPM from their least expensivebrand policy for eggs. This saving has been added to estimated savings of $0.12 PPM from theState’s restrictions on allowed egg size, yielding a total saving of $0.31 PPM for eggs. Lacking anyother empirical estimate of savings from Connecticut’s least expensive brand policy for eggs, thetable entry of $0.26 for eggs in Connecticut includes the Oklahoma estimate of $0.19 PPM. Theremaining $0.07 PPM is the evaluation’s estimate for savings attributable to Connecticut’s sizerestrictions on eggs.
65
Therefore, the estimated savings in table 4-4 for milk and eggs (and for total savings) represent amixture of evaluation and State official’s estimates of savings from food-item restrictions. Althoughthe estimates provided by State officials could not be verified, they provide information that theevaluation could not provide because of data limitations.28
With the combination of State and evaluation estimates of savings in table 4-4, total savings fromfood-item restrictions ranged from a low of $0.05 PPM in Ohio to a high of $7.33 PPM in Texas. Inboth tables 4-3 and 4-4, Ohio had small estimates of total savings, and North Carolina had either asmall loss or a modest saving. The finding of small effects in these two States is not surprising.North Carolina and Ohio were selected to represent States with few food-item restrictions, so costsavings due to such restrictions were not expected.
Of the four States with large estimated savings from their food-item restrictions, Texas had thelargest—$6.82 PPM in table 4-3 and $7.33 PPM in table 4-4. The largest contributors to thesesavings were the State’s large minimum package size requirements for cereal and its combined juicepolicies of least expensive brand and limited types and containers.
With estimated savings of $6.14 PPM (table 4-3) and $6.43 PPM (table 4-4), Oklahoma had thesecond highest estimated savings within the six States. One of the reasons for selecting Oklahomawas to examine the consequences of its requirement that only store-brand or private-label cerealscould be purchased with WIC food instruments. This restriction led to estimated savings of $2.82PPM (table 4-3) and $2.72 PPM (table 4-4). Other major contributors to Oklahoma’s total savingswere its least expensive brand policy for cheese and its requirement that juice purchases be limited tostore or private-label brands.
Total food package cost savings in Connecticut are estimated as $3.09 PPM (table 4-3) and $3.65PPM (table 4-4). The largest contributions to these savings came from the State’s least expensivebrand restrictions on cheese and juice. Finally, the estimated savings for California ($2.48 PPM intable 4-3 and $2.66 PPM in table 4-4) arose largely from its restrictions on the number and types ofcereal that may be purchased and on its package size restrictions on juice.
The estimated savings per participant per month in table 4-4 represent substantial reductions inaverage food package costs, both in percentage terms and as annualized savings. Table 4-5 presentsthe estimated reductions. On a percentage basis, Oklahoma and Texas experienced the largest esti-mated reductions in food package costs: 21.0 and 21.4 percent, respectively. California and Texashad the greatest annualized savings, $39.7 and $66.0 million, respectively, due to the combination oftheir large WIC caseloads and large savings per participant per month.
The annualized savings presented in table 4-5 are not the same as annual savings; the estimates inthe table are based on WIC price and transaction data collected at a point in time, not over the courseof a full year.
28 California officials’ estimate of $0.63 PPM in savings due to use of maximum price restrictions on milk are notincluded because savings from maximum value restrictions on food instruments in the other States are not available.
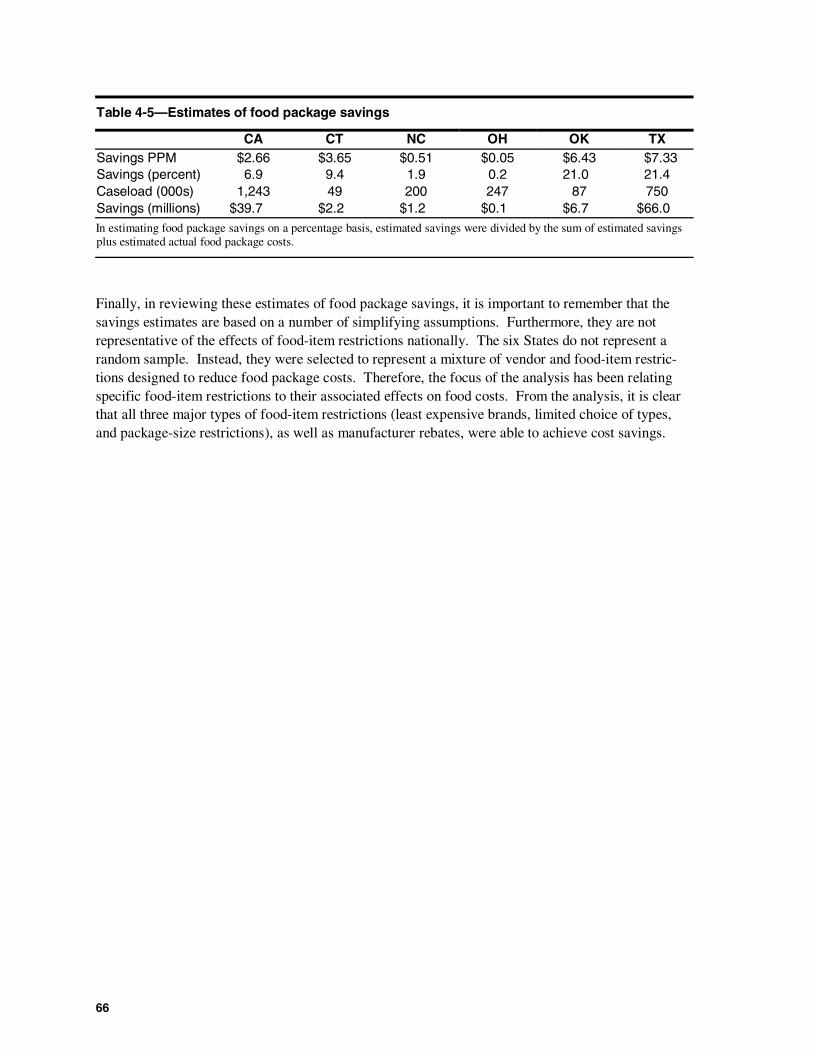
66
Table 4-5—Estimates of food package savings
CA CT NC OH OK TXSavings PPM $2.66 $3.65 $0.51 $0.05 $6.43 $7.33Savings (percent) 6.9 9.4 1.9 0.2 21.0 21.4Caseload (000s) 1,243 49 200 247 87 750Savings (millions) $39.7 $2.2 $1.2 $0.1 $6.7 $66.0In estimating food package savings on a percentage basis, estimated savings were divided by the sum of estimated savingsplus estimated actual food package costs.
Finally, in reviewing these estimates of food package savings, it is important to remember that thesavings estimates are based on a number of simplifying assumptions. Furthermore, they are notrepresentative of the effects of food-item restrictions nationally. The six States do not represent arandom sample. Instead, they were selected to represent a mixture of vendor and food-item restric-tions designed to reduce food package costs. Therefore, the focus of the analysis has been relatingspecific food-item restrictions to their associated effects on food costs. From the analysis, it is clearthat all three major types of food-item restrictions (least expensive brands, limited choice of types,and package-size restrictions), as well as manufacturer rebates, were able to achieve cost savings.
67
Chapter 5Access to WIC Vendors and Availability of
Prescribed Foods
State use of a competitive pricing policy at vendor application may restrict WIC participants’ accessto authorized vendors. Competitive pricing policies and food-item restrictions may both impact theavailability of prescribed foods in authorized WIC stores. This chapter examines the effects of thesepolicies and restrictions on participant access to vendors and food availability in the six case studyStates.
Competitive pricing policies are designed to limit the average cost of prescribed WIC food packages,either by keeping high-price stores out of the program or by causing them to reduce the prices theycharge to WIC. Such policies, however, may restrict WIC participants’ access to vendors if thepolicy reduces their number. As discussed in chapter 2, Connecticut, Oklahoma, and Texas hadexplicit price standards for vendor applications. All three States used a fixed threshold for evaluatingprices of a standard package of WIC foods (which varied by State). If a store’s price for the packageof foods exceeded the threshold, the store had to lower its prices or not be authorized.1 In the otherthree case study States, program analysts had greater flexibility in judging whether store prices wereappropriate. The study therefore treats Connecticut, Oklahoma, and Texas as having “restrictive”vendor selection policies for purposes of comparing participant access and availability of food.
Chapter 2 also noted that very few retailer applications had been denied as a result of competitivepricing policies in any of the States. It is possible, however, that these policies may have dissuadedhigh-price retailers from applying for authorization, thereby reducing the number of stores partici-pating and, potentially, participants’ access to stores that were authorized.
Cost-containment practices may also reduce the availability of prescribed WIC foods. First, ifcompetitive pricing restrictions have the unintended consequence of limiting the availability of well-stocked stores, then WIC participants may have difficulty finding prescribed foods at remaining WICvendors. Second, when State cost-containment practices limit the number of different food items thatmay be purchased with the WIC food instrument, there may be a greater likelihood that an approveditem will not be available when the WIC participant shops.
Research Approach
The first portion of this chapter examines whether measures of participant access to WIC vendorsdiffer between the three States with the most restrictive price standards (Connecticut, Oklahoma, andTexas) and the remaining less restrictive States. Measures of access include distance, travel time, andout-of-pocket costs incurred when traveling to the store in which a participant does most of her WICshopping, especially in comparison to the store in which most regular (non-WIC) shopping is done.
1 Thresholds were determined as a percentage premium over average package price, as determined by store type andarea. Connecticut required that an applicant’s total price be within 7.5 percent of the average price. The thresholds inOklahoma and Texas were 5.0 and 8.0 percent, respectively. Because the States used different approaches to calculateaverage prices, one cannot infer that Oklahoma necessarily had the most stringent policy of the three States.
68
The second portion of the chapter looks at the availability of prescribed foods using two different datasources. The Survey of Food Prices and Item Availability captured information on which State-prescribed food items were available in a sample of WIC vendors in each State. In addition, forrespondents to the Survey of WIC Participants who said they did not buy all the WIC food itemsprescribed for them, the survey asked for the main reason they did not buy all of each item. One ofthe response codes to these questions was that the store ran out of the item, and the chapter examineswhether the frequency of this response is related to the presence of food-item restrictions.
Participant Access to WIC Vendors
Survey respondents’ access to WIC vendors was examined both in absolute terms and in relation toaccess to their regular food stores. In the vast majority of cases (87 percent), however, respondentsdid their WIC shopping at the same store where they did their regular food shopping.
Table 5-1 presents information on participant access to WIC vendors, based on data from the study’sSurvey of WIC Participants. The survey asked respondents about the store where they usually usedtheir WIC food instruments. The table shows average distance to the WIC store (in miles), averagetravel time to the store (minutes), the percentage of respondents who incurred travel expenses whengoing to the WIC store, and the average out-of-pocket expenses incurred.
The average distance traveled to the respondent’s usual WIC store was 3.9 miles.2 Participants inCalifornia traveled the shortest average distance (2.6 miles), whereas Oklahoma participants traveledthe longest average distance to shop (5.2 miles). Average travel time for the six States was 11.0minutes (one way), with Connecticut and California participants spending, respectively, the least andmost time to travel (9.5 and 12.7 minutes).
A cross-State average of only 5.1 percent of respondents said that they incurred out-of-pocketexpenses for the trip to the store. These expenses included bus or taxi fares, tolls, and parking fees.Averaged over the entire sample of respondents, not just those who said they incurred costs, theaverage cost was $0.14 for a one-way trip. With an average of $0.45 per one-way trip, Californiarespondents paid by far the highest out-of-pocket costs, largely because they were most likely (18.3percent) to incur any out-of-pocket costs. 3
When the averages in States without vendor restrictions are compared to averages in the three restric-tive States of Connecticut, Oklahoma, and Texas, only two of the group differences in table 5-1 arestatistically significant. Absolute travel time to the respondent’s WIC store was, on average, 1.7minutes shorter in the States with restrictions than without (significant at the 0.01 level), and respon-dents in the nonrestrictive States were significantly more likely to incur travel expenses (significant atthe 0.01 level). These findings are opposite what one would expect if State cost-containment
2 Group averages reported in this and following chapters give equal weight to data from each State, regardless of the sizeof the State’s WIC caseload. If averages for groups of States (for instance, all restrictive or nonrestrictive States) wereweighted by caseload, all results would be dominated by the experience of WIC participants in California and Texas,which have the largest WIC caseloads in the study.
3 The high travel times and out-of-pocket expenses in California appear to be related to how respondents traveled to theirshopping destination. Respondents in California were the most likely to travel by bus or taxi, thereby incurring costs.They were also relatively likely to walk to the store, contributing to the higher travel times in California.
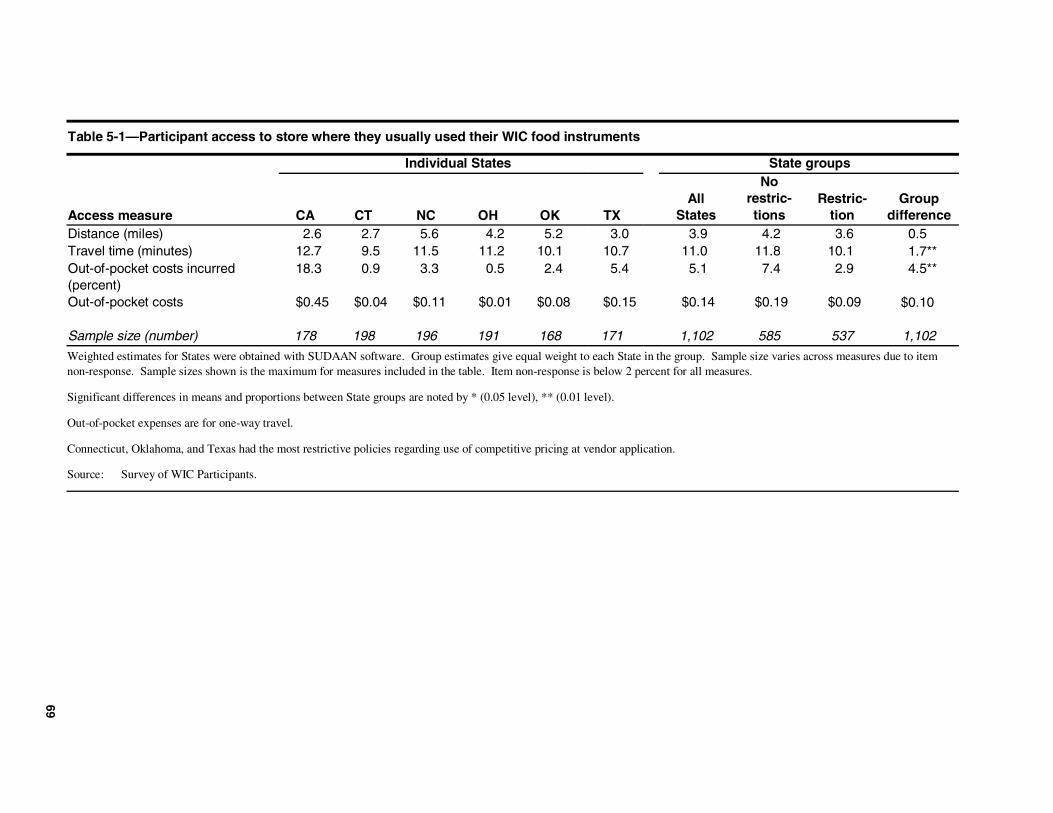
69
Table 5-1—Participant access to store where they usually used their WIC food instruments
Individual States State groups
Access measure CA CT NC OH OK TXAll
States
Norestric-tions
Restric-tion
Groupdifference
Distance (miles) 2.6 2.7 5.6 4.2 5.2 3.0 3.9 4.2 3.6 !0.5Travel time (minutes) 12.7 9.5 11.5 11.2 10.1 10.7 11.0 11.8 10.1
!1.7**Out-of-pocket costs incurred(percent)
18.3 0.9 3.3 0.5 2.4 5.4 5.1 7.4 2.9 !4.5**
Out-of-pocket costs $0.45 $0.04 $0.11 $0.01 $0.08 $0.15 $0.14 $0.19 $0.09!$0.10
Sample size (number) 178 198 196 191 168 171 1,102 585 537 1,102
Weighted estimates for States were obtained with SUDAAN software. Group estimates give equal weight to each State in the group. Sample size varies across measures due to itemnon-response. Sample sizes shown is the maximum for measures included in the table. Item non-response is below 2 percent for all measures.
Significant differences in means and proportions between State groups are noted by * (0.05 level), ** (0.01 level).
Out-of-pocket expenses are for one-way travel.
Connecticut, Oklahoma, and Texas had the most restrictive policies regarding use of competitive pricing at vendor application.
Source: Survey of WIC Participants.
70
practices reduced participant access. Thus, this cross-State comparison provides no evidence thatState use of competitive pricing policies at application reduced participant access to WIC vendors.
Interstate variations in road networks, public transportation, and food store location decisions couldobscure the possible effects of restrictive vendor authorization practices on participant access.Lacking site-level data on these factors, the study used several proxy measures in a multivariateanalysis to determine whether cost-containment practices in Connecticut, Oklahoma, and Texas mayhave affected access. These measures were population density (persons per square mile), the ratio ofpopulation to stores, the percentage of the population living below the Federal poverty guidelines, andthe percentage of the population participating in WIC.4 After controlling for these factors, residencein a State with restrictive practices either had no correlation with the WIC access measure (for out-of-pocket expenses) or a negative and significant correlation (for travel distance and time). Again, theevidence indicates that restrictive vendor authorization practices in these three States did not reduceWIC participants’ access to vendors.
A second and better approach for controlling for State-by-State variations in factors affecting accessis to examine the extra distance, time, and travel costs that WIC participants spent going to theirusual WIC stores, compared to the distance, time, and out-of-pocket expenses incurred going to theirregular food stores. This approach is better because, by using access to regular food stores as a base,it controls for State variation in non-WIC factors affecting access, like transportation system. Table5-2 shows that in three of the six States (California, Connecticut, and Ohio), the average distance toWIC stores was less than the average distance to the respondent’s regular food store, whereas theopposite was true in Oklahoma. Extra distance was virtually zero in North Carolina and Texas. Asimilar pattern holds for travel time. Finally, except for California, differences in out-of-pocketexpenses for trips to WIC and regular stores were small: less than or equal to $0.05 per one-way trip.In California, average trip costs to WIC stores were $0.18 less than average costs to regular stores.
If States’ vendor restrictions decreased WIC participants’ access to WIC stores, one would expect tosee significantly larger extra travel distances, times, and out-of-pocket expenses in table 5-2 for therestrictive States. The absence of significant findings means there is no evidence that State vendorrestrictions affected participant access to WIC-authorized vendors in these States. A similar lack ofsignificant differences was seen when access was examined separately for urban, suburban, and ruralareas.5
4 All model variables were measured at the county level.
5 The sampling scheme for the Survey of WIC Participants used three strata: urban (central city portion of “metropol-itan” counties, as defined by the Office of Management and Budget), suburban (noncentral city portion of metropolitancounties), and rural (nonmetropolitan counties).
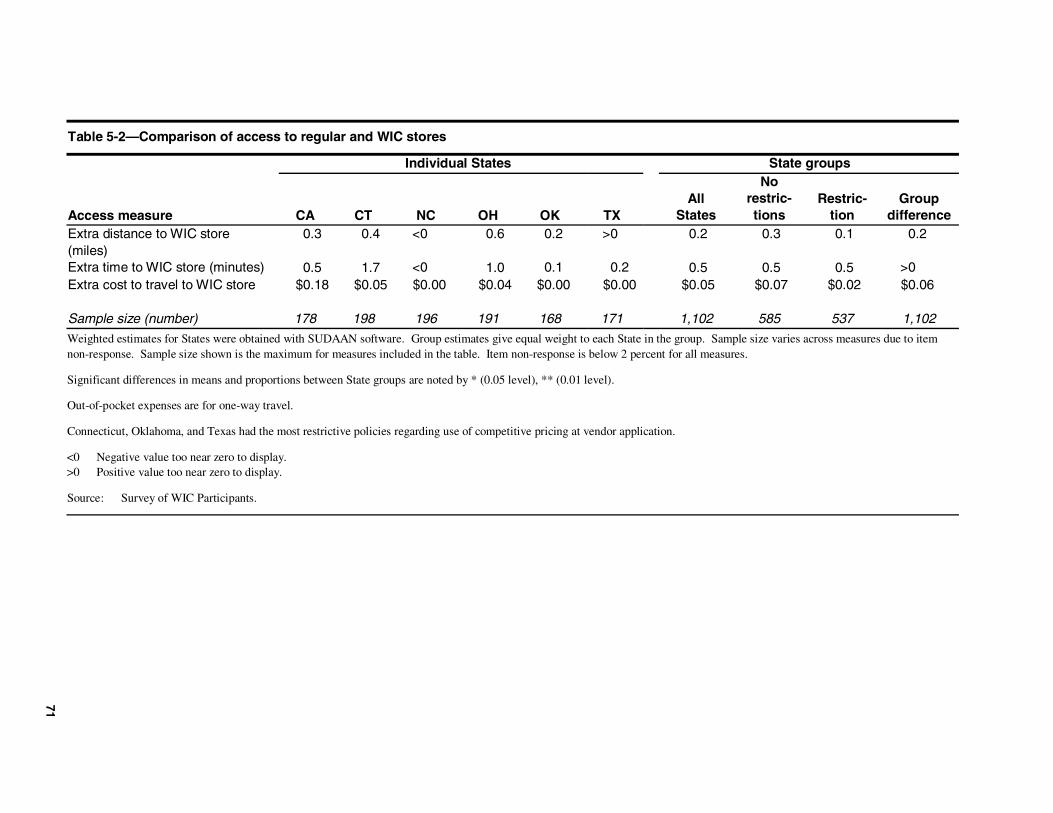
71
Table 5-2—Comparison of access to regular and WIC stores
Individual States State groups
Access measure CA CT NC OH OK TXAll
States
Norestric-tions
Restric-tion
Groupdifference
Extra distance to WIC store(miles)
!0.3 !0.4 <0 !0.6 0.2 >0 !0.2 !0.3 !0.1 0.2
Extra time to WIC store (minutes)!0.5 !1.7 <0
!1.0 0.1 0.2!0.5 !0.5 !0.5 >0
Extra cost to travel to WIC store !$0.18 !$0.05 $0.00 !$0.04 $0.00 $0.00 !$0.05 !$0.07 !$0.02 $0.06
Sample size (number) 178 198 196 191 168 171 1,102 585 537 1,102
Weighted estimates for States were obtained with SUDAAN software. Group estimates give equal weight to each State in the group. Sample size varies across measures due to itemnon-response. Sample size shown is the maximum for measures included in the table. Item non-response is below 2 percent for all measures.
Significant differences in means and proportions between State groups are noted by * (0.05 level), ** (0.01 level).
Out-of-pocket expenses are for one-way travel.
Connecticut, Oklahoma, and Texas had the most restrictive policies regarding use of competitive pricing at vendor application.
<0 Negative value too near zero to display.>0 Positive value too near zero to display.
Source: Survey of WIC Participants.
72
The small, and often negative, measures of extra distance, time, and costs related to WIC shoppingwere largely due to most WIC participants using the same store for both their usual WIC and non-WIC shopping. Table 5-3 shows that a cross-State average of only 13.0 percent of survey respon-dents said that their usual store for WIC shopping was different than the store where they did most oftheir shopping, although the percentage nearly doubled (to 24.2 percent) in California because of therelatively large number of WIC-only food stores in that State.6 There was no significant difference inthis measure between the restrictive and nonrestrictive States. As shown in the table, WIC storeswere sometimes closer than the respondent’s regular food store, and sometimes farther away.
By itself, the fact that most WIC participants in these six States (87.0 percent) did their regular andWIC shopping at the same store is strong evidence that WIC’s competitive pricing policies did notlimit access to WIC vendors. If stores were not being authorized because of high prices, then fewerparticipants would have been doing their WIC shopping at their regular food stores. The absence ofany statistically significant differences in table 5-3 bolsters the finding of no effect.7
Availability of Prescribed Foods
If States limit the number of approved items within a given food category, there may be a greaterchance that an approved item will not be available when WIC participants shop. This can be a parti-cular hardship for participants because, when multiple food items are listed on the same WIC instru-ment, all the items must be purchased at the same time. If an approved item is not available, theparticipant must either forego buying the item with WIC benefits or postpone buying all of the itemsuntil a later trip. Chapter 8 (Food Instrument Redemption) provides a discussion of how the casestudy States aggregate multiple food items on single instruments.
Food-item restrictions can affect item availability in several ways. If States limit the brands allowed,then the possibility increases that the allowed brand(s) will not be on the shelf during the participant’sshopping trip. For instance, California, Connecticut, and Texas limit infant cereal to Gerber brandbecause they have negotiated rebates with Gerber Foods. If a participant in these States finds a storeout of Gerber cereal, her infant’s prescribed cereal is unavailable. In North Carolina and Ohio, a WICparticipant facing a similar situation could purchase Beechnut or Heinz infant cereal instead. (Partici-pants in Oklahoma can buy Heinz or Gerber cereals, but not Beechnut.) One might therefore expectinfant cereal availability to be more of a problem in the States with brand restrictions than elsewhere,even though WIC-authorized vendors are supposed to maintain ample inventories of a variety of fooditems within each food category (as discussed in more detail below).
6 Among the California survey respondents who said that they did their regular and WIC shopping at different stores,80.7 percent said they did their WIC shopping at a WIC-only store.
7 One might argue that any evidence that participants did their WIC shopping at different stores implies an extra burdenfrom additional trips. This is not necessarily the case; the survey did not ask whether any regular shopping was done atthe same store as the WIC shopping. It is quite possible that WIC shopping trips act as substitutes for regular shoppingtrips rather than as additional trips. Furthermore, even if going to a different store for WIC shopping does indicateextra burden, that burden was not more prevalent in the States with restrictions.
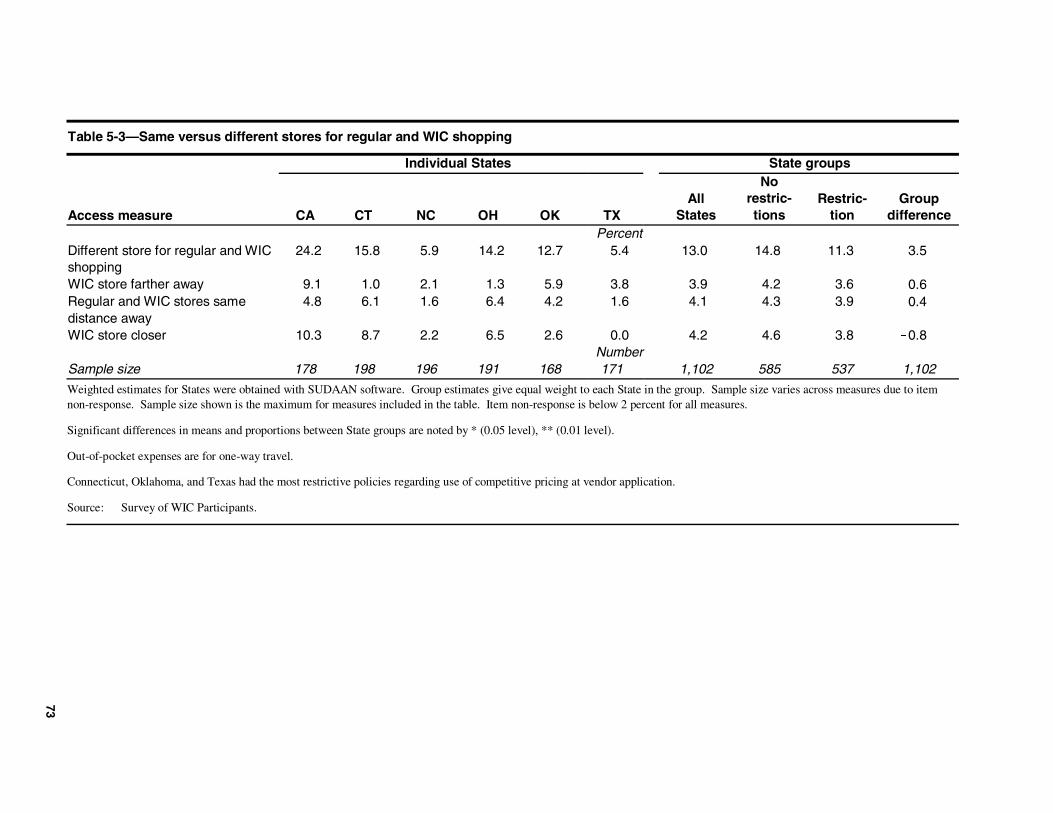
73
Table 5-3—Same versus different stores for regular and WIC shopping
Individual States State groups
Access measure CA CT NC OH OK TXAll
States
Norestric-tions
Restric-tion
Groupdifference
PercentDifferent store for regular and WICshopping
24.2 15.8 5.9 14.2 12.7 5.4 13.0 14.8 11.3 !3.5
WIC store farther away 9.1 1.0 2.1 1.3 5.9 3.8 3.9 4.2 3.6!0.6
Regular and WIC stores samedistance away
4.8 6.1 1.6 6.4 4.2 1.6 4.1 4.3 3.9!0.4
WIC store closer 10.3 8.7 2.2 6.5 2.6 0.0 4.2 4.6 3.8 !0.8Number
Sample size 178 198 196 191 168 171 1,102 585 537 1,102
Weighted estimates for States were obtained with SUDAAN software. Group estimates give equal weight to each State in the group. Sample size varies across measures due to itemnon-response. Sample size shown is the maximum for measures included in the table. Item non-response is below 2 percent for all measures.
Significant differences in means and proportions between State groups are noted by * (0.05 level), ** (0.01 level).
Out-of-pocket expenses are for one-way travel.
Connecticut, Oklahoma, and Texas had the most restrictive policies regarding use of competitive pricing at vendor application.
Source: Survey of WIC Participants.
74
Similarly, package-size restrictions can also affect the availability of prescribed foods. As anexample, Ohio required that all fluid milk be purchased in gallon containers, whereas Texas allowedpurchase of both gallon and half-gallons. Depending on stores’ ability to keep gallon containers ofmilk on the shelf, a WIC participant in Texas might have been more likely to find an allowedcontainer of milk in the store than a participant in Ohio.
Restrictions on food type may also affect the availability of prescribed foods. When fewer typeswithin a food category are allowed, opportunities for substitution when a preferred type is missing arediminished. For instance, California included only four types of cheese on its list of approved foods:American, Cheddar, Monterey jack, and mozzarella. Oklahoma allowed these four plus Colby. If aparticipant viewed Colby cheese as an acceptable substitute for Cheddar, then cheese availabilityshould have been higher in Oklahoma than California, other factors (like store-stocking policies) heldconstant.
Finally, it is possible for vendor restrictions—as well as food-item restrictions—to affect the availa-bility of prescribed foods. If higher priced stores, on average, carry more types of food and largerinventories than lower priced stores, then program restrictions on higher priced stores could increasethe possibility of not finding prescribed food items. This assumption has not been tested, and indeed,higher priced stores may have fewer food item choices than low-priced stores (for instance, high-priced corner grocery stores compared with large supermarkets). Given the earlier findings in thischapter that vendor restrictions appear to have had no impact on store accessibility, there is no expec-tation that vendor restrictions could affect food-item availability in this sample of six States.
One food-item restriction that has not been mentioned is the requirement to purchase the least expen-sive brand of a food item. In the six case study States this means that participants must purchase thelowest-cost brand available within the store. By definition, this cost-containment practice cannotlimit item availability.
In the analyses that follow, no attempt has been made to assess the availability of every single fooditem approved by the six States. Instead, individual food items approved for WIC in each State werecombined with close substitutes (also WIC approved) to form food groups. The chapter thenpresents the percentage of WIC stores in each State that had at least one item from a food groupavailable.
Three types of grouping were performed. The first was to ignore package size as long as it met Stateregulations. Thus, the study looked only at whether reduced-fat milk in an approved size was avail-able, not at whether it was available in both half-gallon and gallon containers. Second, for single-strength juices, the analysis grouped together different package forms (frozen concentrate, liquidconcentrate, refrigerated, and shelf-stable cans and bottles) within each type, as long as the differentforms were State-approved. Finally, for breakfast cereals, all State-approved cold breakfast cerealswere grouped by their predominant grain type (bran, corn, oats, rice, wheat, multi-grain), and hotcereals were treated as a separate group of breakfast cereal.
Even with this grouping, the issue of substitutions remains. If a store carries no oat-based cereals,some participants may view wheat-based cereals as an acceptable substitute, whereas others may not.The study examines the issue of personal preferences and substitutions at the end of this chapter bylooking at the extent to which respondents to the Survey of WIC Participants did not buy a prescribed
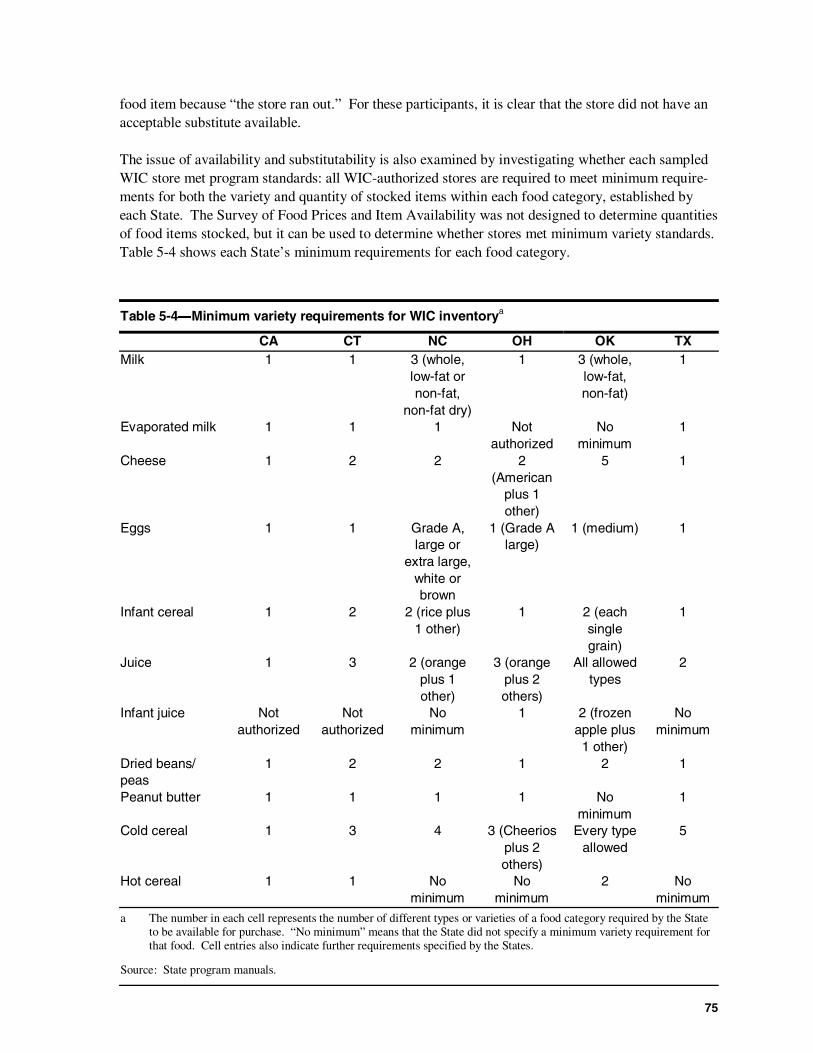
75
food item because “the store ran out.” For these participants, it is clear that the store did not have anacceptable substitute available.
The issue of availability and substitutability is also examined by investigating whether each sampledWIC store met program standards: all WIC-authorized stores are required to meet minimum require-ments for both the variety and quantity of stocked items within each food category, established byeach State. The Survey of Food Prices and Item Availability was not designed to determine quantitiesof food items stocked, but it can be used to determine whether stores met minimum variety standards.Table 5-4 shows each State’s minimum requirements for each food category.
Table 5-4―Minimum variety requirements for WIC inventorya
CA CT NC OH OK TXMilk 1 1 3 (whole,
low-fat ornon-fat,
non-fat dry)
1 3 (whole,low-fat,non-fat)
1
Evaporated milk 1 1 1 Notauthorized
Nominimum
1
Cheese 1 2 2 2(American
plus 1other)
5 1
Eggs 1 1 Grade A,large or
extra large,white orbrown
1 (Grade Alarge)
1 (medium) 1
Infant cereal 1 2 2 (rice plus1 other)
1 2 (eachsinglegrain)
1
Juice 1 3 2 (orangeplus 1other)
3 (orangeplus 2others)
All allowedtypes
2
Infant juice Notauthorized
Notauthorized
Nominimum
1 2 (frozenapple plus1 other)
Nominimum
Dried beans/peas
1 2 2 1 2 1
Peanut butter 1 1 1 1 Nominimum
1
Cold cereal 1 3 4 3 (Cheeriosplus 2others)
Every typeallowed
5
Hot cereal 1 1 Nominimum
Nominimum
2 Nominimum
a The number in each cell represents the number of different types or varieties of a food category required by the Stateto be available for purchase. “No minimum” means that the State did not specify a minimum variety requirement forthat food. Cell entries also indicate further requirements specified by the States.
Source: State program manuals.
76
Availability of Different Types or Varieties of WIC Foods
The availability of approved WIC foods is shown in tables 5-5 through 5-11, with each table repre-senting a different WIC food category. The respective tables are for milk, cheese, eggs, infant cereal,single-strength juices, dried beans or peas, and breakfast cereals. In each table, a blank cell indicatesthat the food item was not approved in that State. For each food category except dried beans/peas, theStates have been classified as restrictive or not, based on food-item restrictions that could potentiallyaffect availability. None of the six States imposed restrictions for dried beans or peas that couldaffect availability.
Availability is defined as an item normally being carried by the store. In many instances, data collec-tors checked store shelves to see if an item was present. When stores used scanning systems at thecheckout, however, store managers or cashiers scanned a set of over 200 Universal Product Codes(UPCs) for Federally approved WIC foods, and data collectors used the resulting printed receipts toascertain item availability and price.8 For items that generally do not have UPCs, like milk, eggs, anddeli cheese, store shelves were always checked for item availability.
One of the 18 WIC stores sampled in Connecticut was found to carry a very low inventory of WICitems. This was a small store, so its chance of being sampled was small. Accordingly, its samplingweight was large, and this single store skewed the food availability results for Connecticut dramati-cally. For this reason, the store was dropped from the analysis sample.9
MilkTable 5-5 shows the percentage of WIC stores in each State in which different types of milk wereavailable. Many types of milk were carried by nearly all of the WIC stores, with low-fat and non-fatfluid cow’s milk being somewhat less available, on average, than whole or reduced-fat milk. Evap-orated milk was carried by all sampled WIC stores in the five States that allowed this item. A cross-State average of 80.3 percent of stores carried lactose-reduced milk.
California, Ohio, and Oklahoma generally limited purchases of cow’s milk to gallon containers, soone might expect approved containers of milk to have been less available in these three States than inConnecticut, North Carolina, or Texas. The group difference column in table 5-5 shows no signifi-cant differences in the availability of milk in the States with and without restrictions, so the hypo-thesis that food-item restrictions might affect item availability is not supported for milk in this sampleof States.
In all States but North Carolina, all sampled stores met the State’s minimum variety requirements foravailability of milk. In North Carolina, 90.2 percent of the stores met the minimum requirements. Aswas shown in table 5-4, North Carolina and Oklahoma both required approved stores to carry at leastthree varieties of cow’s milk, whereas the other States required only one variety. When States withand without restrictions on milk are compared, however, the 3.3 percentage point difference in storescarrying minimum requirements is not statistically significant.
8 If the store did not stock an item, the printed receipt would not show a line for the item.
9 In July 2001, shortly after the end of the study’s data collection period, this store lost program authorization when storeownership changed.
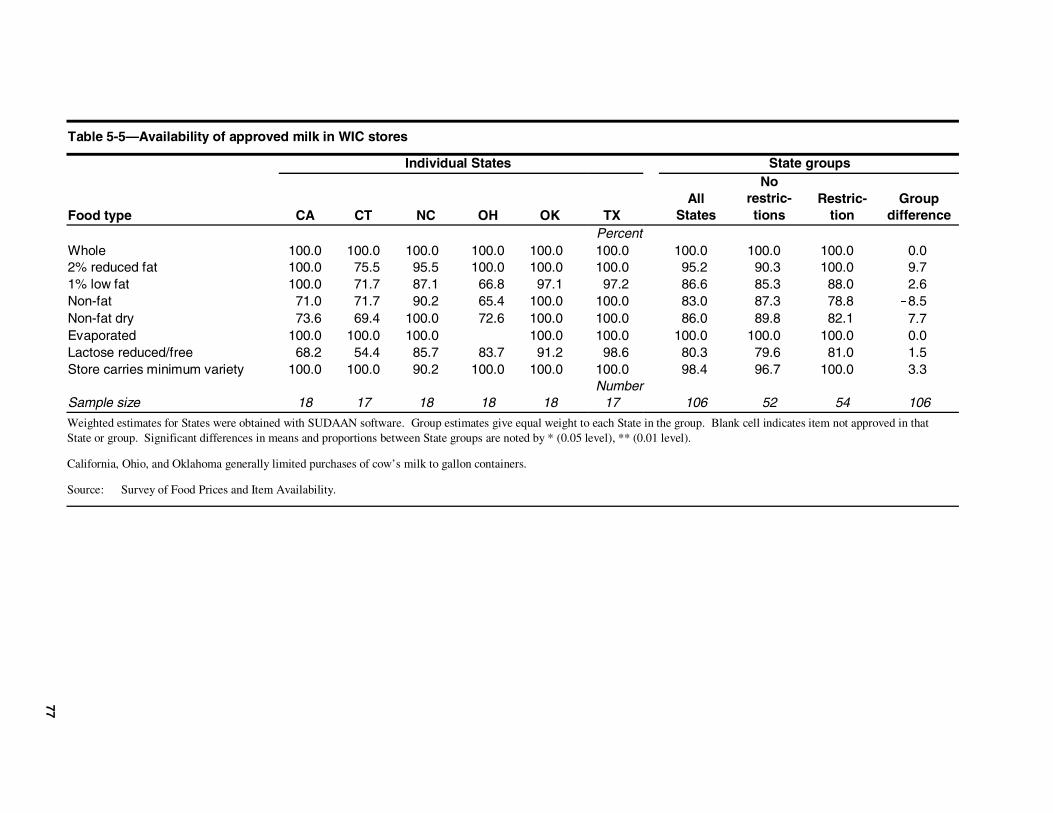
77
Table 5-5—Availability of approved milk in WIC stores
Individual States State groups
Food type CA CT NC OH OK TXAll
States
Norestric-tions
Restric-tion
Groupdifference
PercentWhole 100.0 100.0 100.0 100.0 100.0 100.0 100.0 100.0 100.0 0.02% reduced fat 100.0 75.5 95.5 100.0 100.0 100.0 95.2 90.3 100.0 9.71% low fat 100.0 71.7 87.1 66.8 97.1 97.2 86.6 85.3 88.0 2.6Non-fat 71.0 71.7 90.2 65.4 100.0 100.0 83.0 87.3 78.8 !8.5Non-fat dry 73.6 69.4 100.0 72.6 100.0 100.0 86.0 89.8 82.1
!7.7Evaporated 100.0 100.0 100.0 100.0 100.0 100.0 100.0 100.0 0.0Lactose reduced/free 68.2 54.4 85.7 83.7 91.2 98.6 80.3 79.6 81.0 1.5Store carries minimum variety 100.0 100.0 90.2 100.0 100.0 100.0 98.4 96.7 100.0 3.3
NumberSample size 18 17 18 18 18 17 106 52 54 106
Weighted estimates for States were obtained with SUDAAN software. Group estimates give equal weight to each State in the group. Blank cell indicates item not approved in thatState or group. Significant differences in means and proportions between State groups are noted by * (0.05 level), ** (0.01 level).
California, Ohio, and Oklahoma generally limited purchases of cow’s milk to gallon containers.
Source: Survey of Food Prices and Item Availability.
78
CheeseThe availability of different types of State-approved cheese is presented in table 5-6. California andOklahoma were the most restrictive States with respect to approved types and packaging of cheese.California allowed purchase of only four types (American, cheddar, Monterey jack, and mozzarella),and Oklahoma allowed only five (the previous four plus Colby). Furthermore, Oklahoma prohibitedpurchase of most sliced cheese. Where significant group differences exist in the table, however, theStates with restrictions were more, rather than less, likely to carry approved cheeses than were storesin the States with fewer restrictions. Thus, the hypothesis that food-item restrictions for cheese mightreduce the availability of approved cheese items in stores is not supported.
All stores in the two States with restrictions met minimum variety requirements for cheese, comparedwith a cross-State average of 96.2 percent of stores in the other four States. The 3.8 percentage pointdifference is not statistically significant.
EggsConnecticut had the most restrictive policy for eggs in the six case study States—only large whiteeggs could be purchased with the WIC food instrument. As shown in table 5-7, all stores in Connec-ticut had large white eggs in stock. All the sampled stores in the other States also meet minimumvariety requirements. No relationship exists between the presence of food-item restrictions on eggsand the availability of eggs in the sampled stores.
Infant CerealCalifornia, Connecticut, and Texas limited approved infant cereals to Gerber brand. All four types ofinfant cereal (barley, oatmeal, rice, and mixed) were approved for purchase in each State, but only theavailability of barley cereal differed between States with and without restrictions (table 5-8). Only4.4 percent of sampled stores in North Carolina carried barley infant cereal, and this low availabilitycreated a large (44.7 percentage points) and statistically significant difference in availability betweenthe States with and without restrictions.10 North Carolina did not restrict approved infant cereals tojust one brand, however, so the evidence does not support a hypothesis that food-item restrictionscreated problems with availability. All the sampled stores in each State met the minimum varietyrequirements for infant cereal.
JuicesFor single-strength juices, California imposed the greatest restrictions of the six States on typesallowed, with only apple, grape, orange, pineapple, and tomato being approved for WIC purchase.California also limited allowed brands and packaging for juices. Oklahoma also limited allowedbrands, and Texas required purchase of least expensive brands. These three States form the group ofrestricted States in table 5-9.
Orange juice was the most available juice in the six States, with a cross-State average of 99.4 percentof WIC-authorized stores carrying at least one of the allowed brands/types/package forms of theproduct. Allowed versions of apple, grape, grapefruit, and pineapple juice were also carried by over90 percent of stores. In the two States that allowed tomato juice, an average of 74.1 percent of storesstocked an allowed version. A cross-State average of 64.7 percent of stores stocked vegetable juice in
10 The tables in chapter 3 show that none of the North Carolina respondents to the Survey of WIC Participants said theypurchased barley, and the scanner data from North Carolina show only 0.2 percent of infant cereal purchases were forbarley. The demand in North Carolina for barley cereal appears to be quite low.
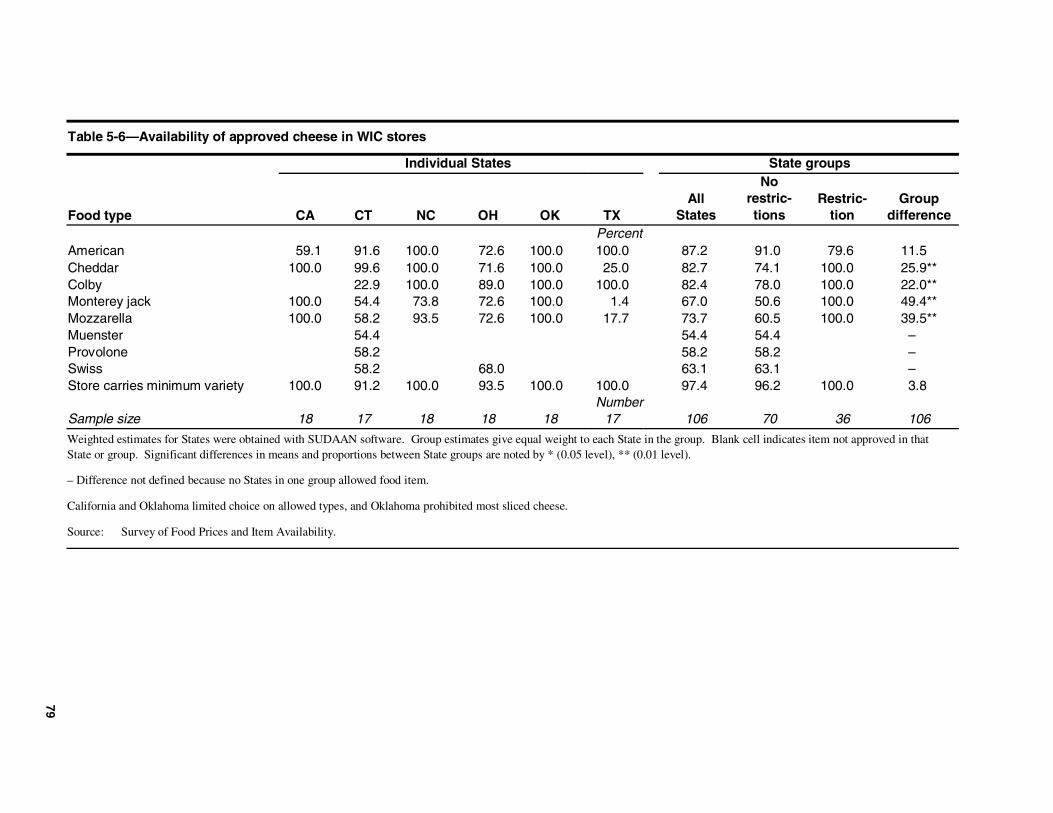
79
Table 5-6—Availability of approved cheese in WIC stores
Individual States State groups
Food type CA CT NC OH OK TXAll
States
Norestric-tions
Restric-tion
Groupdifference
PercentAmerican 59.1 91.6 100.0 72.6 100.0 100.0 87.2 91.0 79.6 !11.5Cheddar 100.0 99.6 100.0 71.6 100.0 25.0 82.7 74.1 100.0 25.9**Colby 22.9 100.0 89.0 100.0 100.0 82.4 78.0 100.0 22.0**Monterey jack 100.0 54.4 73.8 72.6 100.0 1.4 67.0 50.6 100.0 49.4**Mozzarella 100.0 58.2 93.5 72.6 100.0 17.7 73.7 60.5 100.0 39.5**Muenster 54.4 54.4 54.4 –Provolone 58.2 58.2 58.2 –Swiss 58.2 68.0 63.1 63.1 –Store carries minimum variety 100.0 91.2 100.0 93.5 100.0 100.0 97.4 96.2 100.0 3.8
NumberSample size 18 17 18 18 18 17 106 70 36 106
Weighted estimates for States were obtained with SUDAAN software. Group estimates give equal weight to each State in the group. Blank cell indicates item not approved in thatState or group. Significant differences in means and proportions between State groups are noted by * (0.05 level), ** (0.01 level).
– Difference not defined because no States in one group allowed food item.
California and Oklahoma limited choice on allowed types, and Oklahoma prohibited most sliced cheese.
Source: Survey of Food Prices and Item Availability.
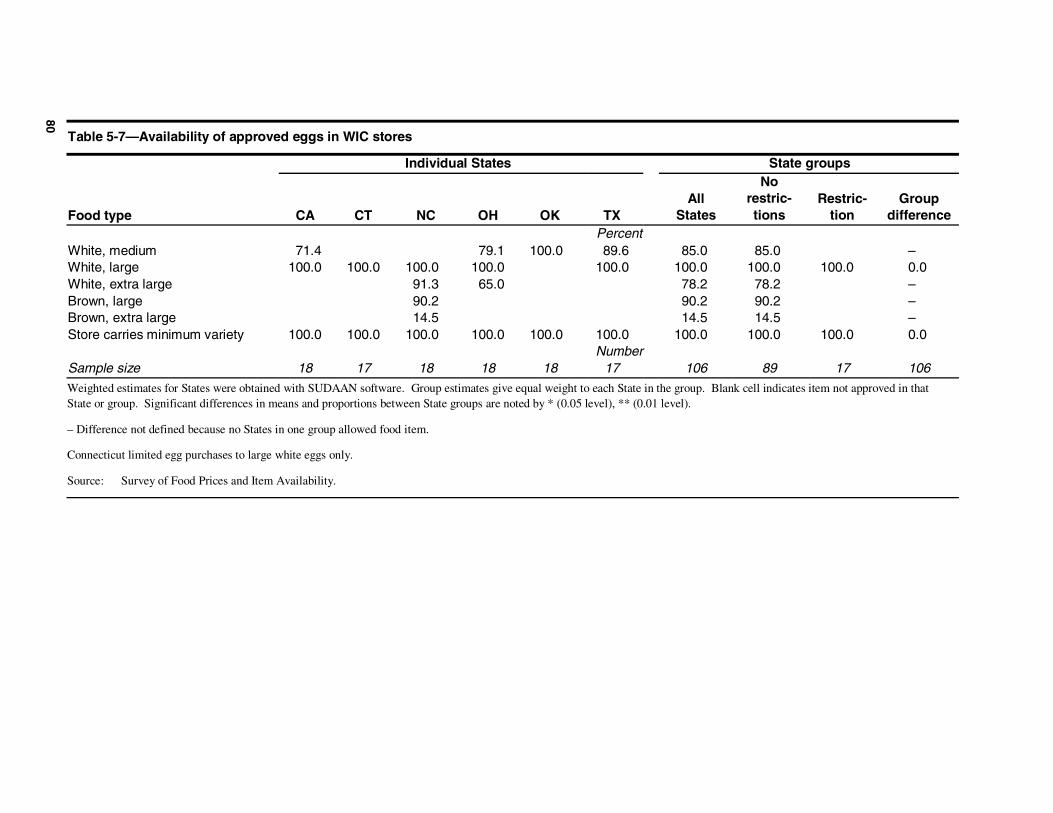
80.80
Table 5-7—Availability of approved eggs in WIC stores
Individual States State groups
Food type CA CT NC OH OK TXAll
States
Norestric-tions
Restric-tion
Groupdifference
PercentWhite, medium 71.4 79.1 100.0 89.6 85.0 85.0 –White, large 100.0 100.0 100.0 100.0 100.0 100.0 100.0 100.0 0.0White, extra large 91.3 65.0 78.2 78.2 –Brown, large 90.2 90.2 90.2 –Brown, extra large 14.5 14.5 14.5 –Store carries minimum variety 100.0 100.0 100.0 100.0 100.0 100.0 100.0 100.0 100.0 0.0
NumberSample size 18 17 18 18 18 17 106 89 17 106
Weighted estimates for States were obtained with SUDAAN software. Group estimates give equal weight to each State in the group. Blank cell indicates item not approved in thatState or group. Significant differences in means and proportions between State groups are noted by * (0.05 level), ** (0.01 level).
– Difference not defined because no States in one group allowed food item.
Connecticut limited egg purchases to large white eggs only.
Source: Survey of Food Prices and Item Availability.

81
Table 5-8—Availability of approved infant cereals in WIC stores
Individual States State groups
Food type CA CT NC OH OK TXAll
States
Norestric-tions
Restric-tion
Groupdifference
PercentBarley 100.0 100.0 4.4 67.3 94.4 100.0 77.7 55.3 100.0 44.7**Oatmeal 90.7 68.9 100.0 97.3 100.0 100.0 92.8 99.1 86.5
!12.6Rice 96.6 100.0 100.0 100.0 100.0 100.0 99.4 100.0 98.8 !1.2Mixed 100.0 100.0 93.5 100.0 100.0 100.0 98.9 97.8 100.0 2.2Store carries minimum variety 100.0 100.0 100.0 100.0 100.0 100.0 100.0 100.0 100.0 0.0
NumberSample size 18 17 18 18 18 17 106 54 52 106
Weighted estimates for States were obtained with SUDAAN software. Group estimates give equal weight to each State in the group. Blank cell indicates item not approved in thatState or group. Significant differences in means and proportions between State groups are noted by * (0.05 level), ** (0.01 level).
California, Connecticut, and Texas required purchase of Gerber brand of infant cereal.
Source: Survey of Food Prices and Item Availability.
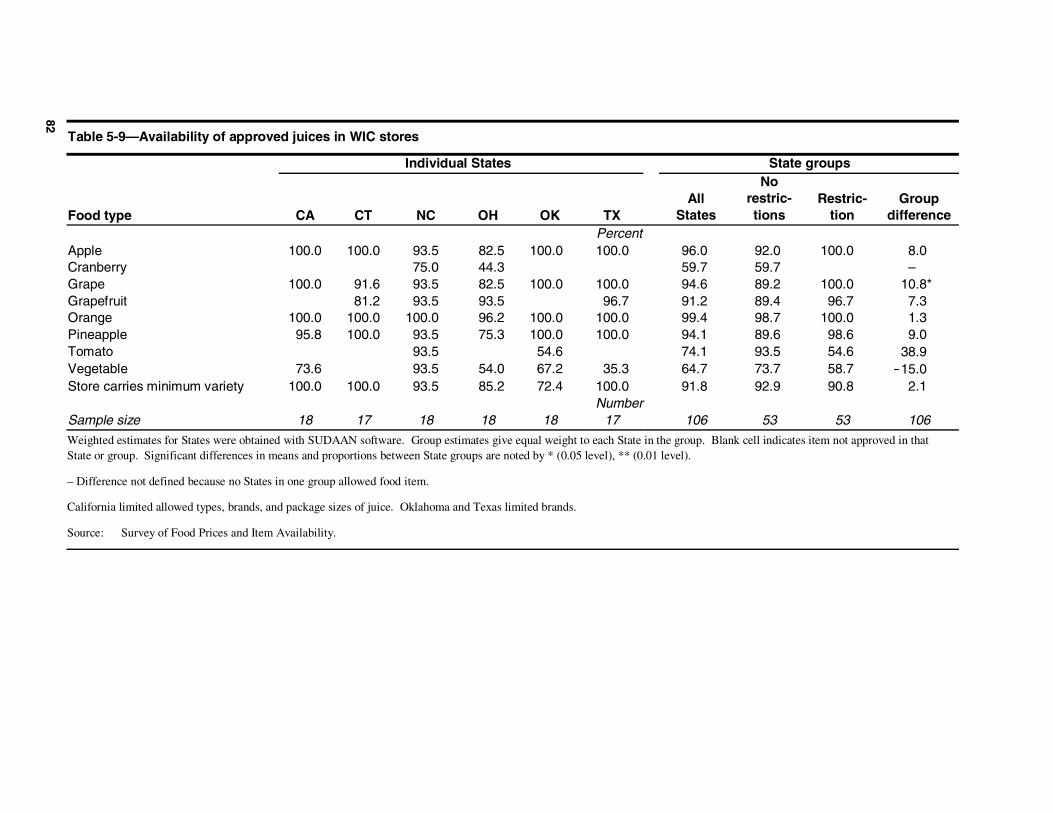
82.82
Table 5-9—Availability of approved juices in WIC stores
Individual States State groups
Food type CA CT NC OH OK TXAll
States
Norestric-tions
Restric-tion
Groupdifference
PercentApple 100.0 100.0 93.5 82.5 100.0 100.0 96.0 92.0 100.0 8.0Cranberry 75.0 44.3 59.7 59.7 –Grape 100.0 91.6 93.5 82.5 100.0 100.0 94.6 89.2 100.0 10.8*Grapefruit 81.2 93.5 93.5 96.7 91.2 89.4 96.7 7.3Orange 100.0 100.0 100.0 96.2 100.0 100.0 99.4 98.7 100.0 1.3Pineapple 95.8 100.0 93.5 75.3 100.0 100.0 94.1 89.6 98.6 9.0Tomato 93.5 54.6 74.1 93.5 54.6
!38.9Vegetable 73.6 93.5 54.0 67.2 35.3 64.7 73.7 58.7
!15.0Store carries minimum variety 100.0 100.0 93.5 85.2 72.4 100.0 91.8 92.9 90.8 !2.1
NumberSample size 18 17 18 18 18 17 106 53 53 106
Weighted estimates for States were obtained with SUDAAN software. Group estimates give equal weight to each State in the group. Blank cell indicates item not approved in thatState or group. Significant differences in means and proportions between State groups are noted by * (0.05 level), ** (0.01 level).
– Difference not defined because no States in one group allowed food item.
California limited allowed types, brands, and package sizes of juice. Oklahoma and Texas limited brands.
Source: Survey of Food Prices and Item Availability.
83
the five States (all but Connecticut) where it was allowed for WIC purchase, and an average of 59.7percent of stores carried cranberry juice in the two States (North Carolina and Ohio) where it wasWIC approved.
Stores in States with juice restrictions were less likely to carry tomato and vegetable juice than werestores in the other States, and the differences were large: 38.9 percentage points for tomato and 15.0percentage points for vegetable juice. The large differences are not statistically significant, however,because the sample sizes for these juices were smaller than indicated in the table (not all Statesallowed these juices). For all other juices, vendors in the restrictive States were more, not less, likelyto stock the individual juices, so there is no consistent evidence that the restrictions on juice types,brands, and package forms were associated with availability problems.
As shown in table 5-9, most stores met State minimum variety requirements for approved juices. Thestringent requirement in Oklahoma that vendors carry all allowed types, however, resulted in only72.4 percent of sampled vendors in that State meeting the minimum requirement.
Peanut ButterConnecticut limited WIC purchases of peanut butter to the least expensive brand available—arestriction that cannot affect availability. All sampled stores in each State carried peanut butter, andthey all met minimum variety requirements. Given the uniformity of the findings, no table of resultsis presented for peanut butter.
Dried Beans or PeasThere were no restrictions among the six States in the brands or types of Federally approved driedbeans or peas that could be purchased with WIC food instruments, so table 5-10 does not computegroup differences for the availability of different types of dried beans/peas. With the exception ofmayacoba beans, most stores in each State carried most of the types shown in the table.
Breakfast CerealsTable 5-11 divides breakfast cereals into types based on predominant grain, with a separate categoryfor hot cereals. California and Oklahoma form the group of States with restrictions; both Statesapproved a relatively narrow choice of breakfast cereals, and Oklahoma allowed purchase only ofstore or private-label brands of cereal.11
With the two exceptions of oat- and wheat-based cereals, WIC stores in California and Oklahomawere equally or more likely to carry approved cereals than were stores in the other four States. Evenfor the two exceptions, the differences in availability, 8.4 and 16.0 percent respectively, were notstatistically different from zero. For hot cereals, the California and Oklahoma stores were signifi-cantly more likely, at the 0.05 level, to carry approved brands, by a margin of 12.2 percentage points.Thus, restrictions on allowed types and brands of cereal did not reduce the availability of alloweditems.
11 In early 2001, when these data were collected, the only national brands allowed in Oklahoma were hot Quaker andNabisco cereals. In July 2001, Oklahoma added four national-brand cold cereals to its list of approved foods.
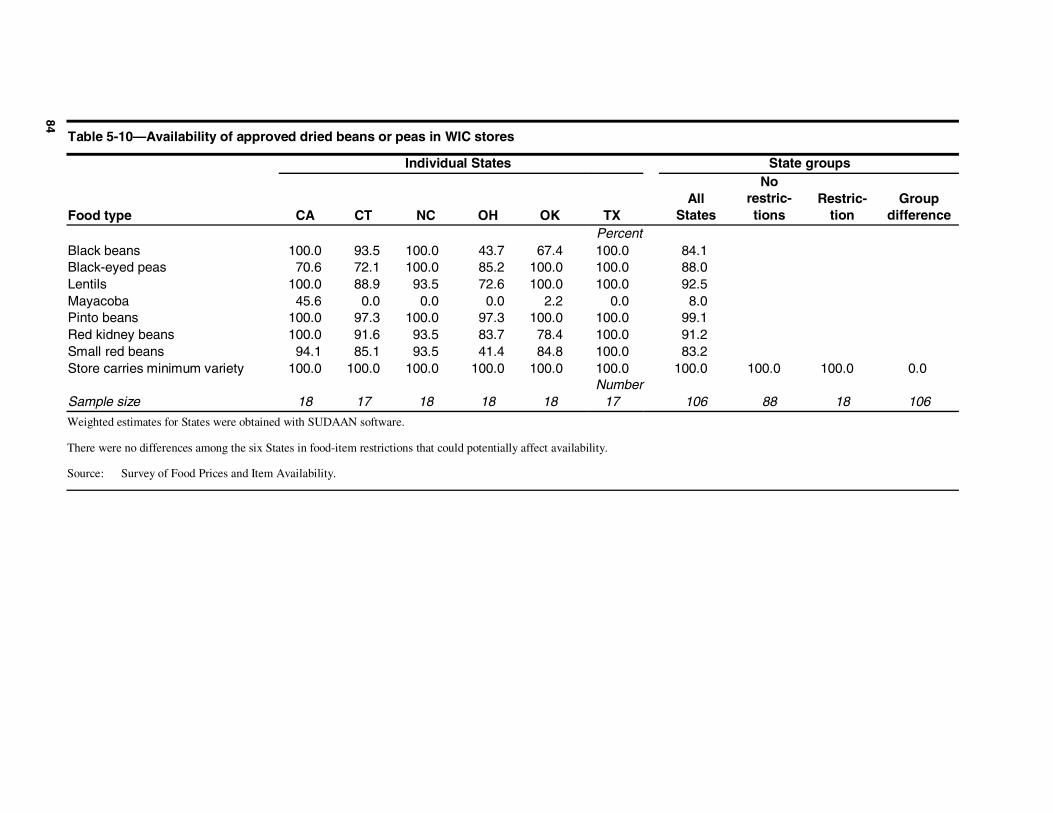
84
Table 5-10—Availability of approved dried beans or peas in WIC stores
Individual States State groups
Food type CA CT NC OH OK TXAll
States
Norestric-tions
Restric-tion
Groupdifference
PercentBlack beans 100.0 93.5 100.0 43.7 67.4 100.0 84.1Black-eyed peas 70.6 72.1 100.0 85.2 100.0 100.0 88.0Lentils 100.0 88.9 93.5 72.6 100.0 100.0 92.5Mayacoba 45.6 0.0 0.0 0.0 2.2 0.0 8.0Pinto beans 100.0 97.3 100.0 97.3 100.0 100.0 99.1Red kidney beans 100.0 91.6 93.5 83.7 78.4 100.0 91.2Small red beans 94.1 85.1 93.5 41.4 84.8 100.0 83.2Store carries minimum variety 100.0 100.0 100.0 100.0 100.0 100.0 100.0 100.0 100.0 0.0
NumberSample size 18 17 18 18 18 17 106 88 18 106
Weighted estimates for States were obtained with SUDAAN software.
There were no differences among the six States in food-item restrictions that could potentially affect availability.
Source: Survey of Food Prices and Item Availability.
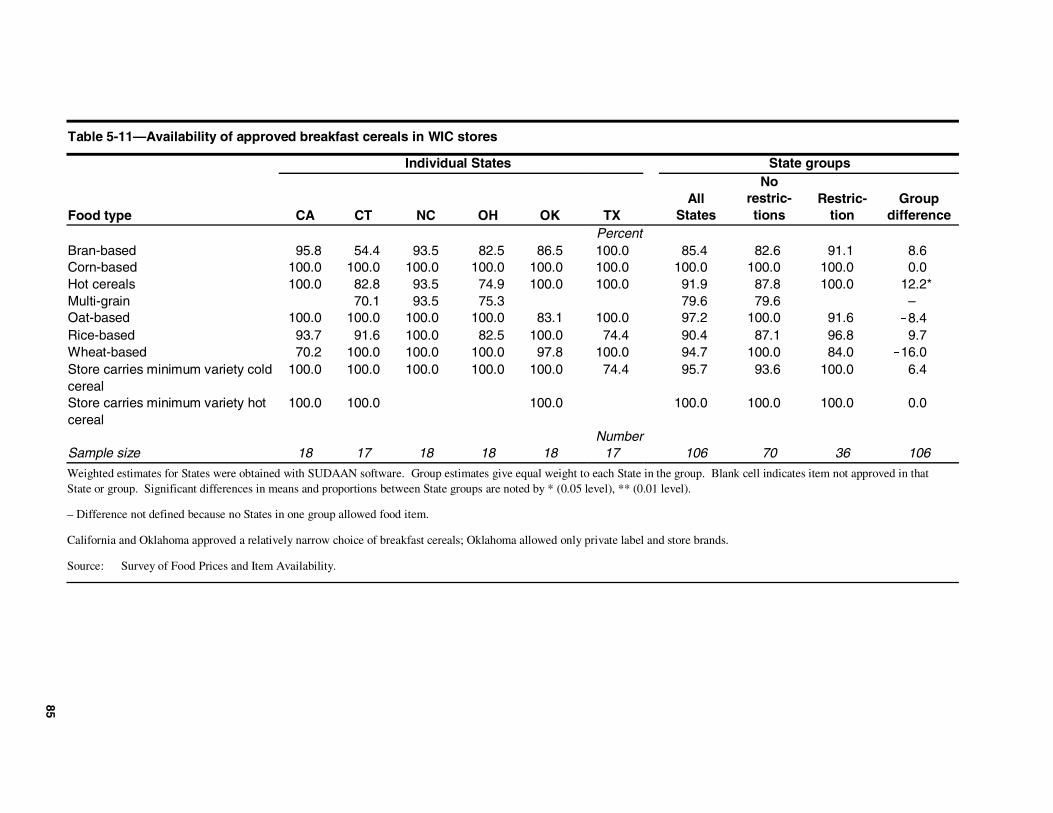
85
Table 5-11—Availability of approved breakfast cereals in WIC stores
Individual States State groups
Food type CA CT NC OH OK TXAll
States
Norestric-tions
Restric-tion
Groupdifference
PercentBran-based 95.8 54.4 93.5 82.5 86.5 100.0 85.4 82.6 91.1 8.6Corn-based 100.0 100.0 100.0 100.0 100.0 100.0 100.0 100.0 100.0 0.0Hot cereals 100.0 82.8 93.5 74.9 100.0 100.0 91.9 87.8 100.0 12.2*Multi-grain 70.1 93.5 75.3 79.6 79.6 –Oat-based 100.0 100.0 100.0 100.0 83.1 100.0 97.2 100.0 91.6
!8.4Rice-based 93.7 91.6 100.0 82.5 100.0 74.4 90.4 87.1 96.8 9.7Wheat-based 70.2 100.0 100.0 100.0 97.8 100.0 94.7 100.0 84.0 !16.0Store carries minimum variety coldcereal
100.0 100.0 100.0 100.0 100.0 74.4 95.7 93.6 100.0 6.4
Store carries minimum variety hotcereal
100.0 100.0 100.0 100.0 100.0 100.0 0.0
NumberSample size 18 17 18 18 18 17 106 70 36 106
Weighted estimates for States were obtained with SUDAAN software. Group estimates give equal weight to each State in the group. Blank cell indicates item not approved in thatState or group. Significant differences in means and proportions between State groups are noted by * (0.05 level), ** (0.01 level).
– Difference not defined because no States in one group allowed food item.
California and Oklahoma approved a relatively narrow choice of breakfast cereals; Oklahoma allowed only private label and store brands.
Source: Survey of Food Prices and Item Availability.
86
In five of the six States, 100 percent of sampled stores met their State’s minimum variety require-ments for cold cereals; only 74.4 percent of stores in Texas did so because some stores did not carryany rice-based cereals. In the three States with minimum variety requirements for hot cereal, allsampled stores met the requirements.
Summary of AvailabilityBased on the six case study States, there is no evidence that the presence of food-item restrictionsadversely affected the availability of foods at WIC stores. Indeed, with most of the significantdifferences in tables 5-5 through 5-11 being positive (meaning that stores in States with food-itemrestrictions were more likely to carry the prescribed food item than stores in States without restric-tions), there is some evidence that approved items were more available at WIC-approved stores whenthe States imposed food-item restrictions. This could reflect grocers’ greater efforts or ability tomaintain inventory of WIC-approved foods when the number of approved items is reduced. It mayalso reflect greater State enforcement of minimum inventory requirements when food-item restric-tions are in place, or simply variation among the States in enforcement that mirrors the presence offood-item restrictions. Available data are not sufficient to explain this pattern, but it is clear that thedata do not support a hypothesis that food-item restrictions decrease item availability.
Nonpurchase of WIC Items Due to Their Being Out of Stock
As mentioned earlier, for survey respondents who did not buy all of a prescribed food item within aparticular food category, the Survey of WIC Participants asked for the main reason they did not. Arelatively small number said the store had run out (of an item normally carried). Rather than comingback another time, or going to a different store to buy all the items on their WIC food instrument,these respondents decided simply to forego purchase of this WIC-prescribed food item.
Table 5-12 displays the percentage of survey respondents in each State who said they did not buy allof a purchased item because the store ran out. The survey did not ask whether the respondent meantonly her preferred item or all allowed items within the food category. Most likely, because non-selected items cannot be picked up at a later time, respondents meant that neither their preferred itemnor an acceptable (to them) alternative was available.
For most of the food items in most States, no respondents said that an out-of-stock item was the mainreason they did not buy all of their prescribed food. In only four instances did more than 1.0 percentof survey respondents indicate a problem with item availability. In descending order of magnitude:
• 4.6 percent of respondents in North Carolina said their store ran out of their choice ofinfant cereal;
• 2.5 percent of respondents in North Carolina said their store ran out of their choice ofbreakfast cereal;
• 2.0 percent of respondents in Ohio said their store ran out of their choice of dried beansor peas; and
• 1.5 percent of respondents in Oklahoma said their store ran out of their choice ofbreakfast cereal.
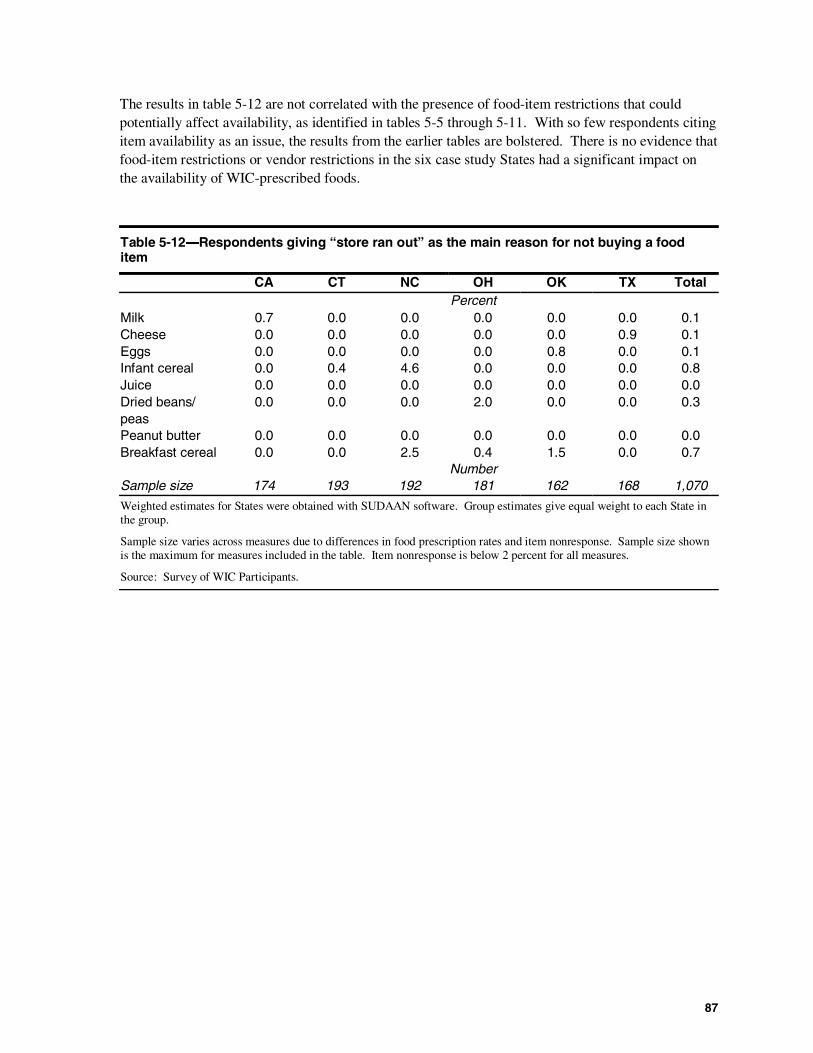
87
The results in table 5-12 are not correlated with the presence of food-item restrictions that couldpotentially affect availability, as identified in tables 5-5 through 5-11. With so few respondents citingitem availability as an issue, the results from the earlier tables are bolstered. There is no evidence thatfood-item restrictions or vendor restrictions in the six case study States had a significant impact onthe availability of WIC-prescribed foods.
Table 5-12―Respondents giving “store ran out” as the main reason for not buying a fooditem
CA CT NC OH OK TX TotalPercent
Milk 0.7 0.0 0.0 0.0 0.0 0.0 0.1Cheese 0.0 0.0 0.0 0.0 0.0 0.9 0.1Eggs 0.0 0.0 0.0 0.0 0.8 0.0 0.1Infant cereal 0.0 0.4 4.6 0.0 0.0 0.0 0.8Juice 0.0 0.0 0.0 0.0 0.0 0.0 0.0Dried beans/peas
0.0 0.0 0.0 2.0 0.0 0.0 0.3
Peanut butter 0.0 0.0 0.0 0.0 0.0 0.0 0.0Breakfast cereal 0.0 0.0 2.5 0.4 1.5 0.0 0.7
NumberSample size 174 193 192 181 162 168 1,070
Weighted estimates for States were obtained with SUDAAN software. Group estimates give equal weight to each State inthe group.
Sample size varies across measures due to differences in food prescription rates and item nonresponse. Sample size shownis the maximum for measures included in the table. Item nonresponse is below 2 percent for all measures.
Source: Survey of WIC Participants.

89
Chapter 6Participant Satisfaction With and
Use of Prescribed Foods
State practices to reduce food package costs—by restricting brands, types, or packaging of allowedfoods—limit WIC participants’ food choices. One of the concerns with food-item restrictions is thepossibility that choice limitation may reduce WIC participants’ satisfaction with the WIC foodpackage, their likelihood of purchasing WIC foods, or their likelihood of consuming all the prescribedfoods they have selected. If such adverse effects exist, then this cost-containment practice may havean undesired impact on the WIC program’s ability to improve the nutritional status of participants.
This chapter is divided into five sections. Following a discussion of research approach, the chapterpresents findings about participant food preferences and the extent to which those preferences areconstrained by State-imposed restrictions on foods, relative to foods allowed under Federal WICregulations. These constraints are examined for cheese, infant cereal, juice, and cereals. The thirdand fourth sections provide a detailed examination of rates of satisfaction with, and purchase andconsumption of, WIC-prescribed cheese and cereal, respectively; these are two food categories forwhich food-item restrictions appear to have had some effect on satisfaction or food use. The fifthsection contains a summary of the estimated effects of food-item restrictions on satisfaction with anduse of foods in all eight categories examined by this study: cheese, cereal, milk, eggs, infant cereal,single-strength adult juice, peanut butter, and dried beans or peas. Detailed findings for the latter sixfood categories are presented in appendix I.
Research Approach
WIC participants’ satisfaction with and consumption of prescribed foods is examined, using datacollected during the Survey of WIC Participants. Most of the respondents to the survey (85.8percent) were asked the following series of questions about foods provided by WIC.1 Did their WICprescription include items from a specific food category (such as milk, cheese, eggs, infant cereal)?How much of the prescribed food was bought (all, some, or none)? How much of the purchased foodwas consumed (all, some, or none)? What was the main reason for not buying or consuming theprescribed item? For each food category, the survey also asked the type and brand of foodspurchased and the types or brands respondents would have liked to buy, but could not because theywere not on the State’s list of approved WIC foods.
Every State imposes some restrictions on allowed foods, often to limit the number of allowed foods toa manageable size. Food-item restrictions designed primarily to reduce food package costs have beendescribed in previous chapters. These restrictions include requirements that participants buy the leastexpensive brand available, limits on the allowed brands or types of food within a category (includingbrands for which the State receives a manufacturer’s rebate), and limits on package size or form. Thecost-containment restrictions vary by State and food category, as shown in table 6-1.
1 The remaining respondents had experience with WIC food instruments, but they had not used them during the surveyreference month—the month prior to the interview. The survey did not ask these respondents questions about theirpurchase or consumption of WIC foods because of concerns about recall error.
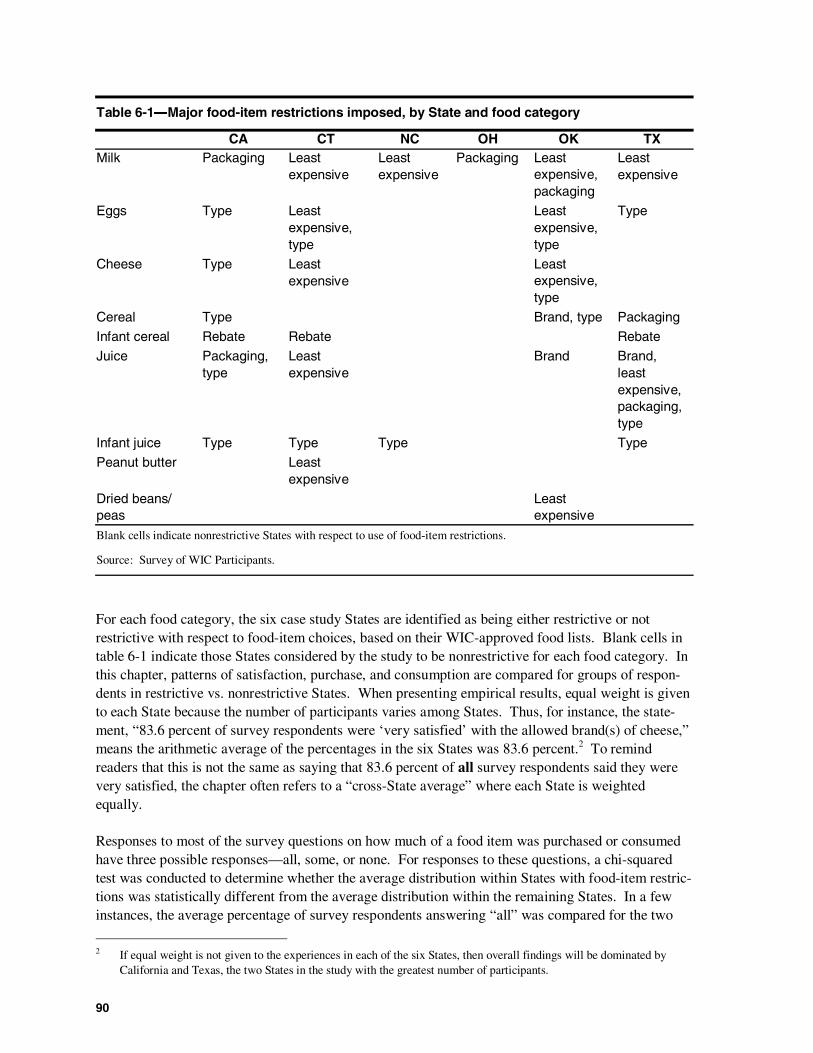
90
Table 6-1―Major food-item restrictions imposed, by State and food category
CA CT NC OH OK TXMilk Packaging Least
expensiveLeastexpensive
Packaging Leastexpensive,packaging
Leastexpensive
Eggs Type Leastexpensive,type
Leastexpensive,type
Type
Cheese Type Leastexpensive
Leastexpensive,type
Cereal Type Brand, type Packaging
Infant cereal Rebate Rebate Rebate
Juice Packaging,type
Leastexpensive
Brand Brand,leastexpensive,packaging,type
Infant juice Type Type Type Type
Peanut butter Leastexpensive
Dried beans/peas
Leastexpensive
Blank cells indicate nonrestrictive States with respect to use of food-item restrictions.
Source: Survey of WIC Participants.
For each food category, the six case study States are identified as being either restrictive or notrestrictive with respect to food-item choices, based on their WIC-approved food lists. Blank cells intable 6-1 indicate those States considered by the study to be nonrestrictive for each food category. Inthis chapter, patterns of satisfaction, purchase, and consumption are compared for groups of respon-dents in restrictive vs. nonrestrictive States. When presenting empirical results, equal weight is givento each State because the number of participants varies among States. Thus, for instance, the state-ment, “83.6 percent of survey respondents were ‘very satisfied’ with the allowed brand(s) of cheese,”means the arithmetic average of the percentages in the six States was 83.6 percent.2 To remindreaders that this is not the same as saying that 83.6 percent of all survey respondents said they werevery satisfied, the chapter often refers to a “cross-State average” where each State is weightedequally.
Responses to most of the survey questions on how much of a food item was purchased or consumedhave three possible responses—all, some, or none. For responses to these questions, a chi-squaredtest was conducted to determine whether the average distribution within States with food-item restric-tions was statistically different from the average distribution within the remaining States. In a fewinstances, the average percentage of survey respondents answering “all” was compared for the two
2 If equal weight is not given to the experiences in each of the six States, then overall findings will be dominated byCalifornia and Texas, the two States in the study with the greatest number of participants.
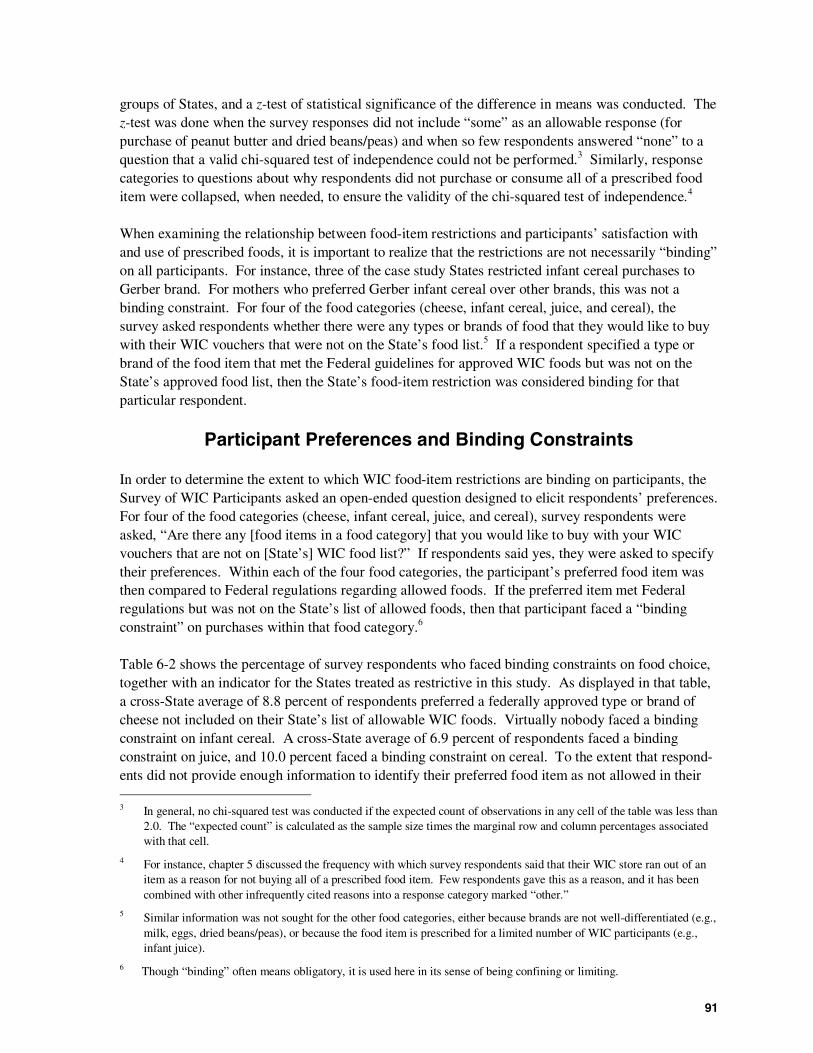
91
groups of States, and a z-test of statistical significance of the difference in means was conducted. Thez-test was done when the survey responses did not include “some” as an allowable response (forpurchase of peanut butter and dried beans/peas) and when so few respondents answered “none” to aquestion that a valid chi-squared test of independence could not be performed.3 Similarly, responsecategories to questions about why respondents did not purchase or consume all of a prescribed fooditem were collapsed, when needed, to ensure the validity of the chi-squared test of independence.4
When examining the relationship between food-item restrictions and participants’ satisfaction withand use of prescribed foods, it is important to realize that the restrictions are not necessarily “binding”on all participants. For instance, three of the case study States restricted infant cereal purchases toGerber brand. For mothers who preferred Gerber infant cereal over other brands, this was not abinding constraint. For four of the food categories (cheese, infant cereal, juice, and cereal), thesurvey asked respondents whether there were any types or brands of food that they would like to buywith their WIC vouchers that were not on the State’s food list.5 If a respondent specified a type orbrand of the food item that met the Federal guidelines for approved WIC foods but was not on theState’s approved food list, then the State’s food-item restriction was considered binding for thatparticular respondent.
Participant Preferences and Binding Constraints
In order to determine the extent to which WIC food-item restrictions are binding on participants, theSurvey of WIC Participants asked an open-ended question designed to elicit respondents’ preferences.For four of the food categories (cheese, infant cereal, juice, and cereal), survey respondents wereasked, “Are there any [food items in a food category] that you would like to buy with your WICvouchers that are not on [State’s] WIC food list?” If respondents said yes, they were asked to specifytheir preferences. Within each of the four food categories, the participant’s preferred food item wasthen compared to Federal regulations regarding allowed foods. If the preferred item met Federalregulations but was not on the State’s list of allowed foods, then that participant faced a “bindingconstraint” on purchases within that food category.6
Table 6-2 shows the percentage of survey respondents who faced binding constraints on food choice,together with an indicator for the States treated as restrictive in this study. As displayed in that table,a cross-State average of 8.8 percent of respondents preferred a federally approved type or brand ofcheese not included on their State’s list of allowable WIC foods. Virtually nobody faced a bindingconstraint on infant cereal. A cross-State average of 6.9 percent of respondents faced a bindingconstraint on juice, and 10.0 percent faced a binding constraint on cereal. To the extent that respond-ents did not provide enough information to identify their preferred food item as not allowed in their
3 In general, no chi-squared test was conducted if the expected count of observations in any cell of the table was less than2.0. The “expected count” is calculated as the sample size times the marginal row and column percentages associatedwith that cell.
4 For instance, chapter 5 discussed the frequency with which survey respondents said that their WIC store ran out of anitem as a reason for not buying all of a prescribed food item. Few respondents gave this as a reason, and it has beencombined with other infrequently cited reasons into a response category marked “other.”
5 Similar information was not sought for the other food categories, either because brands are not well-differentiated (e.g.,milk, eggs, dried beans/peas), or because the food item is prescribed for a limited number of WIC participants (e.g.,infant juice).
6 Though “binding” often means obligatory, it is used here in its sense of being confining or limiting.
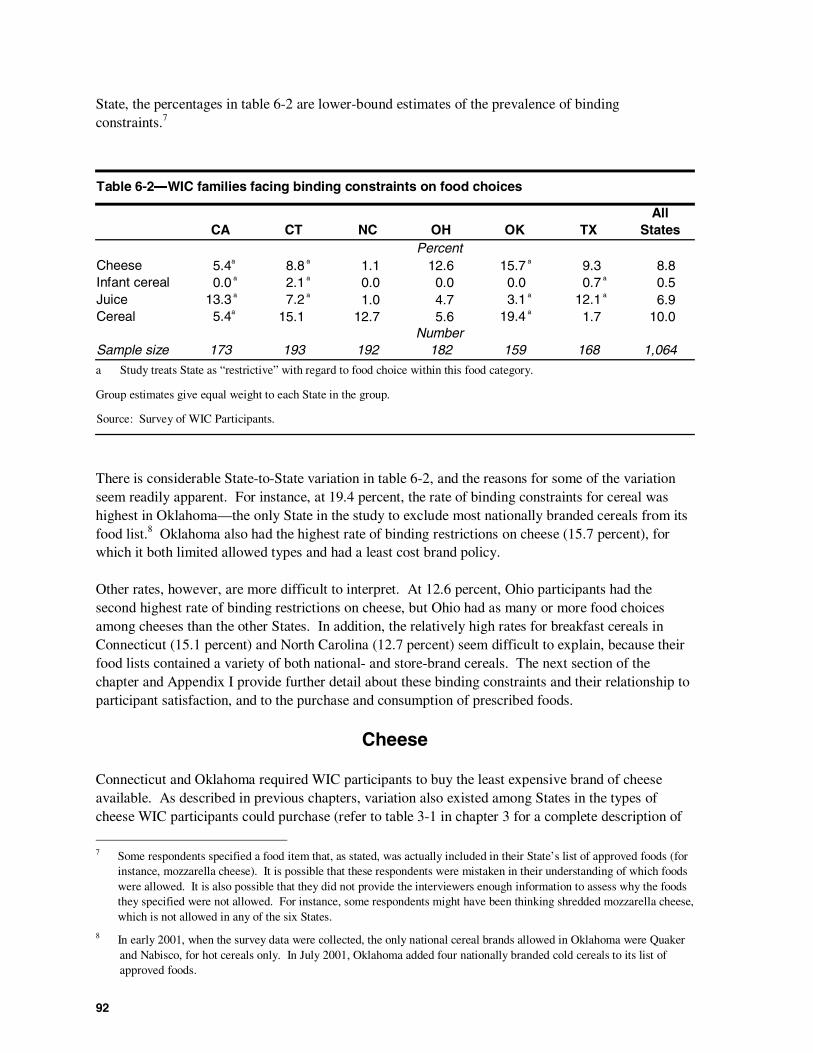
92
State, the percentages in table 6-2 are lower-bound estimates of the prevalence of bindingconstraints.7
Table 6-2―WIC families facing binding constraints on food choices
CA CT NC OH OK TXAll
StatesPercent
Cheese 5.4a 8.8 a 1.1 12.6 15.7 a 9.3 8.8Infant cereal 0.0 a 2.1 a 0.0 0.0 0.0 0.7 a 0.5Juice 13.3 a 7.2 a 1.0 4.7 3.1 a 12.1 a 6.9Cereal 5.4a 15.1 12.7 5.6 19.4 a 1.7 10.0
NumberSample size 173 193 192 182 159 168 1,064
a Study treats State as “restrictive” with regard to food choice within this food category.
Group estimates give equal weight to each State in the group.
Source: Survey of WIC Participants.
There is considerable State-to-State variation in table 6-2, and the reasons for some of the variationseem readily apparent. For instance, at 19.4 percent, the rate of binding constraints for cereal washighest in Oklahoma—the only State in the study to exclude most nationally branded cereals from itsfood list.8 Oklahoma also had the highest rate of binding restrictions on cheese (15.7 percent), forwhich it both limited allowed types and had a least cost brand policy.
Other rates, however, are more difficult to interpret. At 12.6 percent, Ohio participants had thesecond highest rate of binding restrictions on cheese, but Ohio had as many or more food choicesamong cheeses than the other States. In addition, the relatively high rates for breakfast cereals inConnecticut (15.1 percent) and North Carolina (12.7 percent) seem difficult to explain, because theirfood lists contained a variety of both national- and store-brand cereals. The next section of thechapter and Appendix I provide further detail about these binding constraints and their relationship toparticipant satisfaction, and to the purchase and consumption of prescribed foods.
Cheese
Connecticut and Oklahoma required WIC participants to buy the least expensive brand of cheeseavailable. As described in previous chapters, variation also existed among States in the types ofcheese WIC participants could purchase (refer to table 3-1 in chapter 3 for a complete description of
7 Some respondents specified a food item that, as stated, was actually included in their State’s list of approved foods (forinstance, mozzarella cheese). It is possible that these respondents were mistaken in their understanding of which foodswere allowed. It is also possible that they did not provide the interviewers enough information to assess why the foodsthey specified were not allowed. For instance, some respondents might have been thinking shredded mozzarella cheese,which is not allowed in any of the six States.
8 In early 2001, when the survey data were collected, the only national cereal brands allowed in Oklahoma were Quakerand Nabisco, for hot cereals only. In July 2001, Oklahoma added four nationally branded cold cereals to its list ofapproved foods.
93
WIC-approved cheese in each State). California allowed the fewest types (four), whereas Connec-ticut allowed the most (eight). This study treats California, Connecticut, and Oklahoma as therestrictive group of States when examining brand satisfaction, purchase, and consumption of cheese.
All survey respondents were asked whether they were satisfied with brands of food and package sizesallowed for several different food categories, including cheese. If the food item was not currently intheir food package prescription, they were asked whether they were satisfied with the item in thepast.9 The top two sections of table 6-3 present responses for satisfaction with cheese brands andpackage sizes, respectively. For the entire sample of States, a cross-State average of 83.6 percent ofsurvey respondents said they were very satisfied with allowed brands of cheese,10 and 85.2 percentsaid they were very satisfied with allowed package sizes.
The top panel of table 6-3 shows that restrictions on cheese were associated with lower brand satis-faction. When the average distribution of responses within States with restrictions is compared to theaverage distribution in States without restrictions (the “Restriction” and “No restriction” columns inthe table), a chi-squared test on the difference in distributions is statistically significant at the 0.01level; a cross-State average of 81.2 percent of respondents in California, Connecticut, and Oklahomasaid they were very satisfied with allowed brands of cheese, compared to a cross-State average of85.9 percent in States without restrictions.
No chi-squared test is performed on satisfaction with package sizes because the six States had fewdifferences in package-size restrictions on cheese.
The central panel of table 6-3 shows that cheese was prescribed for a cross-State average of 91.5percent of the sampled WIC families. The difference in average prescription rates between Stateswith and without restrictions on cheese, 1.0 percent, is not statistically significant.
All respondents with prescribed cheese were asked whether they purchased “all,” “some,” or “none”of the cheese in the month prior to the interview. As shown in the fourth, or “Amount purchased,”panel of table 6-3, a cross-State average of 95.4 percent of respondents said they purchased all of thecheese prescribed, 4.0 percent said some, and less than 1 percent said none.11 A chi-squared test onthe difference in distributions indicates no significant difference. So few participants answered“none,” however, that the distribution of responses is nearly binomial (“all” versus “some”). A signi-ficance test was therefore performed for the percentage of respondents who said they purchased allthe prescribed cheese; the difference between the two groups (1.3 percentage points) is not statisti-cally significant.12
9 If the food item had never been prescribed, a response of “not applicable” was recorded.
10 For comparison, in a nationally representative survey of people being certified for WIC, 87.5 percent of those withprior WIC experience said they were very satisfied with available brands of prescribed cheese. See Nancy Cole et al.,National Survey of WIC Participants: Final Report, Nutrition Assistance Program Report Series, Food and NutritionService, USDA, October 2001, Exhibit 3-66.
11 Nationally, 98.7 percent of WIC participants say they usually purchase all their prescribed cheese (National SurveyofWIC Participants: Final Report, Exhibit 3-69).
12 Significance tests were not conducted for differences in the average percentage of respondents saying they purchased“some” or “none” of the prescribed cheese. Because such tests would not be independent (of each other or the test on“all”), stricter conditions for evaluating statistical significance would have to be used. The report instead uses the usualcriteria for evaluating the statistical significance of differences in the “all” category. This approach is used throughoutthe rest of the chapter.
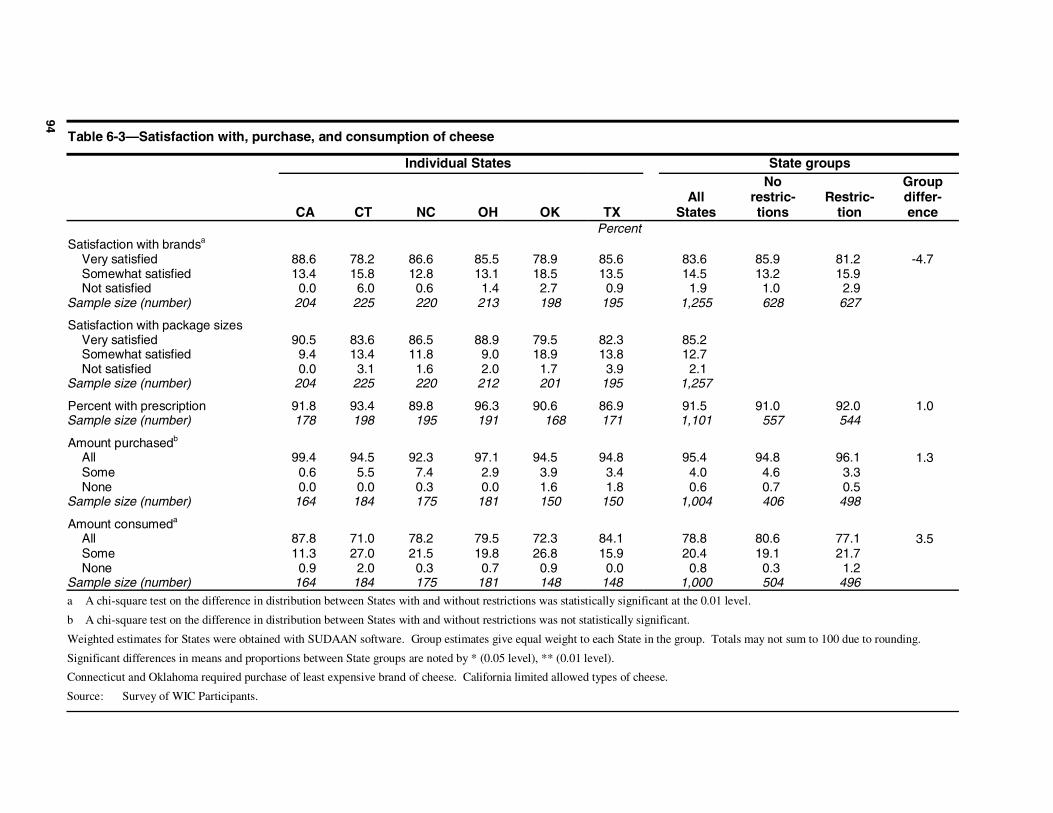
94
Table 6-3—Satisfaction with, purchase, and consumption of cheese
Individual States State groups
CA CT NC OH OK TXAll
States
Norestric-tions
Restric-tion
Groupdiffer-ence
PercentSatisfaction with brandsa
Very satisfied 88.6 78.2 86.6 85.5 78.9 85.6 83.6 85.9 81.2 -4.7Somewhat satisfied 13.4 15.8 12.8 13.1 18.5 13.5 14.5 13.2 15.9Not satisfied 0.0 6.0 0.6 1.4 2.7 0.9 1.9 1.0 2.9
Sample size (number) 204 225 220 213 198 195 1,255 628 627
Satisfaction with package sizesVery satisfied 90.5 83.6 86.5 88.9 79.5 82.3 85.2Somewhat satisfied 9.4 13.4 11.8 9.0 18.9 13.8 12.7Not satisfied 0.0 3.1 1.6 2.0 1.7 3.9 2.1
Sample size (number) 204 225 220 212 201 195 1,257
Percent with prescription 91.8 93.4 89.8 96.3 90.6 86.9 91.5 91.0 92.0 1.0Sample size (number) 178 198 195 191 168 171 1,101 557 544
Amount purchasedb
All 99.4 94.5 92.3 97.1 94.5 94.8 95.4 94.8 96.1!1.3
Some 0.6 5.5 7.4 2.9 3.9 3.4 4.0 4.6 3.3None 0.0 0.0 0.3 0.0 1.6 1.8 0.6 0.7 0.5
Sample size (number) 164 184 175 181 150 150 1,004 406 498
Amount consumeda
All 87.8 71.0 78.2 79.5 72.3 84.1 78.8 80.6 77.1!3.5
Some 11.3 27.0 21.5 19.8 26.8 15.9 20.4 19.1 21.7None 0.9 2.0 0.3 0.7 0.9 0.0 0.8 0.3 1.2
Sample size (number) 164 184 175 181 148 148 1,000 504 496a A chi-square test on the difference in distribution between States with and without restrictions was statistically significant at the 0.01 level.
b A chi-square test on the difference in distribution between States with and without restrictions was not statistically significant.
Weighted estimates for States were obtained with SUDAAN software. Group estimates give equal weight to each State in the group. Totals may not sum to 100 due to rounding.
Significant differences in means and proportions between State groups are noted by * (0.05 level), ** (0.01 level).
Connecticut and Oklahoma required purchase of least expensive brand of cheese. California limited allowed types of cheese.
Source: Survey of WIC Participants.
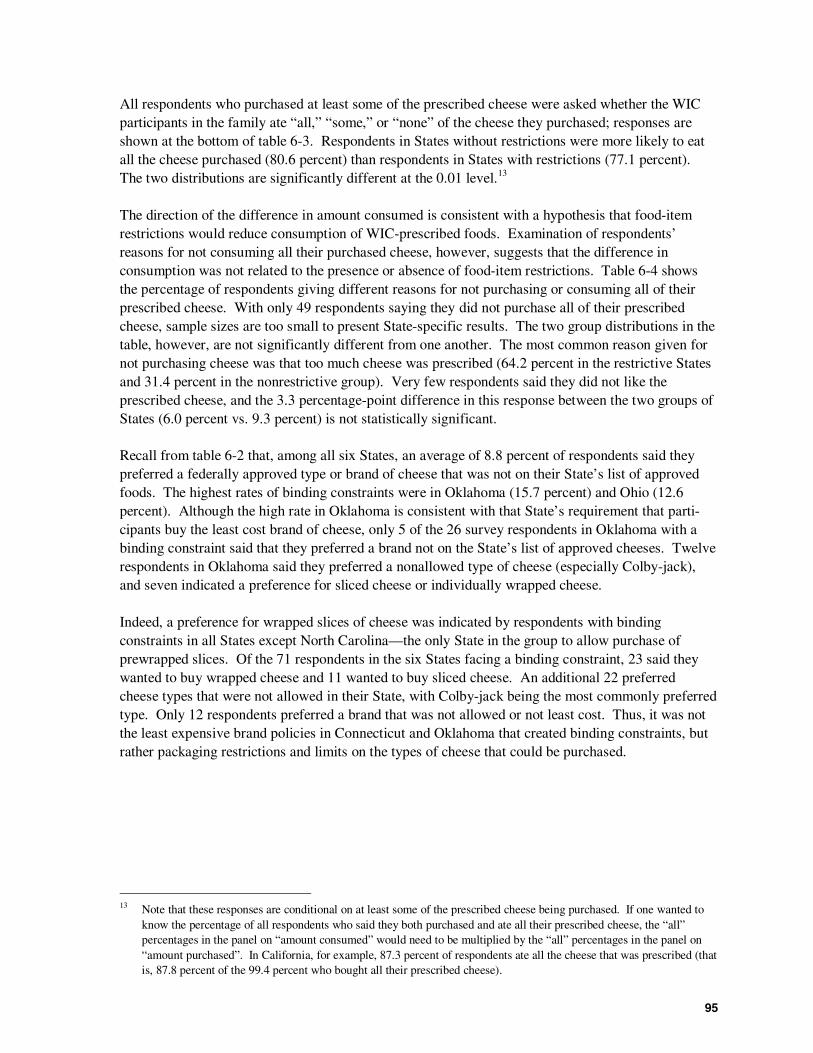
95
All respondents who purchased at least some of the prescribed cheese were asked whether the WICparticipants in the family ate “all,” “some,” or “none” of the cheese they purchased; responses areshown at the bottom of table 6-3. Respondents in States without restrictions were more likely to eatall the cheese purchased (80.6 percent) than respondents in States with restrictions (77.1 percent).The two distributions are significantly different at the 0.01 level.13
The direction of the difference in amount consumed is consistent with a hypothesis that food-itemrestrictions would reduce consumption of WIC-prescribed foods. Examination of respondents’reasons for not consuming all their purchased cheese, however, suggests that the difference inconsumption was not related to the presence or absence of food-item restrictions. Table 6-4 showsthe percentage of respondents giving different reasons for not purchasing or consuming all of theirprescribed cheese. With only 49 respondents saying they did not purchase all of their prescribedcheese, sample sizes are too small to present State-specific results. The two group distributions in thetable, however, are not significantly different from one another. The most common reason given fornot purchasing cheese was that too much cheese was prescribed (64.2 percent in the restrictive Statesand 31.4 percent in the nonrestrictive group). Very few respondents said they did not like theprescribed cheese, and the 3.3 percentage-point difference in this response between the two groups ofStates (6.0 percent vs. 9.3 percent) is not statistically significant.
Recall from table 6-2 that, among all six States, an average of 8.8 percent of respondents said theypreferred a federally approved type or brand of cheese that was not on their State’s list of approvedfoods. The highest rates of binding constraints were in Oklahoma (15.7 percent) and Ohio (12.6percent). Although the high rate in Oklahoma is consistent with that State’s requirement that parti-cipants buy the least cost brand of cheese, only 5 of the 26 survey respondents in Oklahoma with abinding constraint said that they preferred a brand not on the State’s list of approved cheeses. Twelverespondents in Oklahoma said they preferred a nonallowed type of cheese (especially Colby-jack),and seven indicated a preference for sliced cheese or individually wrapped cheese.
Indeed, a preference for wrapped slices of cheese was indicated by respondents with bindingconstraints in all States except North Carolina—the only State in the group to allow purchase ofprewrapped slices. Of the 71 respondents in the six States facing a binding constraint, 23 said theywanted to buy wrapped cheese and 11 wanted to buy sliced cheese. An additional 22 preferredcheese types that were not allowed in their State, with Colby-jack being the most commonly preferredtype. Only 12 respondents preferred a brand that was not allowed or not least cost. Thus, it was notthe least expensive brand policies in Connecticut and Oklahoma that created binding constraints, butrather packaging restrictions and limits on the types of cheese that could be purchased.
13 Note that these responses are conditional on at least some of the prescribed cheese being purchased. If one wanted toknow the percentage of all respondents who said they both purchased and ate all their prescribed cheese, the “all”percentages in the panel on “amount consumed” would need to be multiplied by the “all” percentages in the panel on“amount purchased”. In California, for example, 87.3 percent of respondents ate all the cheese that was prescribed (thatis, 87.8 percent of the 99.4 percent who bought all their prescribed cheese).
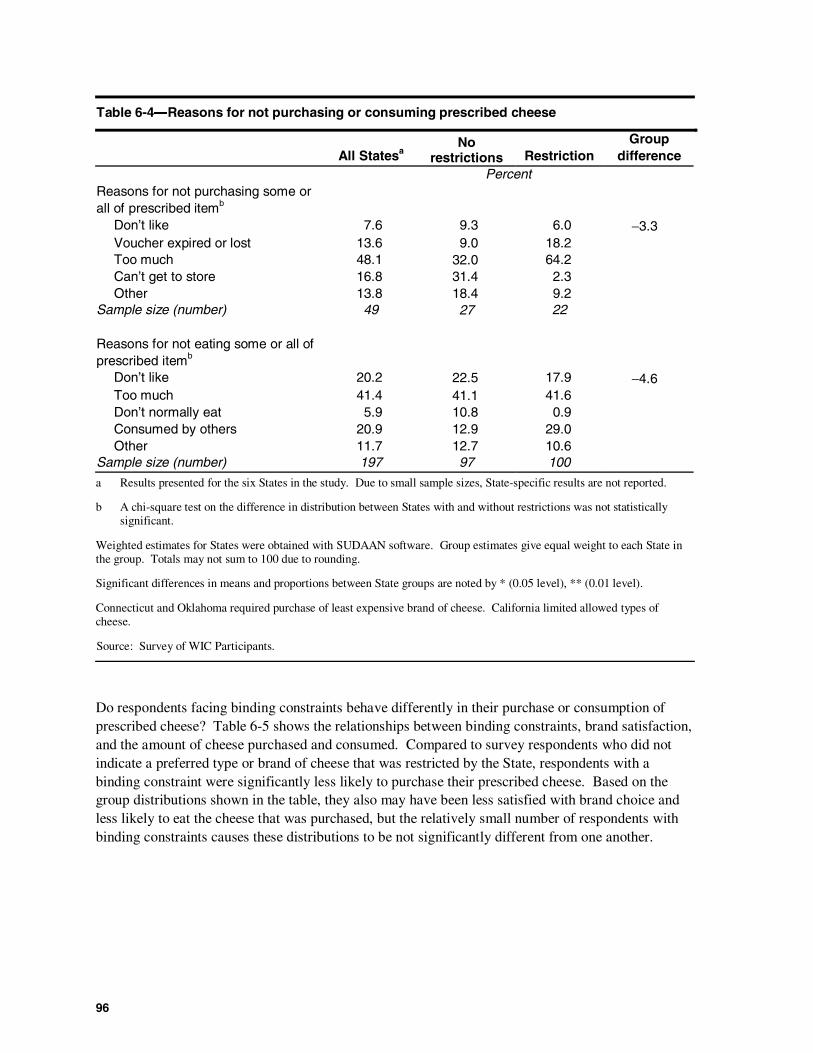
96
Table 6-4―Reasons for not purchasing or consuming prescribed cheese
All StatesaNo
restrictions RestrictionGroup
differencePercent
Reasons for not purchasing some orall of prescribed itemb
Don’t like 7.6 9.3 6.0 −3.3Voucher expired or lost 13.6 9.0 18.2Too much 48.1 32.0 64.2Can’t get to store 16.8 31.4 2.3Other 13.8 18.4 9.2
Sample size (number) 49 27 22
Reasons for not eating some or all ofprescribed itemb
Don’t like 20.2 22.5 17.9 −4.6Too much 41.4 41.1 41.6Don’t normally eat 5.9 10.8 0.9Consumed by others 20.9 12.9 29.0Other 11.7 12.7 10.6
Sample size (number) 197 97 100
a Results presented for the six States in the study. Due to small sample sizes, State-specific results are not reported.
b A chi-square test on the difference in distribution between States with and without restrictions was not statisticallysignificant.
Weighted estimates for States were obtained with SUDAAN software. Group estimates give equal weight to each State inthe group. Totals may not sum to 100 due to rounding.
Significant differences in means and proportions between State groups are noted by * (0.05 level), ** (0.01 level).
Connecticut and Oklahoma required purchase of least expensive brand of cheese. California limited allowed types ofcheese.
Source: Survey of WIC Participants.
Do respondents facing binding constraints behave differently in their purchase or consumption ofprescribed cheese? Table 6-5 shows the relationships between binding constraints, brand satisfaction,and the amount of cheese purchased and consumed. Compared to survey respondents who did notindicate a preferred type or brand of cheese that was restricted by the State, respondents with abinding constraint were significantly less likely to purchase their prescribed cheese. Based on thegroup distributions shown in the table, they also may have been less satisfied with brand choice andless likely to eat the cheese that was purchased, but the relatively small number of respondents withbinding constraints causes these distributions to be not significantly different from one another.
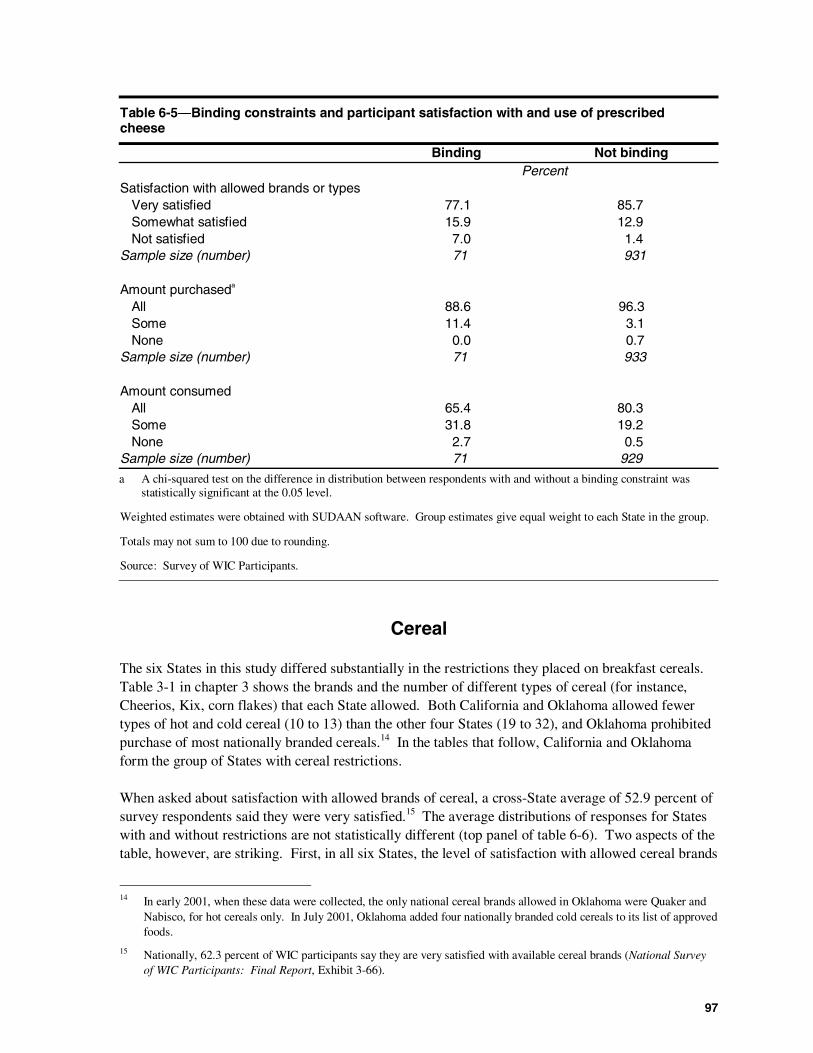
97
Cereal
The six States in this study differed substantially in the restrictions they placed on breakfast cereals.Table 3-1 in chapter 3 shows the brands and the number of different types of cereal (for instance,Cheerios, Kix, corn flakes) that each State allowed. Both California and Oklahoma allowed fewertypes of hot and cold cereal (10 to 13) than the other four States (19 to 32), and Oklahoma prohibitedpurchase of most nationally branded cereals.14 In the tables that follow, California and Oklahomaform the group of States with cereal restrictions.
When asked about satisfaction with allowed brands of cereal, a cross-State average of 52.9 percent ofsurvey respondents said they were very satisfied.15 The average distributions of responses for Stateswith and without restrictions are not statistically different (top panel of table 6-6). Two aspects of thetable, however, are striking. First, in all six States, the level of satisfaction with allowed cereal brands
14 In early 2001, when these data were collected, the only national cereal brands allowed in Oklahoma were Quaker andNabisco, for hot cereals only. In July 2001, Oklahoma added four nationally branded cold cereals to its list of approvedfoods.
15 Nationally, 62.3 percent of WIC participants say they are very satisfied with available cereal brands (National Surveyof WIC Participants: Final Report, Exhibit 3-66).
Table 6-5―Binding constraints and participant satisfaction with and use of prescribedcheese
Binding Not bindingPercent
Satisfaction with allowed brands or typesVery satisfied 77.1 85.7Somewhat satisfied 15.9 12.9Not satisfied 7.0 1.4
Sample size (number) 71 931
Amount purchaseda
All 88.6 96.3Some 11.4 3.1None 0.0 0.7
Sample size (number) 71 933
Amount consumedAll 65.4 80.3Some 31.8 19.2None 2.7 0.5
Sample size (number) 71 929
a A chi-squared test on the difference in distribution between respondents with and without a binding constraint wasstatistically significant at the 0.05 level.
Weighted estimates were obtained with SUDAAN software. Group estimates give equal weight to each State in the group.
Totals may not sum to 100 due to rounding.
Source: Survey of WIC Participants.
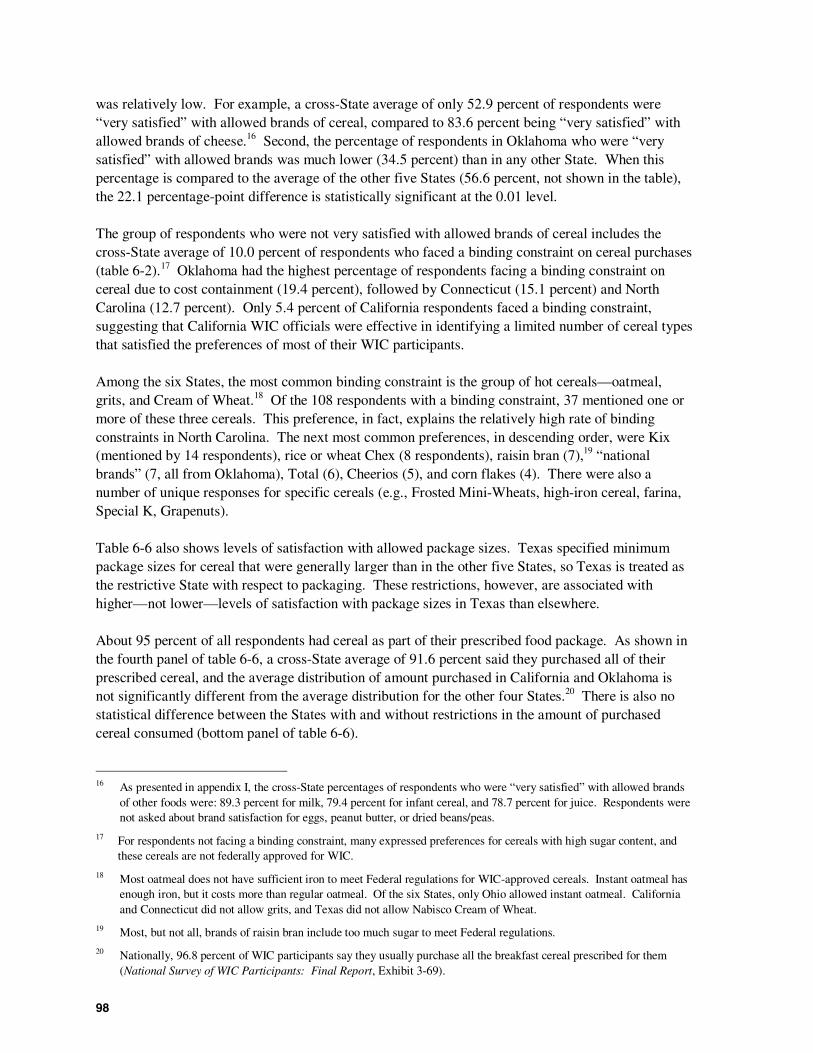
98
was relatively low. For example, a cross-State average of only 52.9 percent of respondents were“very satisfied” with allowed brands of cereal, compared to 83.6 percent being “very satisfied” withallowed brands of cheese.16 Second, the percentage of respondents in Oklahoma who were “verysatisfied” with allowed brands was much lower (34.5 percent) than in any other State. When thispercentage is compared to the average of the other five States (56.6 percent, not shown in the table),the 22.1 percentage-point difference is statistically significant at the 0.01 level.
The group of respondents who were not very satisfied with allowed brands of cereal includes thecross-State average of 10.0 percent of respondents who faced a binding constraint on cereal purchases(table 6-2).17 Oklahoma had the highest percentage of respondents facing a binding constraint oncereal due to cost containment (19.4 percent), followed by Connecticut (15.1 percent) and NorthCarolina (12.7 percent). Only 5.4 percent of California respondents faced a binding constraint,suggesting that California WIC officials were effective in identifying a limited number of cereal typesthat satisfied the preferences of most of their WIC participants.
Among the six States, the most common binding constraint is the group of hot cereals—oatmeal,grits, and Cream of Wheat.18 Of the 108 respondents with a binding constraint, 37 mentioned one ormore of these three cereals. This preference, in fact, explains the relatively high rate of bindingconstraints in North Carolina. The next most common preferences, in descending order, were Kix(mentioned by 14 respondents), rice or wheat Chex (8 respondents), raisin bran (7),19 “nationalbrands” (7, all from Oklahoma), Total (6), Cheerios (5), and corn flakes (4). There were also anumber of unique responses for specific cereals (e.g., Frosted Mini-Wheats, high-iron cereal, farina,Special K, Grapenuts).
Table 6-6 also shows levels of satisfaction with allowed package sizes. Texas specified minimumpackage sizes for cereal that were generally larger than in the other five States, so Texas is treated asthe restrictive State with respect to packaging. These restrictions, however, are associated withhigher—not lower—levels of satisfaction with package sizes in Texas than elsewhere.
About 95 percent of all respondents had cereal as part of their prescribed food package. As shown inthe fourth panel of table 6-6, a cross-State average of 91.6 percent said they purchased all of theirprescribed cereal, and the average distribution of amount purchased in California and Oklahoma isnot significantly different from the average distribution for the other four States.20 There is also nostatistical difference between the States with and without restrictions in the amount of purchasedcereal consumed (bottom panel of table 6-6).
16 As presented in appendix I, the cross-State percentages of respondents who were “very satisfied” with allowed brandsof other foods were: 89.3 percent for milk, 79.4 percent for infant cereal, and 78.7 percent for juice. Respondents werenot asked about brand satisfaction for eggs, peanut butter, or dried beans/peas.
17 For respondents not facing a binding constraint, many expressed preferences for cereals with high sugar content, andthese cereals are not federally approved for WIC.
18 Most oatmeal does not have sufficient iron to meet Federal regulations for WIC-approved cereals. Instant oatmeal hasenough iron, but it costs more than regular oatmeal. Of the six States, only Ohio allowed instant oatmeal. Californiaand Connecticut did not allow grits, and Texas did not allow Nabisco Cream of Wheat.
19 Most, but not all, brands of raisin bran include too much sugar to meet Federal regulations.
20 Nationally, 96.8 percent of WIC participants say they usually purchase all the breakfast cereal prescribed for them(National Survey of WIC Participants: Final Report, Exhibit 3-69).
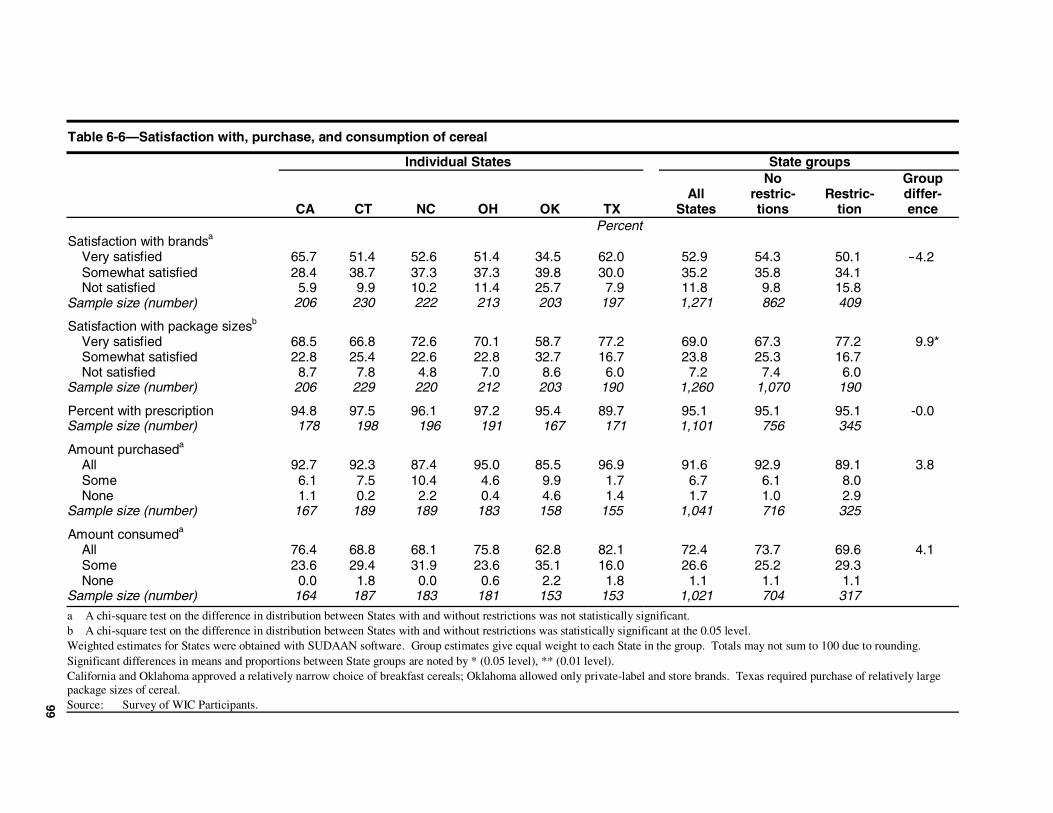
99
Table 6-6—Satisfaction with, purchase, and consumption of cereal
Individual States State groups
CA CT NC OH OK TXAll
States
Norestric-tions
Restric-tion
Groupdiffer-ence
PercentSatisfaction with brandsa
Very satisfied 65.7 51.4 52.6 51.4 34.5 62.0 52.9 54.3 50.1!4.2
Somewhat satisfied 28.4 38.7 37.3 37.3 39.8 30.0 35.2 35.8 34.1Not satisfied 5.9 9.9 10.2 11.4 25.7 7.9 11.8 9.8 15.8
Sample size (number) 206 230 222 213 203 197 1,271 862 409
Satisfaction with package sizesb
Very satisfied 68.5 66.8 72.6 70.1 58.7 77.2 69.0 67.3 77.2 9.9*Somewhat satisfied 22.8 25.4 22.6 22.8 32.7 16.7 23.8 25.3 16.7Not satisfied 8.7 7.8 4.8 7.0 8.6 6.0 7.2 7.4 6.0
Sample size (number) 206 229 220 212 203 190 1,260 1,070 190
Percent with prescription 94.8 97.5 96.1 97.2 95.4 89.7 95.1 95.1 95.1 -0.0Sample size (number) 178 198 196 191 167 171 1,101 756 345
Amount purchaseda
All 92.7 92.3 87.4 95.0 85.5 96.9 91.6 92.9 89.1 !3.8Some 6.1 7.5 10.4 4.6 9.9 1.7 6.7 6.1 8.0None 1.1 0.2 2.2 0.4 4.6 1.4 1.7 1.0 2.9
Sample size (number) 167 189 189 183 158 155 1,041 716 325
Amount consumeda
All 76.4 68.8 68.1 75.8 62.8 82.1 72.4 73.7 69.6 !4.1Some 23.6 29.4 31.9 23.6 35.1 16.0 26.6 25.2 29.3None 0.0 1.8 0.0 0.6 2.2 1.8 1.1 1.1 1.1
Sample size (number) 164 187 183 181 153 153 1,021 704 317
a A chi-square test on the difference in distribution between States with and without restrictions was not statistically significant.b A chi-square test on the difference in distribution between States with and without restrictions was statistically significant at the 0.05 level.Weighted estimates for States were obtained with SUDAAN software. Group estimates give equal weight to each State in the group. Totals may not sum to 100 due to rounding.Significant differences in means and proportions between State groups are noted by * (0.05 level), ** (0.01 level).California and Oklahoma approved a relatively narrow choice of breakfast cereals; Oklahoma allowed only private-label and store brands. Texas required purchase of relatively largepackage sizes of cereal.Source: Survey of WIC Participants.
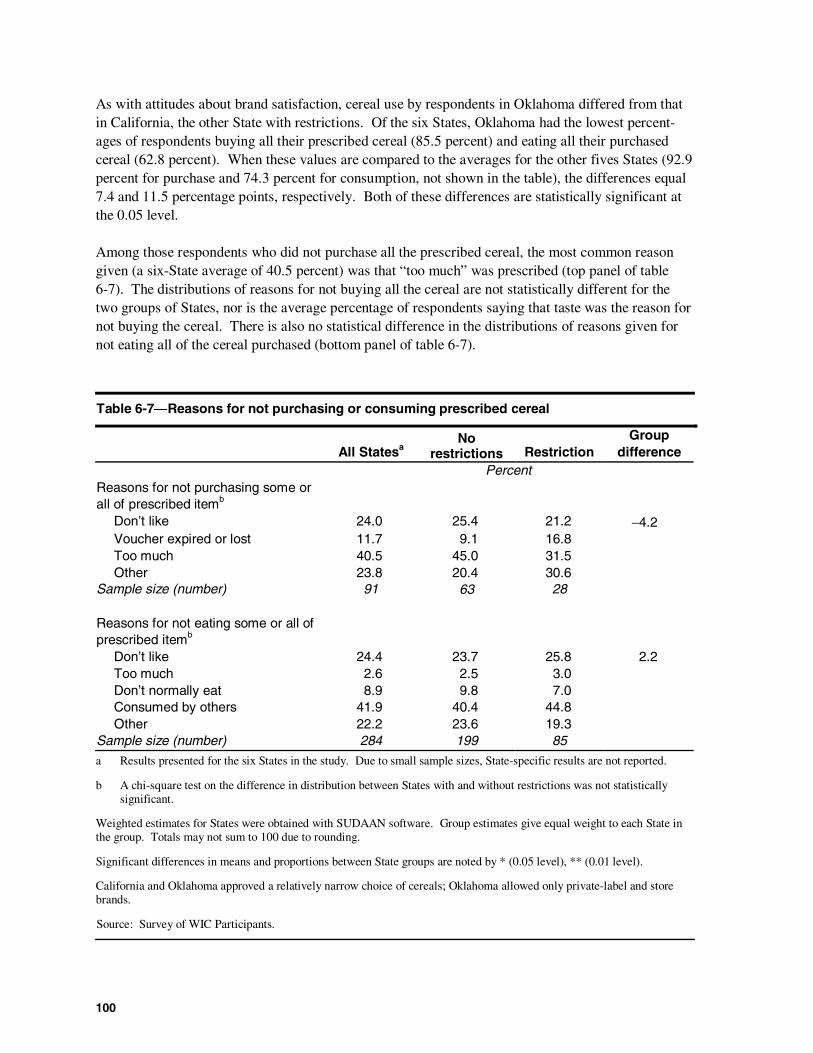
100
As with attitudes about brand satisfaction, cereal use by respondents in Oklahoma differed from thatin California, the other State with restrictions. Of the six States, Oklahoma had the lowest percent-ages of respondents buying all their prescribed cereal (85.5 percent) and eating all their purchasedcereal (62.8 percent). When these values are compared to the averages for the other fives States (92.9percent for purchase and 74.3 percent for consumption, not shown in the table), the differences equal7.4 and 11.5 percentage points, respectively. Both of these differences are statistically significant atthe 0.05 level.
Among those respondents who did not purchase all the prescribed cereal, the most common reasongiven (a six-State average of 40.5 percent) was that “too much” was prescribed (top panel of table6-7). The distributions of reasons for not buying all the cereal are not statistically different for thetwo groups of States, nor is the average percentage of respondents saying that taste was the reason fornot buying the cereal. There is also no statistical difference in the distributions of reasons given fornot eating all of the cereal purchased (bottom panel of table 6-7).
Table 6-7―Reasons for not purchasing or consuming prescribed cereal
All StatesaNo
restrictions RestrictionGroup
differencePercent
Reasons for not purchasing some orall of prescribed itemb
Don’t like 24.0 25.4 21.2 −4.2Voucher expired or lost 11.7 9.1 16.8Too much 40.5 45.0 31.5Other 23.8 20.4 30.6
Sample size (number) 91 63 28
Reasons for not eating some or all ofprescribed itemb
Don’t like 24.4 23.7 25.8 2.2Too much 2.6 2.5 3.0Don’t normally eat 8.9 9.8 7.0Consumed by others 41.9 40.4 44.8Other 22.2 23.6 19.3
Sample size (number) 284 199 85
a Results presented for the six States in the study. Due to small sample sizes, State-specific results are not reported.
b A chi-square test on the difference in distribution between States with and without restrictions was not statisticallysignificant.
Weighted estimates for States were obtained with SUDAAN software. Group estimates give equal weight to each State inthe group. Totals may not sum to 100 due to rounding.
Significant differences in means and proportions between State groups are noted by * (0.05 level), ** (0.01 level).
California and Oklahoma approved a relatively narrow choice of cereals; Oklahoma allowed only private-label and storebrands.
Source: Survey of WIC Participants.
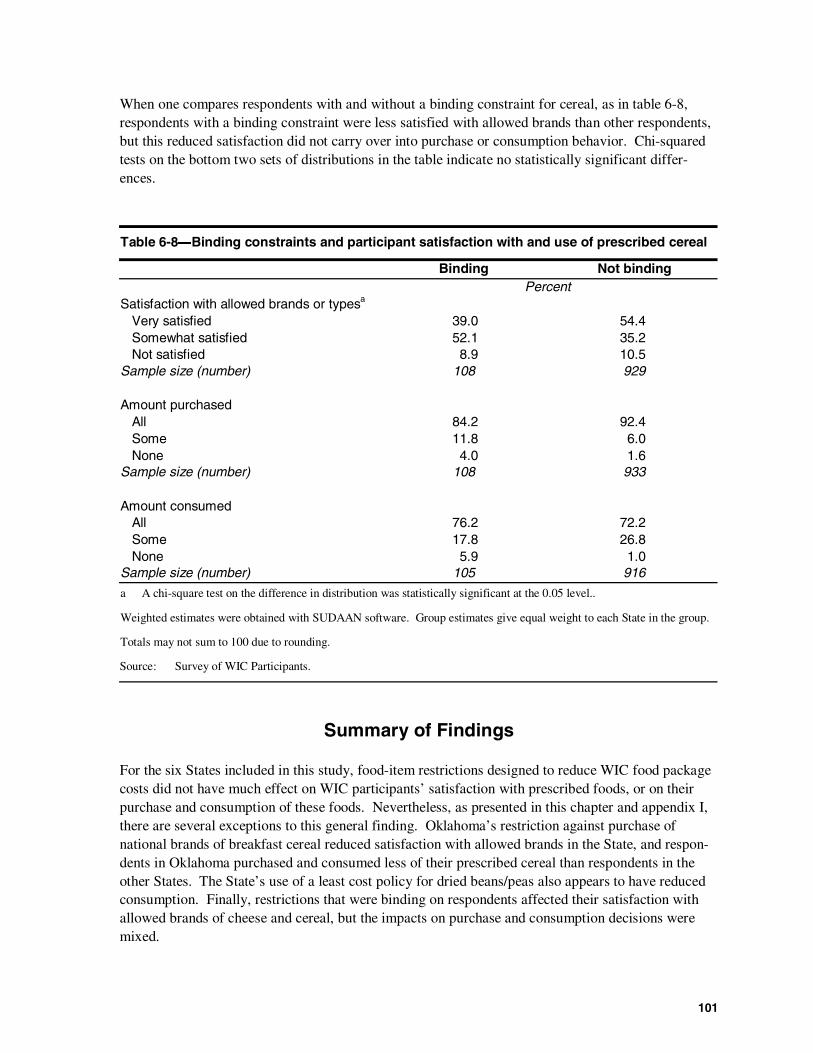
101
When one compares respondents with and without a binding constraint for cereal, as in table 6-8,respondents with a binding constraint were less satisfied with allowed brands than other respondents,but this reduced satisfaction did not carry over into purchase or consumption behavior. Chi-squaredtests on the bottom two sets of distributions in the table indicate no statistically significant differ-ences.
Table 6-8―Binding constraints and participant satisfaction with and use of prescribed cereal
Binding Not bindingPercent
Satisfaction with allowed brands or typesa
Very satisfied 39.0 54.4Somewhat satisfied 52.1 35.2Not satisfied 8.9 10.5
Sample size (number) 108 929
Amount purchasedAll 84.2 92.4Some 11.8 6.0None 4.0 1.6
Sample size (number) 108 933
Amount consumedAll 76.2 72.2Some 17.8 26.8None 5.9 1.0
Sample size (number) 105 916
a A chi-square test on the difference in distribution was statistically significant at the 0.05 level..
Weighted estimates were obtained with SUDAAN software. Group estimates give equal weight to each State in the group.
Totals may not sum to 100 due to rounding.
Source: Survey of WIC Participants.
Summary of Findings
For the six States included in this study, food-item restrictions designed to reduce WIC food packagecosts did not have much effect on WIC participants’ satisfaction with prescribed foods, or on theirpurchase and consumption of these foods. Nevertheless, as presented in this chapter and appendix I,there are several exceptions to this general finding. Oklahoma’s restriction against purchase ofnational brands of breakfast cereal reduced satisfaction with allowed brands in the State, and respon-dents in Oklahoma purchased and consumed less of their prescribed cereal than respondents in theother States. The State’s use of a least cost policy for dried beans/peas also appears to have reducedconsumption. Finally, restrictions that were binding on respondents affected their satisfaction withallowed brands of cheese and cereal, but the impacts on purchase and consumption decisions weremixed.
102
When asked why they did not purchase all of the WIC food prescribed for them, or eat or drink all thefood they purchased, survey respondents provided a variety of reasons. Not liking the food item wasmentioned by some respondents, but other reasons were given more frequently. This suggests thatcost-containment practices limiting types and brands of allowed foods were usually not the mainreason survey respondents did not buy or consume all of their prescribed food.
Among the other reasons given for not buying or consuming all the prescribed food, commonresponses were that too much was prescribed or that some of the purchased food was consumed bynon-WIC members of the family. This may suggest that, for some WIC participants, the program isoverprescribing certain foods—an issue of concern to some WIC officials.21 Given that this researchwas not designed to examine the appropriateness of prescription amounts, however, one should treatthe evidence as suggestive rather than conclusive.
A list follows of the primary findings with respect to each of the food categories examined.
Cheese
• Connecticut and Oklahoma imposed least cost restrictions on cheese, and Californialimited the number of allowed types of cheese.
• The presence of restrictions on cheese was not related to brand satisfaction or amountpurchased.
• Consumption of purchased cheese was lower in the restricted than in the nonrestrictedStates, but the evidence suggests that factors unrelated to restrictions account for thedifference in consumption. Factors cited most frequently were that the WIC foodinstrument was lost (or had expired) and that “too much” cheese had been prescribed.
• State restrictions on brand, type, and packaging of cheese were binding on a Stateaverage of 8.8 percent of survey respondents, with the highest rates in Oklahoma (15.7percent) and Ohio (12.6 percent). Respondents with a binding restriction were, onaverage, less satisfied than others with allowed brands of cheese, less likely to buy theirprescribed cheese, and less likely to eat the cheese they bought
Cereal
• California and Oklahoma imposed relatively stringent restrictions on the brands or typesof cereal that could be purchased. California limited the number of allowed types ofcereal, and Oklahoma limited most cereals to store-brand or private label.
• When the average distribution of respondent satisfaction in California and Oklahoma iscompared to the average distribution in the other four States, there is no significant differ-ence in the two distributions.
• There is no significant difference in the distributions of amount of cereal purchasedbetween States with and without restrictions on cereal types and brands.
21 The National Association of WIC Directors (NAWD) has issued a position paper, “NAWD WIC Food PrescriptionRecommendations” that calls for a reduction in the maximum quantity of milk and protein-rich foods prescribed forchildren (undated).
103
• Similarly, the presence of cereal restrictions was not related to the amount of cerealconsumed.
• If Oklahoma is defined as the only State with cereal restrictions, then satisfaction withallowed brands was significantly lower in Oklahoma than elsewhere, as was purchase andconsumption of cereal. In July 2001, after data for this study were collected, Oklahomaadded four nationally branded cereals to its list of approved foods.
• State restrictions on cereal were binding on a State average of 10.0 percent of surveyrespondents, with the highest rates in Oklahoma (19.4 percent), Connecticut (15.1percent), and North Carolina (12.7 percent). Respondents with a binding restriction were,on average, less satisfied than others with allowed brands of cereal and somewhat lesslikely to buy their prescribed cereal. They were not, however, less likely to eat the cerealthey purchased.
Dried Beans or Peas
• Oklahoma was the only State in the study that imposed a least cost restriction on thepurchase of dried beans or peas.
• The restriction has no impact on the amount of dried beans/peas purchased.
• The restriction appears to have reduced the amount of purchased dried beans/peas thatwas eaten.
Milk
• Connecticut, North Carolina, Oklahoma, and Texas imposed least cost restrictions onmilk.
• The presence of restrictions was not related to brand satisfaction.
• The percentage of respondents purchasing all their prescribed milk was not related to thepresence of least cost restrictions.
• The percentage of respondents drinking all their purchased milk was lower in the Stateswith restrictions than in the nonrestrictive States, but the evidence suggests that factorsother than brand dissatisfaction accounted for this difference. The factor cited most oftenby respondents was that “too much” milk was prescribed.
Eggs
• Connecticut and Oklahoma imposed least cost restrictions on the purchase of eggs.
• The restrictions had no impact on amount purchased.
• There was less consumption of purchased eggs in the restricted States, but apparently notbecause of the imposed restrictions. The most commonly cited factor for not eating allthe purchased eggs was that too much was prescribed.
Infant Cereal
• Three States—California, Connecticut, and Texas—restricted purchases of infant cerealto a single brand.
104
• This brand restriction was binding on almost no WIC participants in these three States.
• The brand restriction was not related to levels of brand satisfaction or amount ofprescribed infant cereal that was purchased.
• The brand restriction did not reduce the amount of infant cereal consumed.
Juice
• Four States—California, Connecticut, Oklahoma, and Texas—imposed restrictions oneither the brand or type of juice that could be purchased.
• The State restrictions had no impact on expressed levels of satisfaction with approvedbrands, nor did they reduce the amount of prescribed juice that was purchased.
• The presence of restrictions on juice was not related to the amount of purchased juice thatwas consumed.
• State restrictions were binding on a State average of 6.9 percent of survey respondents,with the highest rates in California (13.3 percent) and Texas (12.1 percent). Thesebinding restrictions, however, did not affect satisfaction with allowed brands or thepurchase or consumption of prescribed juice.
Peanut Butter
• Connecticut imposed a least cost restriction on the purchase of peanut butter.
• The restriction had no impact on the amount of peanut butter purchased.
• The restriction had no impact on the amount of purchased peanut butter that wasconsumed.
Overall, the food-item restrictions imposed in these six States created some binding constraints andlowered participant satisfaction with allowed brands in some instances. In general, however,satisfaction with allowed brands and packaging was high, and purchase and consumption ofprescribed foods were not affected by the restrictions.
105
Chapter 7WIC Participants with Special Diets
or Food Allergies
One objective of this study is to determine whether WIC cost-containment practices have differentialimpacts on participants with special diets or food allergies, compared with other WIC participants.Those with special diets or food allergies have dietary restrictions that limit the foods they can eat.Often, they must verify food product ingredients to ensure that the product is safe and appropriate.
To address this objective, the study examined several types of special diets and food allergies, basedon responses to the Survey of WIC Participants. The study identified those households with specialdiets in which at least one WIC member:
• modified their diet for a health-related reason,• followed a diet restricted by religious practice, or• followed a vegetarian diet.
The study also identified those households having food allergies in which at least one WIC member:
• had a food allergy diagnosed by a physician, or• had experienced a severe allergic reaction within an hour after eating.
Survey respondents from households with special diets or food allergies were asked whether theirdietary restriction posed problems with finding appropriate foods when shopping for WIC items. Inaddition, the study examines whether respondents with dietary restrictions in States with food-itemrestrictions had different views about brand satisfaction, or exhibited different behaviors with respectto purchase and consumption of prescribed foods, than respondents with dietary restrictions in Stateswithout food-item restrictions.
Possible Effects of Cost-Containment Practices
Food-item restrictions on product size or packaging will not create additional problems for partici-pants with special diets or food allergies. They can still purchase food brands and types known to beappropriate for them. When State WIC agencies restrict which food brands or types may bepurchased with WIC food instruments, however, they may inadvertently eliminate food items thatparticipants know to be appropriate. Such restrictions can occur whenever federally approved WICfood items are not included in the State agency’s list of approved foods.
It is also possible for vendor restrictions to affect participants with special diets or food allergies. IfWIC participants have to shop at a different store as a result of State agency requirements that WICvendors have competitive prices, they may find that the new store does not stock the food items theyknow to be safe and appropriate. When that happens, the participants must make sure that an alterna-tive allowed food brand is appropriate. For instance, those with food allergies may need to checkcereal labels to ensure that offending ingredients are not included in an allowed brand. Because foodlabels do not always list all ingredients, participants may further need to contact manufacturers to
106
check on actual ingredients. They could also decide to simply do without a prescribed food itemrather than risk eating an offending ingredient.
Food-item restrictions, however, should not affect WIC participants’ ability to find WIC-approvedfoods when either (1) most WIC food items already meet the dietary restriction, or (2) substitutefoods are available on the WIC food list. For example, participants on a low-fat diet may chooseskim or 1-percent milk rather than whole milk. In addition, food package tailoring at the WIC cliniccan accommodate certain allergies (for instance, substitution of dried beans or peas for peanut butterfor participants with a peanut allergy). Finally, given the availability of food substitutes, vendorrestrictions on higher price stores are also unlikely to affect participants on most special diets, even ifhigher price stores carry a larger selection of approved WIC foods than authorized stores.
Of course, participants may not be as satisfied with the taste or texture of a substitute food item aswith an item restricted due to cost-containment, even though the item can still meet their dietaryrestrictions.1
Research Approach
The study originally planned to over-sample families with WIC members on special diets or withfood allergies to provide a sufficient sample for examining whether cost-containment practices had adisproportionate effect on them. Review of available data from the WIC certification files of the sixcase study States, however, indicated that consistent data identifying participants special diets or foodallergies were not available. WIC families were therefore randomly selected within each samplingstratum, and the Survey of WIC Participants included a series of questions asking about the presenceof special diets and food allergies.2 A sufficient number of families on special diets or with foodallergies were sampled (n = 528) to address whether cost-containment practices had a dispropor-tionate effect on them.
Most of the chapter presents tabular analyses of the survey data. The last analysis section describes aset of multivariate models used to assess whether families on special diets or with food allergies haddifferent responses to cost-containment practices than other WIC families.
Special Diets
The Survey of WIC Participants asked respondents about three types of special diets: diets modifiedfor health reasons (such as low-calorie for weight loss, low-sodium, and low- or high-fiber); vege-tarian diets; and religious diets, specifically Kosher, Muslim, and Seventh-Day Adventist diets. Table7-1 presents the percentage of survey respondents in each State reporting that they or a WIC familymember were on a special diet.
Depending on the State, from 28.5 to 48.5 percent of survey respondents reported that they were on aspecial diet for health-related reasons (though not necessarily prescribed by their physician). NorthCarolina had the highest percentage, and Texas the lowest. There is no single type of special diet that
1 Participant satisfaction with prescribed foods was described in chapter 6.
2 These questions are contained in section F of the survey questionnaire. A copy of the survey questionnaire and adescription of the survey’s sample design are contained in appendix A.
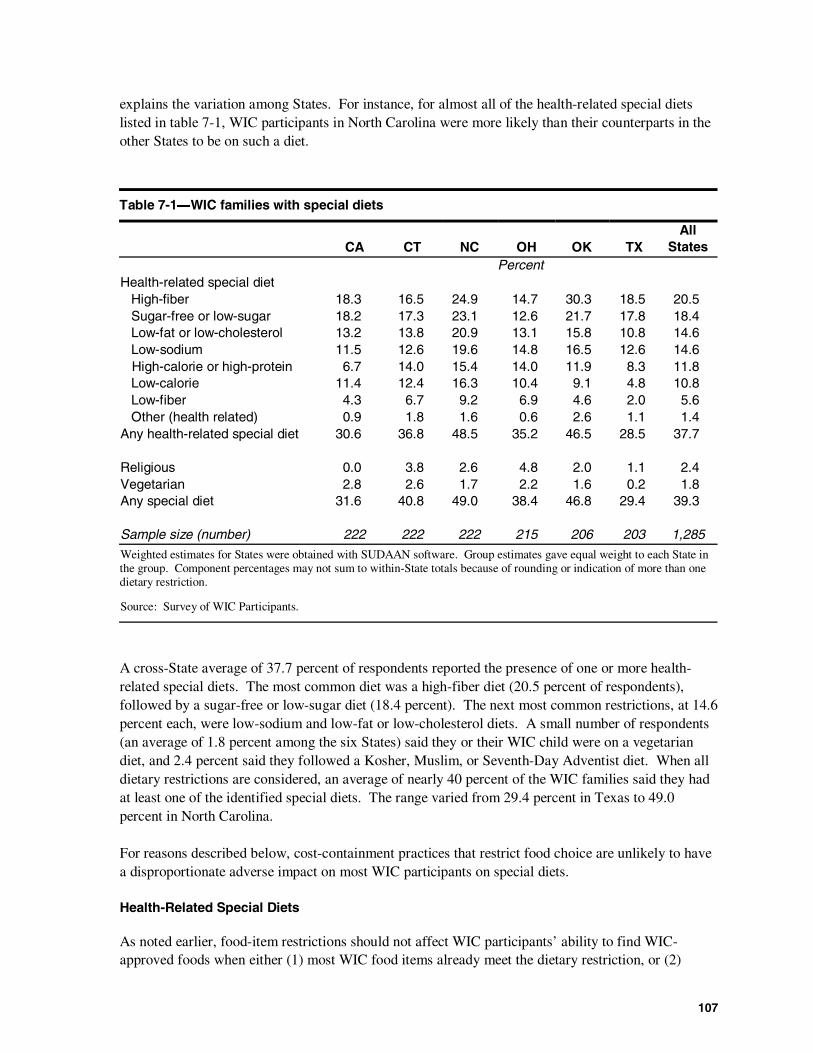
107
explains the variation among States. For instance, for almost all of the health-related special dietslisted in table 7-1, WIC participants in North Carolina were more likely than their counterparts in theother States to be on such a diet.
Table 7-1―WIC families with special diets
CA CT NC OH OK TXAll
StatesPercent
Health-related special dietHigh-fiber 18.3 16.5 24.9 14.7 30.3 18.5 20.5Sugar-free or low-sugar 18.2 17.3 23.1 12.6 21.7 17.8 18.4Low-fat or low-cholesterol 13.2 13.8 20.9 13.1 15.8 10.8 14.6Low-sodium 11.5 12.6 19.6 14.8 16.5 12.6 14.6High-calorie or high-protein 6.7 14.0 15.4 14.0 11.9 8.3 11.8Low-calorie 11.4 12.4 16.3 10.4 9.1 4.8 10.8Low-fiber 4.3 6.7 9.2 6.9 4.6 2.0 5.6Other (health related) 0.9 1.8 1.6 0.6 2.6 1.1 1.4
Any health-related special diet 30.6 36.8 48.5 35.2 46.5 28.5 37.7
Religious 0.0 3.8 2.6 4.8 2.0 1.1 2.4Vegetarian 2.8 2.6 1.7 2.2 1.6 0.2 1.8Any special diet 31.6 40.8 49.0 38.4 46.8 29.4 39.3
Sample size (number) 222 222 222 215 206 203 1,285
Weighted estimates for States were obtained with SUDAAN software. Group estimates gave equal weight to each State inthe group. Component percentages may not sum to within-State totals because of rounding or indication of more than onedietary restriction.
Source: Survey of WIC Participants.
A cross-State average of 37.7 percent of respondents reported the presence of one or more health-related special diets. The most common diet was a high-fiber diet (20.5 percent of respondents),followed by a sugar-free or low-sugar diet (18.4 percent). The next most common restrictions, at 14.6percent each, were low-sodium and low-fat or low-cholesterol diets. A small number of respondents(an average of 1.8 percent among the six States) said they or their WIC child were on a vegetariandiet, and 2.4 percent said they followed a Kosher, Muslim, or Seventh-Day Adventist diet. When alldietary restrictions are considered, an average of nearly 40 percent of the WIC families said they hadat least one of the identified special diets. The range varied from 29.4 percent in Texas to 49.0percent in North Carolina.
For reasons described below, cost-containment practices that restrict food choice are unlikely to havea disproportionate adverse impact on most WIC participants on special diets.
Health-Related Special Diets
As noted earlier, food-item restrictions should not affect WIC participants’ ability to find WIC-approved foods when either (1) most WIC food items already meet the dietary restriction, or (2)
108
substitute foods are available on the WIC food list. With regard to the special diets listed in table 7-1,the following WIC food substitutes or accommodations are available:
• A cross-State average of 20.5 percent of survey respondents said they or their sampledchildren were on high-fiber diets. WIC foods that provide fiber include dried beans/peasand many cereals, especially bran and other whole grain cereals. Changing brands forthese food items would not materially affect fiber content, and State agencies take care tomake sure that their food-item restrictions do not eliminate major cereal grain categories.
• An average of 18.4 percent of surveyed families reported that a WIC member was on asugar-free or low-sugar diet. Most WIC food items are already low in added sugar, sofood-item restrictions should not materially affect participants on low-sugar diets.Cereals, in particular, are restricted to types with no more than 21.2 grams of sucrose orother sugars per 100 grams of dry cereal. Although it is possible that allowable brands ortypes of cereal might have somewhat higher sugar content than restricted brands or types,the differences are likely to be small.
• In addition to infant formula, WIC foods high in fat or cholesterol are milk (whole and 2-percent), eggs, cheese, and peanut butter. None of the case study States precludedpurchase of skim or 1-percent milk. In addition, WIC clinics can tailor food packages toreduce amounts of prescribed cheese, eggs, and peanut butter, and increase amounts ofmilk and dried beans/peas. Clinics can also prescribe low-fat or low-cholesterol cheese.Thus, food restrictions imposed by State WIC agencies should not affect the 14.6 percentof WIC families who said they were on low-fat or low-cholesterol diets.
• A cross-State average of 14.6 percent of survey respondents said they or a WIC familymember were on a low-sodium diet. Except for some cereals (for example, puffed wheatand rice, shredded wheat), most WIC foods are not low in sodium. Thus, to avoidcausing problems for WIC participants on low-sodium diets, State WIC agencies mightwant to include low-sodium cereals on their lists of approved foods.
• WIC participants needing high-calorie or high-protein foods can buy cheese, peanutbutter, dried beans/peas, or whole milk with their WIC food instruments. Food-itemrestrictions do not eliminate these high-protein and generally calorie-rich choices, so theyshould not affect the nearly 12 percent of WIC participants with these special diets.
• An average of 10.8 percent of survey respondents said they were on a low-calorie diet forweight loss. As with participants on low-fat or low-cholesterol diets, and for the samereasons, State WIC food restrictions should not affect the ability of participants to selectand purchase lower calorie types of prescribed foods, such as skim or reduced-fat milk.
• Between 5 and 6 percent of respondents said they were on a low-fiber diet; they wouldneed to avoid buying high-fiber foods like bran or whole-grain cereals. State agencies tryto ensure that their food-item restrictions do not eliminate major cereal grain categories,so these restrictions should not limit participants’ ability to choose low-fiber alternatives.
Religious and Vegetarian Diets
Cost-containment practices may, under some circumstances, make it more difficult for participantswith special diets to observe those diets. For example:
109
• A cross-State average of 2.4 percent of survey respondents said they or a WIC familymember adhered to a religious diet. Food-item restrictions may impact those on Kosheror Muslim diets by eliminating brands that have been certified as meeting the dietaryspecifications. Similarly, restrictions on higher price vendors may reduce the availabilityof WIC stores that stock foods meeting Kosher or Muslim diet needs.
• Fewer than 2 percent of survey respondents said they or a WIC family member were on avegetarian diet. State food-item restrictions should not affect the food choices of theseparticipants because WIC does not prescribe meats (except tuna fish for breastfeedingmothers) or foods that may contain meat ingredients. It is not known if any of these WICparticipants were strict vegan vegetarians, but if these participants choose not to consumedairy products, fish, or eggs, they may require tailored food packages. Again, however,the food-item restrictions imposed for cost-containment purposes would not change theirability to follow a vegetarian diet.
Food Allergies
The survey asked WIC participants whether a doctor had ever told them that they (or another WICmember of the family) had a food allergy, celiac disease or sprue, lactose or milk intolerance, orsulfite sensitivity. It also asked whether, within an hour after eating something, the respondent or herWIC child or infant had ever had a severe reaction, such as itching all over, trouble breathing,flushing, hives, or swelling of the face or hands or feet. This chapter treats all respondents whoreplied “yes” to either the food allergy or severe reaction question as having a food allergy.
Table 7-2 presents the percentages of WIC respondents indicating a food allergy or other conditioncausing food sensitivity. The percentages of respondent families with a food allergy varied from 4.6percent in Texas to 13.4 percent in North Carolina. The cross-State average was 9.4 percent.3
Lactose intolerance or milk intolerance was reported by an average of 10.8 percent of the respon-dents, with a particularly high percentage of them in Oklahoma (21.7 percent). Cost-containmentpractices should not affect participants with lactose or milk intolerance because their food packagescan be tailored to avoid cow’s milk. Furthermore, there were very few reported instances of celiacdisease or sulfite sensitivity in any State. The rest of this section therefore focuses on participantswith food allergies.
3 This percentage is high compared to national figures. For example, in the National Survey of WIC Participants: FinalReport, nutritional risk data indicate that 1.8 percent of participants have a food allergy (a weighted average of cate-gory-specific rates in exhibits 3-31 through 3-35). The presence of a food allergy was not always assessed by the WICclinic, however, so the 1.8 percent figure may be an underestimate. The percentages in table 7-2 refer to any WICmember of the family. The average number of WIC members per family was 1.65, so the 9.4 percent figure in table7-2 corresponds to 5.7 percent of participants having a food allergy, which is still substantially higher than indicatedby the nutritional risk data.
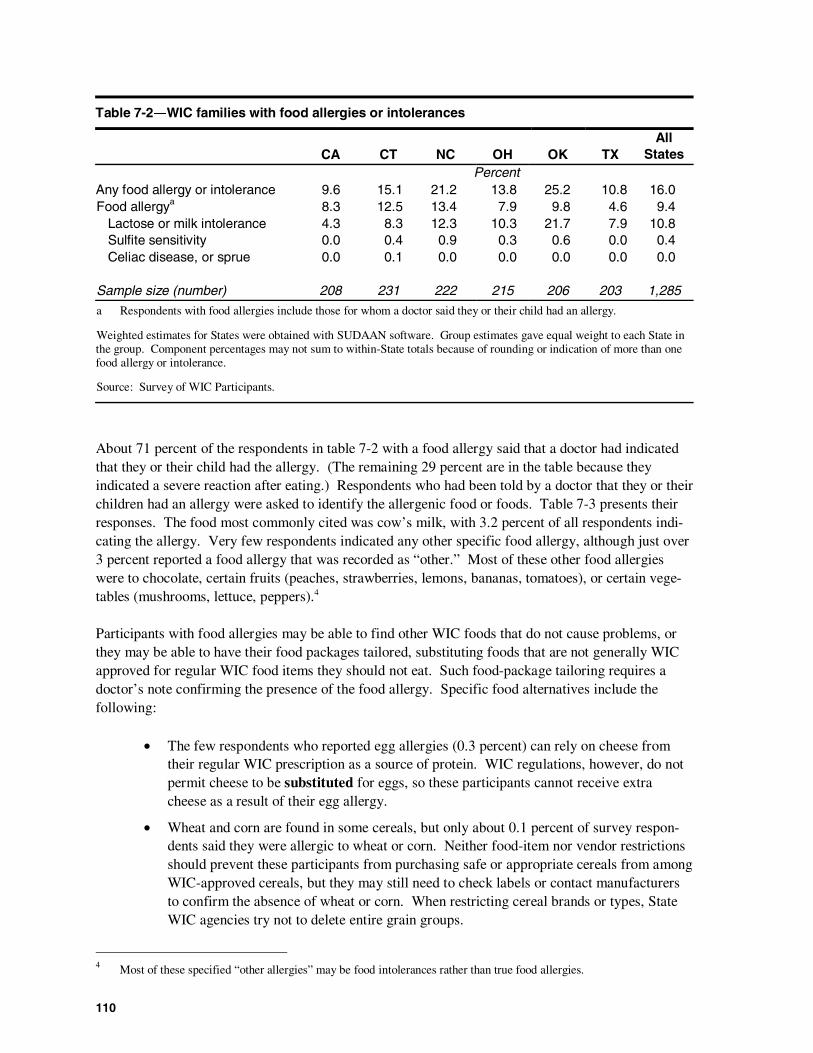
110
Table 7-2―WIC families with food allergies or intolerances
CA CT NC OH OK TXAll
StatesPercent
Any food allergy or intolerance 9.6 15.1 21.2 13.8 25.2 10.8 16.0Food allergya 8.3 12.5 13.4 7.9 9.8 4.6 9.4
Lactose or milk intolerance 4.3 8.3 12.3 10.3 21.7 7.9 10.8Sulfite sensitivity 0.0 0.4 0.9 0.3 0.6 0.0 0.4Celiac disease, or sprue 0.0 0.1 0.0 0.0 0.0 0.0 0.0
Sample size (number) 208 231 222 215 206 203 1,285
a Respondents with food allergies include those for whom a doctor said they or their child had an allergy.
Weighted estimates for States were obtained with SUDAAN software. Group estimates gave equal weight to each State inthe group. Component percentages may not sum to within-State totals because of rounding or indication of more than onefood allergy or intolerance.
Source: Survey of WIC Participants.
About 71 percent of the respondents in table 7-2 with a food allergy said that a doctor had indicatedthat they or their child had the allergy. (The remaining 29 percent are in the table because theyindicated a severe reaction after eating.) Respondents who had been told by a doctor that they or theirchildren had an allergy were asked to identify the allergenic food or foods. Table 7-3 presents theirresponses. The food most commonly cited was cow’s milk, with 3.2 percent of all respondents indi-cating the allergy. Very few respondents indicated any other specific food allergy, although just over3 percent reported a food allergy that was recorded as “other.” Most of these other food allergieswere to chocolate, certain fruits (peaches, strawberries, lemons, bananas, tomatoes), or certain vege-tables (mushrooms, lettuce, peppers).4
Participants with food allergies may be able to find other WIC foods that do not cause problems, orthey may be able to have their food packages tailored, substituting foods that are not generally WICapproved for regular WIC food items they should not eat. Such food-package tailoring requires adoctor’s note confirming the presence of the food allergy. Specific food alternatives include thefollowing:
• The few respondents who reported egg allergies (0.3 percent) can rely on cheese fromtheir regular WIC prescription as a source of protein. WIC regulations, however, do notpermit cheese to be substituted for eggs, so these participants cannot receive extracheese as a result of their egg allergy.
• Wheat and corn are found in some cereals, but only about 0.1 percent of survey respon-dents said they were allergic to wheat or corn. Neither food-item nor vendor restrictionsshould prevent these participants from purchasing safe or appropriate cereals from amongWIC-approved cereals, but they may still need to check labels or contact manufacturersto confirm the absence of wheat or corn. When restricting cereal brands or types, StateWIC agencies try not to delete entire grain groups.
4 Most of these specified “other allergies” may be food intolerances rather than true food allergies.
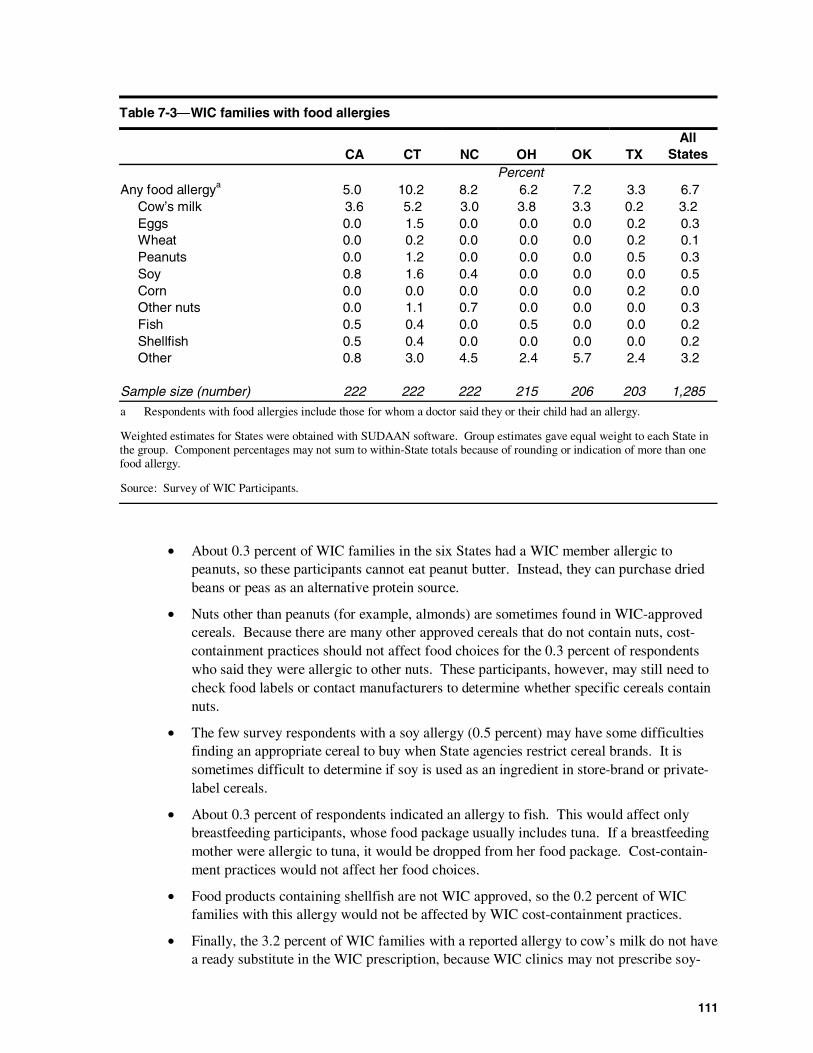
111
Table 7-3―WIC families with food allergies
CA CT NC OH OK TXAll
StatesPercent
Any food allergya 5.0 10.2 8.2 6.2 7.2 3.3 6.7Cow’s milk 3.6 5.2 3.0 3.8 3.3 0.2 3.2Eggs 0.0 1.5 0.0 0.0 0.0 0.2 0.3Wheat 0.0 0.2 0.0 0.0 0.0 0.2 0.1Peanuts 0.0 1.2 0.0 0.0 0.0 0.5 0.3Soy 0.8 1.6 0.4 0.0 0.0 0.0 0.5Corn 0.0 0.0 0.0 0.0 0.0 0.2 0.0Other nuts 0.0 1.1 0.7 0.0 0.0 0.0 0.3Fish 0.5 0.4 0.0 0.5 0.0 0.0 0.2Shellfish 0.5 0.4 0.0 0.0 0.0 0.0 0.2Other 0.8 3.0 4.5 2.4 5.7 2.4 3.2
Sample size (number) 222 222 222 215 206 203 1,285
a Respondents with food allergies include those for whom a doctor said they or their child had an allergy.
Weighted estimates for States were obtained with SUDAAN software. Group estimates gave equal weight to each State inthe group. Component percentages may not sum to within-State totals because of rounding or indication of more than onefood allergy.
Source: Survey of WIC Participants.
• About 0.3 percent of WIC families in the six States had a WIC member allergic topeanuts, so these participants cannot eat peanut butter. Instead, they can purchase driedbeans or peas as an alternative protein source.
• Nuts other than peanuts (for example, almonds) are sometimes found in WIC-approvedcereals. Because there are many other approved cereals that do not contain nuts, cost-containment practices should not affect food choices for the 0.3 percent of respondentswho said they were allergic to other nuts. These participants, however, may still need tocheck food labels or contact manufacturers to determine whether specific cereals containnuts.
• The few survey respondents with a soy allergy (0.5 percent) may have some difficultiesfinding an appropriate cereal to buy when State agencies restrict cereal brands. It issometimes difficult to determine if soy is used as an ingredient in store-brand or private-label cereals.
• About 0.3 percent of respondents indicated an allergy to fish. This would affect onlybreastfeeding participants, whose food package usually includes tuna. If a breastfeedingmother were allergic to tuna, it would be dropped from her food package. Cost-contain-ment practices would not affect her food choices.
• Food products containing shellfish are not WIC approved, so the 0.2 percent of WICfamilies with this allergy would not be affected by WIC cost-containment practices.
• Finally, the 3.2 percent of WIC families with a reported allergy to cow’s milk do not havea ready substitute in the WIC prescription, because WIC clinics may not prescribe soy-
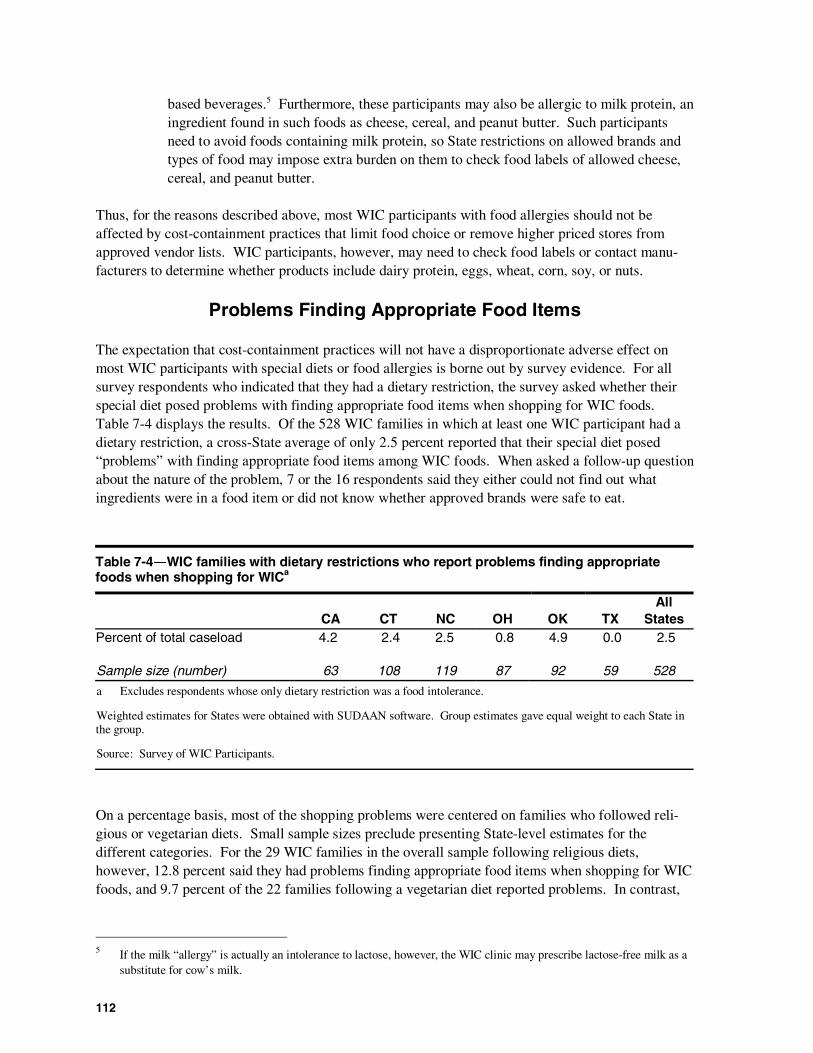
112
based beverages.5 Furthermore, these participants may also be allergic to milk protein, aningredient found in such foods as cheese, cereal, and peanut butter. Such participantsneed to avoid foods containing milk protein, so State restrictions on allowed brands andtypes of food may impose extra burden on them to check food labels of allowed cheese,cereal, and peanut butter.
Thus, for the reasons described above, most WIC participants with food allergies should not beaffected by cost-containment practices that limit food choice or remove higher priced stores fromapproved vendor lists. WIC participants, however, may need to check food labels or contact manu-facturers to determine whether products include dairy protein, eggs, wheat, corn, soy, or nuts.
Problems Finding Appropriate Food Items
The expectation that cost-containment practices will not have a disproportionate adverse effect onmost WIC participants with special diets or food allergies is borne out by survey evidence. For allsurvey respondents who indicated that they had a dietary restriction, the survey asked whether theirspecial diet posed problems with finding appropriate food items when shopping for WIC foods.Table 7-4 displays the results. Of the 528 WIC families in which at least one WIC participant had adietary restriction, a cross-State average of only 2.5 percent reported that their special diet posed“problems” with finding appropriate food items among WIC foods. When asked a follow-up questionabout the nature of the problem, 7 or the 16 respondents said they either could not find out whatingredients were in a food item or did not know whether approved brands were safe to eat.
Table 7-4―WIC families with dietary restrictions who report problems finding appropriatefoods when shopping for WICa
CA CT NC OH OK TXAll
StatesPercent of total caseload 4.2 2.4 2.5 0.8 4.9 0.0 2.5
Sample size (number) 63 108 119 87 92 59 528
a Excludes respondents whose only dietary restriction was a food intolerance.
Weighted estimates for States were obtained with SUDAAN software. Group estimates gave equal weight to each State inthe group.
Source: Survey of WIC Participants.
On a percentage basis, most of the shopping problems were centered on families who followed reli-gious or vegetarian diets. Small sample sizes preclude presenting State-level estimates for thedifferent categories. For the 29 WIC families in the overall sample following religious diets,however, 12.8 percent said they had problems finding appropriate food items when shopping for WICfoods, and 9.7 percent of the 22 families following a vegetarian diet reported problems. In contrast,
5 If the milk “allergy” is actually an intolerance to lactose, however, the WIC clinic may prescribe lactose-free milk as asubstitute for cow’s milk.
113
6.0 percent of families with food allergies and 2.3 percent of families with health-related special dietssaid they had problems shopping for WIC foods.
As displayed in table 7-4, Oklahoma had the highest rate (4.9 percent) of survey respondents whosaid they had problems finding appropriate food items. This high rate is somewhat surprising becauseOklahoma had a relatively low percentage of WIC families who were on a religious (2.0 percent) orvegetarian (1.6 percent) diet. As reported in table 7-2, however, Oklahoma did have the highestpercentage of families (21.7 percent) with food allergies, and this may help explain the relatively highrate of shopping problems within the State. It is also the case that of the seven WIC families inOklahoma who reported difficulty in shopping, three said the problem was in not knowing how tofind out about ingredients in store-brand food items. With the small sample, it is not possible toconclude that these problems were related to Oklahoma’s previous exclusion of national-brandcereals in its WIC food packages.
Satisfaction With and Use of Prescribed Foods
To examine whether WIC participants with special diets or food allergies were less satisfied withallowed brands of food, or less likely to purchase or consume all their WIC food, the study specifiedand estimated a series of logit models. Each model had the following general form:
Y = β0
+ β1*RESTRICT + β
2*RACE + β
3*GRAD + β
4*NUMBER + β
5*DIET + β
6*(DIET*RESTRICT),
where Y is one of three outcome measures, RESTRICT indicates whether the survey respondentresided in a State with restrictions for the food category being examined, RACE is a vector ofracial/ethnic categories, GRAD indicates whether the survey respondent is a high school graduate,NUMBER is the number of WIC participants in the family,6 and DIET is a vector indicating whetherthe respondent had a special diet or food allergy. The interactive terms DIET*RESTRICT areincluded in the model as well. The βs are the estimated coefficients of the model.7
The specific variables representing each vector in the models are:
• RACE (African-American, Hispanic)• DIET (vegetarian diet or special diet for health or religious reasons, food allergy).
Too few respondents indicated that they followed a vegetarian or religious diet to include these dietsas separate variables in the models.
6 The number of WIC members in the family is included to test the hypothesis that, as the number of WIC familymembers increases, the total amount of prescribed food may exceed the family’s demand for WIC foods. If so, theestimated coefficient should be zero (that is, insignificant) in the models of brand satisfaction, but negative in themodels of food purchase and food consumption.
7 Variables indicating location (urban, suburban, rural) and whether any of the WIC members were pregnant, an infant,or a child were included in alternative model specifications. Estimated coefficients for the location variables werenever statistically significant, and these variables were dropped from model specification. The variables indicatingcertification category were dropped because of collinearity between these variables and presence of special diets andfood allergies.
114
The excluded category in each model is White participants living in a State without food restrictions(for the food category examined) who do not have a high school education and special diet or foodallergy.
Separate models were fit to the survey data for three outcome measures: whether or not the respon-dent was “very satisfied” with allowed brands of a WIC food item, whether the respondent purchased“all” of the prescribed WIC item, and whether WIC members of the family consumed “all” of theitem that was purchased. The two models on purchase and consumption behavior were specified foreach of the eight food categories discussed in chapter 6 and appendix I:
• milk• eggs• cheese• juice• cereal• infant cereal• peanut butter• dried beans or peas
The model on brand satisfaction was specified for all food categories except eggs, peanut butter, anddried beans/peas. For these three categories, the survey did not ask about satisfaction with allowedbrands.
If survey respondents with special diets or food allergies were less satisfied with allowed brands thanother survey respondents, the estimated coefficients on the DIET variables will be negative and statis-tically significant. Similarly, the estimated coefficients will be negative in the respective models ifsurvey respondents with dietary restrictions were less likely to purchase all the prescribed food in acategory or to consume all the food purchased.
A significant negative estimated coefficient on a variable indicating a special diet or food allergy,however, does not mean that food-item restrictions are related to the decreased satisfaction or purchaseor consumption behavior. One must also consider the estimated coefficients for the interactive termsin each model. If the estimated coefficients on any interactive terms are negative and statisticallysignificant, this evidence would support a hypothesis that food-item restrictions have a dispropor-tionate impact on WIC participants with special diets or food allergies.
Appendix J presents the estimated coefficients for the 24 models specified. Two separate sets ofmodels are specified for breakfast cereals. The first set includes both California and Oklahoma asStates with food-item restrictions; the second set includes only Oklahoma in the restricted group.This repetition acknowledges the very different types of restrictions used in the two States: limitingtypes of allowed cereals in California versus allowing only store and private-label brands in Okla-homa.
Using the 0.05 confidence level as the threshold for assessing statistical significance, only one of theestimated coefficients for an interaction term is statistically significant, and its sign is positive ratherthan negative. Survey respondents in California and Oklahoma with special diets were more likely toeat all the prescribed cereal they purchased than respondents with special diets in the other States
115
(table j-46 in the appendix). Thus, there is no evidence that food-item restrictions in the six casestudy States had a disproportionate adverse effect on WIC participants with special diets or foodallergies. This finding is consistent with the evidence that very few respondents with special diets orfood allergies (a cross-State average of 2.5 percent) experienced problems finding appropriate fooditems when shopping for WIC foods.
The above models were re-specified with their interaction terms omitted in order to estimate theoverall relationship between having a special diet or food allergy and satisfaction with allowedbrands, amount purchased, and amount consumed. In only two of the new models were the estimatedcoefficients of the special diet variable statistically significant: respondents on special diets were lesslikely than others to buy all their prescribed cheese and to eat all the peanut butter they purchased.None of the estimated coefficients for the food allergy variable were significant in the re-estimatedmodels.
Based on these analyses, there is no evidence that States’ efforts to control food package coststhrough food-item restrictions created special problems for WIC respondents with food allergies orspecial diets. This is not to say that a few WIC participants with food allergies or special diets maynot have been adversely affected by food-item restrictions. If an effect existed, however, it likelyaffected only a small percentage of participants.
Summary
Averaged over the six case study States, 37.7 percent of survey respondents said they or their WICchild followed a special diet for specified health reasons. In addition, an average of 9.4 percentreported a food allergy. Finally, 2.4 percent of the surveyed respondents followed a religious diet,and 1.8 percent of the sample followed a vegetarian diet.
In its legislation authorizing this study, Congress identified WIC participants with special diets orfood allergies as a group of special concern with regard to the possible impacts of WIC cost-contain-ment practices. This chapter’s discussion of dietary restrictions, WIC foods, and substitute foodssuggests that cost-containment practices are not likely to have disproportionately greater impacts onparticipants with dietary restrictions than other participants, and survey evidence supports this discus-sion; only 2.5 percent of WIC families with dietary restrictions said their special diets posed problemswith finding appropriate WIC food items. The incidence of reported shopping problems was consid-erably higher, however (12.8 and 9.7 percent, respectively), for the relatively few WIC familiesadhering to religious or vegetarian diets.

117
Chapter 8Food Instrument Redemption
This chapter examines food instrument redemption in the six case study States and the relationshipbetween redemption rates and food-item restrictions. The key research question is whether food-itemrestrictions lead to decreased redemption rates.
Research Approach
State WIC administrative data on food instrument issuance and redemption are used to examine ratesof redemption. Each issuance record indicates the food categories and amounts included on theinstrument, the month for which the food instrument was valid, and whether or not the instrument wasredeemed.
Two different measures of redemption are examined using the administrative data:
1. Percentage of certified participants who pick up their food instruments2. Percentage of issued food instruments that are redeemed
A third measure is “partial redemption,” where only some of the prescribed foods on a single instru-ment are selected. The administrative data cannot be used to examine this measure because the datado not indicate which of the foods listed on the instrument were selected, and in what amount, onlywhether the instrument was redeemed. Instead, the analysis uses survey data on the percentage ofrespondents who said they did not buy all of their prescribed food. This is not an exact measure ofpartial redemption, because it may include respondents who did not redeem an instrument at all.Nevertheless, the survey data are able to provide information on the likely magnitude of partialredemptions.
Some of the following analyses exclude data from North Carolina or indicate that the North Carolinadata are not representative of the entire State. The problem is one of incomplete coverage of theState; food instrument issuance and redemption data are largely missing for several counties. Thisdata limitation, however, is not expected to bias the results of the analyses.1
This chapter examines all three measures of food instrument redemption: the rates of pickup,redemption, and partial redemption. As explained in the chapter, a multivariate analysis of instrumentredemption rates was conducted, but results were extremely sensitive to model specification. Conclu-sions about the effects of food-item restrictions on instrument redemption, therefore, rely on thetabulations presented in the chapter due to the absence of consistent model results.
1 According to State officials, food instruments are either manually prepared or printed online. Of the 100 counties inthe State, 95 printed their food instruments online at the time of the study, and the issuance information was automati-cally logged onto the State’s computer system. The remaining counties prepared their instruments manually. Even inthe online counties, some instruments were manually prepared. Although the manual data were later logged into theState’s online issuance system, analysis of the issuance file received from the State suggests that some records weremissing. Specifically, the percentage of certified WIC participants who picked up their food instruments appeared tobe artificially low.
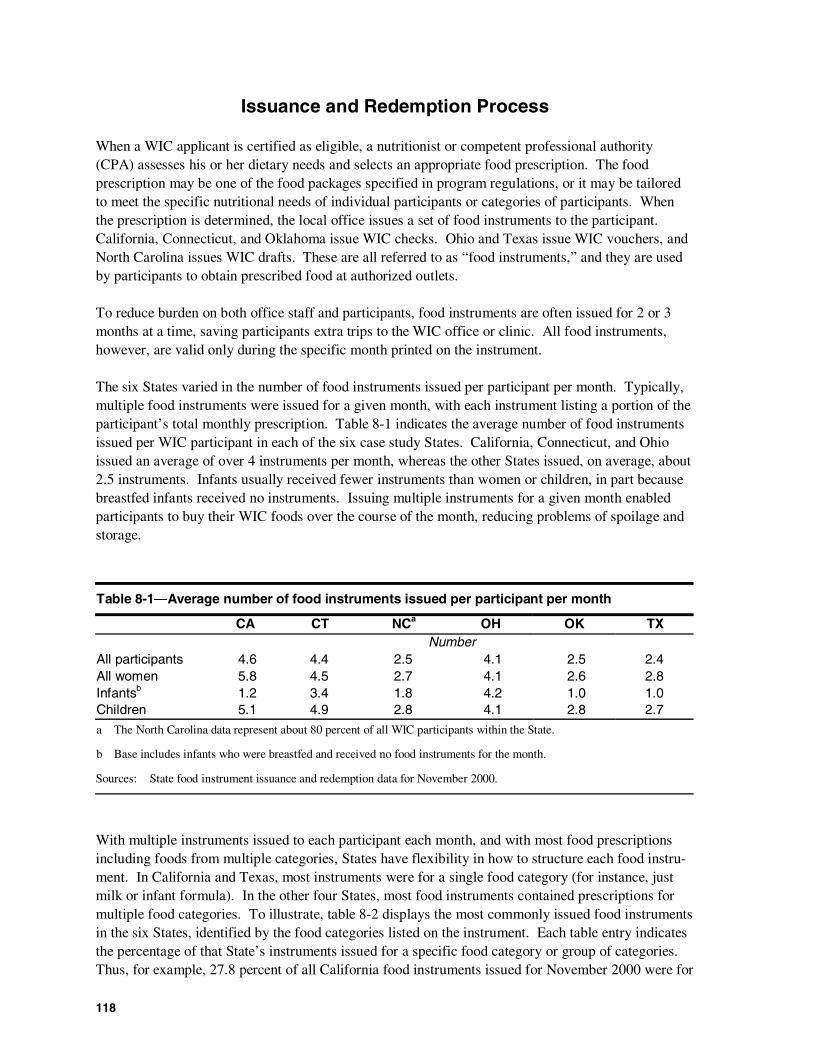
118
Issuance and Redemption Process
When a WIC applicant is certified as eligible, a nutritionist or competent professional authority(CPA) assesses his or her dietary needs and selects an appropriate food prescription. The foodprescription may be one of the food packages specified in program regulations, or it may be tailoredto meet the specific nutritional needs of individual participants or categories of participants. Whenthe prescription is determined, the local office issues a set of food instruments to the participant.California, Connecticut, and Oklahoma issue WIC checks. Ohio and Texas issue WIC vouchers, andNorth Carolina issues WIC drafts. These are all referred to as “food instruments,” and they are usedby participants to obtain prescribed food at authorized outlets.
To reduce burden on both office staff and participants, food instruments are often issued for 2 or 3months at a time, saving participants extra trips to the WIC office or clinic. All food instruments,however, are valid only during the specific month printed on the instrument.
The six States varied in the number of food instruments issued per participant per month. Typically,multiple food instruments were issued for a given month, with each instrument listing a portion of theparticipant’s total monthly prescription. Table 8-1 indicates the average number of food instrumentsissued per WIC participant in each of the six case study States. California, Connecticut, and Ohioissued an average of over 4 instruments per month, whereas the other States issued, on average, about2.5 instruments. Infants usually received fewer instruments than women or children, in part becausebreastfed infants received no instruments. Issuing multiple instruments for a given month enabledparticipants to buy their WIC foods over the course of the month, reducing problems of spoilage andstorage.
Table 8-1―Average number of food instruments issued per participant per month
CA CT NCa OH OK TXNumber
All participants 4.6 4.4 2.5 4.1 2.5 2.4All women 5.8 4.5 2.7 4.1 2.6 2.8Infantsb 1.2 3.4 1.8 4.2 1.0 1.0Children 5.1 4.9 2.8 4.1 2.8 2.7
a The North Carolina data represent about 80 percent of all WIC participants within the State.
b Base includes infants who were breastfed and received no food instruments for the month.
Sources: State food instrument issuance and redemption data for November 2000.
With multiple instruments issued to each participant each month, and with most food prescriptionsincluding foods from multiple categories, States have flexibility in how to structure each food instru-ment. In California and Texas, most instruments were for a single food category (for instance, justmilk or infant formula). In the other four States, most food instruments contained prescriptions formultiple food categories. To illustrate, table 8-2 displays the most commonly issued food instrumentsin the six States, identified by the food categories listed on the instrument. Each table entry indicatesthe percentage of that State’s instruments issued for a specific food category or group of categories.Thus, for example, 27.8 percent of all California food instruments issued for November 2000 were for
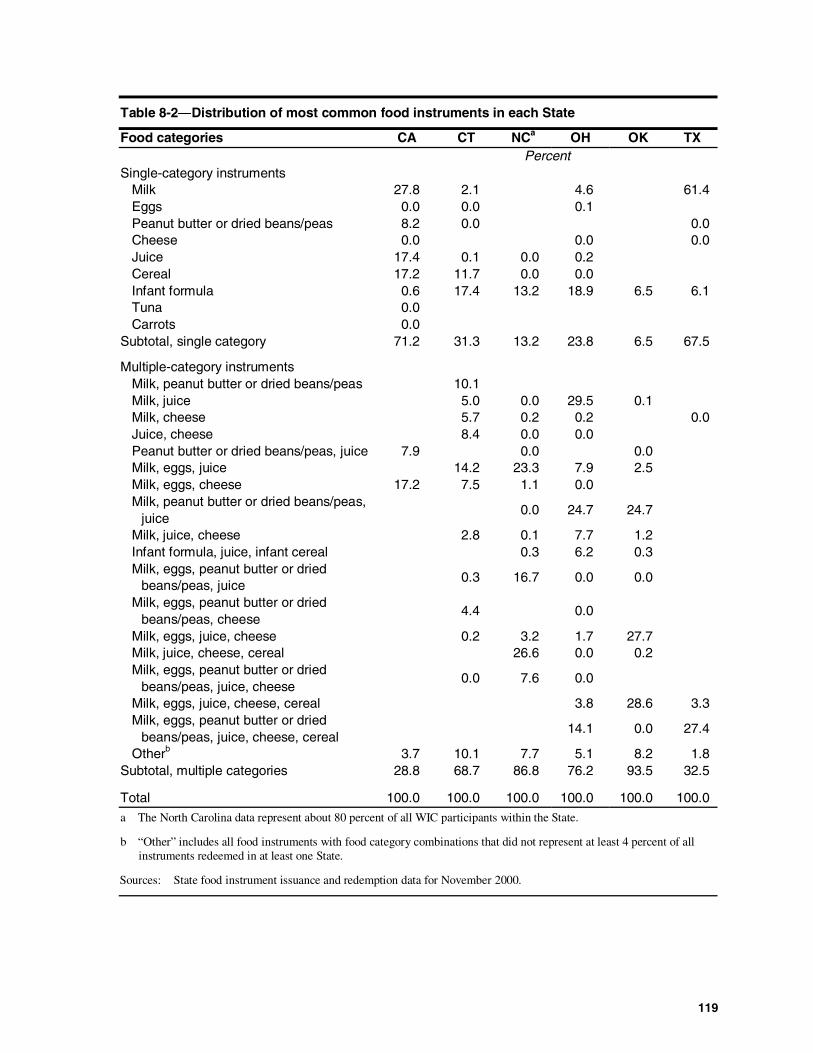
119
Table 8-2―Distribution of most common food instruments in each State
Food categories CA CT NCa OH OK TXPercent
Single-category instrumentsMilk 27.8 2.1 4.6 61.4Eggs 0.0 0.0 0.1Peanut butter or dried beans/peas 8.2 0.0 0.0Cheese 0.0 0.0 0.0Juice 17.4 0.1 0.0 0.2Cereal 17.2 11.7 0.0 0.0Infant formula 0.6 17.4 13.2 18.9 6.5 6.1Tuna 0.0Carrots 0.0
Subtotal, single category 71.2 31.3 13.2 23.8 6.5 67.5
Multiple-category instrumentsMilk, peanut butter or dried beans/peas 10.1Milk, juice 5.0 0.0 29.5 0.1Milk, cheese 5.7 0.2 0.2 0.0Juice, cheese 8.4 0.0 0.0Peanut butter or dried beans/peas, juice 7.9 0.0 0.0Milk, eggs, juice 14.2 23.3 7.9 2.5Milk, eggs, cheese 17.2 7.5 1.1 0.0Milk, peanut butter or dried beans/peas,
juice0.0 24.7 24.7
Milk, juice, cheese 2.8 0.1 7.7 1.2Infant formula, juice, infant cereal 0.3 6.2 0.3Milk, eggs, peanut butter or dried
beans/peas, juice0.3 16.7 0.0 0.0
Milk, eggs, peanut butter or driedbeans/peas, cheese
4.4 0.0
Milk, eggs, juice, cheese 0.2 3.2 1.7 27.7Milk, juice, cheese, cereal 26.6 0.0 0.2Milk, eggs, peanut butter or dried
beans/peas, juice, cheese0.0 7.6 0.0
Milk, eggs, juice, cheese, cereal 3.8 28.6 3.3Milk, eggs, peanut butter or dried
beans/peas, juice, cheese, cereal14.1 0.0 27.4
Otherb 3.7 10.1 7.7 5.1 8.2 1.8Subtotal, multiple categories 28.8 68.7 86.8 76.2 93.5 32.5
Total 100.0 100.0 100.0 100.0 100.0 100.0a The North Carolina data represent about 80 percent of all WIC participants within the State.
b “Other” includes all food instruments with food category combinations that did not represent at least 4 percent of allinstruments redeemed in at least one State.
Sources: State food instrument issuance and redemption data for November 2000.
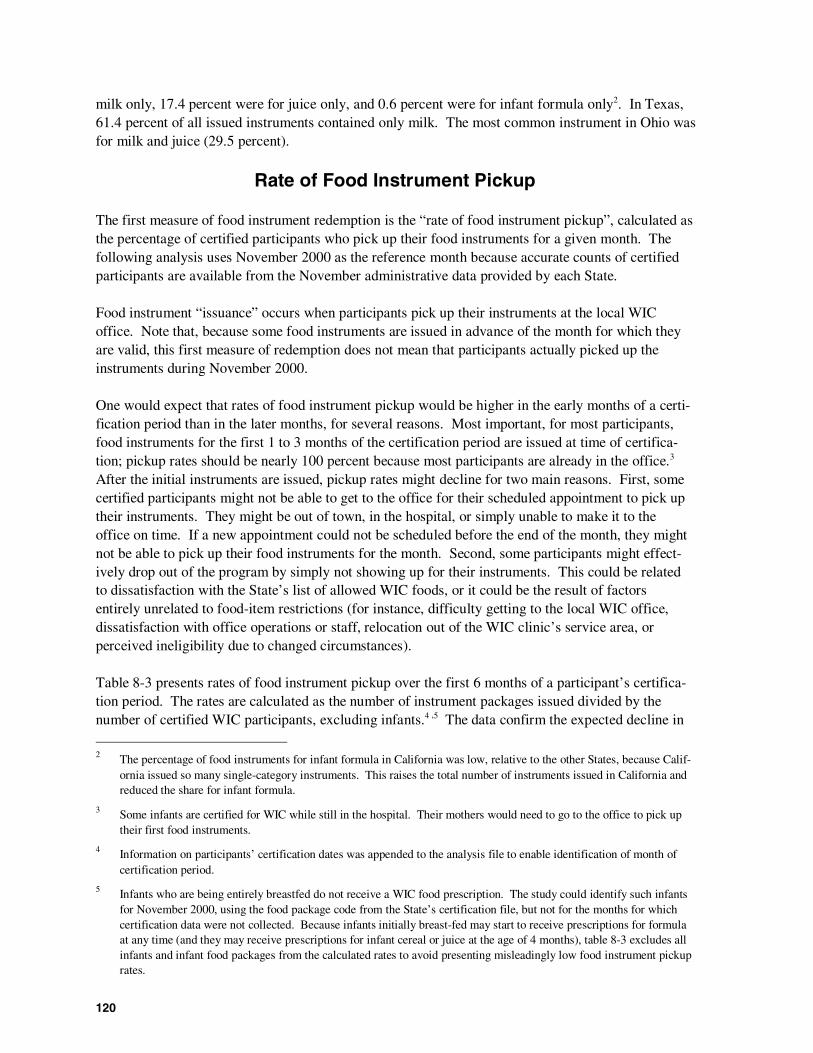
120
milk only, 17.4 percent were for juice only, and 0.6 percent were for infant formula only2. In Texas,61.4 percent of all issued instruments contained only milk. The most common instrument in Ohio wasfor milk and juice (29.5 percent).
Rate of Food Instrument Pickup
The first measure of food instrument redemption is the “rate of food instrument pickup”, calculated asthe percentage of certified participants who pick up their food instruments for a given month. Thefollowing analysis uses November 2000 as the reference month because accurate counts of certifiedparticipants are available from the November administrative data provided by each State.
Food instrument “issuance” occurs when participants pick up their instruments at the local WICoffice. Note that, because some food instruments are issued in advance of the month for which theyare valid, this first measure of redemption does not mean that participants actually picked up theinstruments during November 2000.
One would expect that rates of food instrument pickup would be higher in the early months of a certi-fication period than in the later months, for several reasons. Most important, for most participants,food instruments for the first 1 to 3 months of the certification period are issued at time of certifica-tion; pickup rates should be nearly 100 percent because most participants are already in the office.3
After the initial instruments are issued, pickup rates might decline for two main reasons. First, somecertified participants might not be able to get to the office for their scheduled appointment to pick uptheir instruments. They might be out of town, in the hospital, or simply unable to make it to theoffice on time. If a new appointment could not be scheduled before the end of the month, they mightnot be able to pick up their food instruments for the month. Second, some participants might effect-ively drop out of the program by simply not showing up for their instruments. This could be relatedto dissatisfaction with the State’s list of allowed WIC foods, or it could be the result of factorsentirely unrelated to food-item restrictions (for instance, difficulty getting to the local WIC office,dissatisfaction with office operations or staff, relocation out of the WIC clinic’s service area, orperceived ineligibility due to changed circumstances).
Table 8-3 presents rates of food instrument pickup over the first 6 months of a participant’s certifica-tion period. The rates are calculated as the number of instrument packages issued divided by thenumber of certified WIC participants, excluding infants.4 ,5 The data confirm the expected decline in
2 The percentage of food instruments for infant formula in California was low, relative to the other States, because Calif-ornia issued so many single-category instruments. This raises the total number of instruments issued in California andreduced the share for infant formula.
3 Some infants are certified for WIC while still in the hospital. Their mothers would need to go to the office to pick uptheir first food instruments.
4 Information on participants’ certification dates was appended to the analysis file to enable identification of month ofcertification period.
5 Infants who are being entirely breastfed do not receive a WIC food prescription. The study could identify such infantsfor November 2000, using the food package code from the State’s certification file, but not for the months for whichcertification data were not collected. Because infants initially breast-fed may start to receive prescriptions for formulaat any time (and they may receive prescriptions for infant cereal or juice at the age of 4 months), table 8-3 excludes allinfants and infant food packages from the calculated rates to avoid presenting misleadingly low food instrument pickuprates.
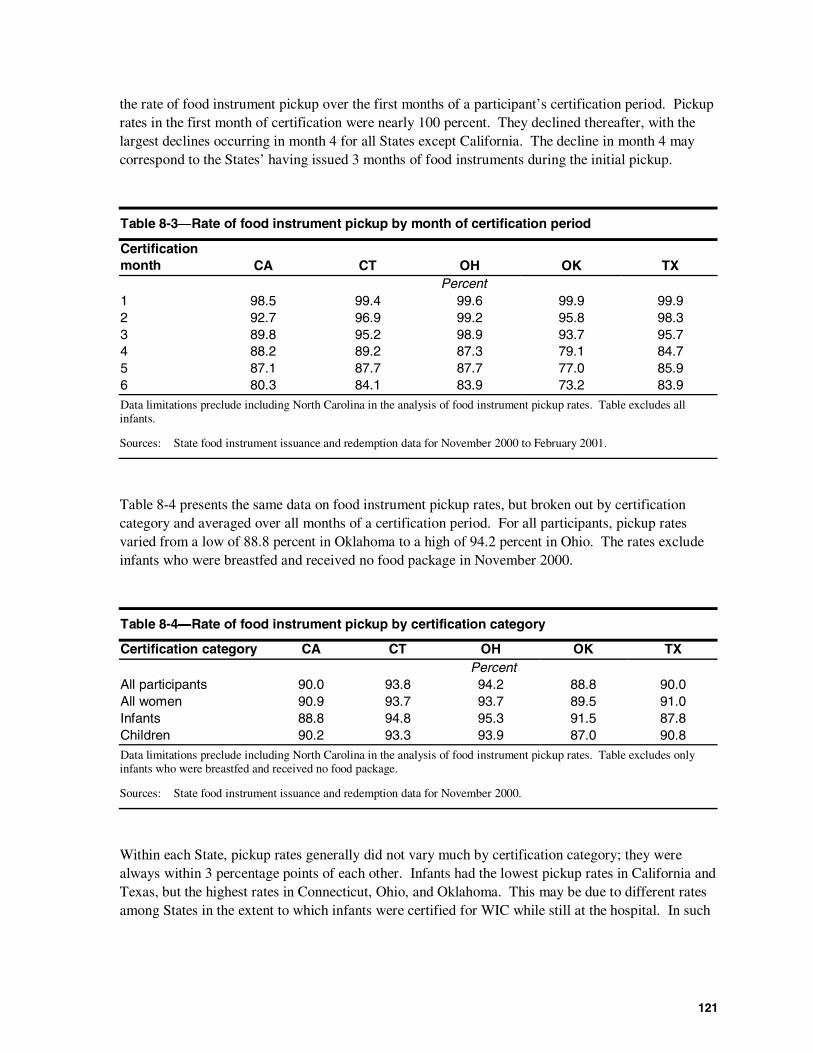
121
the rate of food instrument pickup over the first months of a participant’s certification period. Pickuprates in the first month of certification were nearly 100 percent. They declined thereafter, with thelargest declines occurring in month 4 for all States except California. The decline in month 4 maycorrespond to the States’ having issued 3 months of food instruments during the initial pickup.
Table 8-3―Rate of food instrument pickup by month of certification period
Certificationmonth CA CT OH OK TX
Percent1 98.5 99.4 99.6 99.9 99.92 92.7 96.9 99.2 95.8 98.33 89.8 95.2 98.9 93.7 95.74 88.2 89.2 87.3 79.1 84.75 87.1 87.7 87.7 77.0 85.96 80.3 84.1 83.9 73.2 83.9Data limitations preclude including North Carolina in the analysis of food instrument pickup rates. Table excludes allinfants.
Sources: State food instrument issuance and redemption data for November 2000 to February 2001.
Table 8-4 presents the same data on food instrument pickup rates, but broken out by certificationcategory and averaged over all months of a certification period. For all participants, pickup ratesvaried from a low of 88.8 percent in Oklahoma to a high of 94.2 percent in Ohio. The rates excludeinfants who were breastfed and received no food package in November 2000.
Table 8-4―Rate of food instrument pickup by certification category
Certification category CA CT OH OK TXPercent
All participants 90.0 93.8 94.2 88.8 90.0All women 90.9 93.7 93.7 89.5 91.0Infants 88.8 94.8 95.3 91.5 87.8Children 90.2 93.3 93.9 87.0 90.8Data limitations preclude including North Carolina in the analysis of food instrument pickup rates. Table excludes onlyinfants who were breastfed and received no food package.
Sources: State food instrument issuance and redemption data for November 2000.
Within each State, pickup rates generally did not vary much by certification category; they werealways within 3 percentage points of each other. Infants had the lowest pickup rates in California andTexas, but the highest rates in Connecticut, Ohio, and Oklahoma. This may be due to different ratesamong States in the extent to which infants were certified for WIC while still at the hospital. In such
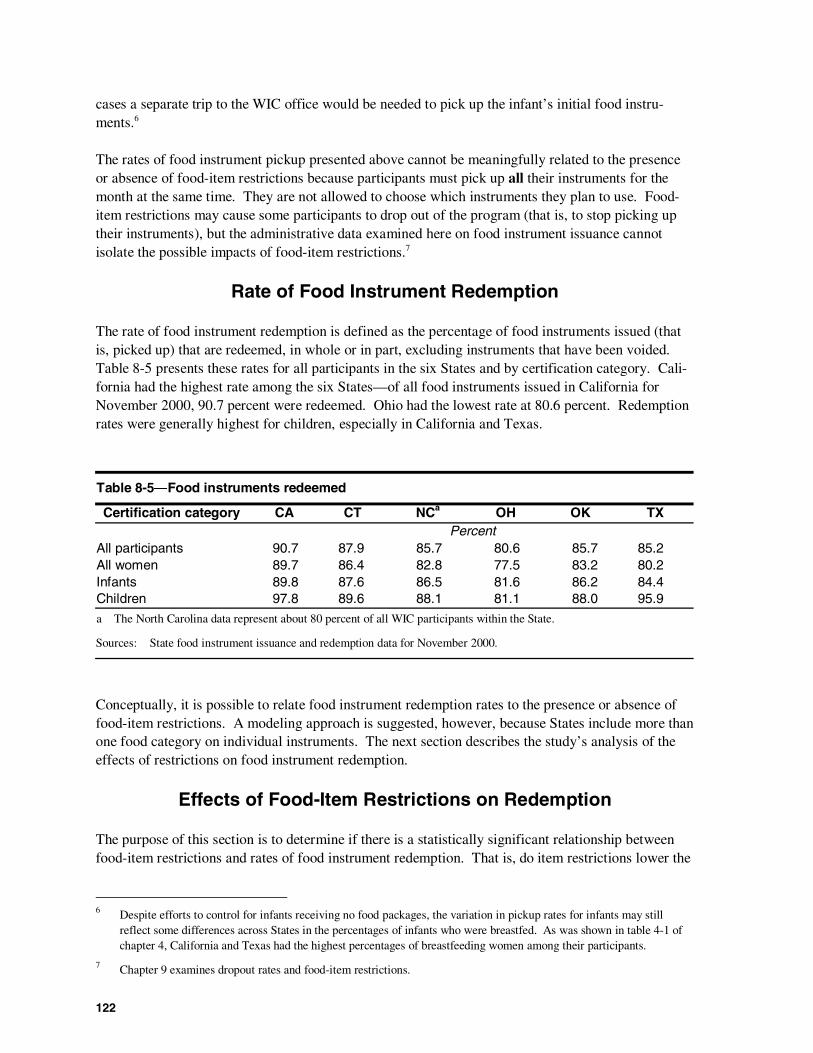
122
cases a separate trip to the WIC office would be needed to pick up the infant’s initial food instru-ments.6
The rates of food instrument pickup presented above cannot be meaningfully related to the presenceor absence of food-item restrictions because participants must pick up all their instruments for themonth at the same time. They are not allowed to choose which instruments they plan to use. Food-item restrictions may cause some participants to drop out of the program (that is, to stop picking uptheir instruments), but the administrative data examined here on food instrument issuance cannotisolate the possible impacts of food-item restrictions.7
Rate of Food Instrument Redemption
The rate of food instrument redemption is defined as the percentage of food instruments issued (thatis, picked up) that are redeemed, in whole or in part, excluding instruments that have been voided.Table 8-5 presents these rates for all participants in the six States and by certification category. Cali-fornia had the highest rate among the six States—of all food instruments issued in California forNovember 2000, 90.7 percent were redeemed. Ohio had the lowest rate at 80.6 percent. Redemptionrates were generally highest for children, especially in California and Texas.
Table 8-5―Food instruments redeemed
Certification category CA CT NCa OH OK TXPercent
All participants 90.7 87.9 85.7 80.6 85.7 85.2All women 89.7 86.4 82.8 77.5 83.2 80.2Infants 89.8 87.6 86.5 81.6 86.2 84.4Children 97.8 89.6 88.1 81.1 88.0 95.9
a The North Carolina data represent about 80 percent of all WIC participants within the State.
Sources: State food instrument issuance and redemption data for November 2000.
Conceptually, it is possible to relate food instrument redemption rates to the presence or absence offood-item restrictions. A modeling approach is suggested, however, because States include more thanone food category on individual instruments. The next section describes the study’s analysis of theeffects of restrictions on food instrument redemption.
Effects of Food-Item Restrictions on Redemption
The purpose of this section is to determine if there is a statistically significant relationship betweenfood-item restrictions and rates of food instrument redemption. That is, do item restrictions lower the
6 Despite efforts to control for infants receiving no food packages, the variation in pickup rates for infants may stillreflect some differences across States in the percentages of infants who were breastfed. As was shown in table 4-1 ofchapter 4, California and Texas had the highest percentages of breastfeeding women among their participants.
7 Chapter 9 examines dropout rates and food-item restrictions.
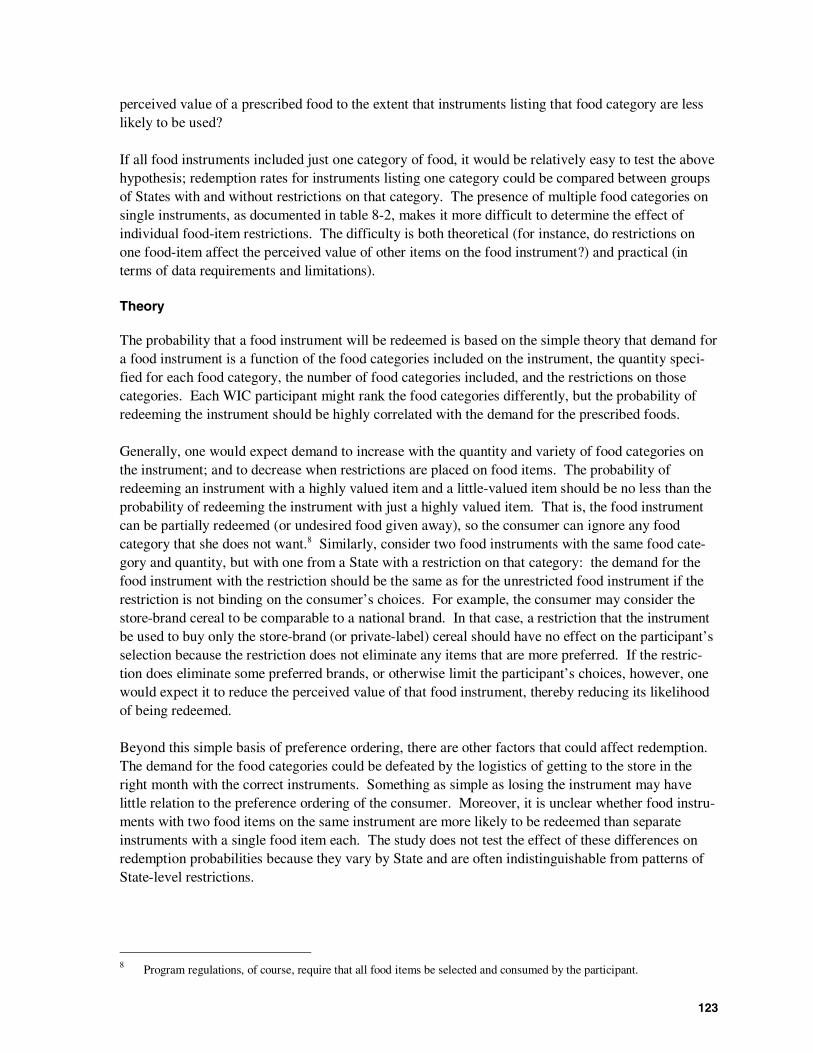
123
perceived value of a prescribed food to the extent that instruments listing that food category are lesslikely to be used?
If all food instruments included just one category of food, it would be relatively easy to test the abovehypothesis; redemption rates for instruments listing one category could be compared between groupsof States with and without restrictions on that category. The presence of multiple food categories onsingle instruments, as documented in table 8-2, makes it more difficult to determine the effect ofindividual food-item restrictions. The difficulty is both theoretical (for instance, do restrictions onone food-item affect the perceived value of other items on the food instrument?) and practical (interms of data requirements and limitations).
Theory
The probability that a food instrument will be redeemed is based on the simple theory that demand fora food instrument is a function of the food categories included on the instrument, the quantity speci-fied for each food category, the number of food categories included, and the restrictions on thosecategories. Each WIC participant might rank the food categories differently, but the probability ofredeeming the instrument should be highly correlated with the demand for the prescribed foods.
Generally, one would expect demand to increase with the quantity and variety of food categories onthe instrument; and to decrease when restrictions are placed on food items. The probability ofredeeming an instrument with a highly valued item and a little-valued item should be no less than theprobability of redeeming the instrument with just a highly valued item. That is, the food instrumentcan be partially redeemed (or undesired food given away), so the consumer can ignore any foodcategory that she does not want.8 Similarly, consider two food instruments with the same food cate-gory and quantity, but with one from a State with a restriction on that category: the demand for thefood instrument with the restriction should be the same as for the unrestricted food instrument if therestriction is not binding on the consumer’s choices. For example, the consumer may consider thestore-brand cereal to be comparable to a national brand. In that case, a restriction that the instrumentbe used to buy only the store-brand (or private-label) cereal should have no effect on the participant’sselection because the restriction does not eliminate any items that are more preferred. If the restric-tion does eliminate some preferred brands, or otherwise limit the participant’s choices, however, onewould expect it to reduce the perceived value of that food instrument, thereby reducing its likelihoodof being redeemed.
Beyond this simple basis of preference ordering, there are other factors that could affect redemption.The demand for the food categories could be defeated by the logistics of getting to the store in theright month with the correct instruments. Something as simple as losing the instrument may havelittle relation to the preference ordering of the consumer. Moreover, it is unclear whether food instru-ments with two food items on the same instrument are more likely to be redeemed than separateinstruments with a single food item each. The study does not test the effect of these differences onredemption probabilities because they vary by State and are often indistinguishable from patterns ofState-level restrictions.
8 Program regulations, of course, require that all food items be selected and consumed by the participant.
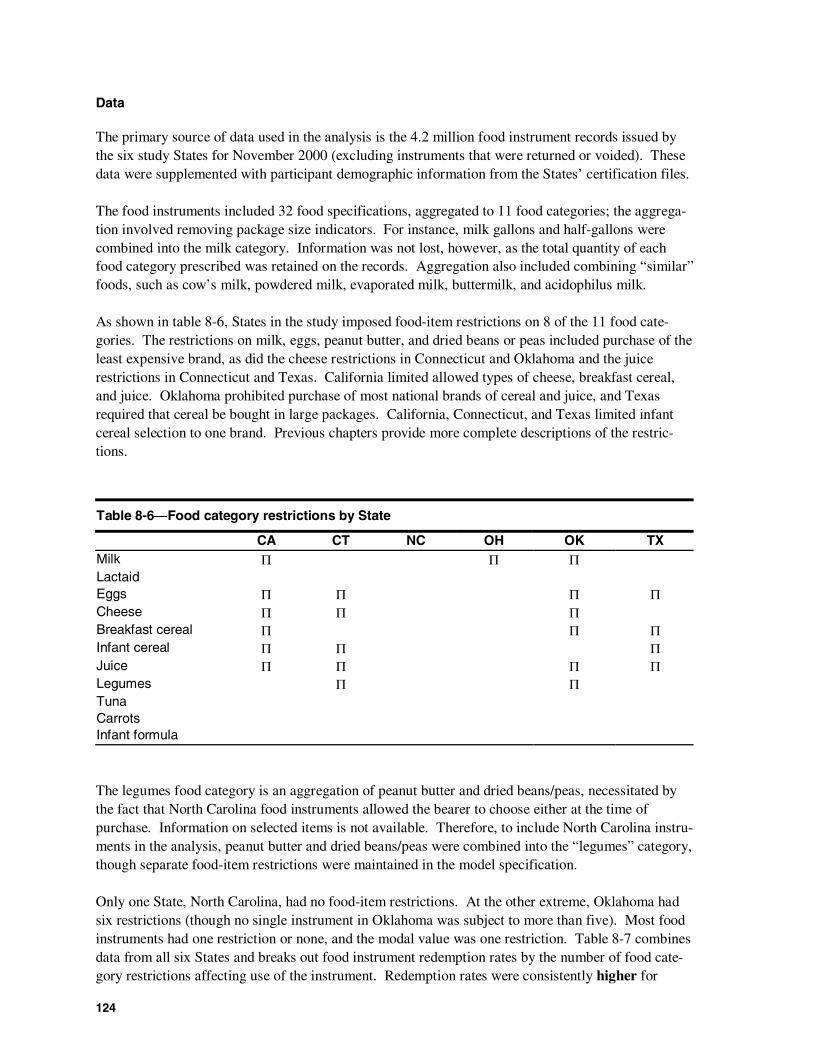
124
Data
The primary source of data used in the analysis is the 4.2 million food instrument records issued bythe six study States for November 2000 (excluding instruments that were returned or voided). Thesedata were supplemented with participant demographic information from the States’ certification files.
The food instruments included 32 food specifications, aggregated to 11 food categories; the aggrega-tion involved removing package size indicators. For instance, milk gallons and half-gallons werecombined into the milk category. Information was not lost, however, as the total quantity of eachfood category prescribed was retained on the records. Aggregation also included combining “similar”foods, such as cow’s milk, powdered milk, evaporated milk, buttermilk, and acidophilus milk.
As shown in table 8-6, States in the study imposed food-item restrictions on 8 of the 11 food cate-gories. The restrictions on milk, eggs, peanut butter, and dried beans or peas included purchase of theleast expensive brand, as did the cheese restrictions in Connecticut and Oklahoma and the juicerestrictions in Connecticut and Texas. California limited allowed types of cheese, breakfast cereal,and juice. Oklahoma prohibited purchase of most national brands of cereal and juice, and Texasrequired that cereal be bought in large packages. California, Connecticut, and Texas limited infantcereal selection to one brand. Previous chapters provide more complete descriptions of the restric-tions.
Table 8-6―Food category restrictions by State
CA CT NC OH OK TXMilk Π Π ΠLactaidEggs Π Π Π ΠCheese Π Π ΠBreakfast cereal Π Π ΠInfant cereal Π Π ΠJuice Π Π Π ΠLegumes Π ΠTunaCarrotsInfant formula
The legumes food category is an aggregation of peanut butter and dried beans/peas, necessitated bythe fact that North Carolina food instruments allowed the bearer to choose either at the time ofpurchase. Information on selected items is not available. Therefore, to include North Carolina instru-ments in the analysis, peanut butter and dried beans/peas were combined into the “legumes” category,though separate food-item restrictions were maintained in the model specification.
Only one State, North Carolina, had no food-item restrictions. At the other extreme, Oklahoma hadsix restrictions (though no single instrument in Oklahoma was subject to more than five). Most foodinstruments had one restriction or none, and the modal value was one restriction. Table 8-7 combinesdata from all six States and breaks out food instrument redemption rates by the number of food cate-gory restrictions affecting use of the instrument. Redemption rates were consistently higher for
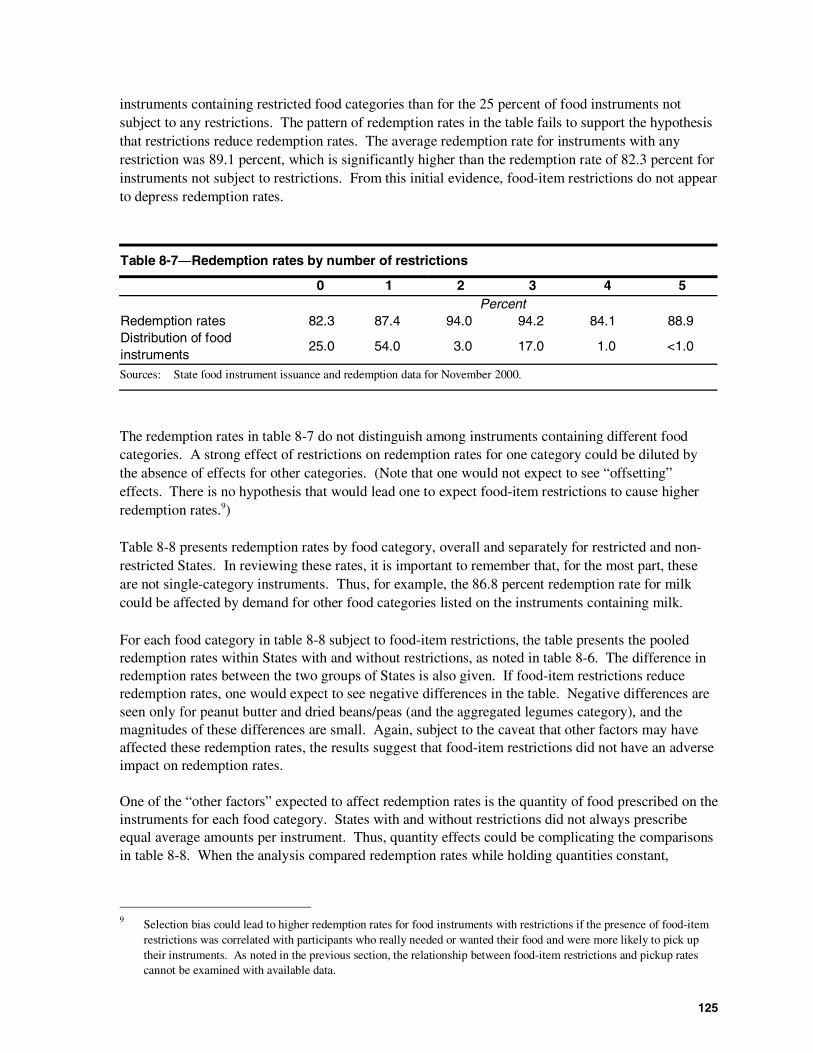
125
instruments containing restricted food categories than for the 25 percent of food instruments notsubject to any restrictions. The pattern of redemption rates in the table fails to support the hypothesisthat restrictions reduce redemption rates. The average redemption rate for instruments with anyrestriction was 89.1 percent, which is significantly higher than the redemption rate of 82.3 percent forinstruments not subject to restrictions. From this initial evidence, food-item restrictions do not appearto depress redemption rates.
Table 8-7―Redemption rates by number of restrictions
0 1 2 3 4 5Percent
Redemption rates 82.3 87.4 94.0 94.2 84.1 88.9Distribution of foodinstruments
25.0 54.0 3.0 17.0 1.0 <1.0
Sources: State food instrument issuance and redemption data for November 2000.
The redemption rates in table 8-7 do not distinguish among instruments containing different foodcategories. A strong effect of restrictions on redemption rates for one category could be diluted bythe absence of effects for other categories. (Note that one would not expect to see “offsetting”effects. There is no hypothesis that would lead one to expect food-item restrictions to cause higherredemption rates.9)
Table 8-8 presents redemption rates by food category, overall and separately for restricted and non-restricted States. In reviewing these rates, it is important to remember that, for the most part, theseare not single-category instruments. Thus, for example, the 86.8 percent redemption rate for milkcould be affected by demand for other food categories listed on the instruments containing milk.
For each food category in table 8-8 subject to food-item restrictions, the table presents the pooledredemption rates within States with and without restrictions, as noted in table 8-6. The difference inredemption rates between the two groups of States is also given. If food-item restrictions reduceredemption rates, one would expect to see negative differences in the table. Negative differences areseen only for peanut butter and dried beans/peas (and the aggregated legumes category), and themagnitudes of these differences are small. Again, subject to the caveat that other factors may haveaffected these redemption rates, the results suggest that food-item restrictions did not have an adverseimpact on redemption rates.
One of the “other factors” expected to affect redemption rates is the quantity of food prescribed on theinstruments for each food category. States with and without restrictions did not always prescribeequal average amounts per instrument. Thus, quantity effects could be complicating the comparisonsin table 8-8. When the analysis compared redemption rates while holding quantities constant,
9 Selection bias could lead to higher redemption rates for food instruments with restrictions if the presence of food-itemrestrictions was correlated with participants who really needed or wanted their food and were more likely to pick uptheir instruments. As noted in the previous section, the relationship between food-item restrictions and pickup ratescannot be examined with available data.
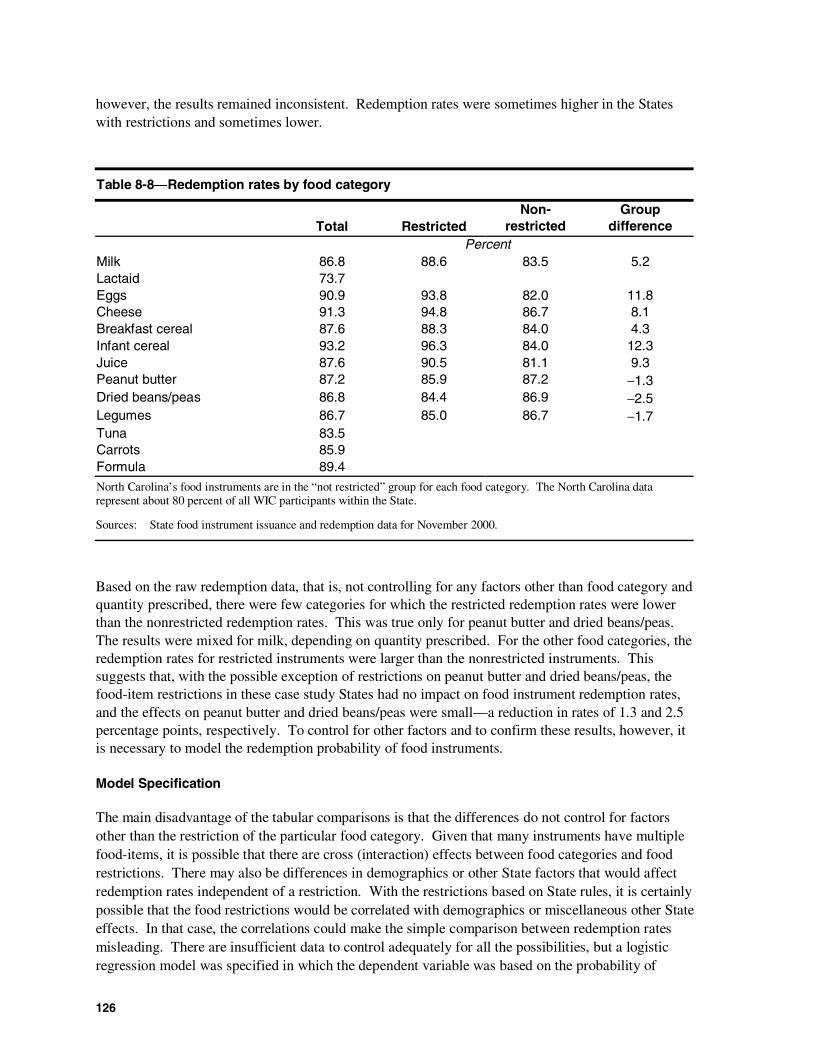
126
however, the results remained inconsistent. Redemption rates were sometimes higher in the Stateswith restrictions and sometimes lower.
Table 8-8―Redemption rates by food category
Total RestrictedNon-
restrictedGroup
differencePercent
Milk 86.8 88.6 83.5 5.2Lactaid 73.7Eggs 90.9 93.8 82.0 11.8Cheese 91.3 94.8 86.7 8.1Breakfast cereal 87.6 88.3 84.0 4.3Infant cereal 93.2 96.3 84.0 12.3Juice 87.6 90.5 81.1 9.3Peanut butter 87.2 85.9 87.2 −1.3Dried beans/peas 86.8 84.4 86.9 −2.5Legumes 86.7 85.0 86.7 −1.7Tuna 83.5Carrots 85.9Formula 89.4
North Carolina’s food instruments are in the “not restricted” group for each food category. The North Carolina datarepresent about 80 percent of all WIC participants within the State.
Sources: State food instrument issuance and redemption data for November 2000.
Based on the raw redemption data, that is, not controlling for any factors other than food category andquantity prescribed, there were few categories for which the restricted redemption rates were lowerthan the nonrestricted redemption rates. This was true only for peanut butter and dried beans/peas.The results were mixed for milk, depending on quantity prescribed. For the other food categories, theredemption rates for restricted instruments were larger than the nonrestricted instruments. Thissuggests that, with the possible exception of restrictions on peanut butter and dried beans/peas, thefood-item restrictions in these case study States had no impact on food instrument redemption rates,and the effects on peanut butter and dried beans/peas were small—a reduction in rates of 1.3 and 2.5percentage points, respectively. To control for other factors and to confirm these results, however, itis necessary to model the redemption probability of food instruments.
Model Specification
The main disadvantage of the tabular comparisons is that the differences do not control for factorsother than the restriction of the particular food category. Given that many instruments have multiplefood-items, it is possible that there are cross (interaction) effects between food categories and foodrestrictions. There may also be differences in demographics or other State factors that would affectredemption rates independent of a restriction. With the restrictions based on State rules, it is certainlypossible that the food restrictions would be correlated with demographics or miscellaneous other Stateeffects. In that case, the correlations could make the simple comparison between redemption ratesmisleading. There are insufficient data to control adequately for all the possibilities, but a logisticregression model was specified in which the dependent variable was based on the probability of
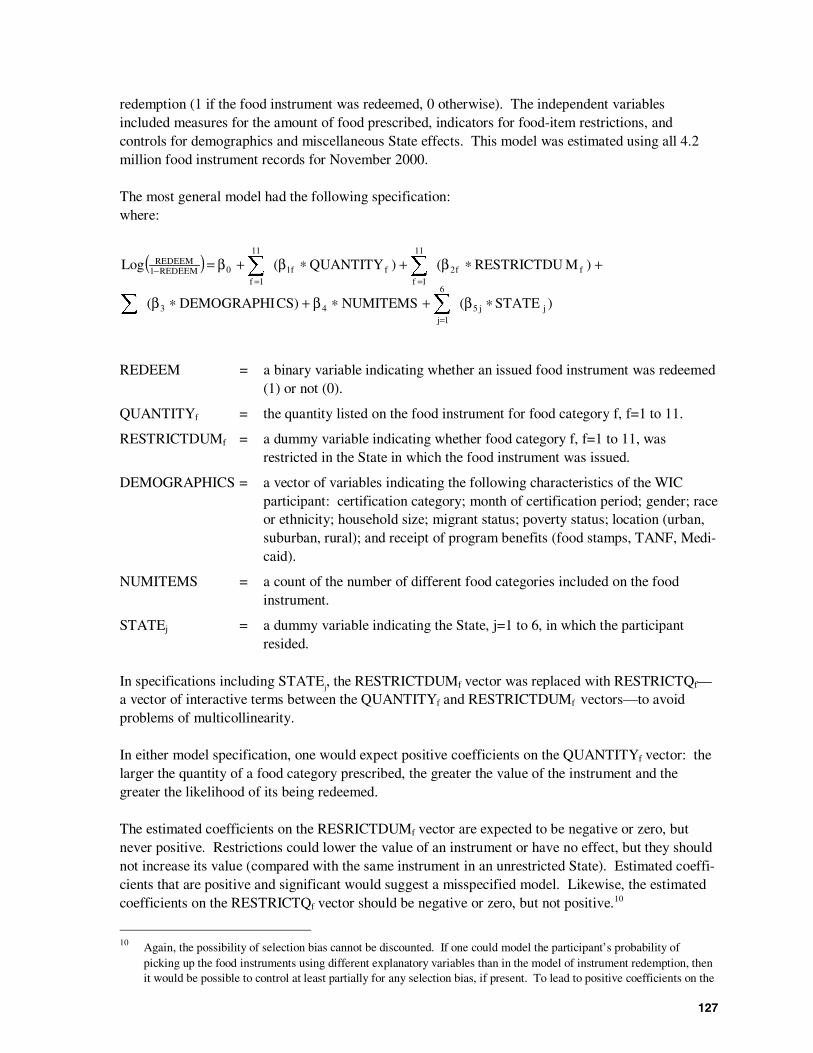
127
redemption (1 if the food instrument was redeemed, 0 otherwise). The independent variablesincluded measures for the amount of food prescribed, indicators for food-item restrictions, andcontrols for demographics and miscellaneous State effects. This model was estimated using all 4.2million food instrument records for November 2000.
The most general model had the following specification:where:
REDEEM = a binary variable indicating whether an issued food instrument was redeemed(1) or not (0).
QUANTITYf = the quantity listed on the food instrument for food category f, f=1 to 11.
RESTRICTDUMf = a dummy variable indicating whether food category f, f=1 to 11, wasrestricted in the State in which the food instrument was issued.
DEMOGRAPHICS = a vector of variables indicating the following characteristics of the WICparticipant: certification category; month of certification period; gender; raceor ethnicity; household size; migrant status; poverty status; location (urban,suburban, rural); and receipt of program benefits (food stamps, TANF, Medi-caid).
NUMITEMS = a count of the number of different food categories included on the foodinstrument.
STATEj = a dummy variable indicating the State, j=1 to 6, in which the participantresided.
In specifications including STATEj, the RESTRICTDUMf vector was replaced with RESTRICTQf—
a vector of interactive terms between the QUANTITYf and RESTRICTDUMf vectors—to avoidproblems of multicollinearity.
In either model specification, one would expect positive coefficients on the QUANTITYf vector: thelarger the quantity of a food category prescribed, the greater the value of the instrument and thegreater the likelihood of its being redeemed.
The estimated coefficients on the RESRICTDUMf vector are expected to be negative or zero, butnever positive. Restrictions could lower the value of an instrument or have no effect, but they shouldnot increase its value (compared with the same instrument in an unrestricted State). Estimated coeffi-cients that are positive and significant would suggest a misspecified model. Likewise, the estimatedcoefficients on the RESTRICTQf vector should be negative or zero, but not positive.10
10 Again, the possibility of selection bias cannot be discounted. If one could model the participant’s probability ofpicking up the food instruments using different explanatory variables than in the model of instrument redemption, thenit would be possible to control at least partially for any selection bias, if present. To lead to positive coefficients on the
( )
)STATE(NUMITEMS)CSDEMOGRAPHI(
)MRESTRICTDU()QUANTITY(Log
jj5
6
1j43
ff2
11
1fff1
11
1f0REDEEM1
REDEEM
∗β+∗β+∗β
+∗β+∗β+β=
∑∑
∑∑
=
==−
128
Analysis Results
The results of the modeling effort are not reported here because, in general, the different model speci-fications were not robust. With such large sample sizes, it was easy to get statistically significantresults, but the signs of the coefficients were extremely sensitive to the model specification. Moreproblematic, there was no consistent support for the theory that food quantities have positive coeffi-cients and food restrictions have zero or negative coefficients.
The results from the pooled data were further tested by estimating separate logistic regressions on thesubset of instruments for each food category. For most food categories, the model specificationincluded the full set of food quantities and restrictions because there were instruments with nearlyevery combination of food-items. Again, the signs of the coefficients were sensitive to the specifica-tion. It was not uncommon for the sign on the restriction coefficient to change depending on whetherthe single restriction was included or the full set of restrictions.
Despite extensive specification searching and regression experimentation, the study was unable tofind evidence of a consistent negative effect from the food restrictions on instrument redemption.The problem of inconsistent findings is largely a data problem. It is difficult to control for State-leveleffects when food-item restrictions are applied statewide. There is also a likely omitted-variablesproblem in the specification—a variable that decreases redemption rates that has different values inthe unrestricted States than in the restricted States.
Partial Redemption of Food Instruments
The last component of the redemption analysis addresses whether participants purchase items from allfood categories listed on the food instrument. For single-category instruments, partial redemptionwould mean that only part of the total quantity listed on the instrument was obtained. For multiple-category instruments, partial redemption could mean either that some foods were not selected at all,or that the full quantities of one or more listed foods were not purchased.11
The food instrument data do not indicate whether food items for all listed categories were selected.The only data available to examine possible partial redemptions are responses to survey questions thatasked respondents whether they purchased all the items prescribed for them or their WIC childrenwithin each food category. These data, originally presented in chapter 6 in a different format, arepresented again in table 8-9. Table entries provide the percentage of respondents who did notpurchase all the food, by category, prescribed for their family for a month.
RESTRICTDUMf or RESTRICTQf vectors, however, the probability of picking up food instruments would have to bepositively related with the presence of restrictions, an unlikely behavioral response.
11 Focus group participants in several States, however, said that store personnel insisted that all foods and quantities listedon a food instrument be selected before ringing up the WIC items.
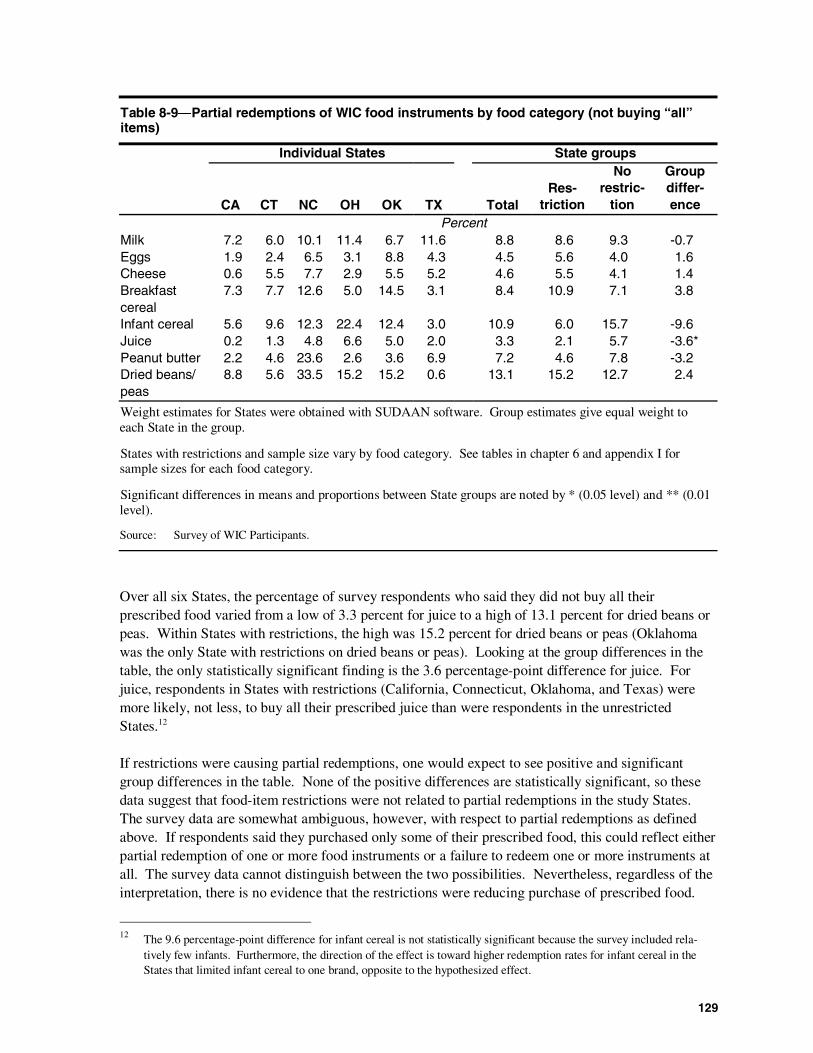
129
Table 8-9―Partial redemptions of WIC food instruments by food category (not buying “all”items)
Individual States State groups
CA CT NC OH OK TX TotalRes-
triction
Norestric-
tion
Groupdiffer-ence
PercentMilk 7.2 6.0 10.1 11.4 6.7 11.6 8.8 8.6 9.3 -0.7Eggs 1.9 2.4 6.5 3.1 8.8 4.3 4.5 5.6 4.0 1.6Cheese 0.6 5.5 7.7 2.9 5.5 5.2 4.6 5.5 4.1 1.4Breakfastcereal
7.3 7.7 12.6 5.0 14.5 3.1 8.4 10.9 7.1 3.8
Infant cereal 5.6 9.6 12.3 22.4 12.4 3.0 10.9 6.0 15.7 -9.6Juice 0.2 1.3 4.8 6.6 5.0 2.0 3.3 2.1 5.7 -3.6*Peanut butter 2.2 4.6 23.6 2.6 3.6 6.9 7.2 4.6 7.8 -3.2Dried beans/peas
8.8 5.6 33.5 15.2 15.2 0.6 13.1 15.2 12.7 2.4
Weight estimates for States were obtained with SUDAAN software. Group estimates give equal weight toeach State in the group.
States with restrictions and sample size vary by food category. See tables in chapter 6 and appendix I forsample sizes for each food category.
Significant differences in means and proportions between State groups are noted by * (0.05 level) and ** (0.01level).
Source: Survey of WIC Participants.
Over all six States, the percentage of survey respondents who said they did not buy all theirprescribed food varied from a low of 3.3 percent for juice to a high of 13.1 percent for dried beans orpeas. Within States with restrictions, the high was 15.2 percent for dried beans or peas (Oklahomawas the only State with restrictions on dried beans or peas). Looking at the group differences in thetable, the only statistically significant finding is the 3.6 percentage-point difference for juice. Forjuice, respondents in States with restrictions (California, Connecticut, Oklahoma, and Texas) weremore likely, not less, to buy all their prescribed juice than were respondents in the unrestrictedStates.12
If restrictions were causing partial redemptions, one would expect to see positive and significantgroup differences in the table. None of the positive differences are statistically significant, so thesedata suggest that food-item restrictions were not related to partial redemptions in the study States.The survey data are somewhat ambiguous, however, with respect to partial redemptions as definedabove. If respondents said they purchased only some of their prescribed food, this could reflect eitherpartial redemption of one or more food instruments or a failure to redeem one or more instruments atall. The survey data cannot distinguish between the two possibilities. Nevertheless, regardless of theinterpretation, there is no evidence that the restrictions were reducing purchase of prescribed food.
12 The 9.6 percentage-point difference for infant cereal is not statistically significant because the survey included rela-tively few infants. Furthermore, the direction of the effect is toward higher redemption rates for infant cereal in theStates that limited infant cereal to one brand, opposite to the hypothesized effect.
130
Conclusions
Given the inconsistency of both the tabular and modeling results, there is no convincing evidence thatState restrictions on food-items reduced rates of food instrument redemption. The tabular resultsshow that redemption rates were often higher in States with restrictions than those without, and themodeling effort failed to resolve this discrepancy. The positive and significant model coefficientsobserved for some restrictions suggest that factors not captured in the models, but correlated with thepresence of restrictions, explain the likelihood that a food instrument will be redeemed.
If food-item restrictions did reduce the likelihood of a food instrument’s being redeemed, the modelresults suggest that the effect must have been small; otherwise, the results would have been moreconsistent. This finding is corroborated by the information collected by the Survey of WICParticipants and presented in chapter 6—very few survey respondents, when faced with restrictions,said they did not purchase all of their prescribed food because they did not like the item.
131
Chapter 9Program Participation
Cost-containment practices can negatively affect WIC participation levels in several ways. First, if aState’s use of competitive pricing criteria at application reduces the number of authorized vendorsand makes it difficult or inconvenient for participants to travel to a WIC-authorized outlet, some ofthem may become dissatisfied with the program and either stop participating (by not picking up orredeeming their food instruments) or not seek recertification at the end of their certification period.Second, food-item restrictions may have similar effects if participants are dissatisfied with the choiceson their State’s list of approved foods. Third, through word of mouth, participant dissatisfaction witha reduced availability of vendors or foods associated with cost-containment practices might keepotherwise-eligible individuals from applying for program benefits.
Research Approach
This chapter examines the possible effects of vendor and food-item restrictions on WIC programparticipation by examining the incidence of participants in the six case study States who “droppedout” of WIC. Focus groups with participants who stopped picking up their food instruments thenprobed the extent to which different cost-containment practices may have influenced the decision tostop participating.
It is beyond the scope of this study to estimate the degree to which cost-containment practices mayhave kept otherwise-eligible individuals from applying to WIC. Based on the findings presented inearlier chapters, however, and especially the survey results on participant satisfaction found in chapter6, there is little evidence that cost-containment practices had any measurable adverse impact onprogram application rates in the case study States.
WIC Program Dropouts
The study defined and identified WIC program “dropouts” as WIC participants who failed to pick uptheir WIC food instruments for two consecutive months during the six months prior to November2000. That is, they missed a scheduled food instrument issuance and did not pick up the instrumentswithin 60 days, regardless of whether they were supposed to pick up a one-, two-, or three-monthsupply at the time. This definition does not preclude identifying as dropouts participants who laterreturned to the program. For instance, a participant could have failed to pick up her food instrumentsin September and October 2000, but then picked up new instruments in November.
Food instrument issuance data are recorded at WIC service sites and maintained in the State’s infor-mation system. Given the variations in the information maintained on each State’s system, the studycould not use the same definition for dropouts in California as in the other States. Dropouts in Cali-fornia could only be identified as those participants who failed to pick up their most recent issuance.
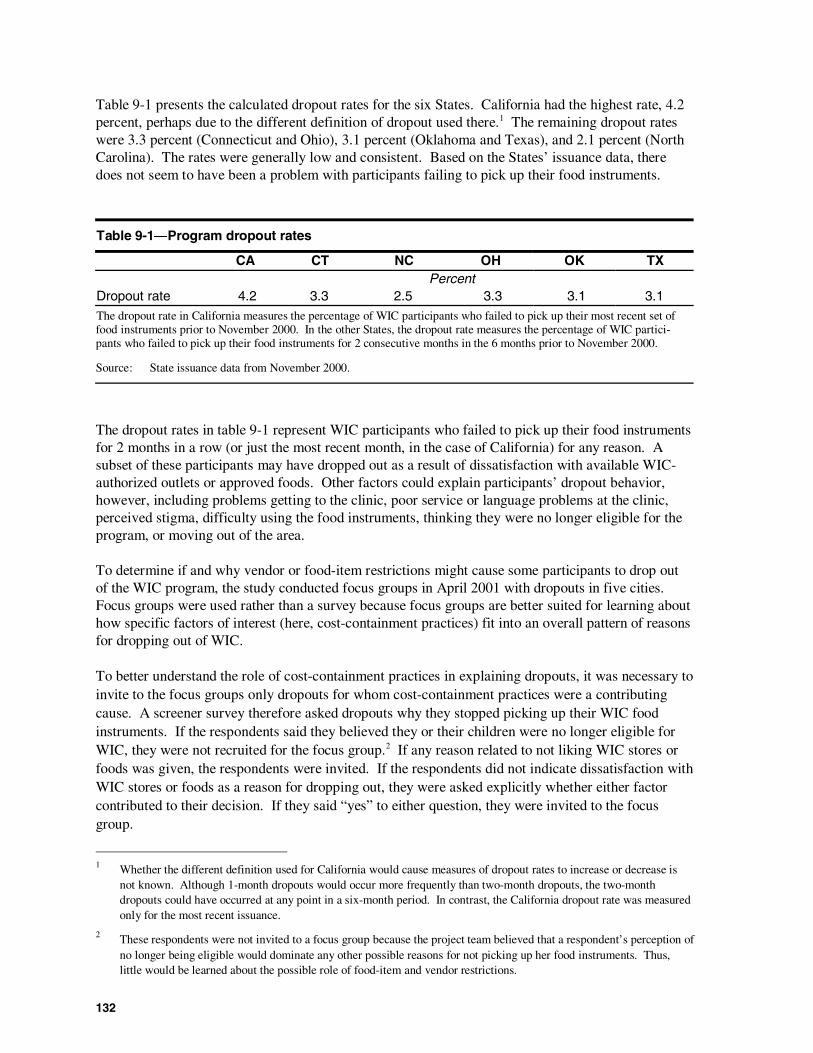
132
Table 9-1 presents the calculated dropout rates for the six States. California had the highest rate, 4.2percent, perhaps due to the different definition of dropout used there.1 The remaining dropout rateswere 3.3 percent (Connecticut and Ohio), 3.1 percent (Oklahoma and Texas), and 2.1 percent (NorthCarolina). The rates were generally low and consistent. Based on the States’ issuance data, theredoes not seem to have been a problem with participants failing to pick up their food instruments.
Table 9-1―Program dropout rates
CA CT NC OH OK TXPercent
Dropout rate 4.2 3.3 2.5 3.3 3.1 3.1The dropout rate in California measures the percentage of WIC participants who failed to pick up their most recent set offood instruments prior to November 2000. In the other States, the dropout rate measures the percentage of WIC partici-pants who failed to pick up their food instruments for 2 consecutive months in the 6 months prior to November 2000.
Source: State issuance data from November 2000.
The dropout rates in table 9-1 represent WIC participants who failed to pick up their food instrumentsfor 2 months in a row (or just the most recent month, in the case of California) for any reason. Asubset of these participants may have dropped out as a result of dissatisfaction with available WIC-authorized outlets or approved foods. Other factors could explain participants’ dropout behavior,however, including problems getting to the clinic, poor service or language problems at the clinic,perceived stigma, difficulty using the food instruments, thinking they were no longer eligible for theprogram, or moving out of the area.
To determine if and why vendor or food-item restrictions might cause some participants to drop outof the WIC program, the study conducted focus groups in April 2001 with dropouts in five cities.Focus groups were used rather than a survey because focus groups are better suited for learning abouthow specific factors of interest (here, cost-containment practices) fit into an overall pattern of reasonsfor dropping out of WIC.
To better understand the role of cost-containment practices in explaining dropouts, it was necessary toinvite to the focus groups only dropouts for whom cost-containment practices were a contributingcause. A screener survey therefore asked dropouts why they stopped picking up their WIC foodinstruments. If the respondents said they believed they or their children were no longer eligible forWIC, they were not recruited for the focus group.2 If any reason related to not liking WIC stores orfoods was given, the respondents were invited. If the respondents did not indicate dissatisfaction withWIC stores or foods as a reason for dropping out, they were asked explicitly whether either factorcontributed to their decision. If they said “yes” to either question, they were invited to the focusgroup.
1 Whether the different definition used for California would cause measures of dropout rates to increase or decrease isnot known. Although 1-month dropouts would occur more frequently than two-month dropouts, the two-monthdropouts could have occurred at any point in a six-month period. In contrast, the California dropout rate was measuredonly for the most recent issuance.
2 These respondents were not invited to a focus group because the project team believed that a respondent’s perception ofno longer being eligible would dominate any other possible reasons for not picking up her food instruments. Thus,little would be learned about the possible role of food-item and vendor restrictions.
133
The plan was to have 8 to 9 WIC dropouts in each State attend a focus group session. For reasonsdescribed below, it was not possible to conduct a focus group in Hartford, CT, so two focus groupswere held in Los Angeles, CA. Other focus group sites were Charlotte, NC; Houston, TX; OklahomaCity, OK; and Cleveland, OH. It was not always possible to find enough WIC participants in a singlecity in each State who met the screening criteria (which included speaking English), despite selectionof the city in each State with the largest number of identified dropouts. A total of 34 respondentsparticipated in the six sessions.3
Out of 268 identified dropouts in Hartford, none met the screening criteria. Recruiting efforts weredifficult in the other sites as well, suggesting that most dropouts stopped picking up their food instru-ments for reasons unrelated to cost-containment practices.4 Following common practice in focusgroup selection of a certain number of people meeting specified criteria, the screening interviews didnot follow the same procedures as an evaluation survey (for example, callbacks to increase responserates or a full follow-through on all released sample). For this reason, one cannot use the results ofthe screening interviews to estimate the percentage of dropouts who gave specific reasons for theirdecision.
Given the recruiting difficulties and the relatively small percentage of participants who dropped out, itis likely that only a small fraction of WIC participants in the six States left the program for reasonsrelated to cost-containment practices. This assessment is reinforced by what was learned at the sixfocus groups, as described below.
Each focus group began with a discussion about attitudes toward the WIC program. Focus groupparticipants were generally positive about the program, and indeed many had resumed picking uptheir food instruments. The free food supplements and health referral services were the favoritecomponents of the program, with many respondents saying the supplements helped them meet thenutritional needs of their children. Mothers with infants relied on the program to obtain expensiveinfant formula. Likewise, the mothers said the WIC program was a valuable source of information onchild health care. Many respondents said they sought health information from WIC on child immuni-zations. These positive attitudes and resumed participation are evidence that the focus group partici-pants did not have strong complaints about the WIC program. Rather, as discussed later, they contin-ually weighed the advantages and disadvantages of continued participation and, with changingcircumstances, made different decisions at different times.
Using a card-sort technique, participants were then invited to rank the relative importance of sixdifferent reasons for not picking up their food instruments:
1. I don’t like the experience in the clinic.2. I can’t shop at my usual store.3. It is too confusing to find the allowed item on the WIC vouchers.
3 The number of participants at each focus group was Cleveland (5), Charlotte (7), Oklahoma City (2), Houston (4), andLos Angeles (8 and 8).
4 Pre-coded responses to the question included (1) transportation or child care problems getting to the clinic; (2) poorservice at the clinic, long waiting lines, or crowded waiting areas; (3) clinic staff not speaking your primary language;(4) feeling like participation in the program labeled you as “poor”; (5) not liking the kinds of food you could get fromWIC; (6) trouble using the food instruments; (7) not liking the stores where WIC instruments can be used or the storesnot being convenient; (8) not being able to get infant formula anymore; and (9) thinking you were (or your child was)no longer eligible for WIC.
134
4. I don’t like the experience at the checkout.5. I don’t like the WIC food-item selections.6. Overall, I don’t think the benefits are worth the extra hassles.
Results from the card sort exercise are not available for the Cleveland focus group.5 Among theremaining five groups, only three out of 27 respondents said that not liking the WIC food-item selec-tions was their main reason for not picking up their food instruments, with another six respondentsgiving food-item selections as their second most important reason. Not being able to shop at theirregular store was consistently at the bottom of the list (only three respondents gave this a first orsecond ranking). These findings about the relative importance of factors other than food-item andvendor restrictions are especially striking when one recalls that the screening criteria used to selectfocus group participants were related only to possible effects of food-item and vendor restrictions.
“I don’t like the experience in the clinic” was the most commonly cited reason for not picking upfood instruments, with 13 of 27 respondents giving this as their first or second most important reason.Eight respondents said their first or second reason was that the WIC benefits were not worth the extrahassle of obtaining them.
With regard to food selection, many respondents voiced preferences for food items not federallyapproved for WIC (like sweetened cereals). Some complaints, however, were related to foodrestrictions imposed by the States. Examples, by item, included the following.
Milk
“We used to get any kind of milk you want and now you have to get the store brand milk.And I don’t understand what’s the difference and why can’t you get Pet milk.” (Charlotte,NC)
“I mean the [store-brand] WIC milk doesn’t taste very good…It tastes spoiled…old…watery.” (Oklahoma City, OK)
Eggs
“You can only get [one] brand of eggs and they [the store] won’t let you substitute becauseWIC won’t pay for the substitution.” (Oklahoma City, OK)
Cereal
“When it comes to the selection of cereal, there is no selection. You can only get about fivedifferent cereals. There are 30 brands of cereal that are healthy that they could put on there.”(Charlotte, NC)
“I think they need to broaden their [cereal] selections.” (Los Angeles, CA)
“I don’t like corn flakes or Kix cereals.” (Cleveland, OH)
5 The cards for the Cleveland focus group were lost in transit. Review of the transcript from the Cleveland sessionindicates that problems at the clinic were the main reason respondents gave for not picking up their food instruments.
135
“There’s not enough selection on the cereal.” (Houston, TX)
“My kids won’t eat Kix. They won’t eat those Cheerios.” (Los Angeles, CA)
“Kids don’t want that [cereal]. You have to get the store brands and that’s a no-no.” (LosAngeles, CA)
“I don’t like WIC food items, but that is only for the cereal though.” (Oklahoma City, OK)
“Don’t like getting the off-brand because they are not end up tasting right.” (Oklahoma City,OK)
Juice
“This one lady told me you can’t get mixed juice. You can only get one, all grape, all apple,or something like that.” (Los Angeles, CA)
“You can get orange juice, but the orange doesn’t taste like orange.” (Los Angeles, CA)
“Generic beans don’t really make a difference because beans is beans, but generic juice isnasty, generic cereal is nasty!” (Los Angeles, CA)
“I’d prefer a national brand [of juice]…I don’t like generic stuff” (Los Angeles, CA)
Cheese
“I just feel they should add sliced cheese in there because if you’re making kids grilledcheese or making the kids sandwiches or something like that the slices are better.” (LosAngeles, CA)
“And they don’t allow you to get individually wrapped cheese. You have to get the cheesethat is thrown together in the pack. It gets hard and you can’t use it.” (Cleveland, OH)
“It’s not Kraft and it’s not milk cheese. It’s that oil-based cheese, and if you try to melt it allof a sudden it just turns oily, constantly, like processed cheese.” (Los Angeles, CA)
“You can’t get high-quality cheese.” (Los Angeles, CA)
A few comments were also heard about access to WIC stores:
“I don’t like how you can’t go to any store and use WIC.” (Oklahoma City, OK)
“I can’t shop at my usual store. Because the store, by being so cheap … they don’t acceptWIC.” (Cleveland, OH)
“I live on the west side and we have four stores close by me. None of these corner storesaccepted WIC until last year.” (Cleveland, OH)
136
Respondents were also asked to rate their satisfaction with the types, quantities, and brands ofselected WIC foods. Key findings related to satisfaction with allowed types were:
• Respondents liked having different types of juice to choose from.
• Most respondents disliked the selection of cereals on their food instruments. Theyunderstood that unsweetened cereals were more nutritious than sweetened cereals, butthey said they had to add sugar to the unsweetened cereals to get their children to eatthem. Several respondents remarked about having to give their WIC cereals away or finda place to store them because nobody at home would eat them.
Key findings related to satisfaction with allowed brands were:
• Most respondents were very satisfied with milk, and they generally did not perceive adifference in taste from one store brand to another.
• A few respondents were unhappy that they could not buy national brands of cheese.
• Some respondents complained about not being able to purchase national brands of juice.
Key findings related to satisfaction with allowed packaging were:
• Some respondents did not like having to buy milk in gallon containers, preferring smallercontainers.
• Most respondents enjoyed the option of purchasing adult juice in either a plastic bottle orcan.
• Most respondents were very satisfied with prescribed cheese, but they did not like havingto select it in blocks, which they found hard to store and keep fresh.
A number of respondents also said that quantities of prescribed food were inadequate, especially formilk, eggs, and juice.6 Cost-containment practices, however, do not change quantities of prescribedfood.
A common theme running through the food-item discussions was that, whether due to State cost-containment practices or Federal restrictions on approved foods, the decision to not pick up one’sfood instruments reflected a balance between benefits and costs. These groups of participantsweighed the benefits of the prescribed food against the difficulties and inconvenience of going to theWIC clinic to pick up their food instruments and using them at the store. Food-item restrictions ontypes, brands, and packaging of approved foods clearly bothered some of the focus group respon-dents, but the problems of picking up the instruments at the clinic and using them at store checkoutcounters bothered them more. Even among this select group of participants, however, the balancebetween perceived benefits and costs varied over time. Although the focus groups did not includeincome levels or income changes as a scheduled topic for discussion, respondents sometimesmentioned that they were more likely to pick up and use their food instruments when money was
6 Remarks in the focus groups that not enough food is prescribed contrasts with survey findings reported in chapter 6 andappendix I. Survey respondents sometimes said that they did not buy or consume all their WIC food because too muchwas prescribed. The two findings are not inconsistent, but merely reflect the two ends of an overall distribution ofparticipant beliefs about the adequacy of prescribed quantities of food.
137
scarce. This is why some of the respondents had resumed picking up their food instruments by thetime the focus groups were held in April 2001.7
Conclusions
Based on these findings, there is little evidence that cost-containment practices had a negative impacton program participation in any of the study States. Five factors justify this conclusion. First, thestudy identified relatively few participants in each State as dropouts; the vast majority (generally over90 percent, according to chapter 8) of WIC participants picked up their food instruments each month.Second, only a subset of all dropouts said that restrictions on authorized vendors or foods contributedto their decision to drop out. Third, even among this subset of dropouts, the food-item and vendorrestrictions usually were not the major reasons for failing to pick up food instruments; instead,unpleasant experiences with clinic staff and inconvenience were cited more often as the reason.Fourth, a number of the focus group respondents said they had already resumed picking up their foodinstruments. Finally, the overall levels of satisfaction with and use of WIC foods (reported in chapter6) make it unlikely that very many otherwise-eligible individuals did not apply for program benefitsbecause they heard complaints from participants about restrictions on authorized stores or allowedfoods. Together, these five factors indicate that cost-containment practices had little or no impact onprogram participation.
7 Recall that the dropout “event” occurred during the 6 months preceding November 2000.

139
Chapter 10Health Outcomes
Positive health outcomes are the ultimate goal of the WIC program. WIC enrolls individuals who areat nutritional risk and provides nutrient-dense foods, nutrition education, and health-service referralsaimed at improving health and nutrition status. One of the congressionally mandated research objec-tives of this study is to examine the impact of WIC cost-containment practices on achievement ofpositive health outcomes.
WIC cost-containment practices do not directly affect the health outcomes of WIC participants, butthere is potential for an indirect effect. Cost-containment practices limit food choices. If limits onfood choice result in reduced food instrument redemption or food use, then WIC’s goal of improvinghealth and nutrition status through provision of nutrient-dense foods is compromised. Thus thepotential link between cost-containment practices and health outcomes consists of two behaviorallyseparate components:
• Relationship between cost-containment practices and food instrument redemption or fooduse.
• Relationship between food instrument redemption or food use and health outcomes.
It is beyond the scope of the current study to model the complex processes that relate WIC cost-containment practices to health outcomes. Nonetheless, this study examines each componentrelationship separately.
The first relationship—between cost-containment practices and food instrument redemption or fooduse—was examined in prior chapters. Within the six case study states, there is no consistent evidencethat cost-containment practices reduced food instrument redemption rates. There is also littleevidence that cost-containment practices reduced food use. Participants facing a binding constrainton cheese were less likely to purchase and consume their prescribed cheese (a cross-State average of8.8 percent of participants faced a binding constraint). In addition, Oklahoma’s food-item restrictionson cereal and dried beans/peas were related to reduced purchase and consumption of these items, butthe State had since added more allowed brands of cereal brands.
The second relationship—between food instrument redemption and health outcomes—is examined inthis chapter. The analysis is focused on whether there is a statistically significant relationshipbetween WIC food instrument redemption rates and health outcomes, regardless of causality.1 Datalimitations prevent a full analysis of the causal relationship between food instrument redemption andhealth outcomes and, therefore, the results presented here are interpreted carefully and used primarilyas indicators that future research is needed.
The analysis of health outcomes presented in this chapter is limited by three factors. First, it wasbeyond the scope of this study to model fully the complex processes determining health status.
1 It is possible that food instrument redemption is related to health outcomes even if no causal relationship exists. Forexample, an illness that requires hospitalization may be associated with failure to redeem instruments and poor healthstatus.
140
Nutrition is only one of many factors that affect health, and WIC foods are only a component of totaldietary intake (WIC foods are intended to supplement the diet and not provide for all dietary needs).The study does not have data on other determinants of health status, such as non-WIC foods or use ofhealth care services. If these unobserved determinants of health status are correlated with WIC foodinstrument redemption, estimates of the relationship between food instrument redemption and healthstatus will be overstated.
The second limitation for the analysis of health outcomes is measurement error. The relationship ofinterest is between consumption of WIC foods and health outcomes, but consumption of WIC foodsis not observable. Food instrument redemption is used as a proxy for food consumption.2 The proxy(food instrument redemption) contains measurement error relative to the true value (food consump-tion) because some foods obtained with WIC food instruments may not be consumed by WIC partici-pants. (For example, WIC foods may be eaten by other family members.) A second source ofmeasurement error derives from the fact that food instrument redemption is observed as a binaryoutcome in WIC administrative data—a food instrument is redeemed or not. Food instruments maybe partially redeemed, however, for a subset of foods listed on the food instrument.
Measurement error in the proxy for WIC food consumption results in estimates of the relationshipbetween food instrument redemption and health status that are understated. This is because bothsources of measurement error result in a measure of food instrument redemption that systematicallyoverstates the true value of interest (on average, food instrument redemption overstates foodconsumption and observed redemption overstates actual redemption). As a result of this systematicupward bias, the estimated relationship between food instrument redemption and health outcomes isunderstated.
The third limitation for the analysis of health outcomes is the possibility of selection bias. Healthoutcomes are observed only for WIC participants who recertify in the program after the certificationperiod in which food instrument use is observed. The direction of bias is unknown and may go eitherway. For example, if participants are not satisfied with the program and do not redeem their instru-ments, they are less likely to recertify; on the other hand, persons with improved health status may beunable to recertify if they no longer meet nutritional risk criteria.
The first section of this chapter presents the research approach, including a description of the data,sample definitions, outcome measures, and estimation approach. The second section presentsanalysis results.
Research Approach
Overview
The analysis in this chapter employs a very simple model relating health outcomes to WIC participantdemographics and rates of food instrument redemption (the proxy for food use).The model is specified as:
2 The Survey of WIC Participants asked about food consumption but the sample is too small for analyses of healthoutcomes; administrative data are used for the analyses in this chapter.
141
Hi = β1Xi + β2Vi + νi (1)
Equation (1) specifies that health outcomes (H) depend on demographic and household characteristics(X) and food instrument redemption (V); ν is an error term. The subscript i indicates that the modelemploys individual-level data. The difficulty with this simple model, however, is that food instru-ment redemption and health outcomes are determined simultaneously. It is likely that a WIC partici-pant who is motivated to improve health status (by engaging in healthy behaviors) will also be moti-vated to redeem WIC food instruments and consume WIC foods. This simultaneity problem is onereason one cannot attribute causality from this analysis.3
The relationship between food instrument redemption and health outcomes is analyzed using state-wide WIC administrative data from the six case study States. Two types of administrative data werecollected: WIC food instrument records and WIC certification records.
WIC food instrument records consist of one record for each issued food instrument, with a participantidentifier that links the food instrument record to the certification file. Each food instrument recordcontains a food package code and sequence or item number to indicate the food items listed forpurchase on the food instrument. The record also contains an indicator of whether the food instru-ment was redeemed, and total amount of payment to the vendor on the redeemed food instrument.Four months of food instrument data were collected from each State, covering two-thirds of a typical6-month certification period.
WIC certification records contain demographic information and measures of health and nutritionstatus. Demographic variables include age, race, sex, household size, household income, and receiptof public assistance (food stamps, TANF, and Medicaid). Health and nutrition status include anthro-pometric measurements (height and weight), blood iron measures (hemoglobin or hematocrit), andindicators of nutrition risk. These measures of health and nutrition status are recorded on certificationrecords because nutrition risk is a criterion for WIC enrollment. Certification records were collectedfrom each State at two points in timeNovember 2000 and April 2001. These two certificationrecords provide two observations of health status for all WIC participants recertified betweenNovember and April.
Outcome Measures
Four health outcomes are examined in this chapter for samples of WIC participants observed in theNovember 2000 caseload and recertified by April 2001.
3 This simultaneity problem is not easily resolved because the root of the problem is that unobserved variables are corre-lated with both food instrument redemption and health outcomes. Theoretically, a structural simultaneous equationsmodel can be specified with one equation for food instrument redemption and another for health outcomes. The struc-tural model requires data on determinants of food instrument redemption that are not correlated with health outcomes(or vice versa) for estimation and identification. The current study lacks the required data.
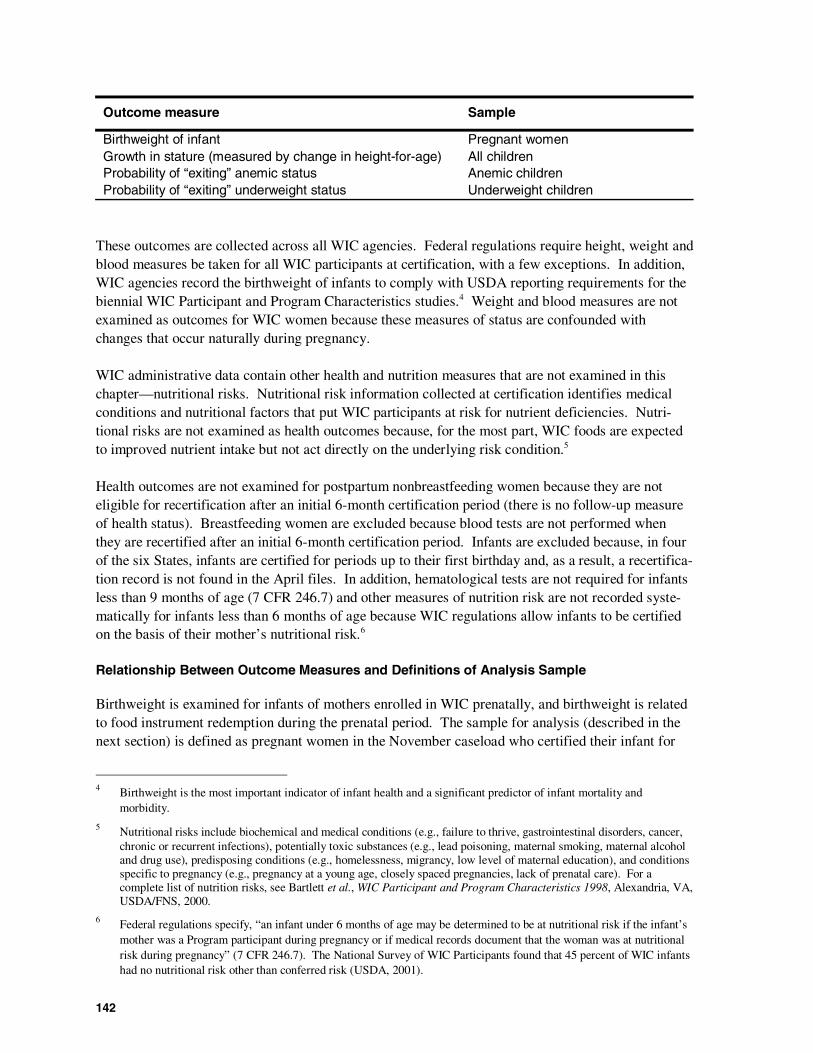
142
Outcome measure Sample
Birthweight of infant Pregnant womenGrowth in stature (measured by change in height-for-age) All childrenProbability of “exiting” anemic status Anemic childrenProbability of “exiting” underweight status Underweight children
These outcomes are collected across all WIC agencies. Federal regulations require height, weight andblood measures be taken for all WIC participants at certification, with a few exceptions. In addition,WIC agencies record the birthweight of infants to comply with USDA reporting requirements for thebiennial WIC Participant and Program Characteristics studies.4 Weight and blood measures are notexamined as outcomes for WIC women because these measures of status are confounded withchanges that occur naturally during pregnancy.
WIC administrative data contain other health and nutrition measures that are not examined in thischapter—nutritional risks. Nutritional risk information collected at certification identifies medicalconditions and nutritional factors that put WIC participants at risk for nutrient deficiencies. Nutri-tional risks are not examined as health outcomes because, for the most part, WIC foods are expectedto improved nutrient intake but not act directly on the underlying risk condition.5
Health outcomes are not examined for postpartum nonbreastfeeding women because they are noteligible for recertification after an initial 6-month certification period (there is no follow-up measureof health status). Breastfeeding women are excluded because blood tests are not performed whenthey are recertified after an initial 6-month certification period. Infants are excluded because, in fourof the six States, infants are certified for periods up to their first birthday and, as a result, a recertifica-tion record is not found in the April files. In addition, hematological tests are not required for infantsless than 9 months of age (7 CFR 246.7) and other measures of nutrition risk are not recorded syste-matically for infants less than 6 months of age because WIC regulations allow infants to be certifiedon the basis of their mother’s nutritional risk.6
Relationship Between Outcome Measures and Definitions of Analysis Sample
Birthweight is examined for infants of mothers enrolled in WIC prenatally, and birthweight is relatedto food instrument redemption during the prenatal period. The sample for analysis (described in thenext section) is defined as pregnant women in the November caseload who certified their infant for
4 Birthweight is the most important indicator of infant health and a significant predictor of infant mortality andmorbidity.
5 Nutritional risks include biochemical and medical conditions (e.g., failure to thrive, gastrointestinal disorders, cancer,chronic or recurrent infections), potentially toxic substances (e.g., lead poisoning, maternal smoking, maternal alcoholand drug use), predisposing conditions (e.g., homelessness, migrancy, low level of maternal education), and conditionsspecific to pregnancy (e.g., pregnancy at a young age, closely spaced pregnancies, lack of prenatal care). For acomplete list of nutrition risks, see Bartlett et al., WIC Participant and Program Characteristics 1998, Alexandria, VA,USDA/FNS, 2000.
6 Federal regulations specify, “an infant under 6 months of age may be determined to be at nutritional risk if the infant’smother was a Program participant during pregnancy or if medical records document that the woman was at nutritionalrisk during pregnancy” (7 CFR 246.7). The National Survey of WIC Participants found that 45 percent of WIC infantshad no nutritional risk other than conferred risk (USDA, 2001).
143
WIC prior to April 2001. The measure of birthweight is obtained from the infant’s certificationrecord in the April file.7 Mean birthweight in this sample is 7.36 pounds (or 117.74 ounces), with 5.1percent of births identified as low birthweight (defined as birthweight below 5.5 pounds).
Growth in height for children is examined for all WIC children age 2 years and older, observed in theNovember caseload and recertified by April 2001. Growth in height is measured as the difference inheight-for-age in the April file versus the November file. Height-for-age was obtained by comparingheight measurements from WIC certification data, to age- and gender- specific reference curvesdeveloped by the Centers for Disease Control and Prevention (CDC).8 The analysis sample containschildren age 2 years and older because the CDC references curves for height were developed forpersons age 2 years and older.9 For the analysis sample of children observed in November and recer-tified by April, the mean height-for-age percentile in November and April, respectively, were 55.66and 56.71; the mean difference was 1.04 percentiles.10 It is important to note that height-for-age maydecline over time, even though height does not decrease. The height-for-age percentile is a standard-ized score and slow growth can cause a decrease in a child’s height-for-age percentile relative to thereference curve.
The analysis of anemia in children is modeled as the probability of “exiting” anemic status. WICfiles contain hematological test results (hemoglobin or hematocrit), which were compared to CDCguidelines to identify anemia in children.11 The records from the November and April certificationfiles provide two observations of anemia status. The analysis sample is limited to children withanemia in November, who were recertified by April. Of all children recertified between Novemberand April, approximately 10 percent were measured anemic in November; of these, 40 percent werestill anemic in April.12
Similar to the analysis of anemia, the analysis of underweight children is modeled as the probabilityof “exiting” underweight status. Underweight children are identified as children with weight-for-agebelow the 10th percentile. Weight-for-age was obtained by comparing weight measurements fromWIC certification data, to age- and gender- specific reference curves developed by the Centers forDisease Control and Prevention. The records from the November and April certification files providetwo observations of underweight status. The analysis sample is limited to children measured
7 Texas records birthweight on the mother’s recertification record. For Texas, the mother’s pregnant record was matchedto her postpartum record and her infant’s record (to obtain information on the sex of the infant).
8 Kuczmarski RJ, Ogden C, Grummer-Strawn LM, et al., CDC Growth Charts: United States, Hyattsville, MD: U.S.Department of Health and Human Services, 2000. NCHS Advance Data Report No. 314.
9 CDC developed stature-for-age (or height-for-age) charts for people age 2 to 20 years old and recumbent length-for-agecharts for children from birth through 36 months. Limiting the sample to children age 2 years and older avoidscomparison of height-for-age measures based on different growth charts.
10 The percent of children with low height-for-age (at or below the 10th percentile) declined from 6.3 percent in Novemberto 5.9 percent in April.
11 CDC guidelines identify anemia in children by hemoglobin below 11 g/dl or hematocrit below 33 percent. Source:Institute of Medicine, WIC Nutrition Risk Criteria: A Scientific Assessment, Washington, DC: National AcademyPress, 1996.
12 As discussed in the next section, the study also examined the probability of “entering” anemic status: among childrenwithout anemia in November, 6 percent were anemic in April. For clarity, however, the discussion is focused onsamples of children with nutritional risks at baseline.
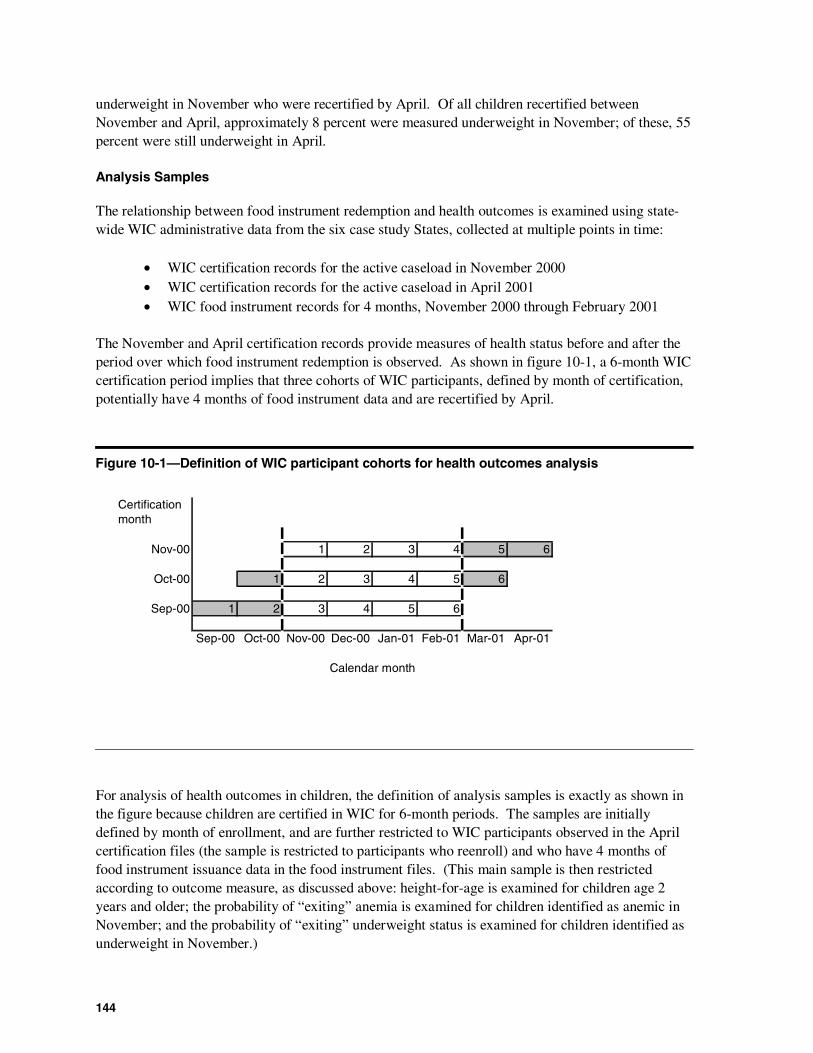
144
underweight in November who were recertified by April. Of all children recertified betweenNovember and April, approximately 8 percent were measured underweight in November; of these, 55percent were still underweight in April.
Analysis Samples
The relationship between food instrument redemption and health outcomes is examined using state-wide WIC administrative data from the six case study States, collected at multiple points in time:
• WIC certification records for the active caseload in November 2000• WIC certification records for the active caseload in April 2001• WIC food instrument records for 4 months, November 2000 through February 2001
The November and April certification records provide measures of health status before and after theperiod over which food instrument redemption is observed. As shown in figure 10-1, a 6-month WICcertification period implies that three cohorts of WIC participants, defined by month of certification,potentially have 4 months of food instrument data and are recertified by April.
Figure 10-1—Definition of WIC participant cohorts for health outcomes analysis
For analysis of health outcomes in children, the definition of analysis samples is exactly as shown inthe figure because children are certified in WIC for 6-month periods. The samples are initiallydefined by month of enrollment, and are further restricted to WIC participants observed in the Aprilcertification files (the sample is restricted to participants who reenroll) and who have 4 months offood instrument issuance data in the food instrument files. (This main sample is then restrictedaccording to outcome measure, as discussed above: height-for-age is examined for children age 2years and older; the probability of “exiting” anemia is examined for children identified as anemic inNovember; and the probability of “exiting” underweight status is examined for children identified asunderweight in November.)
Certificationmonth
Nov-00 1 2 3 4 5 6
Oct-00 1 2 3 4 5 6
Sep-00 1 2 3 4 5 6
Sep-00 Oct-00 Nov-00 Dec-00 Jan-01 Feb-01 Mar-01 Apr-01
Calendar month
145
For analysis of birthweight, the sample contains pregnant women active in November with an infantin the April certification file. The sample for pregnant women includes women certified in themonths of August through November 2000; the sample extended back to August because pregnantwomen may be certified for periods longer than 6 months depending on the trimester of enrollment.The sample sizes for analysis of birthweight and anemia are shown in table 10-1. The table alsoshows the analysis sample as a percent of the November caseload. For example, the analysis ofbirthweights is based on an analysis sample equal to 18.9 percent of all pregnant women certified asof November. The size of the analysis sample is determined first by the size of the cohorts (certifiedin August to November) relative to the entire November caseload (approximately 60 percent)—thesubsample of cohorts from the caseload is random, based on certification month. Within thesubsample of cohorts, the percentage of pregnant women who were recertified by April (i.e., deliv-ered) and had 4 months of food instrument data was approximately 45 percent13—some selection biasis introduced because women with late deliveries (higher birthweights) are more likely to be excludedfrom the sample. Finally, the percent of the remaining sample with non-missing birthweight on anApril certification record varied from less than 50 percent in North Carolina and Ohio to over 80percent in the other States.14
Similarly, the number of children included in the analyses of anemia is about 20 percent of the entireNovember caseload of anemic children. The September through November cohorts represent approx-imately 50 percent of the November caseload; approximately 50 percent of children in these cohortswere recertified by April; and missing data on health status reduces the sample by about 5 percent.The analysis samples for change in height and for underweight status are also approximately 20percent of the respective cases in the entire November caseload.
13 Pregnant women are certified up to 6 weeks postpartum, so a large number are not observed to be recertified within 6months of their original certification date.
14 Birthweight data may be missing on the infant’s WIC record, or it may be missing due to an inability to link the motherand infant WIC records, or because the infant was not certified by April when the data extract was drawn. The lattertwo reasons account for most of the missing birthweight data. For example, only 1.6 percent of infant records in NorthCarolina are missing birthweight; but 47 percent of pregnant women from the August to November cohorts could notbe matched to the record of their infants’ birthweight.
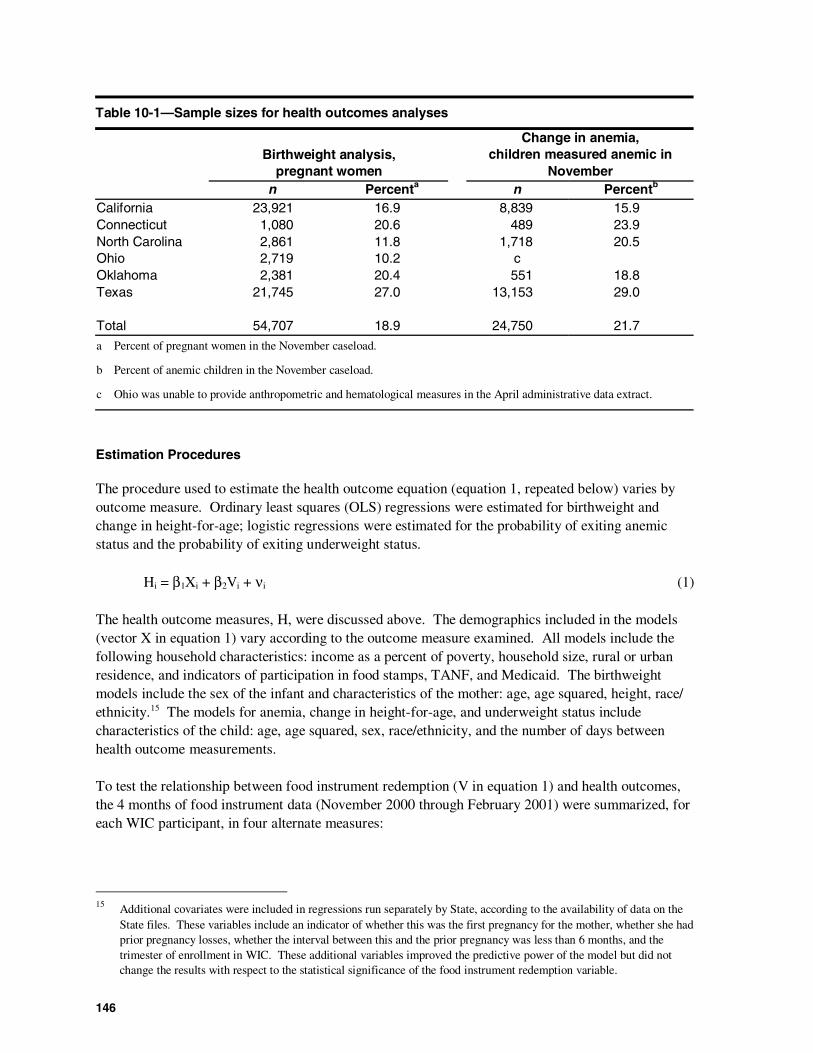
146
Table 10-1—Sample sizes for health outcomes analyses
Birthweight analysis,pregnant women
Change in anemia,children measured anemic in
Novembern Percenta n Percentb
California 23,921 16.9 8,839 15.9Connecticut 1,080 20.6 489 23.9North Carolina 2,861 11.8 1,718 20.5Ohio 2,719 10.2 cOklahoma 2,381 20.4 551 18.8Texas 21,745 27.0 13,153 29.0
Total 54,707 18.9 24,750 21.7
a Percent of pregnant women in the November caseload.
b Percent of anemic children in the November caseload.
c Ohio was unable to provide anthropometric and hematological measures in the April administrative data extract.
Estimation Procedures
The procedure used to estimate the health outcome equation (equation 1, repeated below) varies byoutcome measure. Ordinary least squares (OLS) regressions were estimated for birthweight andchange in height-for-age; logistic regressions were estimated for the probability of exiting anemicstatus and the probability of exiting underweight status.
Hi = β1Xi + β2Vi + νi (1)
The health outcome measures, H, were discussed above. The demographics included in the models(vector X in equation 1) vary according to the outcome measure examined. All models include thefollowing household characteristics: income as a percent of poverty, household size, rural or urbanresidence, and indicators of participation in food stamps, TANF, and Medicaid. The birthweightmodels include the sex of the infant and characteristics of the mother: age, age squared, height, race/ethnicity.15 The models for anemia, change in height-for-age, and underweight status includecharacteristics of the child: age, age squared, sex, race/ethnicity, and the number of days betweenhealth outcome measurements.
To test the relationship between food instrument redemption (V in equation 1) and health outcomes,the 4 months of food instrument data (November 2000 through February 2001) were summarized, foreach WIC participant, in four alternate measures:
15 Additional covariates were included in regressions run separately by State, according to the availability of data on theState files. These variables include an indicator of whether this was the first pregnancy for the mother, whether she hadprior pregnancy losses, whether the interval between this and the prior pregnancy was less than 6 months, and thetrimester of enrollment in WIC. These additional variables improved the predictive power of the model but did notchange the results with respect to the statistical significance of the food instrument redemption variable.
147
PCTINSTRU = percentage of issued food instruments that were redeemed
PCTCOST = percentage of the estimated cost of issued food instruments redeemed
PCTCEREAL = percentage of prescribed cereal ounces on food instruments that wereredeemed
The first measure is a simple count of redeemed food instruments divided by the total food instru-ments issued during the period for the WIC participant. A count of instruments is a crude measure,however, because it does not account for the fact that some food instruments are single-item foodinstruments (gallon of milk), whereas others are multiple-item food instruments (milk, cereal, juice).In other words, the percentage of redeemed instruments does not reflect the percent of WIC foods, ornutrients, redeemed. To create a proxy for the amount of food available from each voucher, eachfood instrument was valued using the average prices per State constructed for the food cost analysis,and PCTCOST is the percentage of the value of WIC foods redeemed.16 The final measure—PCTCEREAL—was constructed for the analysis of anemia, because iron-fortified cereal is the onlyWIC food that provides dietary iron. For all analysis samples, the mean values of the food instrumentredemption summary measures (PCTINSTR, PCTCOST, PCTCEREAL) are between 88 and 91 percent.
Results
The primary estimates of interest from the health outcome regressions are the estimated coefficientson the food instrument redemption variables. These estimates are shown in table 10-2 and discussedbelow. The complete results for each regression model are presented in appendix K.
Birthweight
The estimated relationship between food instrument redemption and birthweight is positive and statis-tically significant, although very small in magnitude. Furthermore, the estimated coefficients on foodinstrument redemption are the same regardless of whether redemption is measured by a count of foodinstruments or the estimated value of food instruments. The estimates suggest that a percentage pointincrease in the rate of food instrument redemption is associated with increased birthweight of 0.03ounces.
The very small magnitude of the relationship between food instrument redemption and birthweight isat least partly due to the fact that mean food instrument redemption is quite high, at 88 to 90 percent.An additional factor is that the model specifications do not include many important determinants ofbirthweight, due to data limitations. For example, some but not all State WIC files contained data onpregnancy histories: number of prior pregnancies, number of pregnancy losses, date most recentpregnancy ended.
16 PCTCOST is equal to the “value” of foods listed on redeemed instruments divided by the “value” of foods listed on allissued instruments. This percent is measured for each WIC participant based on food costs within their State. Thismeasure is not a perfect proxy for percent of nutrients redeemed. Furthermore, as a proxy for nutrients, the measurevaries across States if the relative costs of different food items (e.g., cost of milk relative to cereal) varies across States.
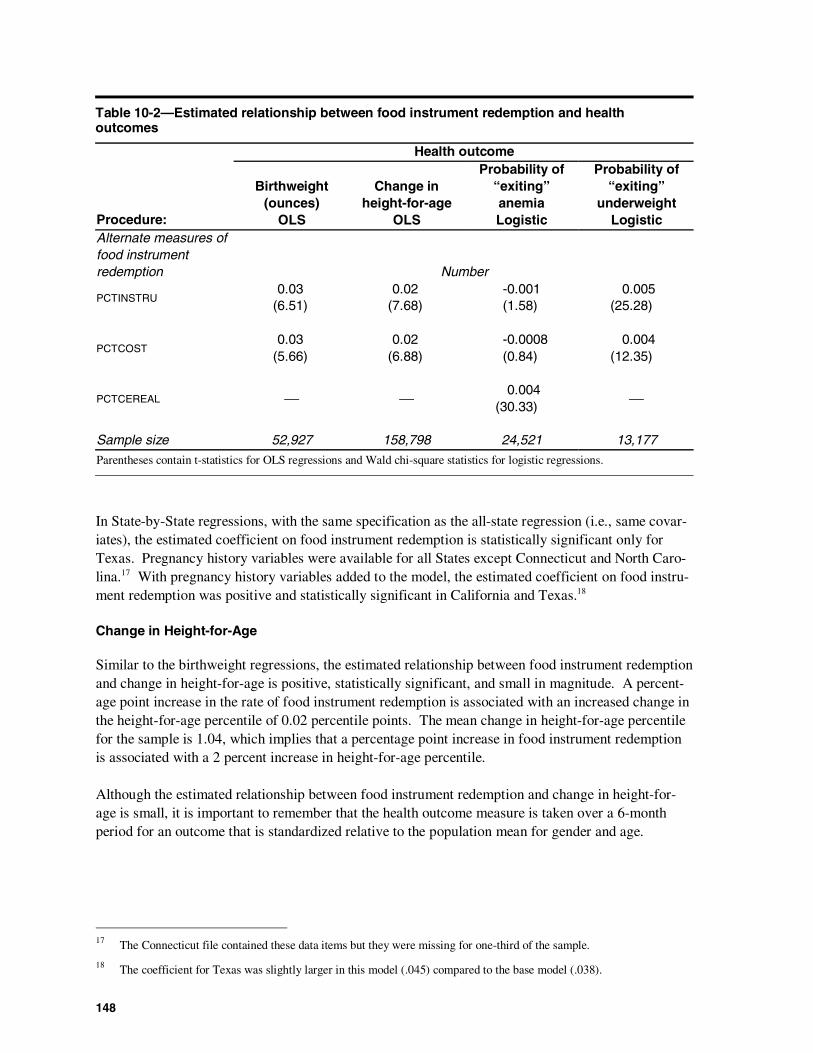
148
Table 10-2—Estimated relationship between food instrument redemption and healthoutcomes
Health outcome
Procedure:
Birthweight(ounces)
OLS
Change inheight-for-age
OLS
Probability of“exiting”anemiaLogistic
Probability of“exiting”
underweightLogistic
Alternate measures offood instrumentredemption Number
PCTINSTRU0.03
(6.51)0.02
(7.68)-0.001(1.58)
0.005(25.28)
PCTCOST0.03
(5.66)0.02
(6.88)-0.0008(0.84)
0.004(12.35)
PCTCEREAL 0.004(30.33)
Sample size 52,927 158,798 24,521 13,177
Parentheses contain t-statistics for OLS regressions and Wald chi-square statistics for logistic regressions.
In State-by-State regressions, with the same specification as the all-state regression (i.e., same covar-iates), the estimated coefficient on food instrument redemption is statistically significant only forTexas. Pregnancy history variables were available for all States except Connecticut and North Caro-lina.17 With pregnancy history variables added to the model, the estimated coefficient on food instru-ment redemption was positive and statistically significant in California and Texas.18
Change in Height-for-Age
Similar to the birthweight regressions, the estimated relationship between food instrument redemptionand change in height-for-age is positive, statistically significant, and small in magnitude. A percent-age point increase in the rate of food instrument redemption is associated with an increased change inthe height-for-age percentile of 0.02 percentile points. The mean change in height-for-age percentilefor the sample is 1.04, which implies that a percentage point increase in food instrument redemptionis associated with a 2 percent increase in height-for-age percentile.
Although the estimated relationship between food instrument redemption and change in height-for-age is small, it is important to remember that the health outcome measure is taken over a 6-monthperiod for an outcome that is standardized relative to the population mean for gender and age.
17 The Connecticut file contained these data items but they were missing for one-third of the sample.
18 The coefficient for Texas was slightly larger in this model (.045) compared to the base model (.038).
149
Anemia
Anemia in children was examined by modeling the probability that children identified as anemic atone WIC certification, would not be anemic at recertification. This model provides compellingresults. The estimated relationship between food instrument redemption and change in anemia statusis the wrong sign and not statistically significant when food instrument redemption is measured byPCTINSTRU or PCTCOST. The “wrong” sign suggests that an increase in food instrument redemptionwould decrease the likelihood of “exiting” anemia status.
In contrast, when food instrument redemption is measured by the percent of cereal ounces onredeemed food instruments, the estimated relationship is positive and statistically significant,although very small in magnitude. A 10-percentage-point increase in the percent of cereal redeemedis associated with a 0.04 percentage point increase in the probability of “exiting” anemia.19
The evidence from the anemia models is compelling. Recall that one of the difficulties with thissimple model of health outcomes is that food instrument redemption and health outcomes are deter-mined simultaneously. It is likely that a WIC participant who is motivated to improve health status(by engaging in healthy behaviors) will also be motivated to redeem WIC food instruments andconsume WIC foods. Because all three measures of food instrument redemption are correlated, theevidence that food instrument redemption, measured generally, is not related to anemia, whereascereal redemption is related to anemia, suggests that food instrument redemption is not acting as aproxy for unobserved healthy behaviors.
Underweight
Similar to anemia, underweight in children was examined by modeling the probability that childrenidentified as underweight at one WIC certification, would not be underweight at recertification. Theestimated coefficients are nearly the same regardless of whether redemption is measured by a count offood instruments or the estimated value of food instruments. The estimates suggest that a percentagepoint increase in the rate of food instrument redemption is associated with a 0.005 increased likeli-hood of no longer being underweight.
An additional model, not shown in the table, was specified to examine the relationship between foodinstrument redemption and overweight status—the probability that overweight children in Novemberare no longer overweight in April. This model provides another way to test whether the food instru-ment redemption measures are acting as a proxy for unobservable behaviors. If food instrumentredemption is a proxy for healthy behavior, then one might expect food instrument redemption toincrease the likelihood that overweight children lose weight.20 On the other hand, if food instrumentredemption provides a reasonable measure of WIC food consumption, one would expect food instru-ment redemption to be negatively related to the likelihood that overweight children lose weight. Theestimated coefficient on food instrument redemption in the overweight model is negative and statisti-
19 Similar results are found when examining the probability of “entering” anemia. Six percent of children who were notanemic in November became anemic by April. The probability of “entering” anemia is positively related toPCTINSTR and PCTCOST, suggesting that consumption of WIC foods is related to anemia (wrong-signed results).The probability of “entering” anemia, however, is negatively related to PCTCEREAL and is statistically significant.
20 Food instrument redemption may also increase the likelihood of “exiting” overweight status if nutrient-dense WICfoods replace higher calories foods with less nutritional value.
150
cally significant (−0.006), suggesting that WIC food instrument redemption decreases the likelihoodof exiting overweight status.
Conclusions
This chapter provides evidence of the relationship between WIC food instrument redemption andhealth outcomes. Four health outcomes are examined: birthweight for women enrolled in WICprenatally, change in height-for-age percentiles for children, the probability that anemic childrenidentified at WIC certification will no longer be anemic at recertification, and the probability thatunderweight children identified at WIC certification will no longer be underweight at recertification.
The estimated models are simple due to data limitations, and the main determinant of interest—foodinstrument redemption—is an imperfect proxy for food consumption. Nonetheless, the results show apositive and statistically significant relationship between food instrument redemption and positivehealth outcomes.
The magnitude of the estimated relationship between food instrument redemption and health out-comes is very small for all outcomes examined. This is partly due to the fact that, in most models,health outcomes are measured as changes in status over a short time period. The estimates are alsounderstated to the extent that measurement error in the food instrument redemption variables puts adownward bias on the estimated coefficients. Better information on the relationship between WICbenefits and health outcomes requires examination of WIC outcomes over a longer time period, withmore precise measures of WIC food use.
For cost-containment practices to have an adverse effect on health outcomes, it is necessary to show(1) that cost-containment practices reduce food instrument redemption or food use, and (2) that apositive relationship exists between food instrument redemption and positive health outcomes. Thischapter has demonstrated the second relationship. Previous chapters have presented evidence thatsome food-item restrictions affect the purchase and consumption of cheese and cereal, but the effectsare targeted toward specific subgroups of the entire WIC caseload (mostly those participants forwhom restrictions impose a binding constraint). Furthermore, there was no consistent evidence thatfood-item restrictions reduced rates of food instrument redemption. Thus, the study concludes that itis unlikely that the cost-containment practices used in the six case study States had any measurablenegative effect on health outcomes.
151
Chapter 11Summary and Conclusions
The previous chapters reported the observed relationships between WIC cost-containment practices inthe six case study States and the outcome measures specified by the U.S. Congress in this study’sauthorizing legislation. This chapter summarizes the main findings from the study. The first sectionof the chapter organizes the findings according to each outcome measure. The second section reorg-anizes these findings according to the cost-containment practices implemented in the six States. Thisreorganization focuses on the individual practices, the costs and savings attributable to them, and theirrelationships with participant outcomes.
This study examined the following cost-containment practices. States implementing each practice areshown in parentheses.
• Competitive pricing. State applies competitive pricing criteria at application to ensurethat stores with excessive prices are not authorized (all States except North Carolina andOhio used competitive pricing criteria at application, but Connecticut, Oklahoma, andTexas had the most explicit and restrictive policies).
• Requiring least expensive brand. For specified food categories, WIC participants mustpurchase the least expensive brand available in the store (Connecticut, North Carolina,Oklahoma, and Texas).
• Restricting brands or types. For specified food categories, the State’s list of approvedfoods restricts which brands or types (such as cheese varieties) that may be purchased(California, Oklahoma, and Texas).
• Limiting package form. For specified food categories, the State’s list of approved foodsrestricts which package forms (package size or container type) may be purchased (Cali-fornia, North Carolina, Ohio, Oklahoma, and Texas).
• Rebate contracts. For infant cereal, the State’s list of approved foods restricts purchaseto a single brand due to a negotiated rebate contract with the manufacturer (California,Connecticut, and Texas).
A number of vendor management practices that may affect food package costs were not examinedbecause they do not impose restrictions on WIC participants. Examples include maximum values onfood instruments and limits on the number of WIC-authorized outlets within a specified area. All ofthe States in the study set maximum redemption values for food instruments. Ohio and Oklahomaplaced limits on the number of WIC vendors in an area. Oklahoma denied authorization to six storesin FY1999 and three in FY2001 when numeric limits were reached. Numeric limits in Ohio hadnever been reached when data for this study were collected (primarily during the spring and summerof 2001), so the State had never denied authorization for this reason.
152
Summary of Findings
There are three major findings from this study:
1. Four of the six case study States (California, Connecticut, Oklahoma, and Texas)imposed restrictions on many WIC foods in an effort to reduce food package costs. Theirefforts were successful, reducing monthly food package costs by an average of nearly 15percent.
2. Cost-containment practices were associated with few adverse outcomes for WIC partici-pants.
3. State and local office administrative costs attributed to cost-containment practices wererelatively low. In the four States with substantial food-item restrictions, administrativecosts averaged less than 1.5 percent of estimated food package savings. These costsaveraged about 0.4 percent of the States’ annual NSA funds.
Due to the nature of case studies, these findings cannot be construed as applicable to all States. Inaddition, the success of cost-containment practices in these six States was the result of their ongoingefforts to find those practices that both reduced food package costs and were acceptable to partici-pants.
Main Findings by Outcome Measure
Food Costs and Food Cost Savings
The study examined average WIC food costs and the savings resulting from food-item restrictions.Two sets of estimated costs and savings were obtained. The first set is based on a research approachthat used a uniform distribution of standard food packages across the States to remove State-by-Statevariation in food package contents—an important factor affecting food package costs. This standard-ized measure is useful for cross-State comparisons of costs and savings. The second measureremoved this standardization and includes estimates by State officials of some savings that this studydid not examine. The second measure is likely to be more meaningful to program officials in the sixStates, and it is the appropriate one to use when comparing savings to administrative costs.
Based on the second (nonstandardized) measure, average food package costs (excluding the cost ofinfant formula, tuna, and carrots) varied from a low of $24.26 per participant per month (PPM) inOklahoma to a high of $35.72 PPM in California.1 The largest contributors to average food packagecosts in the six States were milk, juice, cereal, and cheese.
Again using the nonstandardized measure, cost-containment practices led to estimated savings as highas $6.43 PPM in Oklahoma and $7.33 PPM in Texas. The large savings in Oklahoma and Texaswere due primarily to food-item restrictions on juice and cereal. In California and Texas, the Stateswith the largest WIC caseloads, estimated annual savings from cost-containment practices were
1 Formula costs were not estimated because infant formula was specifically excluded from the study by the authorizinglegislation; costs for tuna and carrots were not estimated because these foods were not subject to cost-containmentrestrictions in any of the six States, and thus could not contribute to food cost savings.
153
nearly $40 million and $66 million, respectively. Even in Oklahoma, a State with a relatively smallWIC caseload, estimated annual savings were $6.7 million.
The small savings in North Carolina and Ohio were expected, as these States used few cost-contain-ment practices. The large savings in Oklahoma and Texas were due primarily to food-item restric-tions on juice and cereal. Oklahoma required purchase of store- or private-label brands for mostallowed juice and cereal products, and restricted many juice purchases to 46-ounce cans, a lessexpensive form than bottled juice. Texas allowed a large number of cereal types and brands, but itsspecified minimum package sizes were generally larger than in the other States. For juice, Texaslimited the number of allowed types, required purchase of the least expensive brand available, andrestricted most juice containers to 46-ounce cans.
Administrative Costs of Cost-Containment Practices
When compared to the overall costs of program administration, the cost-containment practices imple-mented by the case study States were inexpensive to operate. The estimated total administrative costsranged from $0.01 per participant per month (PPM) in Oklahoma to $0.10 PPM in Connecticut.These estimates may under- or overstate actual costs because the States could not always provideinformation needed to estimate costs for specific functions.2 Even allowing for a considerable marginof error, however, costs related to cost-containment were small. The estimated costs represented, onaverage, about 0.4 percent of the States’ FY2001 NSA costs.
The study did not estimate the cost of designing and implementing (as opposed to operating) cost-containment practices because the States implemented these practices many years ago. Programofficials in other States considering the initiation of a cost-containment practice should be aware ofthe unknown magnitude of implementation costs.
Access to Vendors
Four of the six States (all but North Carolina and Ohio) applied competitive pricing criteria at appli-cation to ensure that stores with excessive prices were not authorized.3 Connecticut, Oklahoma, andTexas had the most explicit and restrictive policies, using a fixed threshold for evaluating prices of astandard package of WIC foods. Program officials in all four States, however, said that they rarely, ifever, denied vendor authorization based on prices. Instead, if prices were high, the stores agreed toreduce their prices for WIC transactions.
Although very few stores were denied WIC authorization because of high prices, it is possible thatpricing criteria kept some higher priced stores from applying to WIC at all. This could lead to prob-lems with participant access to WIC-authorized outlets if enough stores elected not to apply.
Examination of shopping patterns, as measured in the Survey of WIC Participants, shows that vendorpricing restrictions in the three most restrictive States had no impact on participant access to WICvendors. Survey respondents in the three States with vendor restrictions, as a group, did not travel
2 In some instances, activities supporting cost-containment practices were so integrated with other administrativeprocesses that State officials could not provide estimates of the cost-containment portion of the activity.
3 Ohio’s policy of competitive pricing applies only when limits on the number of authorized vendors in an area havebeen reached. These limits had never been reached at the time data for this study were collected.
154
farther or longer to do their WIC shopping, compared with their regular shopping, than participants inthe remaining States, nor did they pay more in out-of-pocket expenses. A major reason for finding norelationship between price restrictions and access to vendors is that most survey respondents said theydid their WIC and regular shopping at the same store. A cross-State average of only 13.0 percent ofsurvey respondents did their WIC and non-WIC shopping at different stores.
Availability of Prescribed Foods
Cost-containment practices may reduce the availability of prescribed WIC foods in two ways. First,if competitive pricing restrictions have the unintentional consequence of limiting access to well-stocked stores, then WIC participants may have difficulty finding prescribed foods at WIC vendors.Second, when State cost-containment practices limit the number of food items that may be purchasedwith the WIC food instrument, the likelihood of finding an approved item at an authorized store maydecrease.
The study found that restrictions on the brands, types, and packaging of prescribed foods did notaffect item availability in a sample of stores in each State. Indeed, there is some evidence thatapproved items were more available, rather than less, at WIC-authorized stores in States with food-item restrictions. This could reflect grocers’ greater efforts and/or ability to maintain inventory ofWIC-approved foods when the number of approved items was reduced. It may also reflect greaterState enforcement of minimum inventory requirements when food-item restrictions are in place.
The study also compared the percentages of stores in States with and without restrictions that metWIC’s minimum variety requirements for store inventory. Nearly all stores met the requirements forall food categories. There were no significant differences between the States with and withoutrestrictions.
Participant Satisfaction With and Use of Prescribed Foods
Among the case study States, most surveyed WIC participants indicated they were “very satisfied”with the brands of food allowed on their State’s list of approved foods. Brand satisfaction washighest for milk, cheese, infant cereal, and juice, with satisfaction levels generally near or above 80percent. About 65 percent of respondents said they were “very satisfied” with allowed brands ofpeanut butter, and a little more than 50 percent indicated satisfaction with allowed brands of cereal.Most importantly, when overall satisfaction levels in States with restrictions are compared with levelsin the nonrestrictive States, the differences are small and usually not statistically insignificant. Onlyfor cheese and cereal did food-item restrictions affect levels of satisfaction with allowed brands.
With regard to “use” of prescribed foods, the study examined both the purchase and consumption ofWIC foods by asking survey respondents how much of their monthly prescription they purchased, andhow much of the purchased food they (or other WIC members of the household) ate or drank. Thefindings, by food category, were:
• Milk: Four States (Connecticut, North Carolina, Oklahoma, and Texas) required parti-cipants to purchase the least expensive brand of milk. The percentage of respondentspurchasing all their prescribed milk was not related to these least cost restrictions.Although the percentage of respondents drinking all their purchased milk was lower inthe States with restrictions than in the nonrestrictive States, the evidence suggests that
155
factors other than brand dissatisfaction accounted for this difference. The factors citedmost often by respondents were that “too much” milk was prescribed and that other (non-WIC) members of the household drank some of the milk.
• Eggs: Connecticut and Oklahoma required purchase of the least expensive brand of eggsavailable. These restrictions had no impact on the amount of eggs purchased. Consump-tion of purchased eggs in the two restricted States was lower than in the other States, butapparently not because of the imposed restrictions. The most commonly cited factor fornot eating all the purchased eggs was that too many were prescribed.
• Cheese: Survey respondents in California, Connecticut, and Oklahoma were somewhatless satisfied with allowed brands of cheese than respondents elsewhere. Respondents inStates with and without cheese restrictions, however, were equally likely to purchase andeat the cheese that had been prescribed for them by the local WIC office.
• Cereal: California and Oklahoma were the most restrictive States with regard to allowedbrands or types of cereal. California limited the number of different types of cereal thatcould be purchased, and Oklahoma required purchase of store-brand or private-labelcereals. When responses of sampled respondents in these two States were compared withthose in the other States, there were no significant differences in satisfaction with allowedbrands or the amount of cereal purchased or consumed. When Oklahoma is looked atseparately, however, brand satisfaction and the amount of cereal that survey respondentssaid they purchased and consumed were lower than in the other States.
• Infant cereal: With rebate contracts in place, California, Connecticut, and Texasallowed only Gerber infant cereal to be purchased. The brand restriction did not reducethe amount of infant cereal purchased or eaten.
• Juice: Four States had restrictions on the purchase of single-strength juice. Connecticutand Texas required purchase of the least expensive brand for some or all of theirapproved juices, Texas and California restricted the allowed types of juice, andOklahoma and Texas did not allow purchase of juice in plastic bottles. Oklahoma alsoapproved only store brands or private labels for most juice types. State restrictions onallowed juice were not related to the amount of juice purchased or consumed.
• Peanut butter: Connecticut limited purchase of peanut butter to the least expensivebrand available. This restriction had no impact on the amount of peanut butter bought oreaten.`
• Dried beans or peas: Oklahoma was the only State to restrict dried beans or peas,requiring purchase of the least expensive brand available in the store. This restriction hadno impact on the amount of dried beans/peas purchased, but it may have reduced theamount of purchased dried beans/peas that were eaten. Although the most commonreason given for not eating all the food that had been purchased was that “too much” wasprescribed, another common response was that the respondent did not like the beans orpeas. This latter response may have indicated dissatisfaction with the taste or quality ofthe least expensive brand.
The above findings on satisfaction with, and purchase and consumption of, prescribed foods are basedon the responses of all sampled participants in each State. There are participants, however, for whomtheir State’s food-item restrictions were binding—they would have bought a different federallyapproved food if it was included on their State’s list. Table 11-1 shows the percentage of sampled
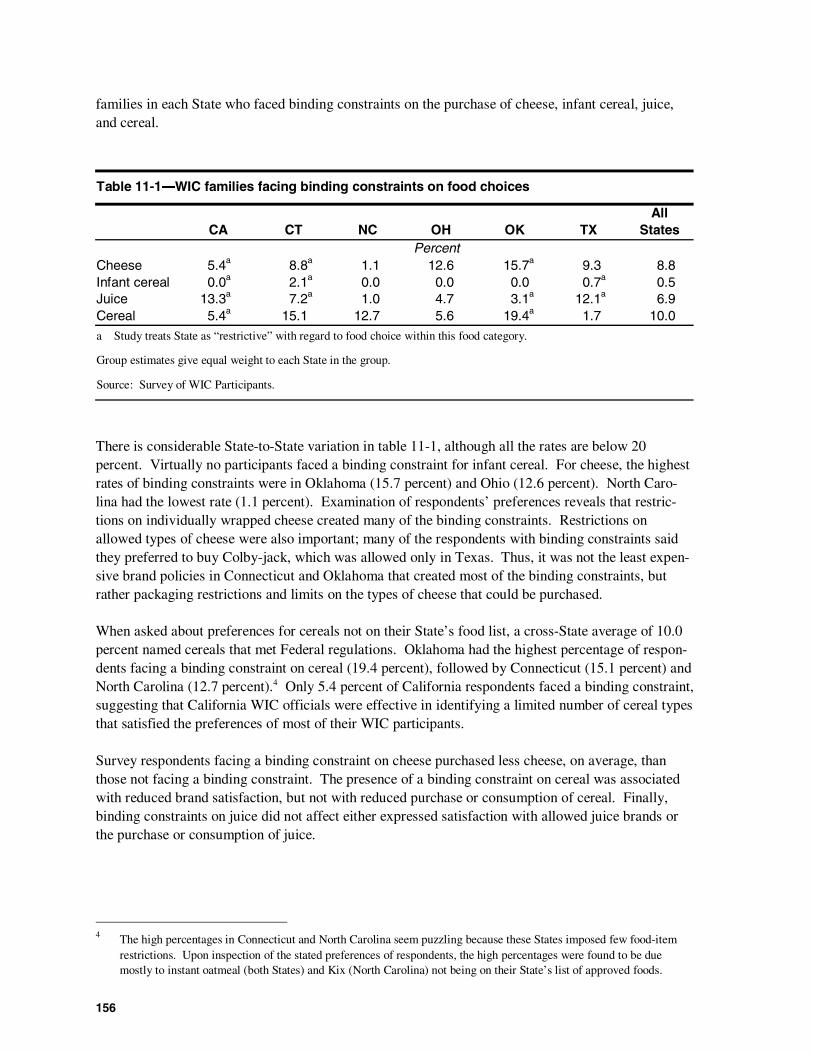
156
families in each State who faced binding constraints on the purchase of cheese, infant cereal, juice,and cereal.
Table 11-1―WIC families facing binding constraints on food choices
CA CT NC OH OK TXAll
StatesPercent
Cheese 5.4a 8.8a 1.1 12.6 15.7a 9.3 8.8Infant cereal 0.0a 2.1a 0.0 0.0 0.0 0.7a 0.5Juice 13.3a 7.2a 1.0 4.7 3.1a 12.1a 6.9Cereal 5.4a 15.1 12.7 5.6 19.4a 1.7 10.0
a Study treats State as “restrictive” with regard to food choice within this food category.
Group estimates give equal weight to each State in the group.
Source: Survey of WIC Participants.
There is considerable State-to-State variation in table 11-1, although all the rates are below 20percent. Virtually no participants faced a binding constraint for infant cereal. For cheese, the highestrates of binding constraints were in Oklahoma (15.7 percent) and Ohio (12.6 percent). North Caro-lina had the lowest rate (1.1 percent). Examination of respondents’ preferences reveals that restric-tions on individually wrapped cheese created many of the binding constraints. Restrictions onallowed types of cheese were also important; many of the respondents with binding constraints saidthey preferred to buy Colby-jack, which was allowed only in Texas. Thus, it was not the least expen-sive brand policies in Connecticut and Oklahoma that created most of the binding constraints, butrather packaging restrictions and limits on the types of cheese that could be purchased.
When asked about preferences for cereals not on their State’s food list, a cross-State average of 10.0percent named cereals that met Federal regulations. Oklahoma had the highest percentage of respon-dents facing a binding constraint on cereal (19.4 percent), followed by Connecticut (15.1 percent) andNorth Carolina (12.7 percent).4 Only 5.4 percent of California respondents faced a binding constraint,suggesting that California WIC officials were effective in identifying a limited number of cereal typesthat satisfied the preferences of most of their WIC participants.
Survey respondents facing a binding constraint on cheese purchased less cheese, on average, thanthose not facing a binding constraint. The presence of a binding constraint on cereal was associatedwith reduced brand satisfaction, but not with reduced purchase or consumption of cereal. Finally,binding constraints on juice did not affect either expressed satisfaction with allowed juice brands orthe purchase or consumption of juice.
4 The high percentages in Connecticut and North Carolina seem puzzling because these States imposed few food-itemrestrictions. Upon inspection of the stated preferences of respondents, the high percentages were found to be duemostly to instant oatmeal (both States) and Kix (North Carolina) not being on their State’s list of approved foods.
157
Impacts on Participants with Special Diets or Food Allergies
A large number of survey respondents said they (or another WIC member in the household) modifiedtheir diets for various health-related reasons; the modifications included high-fiber diets, sugar-free orlow-sugar diets, and low-fat or low-cholesterol diets. The percentage of respondents on special dietsvaried from a low of 28.5 percent in Texas to a high of 48.5 percent in North Carolina. In addition,depending on State, from zero to 4.8 percent of respondents said they followed religious diets, andfrom 0.2 to 2.8 percent said they followed vegetarian diets.
A cross-State average of 9.4 percent of survey respondents reported either that a doctor told them they(or another WIC member) had a food allergy, or they or the other individual had suffered a severereaction after eating a meal. The percentage of WIC families with food allergies varied from 4.6percent in Texas to 13.4 percent in North Carolina. Allergies to cow’s milk were most prevalent.
Respondents on special diets or with food allergies were asked whether their dietary restriction posedproblems finding appropriate foods in their WIC shopping. Only 2.5 percent said yes. When asked afollow-up question about the nature of their shopping problem, the most common responses were thatthey could not find out what ingredients were in a food item or did not know whether approvedbrands were safe or appropriate to eat. The small numbers of respondents involved, however, suggestthat food-item restrictions were not creating many problems for most WIC participants.
For each food category, patterns of brand satisfaction, purchase, and consumption of prescribed foodswere compared for respondents with and without special diets or allergies, using multivariate anal-ysis. There was no evidence that food-item restrictions had any disproportionate effects on theserespondents. Participants on special diets or with food allergies were occasionally less satisfied withbrands, or purchased or consumed less food than those without dietary restrictions, but the differenceswere no greater in States with food-item restrictions than those with none.
Food Instrument Redemption
Participant dissatisfaction with vendor or food-item restrictions used to reduce costs could lead toreduced use of food instruments, defeating the program goal of supplementing participants’ diets withnutritious foods. Three types of behavior could reduce food instrument use:
1. Participants could fail to pick up their food instruments at the local WIC office or clinic.
2. They could fail to redeem some or all of their food instruments.
3. For instruments containing multiple food categories, participants could purchase foodsfrom some categories but not all (“partial redemption”).
As shown in table 11-2, rates of food instrument issuance/pickup were high in the five States in whichthey could be calculated, varying from a low of 88.8 percent in Oklahoma to a high of 94.2 percent inOhio.5 Rates of food instrument redemption varied from a low of 80.6 percent in Ohio to a high of90.7 percent in California.
5 A food instrument pickup rate could not be determined for North Carolina because the State could not providecomplete data on food instrument issuances.
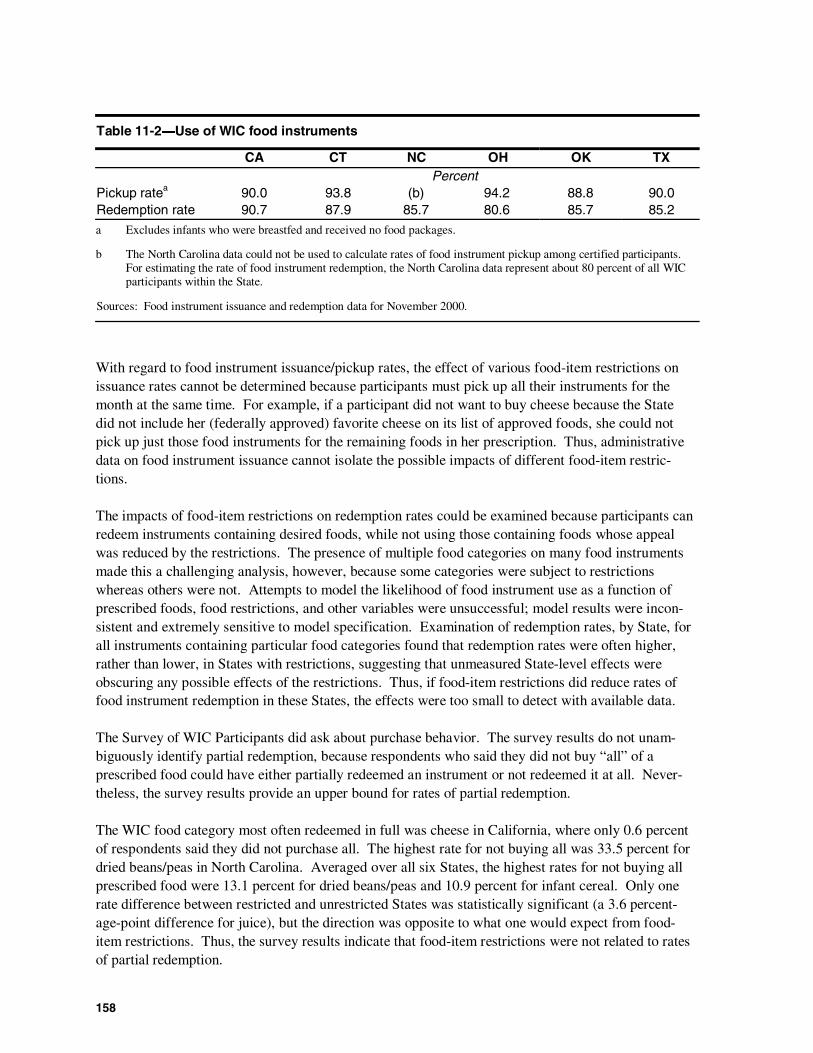
158
Table 11-2―Use of WIC food instruments
CA CT NC OH OK TXPercent
Pickup ratea 90.0 93.8 (b) 94.2 88.8 90.0Redemption rate 90.7 87.9 85.7 80.6 85.7 85.2
a Excludes infants who were breastfed and received no food packages.
b The North Carolina data could not be used to calculate rates of food instrument pickup among certified participants.For estimating the rate of food instrument redemption, the North Carolina data represent about 80 percent of all WICparticipants within the State.
Sources: Food instrument issuance and redemption data for November 2000.
With regard to food instrument issuance/pickup rates, the effect of various food-item restrictions onissuance rates cannot be determined because participants must pick up all their instruments for themonth at the same time. For example, if a participant did not want to buy cheese because the Statedid not include her (federally approved) favorite cheese on its list of approved foods, she could notpick up just those food instruments for the remaining foods in her prescription. Thus, administrativedata on food instrument issuance cannot isolate the possible impacts of different food-item restric-tions.
The impacts of food-item restrictions on redemption rates could be examined because participants canredeem instruments containing desired foods, while not using those containing foods whose appealwas reduced by the restrictions. The presence of multiple food categories on many food instrumentsmade this a challenging analysis, however, because some categories were subject to restrictionswhereas others were not. Attempts to model the likelihood of food instrument use as a function ofprescribed foods, food restrictions, and other variables were unsuccessful; model results were incon-sistent and extremely sensitive to model specification. Examination of redemption rates, by State, forall instruments containing particular food categories found that redemption rates were often higher,rather than lower, in States with restrictions, suggesting that unmeasured State-level effects wereobscuring any possible effects of the restrictions. Thus, if food-item restrictions did reduce rates offood instrument redemption in these States, the effects were too small to detect with available data.
The Survey of WIC Participants did ask about purchase behavior. The survey results do not unam-biguously identify partial redemption, because respondents who said they did not buy “all” of aprescribed food could have either partially redeemed an instrument or not redeemed it at all. Never-theless, the survey results provide an upper bound for rates of partial redemption.
The WIC food category most often redeemed in full was cheese in California, where only 0.6 percentof respondents said they did not purchase all. The highest rate for not buying all was 33.5 percent fordried beans/peas in North Carolina. Averaged over all six States, the highest rates for not buying allprescribed food were 13.1 percent for dried beans/peas and 10.9 percent for infant cereal. Only onerate difference between restricted and unrestricted States was statistically significant (a 3.6 percent-age-point difference for juice), but the direction was opposite to what one would expect from food-item restrictions. Thus, the survey results indicate that food-item restrictions were not related to ratesof partial redemption.
159
Program Participation
One concern with the use of cost-containment practices is that they may reduce participants’ satisfac-tion with the WIC program, leading to reduced participation, and hence, reduced distribution of healthand nutrition benefits to eligible individuals. The study addressed this possibility by examiningprogram “dropout” rates and conducting focus groups with WIC dropouts to determine whether Staterestrictions on vendors or food choice contributed to their decision to leave the program.
The study defined program dropouts as participants who failed to pick up their food instruments for 2consecutive months in the 6-month period prior to November 2000 (except in California, where datalimitations caused dropouts to be defined as participants who failed to pick up their most recent set offood instruments prior to November 2000).
The WIC dropout rate varied from a low of 2.5 percent in North Carolina to a high of 4.2 percent inCalifornia. All the rates were relatively low, and factors unrelated to cost containment (for instance,problems getting to the clinic for an appointment, difficulty using the food instruments, the belief thatone was no longer eligible for WIC) explained some of the dropouts.
Focus group sessions were held with dropouts who said, during a screening interview, that vendor orfood-item restrictions contributed to their dropping out. Finding enough dropouts who met thescreening criteria proved difficult, suggesting that most dropouts failed to pick up their instrumentsfor reasons unrelated to cost-containment practices. Indeed, even among the focus group respon-dents, the major reasons for dropping out were unpleasant experiences at WIC clinics and the“hassle” of picking up one’s food instruments. Only about one-third of all focus group respondentssaid that food-item restrictions were their major or second most important reason for dropping out.Vendor restrictions were seldom mentioned. Thus, although cost-containment practices may havecontributed to the decision of some participants to stop participating in WIC, the evidence suggeststhat any effects were small.
Health Outcomes
WIC cost-containment practices do not directly affect the health outcomes of WIC participants, butthere is potential for an indirect effect. If limits on food choice result in reduced food instrumentredemption or food use, then WIC’s goal of improving health and nutrition status by providingnutrient-dense foods could be compromised. Similarly, if cost-containment practices cause partici-pants to drop out of the program, they would not have access to the program’s nutrition education andhealth referral services.
Based on study results, there is little evidence that the six States’ cost-containment practices affectedfood instrument redemption, food use, or participation rates. Thus, the study concludes that thesecost-containment practices did not have adverse effects on health outcomes of participants.
Despite the conclusion that cost-containment practices could not have affected health outcomesbecause they did not affect food instrument redemption or food use, the study did examine the rela-tionship between food instrument redemption rates and changes in four health measures, based onWIC participants observed in the November 2000 caseload and recertified by April 2001. The fourhealth measures, and the groups of participants to which they were applied, are shown in table 11-3.
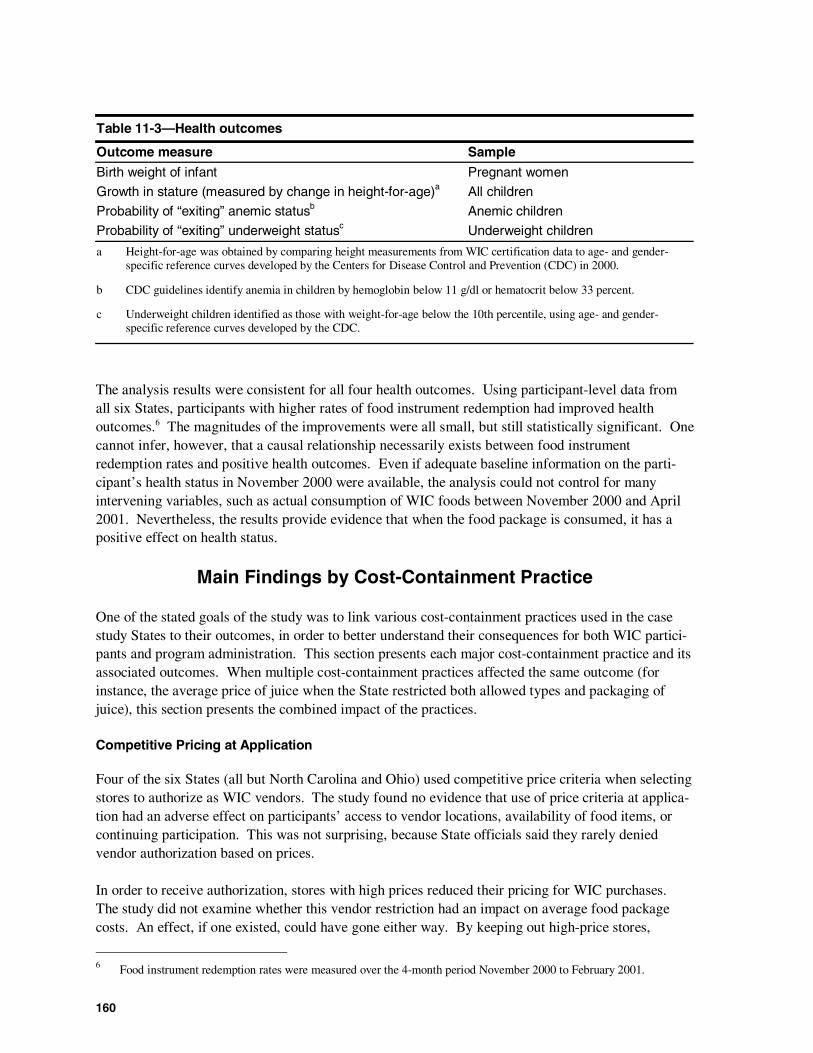
160
Table 11-3—Health outcomes
Outcome measure Sample
Birth weight of infant Pregnant women
Growth in stature (measured by change in height-for-age)a All children
Probability of “exiting” anemic statusb Anemic children
Probability of “exiting” underweight statusc Underweight children
a Height-for-age was obtained by comparing height measurements from WIC certification data to age- and gender-specific reference curves developed by the Centers for Disease Control and Prevention (CDC) in 2000.
b CDC guidelines identify anemia in children by hemoglobin below 11 g/dl or hematocrit below 33 percent.
c Underweight children identified as those with weight-for-age below the 10th percentile, using age- and gender-specific reference curves developed by the CDC.
The analysis results were consistent for all four health outcomes. Using participant-level data fromall six States, participants with higher rates of food instrument redemption had improved healthoutcomes.6 The magnitudes of the improvements were all small, but still statistically significant. Onecannot infer, however, that a causal relationship necessarily exists between food instrumentredemption rates and positive health outcomes. Even if adequate baseline information on the parti-cipant’s health status in November 2000 were available, the analysis could not control for manyintervening variables, such as actual consumption of WIC foods between November 2000 and April2001. Nevertheless, the results provide evidence that when the food package is consumed, it has apositive effect on health status.
Main Findings by Cost-Containment Practice
One of the stated goals of the study was to link various cost-containment practices used in the casestudy States to their outcomes, in order to better understand their consequences for both WIC partici-pants and program administration. This section presents each major cost-containment practice and itsassociated outcomes. When multiple cost-containment practices affected the same outcome (forinstance, the average price of juice when the State restricted both allowed types and packaging ofjuice), this section presents the combined impact of the practices.
Competitive Pricing at Application
Four of the six States (all but North Carolina and Ohio) used competitive price criteria when selectingstores to authorize as WIC vendors. The study found no evidence that use of price criteria at applica-tion had an adverse effect on participants’ access to vendor locations, availability of food items, orcontinuing participation. This was not surprising, because State officials said they rarely deniedvendor authorization based on prices.
In order to receive authorization, stores with high prices reduced their pricing for WIC purchases.The study did not examine whether this vendor restriction had an impact on average food packagecosts. An effect, if one existed, could have gone either way. By keeping out high-price stores,
6 Food instrument redemption rates were measured over the 4-month period November 2000 to February 2001.
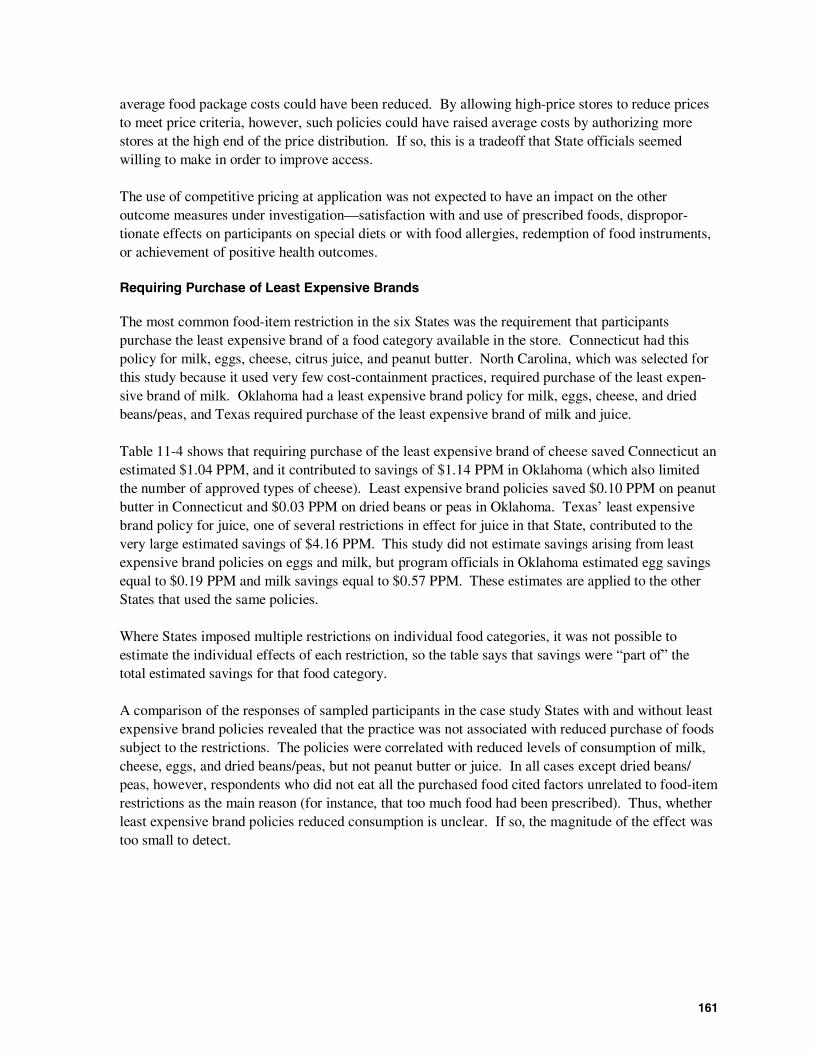
161
average food package costs could have been reduced. By allowing high-price stores to reduce pricesto meet price criteria, however, such policies could have raised average costs by authorizing morestores at the high end of the price distribution. If so, this is a tradeoff that State officials seemedwilling to make in order to improve access.
The use of competitive pricing at application was not expected to have an impact on the otheroutcome measures under investigation—satisfaction with and use of prescribed foods, dispropor-tionate effects on participants on special diets or with food allergies, redemption of food instruments,or achievement of positive health outcomes.
Requiring Purchase of Least Expensive Brands
The most common food-item restriction in the six States was the requirement that participantspurchase the least expensive brand of a food category available in the store. Connecticut had thispolicy for milk, eggs, cheese, citrus juice, and peanut butter. North Carolina, which was selected forthis study because it used very few cost-containment practices, required purchase of the least expen-sive brand of milk. Oklahoma had a least expensive brand policy for milk, eggs, cheese, and driedbeans/peas, and Texas required purchase of the least expensive brand of milk and juice.
Table 11-4 shows that requiring purchase of the least expensive brand of cheese saved Connecticut anestimated $1.04 PPM, and it contributed to savings of $1.14 PPM in Oklahoma (which also limitedthe number of approved types of cheese). Least expensive brand policies saved $0.10 PPM on peanutbutter in Connecticut and $0.03 PPM on dried beans or peas in Oklahoma. Texas’ least expensivebrand policy for juice, one of several restrictions in effect for juice in that State, contributed to thevery large estimated savings of $4.16 PPM. This study did not estimate savings arising from leastexpensive brand policies on eggs and milk, but program officials in Oklahoma estimated egg savingsequal to $0.19 PPM and milk savings equal to $0.57 PPM. These estimates are applied to the otherStates that used the same policies.
Where States imposed multiple restrictions on individual food categories, it was not possible toestimate the individual effects of each restriction, so the table says that savings were “part of” thetotal estimated savings for that food category.
A comparison of the responses of sampled participants in the case study States with and without leastexpensive brand policies revealed that the practice was not associated with reduced purchase of foodssubject to the restrictions. The policies were correlated with reduced levels of consumption of milk,cheese, eggs, and dried beans/peas, but not peanut butter or juice. In all cases except dried beans/peas, however, respondents who did not eat all the purchased food cited factors unrelated to food-itemrestrictions as the main reason (for instance, that too much food had been prescribed). Thus, whetherleast expensive brand policies reduced consumption is unclear. If so, the magnitude of the effect wastoo small to detect.
162
Table 11-4―Estimated savings per participant per month from requiring purchase of leastexpensive brands
CA CT NC OH OK TXDollars PPM
Milk 0.57a 0.57a 0.57a 0.57a
Eggs 0.19a 0.19a
Cheese 1.04 Part of 1.14b
Juice Part of 1.69b Part of 4.16b
Peanut butter 0.10 0.03
Blank cell indicates that State did not impose a least expensive brand policy for that food category.
a Savings estimate based on information provided by State WIC officials in Oklahoma; this information is the onlyavailable evidence on savings due to least expensive policies for milk and eggs.
b State applied multiple restrictions to this food category.
Sources: Survey of Food Prices and Item Availability, State administrative data on food packages, and interviews withState officials.
There is no evidence that the use of least expensive brand policies affected the study’s other outcomemeasures, or that they had disproportionate effects on participants on special diets or with food aller-gies.
Limiting Approved Brands
Oklahoma was the only State that required purchase of private-label or store-brand items for cerealsand juices. Texas also placed limits on brands of juice, allowing selected national brands.
Oklahoma’s restrictions against national brands of cereal saved an estimated $2.72 PPM. The restric-tions, however, were associated with lower levels of participant satisfaction with allowed brands ofcereal, reduced levels of cereal purchase, and reduced levels of consumption. In response to partici-pant preferences, Oklahoma added some national-brand cereals to its list of approved foods after datafor this study were collected.
With respect to brand restrictions on juice, they had no impact on expressed levels of satisfaction withapproved brands. In addition, they did not reduce either the amount of juice purchased or consumed.
Finally, there is no evidence that limiting the number of approved juice and cereal brands affectedrates of either food instrument pickup (based on focus group respondents’ reasons for dropping out ofWIC), instrument redemption, achievement of positive health outcomes, or the availability of allowedjuice or cereal in these States.
Limiting Approved Types of Foods
As shown in table 11-5, all States except Ohio limited the types of certain foods on their approvedlists. California approved a relatively small number of cheeses, juices, and cereals, and it prohibitedpurchase of extra-large or jumbo eggs and infant juice (substituting single-strength juice instead).Connecticut limited egg selection to large white eggs only, and it prohibited purchase of infant juice.North Carolina also prescribed single-strength juice instead of infant juice. Oklahoma prohibited
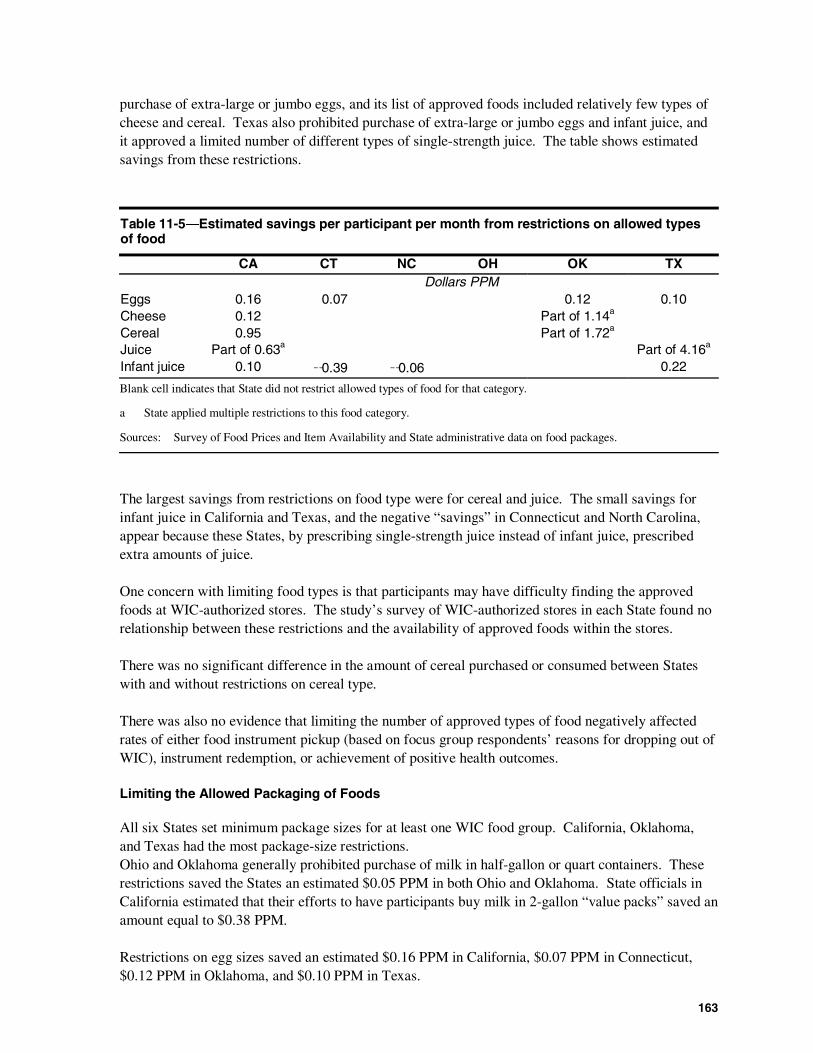
163
purchase of extra-large or jumbo eggs, and its list of approved foods included relatively few types ofcheese and cereal. Texas also prohibited purchase of extra-large or jumbo eggs and infant juice, andit approved a limited number of different types of single-strength juice. The table shows estimatedsavings from these restrictions.
Table 11-5―Estimated savings per participant per month from restrictions on allowed typesof food
CA CT NC OH OK TXDollars PPM
Eggs 0.16 0.07 0.12 0.10Cheese 0.12 Part of 1.14a
Cereal 0.95 Part of 1.72a
Juice Part of 0.63a Part of 4.16a
Infant juice 0.10!0.39 !0.06 0.22
Blank cell indicates that State did not restrict allowed types of food for that category.
a State applied multiple restrictions to this food category.
Sources: Survey of Food Prices and Item Availability and State administrative data on food packages.
The largest savings from restrictions on food type were for cereal and juice. The small savings forinfant juice in California and Texas, and the negative “savings” in Connecticut and North Carolina,appear because these States, by prescribing single-strength juice instead of infant juice, prescribedextra amounts of juice.
One concern with limiting food types is that participants may have difficulty finding the approvedfoods at WIC-authorized stores. The study’s survey of WIC-authorized stores in each State found norelationship between these restrictions and the availability of approved foods within the stores.
There was no significant difference in the amount of cereal purchased or consumed between Stateswith and without restrictions on cereal type.
There was also no evidence that limiting the number of approved types of food negatively affectedrates of either food instrument pickup (based on focus group respondents’ reasons for dropping out ofWIC), instrument redemption, or achievement of positive health outcomes.
Limiting the Allowed Packaging of Foods
All six States set minimum package sizes for at least one WIC food group. California, Oklahoma,and Texas had the most package-size restrictions.Ohio and Oklahoma generally prohibited purchase of milk in half-gallon or quart containers. Theserestrictions saved the States an estimated $0.05 PPM in both Ohio and Oklahoma. State officials inCalifornia estimated that their efforts to have participants buy milk in 2-gallon “value packs” saved anamount equal to $0.38 PPM.
Restrictions on egg sizes saved an estimated $0.16 PPM in California, $0.07 PPM in Connecticut,$0.12 PPM in Oklahoma, and $0.10 PPM in Texas.
164
Texas imposed larger package-size requirements on cereal purchases to take advantage of lower per-ounce costs. The estimated savings from this policy were $2.00 PPM. The State’s restrictions onshelf-stable juice containers (46-ounce cans only) contributed to juice savings of $4.16 PPM.
There is no evidence that limiting the package forms of food negatively affected either rates of foodinstrument pickup (based on focus group respondents’ reasons for dropping out of WIC), instrumentredemption, consumption of prescribed foods, the achievement of positive health outcomes, orprogram participation.
Manufacturer Rebates
California, Connecticut, and Texas received rebates on sales of infant cereal through contracts thatspecified a single allowed brand. These rebates saved an estimated $0.32 PPM in California, $0.37PPM in Connecticut, and $0.27 PPM in Texas.
The infant cereal rebates did not affect the availability of allowed brands in the three States. Theywere binding on almost no WIC participants, and the brand restrictions were not related to levels ofbrand satisfaction, amount purchased, or amount consumed. There is also no evidence that the infantcereal rebates affected rates of food instrument redemption, program participation, or the achievementof positive health outcomes.
Multiple Food-Item Restrictions
The States in the study imposed multiple food-item restrictions for some foods, and it was not poss-ible for the study to estimate the singular effect of the individual restrictions. This section summar-izes the total effects of these multiple restrictions.
For cheese, least expensive brand policies and restrictions on type and packaging created bindingconstraints on a cross-State average of 8.8 percent of survey respondents, with the lowest rate inNorth Carolina (1.1 percent) and the highest rates in Oklahoma (15.7 percent) and Ohio (12.6percent).
Restrictions on brand, type, and packaging of breakfast cereal were binding on a cross-State averageof 10.0 percent of survey respondents, with the highest rates in Oklahoma (19.4 percent), Connecticut(15.1 percent), and North Carolina (12.7 percent). Texas had the lowest rate (1.7 percent).
Least expensive brand policies and restrictions on brand, type, and packaging of juice were bindingon a cross-State average of 6.9 percent of survey respondents, with the highest rates in California(13.3 percent) and Texas (12.1 percent). The lowest rate was in North Carolina (1.0 percent).
Finally, there is no evidence that any food-item restrictions had a differential impact on WIC partici-pants with food allergies or those on special diets.
165
Implications of the Findings for Other States
The cost-containment practices implemented by the six case study States were relatively inexpensiveto manage and operate, reduced food package costs, and had few adverse impacts on WIC partici-pants. It is therefore tempting to conclude that all States should implement similar practices.7
For cost-containment practices to work, they need to be well managed by State officials. The successof cost containment in the case study States was the result of ongoing efforts by these States to findthose restrictions that both reduced food package costs and were acceptable to participants. (Forinstance, all six States collected price information on a regular basis and obtained feedback from localoffices on participant comments on allowed foods.) What works well in one State might not work atall in another. Similarly, an effective practice today may not work tomorrow. Selecting and manag-ing appropriate cost-containment practices is therefore a dynamic process, requiring ongoing attentionto local food markets (especially price and availability of federally approved food items) and partici-pant preferences.
A critical factor in this process lies in the ongoing evaluation of program effectiveness. To facilitatethis activity, States should not overlook the ability to systematically collect and analyze relevant data.In the process of assessing cost-containment practices for this study, considerable limitations anddifficulties were encountered due to a lack of program information in readily useable form. In mostStates, for example, the effects of cost-containment practices on food redemptions could not becompletely analyzed due to different foods being combined on individual food instruments.
This study provides evidence that cost-containment practices can reduce WIC food package costs.Estimates of cost savings in other States are beyond the scope of this study, as are estimates of thepotential for additional savings if further restrictions were adopted. The potential for further costsavings would depend on States’ current use of vendor and item restrictions and Federal incentivesfor States to adopt additional restrictions. Furthermore, not all cost-containment practices may beappropriate for all States because of differences in item prices, availability, and participant prefer-ences. States therefore need the flexibility to find the right balance between food cost reductions andlimits on participant choice and use.
7 Many other States, of course, already use cost-containment practices. The six States in this study were selected only torepresent different combinations of these practices.

A-1
Appendix ASurvey of WIC Participants
This appendix discusses the sample design for the Survey of WIC Participants and presents informa-tion on sampling weights and survey response rates. As part of the discussion of the sample design,the appendix lists geographic areas included in the survey and the local WIC offices serving thoseareas. Officials in these local WIC offices were interviewed as part of the study’s examination ofhow cost-containment practices are implemented and their administrative costs. The appendixincludes a copy of the survey instrument.
Survey Purpose and Structure of Instrument
The Survey of WIC Participants collected information related to almost all of the outcome measuresexamined by this study. The survey instrument included sections on:
A. Item SatisfactionB. Voucher PickupC. Item SelectionCX. Item Preferences of NonparticipantsD. Access to WIC VendorsE. ParticipationF. Special Diets or Food AllergiesG. Health OutcomesH. Demographics
The survey asked about satisfaction with WIC benefits and experiences redeeming food instruments(vouchers) during the “reference month.” The reference month generally was the calendar monthprior to the interview date. If the respondent indicated that none of the food instruments for the priormonth had been used, the reference month was designated as two months prior to the interview date.1
Sampling
The Survey of WIC Participants was conducted in six States. The goal was to survey 1,200 WICfamilies, with the respondent being the “WIC mom” (pregnant, breastfeeding, postpartum woman ormother/guardian of WIC infant or child). Assuming a minimum response rate of 72 percent, an initialsample of 1,669 families was selected. WIC families were chosen as the responding unit, rather thanWIC participants, because in families with multiple WIC participants, it was believed that the respon-dent would have trouble distinguishing the food items purchased with each set of vouchers.
The sample was selected via three stages of sampling:
1 Food instruments expire at the end of their designated month.
A-2
Stage 1. The population of WIC participants was stratified by geographic location, defined by non-metropolitan, metropolitan, and urban areas.2 Three survey areas (one per strata) were selected ineach State, with probability proportional to size. The measure of size used was the number offamilies receiving WIC in November 2000. Families were identified by the “family ID” that linksWIC participants in State administrative data files.3
Stage 2. In all States except Connecticut, a second stage of sampling selected four zip code areaswithin the urban area, to reduce the geographic size of the urban survey area. ZIP code areas wereselected with probability proportional to size. The urban area in Connecticut was small enough toforego this second stage of sampling.
Stage 3. The final stage of sampling selected WIC families within each survey area. In Connecticut,an equal number of families was selected in each survey area (93 families per strata for a total of 279families). In other States, it was necessary to increase the size of the urban sample, relative to theother strata, to offset the increased variance imposed by the second stage of sampling in the urbanarea. The sample size for urban areas was 103 families, and 87 or 88 families were selected in thenon-metro and metro areas, for a total of 278 families per State.
Areas Selected
The first stage of sampling selected 18 geographic areas—a central city, a metropolitan, and a non-metropolitan area in each of the six States (representing urban, suburban, and rural sites, respec-tively). Table A-1 lists the 18 areas, together with the WIC office that was included in the study ofimplementation procedures and administrative costs. When more than one WIC office served ageographic area, the office serving the largest number of sampled participants was selected for thestudy. In Oklahoma, State officials recommended replacement offices for Canadian and Paynecounties with similar caseloads and operating characteristics.
Response Rates
Response to the Survey of WIC Participants is shown in table A-2. The overall response rate was 77percent; the response rate ranged from 72.8 percent in Texas to 82.8 percent in Connecticut. Nonme-tropolitan areas achieved the highest response rates in four of the six States, with metropolitan areasachieving the highest response rate in North Carolina and Ohio.
Table A-2 also shows the number of respondents to "Section CX" of the survey. Section CX wasdesigned as an alternative to Section C (food item selection) for respondents who did not pick upWIC food instruments for the reference month. Overall, 14 percent of respondents did not pick uptheir food instruments; these respondents include WIC participants whose certification period endedprior to the interview, and who did not seek re-certification.
2 Nonmetropolitan areas were defined as counties outside of Census-defined Metropolitan Statistical Areas (MSAs);metropolitan areas were defined as counties in MSAs, exclusive of the central city portion of the county; urban areaswere defined as central cities in MSAs.
3 The family ID was constructed for North Carolina.
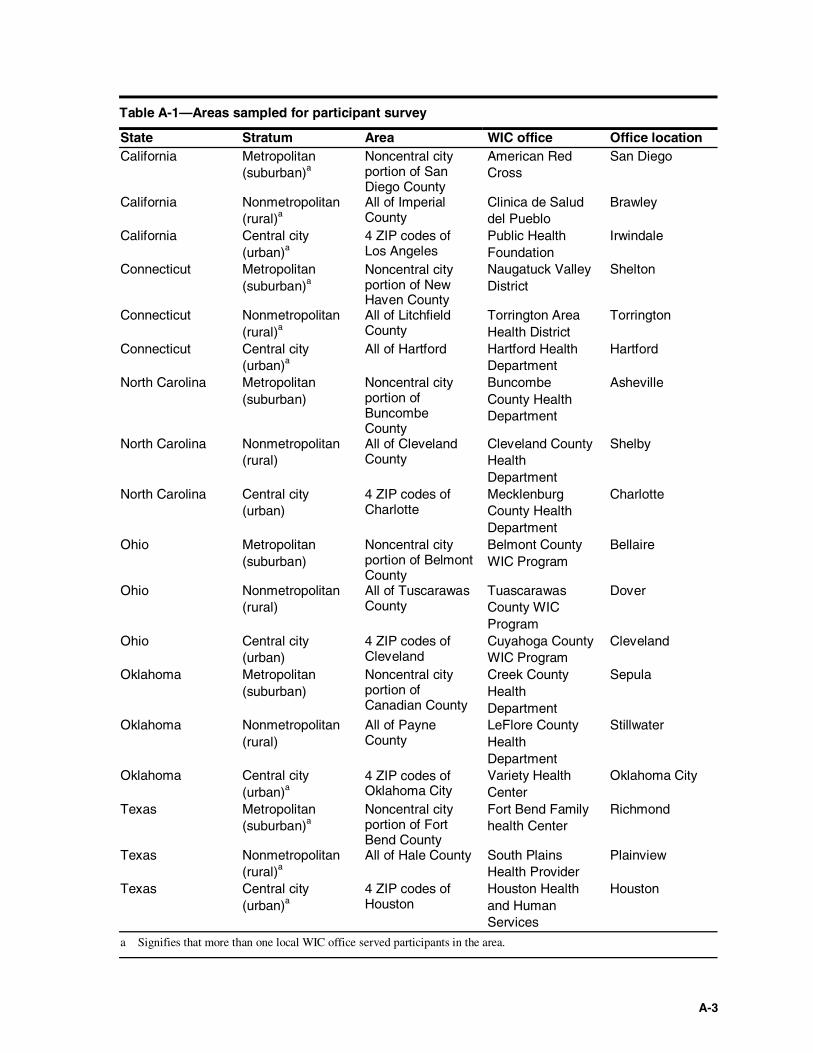
A-3
Table A-1—Areas sampled for participant survey
State Stratum Area WIC office Office locationCalifornia Metropolitan
(suburban)aNoncentral cityportion of SanDiego County
American RedCross
San Diego
California Nonmetropolitan(rural)a
All of ImperialCounty
Clinica de Saluddel Pueblo
Brawley
California Central city(urban)a
4 ZIP codes ofLos Angeles
Public HealthFoundation
Irwindale
Connecticut Metropolitan(suburban)a
Noncentral cityportion of NewHaven County
Naugatuck ValleyDistrict
Shelton
Connecticut Nonmetropolitan(rural)a
All of LitchfieldCounty
Torrington AreaHealth District
Torrington
Connecticut Central city(urban)a
All of Hartford Hartford HealthDepartment
Hartford
North Carolina Metropolitan(suburban)
Noncentral cityportion ofBuncombeCounty
BuncombeCounty HealthDepartment
Asheville
North Carolina Nonmetropolitan(rural)
All of ClevelandCounty
Cleveland CountyHealthDepartment
Shelby
North Carolina Central city(urban)
4 ZIP codes ofCharlotte
MecklenburgCounty HealthDepartment
Charlotte
Ohio Metropolitan(suburban)
Noncentral cityportion of BelmontCounty
Belmont CountyWIC Program
Bellaire
Ohio Nonmetropolitan(rural)
All of TuscarawasCounty
TuascarawasCounty WICProgram
Dover
Ohio Central city(urban)
4 ZIP codes ofCleveland
Cuyahoga CountyWIC Program
Cleveland
Oklahoma Metropolitan(suburban)
Noncentral cityportion ofCanadian County
Creek CountyHealthDepartment
Sepula
Oklahoma Nonmetropolitan(rural)
All of PayneCounty
LeFlore CountyHealthDepartment
Stillwater
Oklahoma Central city(urban)a
4 ZIP codes ofOklahoma City
Variety HealthCenter
Oklahoma City
Texas Metropolitan(suburban)a
Noncentral cityportion of FortBend County
Fort Bend Familyhealth Center
Richmond
Texas Nonmetropolitan(rural)a
All of Hale County South PlainsHealth Provider
Plainview
Texas Central city(urban)a
4 ZIP codes ofHouston
Houston Healthand HumanServices
Houston
a Signifies that more than one local WIC office served participants in the area.
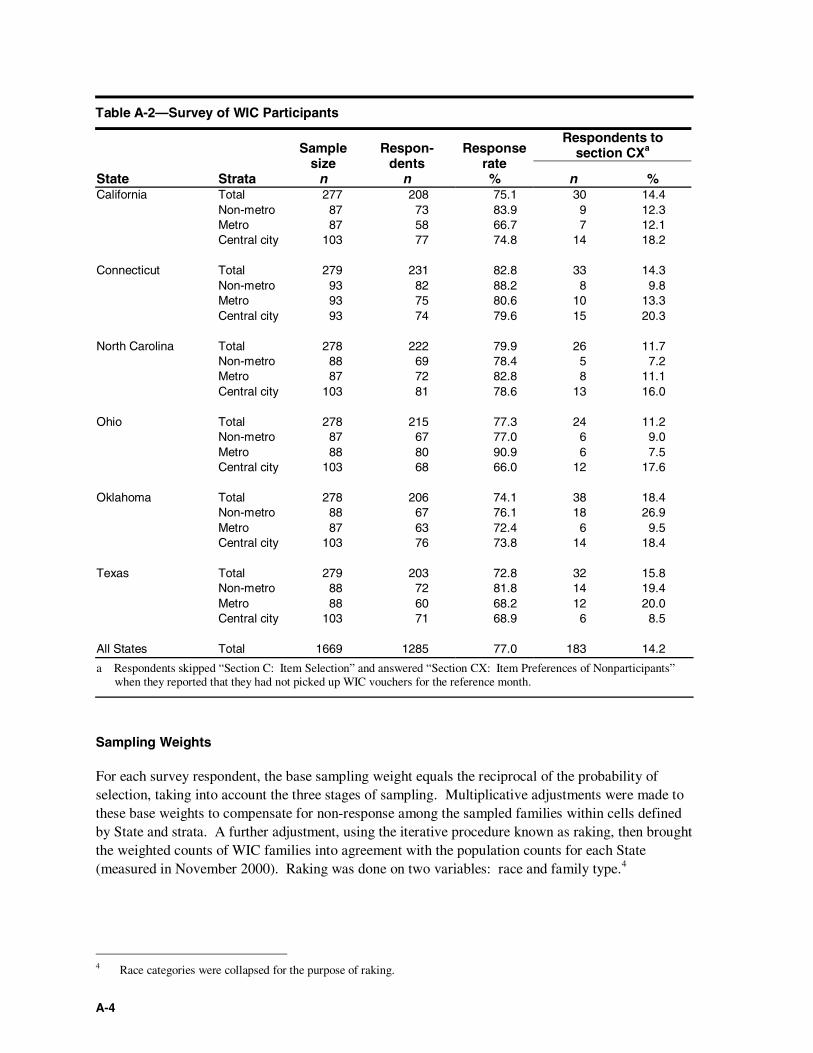
A-4
Table A-2—Survey of WIC Participants
Respondents tosection CXa
State Strata
Samplesize
n
Respon-dents
n
Responserate% n %
California Total 277 208 75.1 30 14.4Non-metro 87 73 83.9 9 12.3Metro 87 58 66.7 7 12.1Central city 103 77 74.8 14 18.2
Connecticut Total 279 231 82.8 33 14.3Non-metro 93 82 88.2 8 9.8Metro 93 75 80.6 10 13.3Central city 93 74 79.6 15 20.3
North Carolina Total 278 222 79.9 26 11.7Non-metro 88 69 78.4 5 7.2Metro 87 72 82.8 8 11.1Central city 103 81 78.6 13 16.0
Ohio Total 278 215 77.3 24 11.2Non-metro 87 67 77.0 6 9.0Metro 88 80 90.9 6 7.5Central city 103 68 66.0 12 17.6
Oklahoma Total 278 206 74.1 38 18.4Non-metro 88 67 76.1 18 26.9Metro 87 63 72.4 6 9.5Central city 103 76 73.8 14 18.4
Texas Total 279 203 72.8 32 15.8Non-metro 88 72 81.8 14 19.4Metro 88 60 68.2 12 20.0Central city 103 71 68.9 6 8.5
All States Total 1669 1285 77.0 183 14.2
a Respondents skipped “Section C: Item Selection” and answered “Section CX: Item Preferences of Nonparticipants”when they reported that they had not picked up WIC vouchers for the reference month.
Sampling Weights
For each survey respondent, the base sampling weight equals the reciprocal of the probability ofselection, taking into account the three stages of sampling. Multiplicative adjustments were made tothese base weights to compensate for non-response among the sampled families within cells definedby State and strata. A further adjustment, using the iterative procedure known as raking, then broughtthe weighted counts of WIC families into agreement with the population counts for each State(measured in November 2000). Raking was done on two variables: race and family type.4
4 Race categories were collapsed for the purpose of raking.

A-5
Survey Instrument
A paper copy of the survey instrument for the Survey of WIC Participants is attached at the end ofthis appendix. The actual survey was conducted using CATI (computer assisted telephone interview)software. Field interviewers administered the survey using laptop computers.

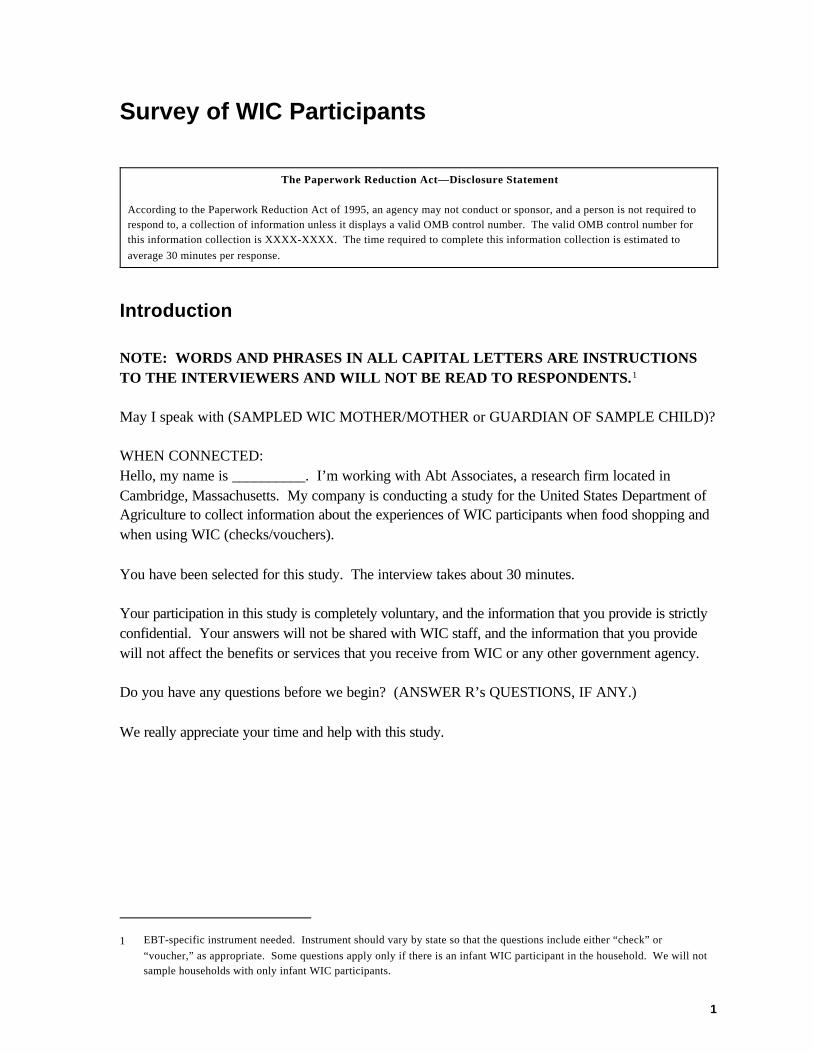
1 EBT-specific instrument needed. Instrument should vary by state so that the questions include either “check” or“voucher,” as appropriate. Some questions apply only if there is an infant WIC participant in the household. We will notsample households with only infant WIC participants.
1
Survey of WIC Participants
The Paperwork Reduction Act—Disclosure Statement
According to the Paperwork Reduction Act of 1995, an agency may not conduct or sponsor, and a person is not required torespond to, a collection of information unless it displays a valid OMB control number. The valid OMB control number forthis information collection is XXXX-XXXX. The time required to complete this information collection is estimated toaverage 30 minutes per response.
Introduction
NOTE: WORDS AND PHRASES IN ALL CAPITAL LETTERS ARE INSTRUCTIONSTO THE INTERVIEWERS AND WILL NOT BE READ TO RESPONDENTS.1
May I speak with (SAMPLED WIC MOTHER/MOTHER or GUARDIAN OF SAMPLE CHILD)?
WHEN CONNECTED:Hello, my name is __________. I’m working with Abt Associates, a research firm located inCambridge, Massachusetts. My company is conducting a study for the United States Department ofAgriculture to collect information about the experiences of WIC participants when food shopping andwhen using WIC (checks/vouchers).
You have been selected for this study. The interview takes about 30 minutes.
Your participation in this study is completely voluntary, and the information that you provide is strictlyconfidential. Your answers will not be shared with WIC staff, and the information that you providewill not affect the benefits or services that you receive from WIC or any other government agency.
Do you have any questions before we begin? (ANSWER R’s QUESTIONS, IF ANY.)
We really appreciate your time and help with this study.

2
1. I’d like to begin by confirming some information. According to our records,
You are the only member of your household receiving WIC foods (PREGNANT ORBREASTFEEDING WOMAN), or
(You and/or NAME(s)) are currently receiving WIC foods (PREGNANT ANDCHILD; POSTPARTUM AND INFANT/CHILDREN; INFANT/CHILDREN)
Is that correct?
YES . . . . . . . . . . . . . . . . . . . . . . . . . . . . . . . . . . . . . . . GO TO A1NO . . . . . . . . . . . . . . . . . . . . . . . . . . . . . . . . . . . . . . . ASK 2
2. Are you currently receiving WIC foods?
YES . . . . . . . . . . . . . . . . . . . . . . . . . . . . . . . . . . . . . . . ASK 2aNO . . . . . . . . . . . . . . . . . . . . . . . . . . . . . . . . . . . . . . . GO TO 3
a. Please tell me the ages of the children in your household currently receiving WIC foods. (IF AGE < 1 YEAR, ENTER 0.)
AGE
[NOTE TO PROGRAMMER: HOUSEHOLD IS PRECODED WITH FLAGS FORTYPES OF WIC PARTICIPANTS—WOMAN, INFANT, CHILD. UPDATE FLAGSBASED ON ABOVE INFO. IF AGE < 1 YEAR THEN INFANT = 1. IF AGE = 1–4YEARS THEN CHILD = 1.]
3. PROGRAMMER CHECK: IF 2 = NO AND ONLY ONE AGE IS ENTERED IN 2a ANDAGE = 0, THEN STOP INTERVIEW.
According to what you have told me, the only person in your household who receives WICfoods is your infant. Is that correct?
YES . . . . . . . . . . . . . . . . . . . . . . . . . . . . . . . . . . . . . . . GO TO EXITNO . . . . . . . . . . . . . . . . . . . . . . . . . . . . . . . . . . . . . . . GO BACK TO 2

3
Exit
This study is interested in learning about the experiences of women and children WIC participants, sowe will not need to continue with the survey. Thank you for your time.
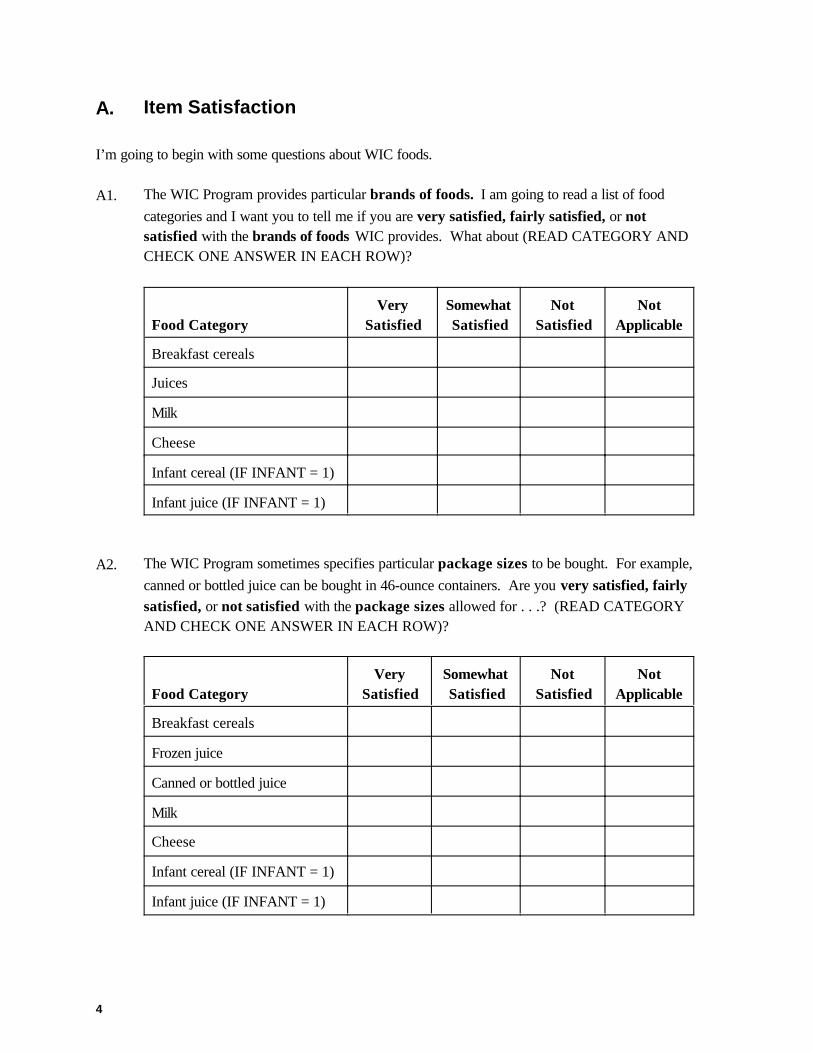
4
A. Item Satisfaction
I’m going to begin with some questions about WIC foods.
A1. The WIC Program provides particular brands of foods. I am going to read a list of foodcategories and I want you to tell me if you are very satisfied, fairly satisfied, or notsatisfied with the brands of foods WIC provides. What about (READ CATEGORY ANDCHECK ONE ANSWER IN EACH ROW)?
Food CategoryVery
SatisfiedSomewhatSatisfied
NotSatisfied
NotApplicable
Breakfast cereals
Juices
Milk
Cheese
Infant cereal (IF INFANT = 1)
Infant juice (IF INFANT = 1)
A2. The WIC Program sometimes specifies particular package sizes to be bought. For example,canned or bottled juice can be bought in 46-ounce containers. Are you very satisfied, fairlysatisfied, or not satisfied with the package sizes allowed for . . .? (READ CATEGORYAND CHECK ONE ANSWER IN EACH ROW)?
Food CategoryVery
SatisfiedSomewhatSatisfied
NotSatisfied
NotApplicable
Breakfast cereals
Frozen juice
Canned or bottled juice
Milk
Cheese
Infant cereal (IF INFANT = 1)
Infant juice (IF INFANT = 1)
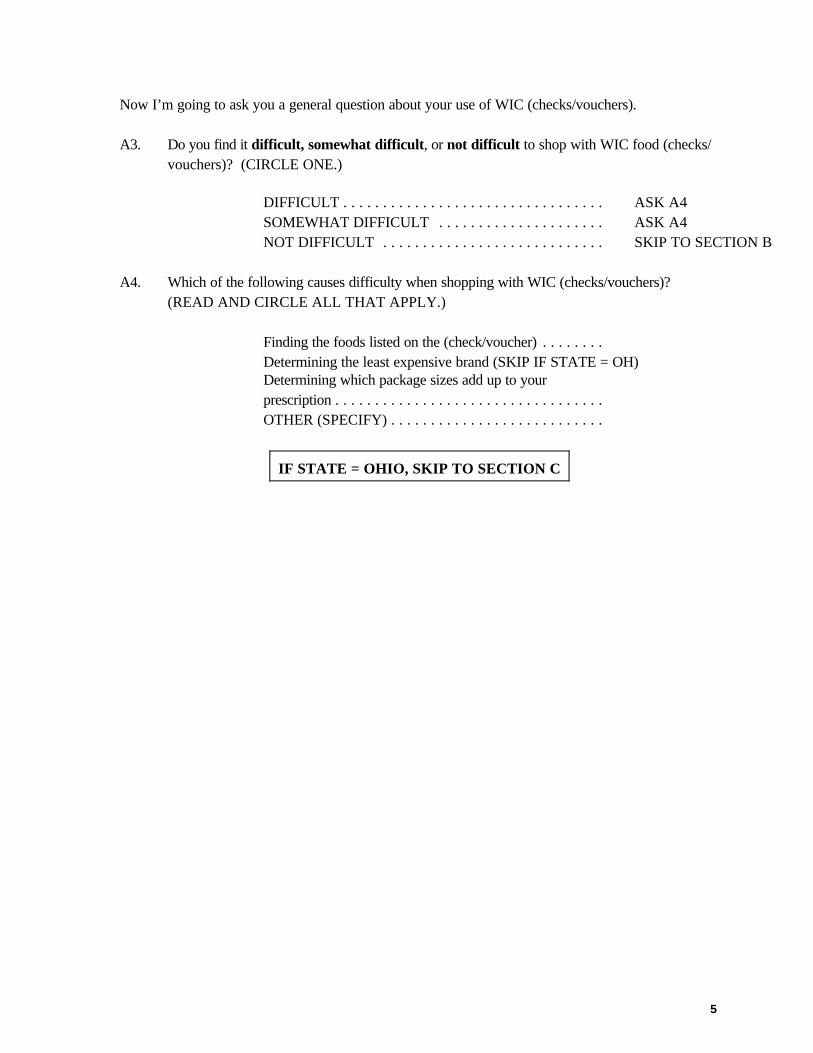
5
Now I’m going to ask you a general question about your use of WIC (checks/vouchers).
A3. Do you find it difficult, somewhat difficult, or not difficult to shop with WIC food (checks/vouchers)? (CIRCLE ONE.)
DIFFICULT . . . . . . . . . . . . . . . . . . . . . . . . . . . . . . . . . ASK A4SOMEWHAT DIFFICULT . . . . . . . . . . . . . . . . . . . . . ASK A4NOT DIFFICULT . . . . . . . . . . . . . . . . . . . . . . . . . . . . SKIP TO SECTION B
A4. Which of the following causes difficulty when shopping with WIC (checks/vouchers)? (READ AND CIRCLE ALL THAT APPLY.)
Finding the foods listed on the (check/voucher) . . . . . . . .Determining the least expensive brand (SKIP IF STATE = OH)Determining which package sizes add up to your prescription . . . . . . . . . . . . . . . . . . . . . . . . . . . . . . . . . .OTHER (SPECIFY) . . . . . . . . . . . . . . . . . . . . . . . . . . .
IF STATE = OHIO, SKIP TO SECTION C
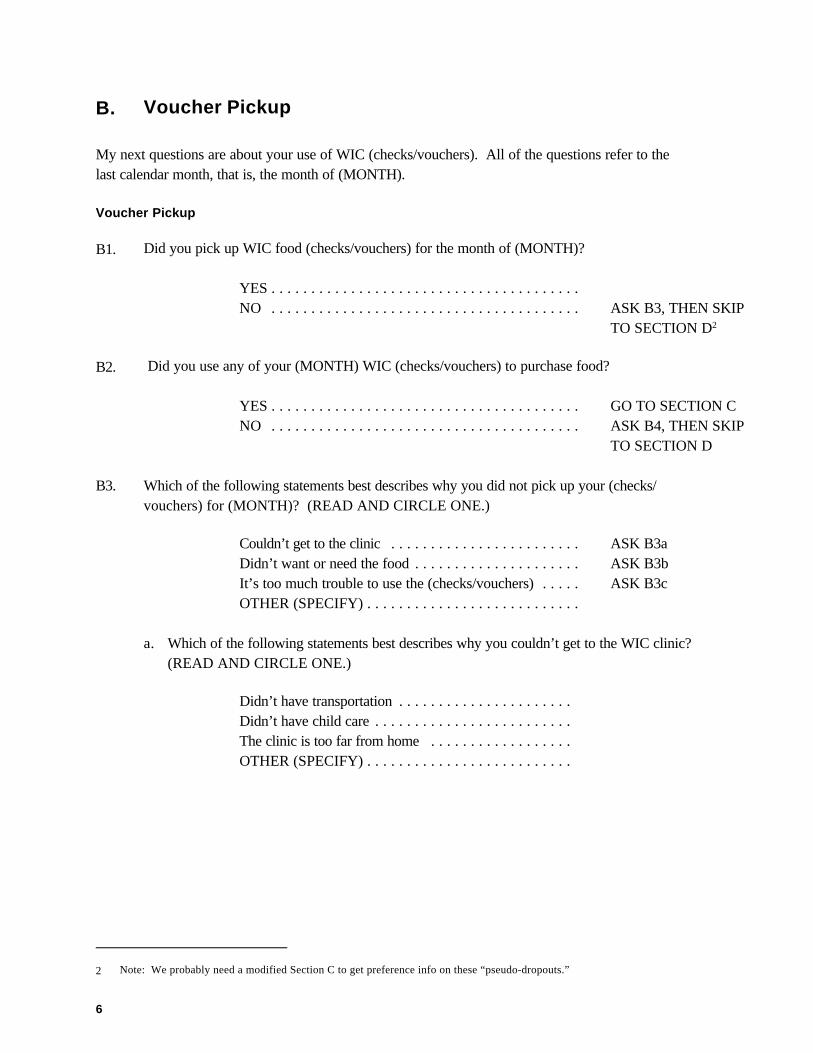
2 Note: We probably need a modified Section C to get preference info on these “pseudo-dropouts.”
6
B. Voucher Pickup
My next questions are about your use of WIC (checks/vouchers). All of the questions refer to thelast calendar month, that is, the month of (MONTH).
Voucher Pickup
B1. Did you pick up WIC food (checks/vouchers) for the month of (MONTH)?
YES . . . . . . . . . . . . . . . . . . . . . . . . . . . . . . . . . . . . . . .NO . . . . . . . . . . . . . . . . . . . . . . . . . . . . . . . . . . . . . . . ASK B3, THEN SKIP
TO SECTION D2
B2. Did you use any of your (MONTH) WIC (checks/vouchers) to purchase food?
YES . . . . . . . . . . . . . . . . . . . . . . . . . . . . . . . . . . . . . . . GO TO SECTION CNO . . . . . . . . . . . . . . . . . . . . . . . . . . . . . . . . . . . . . . . ASK B4, THEN SKIP
TO SECTION D
B3. Which of the following statements best describes why you did not pick up your (checks/vouchers) for (MONTH)? (READ AND CIRCLE ONE.)
Couldn’t get to the clinic . . . . . . . . . . . . . . . . . . . . . . . . ASK B3aDidn’t want or need the food . . . . . . . . . . . . . . . . . . . . . ASK B3bIt’s too much trouble to use the (checks/vouchers) . . . . . ASK B3cOTHER (SPECIFY) . . . . . . . . . . . . . . . . . . . . . . . . . . .
a. Which of the following statements best describes why you couldn’t get to the WIC clinic? (READ AND CIRCLE ONE.)
Didn’t have transportation . . . . . . . . . . . . . . . . . . . . . .Didn’t have child care . . . . . . . . . . . . . . . . . . . . . . . . .The clinic is too far from home . . . . . . . . . . . . . . . . . .OTHER (SPECIFY) . . . . . . . . . . . . . . . . . . . . . . . . . .
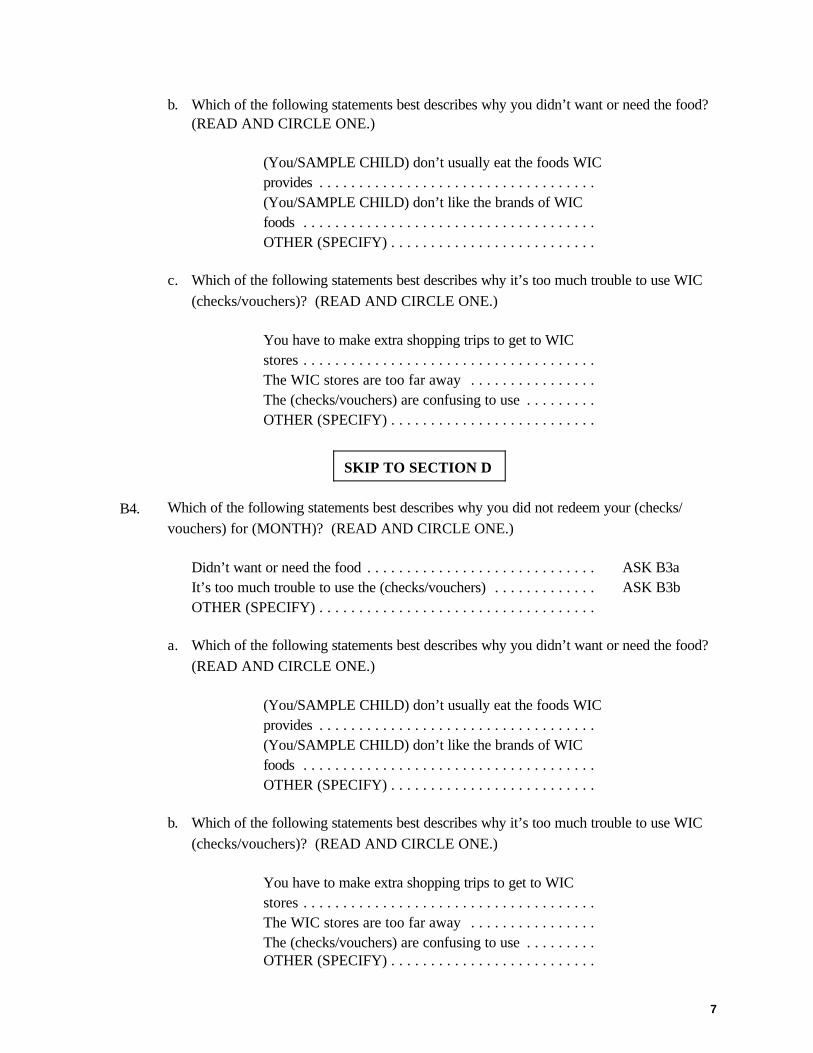
7
b. Which of the following statements best describes why you didn’t want or need the food? (READ AND CIRCLE ONE.)
(You/SAMPLE CHILD) don’t usually eat the foods WIC provides . . . . . . . . . . . . . . . . . . . . . . . . . . . . . . . . . . .(You/SAMPLE CHILD) don’t like the brands of WIC foods . . . . . . . . . . . . . . . . . . . . . . . . . . . . . . . . . . . . .OTHER (SPECIFY) . . . . . . . . . . . . . . . . . . . . . . . . . .
c. Which of the following statements best describes why it’s too much trouble to use WIC(checks/vouchers)? (READ AND CIRCLE ONE.)
You have to make extra shopping trips to get to WIC stores . . . . . . . . . . . . . . . . . . . . . . . . . . . . . . . . . . . . .The WIC stores are too far away . . . . . . . . . . . . . . . .The (checks/vouchers) are confusing to use . . . . . . . . .OTHER (SPECIFY) . . . . . . . . . . . . . . . . . . . . . . . . . .
SKIP TO SECTION D
B4. Which of the following statements best describes why you did not redeem your (checks/vouchers) for (MONTH)? (READ AND CIRCLE ONE.)
Didn’t want or need the food . . . . . . . . . . . . . . . . . . . . . . . . . . . . . ASK B3aIt’s too much trouble to use the (checks/vouchers) . . . . . . . . . . . . . ASK B3bOTHER (SPECIFY) . . . . . . . . . . . . . . . . . . . . . . . . . . . . . . . . . . .
a. Which of the following statements best describes why you didn’t want or need the food? (READ AND CIRCLE ONE.)
(You/SAMPLE CHILD) don’t usually eat the foods WIC provides . . . . . . . . . . . . . . . . . . . . . . . . . . . . . . . . . . .(You/SAMPLE CHILD) don’t like the brands of WIC foods . . . . . . . . . . . . . . . . . . . . . . . . . . . . . . . . . . . . .OTHER (SPECIFY) . . . . . . . . . . . . . . . . . . . . . . . . . .
b. Which of the following statements best describes why it’s too much trouble to use WIC(checks/vouchers)? (READ AND CIRCLE ONE.)
You have to make extra shopping trips to get to WIC stores . . . . . . . . . . . . . . . . . . . . . . . . . . . . . . . . . . . . .The WIC stores are too far away . . . . . . . . . . . . . . . .The (checks/vouchers) are confusing to use . . . . . . . . .OTHER (SPECIFY) . . . . . . . . . . . . . . . . . . . . . . . . . .
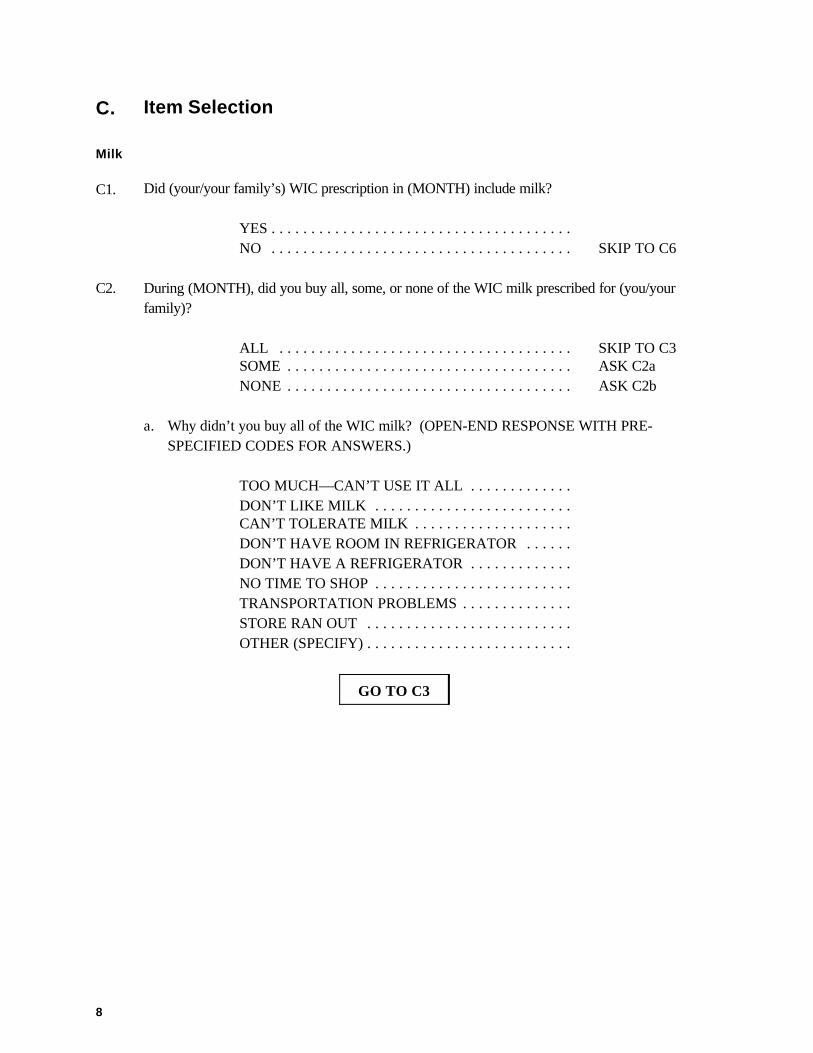
8
C. Item Selection
Milk
C1. Did (your/your family’s) WIC prescription in (MONTH) include milk?
YES . . . . . . . . . . . . . . . . . . . . . . . . . . . . . . . . . . . . . .NO . . . . . . . . . . . . . . . . . . . . . . . . . . . . . . . . . . . . . . SKIP TO C6
C2. During (MONTH), did you buy all, some, or none of the WIC milk prescribed for (you/yourfamily)?
ALL . . . . . . . . . . . . . . . . . . . . . . . . . . . . . . . . . . . . . SKIP TO C3SOME . . . . . . . . . . . . . . . . . . . . . . . . . . . . . . . . . . . . ASK C2aNONE . . . . . . . . . . . . . . . . . . . . . . . . . . . . . . . . . . . . ASK C2b
a. Why didn’t you buy all of the WIC milk? (OPEN-END RESPONSE WITH PRE-SPECIFIED CODES FOR ANSWERS.)
TOO MUCH—CAN’T USE IT ALL . . . . . . . . . . . . .DON’T LIKE MILK . . . . . . . . . . . . . . . . . . . . . . . . .CAN’T TOLERATE MILK . . . . . . . . . . . . . . . . . . . .DON’T HAVE ROOM IN REFRIGERATOR . . . . . .DON’T HAVE A REFRIGERATOR . . . . . . . . . . . . .NO TIME TO SHOP . . . . . . . . . . . . . . . . . . . . . . . . .TRANSPORTATION PROBLEMS . . . . . . . . . . . . . .STORE RAN OUT . . . . . . . . . . . . . . . . . . . . . . . . . .OTHER (SPECIFY) . . . . . . . . . . . . . . . . . . . . . . . . . .
GO TO C3
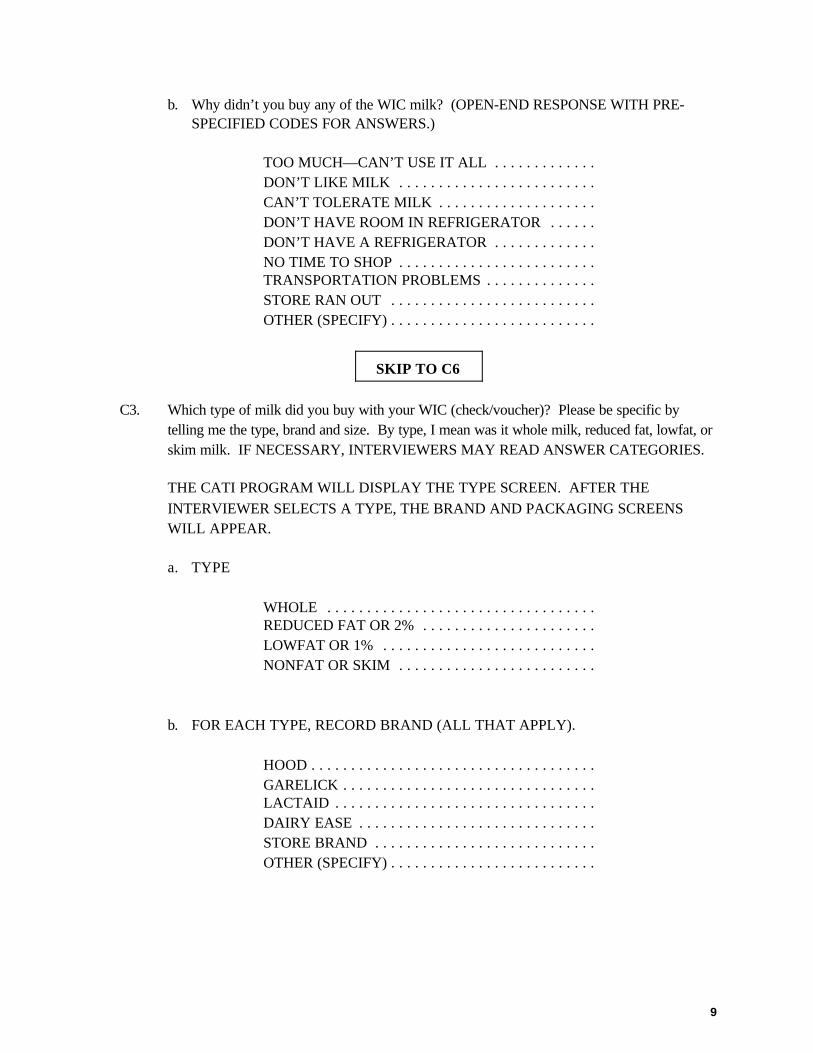
9
b. Why didn’t you buy any of the WIC milk? (OPEN-END RESPONSE WITH PRE-SPECIFIED CODES FOR ANSWERS.)
TOO MUCH—CAN’T USE IT ALL . . . . . . . . . . . . .DON’T LIKE MILK . . . . . . . . . . . . . . . . . . . . . . . . .CAN’T TOLERATE MILK . . . . . . . . . . . . . . . . . . . .DON’T HAVE ROOM IN REFRIGERATOR . . . . . .DON’T HAVE A REFRIGERATOR . . . . . . . . . . . . .NO TIME TO SHOP . . . . . . . . . . . . . . . . . . . . . . . . .TRANSPORTATION PROBLEMS . . . . . . . . . . . . . .STORE RAN OUT . . . . . . . . . . . . . . . . . . . . . . . . . .OTHER (SPECIFY) . . . . . . . . . . . . . . . . . . . . . . . . . .
SKIP TO C6
C3. Which type of milk did you buy with your WIC (check/voucher)? Please be specific bytelling me the type, brand and size. By type, I mean was it whole milk, reduced fat, lowfat, orskim milk. IF NECESSARY, INTERVIEWERS MAY READ ANSWER CATEGORIES.
THE CATI PROGRAM WILL DISPLAY THE TYPE SCREEN. AFTER THEINTERVIEWER SELECTS A TYPE, THE BRAND AND PACKAGING SCREENSWILL APPEAR.
a. TYPE
WHOLE . . . . . . . . . . . . . . . . . . . . . . . . . . . . . . . . . .REDUCED FAT OR 2% . . . . . . . . . . . . . . . . . . . . . .LOWFAT OR 1% . . . . . . . . . . . . . . . . . . . . . . . . . . .NONFAT OR SKIM . . . . . . . . . . . . . . . . . . . . . . . . .
b. FOR EACH TYPE, RECORD BRAND (ALL THAT APPLY).
HOOD . . . . . . . . . . . . . . . . . . . . . . . . . . . . . . . . . . . .GARELICK . . . . . . . . . . . . . . . . . . . . . . . . . . . . . . . .LACTAID . . . . . . . . . . . . . . . . . . . . . . . . . . . . . . . . .DAIRY EASE . . . . . . . . . . . . . . . . . . . . . . . . . . . . . .STORE BRAND . . . . . . . . . . . . . . . . . . . . . . . . . . . .OTHER (SPECIFY) . . . . . . . . . . . . . . . . . . . . . . . . . .
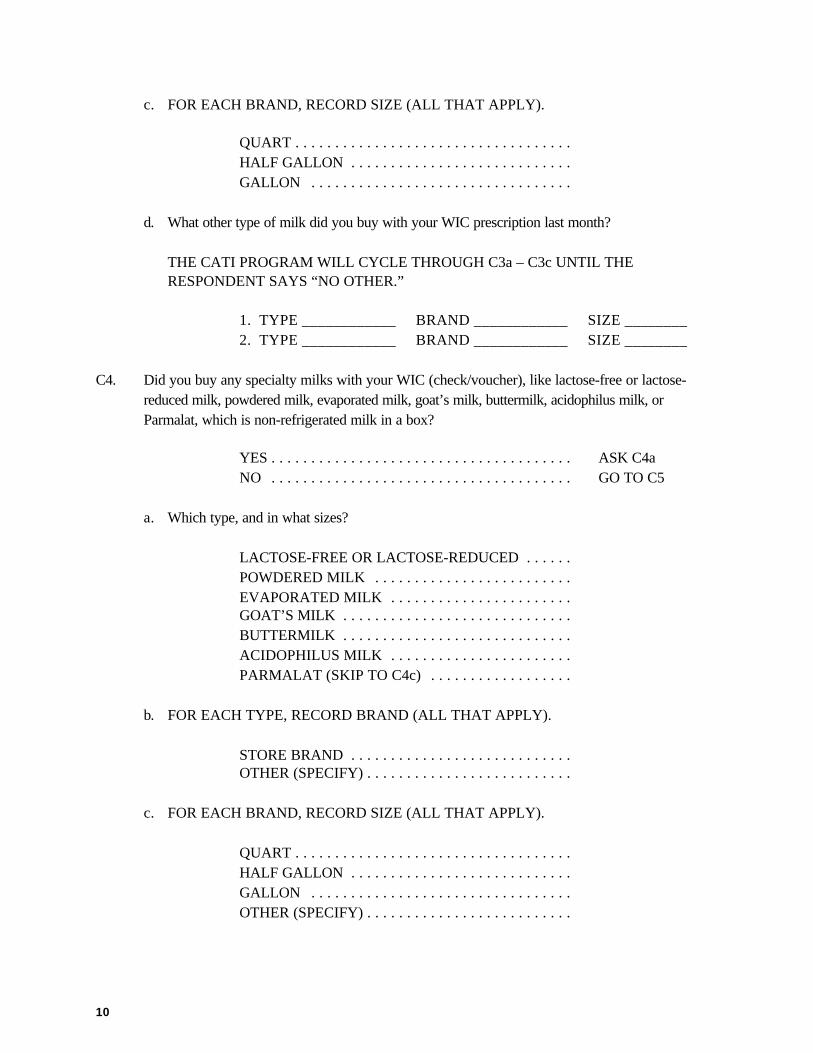
10
c. FOR EACH BRAND, RECORD SIZE (ALL THAT APPLY).
QUART . . . . . . . . . . . . . . . . . . . . . . . . . . . . . . . . . . .HALF GALLON . . . . . . . . . . . . . . . . . . . . . . . . . . . .GALLON . . . . . . . . . . . . . . . . . . . . . . . . . . . . . . . . .
d. What other type of milk did you buy with your WIC prescription last month?
THE CATI PROGRAM WILL CYCLE THROUGH C3a – C3c UNTIL THERESPONDENT SAYS “NO OTHER.”
1. TYPE ____________ BRAND ____________ SIZE ________2. TYPE ____________ BRAND ____________ SIZE ________
C4. Did you buy any specialty milks with your WIC (check/voucher), like lactose-free or lactose-reduced milk, powdered milk, evaporated milk, goat’s milk, buttermilk, acidophilus milk, orParmalat, which is non-refrigerated milk in a box?
YES . . . . . . . . . . . . . . . . . . . . . . . . . . . . . . . . . . . . . . ASK C4aNO . . . . . . . . . . . . . . . . . . . . . . . . . . . . . . . . . . . . . . GO TO C5
a. Which type, and in what sizes?
LACTOSE-FREE OR LACTOSE-REDUCED . . . . . .POWDERED MILK . . . . . . . . . . . . . . . . . . . . . . . . .EVAPORATED MILK . . . . . . . . . . . . . . . . . . . . . . .GOAT’S MILK . . . . . . . . . . . . . . . . . . . . . . . . . . . . .BUTTERMILK . . . . . . . . . . . . . . . . . . . . . . . . . . . . .ACIDOPHILUS MILK . . . . . . . . . . . . . . . . . . . . . . .PARMALAT (SKIP TO C4c) . . . . . . . . . . . . . . . . . .
b. FOR EACH TYPE, RECORD BRAND (ALL THAT APPLY).
STORE BRAND . . . . . . . . . . . . . . . . . . . . . . . . . . . .OTHER (SPECIFY) . . . . . . . . . . . . . . . . . . . . . . . . . .
c. FOR EACH BRAND, RECORD SIZE (ALL THAT APPLY).
QUART . . . . . . . . . . . . . . . . . . . . . . . . . . . . . . . . . . .HALF GALLON . . . . . . . . . . . . . . . . . . . . . . . . . . . .GALLON . . . . . . . . . . . . . . . . . . . . . . . . . . . . . . . . .OTHER (SPECIFY) . . . . . . . . . . . . . . . . . . . . . . . . . .
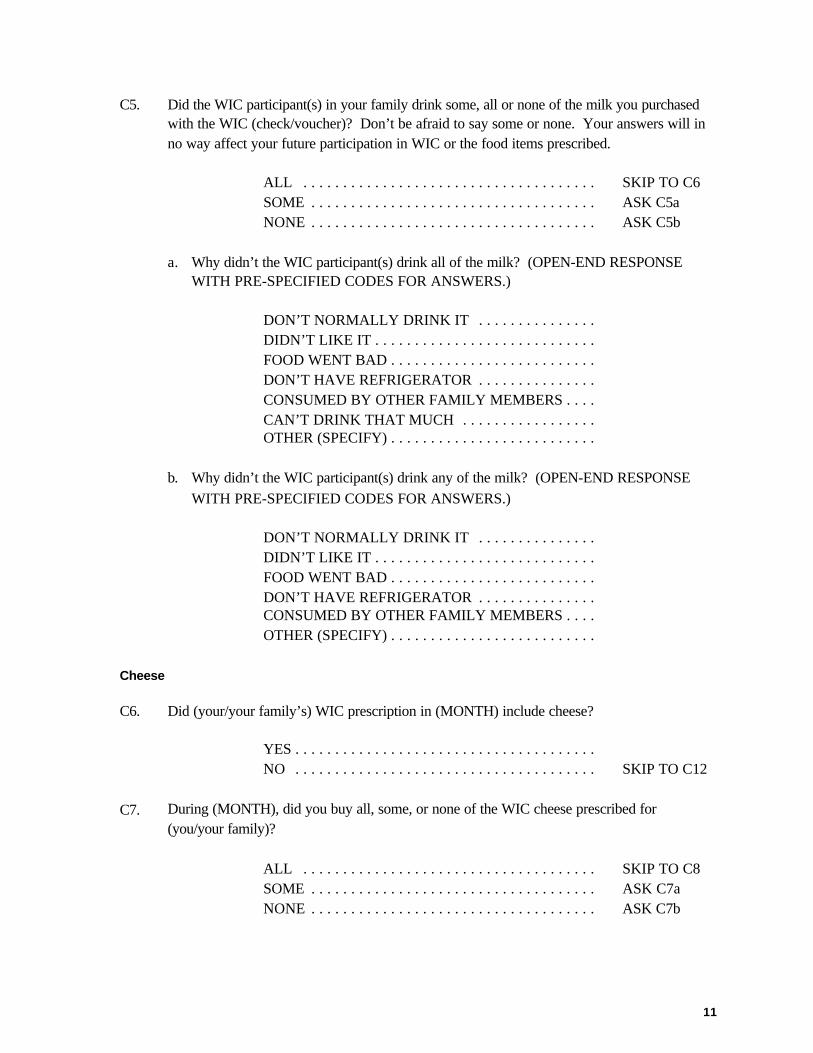
11
C5. Did the WIC participant(s) in your family drink some, all or none of the milk you purchasedwith the WIC (check/voucher)? Don’t be afraid to say some or none. Your answers will inno way affect your future participation in WIC or the food items prescribed.
ALL . . . . . . . . . . . . . . . . . . . . . . . . . . . . . . . . . . . . . SKIP TO C6SOME . . . . . . . . . . . . . . . . . . . . . . . . . . . . . . . . . . . . ASK C5aNONE . . . . . . . . . . . . . . . . . . . . . . . . . . . . . . . . . . . . ASK C5b
a. Why didn’t the WIC participant(s) drink all of the milk? (OPEN-END RESPONSEWITH PRE-SPECIFIED CODES FOR ANSWERS.)
DON’T NORMALLY DRINK IT . . . . . . . . . . . . . . .DIDN’T LIKE IT . . . . . . . . . . . . . . . . . . . . . . . . . . . .FOOD WENT BAD . . . . . . . . . . . . . . . . . . . . . . . . . .DON’T HAVE REFRIGERATOR . . . . . . . . . . . . . . .CONSUMED BY OTHER FAMILY MEMBERS . . . .CAN’T DRINK THAT MUCH . . . . . . . . . . . . . . . . .OTHER (SPECIFY) . . . . . . . . . . . . . . . . . . . . . . . . . .
b. Why didn’t the WIC participant(s) drink any of the milk? (OPEN-END RESPONSEWITH PRE-SPECIFIED CODES FOR ANSWERS.)
DON’T NORMALLY DRINK IT . . . . . . . . . . . . . . .DIDN’T LIKE IT . . . . . . . . . . . . . . . . . . . . . . . . . . . .FOOD WENT BAD . . . . . . . . . . . . . . . . . . . . . . . . . .DON’T HAVE REFRIGERATOR . . . . . . . . . . . . . . .CONSUMED BY OTHER FAMILY MEMBERS . . . .OTHER (SPECIFY) . . . . . . . . . . . . . . . . . . . . . . . . . .
Cheese
C6. Did (your/your family’s) WIC prescription in (MONTH) include cheese?
YES . . . . . . . . . . . . . . . . . . . . . . . . . . . . . . . . . . . . . .NO . . . . . . . . . . . . . . . . . . . . . . . . . . . . . . . . . . . . . . SKIP TO C12
C7. During (MONTH), did you buy all, some, or none of the WIC cheese prescribed for(you/your family)?
ALL . . . . . . . . . . . . . . . . . . . . . . . . . . . . . . . . . . . . . SKIP TO C8SOME . . . . . . . . . . . . . . . . . . . . . . . . . . . . . . . . . . . . ASK C7a NONE . . . . . . . . . . . . . . . . . . . . . . . . . . . . . . . . . . . . ASK C7b
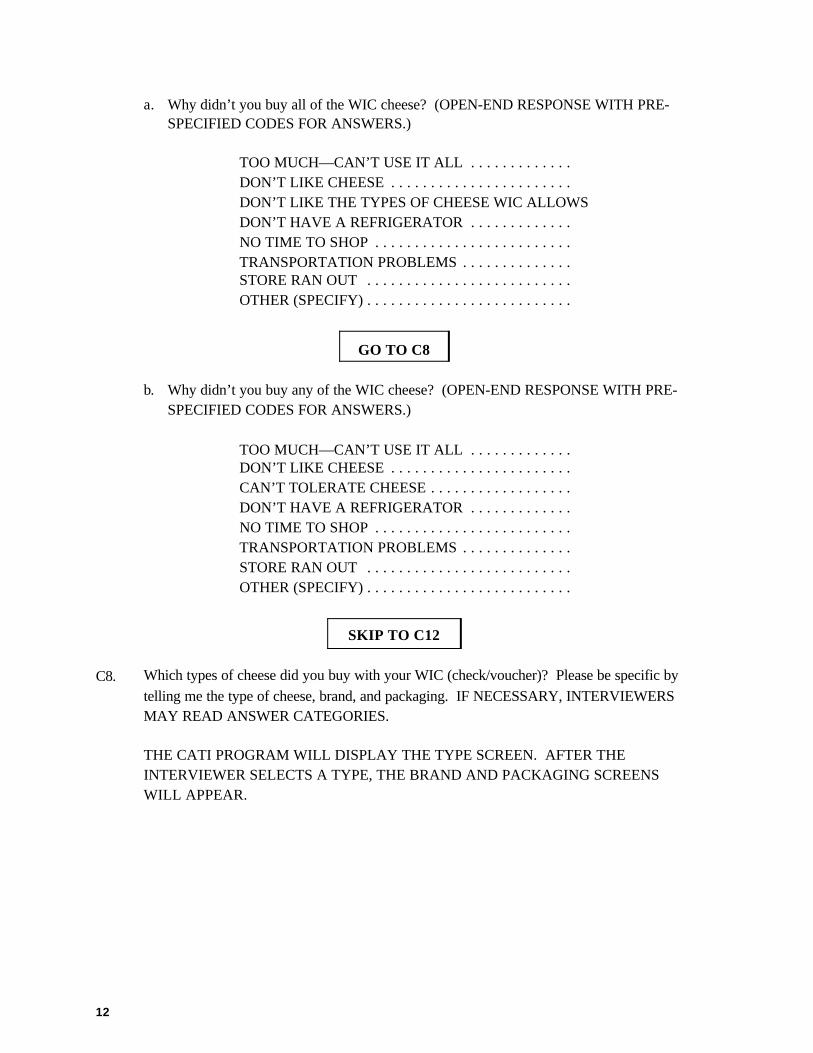
12
a. Why didn’t you buy all of the WIC cheese? (OPEN-END RESPONSE WITH PRE-SPECIFIED CODES FOR ANSWERS.)
TOO MUCH—CAN’T USE IT ALL . . . . . . . . . . . . .DON’T LIKE CHEESE . . . . . . . . . . . . . . . . . . . . . . .DON’T LIKE THE TYPES OF CHEESE WIC ALLOWSDON’T HAVE A REFRIGERATOR . . . . . . . . . . . . .NO TIME TO SHOP . . . . . . . . . . . . . . . . . . . . . . . . .TRANSPORTATION PROBLEMS . . . . . . . . . . . . . .STORE RAN OUT . . . . . . . . . . . . . . . . . . . . . . . . . .OTHER (SPECIFY) . . . . . . . . . . . . . . . . . . . . . . . . . .
GO TO C8
b. Why didn’t you buy any of the WIC cheese? (OPEN-END RESPONSE WITH PRE-SPECIFIED CODES FOR ANSWERS.)
TOO MUCH—CAN’T USE IT ALL . . . . . . . . . . . . .DON’T LIKE CHEESE . . . . . . . . . . . . . . . . . . . . . . .CAN’T TOLERATE CHEESE . . . . . . . . . . . . . . . . . .DON’T HAVE A REFRIGERATOR . . . . . . . . . . . . .NO TIME TO SHOP . . . . . . . . . . . . . . . . . . . . . . . . .TRANSPORTATION PROBLEMS . . . . . . . . . . . . . .STORE RAN OUT . . . . . . . . . . . . . . . . . . . . . . . . . .OTHER (SPECIFY) . . . . . . . . . . . . . . . . . . . . . . . . . .
SKIP TO C12
C8. Which types of cheese did you buy with your WIC (check/voucher)? Please be specific bytelling me the type of cheese, brand, and packaging. IF NECESSARY, INTERVIEWERSMAY READ ANSWER CATEGORIES.
THE CATI PROGRAM WILL DISPLAY THE TYPE SCREEN. AFTER THEINTERVIEWER SELECTS A TYPE, THE BRAND AND PACKAGING SCREENSWILL APPEAR.
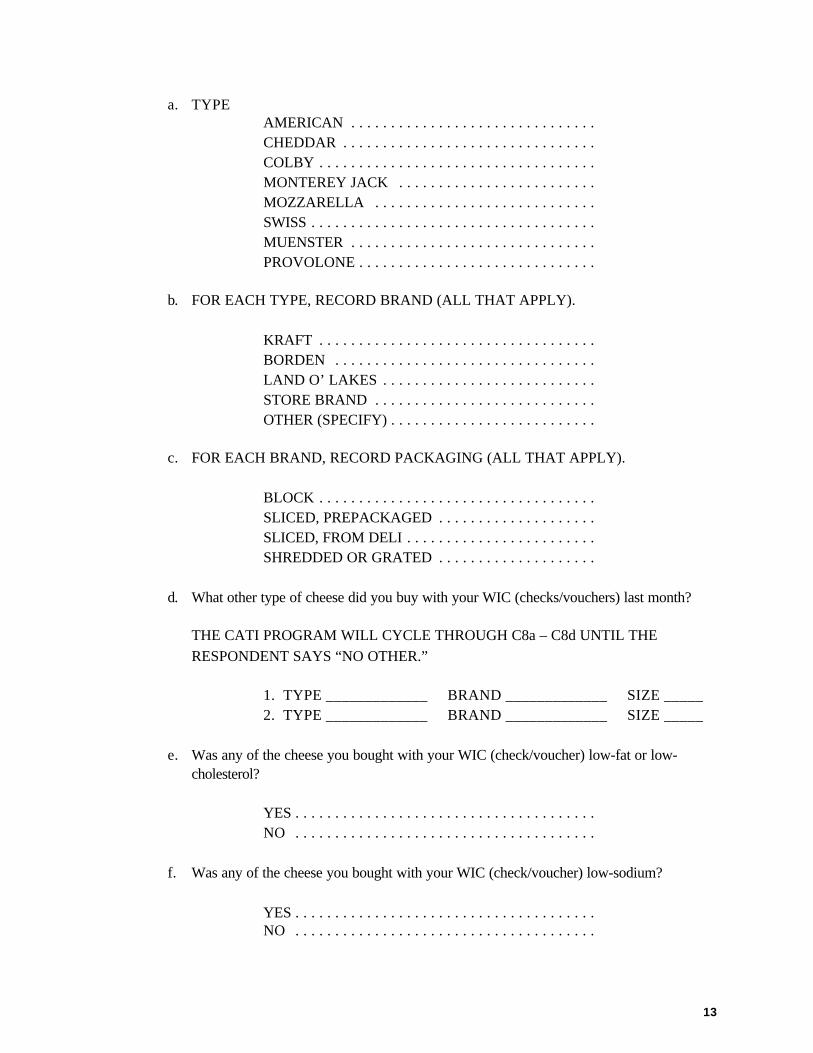
13
a. TYPEAMERICAN . . . . . . . . . . . . . . . . . . . . . . . . . . . . . . .CHEDDAR . . . . . . . . . . . . . . . . . . . . . . . . . . . . . . . .COLBY . . . . . . . . . . . . . . . . . . . . . . . . . . . . . . . . . . .MONTEREY JACK . . . . . . . . . . . . . . . . . . . . . . . . .MOZZARELLA . . . . . . . . . . . . . . . . . . . . . . . . . . . .SWISS . . . . . . . . . . . . . . . . . . . . . . . . . . . . . . . . . . . .MUENSTER . . . . . . . . . . . . . . . . . . . . . . . . . . . . . . .PROVOLONE . . . . . . . . . . . . . . . . . . . . . . . . . . . . . .
b. FOR EACH TYPE, RECORD BRAND (ALL THAT APPLY).
KRAFT . . . . . . . . . . . . . . . . . . . . . . . . . . . . . . . . . . .BORDEN . . . . . . . . . . . . . . . . . . . . . . . . . . . . . . . . .LAND O’ LAKES . . . . . . . . . . . . . . . . . . . . . . . . . . .STORE BRAND . . . . . . . . . . . . . . . . . . . . . . . . . . . .OTHER (SPECIFY) . . . . . . . . . . . . . . . . . . . . . . . . . .
c. FOR EACH BRAND, RECORD PACKAGING (ALL THAT APPLY).
BLOCK . . . . . . . . . . . . . . . . . . . . . . . . . . . . . . . . . . .SLICED, PREPACKAGED . . . . . . . . . . . . . . . . . . . .SLICED, FROM DELI . . . . . . . . . . . . . . . . . . . . . . . .SHREDDED OR GRATED . . . . . . . . . . . . . . . . . . . .
d. What other type of cheese did you buy with your WIC (checks/vouchers) last month?
THE CATI PROGRAM WILL CYCLE THROUGH C8a – C8d UNTIL THERESPONDENT SAYS “NO OTHER.”
1. TYPE _____________ BRAND _____________ SIZE _____2. TYPE _____________ BRAND _____________ SIZE _____
e. Was any of the cheese you bought with your WIC (check/voucher) low-fat or low-cholesterol?
YES . . . . . . . . . . . . . . . . . . . . . . . . . . . . . . . . . . . . . .NO . . . . . . . . . . . . . . . . . . . . . . . . . . . . . . . . . . . . . .
f. Was any of the cheese you bought with your WIC (check/voucher) low-sodium?
YES . . . . . . . . . . . . . . . . . . . . . . . . . . . . . . . . . . . . . .NO . . . . . . . . . . . . . . . . . . . . . . . . . . . . . . . . . . . . . .
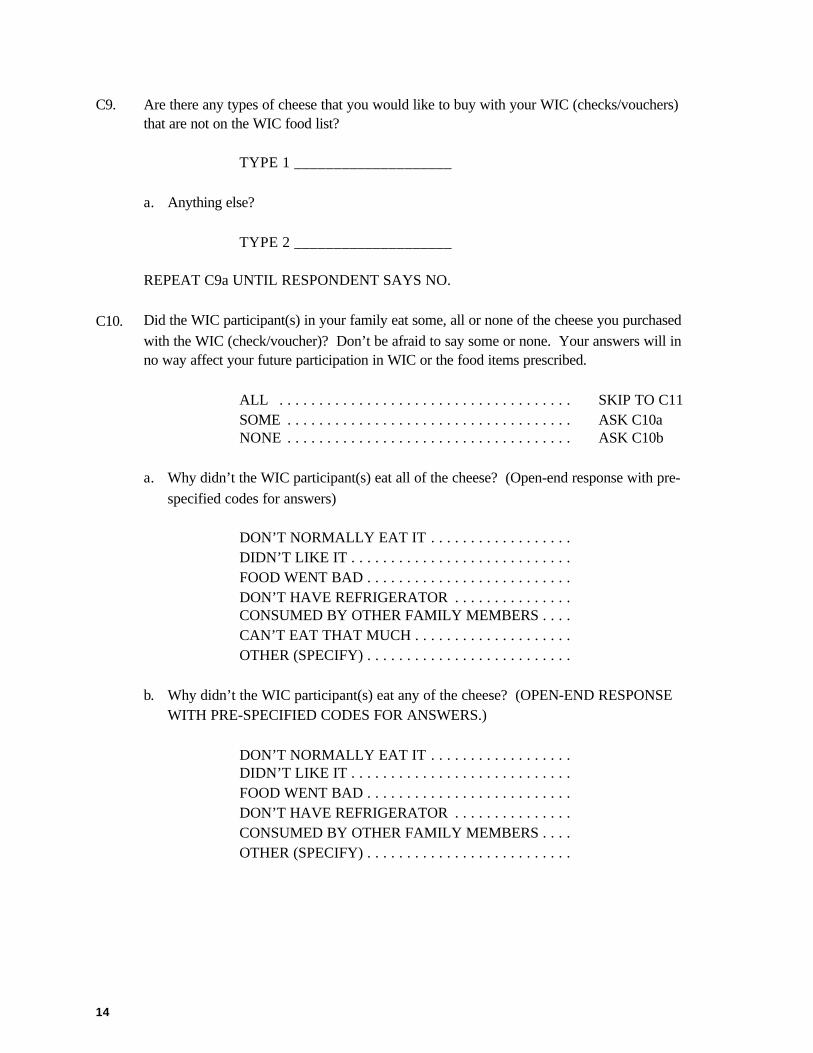
14
C9. Are there any types of cheese that you would like to buy with your WIC (checks/vouchers)that are not on the WIC food list?
TYPE 1 ____________________
a. Anything else?
TYPE 2 ____________________
REPEAT C9a UNTIL RESPONDENT SAYS NO.
C10. Did the WIC participant(s) in your family eat some, all or none of the cheese you purchasedwith the WIC (check/voucher)? Don’t be afraid to say some or none. Your answers will inno way affect your future participation in WIC or the food items prescribed.
ALL . . . . . . . . . . . . . . . . . . . . . . . . . . . . . . . . . . . . . SKIP TO C11SOME . . . . . . . . . . . . . . . . . . . . . . . . . . . . . . . . . . . . ASK C10aNONE . . . . . . . . . . . . . . . . . . . . . . . . . . . . . . . . . . . . ASK C10b
a. Why didn’t the WIC participant(s) eat all of the cheese? (Open-end response with pre-specified codes for answers)
DON’T NORMALLY EAT IT . . . . . . . . . . . . . . . . . .DIDN’T LIKE IT . . . . . . . . . . . . . . . . . . . . . . . . . . . .FOOD WENT BAD . . . . . . . . . . . . . . . . . . . . . . . . . .DON’T HAVE REFRIGERATOR . . . . . . . . . . . . . . .CONSUMED BY OTHER FAMILY MEMBERS . . . .CAN’T EAT THAT MUCH . . . . . . . . . . . . . . . . . . . .OTHER (SPECIFY) . . . . . . . . . . . . . . . . . . . . . . . . . .
b. Why didn’t the WIC participant(s) eat any of the cheese? (OPEN-END RESPONSEWITH PRE-SPECIFIED CODES FOR ANSWERS.)
DON’T NORMALLY EAT IT . . . . . . . . . . . . . . . . . .DIDN’T LIKE IT . . . . . . . . . . . . . . . . . . . . . . . . . . . .FOOD WENT BAD . . . . . . . . . . . . . . . . . . . . . . . . . .DON’T HAVE REFRIGERATOR . . . . . . . . . . . . . . .CONSUMED BY OTHER FAMILY MEMBERS . . . .OTHER (SPECIFY) . . . . . . . . . . . . . . . . . . . . . . . . . .
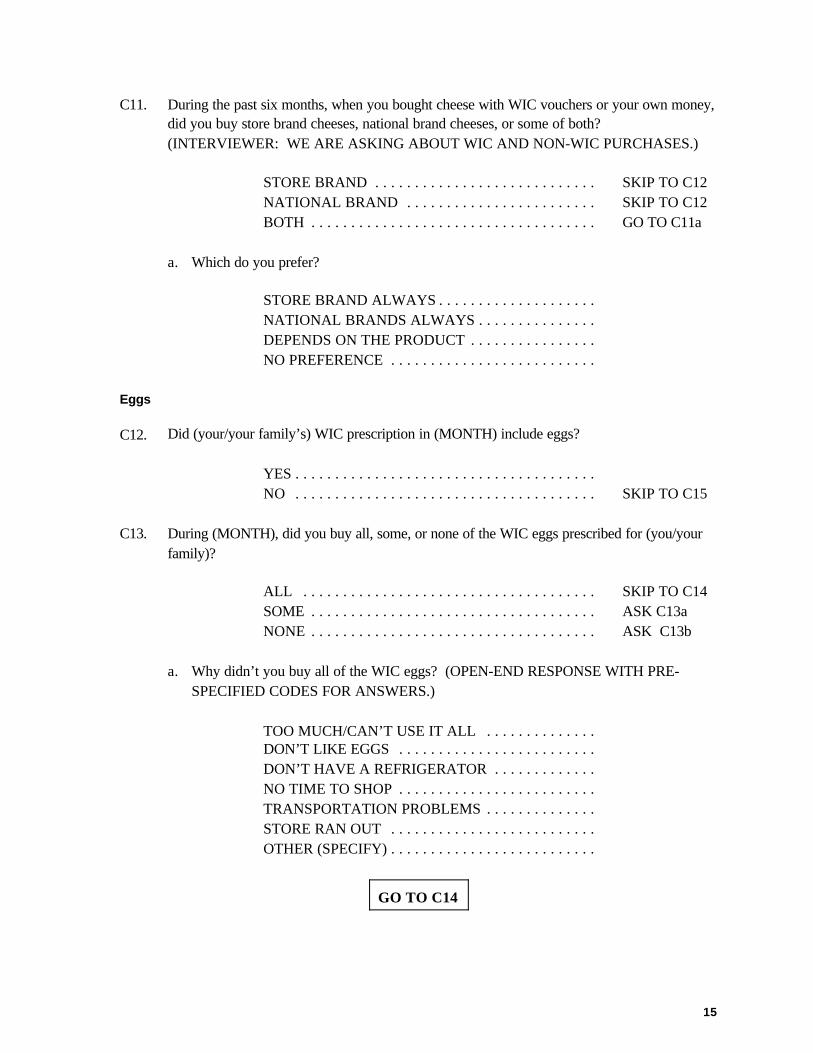
15
C11. During the past six months, when you bought cheese with WIC vouchers or your own money,did you buy store brand cheeses, national brand cheeses, or some of both? (INTERVIEWER: WE ARE ASKING ABOUT WIC AND NON-WIC PURCHASES.)
STORE BRAND . . . . . . . . . . . . . . . . . . . . . . . . . . . . SKIP TO C12NATIONAL BRAND . . . . . . . . . . . . . . . . . . . . . . . . SKIP TO C12BOTH . . . . . . . . . . . . . . . . . . . . . . . . . . . . . . . . . . . . GO TO C11a
a. Which do you prefer?
STORE BRAND ALWAYS . . . . . . . . . . . . . . . . . . . .NATIONAL BRANDS ALWAYS . . . . . . . . . . . . . . .DEPENDS ON THE PRODUCT . . . . . . . . . . . . . . . .NO PREFERENCE . . . . . . . . . . . . . . . . . . . . . . . . . .
Eggs
C12. Did (your/your family’s) WIC prescription in (MONTH) include eggs?
YES . . . . . . . . . . . . . . . . . . . . . . . . . . . . . . . . . . . . . .NO . . . . . . . . . . . . . . . . . . . . . . . . . . . . . . . . . . . . . . SKIP TO C15
C13. During (MONTH), did you buy all, some, or none of the WIC eggs prescribed for (you/yourfamily)?
ALL . . . . . . . . . . . . . . . . . . . . . . . . . . . . . . . . . . . . . SKIP TO C14SOME . . . . . . . . . . . . . . . . . . . . . . . . . . . . . . . . . . . . ASK C13a NONE . . . . . . . . . . . . . . . . . . . . . . . . . . . . . . . . . . . . ASK C13b
a. Why didn’t you buy all of the WIC eggs? (OPEN-END RESPONSE WITH PRE-SPECIFIED CODES FOR ANSWERS.)
TOO MUCH/CAN’T USE IT ALL . . . . . . . . . . . . . .DON’T LIKE EGGS . . . . . . . . . . . . . . . . . . . . . . . . .DON’T HAVE A REFRIGERATOR . . . . . . . . . . . . .NO TIME TO SHOP . . . . . . . . . . . . . . . . . . . . . . . . .TRANSPORTATION PROBLEMS . . . . . . . . . . . . . .STORE RAN OUT . . . . . . . . . . . . . . . . . . . . . . . . . .OTHER (SPECIFY) . . . . . . . . . . . . . . . . . . . . . . . . . .
GO TO C14
16
b. Why didn’t you buy any of the WIC eggs? (OPEN-END RESPONSE WITH PRE-SPECIFIED CODES FOR ANSWERS.)
TOO MUCH/CAN’T USE IT ALL . . . . . . . . . . . . . .DON’T LIKE EGGS . . . . . . . . . . . . . . . . . . . . . . . . .DON’T HAVE A REFRIGERATOR . . . . . . . . . . . . .NO TIME TO SHOP . . . . . . . . . . . . . . . . . . . . . . . . .TRANSPORTATION PROBLEMS . . . . . . . . . . . . . .STORE RAN OUT . . . . . . . . . . . . . . . . . . . . . . . . . .OTHER (SPECIFY) . . . . . . . . . . . . . . . . . . . . . . . . . .
SKIP TO C15
C14. Did the WIC participant(s) in your family eat some, all or none of the eggs you purchasedwith the WIC (check/voucher)? (Don’t be afraid to say some or none. Your answers will inno way affect your future participation in WIC or the food items prescribed.)
ALL . . . . . . . . . . . . . . . . . . . . . . . . . . . . . . . . . . . . . SKIP TO C15SOME . . . . . . . . . . . . . . . . . . . . . . . . . . . . . . . . . . . . ASK C14aNONE . . . . . . . . . . . . . . . . . . . . . . . . . . . . . . . . . . . . ASK C14b
a. Why didn’t the WIC participant(s) eat all of the eggs? (OPEN-END RESPONSEWITH PRE-SPECIFIED CODES FOR ANSWERS.)
DON’T NORMALLY EAT THEM . . . . . . . . . . . . . .DIDN’T LIKE THEM . . . . . . . . . . . . . . . . . . . . . . . .FOOD WENT BAD . . . . . . . . . . . . . . . . . . . . . . . . . .DON’T HAVE REFRIGERATOR . . . . . . . . . . . . . . .CONSUMED BY OTHER FAMILY MEMBERS . . . .CAN’T EAT THAT MUCH . . . . . . . . . . . . . . . . . . . .OTHER (SPECIFY) . . . . . . . . . . . . . . . . . . . . . . . . . .
b. Why didn’t the WIC participant(s) eat any of the eggs? (OPEN-END RESPONSEWITH PRE-SPECIFIED CODES FOR ANSWERS.)
DON’T NORMALLY EAT THEM . . . . . . . . . . . . . .DIDN’T LIKE THEM . . . . . . . . . . . . . . . . . . . . . . . .FOOD WENT BAD . . . . . . . . . . . . . . . . . . . . . . . . . .DON’T HAVE REFRIGERATOR . . . . . . . . . . . . . . .CONSUMED BY OTHER FAMILY MEMBERS . . . .OTHER (SPECIFY) . . . . . . . . . . . . . . . . . . . . . . . . . .
17
Infant Cereal
SKIP SECTION IF THERE IS NO INFANT WIC PARTICIPANT IN FAMILY.
C15. Did (INFANT NAME)’s WIC prescription in (MONTH) include infant cereal?
YES . . . . . . . . . . . . . . . . . . . . . . . . . . . . . . . . . . . . . .NO . . . . . . . . . . . . . . . . . . . . . . . . . . . . . . . . . . . . . . SKIP TO C20
C16. During (MONTH), did you buy all, some, or none of the WIC infant cereal prescribed for(INFANT NAME)?
ALL . . . . . . . . . . . . . . . . . . . . . . . . . . . . . . . . . . . . . SKIP TO C17SOME . . . . . . . . . . . . . . . . . . . . . . . . . . . . . . . . . . . . ASK C16a NONE . . . . . . . . . . . . . . . . . . . . . . . . . . . . . . . . . . . . ASK C16b
a. Why didn’t you buy all of the WIC infant cereal? (OPEN-END RESPONSE WITHPRE-SPECIFIED CODES FOR ANSWERS.)
TOO MUCH—CAN’T USE IT ALL . . . . . . . . . . . . .DON’T LIKE THE FOOD . . . . . . . . . . . . . . . . . . . . .NO TIME TO SHOP . . . . . . . . . . . . . . . . . . . . . . . . .TRANSPORTATION PROBLEMS . . . . . . . . . . . . . .STORE RAN OUT . . . . . . . . . . . . . . . . . . . . . . . . . .OTHER (SPECIFY) . . . . . . . . . . . . . . . . . . . . . . . . . .
GO TO C17
b. Why didn’t you buy any of the WIC infant cereal? (OPEN-END RESPONSE WITHPRE-SPECIFIED CODES FOR ANSWERS.)
TOO MUCH—CAN’T USE IT ALL . . . . . . . . . . . . .DON’T LIKE THE FOOD . . . . . . . . . . . . . . . . . . . . .NO TIME TO SHOP . . . . . . . . . . . . . . . . . . . . . . . . .TRANSPORTATION PROBLEMS . . . . . . . . . . . . . .STORE RAN OUT . . . . . . . . . . . . . . . . . . . . . . . . . .OTHER (SPECIFY) . . . . . . . . . . . . . . . . . . . . . . . . . .
SKIP TO C20
18
C17. Which types of infant cereal did you buy with WIC (checks/vouchers)? Please be as specificas possible by telling me the flavor, brand, and size. IF NECESSARY, INTERVIEWERSMAY READ ANSWER CATEGORIES.
THE CATI SYSTEM WILL DISPLAY THE FLAVOR SCREEN. AFTER THEINTERVIEWER SELECTS A FLAVOR, THE BRAND AND SIZE SCREENS WILLAPPEAR.
a. FLAVOR.
RICE . . . . . . . . . . . . . . . . . . . . . . . . . . . . . . . . . . . . .OATMEAL . . . . . . . . . . . . . . . . . . . . . . . . . . . . . . . .BARLEY . . . . . . . . . . . . . . . . . . . . . . . . . . . . . . . . . .MIXED . . . . . . . . . . . . . . . . . . . . . . . . . . . . . . . . . . .
b. FOR EACH FLAVOR, RECORD BRAND (ALL THAT APPLY).
BEECHNUT . . . . . . . . . . . . . . . . . . . . . . . . . . . . . . .GERBER . . . . . . . . . . . . . . . . . . . . . . . . . . . . . . . . . .HEINZ . . . . . . . . . . . . . . . . . . . . . . . . . . . . . . . . . . .
c. FOR EACH FLAVOR, RECORD SIZE.
8 OZ . . . . . . . . . . . . . . . . . . . . . . . . . . . . . . . . . . . . .16 OZ . . . . . . . . . . . . . . . . . . . . . . . . . . . . . . . . . . . .
d. What other flavor of cereal did you buy with your WIC (checks/vouchers) last month?
THE CATI PROGRAM WILL CYCLE THROUGH C17a – C17c UNTIL THERESPONDENTS SAYS “NO OTHER.”
1. FLAVOR ____________ BRAND ____________ SIZE _____2. FLAVOR ____________ BRAND ____________ SIZE _____
C18. Did (INFANT NAME) eat some, all or none of the infant cereal you purchased with theWIC (check/voucher)? Don’t be afraid to say some or none. Your answers will in no wayaffect your future participation in WIC or the food items prescribed.
ALL . . . . . . . . . . . . . . . . . . . . . . . . . . . . . . . . . . . . . SKIP TO C19SOME . . . . . . . . . . . . . . . . . . . . . . . . . . . . . . . . . . . . ASK C18aNONE . . . . . . . . . . . . . . . . . . . . . . . . . . . . . . . . . . . . ASK C18b
19
a. Why didn’t (INFANT NAME) eat all of the infant cereal? (OPEN-END RESPONSEWITH PRE-SPECIFIED CODES FOR ANSWERS.)
DON’T NORMALLY EAT IT . . . . . . . . . . . . . . . . . .DIDN’T LIKE IT . . . . . . . . . . . . . . . . . . . . . . . . . . . .FOOD WENT BAD . . . . . . . . . . . . . . . . . . . . . . . . . .DON’T HAVE REFRIGERATOR . . . . . . . . . . . . . . .CONSUMED BY OTHER FAMILY MEMBERS . . . .CAN’T EAT THAT MUCH . . . . . . . . . . . . . . . . . . . .OTHER (SPECIFY) . . . . . . . . . . . . . . . . . . . . . . . . . .
b. Why didn’t (INFANT NAME) eat any of the infant cereal? (OPEN-END RESPONSEWITH PRE-SPECIFIED CODES FOR ANSWERS.)
DON’T NORMALLY EAT IT . . . . . . . . . . . . . . . . . .DIDN’T LIKE IT . . . . . . . . . . . . . . . . . . . . . . . . . . . .FOOD WENT BAD . . . . . . . . . . . . . . . . . . . . . . . . . .DON’T HAVE REFRIGERATOR . . . . . . . . . . . . . . .CONSUMED BY OTHER FAMILY MEMBERS . . . .OTHER (SPECIFY) . . . . . . . . . . . . . . . . . . . . . . . . . .
C19. Are there any infant cereals that you would like to purchase with your WIC (checks/vouchers) that are not on the WIC food list?
CEREAL 1 ____________________
a. Anything else?
CEREAL 2 ____________________
REPEAT C19a UNTIL RESPONDENT SAYS NO.
Juice
C20. Did (your/your family’s) WIC prescription in (MONTH) include juice?
YES . . . . . . . . . . . . . . . . . . . . . . . . . . . . . . . . . . . . . .NO . . . . . . . . . . . . . . . . . . . . . . . . . . . . . . . . . . . . . . SKIP TO C26
C21. During (MONTH), did you buy all, some, or none of the WIC juice prescribed for (you/yourfamily)?
ALL . . . . . . . . . . . . . . . . . . . . . . . . . . . . . . . . . . . . . SKIP TO C22SOME . . . . . . . . . . . . . . . . . . . . . . . . . . . . . . . . . . . . ASK C21a NONE . . . . . . . . . . . . . . . . . . . . . . . . . . . . . . . . . . . . ASK C21b
20
a. Why didn’t you buy all of the WIC juice? (OPEN-END RESPONSE WITH PRE-SPECIFIED CODES FOR ANSWERS.)
TOO MUCH—CAN’T USE IT ALL . . . . . . . . . . . . .DON’T LIKE THE FOOD . . . . . . . . . . . . . . . . . . . . .DON’T HAVE A REFRIGERATOR . . . . . . . . . . . . .NO TIME TO SHOP . . . . . . . . . . . . . . . . . . . . . . . . .TRANSPORTATION PROBLEMS . . . . . . . . . . . . . .STORE RAN OUT . . . . . . . . . . . . . . . . . . . . . . . . . .OTHER (SPECIFY) . . . . . . . . . . . . . . . . . . . . . . . . . .
GO TO C22
b. Why didn’t you buy any of the WIC juice? (OPEN-END RESPONSE WITH PRE-SPECIFIED CODES FOR ANSWERS.)
TOO MUCH—CAN’T USE IT ALL . . . . . . . . . . . . .DON’T LIKE THE FOOD . . . . . . . . . . . . . . . . . . . . .DON’T HAVE A REFRIGERATOR . . . . . . . . . . . . .NO TIME TO SHOP . . . . . . . . . . . . . . . . . . . . . . . . .TRANSPORTATION PROBLEMS . . . . . . . . . . . . . .STORE RAN OUT . . . . . . . . . . . . . . . . . . . . . . . . . .OTHER (SPECIFY) . . . . . . . . . . . . . . . . . . . . . . . . . .
SKIP TO C26
C22. Which types of juice did you buy with your WIC (checks/vouchers)? Please tell me theflavors, for example apple or orange, and for each flavor tell me the brand and size. IFNECESSARY, INTERVIEWERS MAY READ ANSWER CATEGORIES.
THE CATI SYSTEM WILL DISPLAY THE FLAVOR SCREEN. AFTER THEINTERVIEWER SELECTS A FLAVOR, THE BRAND AND SIZE SCREENS WILLAPPEAR.
21
a. FLAVOR.
APPLE . . . . . . . . . . . . . . . . . . . . . . . . . . . . . . . . . . .CRANBERRY . . . . . . . . . . . . . . . . . . . . . . . . . . . . . .CRANBERRY BLEND . . . . . . . . . . . . . . . . . . . . . . .GRAPE, PURPLE . . . . . . . . . . . . . . . . . . . . . . . . . . .GRAPEFRUIT . . . . . . . . . . . . . . . . . . . . . . . . . . . . . .ORANGE . . . . . . . . . . . . . . . . . . . . . . . . . . . . . . . . .ORANGE-GRAPEFRUIT . . . . . . . . . . . . . . . . . . . . .ORANGE-PINEAPPLE . . . . . . . . . . . . . . . . . . . . . . .PINEAPPLE . . . . . . . . . . . . . . . . . . . . . . . . . . . . . . .PINEAPPLE BLEND . . . . . . . . . . . . . . . . . . . . . . . .TOMATO . . . . . . . . . . . . . . . . . . . . . . . . . . . . . . . . .VEGETABLE . . . . . . . . . . . . . . . . . . . . . . . . . . . . . .WHITE GRAPE . . . . . . . . . . . . . . . . . . . . . . . . . . . .WHITE GRAPE BLEND . . . . . . . . . . . . . . . . . . . . . .OTHER BLENDS . . . . . . . . . . . . . . . . . . . . . . . . . . .
b. FOR EACH FLAVOR, RECORD BRAND (ALL THAT APPLY).
CAMPBELL’S . . . . . . . . . . . . . . . . . . . . . . . . . . . . .DEL MONTE . . . . . . . . . . . . . . . . . . . . . . . . . . . . . .DOLE . . . . . . . . . . . . . . . . . . . . . . . . . . . . . . . . . . . .JUICY JUICE . . . . . . . . . . . . . . . . . . . . . . . . . . . . . .LUCKY LEAF . . . . . . . . . . . . . . . . . . . . . . . . . . . . .MUSSELMAN’S . . . . . . . . . . . . . . . . . . . . . . . . . . . .NORTHLAND . . . . . . . . . . . . . . . . . . . . . . . . . . . . .SENECA . . . . . . . . . . . . . . . . . . . . . . . . . . . . . . . . . .WELCH’S . . . . . . . . . . . . . . . . . . . . . . . . . . . . . . . . .WHITE HOUSE . . . . . . . . . . . . . . . . . . . . . . . . . . . .STORE BRAND . . . . . . . . . . . . . . . . . . . . . . . . . . . .OTHER (SPECIFY) . . . . . . . . . . . . . . . . . . . . . . . . . .
c. FOR EACH FLAVOR, RECORD SIZE.
46 OZ CANNED . . . . . . . . . . . . . . . . . . . . . . . . . . . .46 OZ BOTTLED . . . . . . . . . . . . . . . . . . . . . . . . . . .6 OZ FROZEN . . . . . . . . . . . . . . . . . . . . . . . . . . . . .12 OZ FROZEN . . . . . . . . . . . . . . . . . . . . . . . . . . . . .11.5 OR 12 OZ LIQUID CONCENTRATE . . . . . . . .
22
d. What other flavor of juice did you buy with your WIC (checks/vouchers) last month?
THE CATI PROGRAM WILL CYCLE THROUGH C22a – C22c UNTIL THERESPONDENTS SAYS “NO OTHER.”
1. FLAVOR ___________ BRAND ___________ SIZE _______2. FLAVOR ___________ BRAND ___________ SIZE _______
C23. Did the WIC participant(s) in your family drink some, all or none of the juice you purchasedwith the WIC (check/voucher)? Don’t be afraid to say some or none. Your answers will inno way affect your future participation in WIC or the food items prescribed.
ALL . . . . . . . . . . . . . . . . . . . . . . . . . . . . . . . . . . . . . SKIP TO C24SOME . . . . . . . . . . . . . . . . . . . . . . . . . . . . . . . . . . . . ASK C23aNONE . . . . . . . . . . . . . . . . . . . . . . . . . . . . . . . . . . . . ASK C23b
a. Why didn’t the WIC participant(s) drink all of the juice? (OPEN-END RESPONSEWITH PRE-SPECIFIED CODES FOR ANSWERS.)
DON’T NORMALLY DRINK IT . . . . . . . . . . . . . . .DIDN’T LIKE IT . . . . . . . . . . . . . . . . . . . . . . . . . . . .JUICE WENT BAD . . . . . . . . . . . . . . . . . . . . . . . . . .DON’T HAVE REFRIGERATOR . . . . . . . . . . . . . . .CONSUMED BY OTHER FAMILY MEMBERS . . . .CAN’T DRINK THAT MUCH . . . . . . . . . . . . . . . . .OTHER (SPECIFY) . . . . . . . . . . . . . . . . . . . . . . . . . .
b. Why didn’t the WIC participant(s) drink any of the juice? (OPEN-END RESPONSEWITH PRE-SPECIFIED CODES FOR ANSWERS.)
DON’T NORMALLY DRINK IT . . . . . . . . . . . . . . .DIDN’T LIKE IT . . . . . . . . . . . . . . . . . . . . . . . . . . . .JUICE WENT BAD . . . . . . . . . . . . . . . . . . . . . . . . . .DON’T HAVE REFRIGERATOR . . . . . . . . . . . . . . .CONSUMED BY OTHER FAMILY MEMBERS . . . .OTHER (SPECIFY) . . . . . . . . . . . . . . . . . . . . . . . . . .
C24. Are there any juices that you would like to buy with your WIC (checks/vouchers) that are noton the WIC food list?
JUICE 1 ____________________
23
a. Anything else?
JUICE 2 ____________________
REPEAT C24a UNTIL RESPONDENTS SAYS NO.
C25. During the past six months, when buying juice with WIC vouchers or your own money, didyou buy store brand juices, national brand juices, or both?
STORE BRAND . . . . . . . . . . . . . . . . . . . . . . . . . . . . GO TO C26NATIONAL BRAND . . . . . . . . . . . . . . . . . . . . . . . . SKIP TO C26BOTH . . . . . . . . . . . . . . . . . . . . . . . . . . . . . . . . . . . . GO TO C25a
a. Which do you prefer?
STORE BRAND ALWAYS . . . . . . . . . . . . . . . . . . . .NATIONAL BRANDS ALWAYS . . . . . . . . . . . . . . .DEPENDS ON THE PRODUCT . . . . . . . . . . . . . . . .NO PREFERENCE . . . . . . . . . . . . . . . . . . . . . . . . . .
Beans
C26. Did (your/your family’s) WIC prescription in (MONTH) include beans?
YES . . . . . . . . . . . . . . . . . . . . . . . . . . . . . . . . . . . . . .NO . . . . . . . . . . . . . . . . . . . . . . . . . . . . . . . . . . . . . . SKIP TO C29
C27. During (MONTH), did you buy the WIC beans prescribed for (you/your family)?
YES . . . . . . . . . . . . . . . . . . . . . . . . . . . . . . . . . . . . . . SKIP TO C28NO . . . . . . . . . . . . . . . . . . . . . . . . . . . . . . . . . . . . . . ASK C27a
24
a. Why didn’t you buy the WIC beans? (OPEN-END RESPONSE WITH PRE-SPECIFIED CODES FOR ANSWERS.)
TOO MUCH—CAN’T USE IT ALL . . . . . . . . . . . . .TOO MUCH TROUBLE/TAKE TOO LONG TO COOKDON’T LIKE THEM . . . . . . . . . . . . . . . . . . . . . . . . .DON’T HAVE A REFRIGERATOR . . . . . . . . . . . . .NO TIME TO SHOP . . . . . . . . . . . . . . . . . . . . . . . . .TRANSPORTATION PROBLEMS . . . . . . . . . . . . . .STORE RAN OUT . . . . . . . . . . . . . . . . . . . . . . . . . .OTHER (SPECIFY) . . . . . . . . . . . . . . . . . . . . . . . . . .
SKIP TO C29
C28. Did the WIC participant(s) in your family eat some, all or none of the beans you purchasedwith the WIC (check/voucher)? Don’t be afraid to say some or none. Your answers will inno way affect your future participation in WIC or the food items prescribed.
ALL . . . . . . . . . . . . . . . . . . . . . . . . . . . . . . . . . . . . . SKIP TO C29SOME . . . . . . . . . . . . . . . . . . . . . . . . . . . . . . . . . . . . ASK C28aNONE . . . . . . . . . . . . . . . . . . . . . . . . . . . . . . . . . . . . ASK C28b
a. Why didn’t the WIC participant(s) eat all of the beans? (OPEN-END RESPONSEWITH PRE-SPECIFIED CODES FOR ANSWERS.)
DON’T NORMALLY EAT THEM . . . . . . . . . . . . . .DIDN’T LIKE THEM . . . . . . . . . . . . . . . . . . . . . . . .FOOD WENT BAD . . . . . . . . . . . . . . . . . . . . . . . . . .DON’T HAVE REFRIGERATOR . . . . . . . . . . . . . . .CONSUMED BY OTHER FAMILY MEMBERS . . . .CAN’T EAT THAT MUCH . . . . . . . . . . . . . . . . . . . .OTHER (SPECIFY) . . . . . . . . . . . . . . . . . . . . . . . . . .
b. Why didn’t the WIC participant(s) eat any of the beans? (OPEN-END RESPONSEWITH PRE-SPECIFIED CODES FOR ANSWERS.)
DON’T NORMALLY EAT THEM . . . . . . . . . . . . . .DIDN’T LIKE THEM . . . . . . . . . . . . . . . . . . . . . . . .FOOD WENT BAD . . . . . . . . . . . . . . . . . . . . . . . . . .DON’T HAVE REFRIGERATOR . . . . . . . . . . . . . . .CONSUMED BY OTHER FAMILY MEMBERS . . . .OTHER (SPECIFY) . . . . . . . . . . . . . . . . . . . . . . . . . .
25
Peanut Butter
C29. Did (your/your family’s) WIC prescription in (MONTH) include peanut butter?
YES . . . . . . . . . . . . . . . . . . . . . . . . . . . . . . . . . . . . . .NO . . . . . . . . . . . . . . . . . . . . . . . . . . . . . . . . . . . . . . SKIP TO C35
C30. During (MONTH), did you buy the WIC peanut butter prescribed for (you/your family)?
YES . . . . . . . . . . . . . . . . . . . . . . . . . . . . . . . . . . . . . . ASK C30aNO . . . . . . . . . . . . . . . . . . . . . . . . . . . . . . . . . . . . . . GO TO C31
a. Why didn’t you buy the WIC peanut butter? (OPEN-END RESPONSE WITH PRE-SPECIFIED CODES FOR ANSWERS.)
TOO MUCH—CAN’T USE IT ALL . . . . . . . . . . . . .DON’T LIKE THE FOOD . . . . . . . . . . . . . . . . . . . . .DON’T HAVE A REFRIGERATOR . . . . . . . . . . . . .NO TIME TO SHOP . . . . . . . . . . . . . . . . . . . . . . . . .TRANSPORTATION PROBLEMS . . . . . . . . . . . . . .STORE RAN OUT . . . . . . . . . . . . . . . . . . . . . . . . . .
SKIP TO C35
C31. What brand of peanut butter did you buy with your WIC (check/voucher)? (OPEN-ENDRESPONSE WITH PRE-SPECIFIED CODES FOR ANSWERS.)
JIF . . . . . . . . . . . . . . . . . . . . . . . . . . . . . . . . . . . . . . .PETER PAN . . . . . . . . . . . . . . . . . . . . . . . . . . . . . . .SKIPPY . . . . . . . . . . . . . . . . . . . . . . . . . . . . . . . . . .REESE’S . . . . . . . . . . . . . . . . . . . . . . . . . . . . . . . . . .STORE BRAND . . . . . . . . . . . . . . . . . . . . . . . . . . . .OTHER (SPECIFY) . . . . . . . . . . . . . . . . . . . . . . . . . .
C32. Was the peanut butter you bought with your WIC (check/voucher) reduced fat or low-fat?
YES . . . . . . . . . . . . . . . . . . . . . . . . . . . . . . . . . . . . . .NO . . . . . . . . . . . . . . . . . . . . . . . . . . . . . . . . . . . . . .
C33. Was the peanut butter you bought with your WIC (check/voucher) low-sodium?
YES . . . . . . . . . . . . . . . . . . . . . . . . . . . . . . . . . . . . . .NO . . . . . . . . . . . . . . . . . . . . . . . . . . . . . . . . . . . . . .
26
C34. Did the WIC participant(s) in your family eat some, all or none of the peanut butter youpurchased with the WIC (check/voucher)? Don’t be afraid to say some or none. Youranswers will in no way affect your future participation in WIC or the food items prescribed.
ALL . . . . . . . . . . . . . . . . . . . . . . . . . . . . . . . . . . . . . SKIP TO C35SOME . . . . . . . . . . . . . . . . . . . . . . . . . . . . . . . . . . . . ASK C34aNONE . . . . . . . . . . . . . . . . . . . . . . . . . . . . . . . . . . . . ASK C34b
a. Why didn’t the WIC participant(s) eat all of the peanut butter? (OPEN-ENDRESPONSE WITH PRE-SPECIFIED CODES FOR ANSWERS.)
DON’T NORMALLY EAT IT . . . . . . . . . . . . . . . . . .DIDN’T LIKE IT . . . . . . . . . . . . . . . . . . . . . . . . . . . .FOOD WENT BAD . . . . . . . . . . . . . . . . . . . . . . . . . .CONSUMED BY OTHER FAMILY MEMBERS . . . .CAN’T EAT THAT MUCH . . . . . . . . . . . . . . . . . . . .OTHER (SPECIFY) . . . . . . . . . . . . . . . . . . . . . . . . . .
b. Why didn’t the WIC participant(s) eat any of the peanut butter? (OPEN-ENDRESPONSE WITH PRE-SPECIFIED CODES FOR ANSWERS.)
DON’T NORMALLY EAT IT . . . . . . . . . . . . . . . . . .DIDN’T LIKE IT . . . . . . . . . . . . . . . . . . . . . . . . . . . .FOOD WENT BAD . . . . . . . . . . . . . . . . . . . . . . . . . .CONSUMED BY OTHER FAMILY MEMBERS . . . .OTHER (SPECIFY) . . . . . . . . . . . . . . . . . . . . . . . . . .
Breakfast Cereal
C35. Did (your/your family’s) WIC prescription in (MONTH) include breakfast cereal?
YES . . . . . . . . . . . . . . . . . . . . . . . . . . . . . . . . . . . . . .NO . . . . . . . . . . . . . . . . . . . . . . . . . . . . . . . . . . . . . . SKIP TO D1
C36. During (MONTH), did you buy all, some, or none of the WIC breakfast cereal prescribed for(you/your family)?
ALL . . . . . . . . . . . . . . . . . . . . . . . . . . . . . . . . . . . . . SKIP TO C37SOME . . . . . . . . . . . . . . . . . . . . . . . . . . . . . . . . . . . . ASK C36a NONE . . . . . . . . . . . . . . . . . . . . . . . . . . . . . . . . . . . . ASK C36b
27
a. Why didn’t you buy all of the WIC breakfast cereal? (OPEN-END RESPONSE WITHPRE-SPECIFIED CODES FOR ANSWERS.)
TOO MUCH—CAN’T USE IT ALL . . . . . . . . . . . . .DON’T LIKE THE FOOD . . . . . . . . . . . . . . . . . . . . .NO TIME TO SHOP . . . . . . . . . . . . . . . . . . . . . . . . .TRANSPORTATION PROBLEMS . . . . . . . . . . . . . .STORE RAN OUT . . . . . . . . . . . . . . . . . . . . . . . . . .OTHER (SPECIFY) . . . . . . . . . . . . . . . . . . . . . . . . . .
GO TO C37
b. Why didn’t you buy any of the WIC breakfast cereal? (OPEN-END RESPONSEWITH PRE-SPECIFIED CODES FOR ANSWERS.)
TOO MUCH—CAN’T USE IT ALL . . . . . . . . . . . . .DON’T LIKE THE FOOD . . . . . . . . . . . . . . . . . . . . .NO TIME TO SHOP . . . . . . . . . . . . . . . . . . . . . . . . .TRANSPORTATION PROBLEMS . . . . . . . . . . . . . .STORE RAN OUT . . . . . . . . . . . . . . . . . . . . . . . . . .OTHER (SPECIFY) . . . . . . . . . . . . . . . . . . . . . . . . . .
SKIP TO D1
C37. Did you buy any hot breakfast cereals with your WIC vouchers last month?
YES . . . . . . . . . . . . . . . . . . . . . . . . . . . . . . . . . . . . . . ASK C37aNO . . . . . . . . . . . . . . . . . . . . . . . . . . . . . . . . . . . . . . GO TO C38
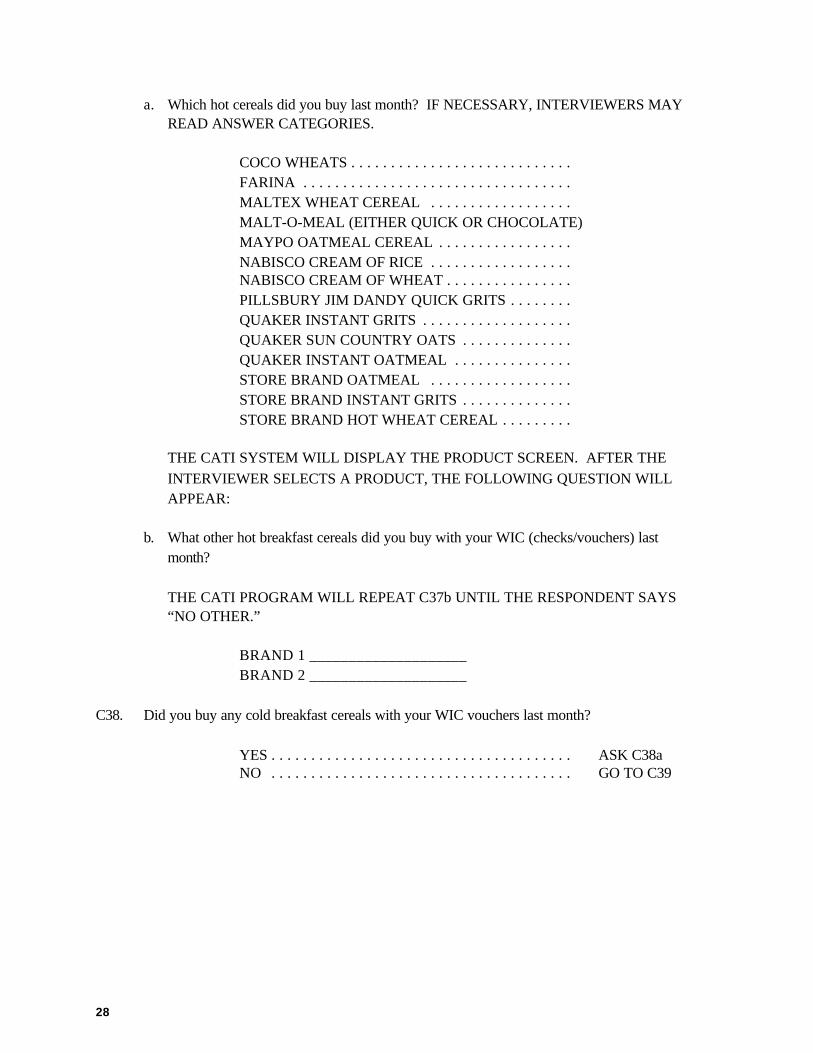
28
a. Which hot cereals did you buy last month? IF NECESSARY, INTERVIEWERS MAYREAD ANSWER CATEGORIES.
COCO WHEATS . . . . . . . . . . . . . . . . . . . . . . . . . . . .FARINA . . . . . . . . . . . . . . . . . . . . . . . . . . . . . . . . . .MALTEX WHEAT CEREAL . . . . . . . . . . . . . . . . . .MALT-O-MEAL (EITHER QUICK OR CHOCOLATE)MAYPO OATMEAL CEREAL . . . . . . . . . . . . . . . . .NABISCO CREAM OF RICE . . . . . . . . . . . . . . . . . .NABISCO CREAM OF WHEAT . . . . . . . . . . . . . . . .PILLSBURY JIM DANDY QUICK GRITS . . . . . . . .QUAKER INSTANT GRITS . . . . . . . . . . . . . . . . . . .QUAKER SUN COUNTRY OATS . . . . . . . . . . . . . .QUAKER INSTANT OATMEAL . . . . . . . . . . . . . . .STORE BRAND OATMEAL . . . . . . . . . . . . . . . . . .STORE BRAND INSTANT GRITS . . . . . . . . . . . . . .STORE BRAND HOT WHEAT CEREAL . . . . . . . . .
THE CATI SYSTEM WILL DISPLAY THE PRODUCT SCREEN. AFTER THEINTERVIEWER SELECTS A PRODUCT, THE FOLLOWING QUESTION WILLAPPEAR:
b. What other hot breakfast cereals did you buy with your WIC (checks/vouchers) lastmonth?
THE CATI PROGRAM WILL REPEAT C37b UNTIL THE RESPONDENT SAYS“NO OTHER.”
BRAND 1 ____________________BRAND 2 ____________________
C38. Did you buy any cold breakfast cereals with your WIC vouchers last month?
YES . . . . . . . . . . . . . . . . . . . . . . . . . . . . . . . . . . . . . . ASK C38aNO . . . . . . . . . . . . . . . . . . . . . . . . . . . . . . . . . . . . . . GO TO C39
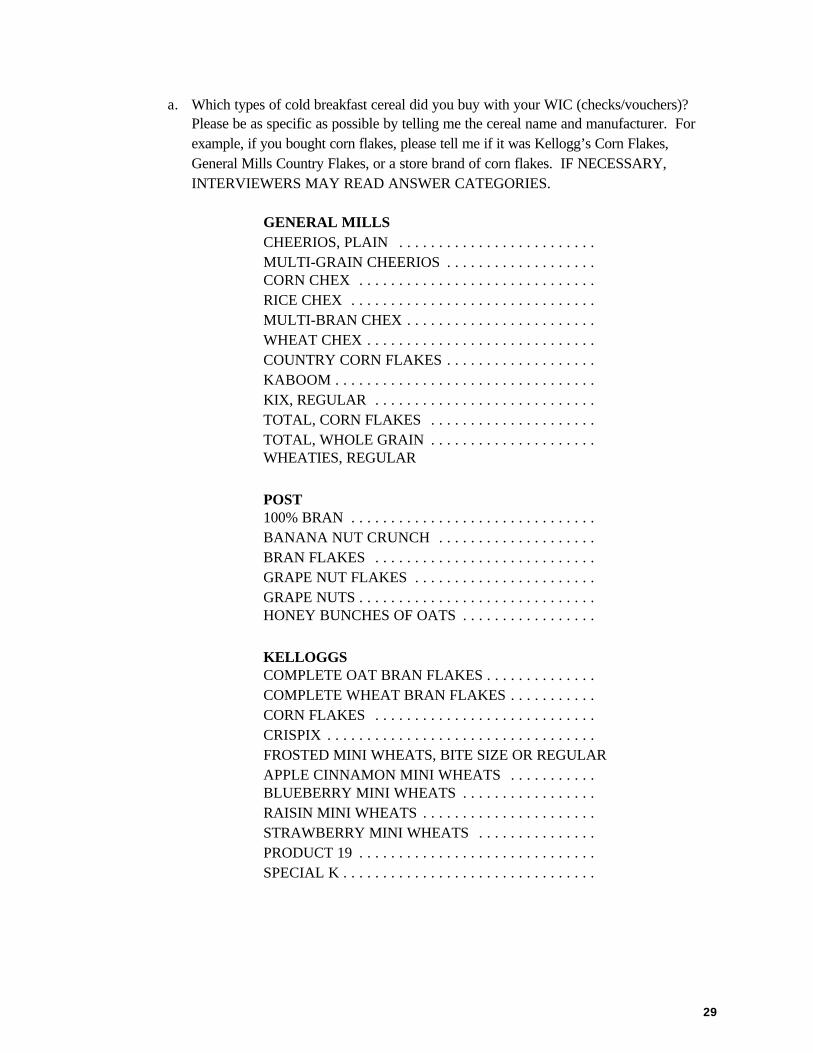
29
a. Which types of cold breakfast cereal did you buy with your WIC (checks/vouchers)? Please be as specific as possible by telling me the cereal name and manufacturer. Forexample, if you bought corn flakes, please tell me if it was Kellogg’s Corn Flakes,General Mills Country Flakes, or a store brand of corn flakes. IF NECESSARY,INTERVIEWERS MAY READ ANSWER CATEGORIES.
GENERAL MILLSCHEERIOS, PLAIN . . . . . . . . . . . . . . . . . . . . . . . . .MULTI-GRAIN CHEERIOS . . . . . . . . . . . . . . . . . . .CORN CHEX . . . . . . . . . . . . . . . . . . . . . . . . . . . . . .RICE CHEX . . . . . . . . . . . . . . . . . . . . . . . . . . . . . . .MULTI-BRAN CHEX . . . . . . . . . . . . . . . . . . . . . . . .WHEAT CHEX . . . . . . . . . . . . . . . . . . . . . . . . . . . . .COUNTRY CORN FLAKES . . . . . . . . . . . . . . . . . . .KABOOM . . . . . . . . . . . . . . . . . . . . . . . . . . . . . . . . .KIX, REGULAR . . . . . . . . . . . . . . . . . . . . . . . . . . . .TOTAL, CORN FLAKES . . . . . . . . . . . . . . . . . . . . .TOTAL, WHOLE GRAIN . . . . . . . . . . . . . . . . . . . . .WHEATIES, REGULAR
POST100% BRAN . . . . . . . . . . . . . . . . . . . . . . . . . . . . . . .BANANA NUT CRUNCH . . . . . . . . . . . . . . . . . . . .BRAN FLAKES . . . . . . . . . . . . . . . . . . . . . . . . . . . .GRAPE NUT FLAKES . . . . . . . . . . . . . . . . . . . . . . .GRAPE NUTS . . . . . . . . . . . . . . . . . . . . . . . . . . . . . .HONEY BUNCHES OF OATS . . . . . . . . . . . . . . . . .
KELLOGGSCOMPLETE OAT BRAN FLAKES . . . . . . . . . . . . . .COMPLETE WHEAT BRAN FLAKES . . . . . . . . . . .CORN FLAKES . . . . . . . . . . . . . . . . . . . . . . . . . . . .CRISPIX . . . . . . . . . . . . . . . . . . . . . . . . . . . . . . . . . .FROSTED MINI WHEATS, BITE SIZE OR REGULARAPPLE CINNAMON MINI WHEATS . . . . . . . . . . .BLUEBERRY MINI WHEATS . . . . . . . . . . . . . . . . .RAISIN MINI WHEATS . . . . . . . . . . . . . . . . . . . . . .STRAWBERRY MINI WHEATS . . . . . . . . . . . . . . .PRODUCT 19 . . . . . . . . . . . . . . . . . . . . . . . . . . . . . .SPECIAL K . . . . . . . . . . . . . . . . . . . . . . . . . . . . . . . .
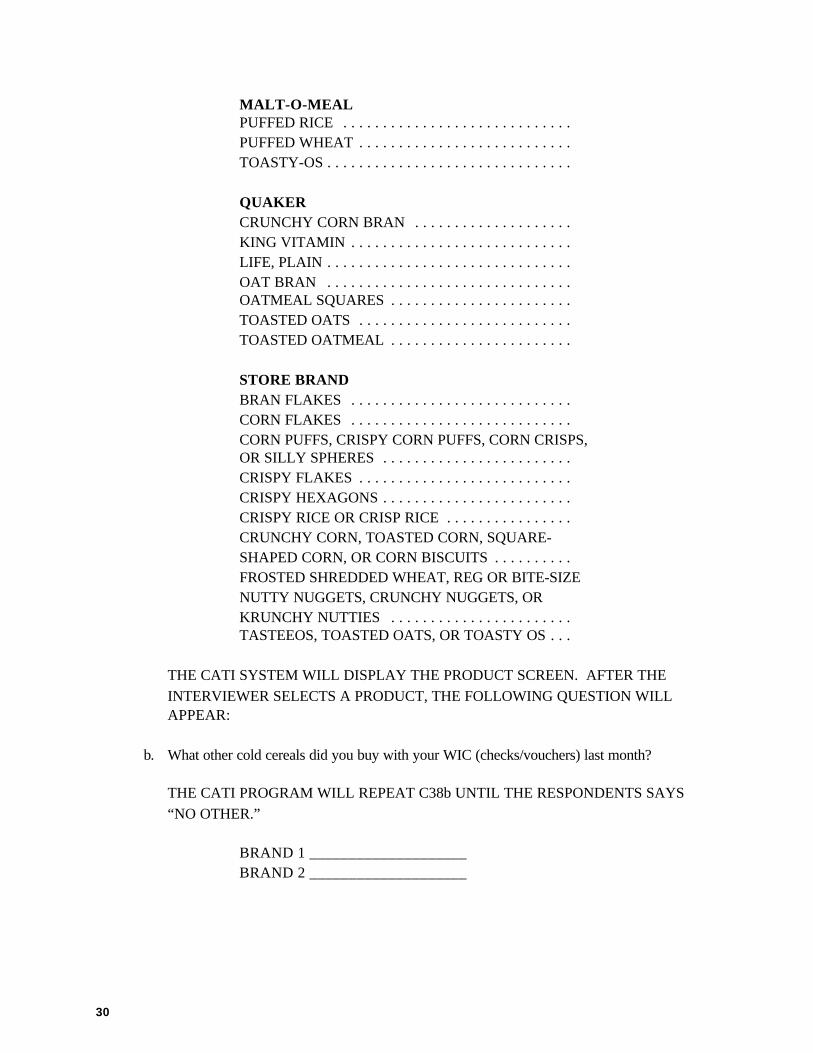
30
MALT-O-MEALPUFFED RICE . . . . . . . . . . . . . . . . . . . . . . . . . . . . .PUFFED WHEAT . . . . . . . . . . . . . . . . . . . . . . . . . . .TOASTY-OS . . . . . . . . . . . . . . . . . . . . . . . . . . . . . . .
QUAKERCRUNCHY CORN BRAN . . . . . . . . . . . . . . . . . . . .KING VITAMIN . . . . . . . . . . . . . . . . . . . . . . . . . . . .LIFE, PLAIN . . . . . . . . . . . . . . . . . . . . . . . . . . . . . . .OAT BRAN . . . . . . . . . . . . . . . . . . . . . . . . . . . . . . .OATMEAL SQUARES . . . . . . . . . . . . . . . . . . . . . . .TOASTED OATS . . . . . . . . . . . . . . . . . . . . . . . . . . .TOASTED OATMEAL . . . . . . . . . . . . . . . . . . . . . . .
STORE BRANDBRAN FLAKES . . . . . . . . . . . . . . . . . . . . . . . . . . . .CORN FLAKES . . . . . . . . . . . . . . . . . . . . . . . . . . . .CORN PUFFS, CRISPY CORN PUFFS, CORN CRISPS, OR SILLY SPHERES . . . . . . . . . . . . . . . . . . . . . . . .CRISPY FLAKES . . . . . . . . . . . . . . . . . . . . . . . . . . .CRISPY HEXAGONS . . . . . . . . . . . . . . . . . . . . . . . .CRISPY RICE OR CRISP RICE . . . . . . . . . . . . . . . .CRUNCHY CORN, TOASTED CORN, SQUARE-SHAPED CORN, OR CORN BISCUITS . . . . . . . . . .FROSTED SHREDDED WHEAT, REG OR BITE-SIZENUTTY NUGGETS, CRUNCHY NUGGETS, OR KRUNCHY NUTTIES . . . . . . . . . . . . . . . . . . . . . . .TASTEEOS, TOASTED OATS, OR TOASTY OS . . .
THE CATI SYSTEM WILL DISPLAY THE PRODUCT SCREEN. AFTER THEINTERVIEWER SELECTS A PRODUCT, THE FOLLOWING QUESTION WILLAPPEAR:
b. What other cold cereals did you buy with your WIC (checks/vouchers) last month?
THE CATI PROGRAM WILL REPEAT C38b UNTIL THE RESPONDENTS SAYS“NO OTHER.”
BRAND 1 ____________________BRAND 2 ____________________
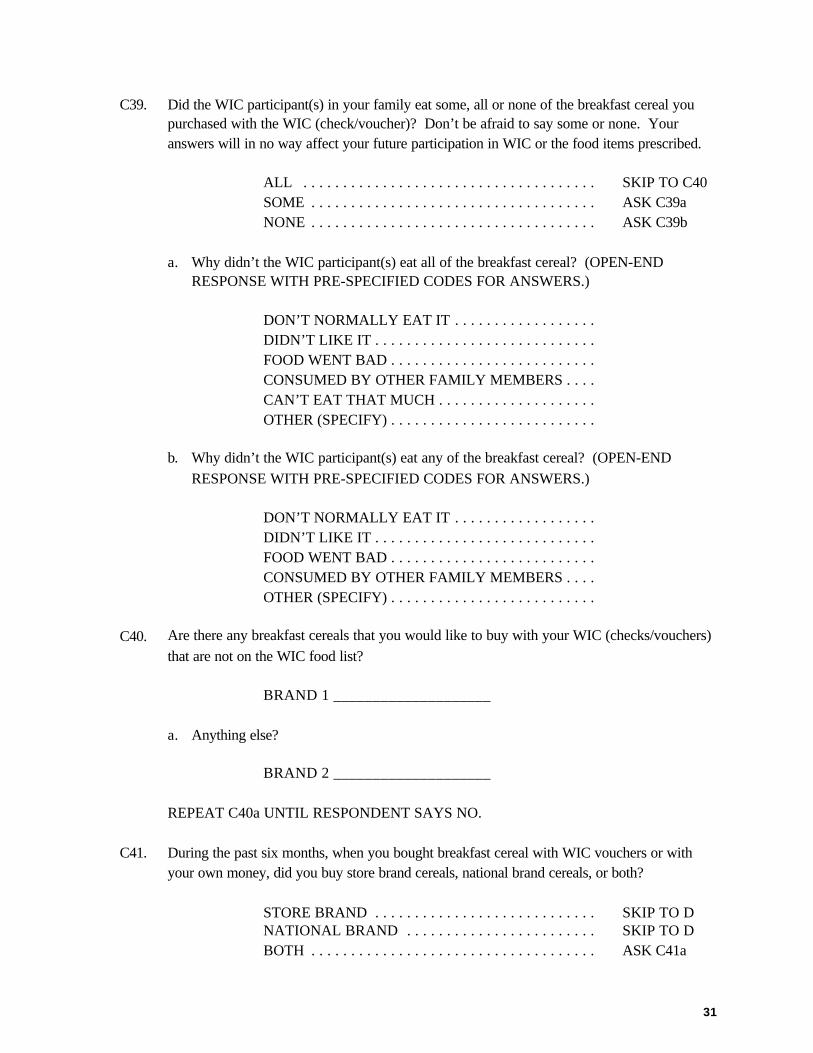
31
C39. Did the WIC participant(s) in your family eat some, all or none of the breakfast cereal youpurchased with the WIC (check/voucher)? Don’t be afraid to say some or none. Youranswers will in no way affect your future participation in WIC or the food items prescribed.
ALL . . . . . . . . . . . . . . . . . . . . . . . . . . . . . . . . . . . . . SKIP TO C40SOME . . . . . . . . . . . . . . . . . . . . . . . . . . . . . . . . . . . . ASK C39aNONE . . . . . . . . . . . . . . . . . . . . . . . . . . . . . . . . . . . . ASK C39b
a. Why didn’t the WIC participant(s) eat all of the breakfast cereal? (OPEN-ENDRESPONSE WITH PRE-SPECIFIED CODES FOR ANSWERS.)
DON’T NORMALLY EAT IT . . . . . . . . . . . . . . . . . .DIDN’T LIKE IT . . . . . . . . . . . . . . . . . . . . . . . . . . . .FOOD WENT BAD . . . . . . . . . . . . . . . . . . . . . . . . . .CONSUMED BY OTHER FAMILY MEMBERS . . . .CAN’T EAT THAT MUCH . . . . . . . . . . . . . . . . . . . .OTHER (SPECIFY) . . . . . . . . . . . . . . . . . . . . . . . . . .
b. Why didn’t the WIC participant(s) eat any of the breakfast cereal? (OPEN-ENDRESPONSE WITH PRE-SPECIFIED CODES FOR ANSWERS.)
DON’T NORMALLY EAT IT . . . . . . . . . . . . . . . . . .DIDN’T LIKE IT . . . . . . . . . . . . . . . . . . . . . . . . . . . .FOOD WENT BAD . . . . . . . . . . . . . . . . . . . . . . . . . .CONSUMED BY OTHER FAMILY MEMBERS . . . .OTHER (SPECIFY) . . . . . . . . . . . . . . . . . . . . . . . . . .
C40. Are there any breakfast cereals that you would like to buy with your WIC (checks/vouchers)that are not on the WIC food list?
BRAND 1 ____________________
a. Anything else?
BRAND 2 ____________________
REPEAT C40a UNTIL RESPONDENT SAYS NO.
C41. During the past six months, when you bought breakfast cereal with WIC vouchers or withyour own money, did you buy store brand cereals, national brand cereals, or both?
STORE BRAND . . . . . . . . . . . . . . . . . . . . . . . . . . . . SKIP TO DNATIONAL BRAND . . . . . . . . . . . . . . . . . . . . . . . . SKIP TO DBOTH . . . . . . . . . . . . . . . . . . . . . . . . . . . . . . . . . . . . ASK C41a

32
a. Which do you prefer?
STORE BRAND ALWAYS . . . . . . . . . . . . . . . . . . . .NATIONAL BRANDS ALWAYS . . . . . . . . . . . . . . .DEPENDS ON THE PRODUCT . . . . . . . . . . . . . . . .NO PREFERENCE . . . . . . . . . . . . . . . . . . . . . . . . . .
33
D. Access to WIC Vendors
General Food Shopping
My next set of questions are about shopping for food.
D1. At what kind of store do you buy most of your food? (READ AND CIRCLE ONE. READEXAMPLES IN PARENTHESES ONLY IF NECESSARY.)
Supermarket . . . . . . . . . . . . . . . . . . . . . . . . . . . . . . . .Smaller grocery store such as a neighborhood grocer . .Convenience store such as 7-11 or stores that sell
groceries and gas . . . . . . . . . . . . . . . . . . . . . . . . . . .Specialty stores such as bakeries, vegetable stands,
farmers’ markets, dairy stores, meat markets, health food stores . . . . . . . . . . . . . . . . . . . . . . . . . . . . . . .
General merchandise store such as WalMart . . . . . . . .OTHER (SPECIFY) . . . . . . . . . . . . . . . . . . . . . . . . . .
D2. What is the name of the store where you buy most of your food?
______________________________
D3. Where is that store located? (PROMPT FOR STREET AND CITY.)
STREET NAME _________________________________________CITY OR TOWN ________________________________________
D4. How do you usually get to (STORE)? IF RESPONDENT REPORTS COMBINATION,CODE HIGHEST NUMBER.
WALK . . . . . . . . . . . . . . . . . . . . . . . . . . . . . . . . . . . SKIP TO D8BICYCLE . . . . . . . . . . . . . . . . . . . . . . . . . . . . . . . . . SKIP TO D7DRIVE A CAR . . . . . . . . . . . . . . . . . . . . . . . . . . . . . GO TO D5GET A RIDE WITH FRIENDS OR RELATIVES . . . GO TO D5TAKE A BUS . . . . . . . . . . . . . . . . . . . . . . . . . . . . . . SKIP TO D6TAKE A TAXI/HACK . . . . . . . . . . . . . . . . . . . . . . . SKIP TO D6TAKE A CUSTOMER SERVICE VAN . . . . . . . . . . . SKIP TO D6OTHER (SPECIFY) . . . . . . . . . . . . . . . . . . . . . . . . . .
D5. Do you pay any out-of-pocket costs when you drive to (STORE), such as parking or tolls?
YES . . . . . . . . . . . . . . . . . . . . . . . . . . . . . . . . . . . . . . ASK D5aNO . . . . . . . . . . . . . . . . . . . . . . . . . . . . . . . . . . . . . . SKIP TO D7
34
a. How much do you usually pay in out-of-pocket costs each time you go to (STORE)?
$ _____. __ . . . . . . . . . . . . . . . . . . . . . . . . . . . . . . . SKIP TO D7
D6. Do you pay any out-of-pocket costs for this transportation to get to (STORE)?
YES . . . . . . . . . . . . . . . . . . . . . . . . . . . . . . . . . . . . . . ASK D6aNO . . . . . . . . . . . . . . . . . . . . . . . . . . . . . . . . . . . . . . GO TO D7
a. How much do you usually pay in out-of-pocket costs each time you go to (STORE)?
$ _____. __
b. Is that amount for one way, or for a round trip?
ONE WAY . . . . . . . . . . . . . . . . . . . . . . . . . . . . . . . .ROUND TRIP . . . . . . . . . . . . . . . . . . . . . . . . . . . . . .
D7. If you wanted to, could you walk to (STORE)?
YES . . . . . . . . . . . . . . . . . . . . . . . . . . . . . . . . . . . . . .NO . . . . . . . . . . . . . . . . . . . . . . . . . . . . . . . . . . . . . .
D8. How far is (STORE) from your home? PROBE: How many miles or blocks is (STORE)from your home?
_____ MILES_____ BLOCKS
D9. How long does it take you to travel to (STORE)? PROBE: By your usual means oftransportation. WE WANT TRAVEL TIME ONE WAY.
_____ MINUTES
WIC Redemption
D10. Is the store where you do most of your food shopping the same store where you usually useyour WIC (checks/vouchers)?
YES . . . . . . . . . . . . . . . . . . . . . . . . . . . . . . . . . . . . . . SKIP TO D19NO . . . . . . . . . . . . . . . . . . . . . . . . . . . . . . . . . . . . . .NEVER USED (CHECKS/VOUCHERS) . . . . . . . . . . SKIP TO SECTION E
35
D11. What is the name of the store where you usually use your WIC (checks/vouchers)?
______________________________
D12. Where is that store located? (PROMPT FOR STREET AND CITY.)
STREET __________________________________________CITY OR TOWN ___________________________________
D13. How do you usually get to (WIC STORE)? IF RESPONDENT REPORTSCOMBINATION, CODE HIGHEST NUMBER.
WALK . . . . . . . . . . . . . . . . . . . . . . . . . . . . . . . . . . . SKIP TO D17BICYCLE . . . . . . . . . . . . . . . . . . . . . . . . . . . . . . . . . SKIP TO D16DRIVE A CAR . . . . . . . . . . . . . . . . . . . . . . . . . . . . . ASK D14GET A RIDE WITH FRIENDS OR RELATIVES . . . ASK D14TAKE A BUS . . . . . . . . . . . . . . . . . . . . . . . . . . . . . . SKIP TO D15TAKE A TAXI/HACK . . . . . . . . . . . . . . . . . . . . . . . SKIP TO D15TAKE A CUSTOMER SERVICE VAN . . . . . . . . . . . SKIP TO D15OTHER (SPECIFY) . . . . . . . . . . . . . . . . . . . . . . . . . .
D14. Do you pay any out-of-pocket costs when you drive to (WIC STORE), such as parking ortolls?
YES . . . . . . . . . . . . . . . . . . . . . . . . . . . . . . . . . . . . . . ASK D14aNO . . . . . . . . . . . . . . . . . . . . . . . . . . . . . . . . . . . . . . SKIP TO D16
a. How much do you usually pay in out-of-pocket costs each time you go to (WICSTORE)?
$ _____. __ . . . . . . . . . . . . . . . . . . . . . . . . . . . . . . . SKIP TO D16
D15. Do you pay any out-of-pocket costs for this transportation to get to (WIC STORE)?
YES . . . . . . . . . . . . . . . . . . . . . . . . . . . . . . . . . . . . . . ASK D15aNO . . . . . . . . . . . . . . . . . . . . . . . . . . . . . . . . . . . . . . GO TO D16
a. How much do you usually pay in out-of-pocket costs for this transportation?
$ _____. __
36
b. Is that amount for one way or for a round trip?
ONE WAY . . . . . . . . . . . . . . . . . . . . . . . . . . . . . . . .ROUND TRIP . . . . . . . . . . . . . . . . . . . . . . . . . . . . . .
D16. If you wanted to, could you walk to (WIC STORE)?
YES . . . . . . . . . . . . . . . . . . . . . . . . . . . . . . . . . . . . . .NO . . . . . . . . . . . . . . . . . . . . . . . . . . . . . . . . . . . . . .
D17. How far is (WIC STORE) from your home? PROBE: How many miles or blocks is (WICSTORE) from your home?
_____ MILES_____ BLOCKS
D18. How long does it take you to travel to (WIC STORE)? PROBE: By your usual means oftransportation. WE WANT TRAVEL TIME ONE WAY.
_____ MINUTES
Store Satisfaction
D19. Next, I am going to read a list of factors that could be important when a person decideswhere to shop for food. As I read each one, please tell me if (WIC STORE) is excellent,good, fair, or poor.
a. First, having a clean, neat store. Would you rate the cleanliness and neatness of (WICSTORE) as excellent, good, fair, or poor?
EXCELLENT . . . . . . . . . . . . . . . . . . . . . . . . . . . . . .GOOD . . . . . . . . . . . . . . . . . . . . . . . . . . . . . . . . . . . .FAIR . . . . . . . . . . . . . . . . . . . . . . . . . . . . . . . . . . . . .POOR . . . . . . . . . . . . . . . . . . . . . . . . . . . . . . . . . . . .
b. Having courteous, friendly employees. PROBE: Please tell me if (WIC STORE) isexcellent, good, fair, or poor.
EXCELLENT . . . . . . . . . . . . . . . . . . . . . . . . . . . . . .GOOD . . . . . . . . . . . . . . . . . . . . . . . . . . . . . . . . . . . .FAIR . . . . . . . . . . . . . . . . . . . . . . . . . . . . . . . . . . . . .POOR . . . . . . . . . . . . . . . . . . . . . . . . . . . . . . . . . . . .

37
c. Having good, low prices. PROBE: Please tell me if (WIC STORE) is excellent, good,fair, or poor.
EXCELLENT . . . . . . . . . . . . . . . . . . . . . . . . . . . . . .GOOD . . . . . . . . . . . . . . . . . . . . . . . . . . . . . . . . . . . .FAIR . . . . . . . . . . . . . . . . . . . . . . . . . . . . . . . . . . . . .POOR . . . . . . . . . . . . . . . . . . . . . . . . . . . . . . . . . . . .
d. Having quality fruits and vegetables. PROBE: Please tell me if (WIC STORE) isexcellent, good, fair, or poor.
EXCELLENT . . . . . . . . . . . . . . . . . . . . . . . . . . . . . .GOOD . . . . . . . . . . . . . . . . . . . . . . . . . . . . . . . . . . . .FAIR . . . . . . . . . . . . . . . . . . . . . . . . . . . . . . . . . . . . .POOR . . . . . . . . . . . . . . . . . . . . . . . . . . . . . . . . . . . .
e. Having good quality meat. PROBE: Please tell me if (WIC STORE) is excellent, good,fair, or poor.
EXCELLENT . . . . . . . . . . . . . . . . . . . . . . . . . . . . . .GOOD . . . . . . . . . . . . . . . . . . . . . . . . . . . . . . . . . . . .FAIR . . . . . . . . . . . . . . . . . . . . . . . . . . . . . . . . . . . . .POOR . . . . . . . . . . . . . . . . . . . . . . . . . . . . . . . . . . . .
f. Having good variety or a wide selection. PROBE: Please tell me if (WIC STORE) isexcellent, good, fair, or poor.
EXCELLENT . . . . . . . . . . . . . . . . . . . . . . . . . . . . . .GOOD . . . . . . . . . . . . . . . . . . . . . . . . . . . . . . . . . . . .FAIR . . . . . . . . . . . . . . . . . . . . . . . . . . . . . . . . . . . . .POOR . . . . . . . . . . . . . . . . . . . . . . . . . . . . . . . . . . . .
g. Having private labels or store brands. PROBE: Please tell me if (WIC STORE) isexcellent, good, fair, or poor.
EXCELLENT . . . . . . . . . . . . . . . . . . . . . . . . . . . . . .GOOD . . . . . . . . . . . . . . . . . . . . . . . . . . . . . . . . . . . .FAIR . . . . . . . . . . . . . . . . . . . . . . . . . . . . . . . . . . . . .POOR . . . . . . . . . . . . . . . . . . . . . . . . . . . . . . . . . . . .
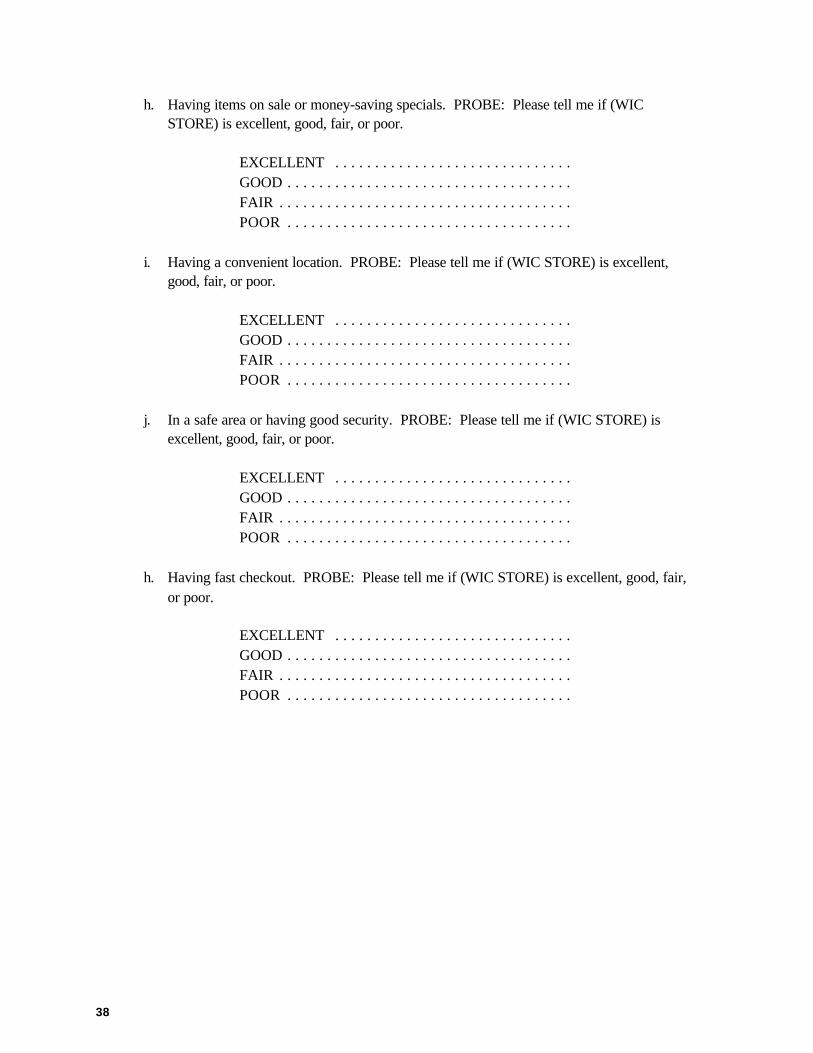
38
h. Having items on sale or money-saving specials. PROBE: Please tell me if (WICSTORE) is excellent, good, fair, or poor.
EXCELLENT . . . . . . . . . . . . . . . . . . . . . . . . . . . . . .GOOD . . . . . . . . . . . . . . . . . . . . . . . . . . . . . . . . . . . .FAIR . . . . . . . . . . . . . . . . . . . . . . . . . . . . . . . . . . . . .POOR . . . . . . . . . . . . . . . . . . . . . . . . . . . . . . . . . . . .
i. Having a convenient location. PROBE: Please tell me if (WIC STORE) is excellent,good, fair, or poor.
EXCELLENT . . . . . . . . . . . . . . . . . . . . . . . . . . . . . .GOOD . . . . . . . . . . . . . . . . . . . . . . . . . . . . . . . . . . . .FAIR . . . . . . . . . . . . . . . . . . . . . . . . . . . . . . . . . . . . .POOR . . . . . . . . . . . . . . . . . . . . . . . . . . . . . . . . . . . .
j. In a safe area or having good security. PROBE: Please tell me if (WIC STORE) isexcellent, good, fair, or poor.
EXCELLENT . . . . . . . . . . . . . . . . . . . . . . . . . . . . . .GOOD . . . . . . . . . . . . . . . . . . . . . . . . . . . . . . . . . . . .FAIR . . . . . . . . . . . . . . . . . . . . . . . . . . . . . . . . . . . . .POOR . . . . . . . . . . . . . . . . . . . . . . . . . . . . . . . . . . . .
h. Having fast checkout. PROBE: Please tell me if (WIC STORE) is excellent, good, fair,or poor.
EXCELLENT . . . . . . . . . . . . . . . . . . . . . . . . . . . . . .GOOD . . . . . . . . . . . . . . . . . . . . . . . . . . . . . . . . . . . .FAIR . . . . . . . . . . . . . . . . . . . . . . . . . . . . . . . . . . . . .POOR . . . . . . . . . . . . . . . . . . . . . . . . . . . . . . . . . . . .
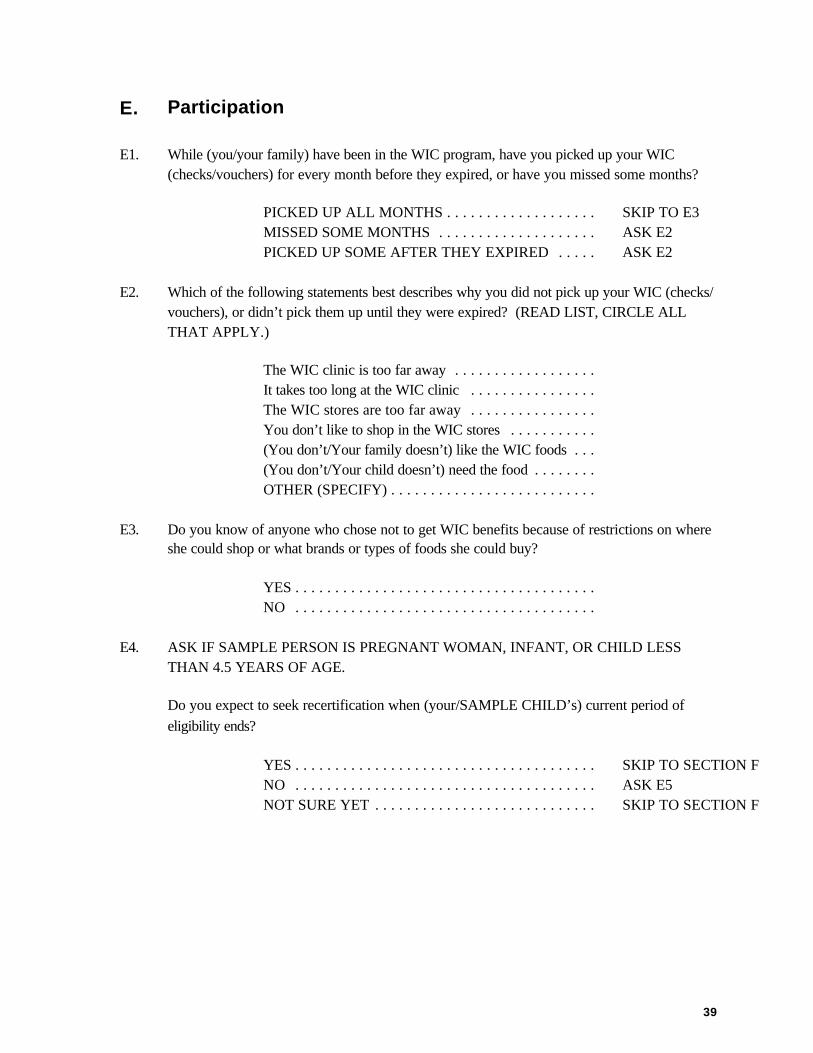
39
E. Participation
E1. While (you/your family) have been in the WIC program, have you picked up your WIC(checks/vouchers) for every month before they expired, or have you missed some months?
PICKED UP ALL MONTHS . . . . . . . . . . . . . . . . . . . SKIP TO E3MISSED SOME MONTHS . . . . . . . . . . . . . . . . . . . . ASK E2PICKED UP SOME AFTER THEY EXPIRED . . . . . ASK E2
E2. Which of the following statements best describes why you did not pick up your WIC (checks/vouchers), or didn’t pick them up until they were expired? (READ LIST, CIRCLE ALLTHAT APPLY.)
The WIC clinic is too far away . . . . . . . . . . . . . . . . . .It takes too long at the WIC clinic . . . . . . . . . . . . . . . .The WIC stores are too far away . . . . . . . . . . . . . . . .You don’t like to shop in the WIC stores . . . . . . . . . . .(You don’t/Your family doesn’t) like the WIC foods . . .(You don’t/Your child doesn’t) need the food . . . . . . . .OTHER (SPECIFY) . . . . . . . . . . . . . . . . . . . . . . . . . .
E3. Do you know of anyone who chose not to get WIC benefits because of restrictions on whereshe could shop or what brands or types of foods she could buy?
YES . . . . . . . . . . . . . . . . . . . . . . . . . . . . . . . . . . . . . .NO . . . . . . . . . . . . . . . . . . . . . . . . . . . . . . . . . . . . . .
E4. ASK IF SAMPLE PERSON IS PREGNANT WOMAN, INFANT, OR CHILD LESSTHAN 4.5 YEARS OF AGE.
Do you expect to seek recertification when (your/SAMPLE CHILD’s) current period ofeligibility ends?
YES . . . . . . . . . . . . . . . . . . . . . . . . . . . . . . . . . . . . . . SKIP TO SECTION FNO . . . . . . . . . . . . . . . . . . . . . . . . . . . . . . . . . . . . . . ASK E5NOT SURE YET . . . . . . . . . . . . . . . . . . . . . . . . . . . . SKIP TO SECTION F
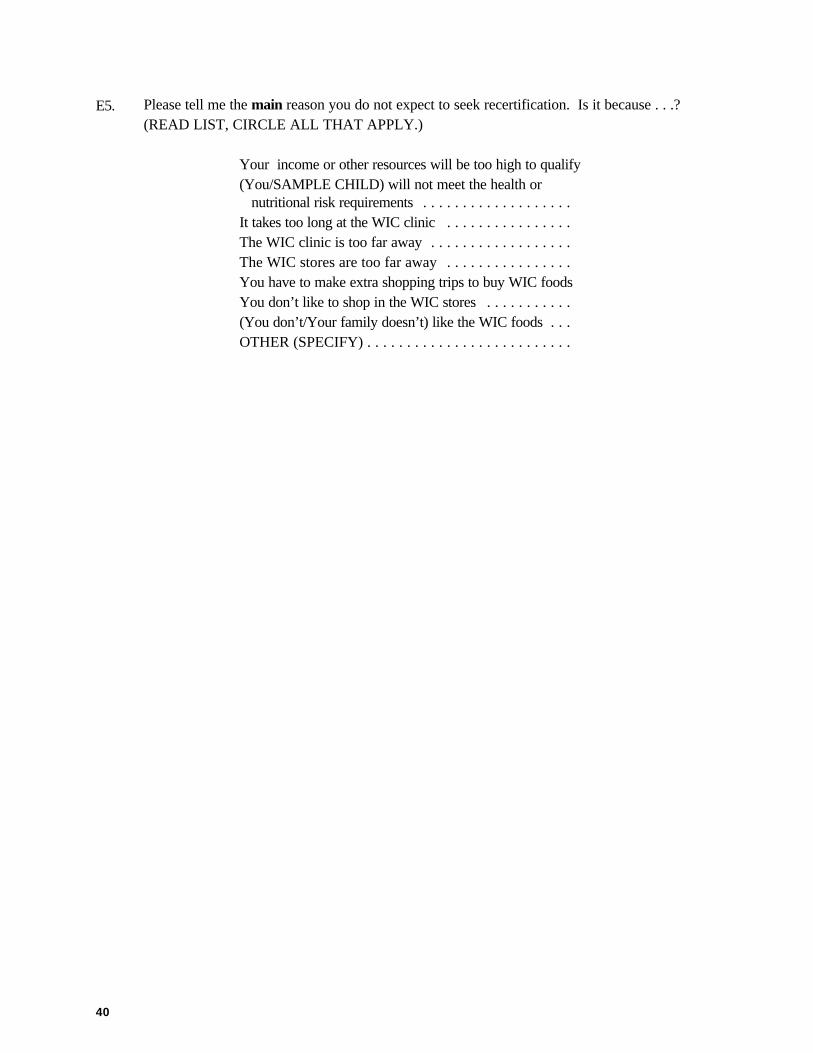
40
E5. Please tell me the main reason you do not expect to seek recertification. Is it because . . .? (READ LIST, CIRCLE ALL THAT APPLY.)
Your income or other resources will be too high to qualify(You/SAMPLE CHILD) will not meet the health or
nutritional risk requirements . . . . . . . . . . . . . . . . . . .It takes too long at the WIC clinic . . . . . . . . . . . . . . . .The WIC clinic is too far away . . . . . . . . . . . . . . . . . .The WIC stores are too far away . . . . . . . . . . . . . . . .You have to make extra shopping trips to buy WIC foodsYou don’t like to shop in the WIC stores . . . . . . . . . . .(You don’t/Your family doesn’t) like the WIC foods . . .OTHER (SPECIFY) . . . . . . . . . . . . . . . . . . . . . . . . . .
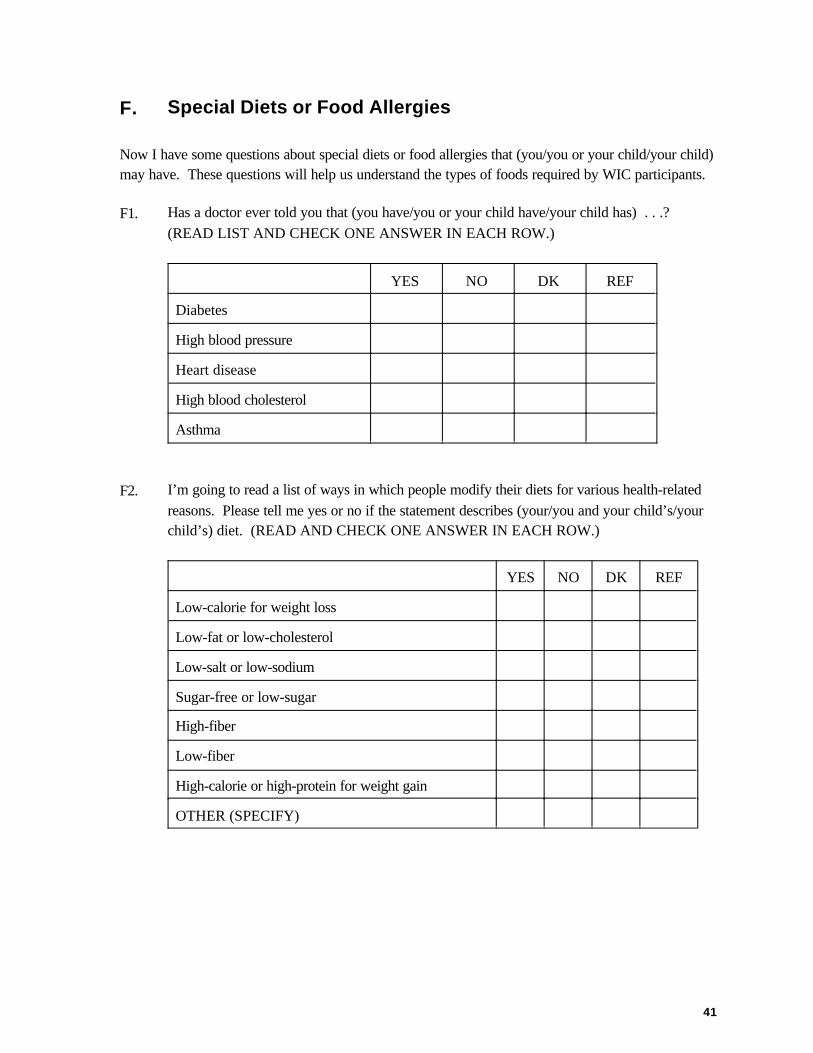
41
F. Special Diets or Food Allergies
Now I have some questions about special diets or food allergies that (you/you or your child/your child)may have. These questions will help us understand the types of foods required by WIC participants.
F1. Has a doctor ever told you that (you have/you or your child have/your child has) . . .? (READ LIST AND CHECK ONE ANSWER IN EACH ROW.)
YES NO DK REF
Diabetes
High blood pressure
Heart disease
High blood cholesterol
Asthma
F2. I’m going to read a list of ways in which people modify their diets for various health-relatedreasons. Please tell me yes or no if the statement describes (your/you and your child’s/yourchild’s) diet. (READ AND CHECK ONE ANSWER IN EACH ROW.)
YES NO DK REF
Low-calorie for weight loss
Low-fat or low-cholesterol
Low-salt or low-sodium
Sugar-free or low-sugar
High-fiber
Low-fiber
High-calorie or high-protein for weight gain
OTHER (SPECIFY)
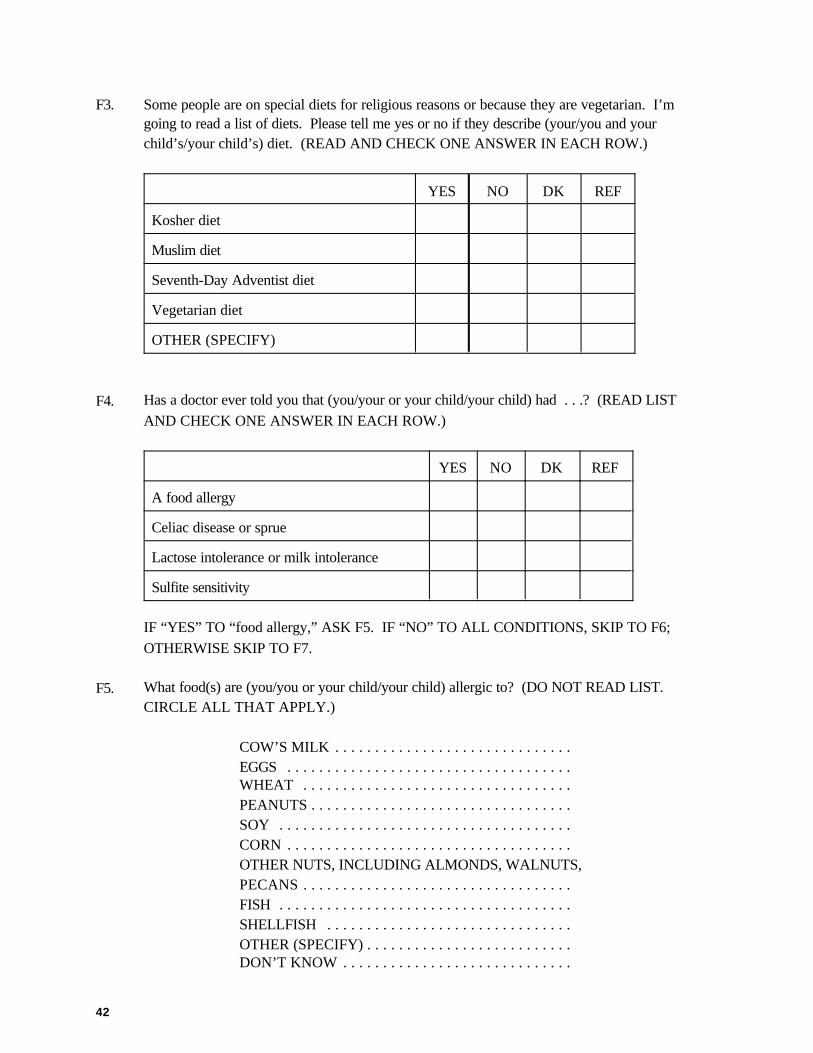
42
F3. Some people are on special diets for religious reasons or because they are vegetarian. I’mgoing to read a list of diets. Please tell me yes or no if they describe (your/you and yourchild’s/your child’s) diet. (READ AND CHECK ONE ANSWER IN EACH ROW.)
YES NO DK REF
Kosher diet
Muslim diet
Seventh-Day Adventist diet
Vegetarian diet
OTHER (SPECIFY)
F4. Has a doctor ever told you that (you/your or your child/your child) had . . .? (READ LISTAND CHECK ONE ANSWER IN EACH ROW.)
YES NO DK REF
A food allergy
Celiac disease or sprue
Lactose intolerance or milk intolerance
Sulfite sensitivity
IF “YES” TO “food allergy,” ASK F5. IF “NO” TO ALL CONDITIONS, SKIP TO F6;OTHERWISE SKIP TO F7.
F5. What food(s) are (you/you or your child/your child) allergic to? (DO NOT READ LIST. CIRCLE ALL THAT APPLY.)
COW’S MILK . . . . . . . . . . . . . . . . . . . . . . . . . . . . . .EGGS . . . . . . . . . . . . . . . . . . . . . . . . . . . . . . . . . . . .WHEAT . . . . . . . . . . . . . . . . . . . . . . . . . . . . . . . . . .PEANUTS . . . . . . . . . . . . . . . . . . . . . . . . . . . . . . . . .SOY . . . . . . . . . . . . . . . . . . . . . . . . . . . . . . . . . . . . .CORN . . . . . . . . . . . . . . . . . . . . . . . . . . . . . . . . . . . .OTHER NUTS, INCLUDING ALMONDS, WALNUTS, PECANS . . . . . . . . . . . . . . . . . . . . . . . . . . . . . . . . . .FISH . . . . . . . . . . . . . . . . . . . . . . . . . . . . . . . . . . . . .SHELLFISH . . . . . . . . . . . . . . . . . . . . . . . . . . . . . . .OTHER (SPECIFY) . . . . . . . . . . . . . . . . . . . . . . . . . .DON’T KNOW . . . . . . . . . . . . . . . . . . . . . . . . . . . . .
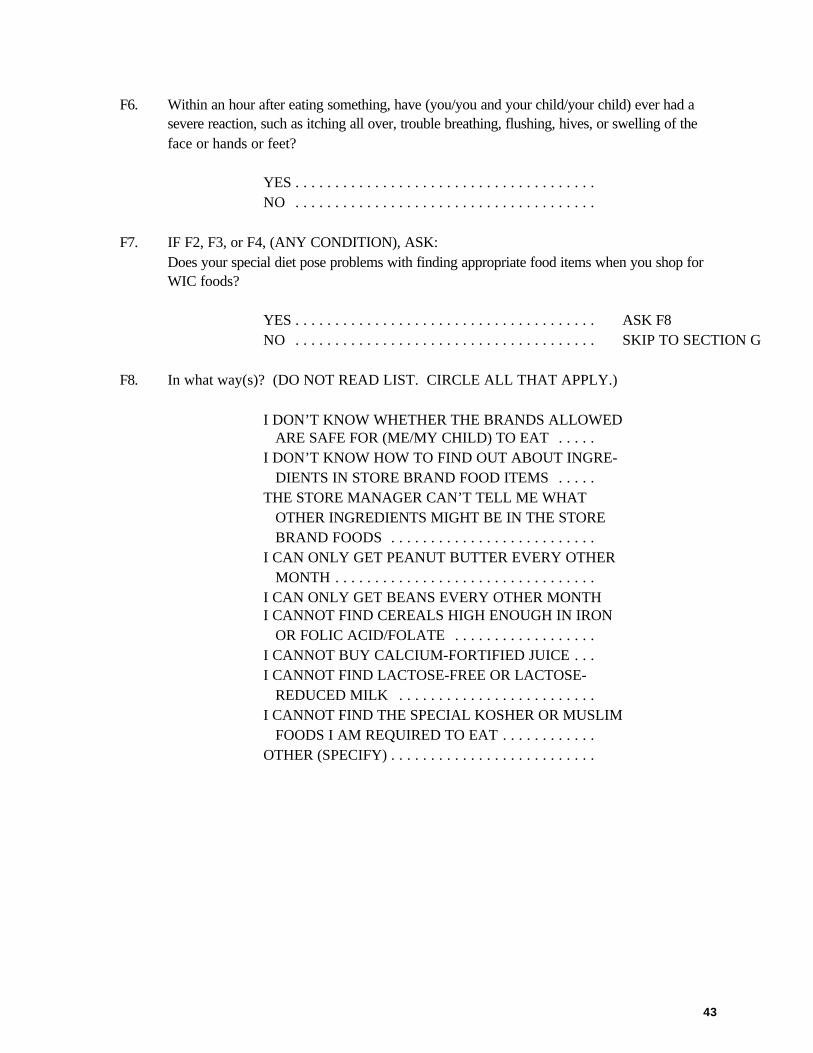
43
F6. Within an hour after eating something, have (you/you and your child/your child) ever had asevere reaction, such as itching all over, trouble breathing, flushing, hives, or swelling of theface or hands or feet?
YES . . . . . . . . . . . . . . . . . . . . . . . . . . . . . . . . . . . . . .NO . . . . . . . . . . . . . . . . . . . . . . . . . . . . . . . . . . . . . .
F7. IF F2, F3, or F4, (ANY CONDITION), ASK:Does your special diet pose problems with finding appropriate food items when you shop forWIC foods?
YES . . . . . . . . . . . . . . . . . . . . . . . . . . . . . . . . . . . . . . ASK F8NO . . . . . . . . . . . . . . . . . . . . . . . . . . . . . . . . . . . . . . SKIP TO SECTION G
F8. In what way(s)? (DO NOT READ LIST. CIRCLE ALL THAT APPLY.)
I DON’T KNOW WHETHER THE BRANDS ALLOWEDARE SAFE FOR (ME/MY CHILD) TO EAT . . . . .
I DON’T KNOW HOW TO FIND OUT ABOUT INGRE-DIENTS IN STORE BRAND FOOD ITEMS . . . . .
THE STORE MANAGER CAN’T TELL ME WHAT OTHER INGREDIENTS MIGHT BE IN THE STORE BRAND FOODS . . . . . . . . . . . . . . . . . . . . . . . . . .
I CAN ONLY GET PEANUT BUTTER EVERY OTHERMONTH . . . . . . . . . . . . . . . . . . . . . . . . . . . . . . . . .
I CAN ONLY GET BEANS EVERY OTHER MONTHI CANNOT FIND CEREALS HIGH ENOUGH IN IRON
OR FOLIC ACID/FOLATE . . . . . . . . . . . . . . . . . .I CANNOT BUY CALCIUM-FORTIFIED JUICE . . .I CANNOT FIND LACTOSE-FREE OR LACTOSE-
REDUCED MILK . . . . . . . . . . . . . . . . . . . . . . . . .I CANNOT FIND THE SPECIAL KOSHER OR MUSLIM
FOODS I AM REQUIRED TO EAT . . . . . . . . . . . .OTHER (SPECIFY) . . . . . . . . . . . . . . . . . . . . . . . . . .
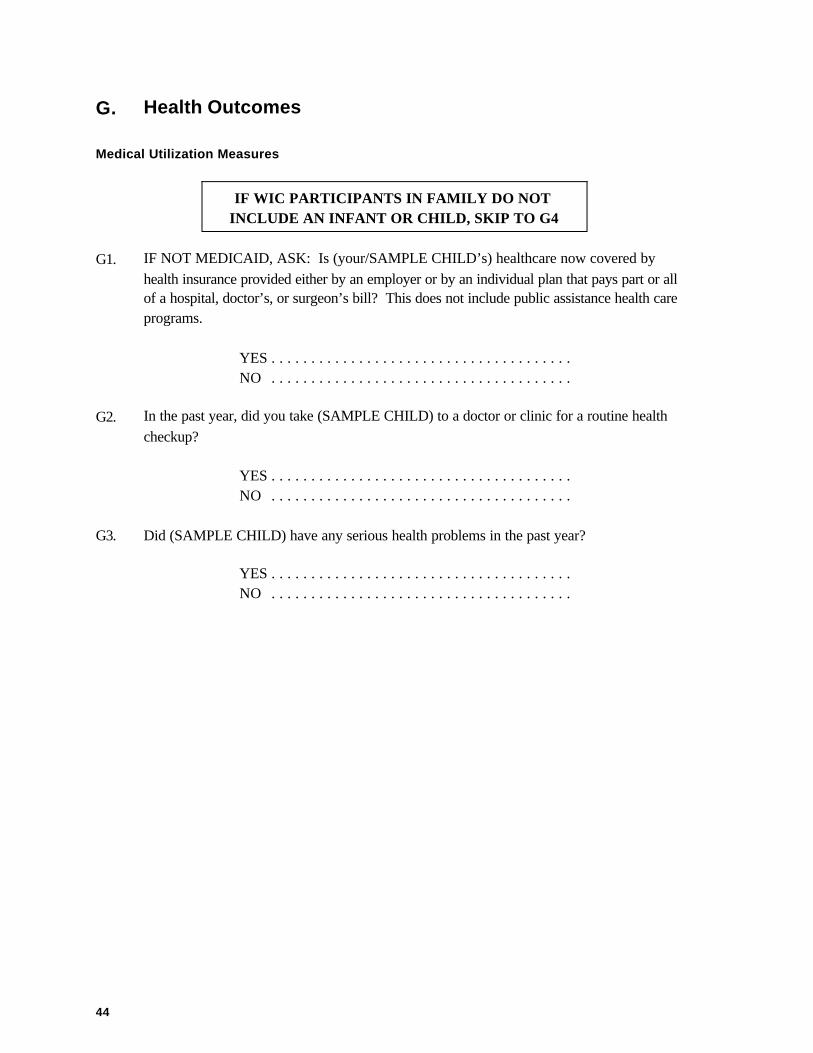
44
G. Health Outcomes
Medical Utilization Measures
IF WIC PARTICIPANTS IN FAMILY DO NOT INCLUDE AN INFANT OR CHILD, SKIP TO G4
G1. IF NOT MEDICAID, ASK: Is (your/SAMPLE CHILD’s) healthcare now covered byhealth insurance provided either by an employer or by an individual plan that pays part or allof a hospital, doctor’s, or surgeon’s bill? This does not include public assistance health careprograms.
YES . . . . . . . . . . . . . . . . . . . . . . . . . . . . . . . . . . . . . .NO . . . . . . . . . . . . . . . . . . . . . . . . . . . . . . . . . . . . . .
G2. In the past year, did you take (SAMPLE CHILD) to a doctor or clinic for a routine healthcheckup?
YES . . . . . . . . . . . . . . . . . . . . . . . . . . . . . . . . . . . . . .NO . . . . . . . . . . . . . . . . . . . . . . . . . . . . . . . . . . . . . .
G3. Did (SAMPLE CHILD) have any serious health problems in the past year?
YES . . . . . . . . . . . . . . . . . . . . . . . . . . . . . . . . . . . . . .NO . . . . . . . . . . . . . . . . . . . . . . . . . . . . . . . . . . . . . .
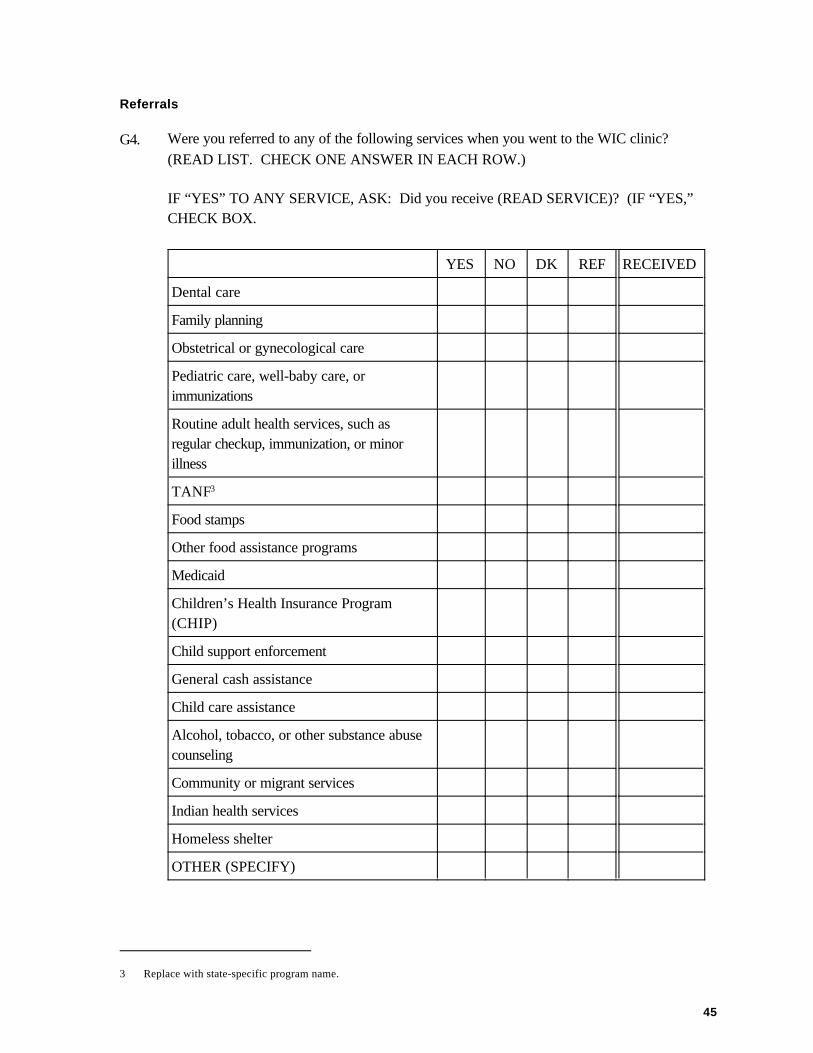
3 Replace with state-specific program name.
45
Referrals
G4. Were you referred to any of the following services when you went to the WIC clinic? (READ LIST. CHECK ONE ANSWER IN EACH ROW.)
IF “YES” TO ANY SERVICE, ASK: Did you receive (READ SERVICE)? (IF “YES,”CHECK BOX.
YES NO DK REF RECEIVED
Dental care
Family planning
Obstetrical or gynecological care
Pediatric care, well-baby care, orimmunizations
Routine adult health services, such asregular checkup, immunization, or minorillness
TANF3
Food stamps
Other food assistance programs
Medicaid
Children’s Health Insurance Program(CHIP)
Child support enforcement
General cash assistance
Child care assistance
Alcohol, tobacco, or other substance abusecounseling
Community or migrant services
Indian health services
Homeless shelter
OTHER (SPECIFY)
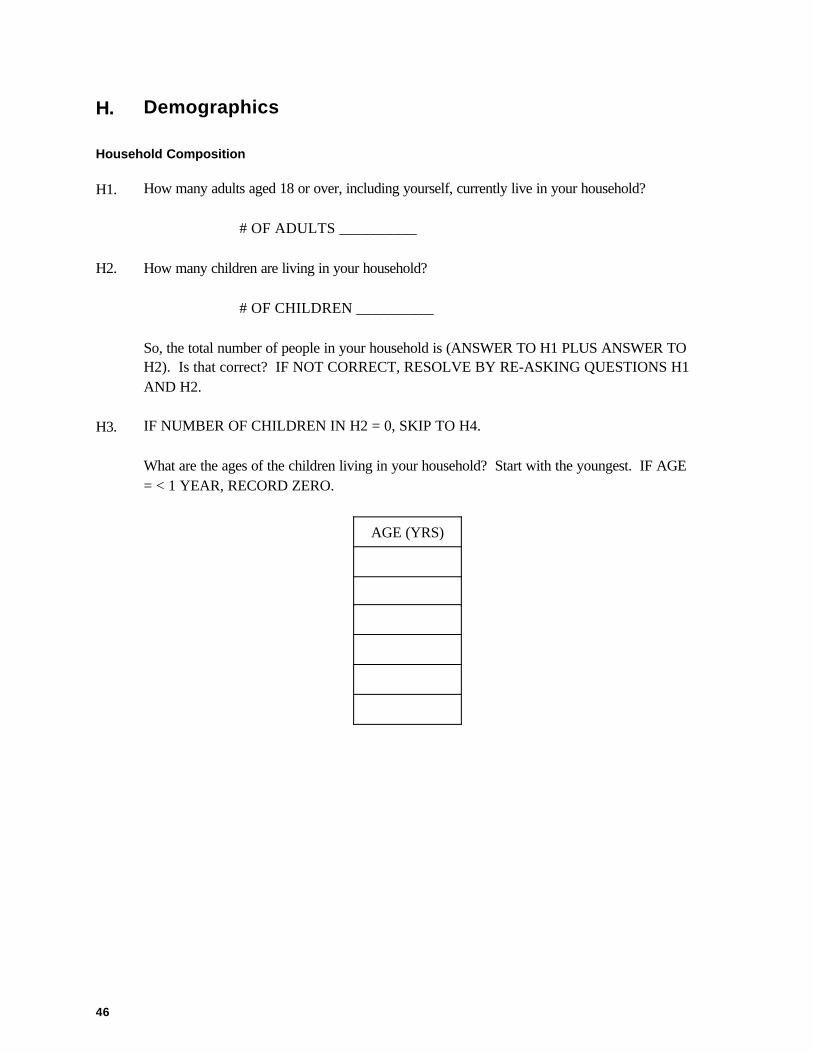
46
H. Demographics
Household Composition
H1. How many adults aged 18 or over, including yourself, currently live in your household?
# OF ADULTS __________
H2. How many children are living in your household?
# OF CHILDREN __________
So, the total number of people in your household is (ANSWER TO H1 PLUS ANSWER TOH2). Is that correct? IF NOT CORRECT, RESOLVE BY RE-ASKING QUESTIONS H1AND H2.
H3. IF NUMBER OF CHILDREN IN H2 = 0, SKIP TO H4.
What are the ages of the children living in your household? Start with the youngest. IF AGE= < 1 YEAR, RECORD ZERO.
AGE (YRS)
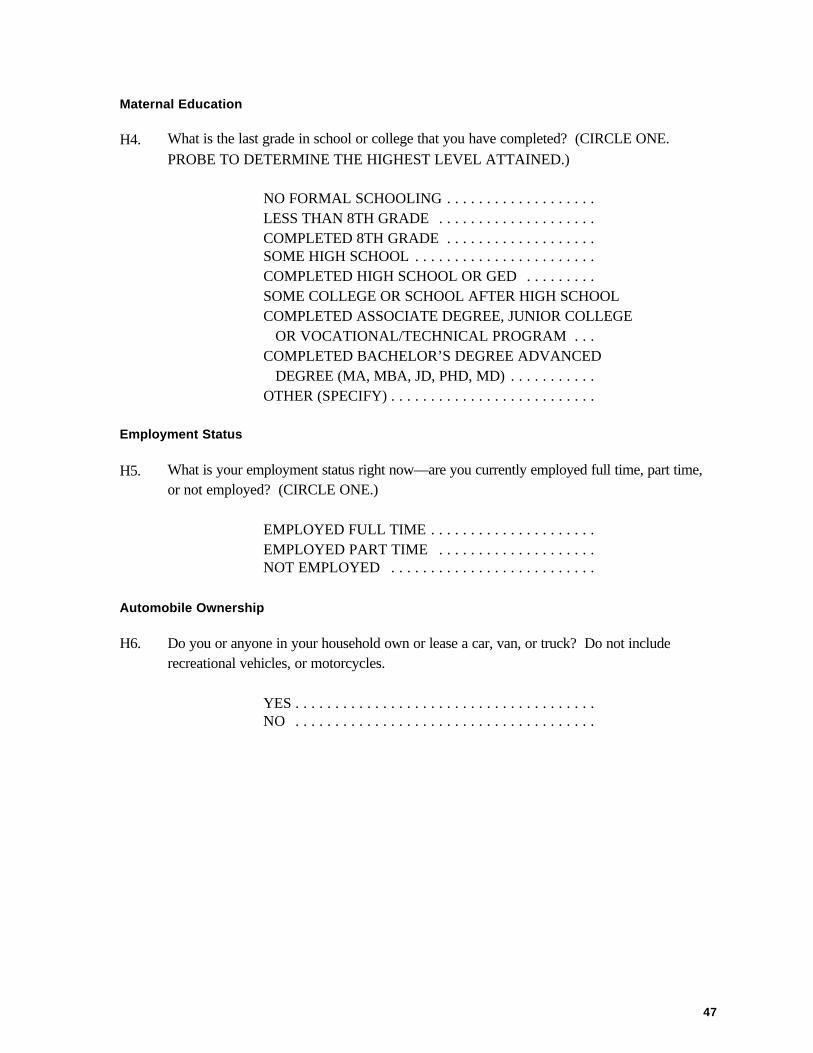
47
Maternal Education
H4. What is the last grade in school or college that you have completed? (CIRCLE ONE. PROBE TO DETERMINE THE HIGHEST LEVEL ATTAINED.)
NO FORMAL SCHOOLING . . . . . . . . . . . . . . . . . . .LESS THAN 8TH GRADE . . . . . . . . . . . . . . . . . . . .COMPLETED 8TH GRADE . . . . . . . . . . . . . . . . . . .SOME HIGH SCHOOL . . . . . . . . . . . . . . . . . . . . . . .COMPLETED HIGH SCHOOL OR GED . . . . . . . . .SOME COLLEGE OR SCHOOL AFTER HIGH SCHOOLCOMPLETED ASSOCIATE DEGREE, JUNIOR COLLEGE
OR VOCATIONAL/TECHNICAL PROGRAM . . .COMPLETED BACHELOR’S DEGREE ADVANCED
DEGREE (MA, MBA, JD, PHD, MD) . . . . . . . . . . .OTHER (SPECIFY) . . . . . . . . . . . . . . . . . . . . . . . . . .
Employment Status
H5. What is your employment status right now—are you currently employed full time, part time,or not employed? (CIRCLE ONE.)
EMPLOYED FULL TIME . . . . . . . . . . . . . . . . . . . . .EMPLOYED PART TIME . . . . . . . . . . . . . . . . . . . .NOT EMPLOYED . . . . . . . . . . . . . . . . . . . . . . . . . .
Automobile Ownership
H6. Do you or anyone in your household own or lease a car, van, or truck? Do not includerecreational vehicles, or motorcycles.
YES . . . . . . . . . . . . . . . . . . . . . . . . . . . . . . . . . . . . . .NO . . . . . . . . . . . . . . . . . . . . . . . . . . . . . . . . . . . . . .
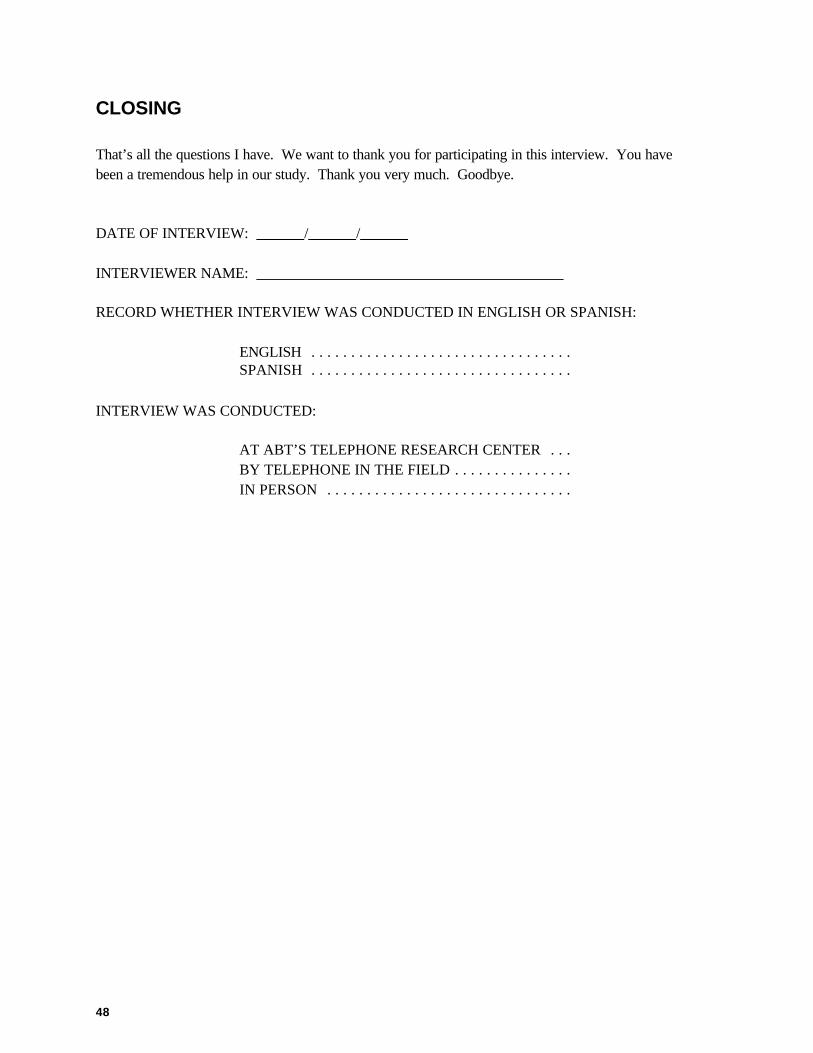
48
CLOSING
That’s all the questions I have. We want to thank you for participating in this interview. You havebeen a tremendous help in our study. Thank you very much. Goodbye.
DATE OF INTERVIEW: / /
INTERVIEWER NAME:
RECORD WHETHER INTERVIEW WAS CONDUCTED IN ENGLISH OR SPANISH:
ENGLISH . . . . . . . . . . . . . . . . . . . . . . . . . . . . . . . . .SPANISH . . . . . . . . . . . . . . . . . . . . . . . . . . . . . . . . .
INTERVIEW WAS CONDUCTED:
AT ABT’S TELEPHONE RESEARCH CENTER . . .BY TELEPHONE IN THE FIELD . . . . . . . . . . . . . . .IN PERSON . . . . . . . . . . . . . . . . . . . . . . . . . . . . . . .
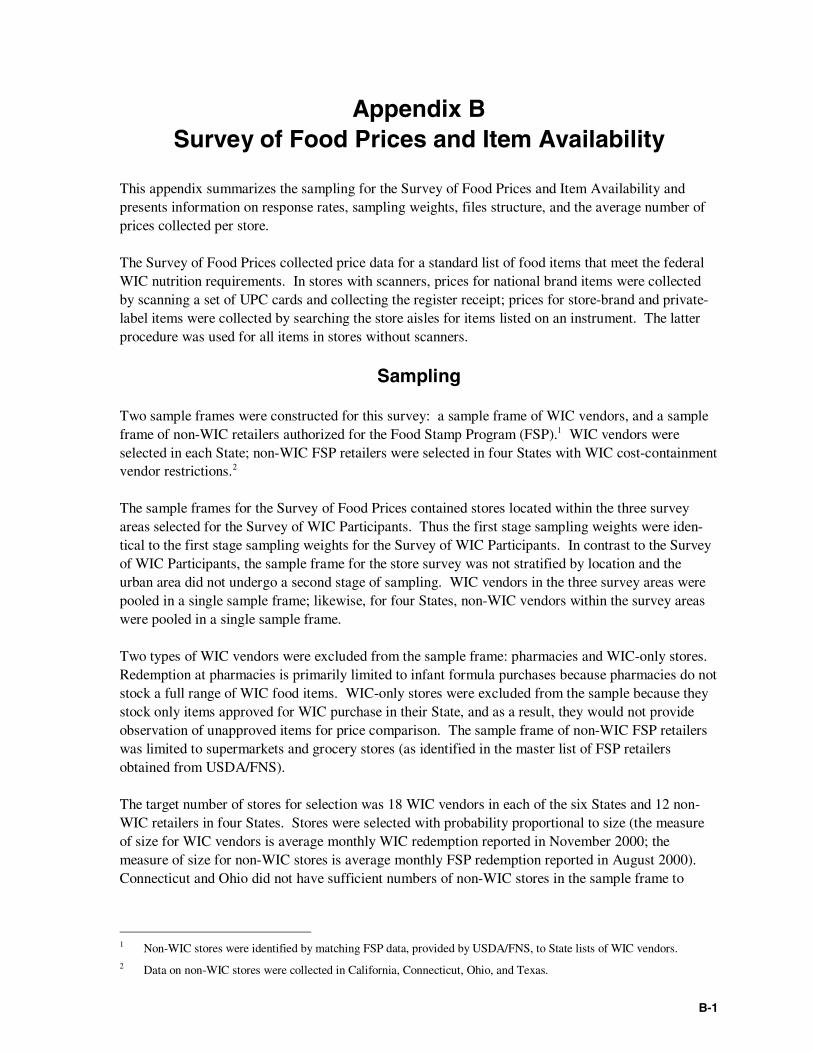
B-1
Appendix BSurvey of Food Prices and Item Availability
This appendix summarizes the sampling for the Survey of Food Prices and Item Availability andpresents information on response rates, sampling weights, files structure, and the average number ofprices collected per store.
The Survey of Food Prices collected price data for a standard list of food items that meet the federalWIC nutrition requirements. In stores with scanners, prices for national brand items were collectedby scanning a set of UPC cards and collecting the register receipt; prices for store-brand and private-label items were collected by searching the store aisles for items listed on an instrument. The latterprocedure was used for all items in stores without scanners.
Sampling
Two sample frames were constructed for this survey: a sample frame of WIC vendors, and a sampleframe of non-WIC retailers authorized for the Food Stamp Program (FSP).1 WIC vendors wereselected in each State; non-WIC FSP retailers were selected in four States with WIC cost-containmentvendor restrictions.2
The sample frames for the Survey of Food Prices contained stores located within the three surveyareas selected for the Survey of WIC Participants. Thus the first stage sampling weights were iden-tical to the first stage sampling weights for the Survey of WIC Participants. In contrast to the Surveyof WIC Participants, the sample frame for the store survey was not stratified by location and theurban area did not undergo a second stage of sampling. WIC vendors in the three survey areas werepooled in a single sample frame; likewise, for four States, non-WIC vendors within the survey areaswere pooled in a single sample frame.
Two types of WIC vendors were excluded from the sample frame: pharmacies and WIC-only stores.Redemption at pharmacies is primarily limited to infant formula purchases because pharmacies do notstock a full range of WIC food items. WIC-only stores were excluded from the sample because theystock only items approved for WIC purchase in their State, and as a result, they would not provideobservation of unapproved items for price comparison. The sample frame of non-WIC FSP retailerswas limited to supermarkets and grocery stores (as identified in the master list of FSP retailersobtained from USDA/FNS).
The target number of stores for selection was 18 WIC vendors in each of the six States and 12 non-WIC retailers in four States. Stores were selected with probability proportional to size (the measureof size for WIC vendors is average monthly WIC redemption reported in November 2000; themeasure of size for non-WIC stores is average monthly FSP redemption reported in August 2000).Connecticut and Ohio did not have sufficient numbers of non-WIC stores in the sample frame to
1 Non-WIC stores were identified by matching FSP data, provided by USDA/FNS, to State lists of WIC vendors.2 Data on non-WIC stores were collected in California, Connecticut, Ohio, and Texas.
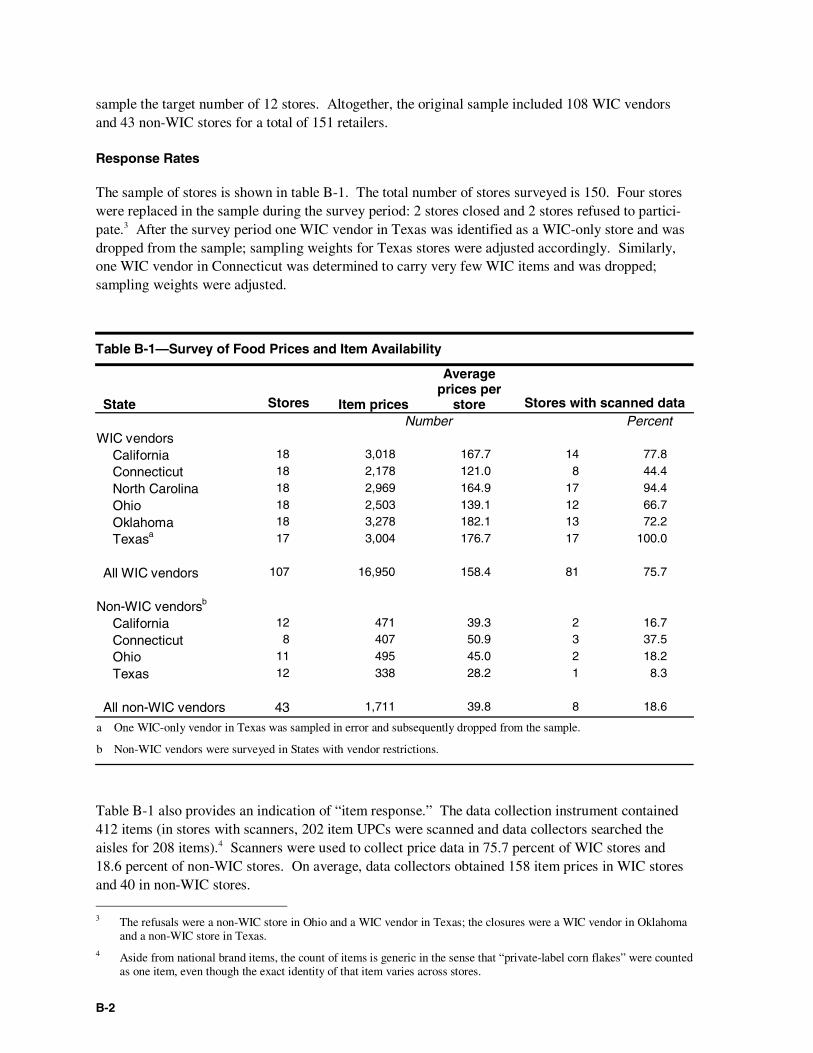
B-2
sample the target number of 12 stores. Altogether, the original sample included 108 WIC vendorsand 43 non-WIC stores for a total of 151 retailers.
Response Rates
The sample of stores is shown in table B-1. The total number of stores surveyed is 150. Four storeswere replaced in the sample during the survey period: 2 stores closed and 2 stores refused to partici-pate.3 After the survey period one WIC vendor in Texas was identified as a WIC-only store and wasdropped from the sample; sampling weights for Texas stores were adjusted accordingly. Similarly,one WIC vendor in Connecticut was determined to carry very few WIC items and was dropped;sampling weights were adjusted.
Table B-1—Survey of Food Prices and Item Availability
State Stores Item prices
Averageprices per
store Stores with scanned dataNumber Percent
WIC vendorsCalifornia 18 3,018 167.7 14 77.8
Connecticut 18 2,178 121.0 8 44.4
North Carolina 18 2,969 164.9 17 94.4
Ohio 18 2,503 139.1 12 66.7
Oklahoma 18 3,278 182.1 13 72.2
Texasa 17 3,004 176.7 17 100.0
All WIC vendors 107 16,950 158.4 81 75.7
Non-WIC vendorsb
California 12 471 39.3 2 16.7
Connecticut 8 407 50.9 3 37.5
Ohio 11 495 45.0 2 18.2
Texas 12 338 28.2 1 8.3
All non-WIC vendors 43 1,711 39.8 8 18.6
a One WIC-only vendor in Texas was sampled in error and subsequently dropped from the sample.
b Non-WIC vendors were surveyed in States with vendor restrictions.
Table B-1 also provides an indication of “item response.” The data collection instrument contained412 items (in stores with scanners, 202 item UPCs were scanned and data collectors searched theaisles for 208 items).4 Scanners were used to collect price data in 75.7 percent of WIC stores and18.6 percent of non-WIC stores. On average, data collectors obtained 158 item prices in WIC storesand 40 in non-WIC stores.
3 The refusals were a non-WIC store in Ohio and a WIC vendor in Texas; the closures were a WIC vendor in Oklahomaand a non-WIC store in Texas.
4 Aside from national brand items, the count of items is generic in the sense that “private-label corn flakes” were countedas one item, even though the exact identity of that item varies across stores.
B-3
Sampling Weights
Two sets of sampling weights were derived: WIC weights and FSP weights. WIC weights apply toall WIC vendors in a State; FSP weights apply to the full sample of WIC and non-WIC vendors in thefour States with vendor restrictions.5
For each store in the survey, the base sampling weight equaled the reciprocal of the probability ofselection, taking into account the two stages of sampling. First-stage weights are identical to the first-stage weights for the Survey of WIC Participants (these weights were derived by the probability ofselecting each of the three geographic survey areas, with the measure of size for selection equal toWIC families). Second-stage WIC weights are equal to the probability of selection within the surveyarea—that is, the ratio of the store's average monthly WIC redemption to the total average monthlyWIC redemption within the survey areas. Second-stage FSP weights were constructed for all FSPstores (WIC and non-WIC), and are equal to the ratio of the store's average monthly FSP redemptionto the total average monthly FSP redemption at grocery stores and supermarkets within the surveyareas.
For both sets of weights, the weights from each stage of sampling were derived with different data:participant data at stage one and store data at stage two. As a result, the base sampling weights didnot sum to total redemption. A further adjustment brought the sum of the base WIC weights intoagreement with total monthly WIC redemption in each State, and the sum of the FSP weights intoagreement with total monthly FSP redemption (at grocery stores and supermarkets) in each State.
Survey Instrument
Two data collection instruments were used—one each for stores with and without scanning systems.A copy of the instrument used in stores without scanners is attached. The other instrument was nearlyidentical; blocks for food items whose UPC codes were being scanned were crossed out to reminddata collectors that these data were being collected elsewhere.
5 The two sets of weights were to be used independently for different analyses. The marginal impact of food-itemrestrictions on food package costs was analyzed using price data from WIC vendors. The marginal impact of vendorrestrictions on food package costs was going to be analyzed using the pooled sample of WIC and non-WIC stores, butdiscovery that State policies had not excluded any stores removed the need for the analysis.

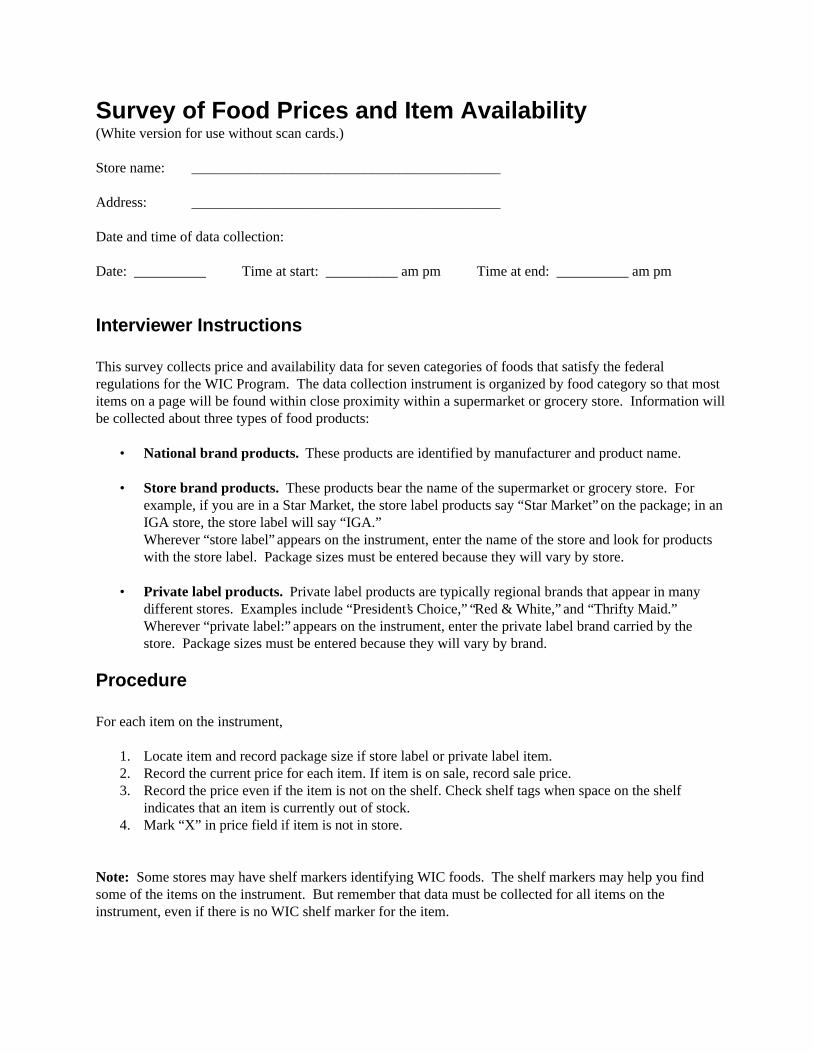
Survey of Food Prices and Item Availability(White version for use without scan cards.)
Store name: ___________________________________________
Address: ___________________________________________
Date and time of data collection:
Date: __________ Time at start: __________ am pm Time at end: __________ am pm
Interviewer Instructions
This survey collects price and availability data for seven categories of foods that satisfy the federalregulations for the WIC Program. The data collection instrument is organized by food category so that mostitems on a page will be found within close proximity within a supermarket or grocery store. Information willbe collected about three types of food products:
• National brand products. These products are identified by manufacturer and product name.
• Store brand products. These products bear the name of the supermarket or grocery store. Forexample, if you are in a Star Market, the store label products say “Star Market” on the package; in anIGA store, the store label will say “IGA.” Wherever “store label” appears on the instrument, enter the name of the store and look for productswith the store label. Package sizes must be entered because they will vary by store.
• Private label products. Private label products are typically regional brands that appear in manydifferent stores. Examples include “President’s Choice,” “Red & White,” and “Thrifty Maid.” Wherever “private label:” appears on the instrument, enter the private label brand carried by thestore. Package sizes must be entered because they will vary by brand.
Procedure
For each item on the instrument,
1. Locate item and record package size if store label or private label item.2. Record the current price for each item. If item is on sale, record sale price.3. Record the price even if the item is not on the shelf. Check shelf tags when space on the shelf
indicates that an item is currently out of stock.4. Mark “X” in price field if item is not in store.
Note: Some stores may have shelf markers identifying WIC foods. The shelf markers may help you findsome of the items on the instrument. But remember that data must be collected for all items on theinstrument, even if there is no WIC shelf marker for the item.
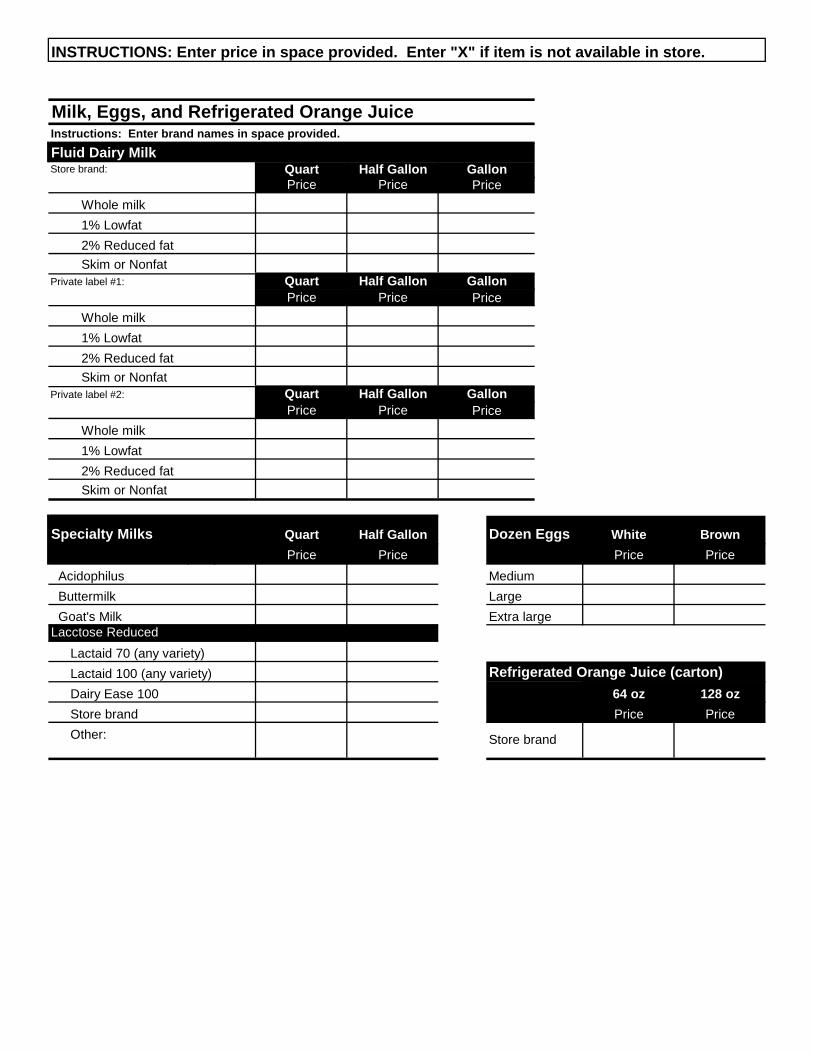
Milk, Eggs, and Refrigerated Orange JuiceInstructions: Enter brand names in space provided.
Fluid Dairy MilkStore brand: Quart Half Gallon
Price PriceWhole milk1% Lowfat2% Reduced fatSkim or Nonfat
Private label #1: Quart Half GallonPrice Price
Whole milk1% Lowfat2% Reduced fatSkim or Nonfat
Private label #2: Quart Half GallonPrice Price
Whole milk1% Lowfat2% Reduced fatSkim or Nonfat
Specialty Milks Quart Half Gallon Dozen Eggs White Brown
Price Price Price Price
Acidophilus Medium Buttermilk Large Goat's Milk Extra largeLacctose Reduced
Lactaid 70 (any variety)Lactaid 100 (any variety) Refrigerated Orange Juice (carton)Dairy Ease 100 64 oz 128 oz
Store brand Price PriceOther:
INSTRUCTIONS: Enter price in space provided. Enter "X" if item is not available in store.
GallonPrice
Gallon
Store brand
Price
GallonPrice
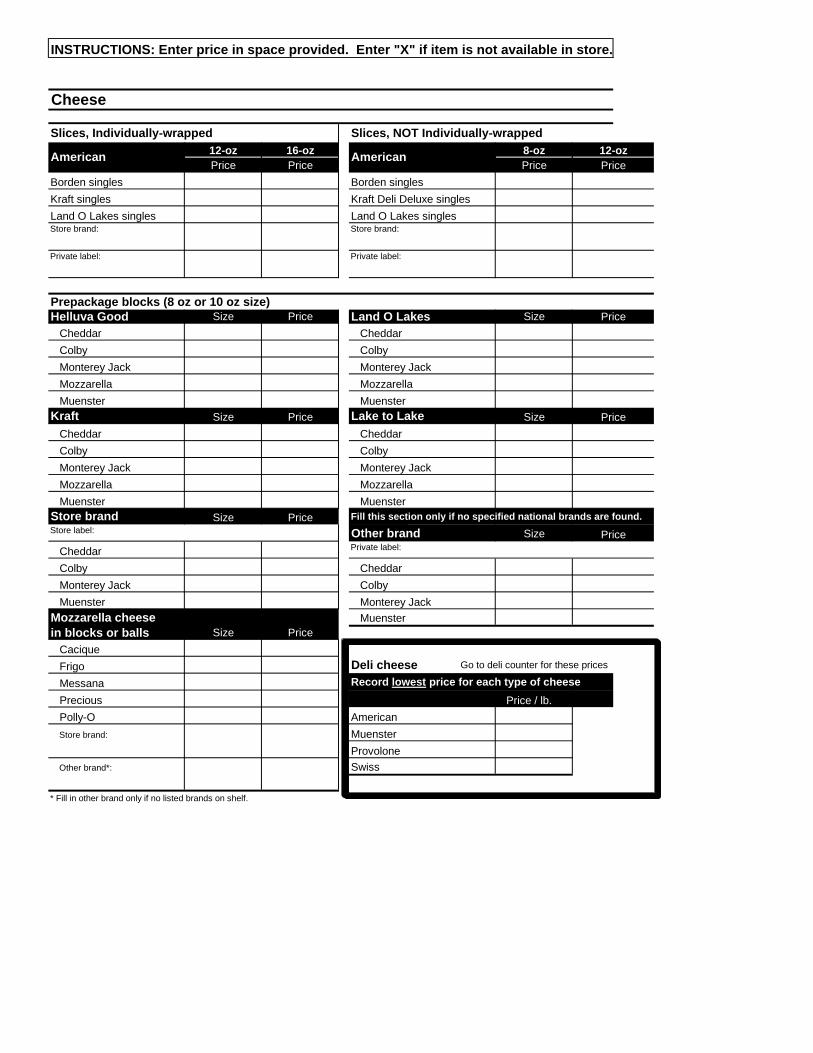
Cheese
Slices, Individually-wrapped Slices, NOT Individually-wrapped12-oz 16-oz 8-ozPrice Price Price
Borden singles Borden singlesKraft singles Kraft Deli Deluxe singlesLand O Lakes singles Land O Lakes singlesStore brand: Store brand:
Private label: Private label:
Prepackage blocks (8 oz or 10 oz size)Helluva Good Size Price Land O Lakes Size
Cheddar CheddarColby ColbyMonterey Jack Monterey JackMozzarella Mozzarella Muenster Muenster
Kraft Size Price Lake to Lake SizeCheddar CheddarColby ColbyMonterey Jack Monterey JackMozzarella Mozzarella Muenster Muenster
Store brand Size Price Fill this section only if no specified national brands are found.Store label: Other brand Size
Cheddar Private label:
Colby CheddarMonterey Jack ColbyMuenster Monterey Jack
Mozzarella cheese Muensterin blocks or balls Size Price
CaciqueFrigo Deli cheese Go to deli counter for these prices
Messana Record lowest price for each type of cheese
PreciousPolly-O AmericanStore brand: Muenster
ProvoloneOther brand*: Swiss
* Fill in other brand only if no listed brands on shelf.
INSTRUCTIONS: Enter price in space provided. Enter "X" if item is not available in store.
American American
Price / lb.
12-ozPrice
Price
Price
Price
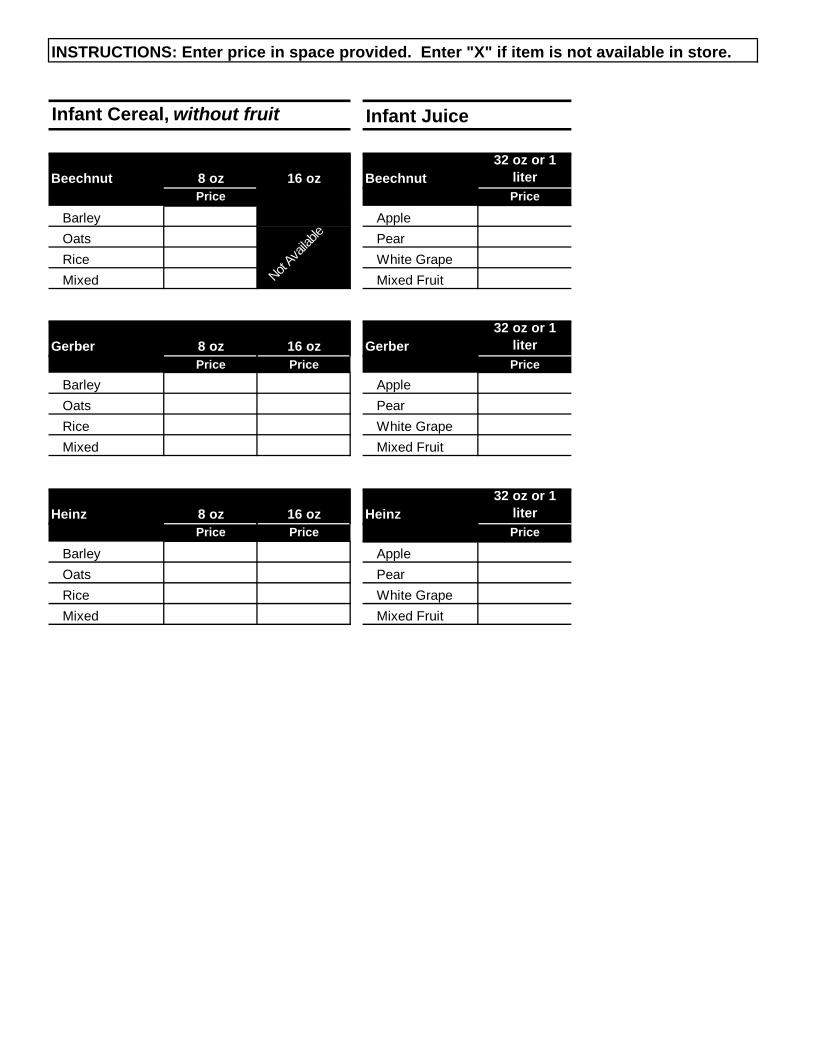
Infant Cereal, without fruit Infant Juice
Beechnut 8 oz 16 oz Beechnut32 oz or 1
literPrice Price
Barley AppleOats PearRice White GrapeMixed Mixed Fruit
Gerber 8 oz 16 oz Gerber32 oz or 1
literPrice Price Price
Barley AppleOats PearRice White GrapeMixed Mixed Fruit
Heinz 8 oz 16 oz Heinz32 oz or 1
literPrice Price Price
Barley AppleOats PearRice White GrapeMixed Mixed Fruit
Not
Availab
le
INSTRUCTIONS: Enter price in space provided. Enter "X" if item is not available in store.
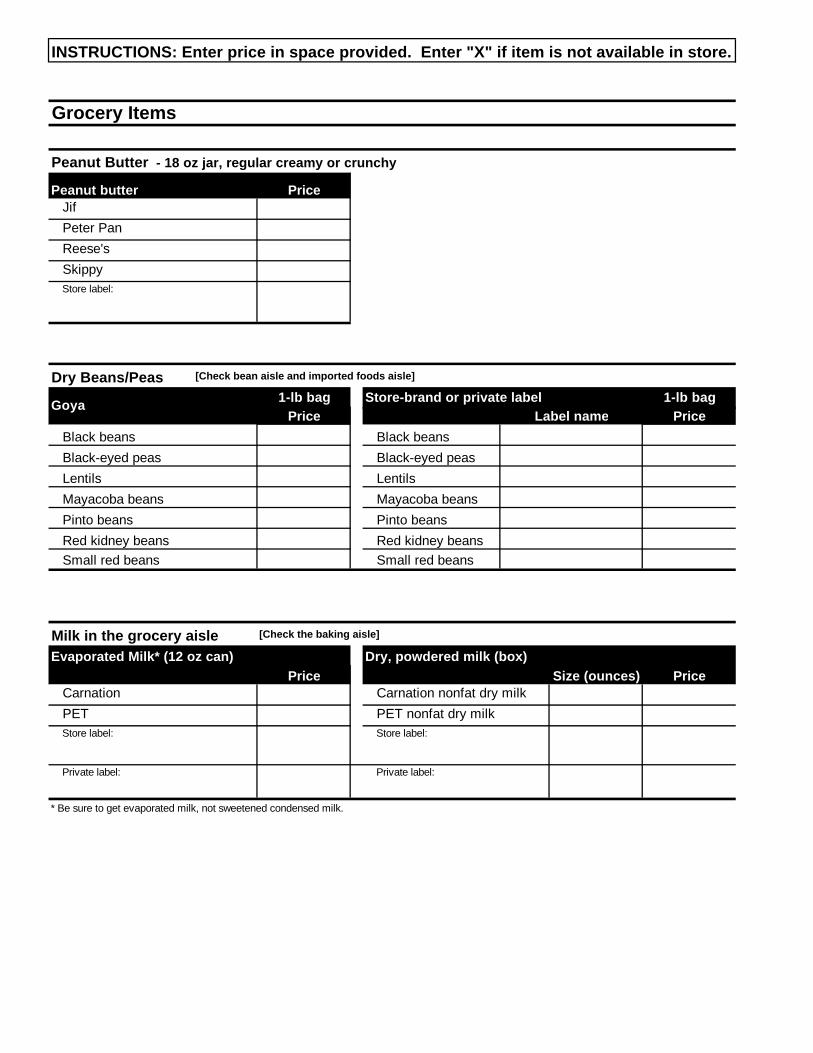
Grocery Items
Peanut Butter - 18 oz jar, regular creamy or crunchy
PriceJifPeter PanReese'sSkippy Store label:
Dry Beans/Peas [Check bean aisle and imported foods aisle]
1-lb bag Store-brand or private label 1-lb bagPrice Price
Black beans Black beansBlack-eyed peas Black-eyed peasLentils Lentils Mayacoba beans Mayacoba beansPinto beans Pinto beansRed kidney beans Red kidney beansSmall red beans Small red beans
Milk in the grocery aisle [Check the baking aisle]
Dry, powdered milk (box)Price Size (ounces) Price
Carnation Carnation nonfat dry milkPET PET nonfat dry milkStore label: Store label:
Private label: Private label:
* Be sure to get evaporated milk, not sweetened condensed milk.
INSTRUCTIONS: Enter price in space provided. Enter "X" if item is not available in store.
Peanut butter
Evaporated Milk* (12 oz can)
Label nameGoya
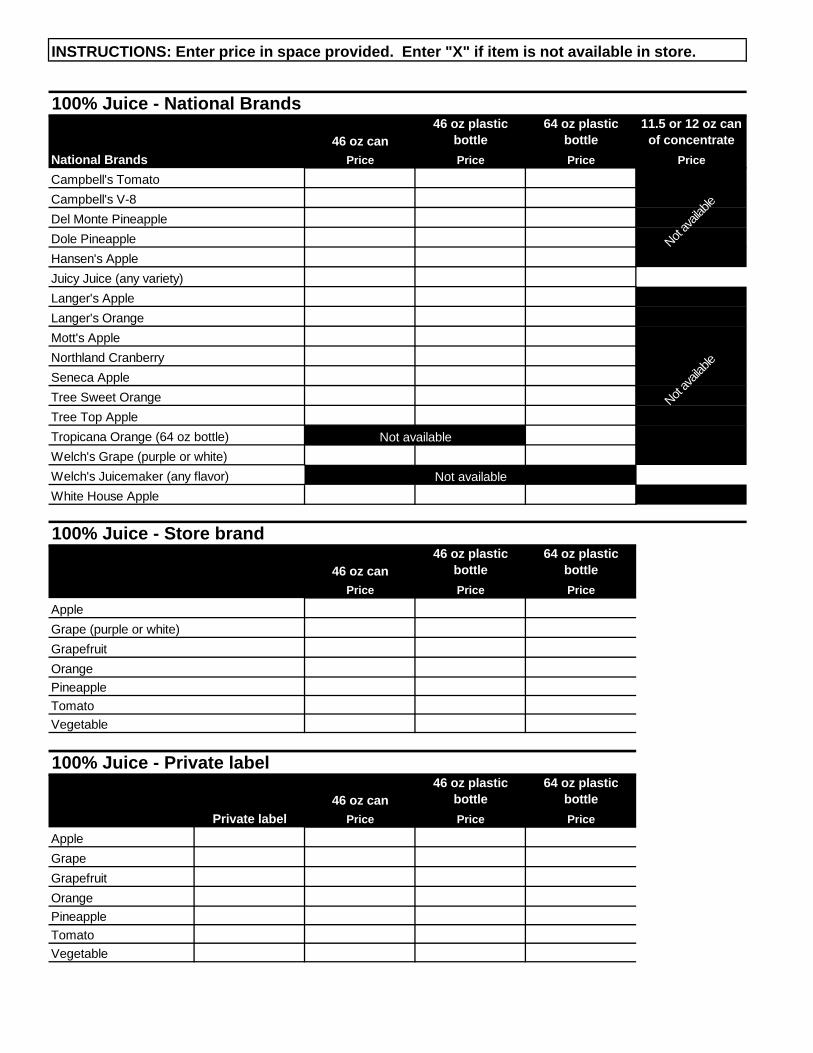
100% Juice - National Brands
46 oz can46 oz plastic
bottle64 oz plastic
bottle11.5 or 12 oz can
of concentrate
National Brands Price Price Price Price
Campbell's TomatoCampbell's V-8Del Monte PineappleDole PineappleHansen's AppleJuicy Juice (any variety)Langer's AppleLanger's OrangeMott's AppleNorthland CranberrySeneca AppleTree Sweet OrangeTree Top AppleTropicana Orange (64 oz bottle)Welch's Grape (purple or white)Welch's Juicemaker (any flavor)White House Apple
100% Juice - Store brand
46 oz can46 oz plastic
bottle64 oz plastic
bottle
Price Price Price
AppleGrape (purple or white)GrapefruitOrangePineappleTomatoVegetable
100% Juice - Private label
46 oz can46 oz plastic
bottle64 oz plastic
bottle
Private label Price Price Price
AppleGrapeGrapefruitOrangePineappleTomatoVegetable
Not av
ailable
Not available
INSTRUCTIONS: Enter price in space provided. Enter "X" if item is not available in store.
Not av
ailable
Not available
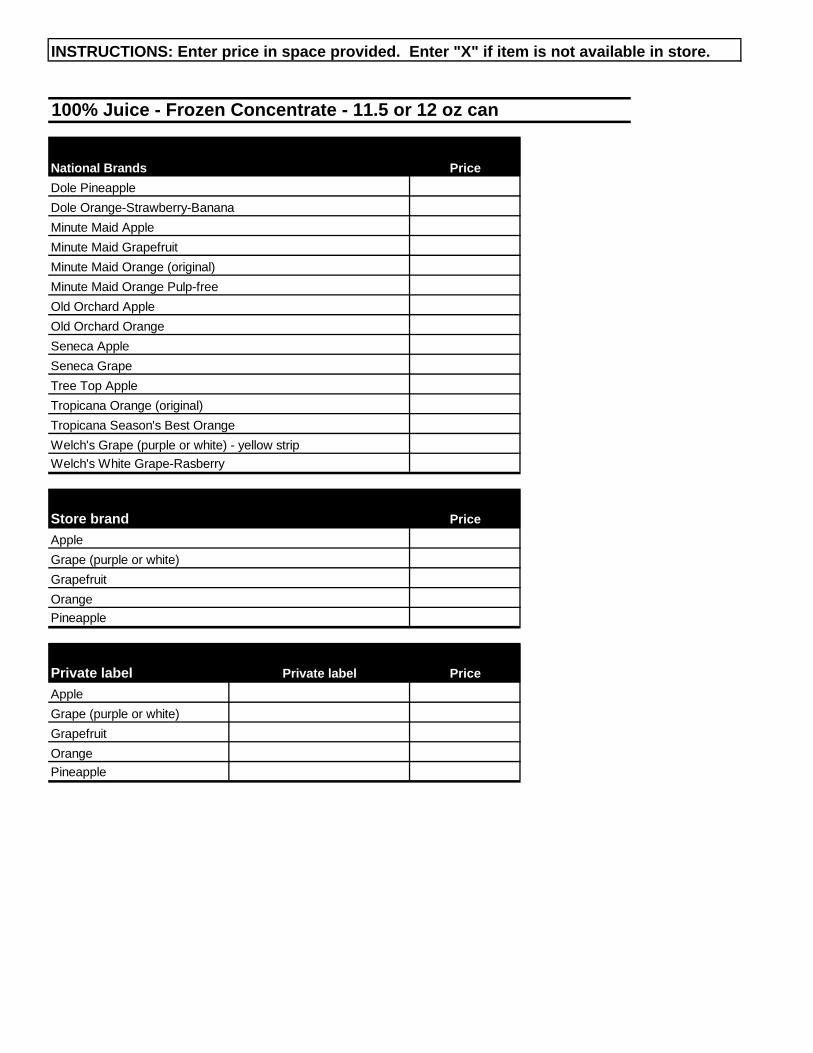
100% Juice - Frozen Concentrate - 11.5 or 12 oz can
National Brands Price
Dole PineappleDole Orange-Strawberry-BananaMinute Maid AppleMinute Maid GrapefruitMinute Maid Orange (original)Minute Maid Orange Pulp-freeOld Orchard AppleOld Orchard OrangeSeneca AppleSeneca GrapeTree Top AppleTropicana Orange (original)Tropicana Season's Best OrangeWelch's Grape (purple or white) - yellow stripWelch's White Grape-Rasberry
Store brand Price
AppleGrape (purple or white)GrapefruitOrangePineapple
Private label Private label Price
AppleGrape (purple or white)GrapefruitOrangePineapple
INSTRUCTIONS: Enter price in space provided. Enter "X" if item is not available in store.
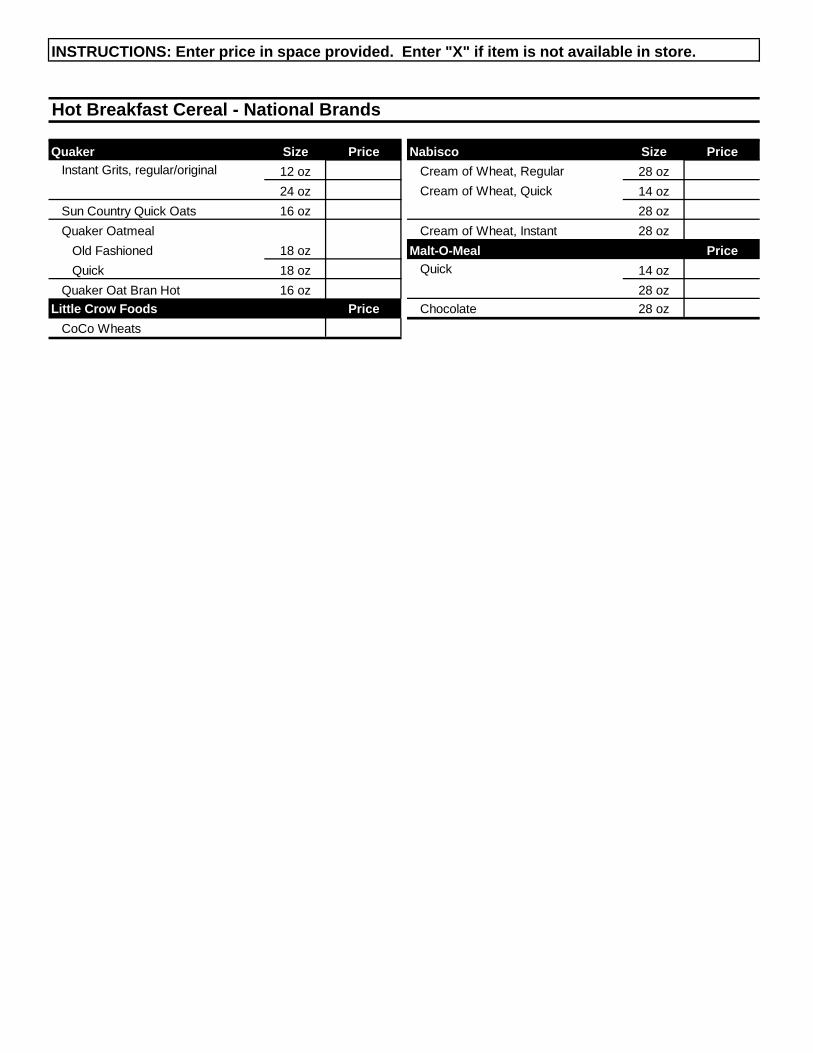
Hot Breakfast Cereal - National Brands
Quaker Size Price Nabisco Size PriceInstant Grits, regular/original 12 oz Cream of Wheat, Regular 28 oz
24 oz Cream of Wheat, Quick 14 ozSun Country Quick Oats 16 oz 28 ozQuaker Oatmeal Cream of Wheat, Instant 28 oz
Old Fashioned 18 oz Malt-O-Meal Price
Quick 18 oz Quick 14 ozQuaker Oat Bran Hot 16 oz 28 oz
Little Crow Foods Price Chocolate 28 ozCoCo Wheats
INSTRUCTIONS: Enter price in space provided. Enter "X" if item is not available in store.
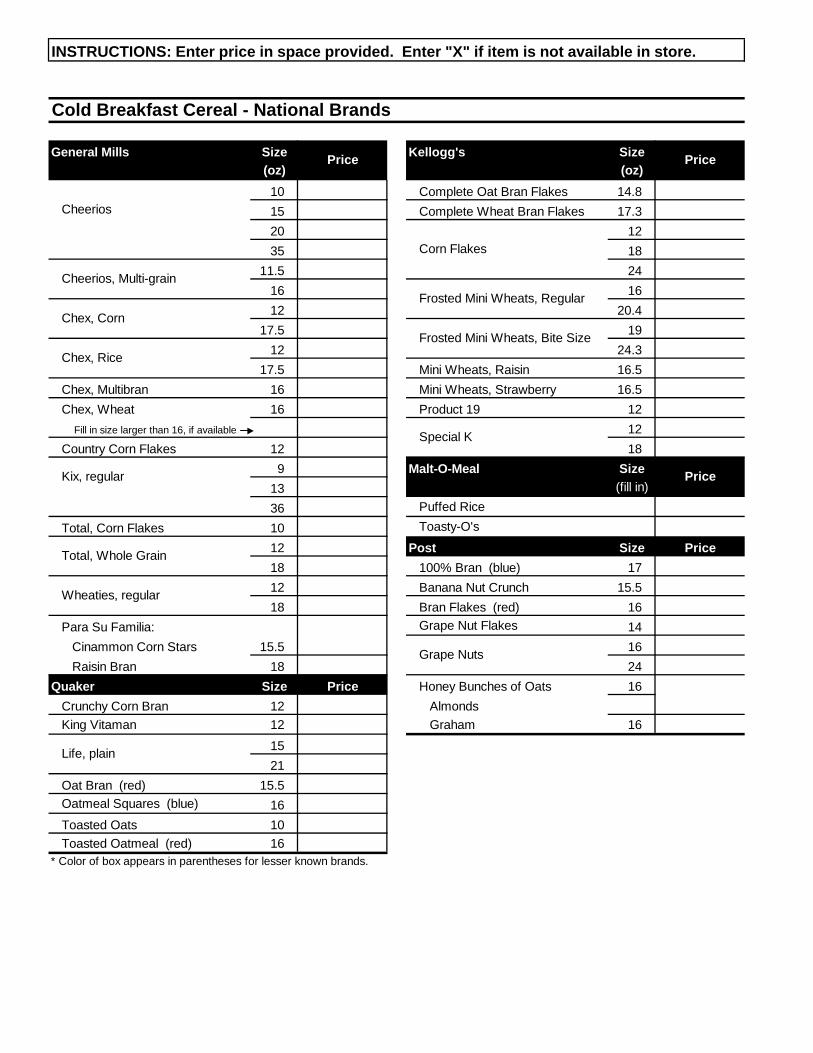
Cold Breakfast Cereal - National Brands
General Mills Size Kellogg's Size(oz) (oz)
10 Complete Oat Bran Flakes 14.8 15 Complete Wheat Bran Flakes 17.3 20 12 35 18
11.5 24 16 16 12 20.4
17.5 19 12 24.3
17.5 Mini Wheats, Raisin 16.5 Chex, Multibran 16 Mini Wheats, Strawberry 16.5 Chex, Wheat 16 Product 19 12
Fill in size larger than 16, if available 12 Country Corn Flakes 12 18
9 Malt-O-Meal Size
13 (fill in)
36 Puffed Rice
Total, Corn Flakes 10 Toasty-O's
12 Post Size Price
18 100% Bran (blue) 17 12 Banana Nut Crunch 15.5 18 Bran Flakes (red) 16
Para Su Familia: Grape Nut Flakes 14 Cinammon Corn Stars 15.5 16 Raisin Bran 18 24
Quaker Size Price Honey Bunches of Oats 16 Crunchy Corn Bran 12 AlmondsKing Vitaman 12 Graham 16
15 21
Oat Bran (red) 15.5 Oatmeal Squares (blue) 16 Toasted Oats 10 Toasted Oatmeal (red) 16
* Color of box appears in parentheses for lesser known brands.
Price Price
Price
INSTRUCTIONS: Enter price in space provided. Enter "X" if item is not available in store.
Chex, Corn
Kix, regular
Chex, Rice
Grape Nuts
Life, plain
Special K
Cheerios, Multi-grain
Corn Flakes
Frosted Mini Wheats, Bite Size
Frosted Mini Wheats, Regular
Cheerios
Wheaties, regular
Total, Whole Grain
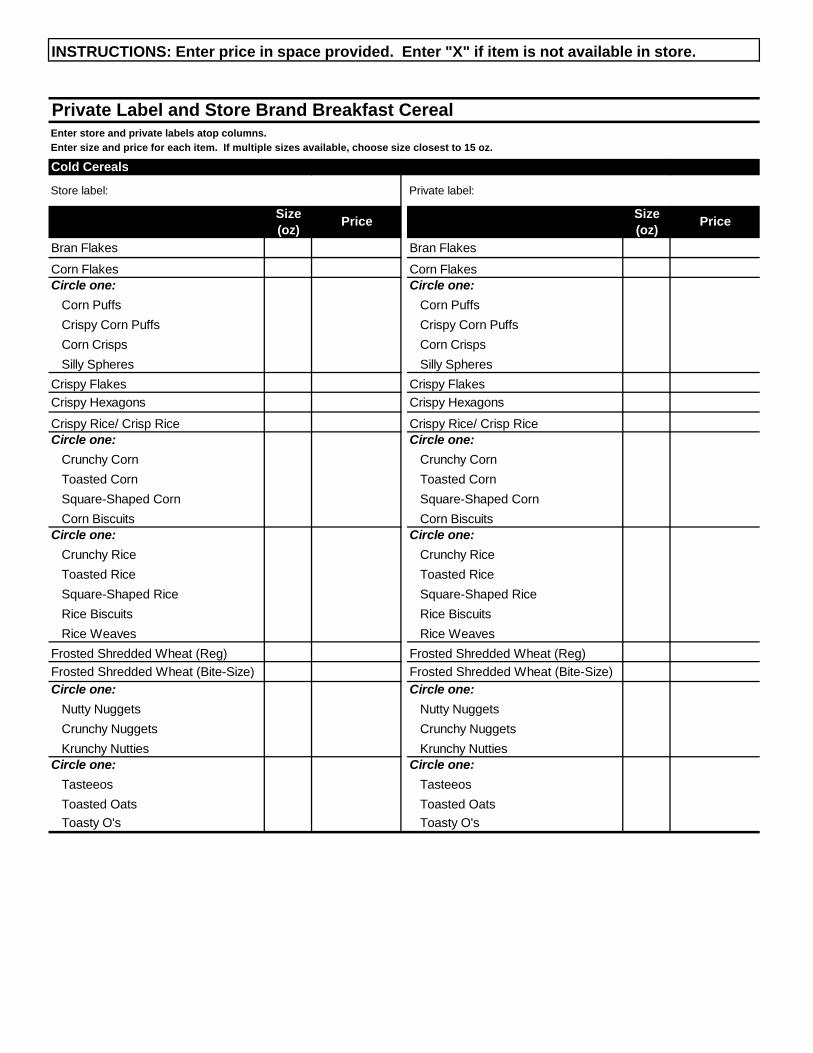
Private Label and Store Brand Breakfast CerealEnter store and private labels atop columns. Enter size and price for each item. If multiple sizes available, choose size closest to 15 oz.
Cold Cereals
Store label: Private label:
Size Size(oz) (oz)
Bran Flakes Bran Flakes
Corn Flakes Corn FlakesCircle one: Circle one:
Corn Puffs Corn PuffsCrispy Corn Puffs Crispy Corn PuffsCorn Crisps Corn CrispsSilly Spheres Silly Spheres
Crispy Flakes Crispy FlakesCrispy Hexagons Crispy Hexagons
Crispy Rice/ Crisp Rice Crispy Rice/ Crisp RiceCircle one: Circle one:
Crunchy Corn Crunchy CornToasted Corn Toasted CornSquare-Shaped Corn Square-Shaped CornCorn Biscuits Corn Biscuits
Circle one: Circle one:Crunchy Rice Crunchy RiceToasted Rice Toasted RiceSquare-Shaped Rice Square-Shaped RiceRice Biscuits Rice BiscuitsRice Weaves Rice Weaves
Frosted Shredded Wheat (Reg) Frosted Shredded Wheat (Reg)Frosted Shredded Wheat (Bite-Size) Frosted Shredded Wheat (Bite-Size)Circle one: Circle one:
Nutty Nuggets Nutty NuggetsCrunchy Nuggets Crunchy NuggetsKrunchy Nutties Krunchy Nutties
Circle one: Circle one:Tasteeos TasteeosToasted Oats Toasted OatsToasty O's Toasty O's
INSTRUCTIONS: Enter price in space provided. Enter "X" if item is not available in store.
Price Price
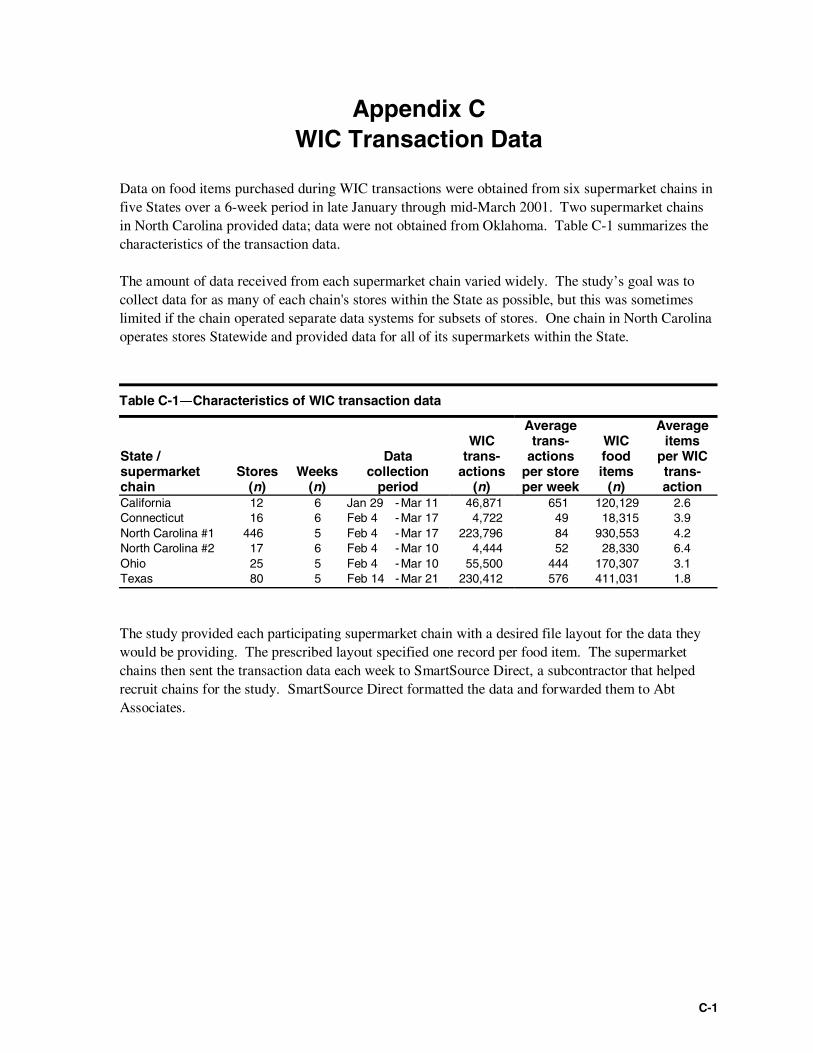
C-1
Appendix CWIC Transaction Data
Data on food items purchased during WIC transactions were obtained from six supermarket chains infive States over a 6-week period in late January through mid-March 2001. Two supermarket chainsin North Carolina provided data; data were not obtained from Oklahoma. Table C-1 summarizes thecharacteristics of the transaction data.
The amount of data received from each supermarket chain varied widely. The study’s goal was tocollect data for as many of each chain's stores within the State as possible, but this was sometimeslimited if the chain operated separate data systems for subsets of stores. One chain in North Carolinaoperates stores Statewide and provided data for all of its supermarkets within the State.
Table C-1―Characteristics of WIC transaction data
State /supermarketchain
Stores(n)
Weeks(n)
Datacollection
period
WICtrans-
actions(n)
Averagetrans-
actionsper storeper week
WICfooditems
(n)
Averageitems
per WICtrans-action
California 12 6 Jan 29 - Mar 11 46,871 651 120,129 2.6Connecticut 16 6 Feb 4 - Mar 17 4,722 49 18,315 3.9North Carolina #1 446 5 Feb 4 - Mar 17 223,796 84 930,553 4.2North Carolina #2 17 6 Feb 4 - Mar 10 4,444 52 28,330 6.4Ohio 25 5 Feb 4 - Mar 10 55,500 444 170,307 3.1Texas 80 5 Feb 14 - Mar 21 230,412 576 411,031 1.8
The study provided each participating supermarket chain with a desired file layout for the data theywould be providing. The prescribed layout specified one record per food item. The supermarketchains then sent the transaction data each week to SmartSource Direct, a subcontractor that helpedrecruit chains for the study. SmartSource Direct formatted the data and forwarded them to AbtAssociates.

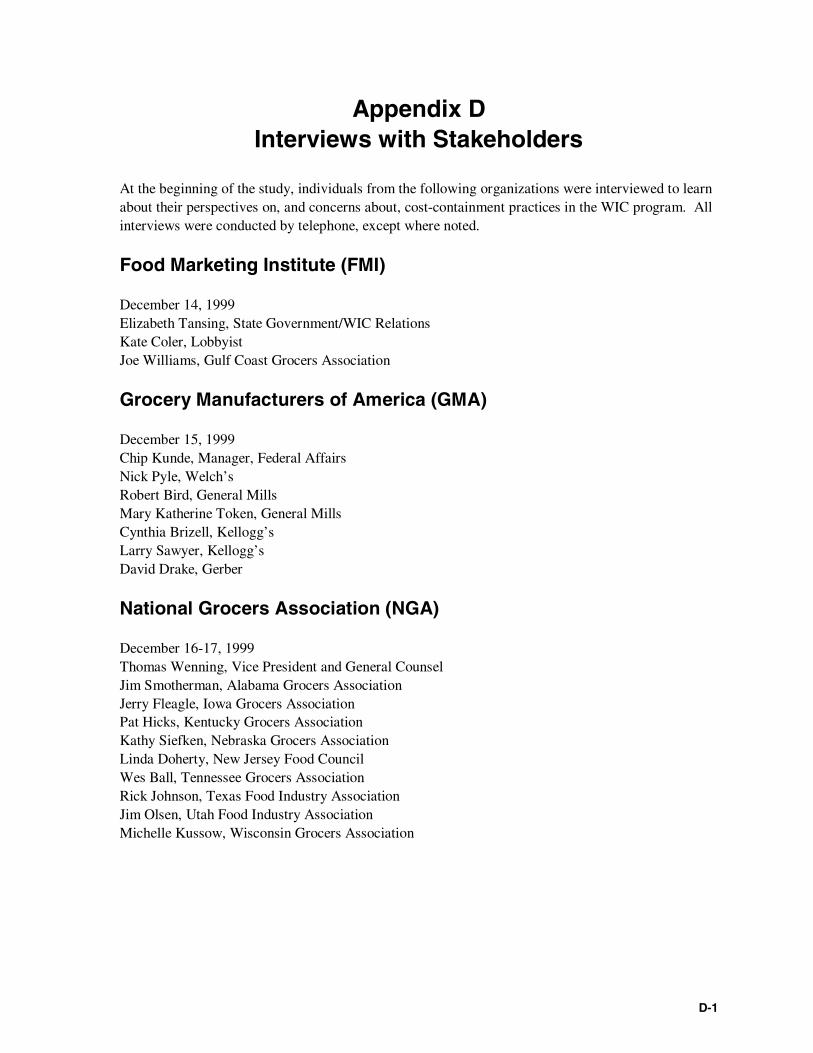
D-1
Appendix DInterviews with Stakeholders
At the beginning of the study, individuals from the following organizations were interviewed to learnabout their perspectives on, and concerns about, cost-containment practices in the WIC program. Allinterviews were conducted by telephone, except where noted.
Food Marketing Institute (FMI)
December 14, 1999Elizabeth Tansing, State Government/WIC RelationsKate Coler, LobbyistJoe Williams, Gulf Coast Grocers Association
Grocery Manufacturers of America (GMA)
December 15, 1999Chip Kunde, Manager, Federal AffairsNick Pyle, Welch’sRobert Bird, General MillsMary Katherine Token, General MillsCynthia Brizell, Kellogg’sLarry Sawyer, Kellogg’sDavid Drake, Gerber
National Grocers Association (NGA)
December 16-17, 1999Thomas Wenning, Vice President and General CounselJim Smotherman, Alabama Grocers AssociationJerry Fleagle, Iowa Grocers AssociationPat Hicks, Kentucky Grocers AssociationKathy Siefken, Nebraska Grocers AssociationLinda Doherty, New Jersey Food CouncilWes Ball, Tennessee Grocers AssociationRick Johnson, Texas Food Industry AssociationJim Olsen, Utah Food Industry AssociationMichelle Kussow, Wisconsin Grocers Association
D-2
National WIC Association (NWA)1
November 30, 1999Doug Greenaway, Executive DirectorDon Johnson, President; WIC Director, UtahBill Eden, Vice President; WIC Director, ColoradoPeggy Trouba, Food Cost Management Committee; WIC Director, NebraskaTerry Bryce, WIC Director, OklahomaPhil Wagner, Vendor Management/Rebates, Colorado
Private Label Manufacturers Association (PLMA)
December 1, 1999Brian Sharoff, PresidentKen Clarfield, Director, Industry RelationsTim Simmons, Vice President, Public Relations
USDA, Food and Nutrition Service
(All USDA staff are from Supplemental Food Programs unless otherwise noted)
National Headquarters
November 24, 1999Dawn Aldridge, Office of Analysis and EvaluationChris CaseyLinda Clark
Mid-Atlantic Regional Office
November 12, 1999Roberta HodsdonSylvia RyanDelores StewartDiana Torrice
Midwest Regional Office
November 15, 1999Liza CowdenCarla Mcgill-YearbySandra SlaytonSteve Vrabel
1 Formerly the National Association of WIC Directors (NAWD).
D-3
Mountain-Plains Regional Office
November 22, 1999Ralph AnzurJean LiekhusJeanette MontanoKaren Painter-Jacques
Northeast Regional Office
In-person interviews on November 10, 1999Robert MulveyEric NormanCandice Stoiber
Southeast Regional Office
November 8, 1999Lorine BizellePeggy FoutsLarilyn Pittman
Southwest Regional Office
November 10, 1999Henry BarberBob GraybillRon GwinnSusan Mayer
Western Regional Office
November 10, 1999Mike DrewLisa MedeirosRon Rizzo

E-1
Appendix EState Cost-Containment Practices
State WIC agencies use several different approaches to control the costs of WIC food packages.These include:
• Vendor selection practices—Reducing prices of WIC foods obtained by participants byselecting lower priced stores for vendor authorization.
• Item selection practices—Reducing the unit price by restricting the brands, types, orpackage sizes allowed for purchase with WIC food instruments.
• Manufacturer rebates—Entering into agreements with specific manufacturers tonegotiate a lower unit price for certain food items.
This appendix presents information on the general prevalence of cost-containment practices amongall State WIC agencies.1 The practices covered affect vendor selection, food-item selection, andmanufacturer rebates for foods other than infant formula. The information provides a background tothe indepth discussion of cost-containment practices in the six States selected for the study. Thematerial in this appendix previously appeared in the evaluation’s interim report.2 This informationwas used in selecting the six States to represent the variety of cost-containment practices.
The information in this appendix came primarily from documents collected in Fall 1999 from StateWIC agencies (including State WIC-approved food lists and State vendor materials) and from discus-sions with national and regional WIC officials. Two national databases created and maintained by theUSDA Food and Nutrition Service were used as well: the Store Tracking and Redemption Subsystem(STARS) database, to obtain counts of retailers authorized to participate in the Food Stamp Program(FSP) by State and store type classification (for example, supermarkets and grocery stores); and theIntegrity Profile (TIP) database, to obtain counts of WIC-authorized vendors by State. Specific prac-tices and individual States may have changed since 1999, but the overall patterns remain informative.
Vendor Selection Practices
As stated in FNS regulations, the following principle governs the authorization of WIC vendors:
The State agency shall authorize an appropriate number and distribution of foodvendors in order to assure adequate participant convenience and access and to assurethat State or local officials can effectively manage review of authorized food vendorsin their jurisdiction.3
1 The appendix includes information for the 50 States and the District of Columbia. State WIC agencies representingIndian tribal organizations; Puerto Rico and the U.S. territories are not included.
2 Kirlin, John A. and Nancy Cole. Assessment of WIC Cost-Containment Practices: An Interim Report to Congress. AbtAssociates, Inc. for U.S. Department of Agriculture, Economic Research Service, under contract number 53-K06-9-11,February 2001.
3 7 CFR 246.12(e)(2).
E-2
Thus, States must balance the goals of adequate participant access and adequate oversight. The regu-lations recognize this tradeoff by allowing, but not mandating, the States to establish criteria to limitthe number of vendors.
State WIC agencies restrict the number of authorized vendors in two ways: by limiting the number,and by establishing selection criteria that applicant stores must meet or exceed to be authorized.Vendor limits are defined either in terms of a maximum number of those authorized (for the wholeState or portions of it) or as a minimum ratio of WIC participants to vendors.4 Selection criteria mayrequire that vendors maintain a minimum inventory of WIC foods, charge competitive prices, beauthorized for FSP participation, have WIC sales exceeding a certain dollar amount or certainpercentage of total vendor sales, or have no history of WIC or FSP violations.5 As of October 1,2002, all States were required to use criteria for competitive prices, minimum variety and quantity ofsupplemental foods, and business integrity.6
Competitive Pricing
The principal vendor selection criterion used for cost containment is a competitive pricing standard toexclude high-priced vendors. States with this criterion require that vendors charge a “fair and compe-titive price.” States differ in defining this price and in whether they use a competitive pricingcriterion at application or in evaluating redemptions.
Table E-1 presents information on the use of competitive pricing standards in 1999, based on vendorapplication materials and vendor handbooks collected for this study from all States using retail fooddelivery systems. For the purpose of the study, the contractor identified whether competitive pricingwas used at application and, if so, the relative stringency of the criterion.
Table E-1 shows that almost all States with retail delivery systems used competitive pricing at appli-cation. The relative stringency of the competitive pricing criterion is shown in the classification ofStates as “highly restrictive” or “less restrictive” in the table (last column). States requiring thatapplicants’ prices be lower than 110 percent of existing vendors’ average prices were classified ashaving a “highly restrictive” criterion; those with a threshold greater than 110 percent were classifiedas having a “less restrictive” criterion. Twenty of the 45 States with competitive pricing used the110-percent, highly restrictive threshold; they are shown in the last column with an “H.” States usinga less restrictive threshold (and those for whom the threshold could not be determined) are shownwith an “L.”
Competitive pricing policies identify States that seek to contain WIC food costs by restricting WICvendor selection based on price. It is apparent from table E-1, however, that the precise details ofcompetitive pricing criteria could not be discerned for some States (those for which “NS%” is
4 According to 1999 vendor application materials collected from States for this study, 23 States set a limit on the numberof authorized WIC vendors. Ten States limited the ratio of participants to vendors, 1 State limited the absolute numberof authorized vendors in the State, and 1 State used both methods. Eleven States limited the number of vendors but didnot specify the mechanism in their vendor application materials.
5 Other selection criteria, used less frequently, include minimum specifications for days and hours of operation, store sizeor total food sales volume, and distance from the nearest authorized WIC vendor.
6 7 CFR 246.12(g)(3).
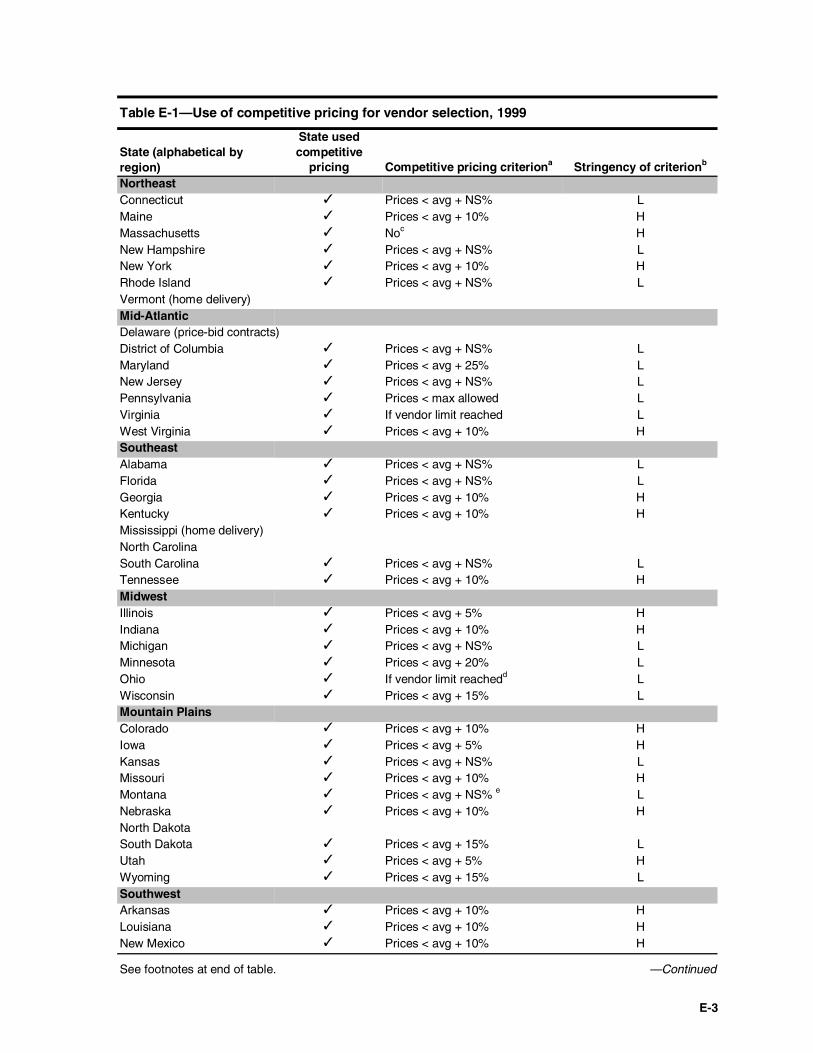
E-3
Table E-1—Use of competitive pricing for vendor selection, 1999
State (alphabetical byregion)
State usedcompetitive
pricing Competitive pricing criteriona Stringency of criterionb
NortheastConnecticut ✓ Prices < avg + NS% LMaine ✓ Prices < avg + 10% HMassachusetts ✓ Noc HNew Hampshire ✓ Prices < avg + NS% LNew York ✓ Prices < avg + 10% HRhode Island ✓ Prices < avg + NS% LVermont (home delivery)Mid-AtlanticDelaware (price-bid contracts)District of Columbia ✓ Prices < avg + NS% LMaryland ✓ Prices < avg + 25% LNew Jersey ✓ Prices < avg + NS% LPennsylvania ✓ Prices < max allowed LVirginia ✓ If vendor limit reached LWest Virginia ✓ Prices < avg + 10% HSoutheastAlabama ✓ Prices < avg + NS% LFlorida ✓ Prices < avg + NS% LGeorgia ✓ Prices < avg + 10% HKentucky ✓ Prices < avg + 10% HMississippi (home delivery)North CarolinaSouth Carolina ✓ Prices < avg + NS% LTennessee ✓ Prices < avg + 10% HMidwestIllinois ✓ Prices < avg + 5% HIndiana ✓ Prices < avg + 10% HMichigan ✓ Prices < avg + NS% LMinnesota ✓ Prices < avg + 20% LOhio ✓ If vendor limit reachedd LWisconsin ✓ Prices < avg + 15% LMountain PlainsColorado ✓ Prices < avg + 10% HIowa ✓ Prices < avg + 5% HKansas ✓ Prices < avg + NS% LMissouri ✓ Prices < avg + 10% HMontana ✓ Prices < avg + NS% e LNebraska ✓ Prices < avg + 10% HNorth DakotaSouth Dakota ✓ Prices < avg + 15% LUtah ✓ Prices < avg + 5% HWyoming ✓ Prices < avg + 15% LSouthwestArkansas ✓ Prices < avg + 10% HLouisiana ✓ Prices < avg + 10% HNew Mexico ✓ Prices < avg + 10% H
See footnotes at end of table. —Continued
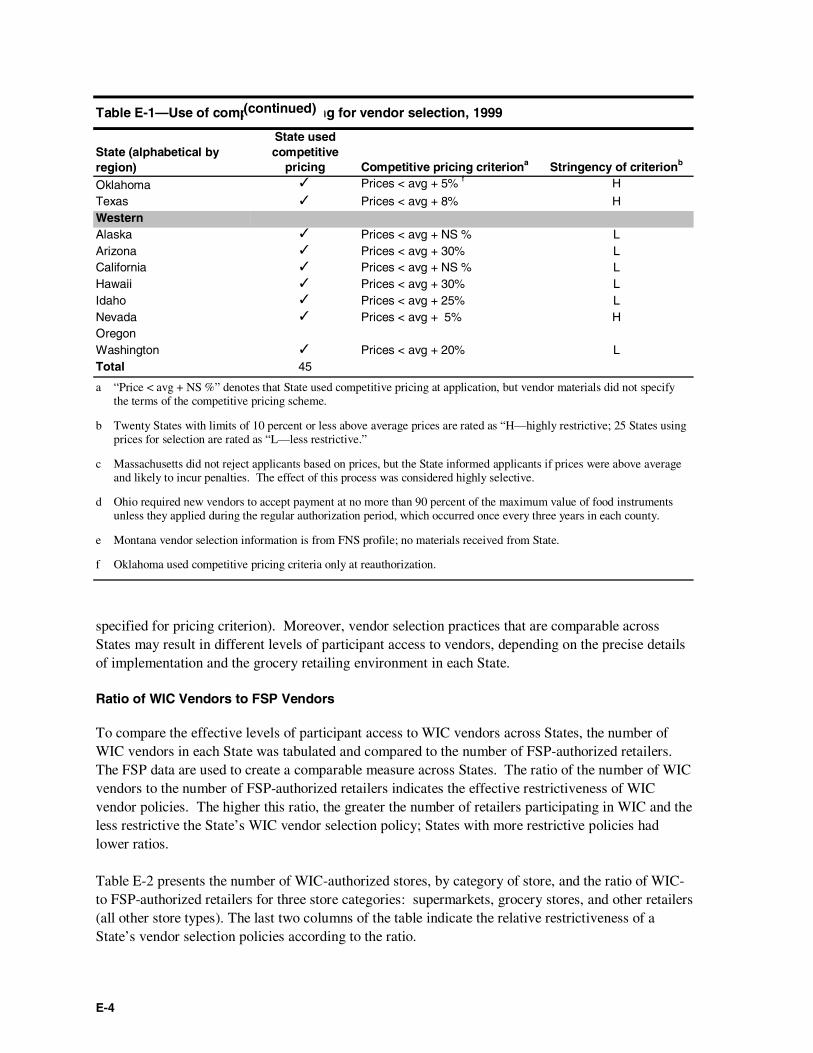
E-4
Table E-1—Use of competitive pricing for vendor selection, 1999
State (alphabetical byregion)
State usedcompetitive
pricing Competitive pricing criteriona Stringency of criterionb
Oklahoma ✓ Prices < avg + 5% f H
Texas ✓ Prices < avg + 8% HWesternAlaska ✓ Prices < avg + NS % LArizona ✓ Prices < avg + 30% LCalifornia ✓ Prices < avg + NS % LHawaii ✓ Prices < avg + 30% LIdaho ✓ Prices < avg + 25% LNevada ✓ Prices < avg + 5% HOregonWashington ✓ Prices < avg + 20% LTotal 45
a “Price < avg + NS %” denotes that State used competitive pricing at application, but vendor materials did not specifythe terms of the competitive pricing scheme.
b Twenty States with limits of 10 percent or less above average prices are rated as “H—highly restrictive; 25 States usingprices for selection are rated as “L—less restrictive.”
c Massachusetts did not reject applicants based on prices, but the State informed applicants if prices were above averageand likely to incur penalties. The effect of this process was considered highly selective.
d Ohio required new vendors to accept payment at no more than 90 percent of the maximum value of food instrumentsunless they applied during the regular authorization period, which occurred once every three years in each county.
e Montana vendor selection information is from FNS profile; no materials received from State.
f Oklahoma used competitive pricing criteria only at reauthorization.
specified for pricing criterion). Moreover, vendor selection practices that are comparable acrossStates may result in different levels of participant access to vendors, depending on the precise detailsof implementation and the grocery retailing environment in each State.
Ratio of WIC Vendors to FSP Vendors
To compare the effective levels of participant access to WIC vendors across States, the number ofWIC vendors in each State was tabulated and compared to the number of FSP-authorized retailers.The FSP data are used to create a comparable measure across States. The ratio of the number of WICvendors to the number of FSP-authorized retailers indicates the effective restrictiveness of WICvendor policies. The higher this ratio, the greater the number of retailers participating in WIC and theless restrictive the State’s WIC vendor selection policy; States with more restrictive policies hadlower ratios.
Table E-2 presents the number of WIC-authorized stores, by category of store, and the ratio of WIC-to FSP-authorized retailers for three store categories: supermarkets, grocery stores, and other retailers(all other store types). The last two columns of the table indicate the relative restrictiveness of aState’s vendor selection policies according to the ratio.
(continued)
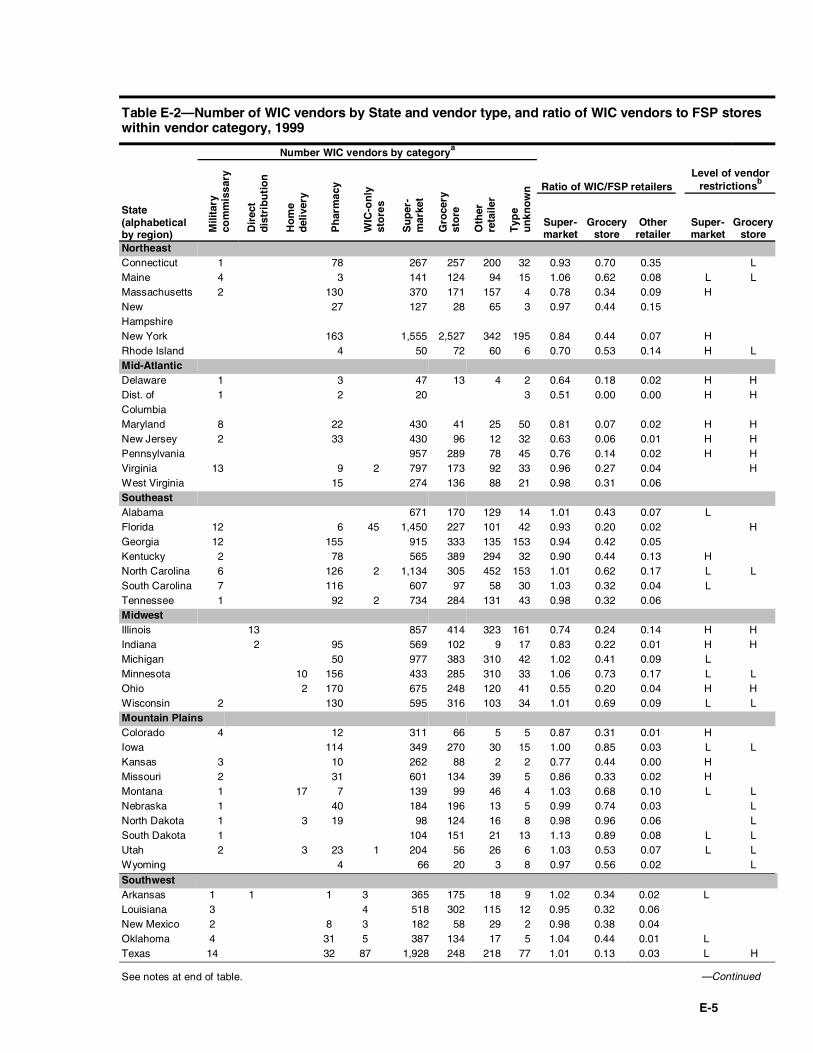
E-5
Table E-2—Number of WIC vendors by State and vendor type, and ratio of WIC vendors to FSP storeswithin vendor category, 1999
Number WIC vendors by categorya
Ratio of WIC/FSP retailersLevel of vendor
restrictionsb
State(alphabeticalby region) M
ilita
ryco
mm
issa
ry
Dir
ect
dis
trib
uti
on
Ho
me
del
iver
y
Ph
arm
acy
WIC
-on
lyst
ore
s
Su
per
-m
arke
t
Gro
cery
sto
re
Oth
erre
taile
r
Typ
eu
nkn
ow
n
Super-market
Grocerystore
Otherretailer
Super-market
Grocerystore
NortheastConnecticut 1 78 267 257 200 32 0.93 0.70 0.35 LMaine 4 3 141 124 94 15 1.06 0.62 0.08 L LMassachusetts 2 130 370 171 157 4 0.78 0.34 0.09 HNewHampshire
27 127 28 65 3 0.97 0.44 0.15
New York 163 1,555 2,527 342 195 0.84 0.44 0.07 HRhode Island 4 50 72 60 6 0.70 0.53 0.14 H LMid-AtlanticDelaware 1 3 47 13 4 2 0.64 0.18 0.02 H HDist. ofColumbia
1 2 20 3 0.51 0.00 0.00 H H
Maryland 8 22 430 41 25 50 0.81 0.07 0.02 H HNew Jersey 2 33 430 96 12 32 0.63 0.06 0.01 H HPennsylvania 957 289 78 45 0.76 0.14 0.02 H HVirginia 13 9 2 797 173 92 33 0.96 0.27 0.04 HWest Virginia 15 274 136 88 21 0.98 0.31 0.06SoutheastAlabama 671 170 129 14 1.01 0.43 0.07 LFlorida 12 6 45 1,450 227 101 42 0.93 0.20 0.02 HGeorgia 12 155 915 333 135 153 0.94 0.42 0.05Kentucky 2 78 565 389 294 32 0.90 0.44 0.13 HNorth Carolina 6 126 2 1,134 305 452 153 1.01 0.62 0.17 L LSouth Carolina 7 116 607 97 58 30 1.03 0.32 0.04 LTennessee 1 92 2 734 284 131 43 0.98 0.32 0.06MidwestIllinois 13 857 414 323 161 0.74 0.24 0.14 H HIndiana 2 95 569 102 9 17 0.83 0.22 0.01 H HMichigan 50 977 383 310 42 1.02 0.41 0.09 LMinnesota 10 156 433 285 310 33 1.06 0.73 0.17 L LOhio 2 170 675 248 120 41 0.55 0.20 0.04 H HWisconsin 2 130 595 316 103 34 1.01 0.69 0.09 L LMountain PlainsColorado 4 12 311 66 5 5 0.87 0.31 0.01 HIowa 114 349 270 30 15 1.00 0.85 0.03 L LKansas 3 10 262 88 2 2 0.77 0.44 0.00 HMissouri 2 31 601 134 39 5 0.86 0.33 0.02 HMontana 1 17 7 139 99 46 4 1.03 0.68 0.10 L LNebraska 1 40 184 196 13 5 0.99 0.74 0.03 LNorth Dakota 1 3 19 98 124 16 8 0.98 0.96 0.06 LSouth Dakota 1 104 151 21 13 1.13 0.89 0.08 L LUtah 2 3 23 1 204 56 26 6 1.03 0.53 0.07 L LWyoming 4 66 20 3 8 0.97 0.56 0.02 L
SouthwestArkansas 1 1 1 3 365 175 18 9 1.02 0.34 0.02 LLouisiana 3 4 518 302 115 12 0.95 0.32 0.06New Mexico 2 8 3 182 58 29 2 0.98 0.38 0.04Oklahoma 4 31 5 387 134 17 5 1.04 0.44 0.01 LTexas 14 32 87 1,928 248 218 77 1.01 0.13 0.03 L H
See notes at end of table. —Continued
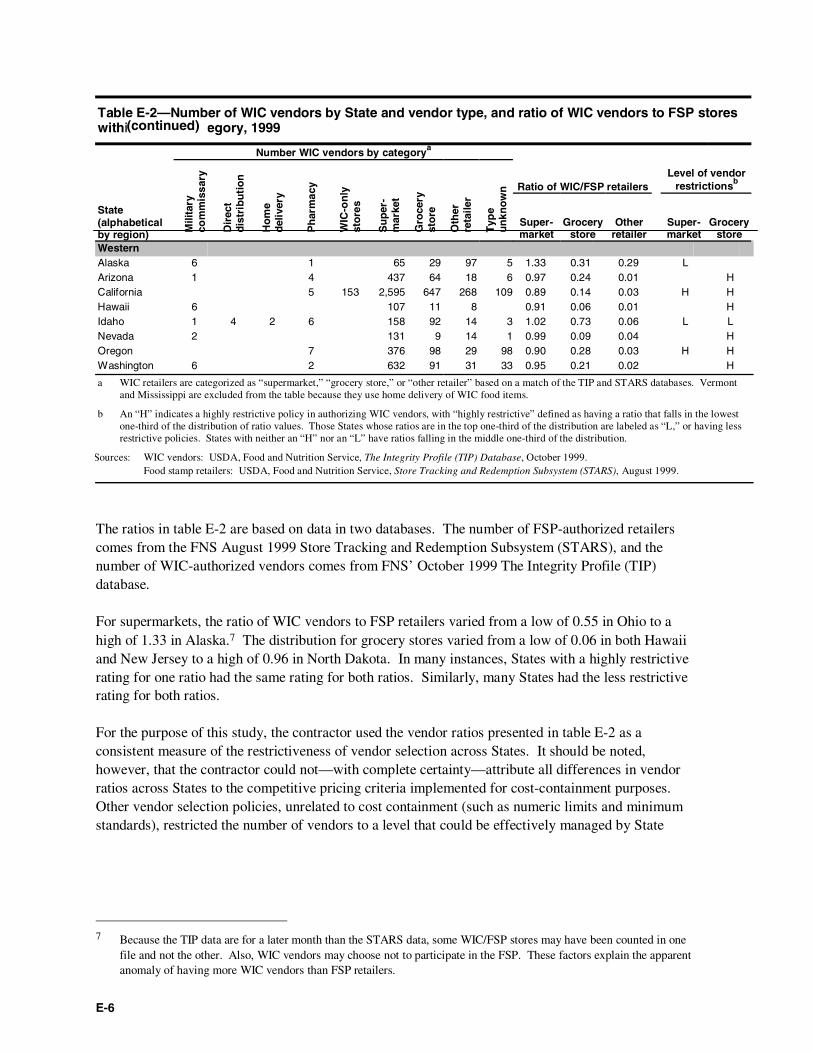
E-6
Table E-2—Number of WIC vendors by State and vendor type, and ratio of WIC vendors to FSP storeswithin vendor category, 1999
Number WIC vendors by categorya
Ratio of WIC/FSP retailersLevel of vendor
restrictionsb
State(alphabeticalby region) M
ilita
ryco
mm
issa
ry
Dir
ect
dis
trib
uti
on
Ho
me
del
iver
y
Ph
arm
acy
WIC
-on
lyst
ore
s
Su
per
-m
arke
t
Gro
cery
sto
re
Oth
erre
taile
r
Typ
eu
nkn
ow
n
Super-market
Grocerystore
Otherretailer
Super-market
Grocerystore
WesternAlaska 6 1 65 29 97 5 1.33 0.31 0.29 LArizona 1 4 437 64 18 6 0.97 0.24 0.01 HCalifornia 5 153 2,595 647 268 109 0.89 0.14 0.03 H HHawaii 6 107 11 8 0.91 0.06 0.01 HIdaho 1 4 2 6 158 92 14 3 1.02 0.73 0.06 L LNevada 2 131 9 14 1 0.99 0.09 0.04 HOregon 7 376 98 29 98 0.90 0.28 0.03 H HWashington 6 2 632 91 31 33 0.95 0.21 0.02 H
a WIC retailers are categorized as “supermarket,” “grocery store,” or “other retailer” based on a match of the TIP and STARS databases. Vermontand Mississippi are excluded from the table because they use home delivery of WIC food items.
b An “H” indicates a highly restrictive policy in authorizing WIC vendors, with “highly restrictive” defined as having a ratio that falls in the lowestone-third of the distribution of ratio values. Those States whose ratios are in the top one-third of the distribution are labeled as “L,” or having lessrestrictive policies. States with neither an “H” nor an “L” have ratios falling in the middle one-third of the distribution.
Sources: WIC vendors: USDA, Food and Nutrition Service, The Integrity Profile (TIP) Database, October 1999.Food stamp retailers: USDA, Food and Nutrition Service, Store Tracking and Redemption Subsystem (STARS), August 1999.
The ratios in table E-2 are based on data in two databases. The number of FSP-authorized retailerscomes from the FNS August 1999 Store Tracking and Redemption Subsystem (STARS), and thenumber of WIC-authorized vendors comes from FNS’ October 1999 The Integrity Profile (TIP)database.
For supermarkets, the ratio of WIC vendors to FSP retailers varied from a low of 0.55 in Ohio to ahigh of 1.33 in Alaska.7 The distribution for grocery stores varied from a low of 0.06 in both Hawaiiand New Jersey to a high of 0.96 in North Dakota. In many instances, States with a highly restrictiverating for one ratio had the same rating for both ratios. Similarly, many States had the less restrictiverating for both ratios.
For the purpose of this study, the contractor used the vendor ratios presented in table E-2 as aconsistent measure of the restrictiveness of vendor selection across States. It should be noted,however, that the contractor could not—with complete certainty—attribute all differences in vendorratios across States to the competitive pricing criteria implemented for cost-containment purposes.Other vendor selection policies, unrelated to cost containment (such as numeric limits and minimumstandards), restricted the number of vendors to a level that could be effectively managed by State
7 Because the TIP data are for a later month than the STARS data, some WIC/FSP stores may have been counted in onefile and not the other. Also, WIC vendors may choose not to participate in the FSP. These factors explain the apparentanomaly of having more WIC vendors than FSP retailers.
(continued)
E-7
agencies and ensured that vendors met standards to adequately provide program benefits. Thesevendor-selection policies also may have contributed to variation in ratios across States.8
Item-Selection Practices
Federal regulations define standard food packages for seven categories of WIC participants: (I)infants 0 through 3 months; (II) infants 4 through 12 months; (III) children and women with specialdietary needs; (IV) children 1 to 5 years; (V) pregnant and breastfeeding women (basic package); (VI)non-breastfeeding postpartum women; and (VII) breastfeeding women (enhanced package).9 Theregulations specify the types of foods in each package and the maximum quantities of each food thatmay be prescribed.
For participants receiving packages I, II and III, the purchase of infant formula, or medicallyprescribed formula, is the principal food expense. Food packages II and III also contain infant oradult cereal and juice. Food packages IV through VII each contain four major food groups: milk orcheese, eggs, breakfast cereal, and juice. In addition, packages IV and V contain legumes (peanutbutter or dry beans), and package VII contains legumes, canned tuna fish, and carrots.10
Within the guidelines provided by the Federal regulations, States establish more specific policies forthe quantities of foods prescribed to participants. By FNS policy, food quantities must not be reducedfor cost-saving reasons, but States may tailor food packages to reduce quantities of foods for individ-ual participants—or categories of participants—based on their nutritional needs, to accommodateparticipant preferences, intolerances, or household conditions. States, however, are encouraged byFNS to consider cost as well as nutritional impact when determining the allowable types and forms offoods in each food group. The flexibility to make “administrative adjustments” to allowablepackaging and brands of foods is an important tool for controlling WIC costs.11
State WIC agencies implement the Federal regulations by assembling a list of “WIC-approved foods”that satisfy both the Federal regulations and the selection criteria of the State. Detailed State selectioncriteria are not always codified in State plans, but selection is generally based on:
• item availability within the State,• participant preferences.• per unit cost, and• nutrient content (a few States specify criteria more stringent than Federal regulations).
States review and revise their WIC-approved food list annually or biennially to add new food items,drop discontinued items, or implement new selection criteria.
8 All States with numeric limits also had competitive pricing criteria. Discussions with FNS regional staff, confirmed bycomparison of numeric limits with actual numbers of vendors, suggested that numeric limits were rarely binding on aStatewide basis, although they may have been binding in certain areas within a State.
9 7 CFR 246.10.
10 Food packages IV through VI provide either milk or cheese or a combination of the two; package VII provides specificquantities of both milk and cheese.
11 FNS Final WIC Policy Memorandum #97-7, May 1997.
E-8
Cost-containment item restrictions limit WIC participants’ choice of the foods that may be purchasedwithin the prescribed food package. WIC food lists collected from the States indicated four mainmethods by which item-selection was limited:
• “least expensive brand” policies,• limits on package size,• limits on product types and forms, and• limits on the number of approved brands.
These item restriction policies are summarized in table E-3, as is the related use of manufacturerrebates.
Different methods of cost containment were often applied to the various categories of WIC foods(milk, cheese, eggs, peanut butter, cereal, juice). For the most part, States used different strategies for“dairy” items (milk, cheese, and eggs) and “branded” items (cereal, juice, and peanut butter). Thesedifferences arose because participants are more likely to have stronger choice preferences amongbranded items than among dairy items.
Brands of milk, cheese, and eggs are not highly differentiated in terms of ingredients, nutrientcontent, and product quality. As a result, limits on product choice within these food categories maynot adversely affect participant satisfaction with WIC purchases. The cost-containment practicesmost often observed within the dairy food groups were “least expensive brand” policies, limits onpackage sizes, and limits on package form.
Breakfast cereal, juice, and peanut butter are branded grocery items. These products may be highlydifferentiated in terms of ingredients, nutrient content, or product quality. All State WIC-approvedfood lists included enumeration of allowable brands and types of breakfast cereal and juice; mostStates allowed purchase of any brand of peanut butter.
The next sections describe the specific ways in which item restrictions were implemented on StateWIC-approved food lists.
Least Expensive Brand Requirements
As noted in table E-3, State agencies with a least expensive brand policy specified on the WIC-approved food list that participants “must buy least expensive brand” for one or more particular foodgroups. Details of what this means varied slightly from State to State. Variants of the least expensivebrand policy included:
Current lowest price: Within a food category, participants must select thebrand that is least expensive at the time of purchase.
Traditionally least expensive: Within a food category, items chosen for the food listare those that have traditionally been least expensive.
Store brand or least expensive brand: Within a food category, participants are required topurchase either the store brand or the least expensivebrand.
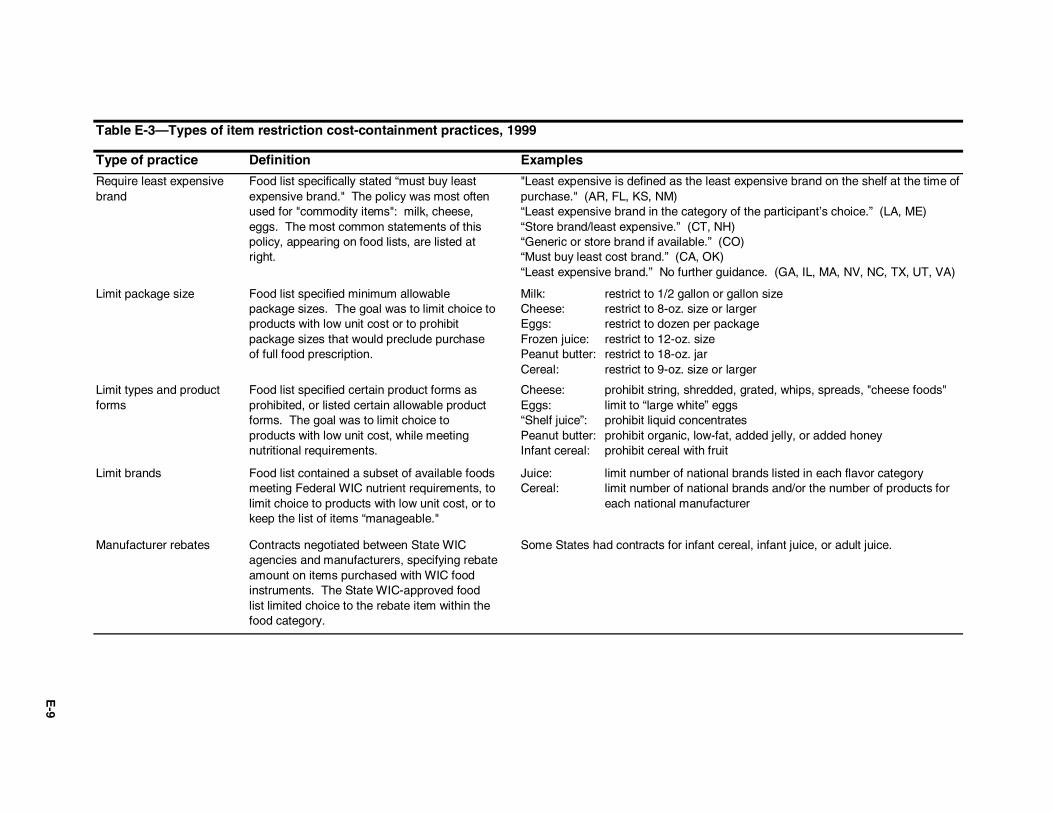
E-9
Table E-3—Types of item restriction cost-containment practices, 1999
Type of practice Definition Examples
Require least expensivebrand
Food list specifically stated “must buy leastexpensive brand." The policy was most oftenused for "commodity items": milk, cheese,eggs. The most common statements of thispolicy, appearing on food lists, are listed atright.
"Least expensive is defined as the least expensive brand on the shelf at the time ofpurchase." (AR, FL, KS, NM)“Least expensive brand in the category of the participant’s choice.” (LA, ME)“Store brand/least expensive.” (CT, NH)“Generic or store brand if available.” (CO)“Must buy least cost brand.” (CA, OK)“Least expensive brand.” No further guidance. (GA, IL, MA, NV, NC, TX, UT, VA)
Limit package size Food list specified minimum allowablepackage sizes. The goal was to limit choice toproducts with low unit cost or to prohibitpackage sizes that would preclude purchaseof full food prescription.
Milk: restrict to 1/2 gallon or gallon sizeCheese: restrict to 8-oz. size or largerEggs: restrict to dozen per packageFrozen juice: restrict to 12-oz. sizePeanut butter: restrict to 18-oz. jarCereal: restrict to 9-oz. size or larger
Limit types and productforms
Food list specified certain product forms asprohibited, or listed certain allowable productforms. The goal was to limit choice toproducts with low unit cost, while meetingnutritional requirements.
Cheese: prohibit string, shredded, grated, whips, spreads, "cheese foods"Eggs: limit to “large white” eggs“Shelf juice”: prohibit liquid concentratesPeanut butter: prohibit organic, low-fat, added jelly, or added honeyInfant cereal: prohibit cereal with fruit
Limit brands Food list contained a subset of available foodsmeeting Federal WIC nutrient requirements, tolimit choice to products with low unit cost, or tokeep the list of items “manageable."
Juice: limit number of national brands listed in each flavor categoryCereal: limit number of national brands and/or the number of products for
each national manufacturer
Manufacturer rebates Contracts negotiated between State WICagencies and manufacturers, specifying rebateamount on items purchased with WIC foodinstruments. The State WIC-approved foodlist limited choice to the rebate item within thefood category.
Some States had contracts for infant cereal, infant juice, or adult juice.
E-10
States often adopted a “traditionally least expensive” approach because of the difficulties of imple-menting a food list with a lowest price policy. Whereas the “current lowest price policy” placed theburden on participants and vendors to determine the lowest price item at the time of purchase, thetraditionally least expensive approach allowed the State to enumerate specific items on the food list.The “store brand or least expensive” approach was also adopted as an alternative to the lowest pricepolicy approach, to allow for the purchase of national brand items when they were on sale, or whenuse of a coupon made the national brand less expensive than the store brand.
Limits on Package Sizes
Choice of package size was generally limited for one of two reasons. The primary reason was toreduce food cost: larger packages generally have lower unit prices. Package size also was limitedsometimes to ensure that the entire food prescription was purchased.12
When setting package size restrictions, States took into account the circumstances of participants andretailers. States with many small retailers (either in older cities or in rural areas) may have to be moreflexible, because smaller retailers do not carry as many different sizes as larger supermarkets. SomeStates chose to take an educational approach rather than a regulatory one: they stressed the lower unitcost of larger packages in nutrition education.
Limits on Product Types and Forms
Some food lists prohibited certain product forms within a product group (e.g., string, shredded, orgrated cheese) or indicated allowable product types (e.g., cheddar and American cheese) or productforms (e.g., large white eggs). In either case, the goal was to limit choice to products with low unitprices (e.g., cost per ounce), thereby cutting the total cost of the food package.
Limits on Brands of Items Due to Nutrient Requirements and Cost
As previously stated, peanut butter, breakfast cereal, and juice may be highly differentiated by brandin terms of ingredients, nutrient content, or product quality. Because of this, not all items within aWIC product category may meet the Federal WIC nutrient requirements. The primary purpose ofState WIC-approved food lists is to enumerate products that meet the requirements; a secondarypurpose is to enumerate products that meet State criteria for cost savings.
All peanut butter brands meet Federal WIC requirements for nutrient content, except forms withadded jelly, honey, or other sweeteners. As a result, most WIC States approved all peanut butterbrands for WIC purchase but excluded the types of peanut butter that did not meet Federalrequirements.
Only six States restricted peanut butter purchases for cost containment, requiring the least expensivebrand of peanut butter. As noted, the meaning of this requirement varied from State to State, so it isnot clear whether some or all of these States effectively required the purchase of store-brand peanut
12 For example, Federal WIC food package regulations stipulate 18 ounces of peanut butter per month. Most Statesrequire purchase of peanut butter in 18-ounce jars. This package size requirement is likely due to the fact that purchaseof 12- or 16-ounce jars of peanut butter cannot be supplemented with purchases of 6- or 2-ounce jars (because peanutbutter is not available in these sizes). Therefore, only purchase of an 18-ounce jar represents full food packageconsumption.
E-11
butter, which would usually be least expensive. A few States, such as Texas, experimented withrequiring store brands for peanut butter but then withdrew these requirements before 1999, citingparticipant dissatisfaction and reduced consumption of peanut butter.13
Within the cereal and juice categories, there is a wide range of choice in a typical supermarket, butonly subsets of all manufactured cereals and juices meet the Federal WIC nutrient requirements.Within those subsets, each State WIC agency selected items eligible for WIC purchase and enumer-ated specific products (by brand and type) on the State’s WIC-approved food list.
There was considerable variation across States in the number of breakfast cereals and juices on thefood lists. Some variation in the number of branded items appeared to be due to the time and effortrequired to update the lists. States must annually review the nutrient content of items on their WIC-approved food list. By limiting the number of items, a State conserves costs of reviewing currentitems, approving newly available ones, and disseminating the changes to local agencies, participants,and vendors. Competing priorities for program managers also may lead some States to lag behindothers in responding to the introduction of new brands in the marketplace.
Many of the State limits on branded food items, however, were clearly for cost-containment reasons.Typically, item restrictions for cost-containment purposes limited participants to items with low unitcost. For example, containment of food costs was clearly the motive when WIC agencies requiredpurchase of store brands or placed limits on package size.14 These two types of restrictions weredirectly observable on State WIC-approved food lists. (Some States used a per unit price cutoff whenapproving items for their food list, but the actual price cutoffs were generally not documented in Statepublications.)
In addition to restricting food lists to low-cost brands, WIC agencies were increasingly aware of thecost-reducing advantages of adding store brands to their food lists. Both FNS and industry sourcesindicated that numerous States have opened up their food lists to increasing numbers of store brandsin recent years, responding to the availability and popularity of these alternatives to national brands.Because State agencies often track the food lists of neighboring States, this change has tended tospread on a regional basis.
Summary of Item Restrictions
The item restrictions observed on State WIC-approved food lists are summarized in table E-4. Forthis table, and in the subsequent discussion, the focus is on the main categories of food that accountfor most WIC purchases, for example, fluid milk as opposed to evaporated, dry, or lactose-free milk;or peanut butter as opposed to dried beans or peas. The first three columns of table E-4 contain indi-cators of least expensive brand policies, store-brand requirements, and product-size restrictions,respectively. In each of these columns, food groups are denoted by abbreviation (“m” stands formilk, “c” for cheese, “e” for eggs, and so on, as defined in the footnote to the table).
13 Interview with Texas WIC director conducted on February 27, 1997 by Peter Bramble and Leigh White, U.S. GeneralAccounting Office.
14 Except, as noted above, for peanut butter.
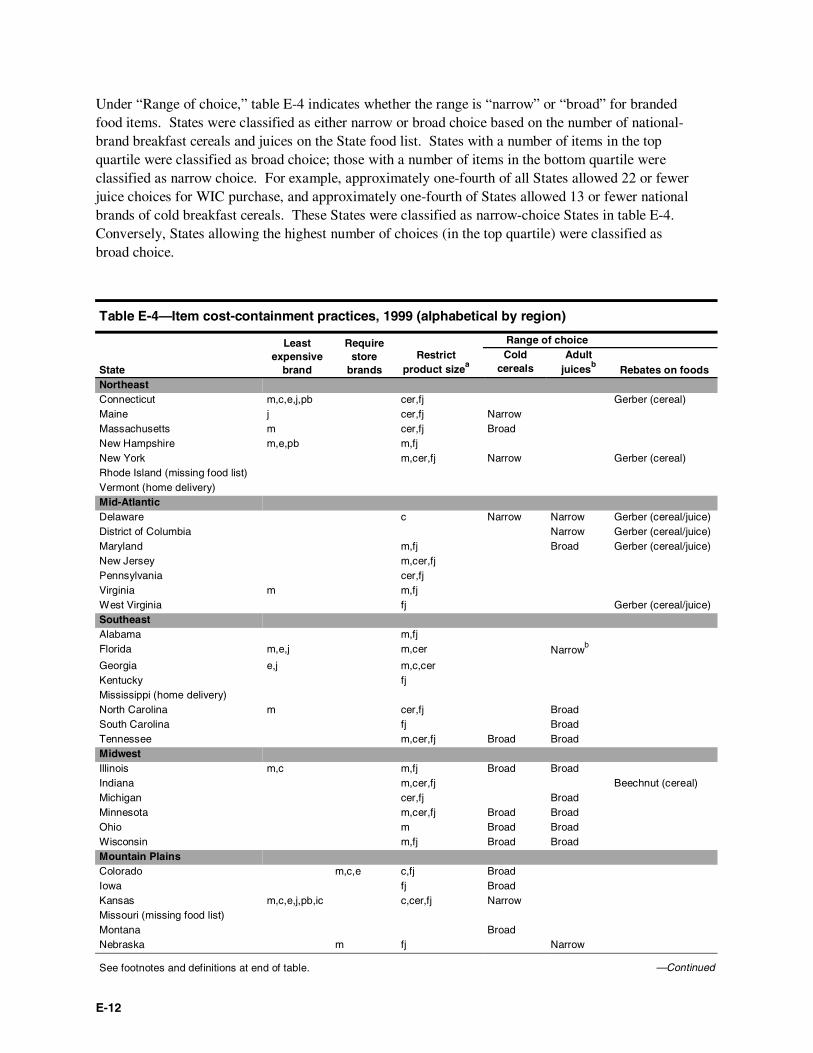
E-12
Under “Range of choice,” table E-4 indicates whether the range is “narrow” or “broad” for brandedfood items. States were classified as either narrow or broad choice based on the number of national-brand breakfast cereals and juices on the State food list. States with a number of items in the topquartile were classified as broad choice; those with a number of items in the bottom quartile wereclassified as narrow choice. For example, approximately one-fourth of all States allowed 22 or fewerjuice choices for WIC purchase, and approximately one-fourth of States allowed 13 or fewer nationalbrands of cold breakfast cereals. These States were classified as narrow-choice States in table E-4.Conversely, States allowing the highest number of choices (in the top quartile) were classified asbroad choice.
Table E-4—Item cost-containment practices, 1999 (alphabetical by region)
Range of choice
State
Leastexpensive
brand
Requirestore
brandsRestrict
product sizeaCold
cerealsAdult
juicesbRebates on foods
NortheastConnecticut m,c,e,j,pb cer,fj Gerber (cereal)Maine j cer,fj NarrowMassachusetts m cer,fj BroadNew Hampshire m,e,pb m,fjNew York m,cer,fj Narrow Gerber (cereal)Rhode Island (missing food list)Vermont (home delivery)Mid-AtlanticDelaware c Narrow Narrow Gerber (cereal/juice)District of Columbia Narrow Gerber (cereal/juice)Maryland m,fj Broad Gerber (cereal/juice)New Jersey m,cer,fjPennsylvania cer,fjVirginia m m,fjWest Virginia fj Gerber (cereal/juice)SoutheastAlabama m,fjFlorida m,e,j m,cer Narrowb
Georgia e,j m,c,cerKentucky fjMississippi (home delivery)North Carolina m cer,fj BroadSouth Carolina fj BroadTennessee m,cer,fj Broad BroadMidwestIllinois m,c m,fj Broad BroadIndiana m,cer,fj Beechnut (cereal)Michigan cer,fj BroadMinnesota m,cer,fj Broad BroadOhio m Broad BroadWisconsin m,fj Broad BroadMountain PlainsColorado m,c,e c,fj BroadIowa fj BroadKansas m,c,e,j,pb,ic c,cer,fj NarrowMissouri (missing food list)Montana BroadNebraska m fj Narrow
See footnotes and definitions at end of table. —Continued
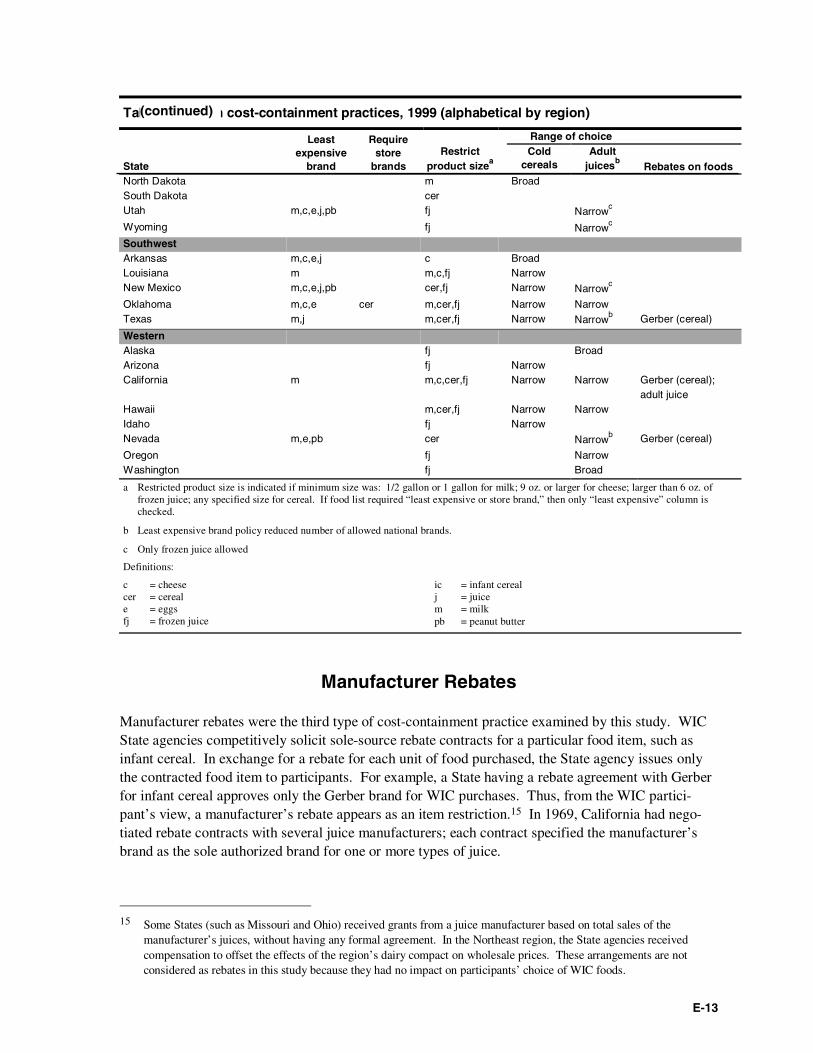
E-13
Table E-4—Item cost-containment practices, 1999 (alphabetical by region)
Range of choice
State
Leastexpensive
brand
Requirestore
brandsRestrict
product sizeaCold
cerealsAdult
juicesbRebates on foods
North Dakota m BroadSouth Dakota cerUtah m,c,e,j,pb fj Narrowc
Wyoming fj Narrowc
SouthwestArkansas m,c,e,j c BroadLouisiana m m,c,fj NarrowNew Mexico m,c,e,j,pb cer,fj Narrow Narrowc
Oklahoma m,c,e cer m,cer,fj Narrow NarrowTexas m,j m,cer,fj Narrow Narrowb Gerber (cereal)
WesternAlaska fj BroadArizona fj NarrowCalifornia m m,c,cer,fj Narrow Narrow Gerber (cereal);
adult juiceHawaii m,cer,fj Narrow NarrowIdaho fj NarrowNevada m,e,pb cer Narrowb Gerber (cereal)
Oregon fj NarrowWashington fj Broad
a Restricted product size is indicated if minimum size was: 1/2 gallon or 1 gallon for milk; 9 oz. or larger for cheese; larger than 6 oz. offrozen juice; any specified size for cereal. If food list required “least expensive or store brand,” then only “least expensive” column ischecked.
b Least expensive brand policy reduced number of allowed national brands.
c Only frozen juice allowed
Definitions:
c = cheesecer = cereale = eggsfj = frozen juice
ic = infant cerealj = juicem = milkpb = peanut butter
Manufacturer Rebates
Manufacturer rebates were the third type of cost-containment practice examined by this study. WICState agencies competitively solicit sole-source rebate contracts for a particular food item, such asinfant cereal. In exchange for a rebate for each unit of food purchased, the State agency issues onlythe contracted food item to participants. For example, a State having a rebate agreement with Gerberfor infant cereal approves only the Gerber brand for WIC purchases. Thus, from the WIC partici-pant’s view, a manufacturer’s rebate appears as an item restriction.15 In 1969, California had nego-tiated rebate contracts with several juice manufacturers; each contract specified the manufacturer’sbrand as the sole authorized brand for one or more types of juice.
15 Some States (such as Missouri and Ohio) received grants from a juice manufacturer based on total sales of themanufacturer’s juices, without having any formal agreement. In the Northeast region, the State agencies receivedcompensation to offset the effects of the region’s dairy compact on wholesale prices. These arrangements are notconsidered as rebates in this study because they had no impact on participants’ choice of WIC foods.
(continued)

E-14
Manufacturer rebate contracts are shown in the last column of table E-4. Nine States and the Districtof Columbia had rebate contracts in place in fall 1999. Nearly all rebate contracts were for infantcereal and infant juice; the exception was California’s contracts for adult juice, which expired inJanuary 2000.
F-1
Appendix FAdministrative Costs of Cost Containment
This appendix describes the method of estimating the administrative costs of cost-containment prac-tices, including the data collection process, and presents the estimates for each practice covered by thestudy. This information is provided primarily to explain the sources and limitations of the overallcost estimates presented in chapter 2. Readers are cautioned to keep the data limitations in mindwhen reviewing the detailed results.
Data Sources and Limitations
The six case study States did not collect specific data on the administrative costs associated with cost-containment practices. Federal reporting requirements do not require identification of these costs, sonone of the States tracked the costs at the necessary level of detail.1 Only one State, California, hadstudied some of these costs.
Due to the absence of data, this study relied on estimates of staff time (and other costs, where poss-ible) collected from WIC agency officials through structured interviews. This approach depended ona combination of experience and subjective estimates, but provided the best available insight into theadministrative costs of cost-containment practices.
The State and local staff members were asked to identify which of these tasks they performed, howoften they did each task, and how much time they spent on each task (per event or per year). Toconvert time estimates into costs, data were collected on salaries, fringe benefits, and indirect costsfor the staff involved in cost containment.2
If a task was not performed solely for cost containment, staff members were asked to estimate whatproportion was attributable to the cost-containment practice. This estimate was based on the relativeimportance of cost-containment objectives or the share of resources attributable to them. Forexample, some local staff members were most comfortable estimating the total time spent providingtraining to new participants on program objectives and procedures. They then gave their best esti-mates of the proportion of this training devoted to restrictions on food purchases shaped by cost-containment practices (for example, requirements to purchase the least expensive brand).
With rare exceptions, the respondents could identify only labor costs. Several cost-containment prac-tices require support from automated data processing (ADP) systems, but these ADP costs could notbe broken out, either for operations or for initial implementation, because of the highly integratednature of the ADP systems.3
1 State WIC agencies report their WIC nutritional and administrative service (NSA) costs to FNS, by function. Thefunctional framework does not differentiate the very specific administrative costs associated with cost containment.
2 Some States (e.g., Connecticut) do not charge indirect costs against their WIC NSA grants. Indirect costs are includedin the administrative cost estimates for all States so that the estimates are complete and comparable.
3 State staff members often noted that the most significant expenditure of ADP resources to facilitate cost containmentwas in the development stage of their systems, when the staff and contractors were designing and testing the on-linefunctions and reports.
F-2
To incorporate other costs associated with staff activities, State and local indirect cost rates wereadded to the hourly cost of staff time (including salaries and fringe benefits).4 Respondents occa-sionally noted other costs that might theoretically be included (such as a share of travel costs for storevisits to collect prices and other information onsite). There was no basis for estimating these costs,however, and they were generally thought to be too small to affect the estimates in a noticeable way.
The cost estimates in this chapter are presented with the recognition that that they rely on subjectiveinterpretation of experience. Individual responses may be subject to random estimation error, andrespondents may have been biased toward estimating their costs high or low. The interviewersprobed carefully to minimize the likelihood of error or bias. The availability of multiple estimates foreach activity provides the opportunity for errors and biased responses to offset each other. Therefore,the discussion in the chapter focuses primarily on the average administrative cost for each cost-containment practice, rather than on the extremes.
Each table of administrative cost estimates includes an average cost figure for all six States or asubset of the States. In computing these averages, the State-level estimates were given equal weight,without regard to the size of the State. This approach, used both here and in the main report, is appro-priate because the study is treating the experiences in the States as case studies. The averages are notmeant to be generalizable to a larger population of States.
Costs of Using Price Data in Vendor Authorization
As shown in table F-1, five of the six States provided data to estimate the administrative costs ofusing price data in vendor authorization. The estimated costs ranged from $0.01 per participant peryear (PPY) in Ohio to $0.10 PPY in Oklahoma. Among the States with estimated costs for this prac-tice, the average was $0.06 PPY. Three States (California, Connecticut, and Texas) had costs within$0.02 PPY of the average. North Carolina did not identify any costs associated with this practice,because it did not restrict vendor authorization based on price. Instead, the State included costs for itsprice surveys in its costs for using price data to limit vendor payments (discussed in appendix G).
The State respondents varied in their treatment of the costs of collecting and processing vendor data,because they used the data for several purposes: to check the prices of applicants and authorizedvendors, to set or modify maximum food prices, and to gather information for projecting foodpackage costs. Therefore, the responses were affected by the different approaches to using price datain vendor authorization, as follows:
• For California and Connecticut, the costs of price surveys used during authorizationcycles were included in the costs of using price data for vendor authorization. The costsof price surveys between authorization cycles were included in the cost of another func-tion, using price data to limit vendor payments.5
• For North Carolina, all costs associated with collecting and analyzing price survey formswere included in the costs of using price data to limit vendor payments.
4 Indirect cost rates typically included generic expenses such as telephone service, postage, paper, copying, officeequipment, and space.
5 See appendix G for further information on this vendor management function.
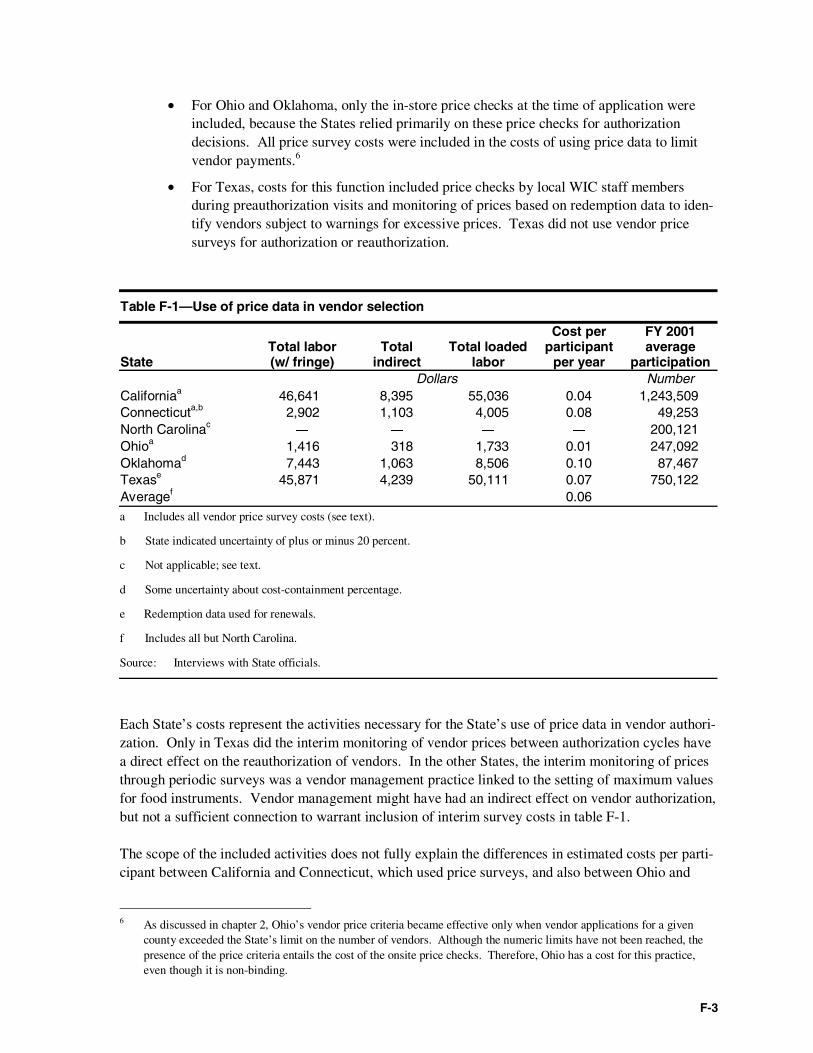
F-3
• For Ohio and Oklahoma, only the in-store price checks at the time of application wereincluded, because the States relied primarily on these price checks for authorizationdecisions. All price survey costs were included in the costs of using price data to limitvendor payments.6
• For Texas, costs for this function included price checks by local WIC staff membersduring preauthorization visits and monitoring of prices based on redemption data to iden-tify vendors subject to warnings for excessive prices. Texas did not use vendor pricesurveys for authorization or reauthorization.
Table F-1—Use of price data in vendor selection
StateTotal labor(w/ fringe)
Totalindirect
Total loadedlabor
Cost perparticipant
per year
FY 2001average
participationDollars Number
Californiaa 46,641 8,395 55,036 0.04 1,243,509Connecticuta,b 2,902 1,103 4,005 0.08 49,253North Carolinac
― ― ― ― 200,121Ohioa 1,416 318 1,733 0.01 247,092Oklahomad 7,443 1,063 8,506 0.10 87,467Texase 45,871 4,239 50,111 0.07 750,122Averagef 0.06a Includes all vendor price survey costs (see text).
b State indicated uncertainty of plus or minus 20 percent.
c Not applicable; see text.
d Some uncertainty about cost-containment percentage.
e Redemption data used for renewals.
f Includes all but North Carolina.
Source: Interviews with State officials.
Each State’s costs represent the activities necessary for the State’s use of price data in vendor authori-zation. Only in Texas did the interim monitoring of vendor prices between authorization cycles havea direct effect on the reauthorization of vendors. In the other States, the interim monitoring of pricesthrough periodic surveys was a vendor management practice linked to the setting of maximum valuesfor food instruments. Vendor management might have had an indirect effect on vendor authorization,but not a sufficient connection to warrant inclusion of interim survey costs in table F-1.
The scope of the included activities does not fully explain the differences in estimated costs per parti-cipant between California and Connecticut, which used price surveys, and also between Ohio and
6 As discussed in chapter 2, Ohio’s vendor price criteria became effective only when vendor applications for a givencounty exceeded the State’s limit on the number of vendors. Although the numeric limits have not been reached, thepresence of the price criteria entails the cost of the onsite price checks. Therefore, Ohio has a cost for this practice,even though it is non-binding.
F-4
Oklahoma, which relied on onsite visits to vendors for price data used in authorization. Several otherfactors may have contributed to these differences. The differences in scale of WIC operations mayhelp explain higher costs in Connecticut and Oklahoma, the two smallest of the study States. Theother States that used similar methods might have been able to process vendor price information moreefficiently. Second, there might have been differences in the quantity of price information obtainedfor each vendor or the quality of the information provided by the vendors. Such differences wouldaffect the costs of compiling and using the vendor price data. Oklahoma put greater emphasis onusing vendor price data in authorization than Ohio, and this difference may have contributed to staffspending more time to collect price data during store visits. Third, the estimates are based on theexperience of State officials, but there is a subjective element. The Connecticut and Oklahomarespondents may have perceived cost-containment tasks as more time-consuming than did the otherrespondents; lacking direct objective measures of time spent, it was not possible to determine whethersuch a bias was present or which States’ perceptions were more accurate.7
More generally, the data do not indicate whether the cost differences are the result of real differencesin process and cost structure, measurement error, or a combination of these factors. Given theseuncertainties, the cost data should be used with appropriate caution, with more reliance on the aver-ages than on individual State estimates.
Costs of Using Cost Criteria for Food-Item Restrictions
The administrative costs of food-item restrictions include three components, each analyzed separatelyfor this report:
• Using cost criteria in constructing WIC food lists;
• Communicating information on price-based restrictions on allowable foods toparticipants; and
• Communicating information on price-based restrictions on allowable foods to vendors.
The study also analyzed the administrative costs associated with infant cereal rebate contracts in thethree States that had them.
Constructing WIC Food Lists
Estimates for the first component, using cost criteria in constructing WIC food lists, are presented intable F-2. As indicated, these costs were estimated for four of the six States, excluding California andOhio. Both those States applied cost criteria in constructing and updating their food lists, but neitherwas able to provide information on the associated level of effort and administrative costs. The esti-mated costs were $0.03 PPY or less for North Carolina, Oklahoma, and Texas. In contrast, the esti-mated cost for Connecticut was $0.71 PPY.
7 The Connecticut estimates were obtained through in-person interviews, whereas the other estimates were obtainedthrough telephone interviews and correspondence. The method of obtaining the data may have influenced the esti-mates. Lacking other data from in-person interviews, there was no way to determine whether the data collectionmethod affected the results, or which approach should be considered more reliable.
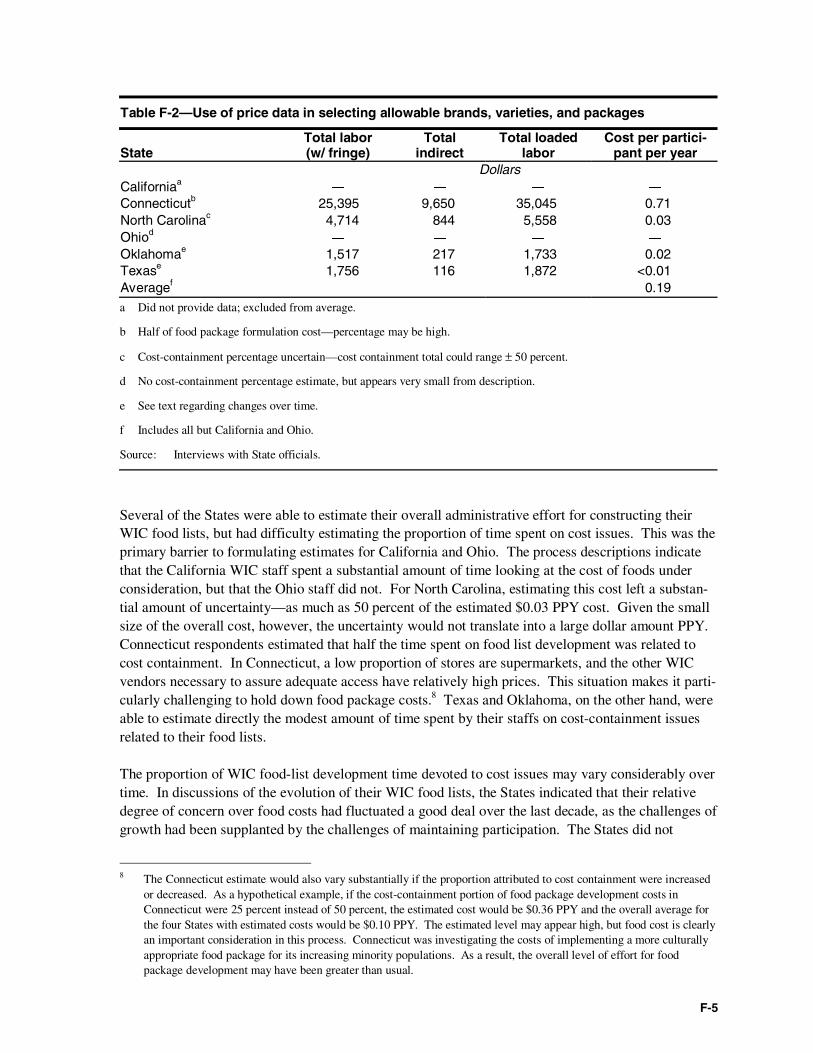
F-5
Table F-2—Use of price data in selecting allowable brands, varieties, and packages
StateTotal labor(w/ fringe)
Totalindirect
Total loadedlabor
Cost per partici-pant per year
DollarsCaliforniaa
― ― ― ―
Connecticutb 25,395 9,650 35,045 0.71North Carolinac 4,714 844 5,558 0.03Ohiod
― ― ― ―
Oklahomae 1,517 217 1,733 0.02Texase 1,756 116 1,872 <0.01Averagef 0.19a Did not provide data; excluded from average.
b Half of food package formulation cost—percentage may be high.
c Cost-containment percentage uncertain—cost containment total could range ± 50 percent.
d No cost-containment percentage estimate, but appears very small from description.
e See text regarding changes over time.
f Includes all but California and Ohio.
Source: Interviews with State officials.
Several of the States were able to estimate their overall administrative effort for constructing theirWIC food lists, but had difficulty estimating the proportion of time spent on cost issues. This was theprimary barrier to formulating estimates for California and Ohio. The process descriptions indicatethat the California WIC staff spent a substantial amount of time looking at the cost of foods underconsideration, but that the Ohio staff did not. For North Carolina, estimating this cost left a substan-tial amount of uncertainty—as much as 50 percent of the estimated $0.03 PPY cost. Given the smallsize of the overall cost, however, the uncertainty would not translate into a large dollar amount PPY.Connecticut respondents estimated that half the time spent on food list development was related tocost containment. In Connecticut, a low proportion of stores are supermarkets, and the other WICvendors necessary to assure adequate access have relatively high prices. This situation makes it parti-cularly challenging to hold down food package costs.8 Texas and Oklahoma, on the other hand, wereable to estimate directly the modest amount of time spent by their staffs on cost-containment issuesrelated to their food lists.
The proportion of WIC food-list development time devoted to cost issues may vary considerably overtime. In discussions of the evolution of their WIC food lists, the States indicated that their relativedegree of concern over food costs had fluctuated a good deal over the last decade, as the challenges ofgrowth had been supplanted by the challenges of maintaining participation. The States did not
8 The Connecticut estimate would also vary substantially if the proportion attributed to cost containment were increasedor decreased. As a hypothetical example, if the cost-containment portion of food package development costs inConnecticut were 25 percent instead of 50 percent, the estimated cost would be $0.36 PPY and the overall average forthe four States with estimated costs would be $0.10 PPY. The estimated level may appear high, but food cost is clearlyan important consideration in this process. Connecticut was investigating the costs of implementing a more culturallyappropriate food package for its increasing minority populations. As a result, the overall level of effort for foodpackage development may have been greater than usual.
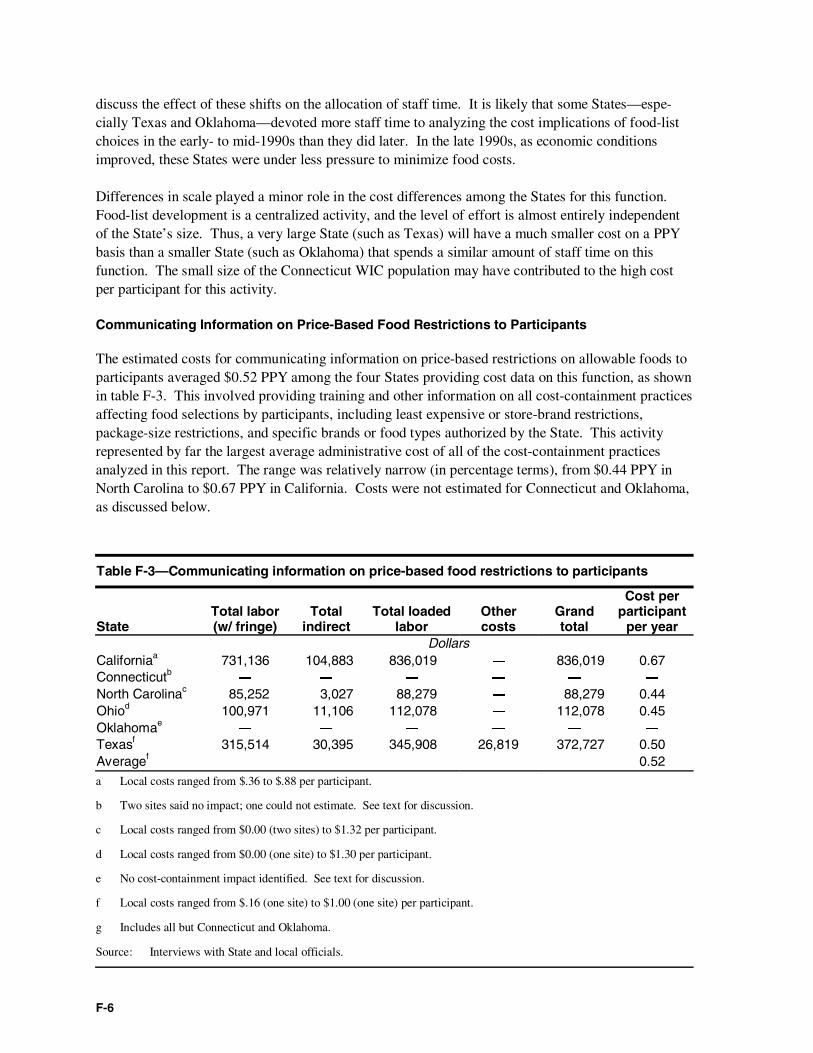
F-6
discuss the effect of these shifts on the allocation of staff time. It is likely that some States—espe-cially Texas and Oklahoma—devoted more staff time to analyzing the cost implications of food-listchoices in the early- to mid-1990s than they did later. In the late 1990s, as economic conditionsimproved, these States were under less pressure to minimize food costs.
Differences in scale played a minor role in the cost differences among the States for this function.Food-list development is a centralized activity, and the level of effort is almost entirely independentof the State’s size. Thus, a very large State (such as Texas) will have a much smaller cost on a PPYbasis than a smaller State (such as Oklahoma) that spends a similar amount of staff time on thisfunction. The small size of the Connecticut WIC population may have contributed to the high costper participant for this activity.
Communicating Information on Price-Based Food Restrictions to Participants
The estimated costs for communicating information on price-based restrictions on allowable foods toparticipants averaged $0.52 PPY among the four States providing cost data on this function, as shownin table F-3. This involved providing training and other information on all cost-containment practicesaffecting food selections by participants, including least expensive or store-brand restrictions,package-size restrictions, and specific brands or food types authorized by the State. This activityrepresented by far the largest average administrative cost of all of the cost-containment practicesanalyzed in this report. The range was relatively narrow (in percentage terms), from $0.44 PPY inNorth Carolina to $0.67 PPY in California. Costs were not estimated for Connecticut and Oklahoma,as discussed below.
Table F-3—Communicating information on price-based food restrictions to participants
StateTotal labor(w/ fringe)
Totalindirect
Total loadedlabor
Othercosts
Grandtotal
Cost perparticipant
per yearDollars
Californiaa 731,136 104,883 836,019 ― 836,019 0.67Connecticutb ― ― ― ― ― ―
North Carolinac 85,252 3,027 88,279 ― 88,279 0.44Ohiod 100,971 11,106 112,078 ― 112,078 0.45Oklahomae
― ― ― ― ― ―
Texasf 315,514 30,395 345,908 26,819 372,727 0.50Averagef 0.52a Local costs ranged from $.36 to $.88 per participant.
b Two sites said no impact; one could not estimate. See text for discussion.
c Local costs ranged from $0.00 (two sites) to $1.32 per participant.
d Local costs ranged from $0.00 (one site) to $1.30 per participant.
e No cost-containment impact identified. See text for discussion.
f Local costs ranged from $.16 (one site) to $1.00 (one site) per participant.
g Includes all but Connecticut and Oklahoma.
Source: Interviews with State and local officials.
F-7
Unlike other costs analyzed for this chapter, the costs for this function were derived almost entirelyfrom local agency interviews. For each local agency, the cost PPY was estimated from the interviewdata. For each State, the simple average of the local agency estimates was computed to estimate thestatewide cost PPY, and the statewide annual cost was computed using this figure and the averagestatewide participation level for FY2001. This method was used for other local agency costs, butthese were rarely identified for other functions. State costs were included in this function whenreported (primarily for developing training materials and training local agencies). The interviewsample was very small for statewide estimates, but the average cost PPY is representative of the areaswhere participant data were collected for the study.9
In 8 of the 18 local agencies contacted for the study (including 2 of the Connecticut sites and all 3Oklahoma sites), local respondents expressed the view that cost-containment restrictions had noimpact on participant training costs. This response can be interpreted two ways. The respondentsmay have meant that they truly spent no resources (or at least so little as to be immaterial) on thisfunction, or they may have meant that their training costs would be the same if the restrictions wereeliminated (thus assuming that training on other functions would be increased to substitute for timespent on cost containment). In the States with a broad range of estimated costs for this function, theanalysis conservatively assumed that the intent was to report that the costs were essentially zero, andthe data from these sites were included in the averages. On the other hand, in the absence of anypositive estimates from local agencies in Connecticut and Oklahoma, we chose not to estimate thiscost for those States. It is impossible to tell whether these local agencies truly experienced no costs orwhether they were just unable to separate this portion of participant training from other aspects (nutri-tional content of WIC foods, use of food instruments, etc.).
The estimated costs for informing participants about price-based restrictions on food selection arelarger than for other cost-containment functions because this task requires direct communication withindividuals or groups. Thus, there are no great economies of scale, although larger agencies some-times provided training on WIC shopping in a group setting. The relatively consistent cost PPYamong the four States with estimates reflects similarities in the training process and in the averagetime devoted during training to cost-containment restrictions.
This consistency should not be overemphasized, because the local agencies varied widely in themagnitude and precision of their estimates. Among the local agencies with non-zero estimates, therange was from $0.06 PPY in the largest Ohio site to $1.32 PPY in one of the North Carolina sites. In3 of the 4 States, the highest local estimate for this task was $1.00 PPY or more. The presence ofestimates of this magnitude in North Carolina and Ohio is particularly surprising, given the minimalrestrictions on food choices in these States. California and Texas had the clearest evidence that localagencies generally spent a measurable amount of resources on this function, with minimum localagency estimates of $0.36 PPY and $0.16 PPY, respectively. Given the amount of variation amongthe local agencies, it is unclear whether the differences among States reflect State policies or thespecific practices of the local agencies in the sample.
9 As discussed in appendix A, the local agencies selected for interviews served the largest number of participants in thesample frame for the participant survey.
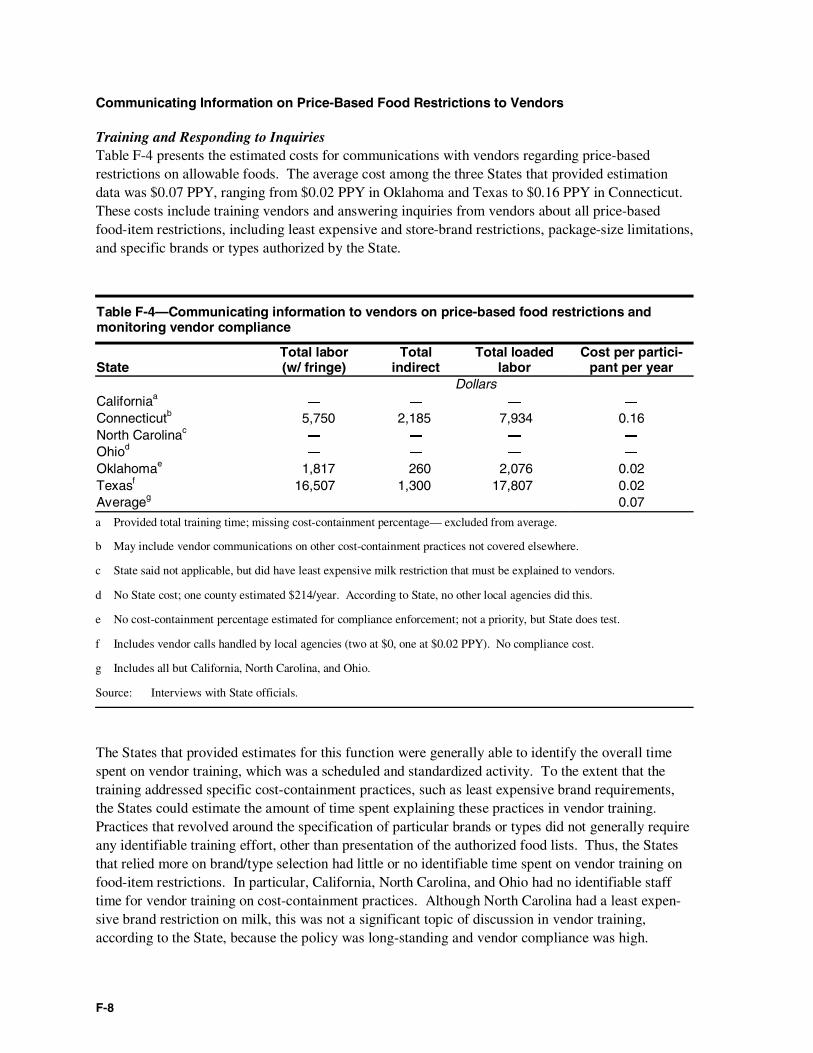
F-8
Communicating Information on Price-Based Food Restrictions to Vendors
Training and Responding to InquiriesTable F-4 presents the estimated costs for communications with vendors regarding price-basedrestrictions on allowable foods. The average cost among the three States that provided estimationdata was $0.07 PPY, ranging from $0.02 PPY in Oklahoma and Texas to $0.16 PPY in Connecticut.These costs include training vendors and answering inquiries from vendors about all price-basedfood-item restrictions, including least expensive and store-brand restrictions, package-size limitations,and specific brands or types authorized by the State.
Table F-4—Communicating information to vendors on price-based food restrictions andmonitoring vendor compliance
StateTotal labor(w/ fringe)
Totalindirect
Total loadedlabor
Cost per partici-pant per year
DollarsCaliforniaa
― ― ― ―
Connecticutb 5,750 2,185 7,934 0.16North Carolinac
― ― ― ―
Ohiod― ― ― ―
Oklahomae 1,817 260 2,076 0.02Texasf 16,507 1,300 17,807 0.02Averageg 0.07
a Provided total training time; missing cost-containment percentage— excluded from average.
b May include vendor communications on other cost-containment practices not covered elsewhere.
c State said not applicable, but did have least expensive milk restriction that must be explained to vendors.
d No State cost; one county estimated $214/year. According to State, no other local agencies did this.
e No cost-containment percentage estimated for compliance enforcement; not a priority, but State does test.
f Includes vendor calls handled by local agencies (two at $0, one at $0.02 PPY). No compliance cost.
g Includes all but California, North Carolina, and Ohio.
Source: Interviews with State officials.
The States that provided estimates for this function were generally able to identify the overall timespent on vendor training, which was a scheduled and standardized activity. To the extent that thetraining addressed specific cost-containment practices, such as least expensive brand requirements,the States could estimate the amount of time spent explaining these practices in vendor training.Practices that revolved around the specification of particular brands or types did not generally requireany identifiable training effort, other than presentation of the authorized food lists. Thus, the Statesthat relied more on brand/type selection had little or no identifiable time spent on vendor training onfood-item restrictions. In particular, California, North Carolina, and Ohio had no identifiable stafftime for vendor training on cost-containment practices. Although North Carolina had a least expen-sive brand restriction on milk, this was not a significant topic of discussion in vendor training,according to the State, because the policy was long-standing and vendor compliance was high.
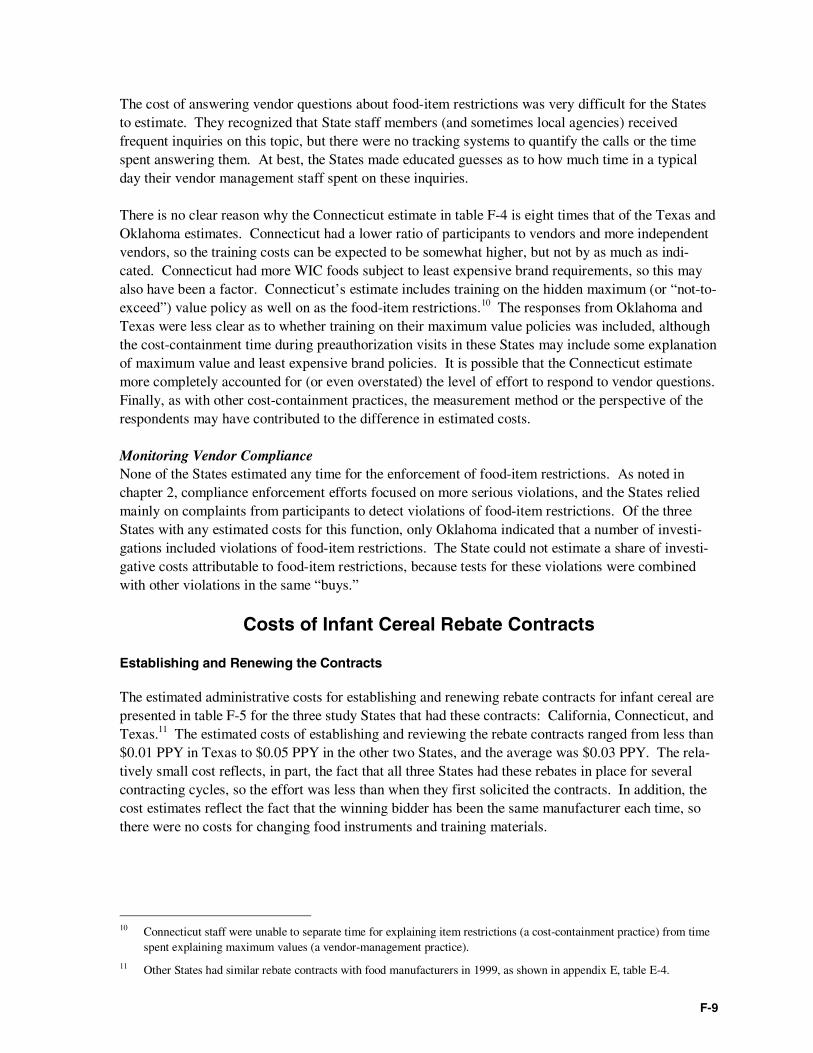
F-9
The cost of answering vendor questions about food-item restrictions was very difficult for the Statesto estimate. They recognized that State staff members (and sometimes local agencies) receivedfrequent inquiries on this topic, but there were no tracking systems to quantify the calls or the timespent answering them. At best, the States made educated guesses as to how much time in a typicalday their vendor management staff spent on these inquiries.
There is no clear reason why the Connecticut estimate in table F-4 is eight times that of the Texas andOklahoma estimates. Connecticut had a lower ratio of participants to vendors and more independentvendors, so the training costs can be expected to be somewhat higher, but not by as much as indi-cated. Connecticut had more WIC foods subject to least expensive brand requirements, so this mayalso have been a factor. Connecticut’s estimate includes training on the hidden maximum (or “not-to-exceed”) value policy as well on as the food-item restrictions.10 The responses from Oklahoma andTexas were less clear as to whether training on their maximum value policies was included, althoughthe cost-containment time during preauthorization visits in these States may include some explanationof maximum value and least expensive brand policies. It is possible that the Connecticut estimatemore completely accounted for (or even overstated) the level of effort to respond to vendor questions.Finally, as with other cost-containment practices, the measurement method or the perspective of therespondents may have contributed to the difference in estimated costs.
Monitoring Vendor ComplianceNone of the States estimated any time for the enforcement of food-item restrictions. As noted inchapter 2, compliance enforcement efforts focused on more serious violations, and the States reliedmainly on complaints from participants to detect violations of food-item restrictions. Of the threeStates with any estimated costs for this function, only Oklahoma indicated that a number of investi-gations included violations of food-item restrictions. The State could not estimate a share of investi-gative costs attributable to food-item restrictions, because tests for these violations were combinedwith other violations in the same “buys.”
Costs of Infant Cereal Rebate Contracts
Establishing and Renewing the Contracts
The estimated administrative costs for establishing and renewing rebate contracts for infant cereal arepresented in table F-5 for the three study States that had these contracts: California, Connecticut, andTexas.11 The estimated costs of establishing and reviewing the rebate contracts ranged from less than$0.01 PPY in Texas to $0.05 PPY in the other two States, and the average was $0.03 PPY. The rela-tively small cost reflects, in part, the fact that all three States had these rebates in place for severalcontracting cycles, so the effort was less than when they first solicited the contracts. In addition, thecost estimates reflect the fact that the winning bidder has been the same manufacturer each time, sothere were no costs for changing food instruments and training materials.
10 Connecticut staff were unable to separate time for explaining item restrictions (a cost-containment practice) from timespent explaining maximum values (a vendor-management practice).
11 Other States had similar rebate contracts with food manufacturers in 1999, as shown in appendix E, table E-4.
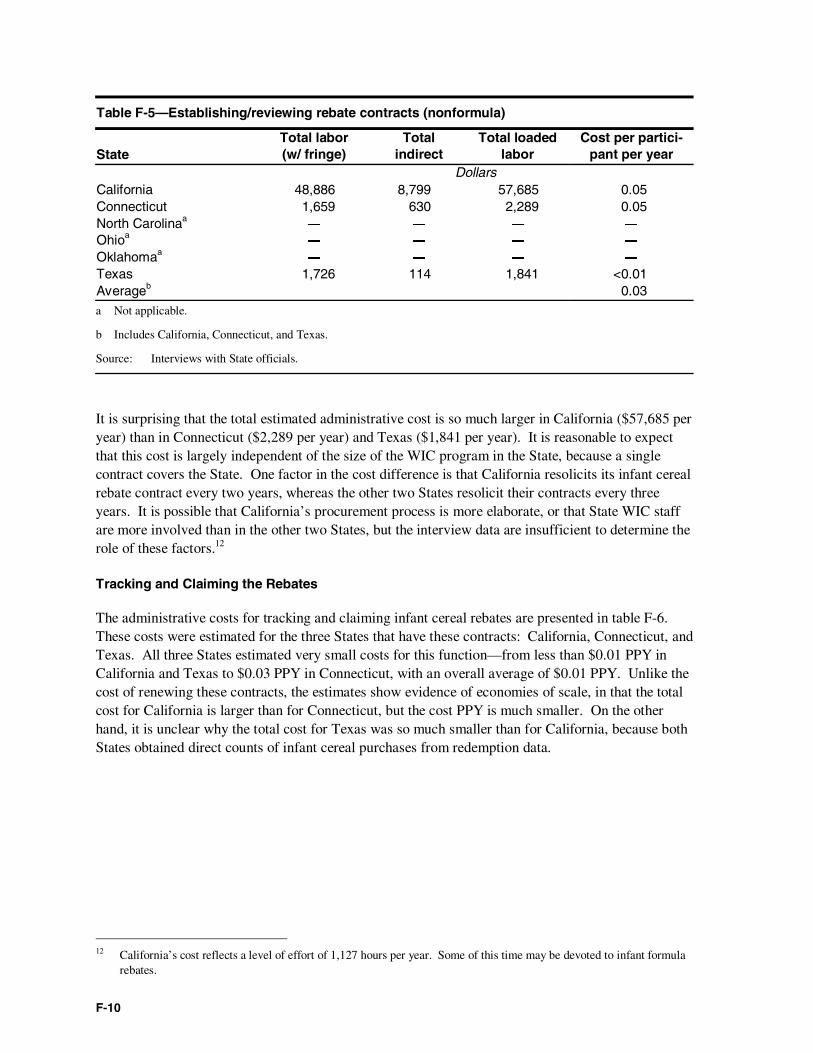
F-10
Table F-5—Establishing/reviewing rebate contracts (nonformula)
StateTotal labor(w/ fringe)
Totalindirect
Total loadedlabor
Cost per partici-pant per year
DollarsCalifornia 48,886 8,799 57,685 0.05Connecticut 1,659 630 2,289 0.05North Carolinaa
― ― ― ―
Ohioa― ― ― ―
Oklahomaa― ― ― ―
Texas 1,726 114 1,841 <0.01Averageb 0.03a Not applicable.
b Includes California, Connecticut, and Texas.
Source: Interviews with State officials.
It is surprising that the total estimated administrative cost is so much larger in California ($57,685 peryear) than in Connecticut ($2,289 per year) and Texas ($1,841 per year). It is reasonable to expectthat this cost is largely independent of the size of the WIC program in the State, because a singlecontract covers the State. One factor in the cost difference is that California resolicits its infant cerealrebate contract every two years, whereas the other two States resolicit their contracts every threeyears. It is possible that California’s procurement process is more elaborate, or that State WIC staffare more involved than in the other two States, but the interview data are insufficient to determine therole of these factors.12
Tracking and Claiming the Rebates
The administrative costs for tracking and claiming infant cereal rebates are presented in table F-6.These costs were estimated for the three States that have these contracts: California, Connecticut, andTexas. All three States estimated very small costs for this function—from less than $0.01 PPY inCalifornia and Texas to $0.03 PPY in Connecticut, with an overall average of $0.01 PPY. Unlike thecost of renewing these contracts, the estimates show evidence of economies of scale, in that the totalcost for California is larger than for Connecticut, but the cost PPY is much smaller. On the otherhand, it is unclear why the total cost for Texas was so much smaller than for California, because bothStates obtained direct counts of infant cereal purchases from redemption data.
12 California’s cost reflects a level of effort of 1,127 hours per year. Some of this time may be devoted to infant formularebates.
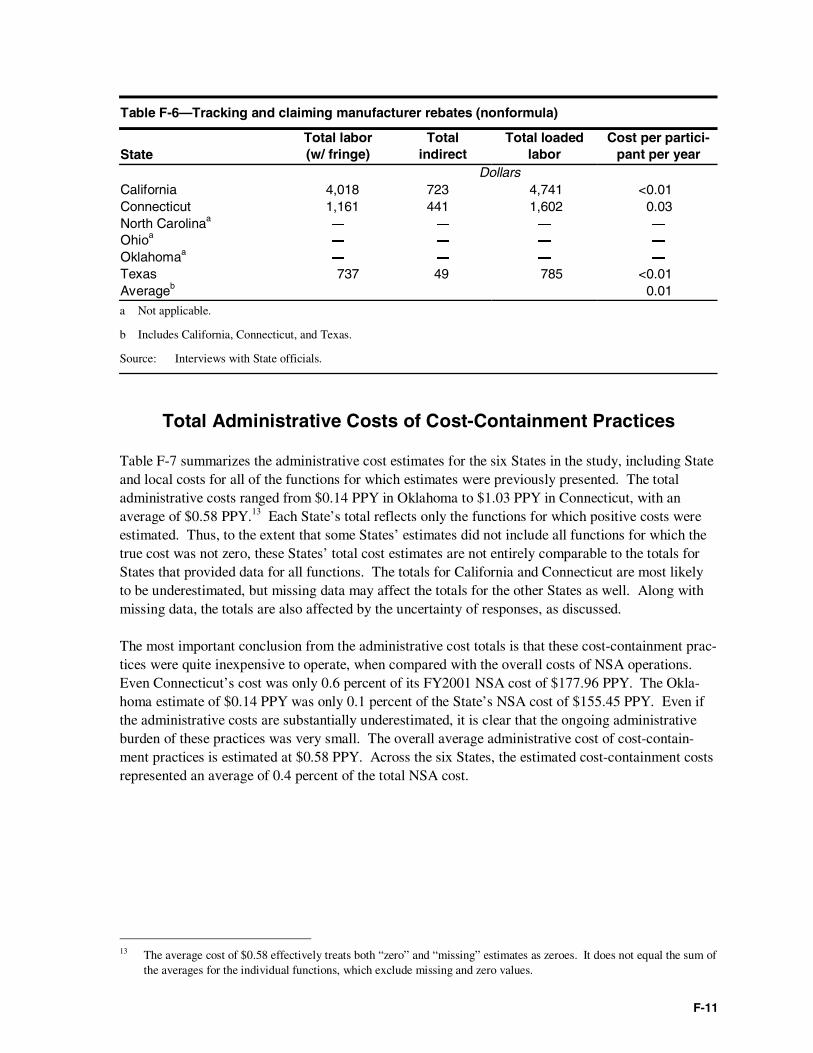
F-11
Table F-6—Tracking and claiming manufacturer rebates (nonformula)
StateTotal labor(w/ fringe)
Totalindirect
Total loadedlabor
Cost per partici-pant per year
DollarsCalifornia 4,018 723 4,741 <0.01Connecticut 1,161 441 1,602 0.03North Carolinaa
― ― ― ―
Ohioa― ― ― ―
Oklahomaa― ― ― ―
Texas 737 49 785 <0.01Averageb 0.01a Not applicable.
b Includes California, Connecticut, and Texas.
Source: Interviews with State officials.
Total Administrative Costs of Cost-Containment Practices
Table F-7 summarizes the administrative cost estimates for the six States in the study, including Stateand local costs for all of the functions for which estimates were previously presented. The totaladministrative costs ranged from $0.14 PPY in Oklahoma to $1.03 PPY in Connecticut, with anaverage of $0.58 PPY.13 Each State’s total reflects only the functions for which positive costs wereestimated. Thus, to the extent that some States’ estimates did not include all functions for which thetrue cost was not zero, these States’ total cost estimates are not entirely comparable to the totals forStates that provided data for all functions. The totals for California and Connecticut are most likelyto be underestimated, but missing data may affect the totals for the other States as well. Along withmissing data, the totals are also affected by the uncertainty of responses, as discussed.
The most important conclusion from the administrative cost totals is that these cost-containment prac-tices were quite inexpensive to operate, when compared with the overall costs of NSA operations.Even Connecticut’s cost was only 0.6 percent of its FY2001 NSA cost of $177.96 PPY. The Okla-homa estimate of $0.14 PPY was only 0.1 percent of the State’s NSA cost of $155.45 PPY. Even ifthe administrative costs are substantially underestimated, it is clear that the ongoing administrativeburden of these practices was very small. The overall average administrative cost of cost-contain-ment practices is estimated at $0.58 PPY. Across the six States, the estimated cost-containment costsrepresented an average of 0.4 percent of the total NSA cost.
13 The average cost of $0.58 effectively treats both “zero” and “missing” estimates as zeroes. It does not equal the sum ofthe averages for the individual functions, which exclude missing and zero values.
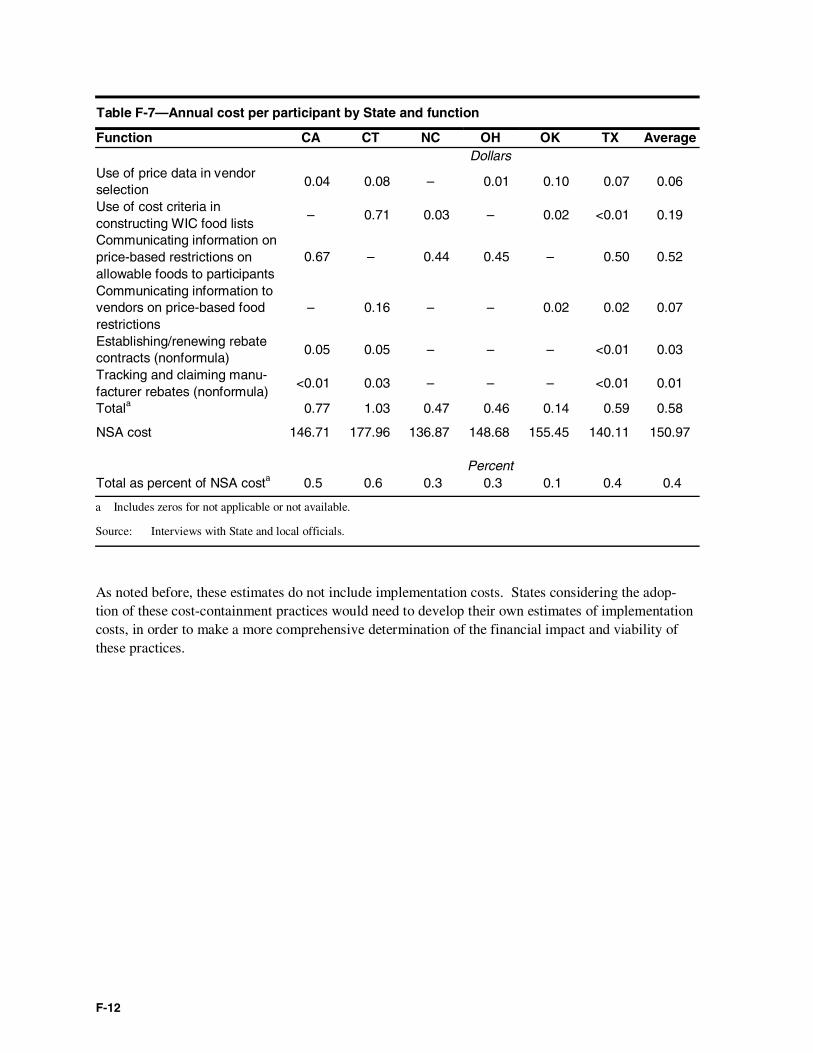
F-12
Table F-7—Annual cost per participant by State and function
Function CA CT NC OH OK TX AverageDollars
Use of price data in vendorselection
0.04 0.08 – 0.01 0.10 0.07 0.06
Use of cost criteria inconstructing WIC food lists
– 0.71 0.03 – 0.02 <0.01 0.19
Communicating information onprice-based restrictions onallowable foods to participants
0.67 – 0.44 0.45 – 0.50 0.52
Communicating information tovendors on price-based foodrestrictions
– 0.16 – – 0.02 0.02 0.07
Establishing/renewing rebatecontracts (nonformula)
0.05 0.05 – – – <0.01 0.03
Tracking and claiming manu-facturer rebates (nonformula)
<0.01 0.03 – – – <0.01 0.01
Totala 0.77 1.03 0.47 0.46 0.14 0.59 0.58
NSA cost 146.71 177.96 136.87 148.68 155.45 140.11 150.97
PercentTotal as percent of NSA costa 0.5 0.6 0.3 0.3 0.1 0.4 0.4
a Includes zeros for not applicable or not available.
Source: Interviews with State and local officials.
As noted before, these estimates do not include implementation costs. States considering the adop-tion of these cost-containment practices would need to develop their own estimates of implementationcosts, in order to make a more comprehensive determination of the financial impact and viability ofthese practices.
G-1
Appendix GUse of Food Price Informationto Limit Payments to Vendors
As a practice for managing authorized vendors and ensuring the integrity of the food delivery system,all six States in the study used price standards for individual WIC foods to set limits on payments forredeemed food instruments, otherwise known as maximum, or “not-to-exceed,” values. Thisappendix describes these practices and presents information on their costs.
In all of the six States except Texas, each food instrument had a maximum total value that dependedon the items on the instrument. If a vendor submitted a food instrument that exceeded the State’smaximum value for that food instrument, the State rejected the instrument or reduced thereimbursement to the specified maximum.1
Texas, on the other hand, set a maximum price for each item on the food instrument. The vendorrecorded the actual prices on the instrument for the foods taken by the participant. If the price for anitem exceeded the maximum, the State reduced the vendor’s reimbursement by the amount of theexcess.
Maximum values for food instruments have two purposes. First, the process catches errors anddeliberate overcharging by vendors. For example, if a clerk enters an extra zero on the price, so thatthe vendor deposits a WIC check for two gallons of milk for $45.00 instead of $4.50, this error willbe detected if the State has a maximum value of $6.00 for the check. Second, the maximum valuesprevent the WIC program from paying prices that are high relative to the competitive price levelamong WIC vendors. This practice gives the State more control of food package costs, particularlyunder the Texas model.
The maximum-value policy is closely related to the use of food prices in vendor selection. As notedin chapter 2, States notified vendors if the prices they submitted at the time of application exceededthe standards used by the State to set maximum values for food instruments. Vendor price surveysand redemption data were the principal sources of market data for setting maximum values. The useof maximum values, in turn, provided feedback to the vendors: if their prices were high, the Staterejected or reduced their requests for reimbursement.
Unlike the WIC cost-containment restrictions described in this report, the use of maximum values isnot intended to affect vendor participation or participants’ choice of WIC foods.2 Rather, maximumvalue standards serve to ensure that authorized WIC vendors maintain competitive pricing and avoidovercharging, thus promoting vendor management goals. Therefore, the study did not look for anysuch effects or compare participant outcomes on the basis of differences in the implementation of thispractice.
1 State WIC agencies often contract with banks or other firms to process food instruments redeemed by vendors. Forease of exposition, the text that follows treats the contractors acting as the State’s agents as if they were part of theState WIC agency.
2 Ohio’s cost-containment contracts for new vendors do not exclude any vendors, although it is possible that somepotential vendors choose not to accept this contract.
G-2
Nevertheless, the study collected information on the use of maximum values in the six States becauseof the possibility that this practice could have an indirect impact on vendor participation. A stringentset of maximum values might have the effect of discouraging participation by small independentstores whose prices are high because of high costs for wholesale food and other expenses. Thiswould help hold down food costs, but it could also reduce access to WIC foods for participantslacking access to large chain stores, including inner-city and rural communities. This result would becontrary to Federal rules requiring adequate geographic distribution of WIC vendors. As discussedbelow, the available evidence suggests that such effects are minimal or nonexistent, primarily becauseof the steps the States take to avoid this problem.
Procedures for Applying Maximum Values
The use of maximum values for food instruments involves the following activities:
• Collecting market prices for WIC foods
• Determining and updating maximum prices for WIC foods and food instruments
• Providing information on maximum values for foods or food instruments to vendors
• Rejecting or adjusting food instruments that exceed maximum values
• Reconsidering food instruments rejected or adjusted because of prices that exceedmaximum values
The text below describes these activities and compares approaches among the six States in the study.Table G-1 summarizes this information.
Collecting Market Price Information for WIC Foods
Except for Texas, all the States collected information on market prices for WIC foods from vendorsurveys (as summarized in table 2-2). Connecticut, North Carolina, Ohio, and Oklahoma collectedprice surveys from all authorized vendors 2 to 4 times per year. California and Oklahoma collectedprices from all vendors during annual monitoring visits, but these States also collected supplementaryprice surveys from samples of vendors when needed to update prices for foods where the maximumvalues might be out of line with the market. Ohio also collected vendor prices during annualmonitoring visits, and Connecticut checked vendor prices during visits every 1 to 3 years prior tovendor reauthorization.
For Texas, the vendor prices recorded on WIC vouchers were the primary data source. The other fiveStates used redemption data as well, primarily to monitor the proportion of food instrumentsredeemed at or near the maximum value. This information is one indicator that a vendor may beovercharging or committing other WIC program violations. Individual stores with high rates ofredemptions near the maximum value are often labeled as “high-risk” and targeted for complianceinvestigations or audits. On a more systemic level, if a large number of stores redeemed food instru-ments at or near the maximum value, the State usually reviewed the redemption and survey data todetermine whether to revise the price standards used to set the maximum values.
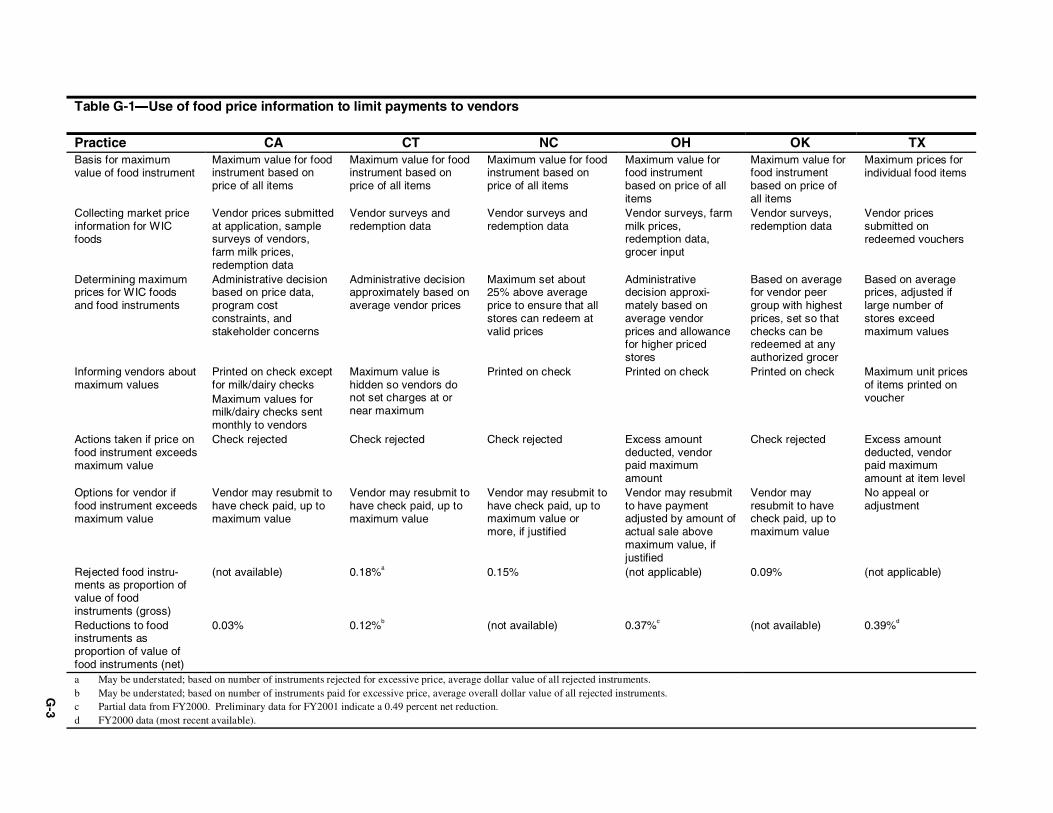
G-3
Table G-1―Use of food price information to limit payments to vendors
Practice CA CT NC OH OK TXBasis for maximumvalue of food instrument
Maximum value for foodinstrument based onprice of all items
Maximum value for foodinstrument based onprice of all items
Maximum value for foodinstrument based onprice of all items
Maximum value forfood instrumentbased on price of allitems
Maximum value forfood instrumentbased on price ofall items
Maximum prices forindividual food items
Collecting market priceinformation for WICfoods
Vendor prices submittedat application, samplesurveys of vendors,farm milk prices,redemption data
Vendor surveys andredemption data
Vendor surveys andredemption data
Vendor surveys, farmmilk prices,redemption data,grocer input
Vendor surveys,redemption data
Vendor pricessubmitted onredeemed vouchers
Determining maximumprices for WIC foodsand food instruments
Administrative decisionbased on price data,program costconstraints, andstakeholder concerns
Administrative decisionapproximately based onaverage vendor prices
Maximum set about25% above averageprice to ensure that allstores can redeem atvalid prices
Administrativedecision approxi-mately based onaverage vendorprices and allowancefor higher pricedstores
Based on averagefor vendor peergroup with highestprices, set so thatchecks can beredeemed at anyauthorized grocer
Based on averageprices, adjusted iflarge number ofstores exceedmaximum values
Informing vendors aboutmaximum values
Printed on check exceptfor milk/dairy checksMaximum values formilk/dairy checks sentmonthly to vendors
Maximum value ishidden so vendors donot set charges at ornear maximum
Printed on check Printed on check Printed on check Maximum unit pricesof items printed onvoucher
Actions taken if price onfood instrument exceedsmaximum value
Check rejected Check rejected Check rejected Excess amountdeducted, vendorpaid maximumamount
Check rejected Excess amountdeducted, vendorpaid maximumamount at item level
Options for vendor iffood instrument exceedsmaximum value
Vendor may resubmit tohave check paid, up tomaximum value
Vendor may resubmit tohave check paid, up tomaximum value
Vendor may resubmit tohave check paid, up tomaximum value ormore, if justified
Vendor may resubmitto have paymentadjusted by amount ofactual sale abovemaximum value, ifjustified
Vendor mayresubmit to havecheck paid, up tomaximum value
No appeal oradjustment
Rejected food instru-ments as proportion ofvalue of foodinstruments (gross)
(not available) 0.18%a 0.15% (not applicable) 0.09% (not applicable)
Reductions to foodinstruments asproportion of value offood instruments (net)
0.03% 0.12%b (not available) 0.37%c (not available) 0.39%d
a May be understated; based on number of instruments rejected for excessive price, average dollar value of all rejected instruments.b May be understated; based on number of instruments paid for excessive price, average overall dollar value of all rejected instruments.c Partial data from FY2000. Preliminary data for FY2001 indicate a 0.49 percent net reduction.d FY2000 data (most recent available).
G-4
Some of the States used other data sources for setting their maximum values. California updatedmaximum values for milk-only and dairy-combination food instruments on a monthly basis, usinginformation on farm milk prices set by the California Department of Agriculture. Ohio also usedfarm price information from the Ohio Department of Agriculture in setting price standards for milk.In addition, Ohio obtained information from the Ohio Grocer’s Association on methods for settingmaximum values, taking into account wholesale prices and typical grocer markups.
Determining Maximum Prices for WIC Foods and Food Instruments
In all six States, the maximum values for food instruments depended on the price standardsestablished for each category of WIC food. Where the maximum value was for the entire foodinstrument, the State computed this value based on the items on the food instrument, their quantities,and the price standards for each item.
The States based the price standards for individual foods on average prices charged by WIC vendors,but they exercised judgment in setting the standards. On the one hand, they wanted to prevent over-charging and hold down food costs. At the same time, they recognized that some vendors had legiti-mately high operating costs, especially in areas with relatively few stores that could meet WICparticipants’ needs. They were also aware that their price information could lag behind the market,and that food instruments are issued up to 2 months before they can be used. Therefore, the Statesmade some allowances for expected price increases to avoid rejecting food instruments for a largenumber of vendors. All the States indicated that when they saw a high rate of food instrumentsrejected, particularly when larger stores were involved, they updated their price standards. The Statesmonitored prices regularly, but adjustments to price standards were intermittent.
State officials described different approaches to finding the right balance in setting maximumstandards for foods. Officials in North Carolina and Oklahoma emphasized the importance of makingsure that participants could redeem food instruments at full value in all stores, including the smallerstores that served more remote areas. North Carolina set its price standards about 25 percent abovestatewide averages, and Oklahoma focused on the average prices for the vendor peer group with thehighest prices. Oklahoma officials also noted, however, that their price standards remained set forextended periods, potentially bringing down peer group averages by pushing out the most expensiveauthorized vendors. Connecticut officials described a similar need to make sure that prices of smallerstores were taken into account, because participants in inner-city areas often relied on these stores.
In California, Ohio, and Texas, officials emphasized the need for cost containment and their authorityto limit what the State will pay for WIC foods. California officials described their process as takinginto account both vendor concerns and cost constraints. If the trend in food package costs indicated arisk of exceeding the WIC grant, the State set price standards at a lower level than it would have ifthere had been less concern about overspending. Ohio officials worked with the Ohio Grocer’sAssociation to develop the process for setting maximum values, but they also stressed that they didnot try to accommodate all retailers in this process. Instead, the State set the prices it was willing topay and let the retailers choose whether to participate. Texas officials closely monitored vendorprices and the incidence of prices exceeding the maximum, but they rarely adjusted their maximum
G-5
prices (except for infant formula).3 As in Ohio, officials in Texas view the maximum prices as astatement of what they were willing to pay on behalf of the taxpayers.
Informing Vendors about Maximum Values
Four of the six States printed maximum total values on their food instruments: North Carolina, Ohio,and Oklahoma did this on all of their food instruments, and California printed maximum values onmost, but not all, food instruments. Because of the State’s three-month check issuance cycle and themonthly review of price standards for milk, California did not print the maximum value on the milk-only and dairy-combination food instruments. Instead, the State sent monthly updates on themaximum values for these food instruments to vendors and posted them on the Internet.
As noted, Texas printed maximum values on its food instruments for each food category. Texasvendors do not receive more than the maximum amount for a category, whereas vendors in the otherStates can offset high prices in one food category with low prices in another to keep within the State’smaximum total.
Connecticut kept maximum values hidden so that vendors could not abuse the program by settingtheir charges at or close to the stated maximum. Instead, vendors learned that their prices were toohigh by having their checks rejected. After the State adopted the hidden maximum value and severalother cost-containment initiatives in 1996, its food package costs dropped from $36.36 per person inFY1995 to $34.23 per person in FY1997.4 The other States addressed the problem of “pricing to themax” by targeting vendors that consistently charged at or near the maximum for followup, such astelephone contacts, covert compliance visits, or audits.
Actions Taken if Price on Food Instrument Exceeded Maximum Value
Of the States that used printed maximum values, all five instructed vendors not to submit food instru-ments totaling more than the maximum value. In Connecticut, the food instruments did not haveprinted maximum values, but vendors acted with the knowledge that some limit existed. The otherStates also prohibited vendors from requesting payment of the excess amount from the participant ordenying a participant a prescribed food. The States differed, however, in the procedure that cashiersshould follow if the prices for a participant’s food selections exceeded the maximum value. OnlyOhio prohibited the vendor from asking the participant to replace a selected item with a lower pricedWIC-approved item to bring the total purchase within the maximum value. California and Texasexplicitly authorized vendors to request that the participant switch to a lower priced, WIC-approveditem. Vendor handbooks and rules in North Carolina and Oklahoma neither prohibited nor authorizedthis practice.
When a vendor submitted a food instrument that exceeded the maximum value, Ohio and Texasautomatically reduced the payment to the maximum value; the other four States rejected the entire
3 Texas officials indicated that retail prices for infant formula were subject to larger fluctuations than for other WICfoods, primarily because of fluctuations in wholesale prices.
4 The proportion of savings specifically attributable to hiding the maximum value is unknown. The State previously hada fixed maximum value for all food instruments, regardless of the items included. Along with the hidden maximumvalue, the State also began to review vendors’ reimbursements in relation to their reported prices and to follow up ondiscrepancies, as discussed in the section on vendor selection.
G-6
food instrument. Five of the States had procedures for vendors to resubmit food instruments when theState rejected the instrument or reduced payment due to excessive prices, but the rules for this processdiffered. Texas did not allow resubmission of food instruments when payment had been reduced dueto excessive prices.
Two States, North Carolina and Ohio, paid the vendor’s shelf price even if it was greater than themaximum value, but only if the vendor provided documentation of the shelf price and justified it onthe basis of wholesale cost. In North Carolina, a vendor could submit a food instrument thatexceeded the maximum value to the local WIC office for “revalidation” to avoid having it rejected bythe State’s processing agent. In areas served mainly by small stores with high prices, theserevalidations were common.
The other four States would not pay more than the maximum for the food instrument. California,Connecticut, and Oklahoma adjusted payment up to the actual amount of sale or the maximum(whichever was less) to correct errors by the vendor or the State’s agent.
To varying extents, food instruments rejected for excessive prices in California, Connecticut, NorthCarolina, and Oklahoma were not resubmitted, so the State sometimes saved the entire amount, notjust the excess. Vendors resubmitted nearly all food instruments rejected for excessive prices inCalifornia, but only 35 percent were resubmitted and paid in Connecticut.5 North Carolina andOklahoma could not provide data on the proportion of rejected food instruments resubmitted byvendors.
Table G-1 provides information on the approximate scale of savings due to food instruments rejectedor payments reduced because of prices exceeding the maximum value. Some of the States couldprovide only the gross value of food instruments rejected, whereas others provided the net value ofsavings based on the difference between the amount claimed by the vendor and the amount paid at orbelow the maximum value. Both rates are quite small—less than 0.5 percent of total food costs in allsix States.
Among the States providing the gross value of food instruments rejected for exceeding the maximumvalue, Connecticut had the highest rate (at least 0.18 percent of food costs). North Carolina’s ratewas somewhat smaller (0.15 percent), and Oklahoma’s rate was smaller still (0.09 percent). Actualsavings in all three States were smaller than indicated, to the extent that rejected food instrumentswere resubmitted at or below the maximum value. Connecticut’s net savings are estimated at 0.12percent of food costs, although this estimate may be low (as discussed in the notes to table G-1). Theother States could not estimate the net savings after resubmission of rejected food instruments.
Ohio and Texas had similar rates of net reductions in payment due to maximum values: 0.37 percentof food costs for Ohio and 0.39 percent for Texas (based on FY2000 data).6 These reductions weresubstantially greater than the gross figures for Connecticut, North Carolina, and Texas, but still quitesmall as a percentage of food costs. California’s net reduction of 0.03 percent is the smallest of the 4
5 Oklahoma and North Carolina did not provide estimates of the proportion of rejected food instruments resubmitted andpaid.
6 Preliminary data indicate an 0.49-percent reduction in Ohio for FY2001. Data for FY2001 were not available forTexas.
G-7
States that had these figures available, as might be expected given the high proportion of rejectedfood instruments resubmitted by vendors.
Taken by themselves, these data suggest that Ohio and Texas had the most stringent limits on foodinstrument payments through their maximum values, whereas those in Oklahoma and California werethe least stringent. The data are insufficient to make such a judgment, for two reasons. First, avail-able data from Oklahoma suggest that the actual rejections represent the “tip of the iceberg” relativeto the total value of food instruments for which the vendor’s shelf prices exceed the maximum value.In Oklahoma, about 0.5 percent of food instruments (by value) were redeemed at the maximum—over five times the proportion rejected for being over the maximum. At least a fraction of the foodinstruments redeemed at the maximum represent situations where the vendor was reimbursed lessthan the shelf price. Furthermore, an unknown amount of potential overcharging was deterred by themaximum value.7 Secondly, differences in the proportion of food instruments rejected for excessiveprices may in part reflect differences in the underlying distribution and variability of retail food pricesamong the States. For any given standard relative to the average vendor prices, the proportion of foodinstruments rejected, and thus the apparent stringency of maximum values, will depend on thevariation of prices across vendors and over time.
Administrative Costs of Using Price Data ToLimit Payments to Vendors
As shown in table G-2, five of the six States provided data to estimate the administrative costs ofusing price data to limit payments to vendors. The estimated costs ranged from $0.01 PPY in Cali-fornia to $0.53 PPY in Connecticut, with a cross-State average of $0.21 PPY. The wide variation incosts reflects differences in both the process and the available information on costs.
Texas indicated that there were no incremental costs for this practice. The State explained that themajor activities that contributed to its process for limiting vendor payments—including the entry ofitem prices during food instrument processing, likely the largest cost component—have always beenin place and would occur even in the highly unlikely event that limits on item costs were lifted. Asnoted in chapter 2, monitoring of vendors with excessive prices is part of the estimated cost for usingprice data in vendor authorization in Texas.
The costs estimated for the use of price data to limit vendor payments fall into two categories, presentin varying degrees in the five States with estimated costs for this function. First, some States treatedsome or all of their costs for collecting, tabulating, and analyzing vendor prices as part of thisfunction, because this was the primary use of the price data. The five States reported administrativecosts as follows:
• In addition to vendor price survey costs, California’s cost for this function included timespent monitoring actual redemption costs relative to maximum prices, in order to ensurethat the maximum prices were neither too high nor too low.8
7 A recent FNS study estimated that overcharges account for 0.9 to 1.6 percent of WIC redemptions. Across all types oftransactions conducted for the study, vendors overcharged in 8.7 percent of transactions (FNS, 2001).
8 California was unable to estimate the costs for tracking dairy prices, updating maximum values for milk and dairy-combination food instruments, and disseminating this information to vendors.
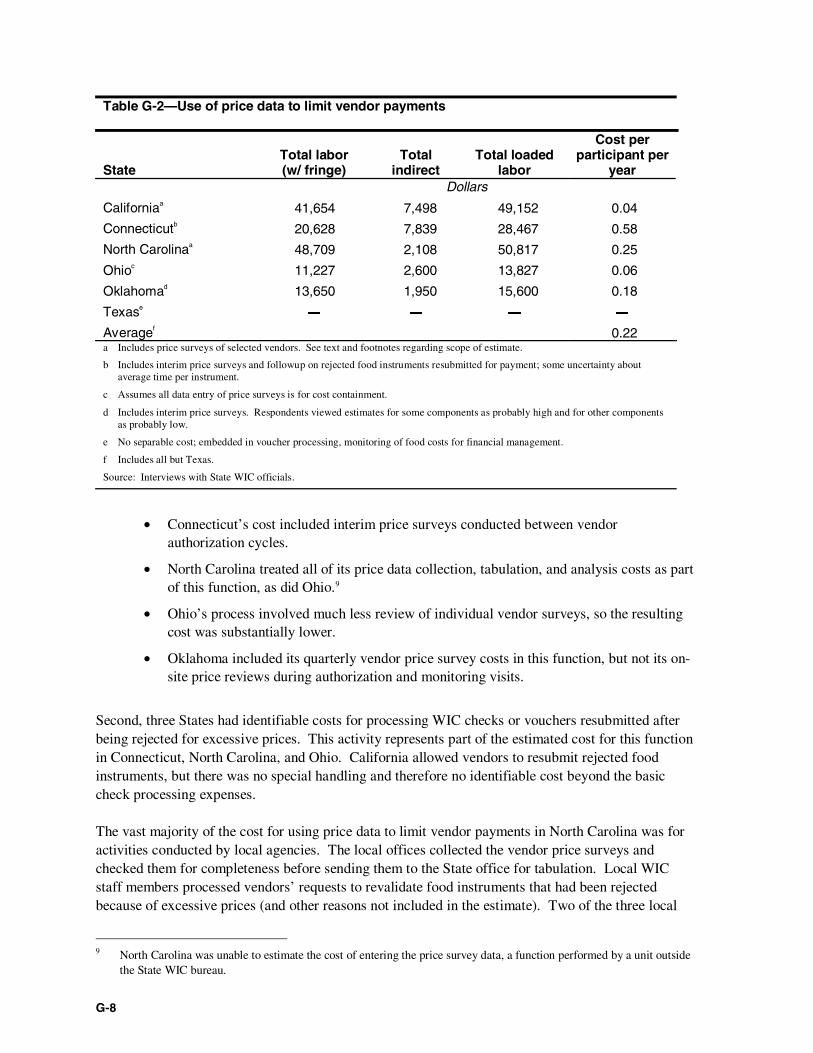
G-8
Table G-2—Use of price data to limit vendor payments
StateTotal labor(w/ fringe)
Totalindirect
Total loadedlabor
Cost perparticipant per
yearDollars
Californiaa 41,654 7,498 49,152 0.04
Connecticutb 20,628 7,839 28,467 0.58
North Carolinaa 48,709 2,108 50,817 0.25
Ohioc 11,227 2,600 13,827 0.06
Oklahomad 13,650 1,950 15,600 0.18
Texase― ― ― ―
Averagef 0.22a Includes price surveys of selected vendors. See text and footnotes regarding scope of estimate.
b Includes interim price surveys and followup on rejected food instruments resubmitted for payment; some uncertainty aboutaverage time per instrument.
c Assumes all data entry of price surveys is for cost containment.
d Includes interim price surveys. Respondents viewed estimates for some components as probably high and for other componentsas probably low.
e No separable cost; embedded in voucher processing, monitoring of food costs for financial management.
f Includes all but Texas.
Source: Interviews with State WIC officials.
• Connecticut’s cost included interim price surveys conducted between vendorauthorization cycles.
• North Carolina treated all of its price data collection, tabulation, and analysis costs as partof this function, as did Ohio.9
• Ohio’s process involved much less review of individual vendor surveys, so the resultingcost was substantially lower.
• Oklahoma included its quarterly vendor price survey costs in this function, but not its on-site price reviews during authorization and monitoring visits.
Second, three States had identifiable costs for processing WIC checks or vouchers resubmitted afterbeing rejected for excessive prices. This activity represents part of the estimated cost for this functionin Connecticut, North Carolina, and Ohio. California allowed vendors to resubmit rejected foodinstruments, but there was no special handling and therefore no identifiable cost beyond the basiccheck processing expenses.
The vast majority of the cost for using price data to limit vendor payments in North Carolina was foractivities conducted by local agencies. The local offices collected the vendor price surveys andchecked them for completeness before sending them to the State office for tabulation. Local WICstaff members processed vendors’ requests to revalidate food instruments that had been rejectedbecause of excessive prices (and other reasons not included in the estimate). Two of the three local
9 North Carolina was unable to estimate the cost of entering the price survey data, a function performed by a unit outsidethe State WIC bureau.
G-9
agency respondents gave cost data for these activities, and their estimates were similar ($.21 PPY and$.27 PPY). The third local agency was unable to provide cost data for these activities, so theunweighted average of the other two agencies was used.10 The cost for revalidating WIC foodinstruments could vary much more than indicated by the data, according to the State, because thevolume of requests varied a great deal. The State lacked precise data on this volume, so the estimatesrely on the very small sample of two local agencies.
In considering the cost estimates for limiting vendor payments by using price data, it is important torecognize that price surveys also serve as input for monitoring and projecting food package costs.Thus, a portion of these costs might be attributed to financial management objectives other than costcontainment. In addition, the initial process of setting maximum prices is more time consuming thanthe ongoing costs of maintaining this practice. After maximum prices have been established, theStates do not want to change them too often, because stable limits encourage vendors to keep pricesdown, but the States also recognize the need to respond when market prices rise (particularlywholesale costs). The initial costs could not be estimated, because all of the States had maintainedtheir maximum value systems for 5 or more years and because key ADP costs were embedded inthose of much larger WIC management information system projects. As with the cost-containmentcosts presented in appendix F, the costs in Connecticut are higher than in any of the other States, andthe reasons may include both real differences in cost structure and measurement error.
10 Weighting of local agency averages was not appropriate, given the sampling method used.

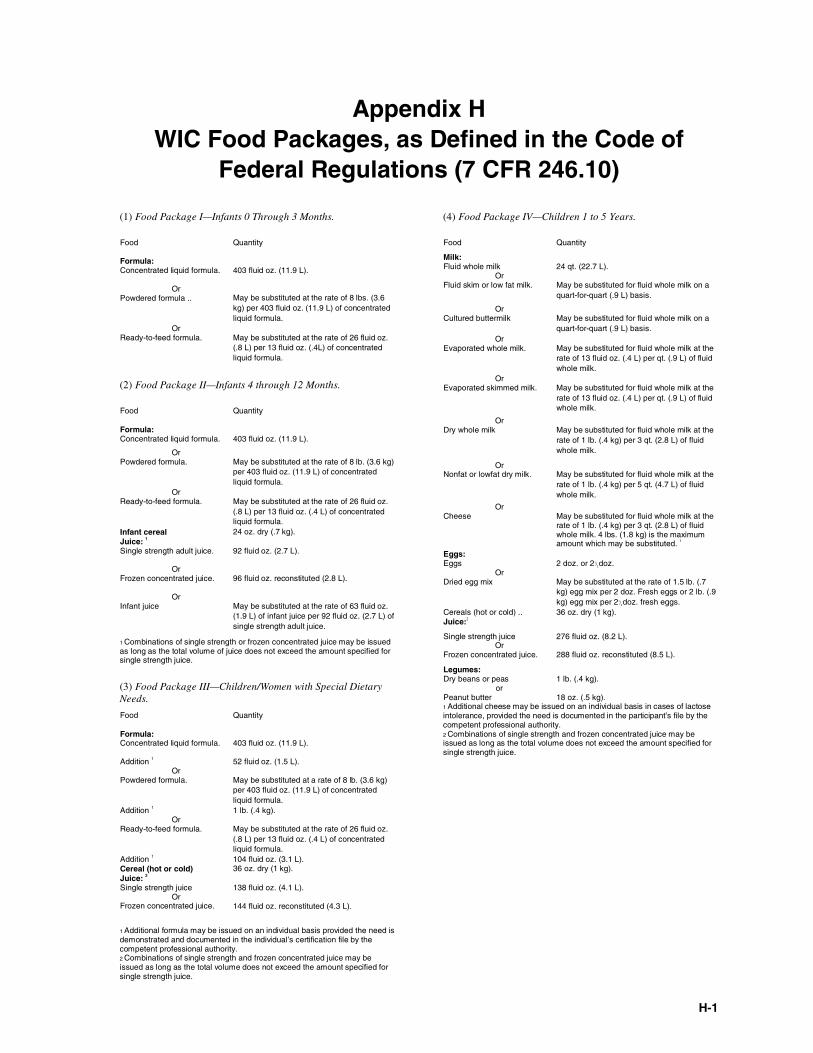
H-1
Appendix HWIC Food Packages, as Defined in the Code of
Federal Regulations (7 CFR 246.10)
(1) Food Package I—Infants 0 Through 3 Months.
Food Quantity
Formula:Concentrated liquid formula. 403 fluid oz. (11.9 L).
OrPowdered formula .. May be substituted at the rate of 8 lbs. (3.6
kg) per 403 fluid oz. (11.9 L) of concentratedliquid formula.
OrReady-to-feed formula. May be substituted at the rate of 26 fluid oz.
(.8 L) per 13 fluid oz. (.4L) of concentratedliquid formula.
(2) Food Package II—Infants 4 through 12 Months.
Food Quantity
Formula:Concentrated liquid formula. 403 fluid oz. (11.9 L).
OrPowdered formula. May be substituted at the rate of 8 lb. (3.6 kg)
per 403 fluid oz. (11.9 L) of concentratedliquid formula.
OrReady-to-feed formula. May be substituted at the rate of 26 fluid oz.
(.8 L) per 13 fluid oz. (.4 L) of concentratedliquid formula.
Infant cereal 24 oz. dry (.7 kg).Juice: 1
Single strength adult juice. 92 fluid oz. (2.7 L).
OrFrozen concentrated juice. 96 fluid oz. reconstituted (2.8 L).
OrInfant juice May be substituted at the rate of 63 fluid oz.
(1.9 L) of infant juice per 92 fluid oz. (2.7 L) ofsingle strength adult juice.
1 Combinations of single strength or frozen concentrated juice may be issuedas long as the total volume of juice does not exceed the amount specified forsingle strength juice.
(3) Food Package III—Children/Women with Special DietaryNeeds.
Food Quantity
Formula:Concentrated liquid formula. 403 fluid oz. (11.9 L).
Addition 1 52 fluid oz. (1.5 L).Or
Powdered formula. May be substituted at a rate of 8 lb. (3.6 kg)per 403 fluid oz. (11.9 L) of concentratedliquid formula.
Addition 1 1 lb. (.4 kg).Or
Ready-to-feed formula. May be substituted at the rate of 26 fluid oz.(.8 L) per 13 fluid oz. (.4 L) of concentratedliquid formula.
Addition 1 104 fluid oz. (3.1 L).Cereal (hot or cold) 36 oz. dry (1 kg).Juice: 2
Single strength juice 138 fluid oz. (4.1 L).Or
Frozen concentrated juice. 144 fluid oz. reconstituted (4.3 L).
1 Additional formula may be issued on an individual basis provided the need isdemonstrated and documented in the individual’s certification file by thecompetent professional authority.2 Combinations of single strength and frozen concentrated juice may beissued as long as the total volume does not exceed the amount specified forsingle strength juice.
(4) Food Package IV—Children 1 to 5 Years.
Food Quantity
Milk:Fluid whole milk 24 qt. (22.7 L).
OrFluid skim or low fat milk. May be substituted for fluid whole milk on a
quart-for-quart (.9 L) basis.
OrCultured buttermilk May be substituted for fluid whole milk on a
quart-for-quart (.9 L) basis.Or
Evaporated whole milk. May be substituted for fluid whole milk at therate of 13 fluid oz. (.4 L) per qt. (.9 L) of fluidwhole milk.
OrEvaporated skimmed milk. May be substituted for fluid whole milk at the
rate of 13 fluid oz. (.4 L) per qt. (.9 L) of fluidwhole milk.
OrDry whole milk May be substituted for fluid whole milk at the
rate of 1 lb. (.4 kg) per 3 qt. (2.8 L) of fluidwhole milk.
OrNonfat or lowfat dry milk. May be substituted for fluid whole milk at the
rate of 1 lb. (.4 kg) per 5 qt. (4.7 L) of fluidwhole milk.
OrCheese May be substituted for fluid whole milk at the
rate of 1 lb. (.4 kg) per 3 qt. (2.8 L) of fluidwhole milk. 4 lbs. (1.8 kg) is the maximumamount which may be substituted. 1
Eggs:Eggs 2 doz. or 21/2 doz.
OrDried egg mix May be substituted at the rate of 1.5 lb. (.7
kg) egg mix per 2 doz. Fresh eggs or 2 lb. (.9kg) egg mix per 21/2 doz. fresh eggs.
Cereals (hot or cold) .. 36 oz. dry (1 kg).Juice:2
Single strength juice 276 fluid oz. (8.2 L).Or
288 fluid oz. reconstituted (8.5 L).Frozen concentrated juice.
Legumes:Dry beans or peas 1 lb. (.4 kg).
orPeanut butter 18 oz. (.5 kg).1 Additional cheese may be issued on an individual basis in cases of lactoseintolerance, provided the need is documented in the participant’s file by thecompetent professional authority.2 Combinations of single strength and frozen concentrated juice may beissued as long as the total volume does not exceed the amount specified forsingle strength juice.
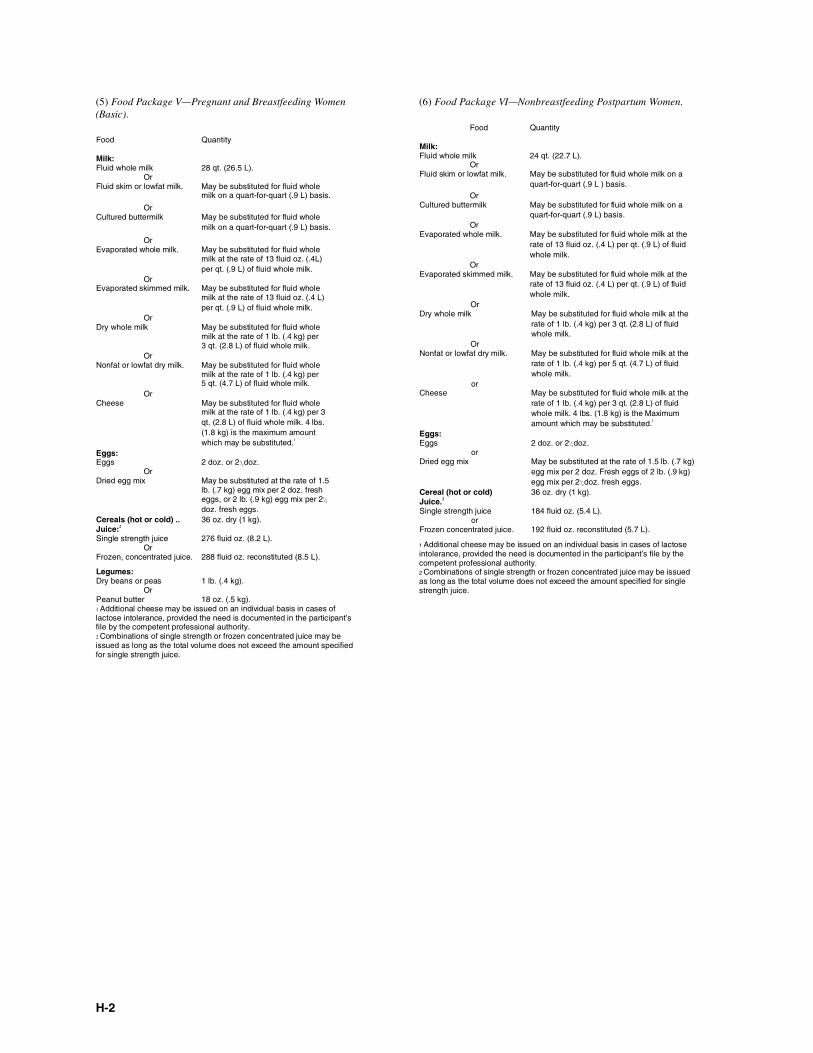
H-2
(5) Food Package V—Pregnant and Breastfeeding Women(Basic).
Food Quantity
Milk:Fluid whole milk 28 qt. (26.5 L).
OrFluid skim or lowfat milk. May be substituted for fluid whole
milk on a quart-for-quart (.9 L) basis.
OrCultured buttermilk May be substituted for fluid whole
milk on a quart-for-quart (.9 L) basis.
OrEvaporated whole milk. May be substituted for fluid whole
milk at the rate of 13 fluid oz. (.4L)per qt. (.9 L) of fluid whole milk.
OrEvaporated skimmed milk. May be substituted for fluid whole
milk at the rate of 13 fluid oz. (.4 L)per qt. (.9 L) of fluid whole milk.
OrDry whole milk May be substituted for fluid whole
milk at the rate of 1 lb. (.4 kg) per3 qt. (2.8 L) of fluid whole milk.
OrNonfat or lowfat dry milk. May be substituted for fluid whole
milk at the rate of 1 lb. (.4 kg) per5 qt. (4.7 L) of fluid whole milk.
OrCheese May be substituted for fluid whole
milk at the rate of 1 lb. (.4 kg) per 3qt. (2.8 L) of fluid whole milk. 4 lbs.(1.8 kg) is the maximum amountwhich may be substituted.1
Eggs:Eggs 2 doz. or 21/2 doz.
OrDried egg mix May be substituted at the rate of 1.5
lb. (.7 kg) egg mix per 2 doz. fresheggs, or 2 lb. (.9 kg) egg mix per 21/2
doz. fresh eggs.Cereals (hot or cold) .. 36 oz. dry (1 kg).Juice:2
Single strength juice 276 fluid oz. (8.2 L).Or
288 fluid oz. reconstituted (8.5 L).Frozen, concentrated juice.
Legumes:Dry beans or peas 1 lb. (.4 kg).
OrPeanut butter 18 oz. (.5 kg).1 Additional cheese may be issued on an individual basis in cases oflactose intolerance, provided the need is documented in the participant’sfile by the competent professional authority.2 Combinations of single strength or frozen concentrated juice may beissued as long as the total volume does not exceed the amount specifiedfor single strength juice.
(6) Food Package VI—Nonbreastfeeding Postpartum Women.
Food Quantity
Milk:Fluid whole milk 24 qt. (22.7 L).
OrFluid skim or lowfat milk. May be substituted for fluid whole milk on a
quart-for-quart (.9 L ) basis.Or
Cultured buttermilk May be substituted for fluid whole milk on aquart-for-quart (.9 L) basis.
OrEvaporated whole milk. May be substituted for fluid whole milk at the
rate of 13 fluid oz. (.4 L) per qt. (.9 L) of fluidwhole milk.
OrEvaporated skimmed milk. May be substituted for fluid whole milk at the
rate of 13 fluid oz. (.4 L) per qt. (.9 L) of fluidwhole milk.
OrDry whole milk May be substituted for fluid whole milk at the
rate of 1 lb. (.4 kg) per 3 qt. (2.8 L) of fluidwhole milk.
OrNonfat or lowfat dry milk. May be substituted for fluid whole milk at the
rate of 1 lb. (.4 kg) per 5 qt. (4.7 L) of fluidwhole milk.
orCheese May be substituted for fluid whole milk at the
rate of 1 lb. (.4 kg) per 3 qt. (2.8 L) of fluidwhole milk. 4 lbs. (1.8 kg) is the Maximumamount which may be substituted.1
Eggs:Eggs 2 doz. or 21/2 doz.
orDried egg mix May be substituted at the rate of 1.5 lb. (.7 kg)
egg mix per 2 doz. Fresh eggs of 2 lb. (.9 kg)egg mix per 21/2 doz. fresh eggs.
Cereal (hot or cold) 36 oz. dry (1 kg).Juice.2
Single strength juice 184 fluid oz. (5.4 L).or
Frozen concentrated juice. 192 fluid oz. reconstituted (5.7 L).
1 Additional cheese may be issued on an individual basis in cases of lactoseintolerance, provided the need is documented in the participant’s file by thecompetent professional authority.2 Combinations of single strength or frozen concentrated juice may be issuedas long as the total volume does not exceed the amount specified for singlestrength juice.
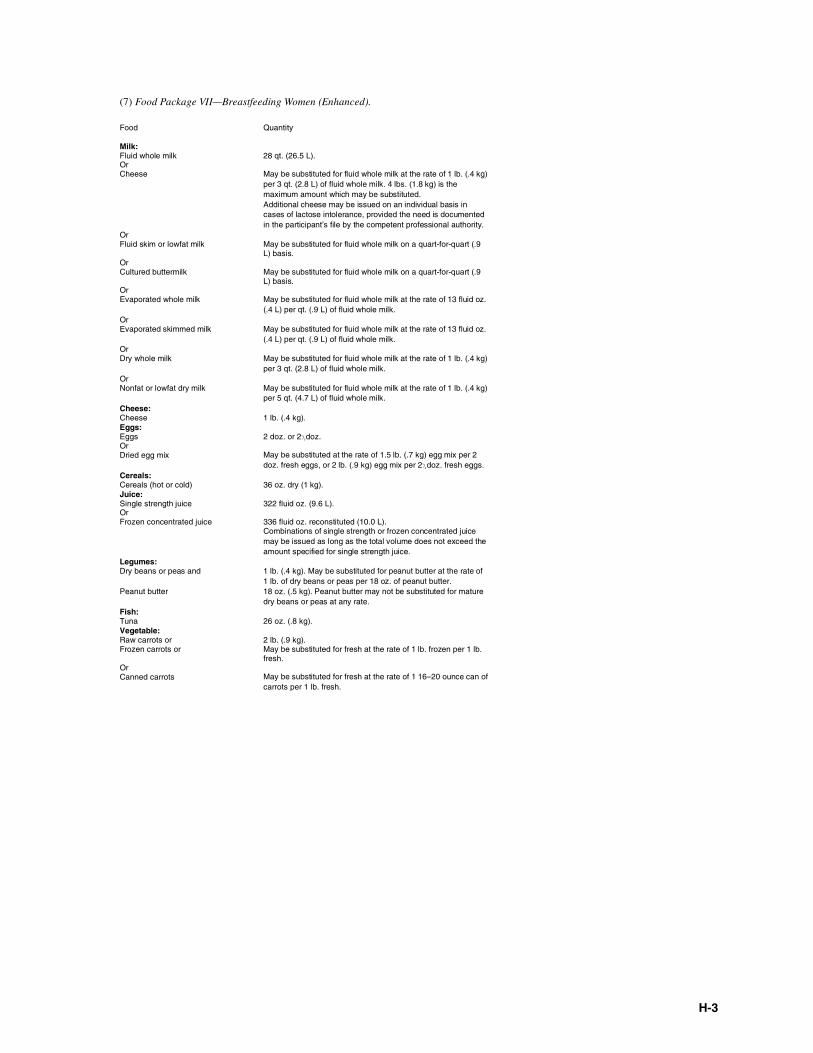
H-3
(7) Food Package VII—Breastfeeding Women (Enhanced).
Food Quantity
Milk:Fluid whole milk 28 qt. (26.5 L).Or
May be substituted for fluid whole milk at the rate of 1 lb. (.4 kg)per 3 qt. (2.8 L) of fluid whole milk. 4 lbs. (1.8 kg) is themaximum amount which may be substituted.
Cheese
Additional cheese may be issued on an individual basis incases of lactose intolerance, provided the need is documentedin the participant’s file by the competent professional authority.
OrFluid skim or lowfat milk May be substituted for fluid whole milk on a quart-for-quart (.9
L) basis.OrCultured buttermilk May be substituted for fluid whole milk on a quart-for-quart (.9
L) basis.OrEvaporated whole milk May be substituted for fluid whole milk at the rate of 13 fluid oz.
(.4 L) per qt. (.9 L) of fluid whole milk.OrEvaporated skimmed milk May be substituted for fluid whole milk at the rate of 13 fluid oz.
(.4 L) per qt. (.9 L) of fluid whole milk.OrDry whole milk May be substituted for fluid whole milk at the rate of 1 lb. (.4 kg)
per 3 qt. (2.8 L) of fluid whole milk.OrNonfat or lowfat dry milk May be substituted for fluid whole milk at the rate of 1 lb. (.4 kg)
per 5 qt. (4.7 L) of fluid whole milk.Cheese:Cheese 1 lb. (.4 kg).Eggs:Eggs 2 doz. or 21/2 doz.OrDried egg mix May be substituted at the rate of 1.5 lb. (.7 kg) egg mix per 2
doz. fresh eggs, or 2 lb. (.9 kg) egg mix per 21/2 doz. fresh eggs.Cereals:Cereals (hot or cold) 36 oz. dry (1 kg).Juice:Single strength juice 322 fluid oz. (9.6 L).Or
336 fluid oz. reconstituted (10.0 L).Frozen concentrated juiceCombinations of single strength or frozen concentrated juicemay be issued as long as the total volume does not exceed theamount specified for single strength juice.
Legumes:Dry beans or peas and 1 lb. (.4 kg). May be substituted for peanut butter at the rate of
1 lb. of dry beans or peas per 18 oz. of peanut butter.Peanut butter 18 oz. (.5 kg). Peanut butter may not be substituted for mature
dry beans or peas at any rate.Fish:Tuna 26 oz. (.8 kg).Vegetable:Raw carrots or 2 lb. (.9 kg).Frozen carrots or May be substituted for fresh at the rate of 1 lb. frozen per 1 lb.
fresh.OrCanned carrots May be substituted for fresh at the rate of 1 16–20 ounce can of
carrots per 1 lb. fresh.

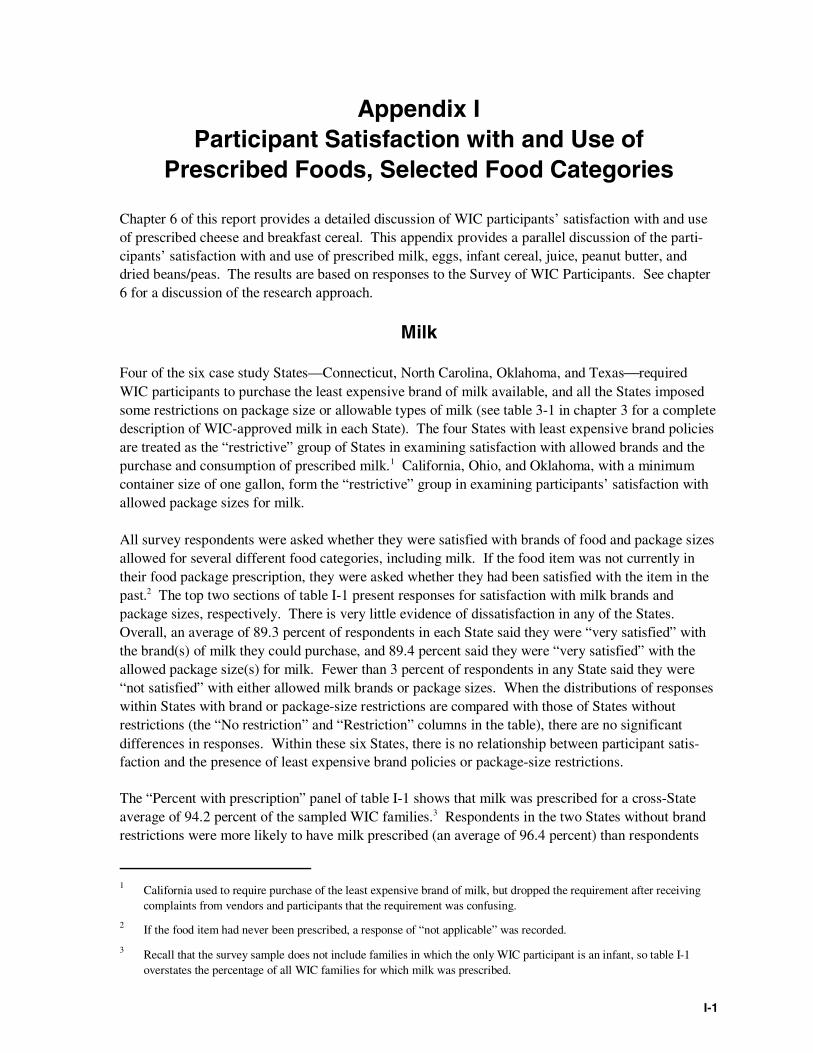
I-1
Appendix IParticipant Satisfaction with and Use of
Prescribed Foods, Selected Food Categories
Chapter 6 of this report provides a detailed discussion of WIC participants’ satisfaction with and useof prescribed cheese and breakfast cereal. This appendix provides a parallel discussion of the parti-cipants’ satisfaction with and use of prescribed milk, eggs, infant cereal, juice, peanut butter, anddried beans/peas. The results are based on responses to the Survey of WIC Participants. See chapter6 for a discussion of the research approach.
Milk
Four of the six case study States—Connecticut, North Carolina, Oklahoma, and TexasrequiredWIC participants to purchase the least expensive brand of milk available, and all the States imposedsome restrictions on package size or allowable types of milk (see table 3-1 in chapter 3 for a completedescription of WIC-approved milk in each State). The four States with least expensive brand policiesare treated as the “restrictive” group of States in examining satisfaction with allowed brands and thepurchase and consumption of prescribed milk.1 California, Ohio, and Oklahoma, with a minimumcontainer size of one gallon, form the “restrictive” group in examining participants’ satisfaction withallowed package sizes for milk.
All survey respondents were asked whether they were satisfied with brands of food and package sizesallowed for several different food categories, including milk. If the food item was not currently intheir food package prescription, they were asked whether they had been satisfied with the item in thepast.2 The top two sections of table I-1 present responses for satisfaction with milk brands andpackage sizes, respectively. There is very little evidence of dissatisfaction in any of the States.Overall, an average of 89.3 percent of respondents in each State said they were “very satisfied” withthe brand(s) of milk they could purchase, and 89.4 percent said they were “very satisfied” with theallowed package size(s) for milk. Fewer than 3 percent of respondents in any State said they were“not satisfied” with either allowed milk brands or package sizes. When the distributions of responseswithin States with brand or package-size restrictions are compared with those of States withoutrestrictions (the “No restriction” and “Restriction” columns in the table), there are no significantdifferences in responses. Within these six States, there is no relationship between participant satis-faction and the presence of least expensive brand policies or package-size restrictions.
The “Percent with prescription” panel of table I-1 shows that milk was prescribed for a cross-Stateaverage of 94.2 percent of the sampled WIC families.3 Respondents in the two States without brandrestrictions were more likely to have milk prescribed (an average of 96.4 percent) than respondents
1 California used to require purchase of the least expensive brand of milk, but dropped the requirement after receivingcomplaints from vendors and participants that the requirement was confusing.
2 If the food item had never been prescribed, a response of “not applicable” was recorded.
3 Recall that the survey sample does not include families in which the only WIC participant is an infant, so table I-1overstates the percentage of all WIC families for which milk was prescribed.
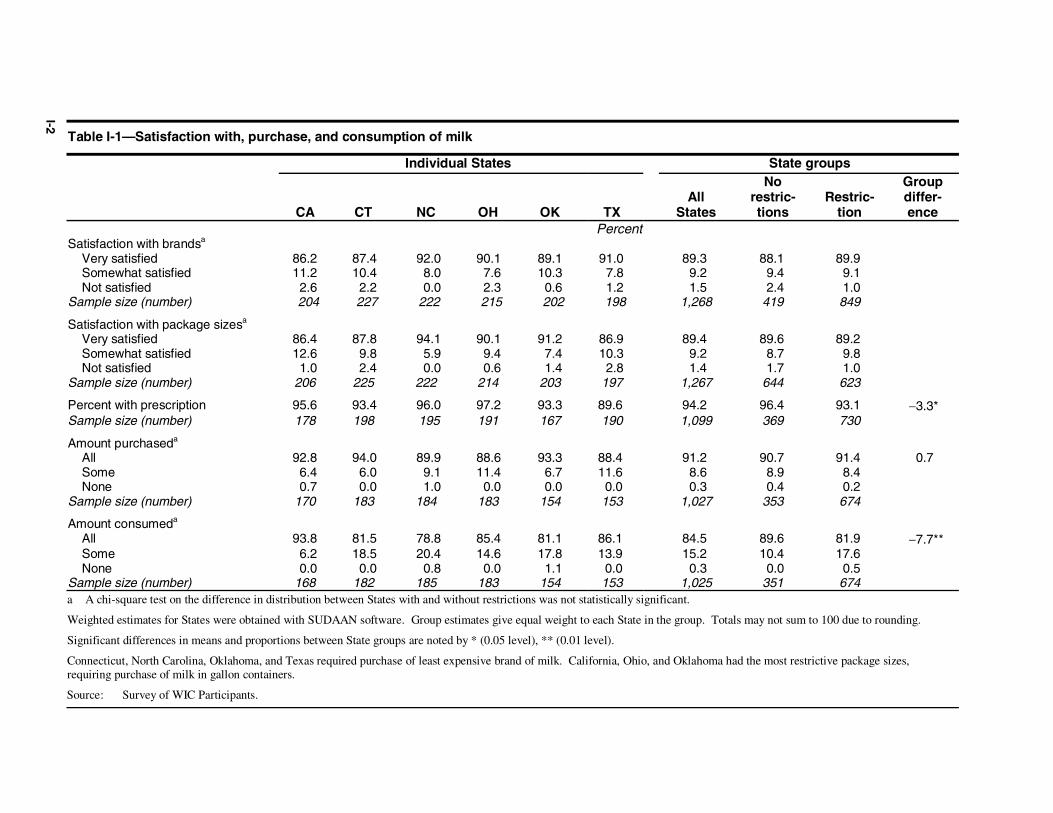
I-2
Table I-1—Satisfaction with, purchase, and consumption of milk
Individual States State groups
CA CT NC OH OK TXAll
States
Norestric-tions
Restric-tion
Groupdiffer-ence
PercentSatisfaction with brandsa
Very satisfied 86.2 87.4 92.0 90.1 89.1 91.0 89.3 88.1 89.9Somewhat satisfied 11.2 10.4 8.0 7.6 10.3 7.8 9.2 9.4 9.1Not satisfied 2.6 2.2 0.0 2.3 0.6 1.2 1.5 2.4 1.0
Sample size (number) 204 227 222 215 202 198 1,268 419 849
Satisfaction with package sizesa
Very satisfied 86.4 87.8 94.1 90.1 91.2 86.9 89.4 89.6 89.2Somewhat satisfied 12.6 9.8 5.9 9.4 7.4 10.3 9.2 8.7 9.8Not satisfied 1.0 2.4 0.0 0.6 1.4 2.8 1.4 1.7 1.0
Sample size (number) 206 225 222 214 203 197 1,267 644 623
Percent with prescription 95.6 93.4 96.0 97.2 93.3 89.6 94.2 96.4 93.1 −3.3*Sample size (number) 178 198 195 191 167 190 1,099 369 730
Amount purchaseda
All 92.8 94.0 89.9 88.6 93.3 88.4 91.2 90.7 91.4 0.7Some 6.4 6.0 9.1 11.4 6.7 11.6 8.6 8.9 8.4None 0.7 0.0 1.0 0.0 0.0 0.0 0.3 0.4 0.2
Sample size (number) 170 183 184 183 154 153 1,027 353 674
Amount consumeda
All 93.8 81.5 78.8 85.4 81.1 86.1 84.5 89.6 81.9 −7.7**Some 6.2 18.5 20.4 14.6 17.8 13.9 15.2 10.4 17.6None 0.0 0.0 0.8 0.0 1.1 0.0 0.3 0.0 0.5
Sample size (number) 168 182 185 183 154 153 1,025 351 674a A chi-square test on the difference in distribution between States with and without restrictions was not statistically significant.
Weighted estimates for States were obtained with SUDAAN software. Group estimates give equal weight to each State in the group. Totals may not sum to 100 due to rounding.
Significant differences in means and proportions between State groups are noted by * (0.05 level), ** (0.01 level).
Connecticut, North Carolina, Oklahoma, and Texas required purchase of least expensive brand of milk. California, Ohio, and Oklahoma had the most restrictive package sizes,requiring purchase of milk in gallon containers.
Source: Survey of WIC Participants.
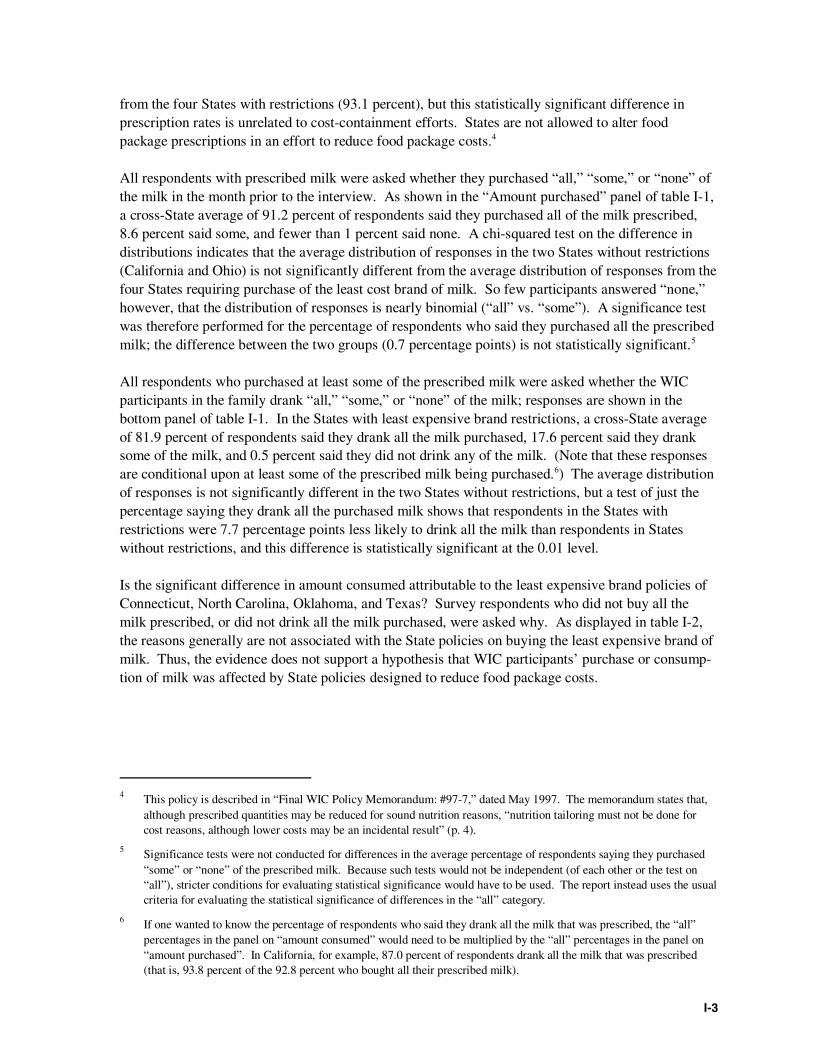
I-3
from the four States with restrictions (93.1 percent), but this statistically significant difference inprescription rates is unrelated to cost-containment efforts. States are not allowed to alter foodpackage prescriptions in an effort to reduce food package costs.4
All respondents with prescribed milk were asked whether they purchased “all,” “some,” or “none” ofthe milk in the month prior to the interview. As shown in the “Amount purchased” panel of table I-1,a cross-State average of 91.2 percent of respondents said they purchased all of the milk prescribed,8.6 percent said some, and fewer than 1 percent said none. A chi-squared test on the difference indistributions indicates that the average distribution of responses in the two States without restrictions(California and Ohio) is not significantly different from the average distribution of responses from thefour States requiring purchase of the least cost brand of milk. So few participants answered “none,”however, that the distribution of responses is nearly binomial (“all” vs. “some”). A significance testwas therefore performed for the percentage of respondents who said they purchased all the prescribedmilk; the difference between the two groups (0.7 percentage points) is not statistically significant.5
All respondents who purchased at least some of the prescribed milk were asked whether the WICparticipants in the family drank “all,” “some,” or “none” of the milk; responses are shown in thebottom panel of table I-1. In the States with least expensive brand restrictions, a cross-State averageof 81.9 percent of respondents said they drank all the milk purchased, 17.6 percent said they dranksome of the milk, and 0.5 percent said they did not drink any of the milk. (Note that these responsesare conditional upon at least some of the prescribed milk being purchased.6) The average distributionof responses is not significantly different in the two States without restrictions, but a test of just thepercentage saying they drank all the purchased milk shows that respondents in the States withrestrictions were 7.7 percentage points less likely to drink all the milk than respondents in Stateswithout restrictions, and this difference is statistically significant at the 0.01 level.
Is the significant difference in amount consumed attributable to the least expensive brand policies ofConnecticut, North Carolina, Oklahoma, and Texas? Survey respondents who did not buy all themilk prescribed, or did not drink all the milk purchased, were asked why. As displayed in table I-2,the reasons generally are not associated with the State policies on buying the least expensive brand ofmilk. Thus, the evidence does not support a hypothesis that WIC participants’ purchase or consump-tion of milk was affected by State policies designed to reduce food package costs.
4 This policy is described in “Final WIC Policy Memorandum: #97-7,” dated May 1997. The memorandum states that,although prescribed quantities may be reduced for sound nutrition reasons, “nutrition tailoring must not be done forcost reasons, although lower costs may be an incidental result” (p. 4).
5 Significance tests were not conducted for differences in the average percentage of respondents saying they purchased“some” or “none” of the prescribed milk. Because such tests would not be independent (of each other or the test on“all”), stricter conditions for evaluating statistical significance would have to be used. The report instead uses the usualcriteria for evaluating the statistical significance of differences in the “all” category.
6 If one wanted to know the percentage of respondents who said they drank all the milk that was prescribed, the “all”percentages in the panel on “amount consumed” would need to be multiplied by the “all” percentages in the panel on“amount purchased”. In California, for example, 87.0 percent of respondents drank all the milk that was prescribed(that is, 93.8 percent of the 92.8 percent who bought all their prescribed milk).
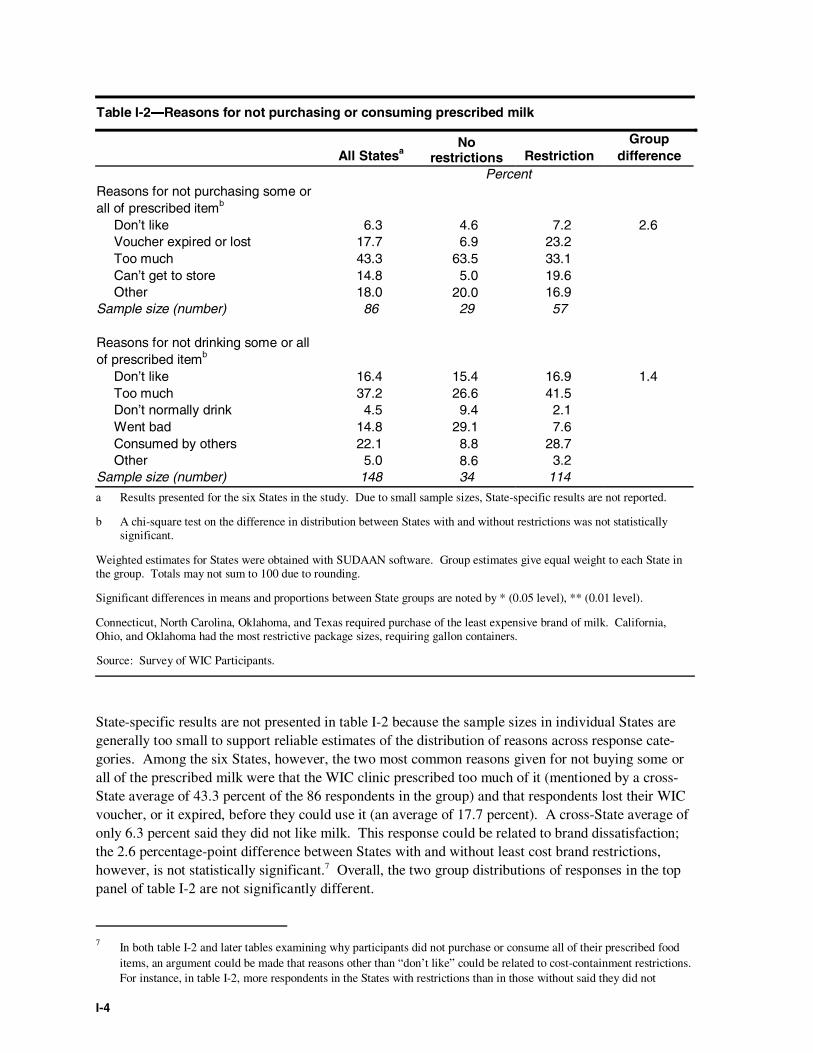
I-4
Table I-2―Reasons for not purchasing or consuming prescribed milk
All StatesaNo
restrictions RestrictionGroup
differencePercent
Reasons for not purchasing some orall of prescribed itemb
Don’t like 6.3 4.6 7.2 2.6Voucher expired or lost 17.7 6.9 23.2Too much 43.3 63.5 33.1Can’t get to store 14.8 5.0 19.6Other 18.0 20.0 16.9
Sample size (number) 86 29 57
Reasons for not drinking some or allof prescribed itemb
Don’t like 16.4 15.4 16.9 1.4Too much 37.2 26.6 41.5Don’t normally drink 4.5 9.4 2.1Went bad 14.8 29.1 7.6Consumed by others 22.1 8.8 28.7Other 5.0 8.6 3.2
Sample size (number) 148 34 114
a Results presented for the six States in the study. Due to small sample sizes, State-specific results are not reported.
b A chi-square test on the difference in distribution between States with and without restrictions was not statisticallysignificant.
Weighted estimates for States were obtained with SUDAAN software. Group estimates give equal weight to each State inthe group. Totals may not sum to 100 due to rounding.
Significant differences in means and proportions between State groups are noted by * (0.05 level), ** (0.01 level).
Connecticut, North Carolina, Oklahoma, and Texas required purchase of the least expensive brand of milk. California,Ohio, and Oklahoma had the most restrictive package sizes, requiring gallon containers.
Source: Survey of WIC Participants.
State-specific results are not presented in table I-2 because the sample sizes in individual States aregenerally too small to support reliable estimates of the distribution of reasons across response cate-gories. Among the six States, however, the two most common reasons given for not buying some orall of the prescribed milk were that the WIC clinic prescribed too much of it (mentioned by a cross-State average of 43.3 percent of the 86 respondents in the group) and that respondents lost their WICvoucher, or it expired, before they could use it (an average of 17.7 percent). A cross-State average ofonly 6.3 percent said they did not like milk. This response could be related to brand dissatisfaction;the 2.6 percentage-point difference between States with and without least cost brand restrictions,however, is not statistically significant.7 Overall, the two group distributions of responses in the toppanel of table I-2 are not significantly different.
7 In both table I-2 and later tables examining why participants did not purchase or consume all of their prescribed fooditems, an argument could be made that reasons other than “don’t like” could be related to cost-containment restrictions.For instance, in table I-2, more respondents in the States with restrictions than in those without said they did not
I-5
When asked why they did not drink some or all of the purchased milk (the bottom panel of table I-2),a cross-State average of 16.4 percent said they did not like the milk. The 1.4 percentage-point differ-ence between the two groups of States is not significantly different from zero. The most commonreasons cited for not drinking purchased milk were that too much was prescribed (a cross-Stateaverage of 37.2 percent), and that non-WIC members of the family consumed the milk (an average of22.1 percent).8 The group distributions are not significantly different from one another.
Eggs
The six States varied somewhat in the restrictions they imposed on eggs. North Carolina was the onlyState to allow purchase of brown as well as white eggs, but it allowed only Grade A eggs, whereas theother States were either less restrictive on grade or allowed Grade AA eggs. The States also differedin which size eggs could be purchased, with Ohio being the least restrictive and Connecticut the most.Two States—Connecticut and Oklahoma—required WIC participants to purchase the least expensivebrand of eggs available in the store. For examining the effects of cost-containment practices, tablesI-3 and I-4 focus on the impacts of imposing least expensive brand provisions on eggs.
An average of 92.4 percent of survey respondents in the six States had eggs included in their WICprescriptions (table I-3). A cross-State average of 95.5 percent of these respondents said theypurchased all the eggs included in their food package, with less than 1 percent saying that they did notpurchase any. There is no significant difference in the distribution of amount purchased betweenStates with and without least expensive brand restrictions.
Among those respondents who purchased at least some of their prescribed eggs, an average of 79.0percent said they ate all they purchased. A cross-State average of 20.5 percent said they ate some ofthe eggs. The overall average distribution of amount consumed within States without least costrestrictions is not significantly different from the average distribution for the States with restrictions.The 12.5 percentage-point difference in respondents saying they ate all of the eggs, however, issignificant at the 0.01 level.
purchase all their milk because their voucher expired or was lost. If participants did not like the available choices of aparticular food item, they could simply have let their vouchers expire (or not tried to get to the store, or let non-WICfamily members consume the item, or taken any number of actions). In this situation the study would be underesti-mating the impact of the restrictions on purchasing behavior. Given that the survey asked for the main reason theprescribed item was not bought, however, “don’t like” seems a more straightforward measure of reasons related to cost-containment restrictions. That is, if a participant did not buy a prescribed item because she did not like the availablechoices, it was simpler for her to say she did not like the item than to provide another reason not directly related topreferences.
8 California officials report that the complaints they receive about “too much” milk involve prescriptions for youngtoddlers. Mothers say that these children cannot finish the milk before it spoils.
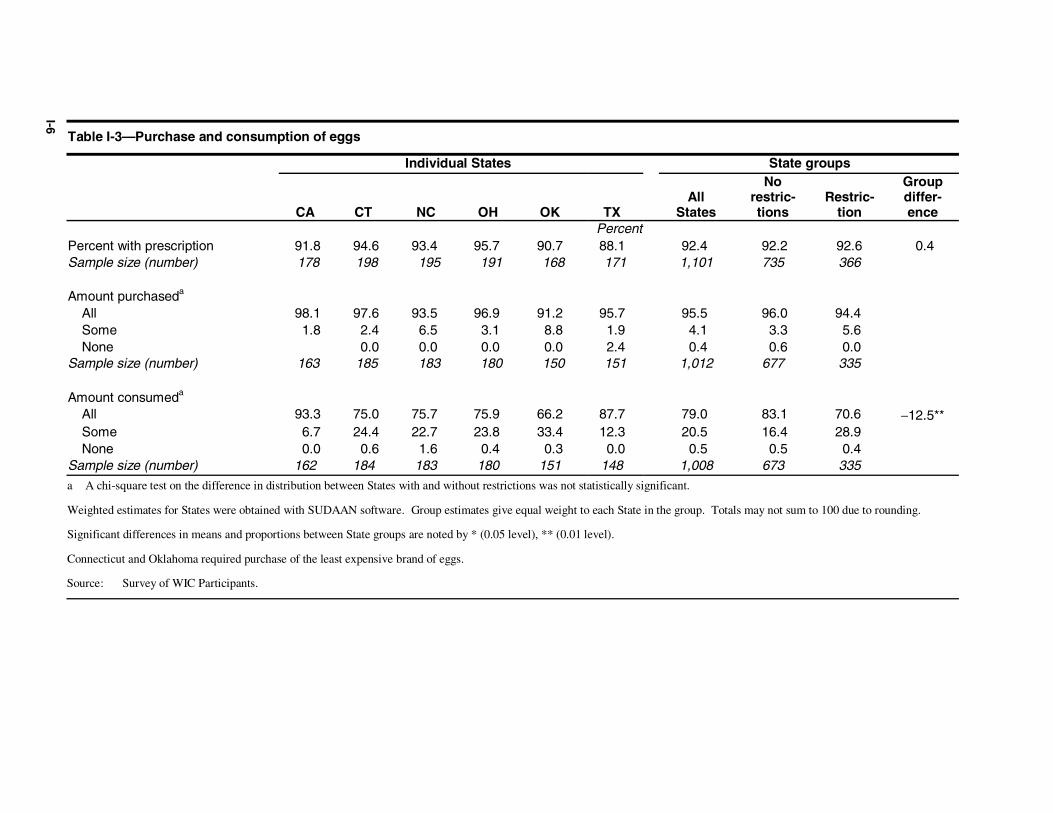
I-6
Table I-3—Purchase and consumption of eggs
Individual States State groups
CA CT NC OH OK TXAll
States
Norestric-tions
Restric-tion
Groupdiffer-ence
PercentPercent with prescription 91.8 94.6 93.4 95.7 90.7 88.1 92.4 92.2 92.6 0.4Sample size (number) 178 198 195 191 168 171 1,101 735 366
Amount purchaseda
All 98.1 97.6 93.5 96.9 91.2 95.7 95.5 96.0 94.4Some 1.8 2.4 6.5 3.1 8.8 1.9 4.1 3.3 5.6None 0.0 0.0 0.0 0.0 2.4 0.4 0.6 0.0
Sample size (number) 163 185 183 180 150 151 1,012 677 335
Amount consumeda
All 93.3 75.0 75.7 75.9 66.2 87.7 79.0 83.1 70.6 −12.5**Some 6.7 24.4 22.7 23.8 33.4 12.3 20.5 16.4 28.9None 0.0 0.6 1.6 0.4 0.3 0.0 0.5 0.5 0.4
Sample size (number) 162 184 183 180 151 148 1,008 673 335
a A chi-square test on the difference in distribution between States with and without restrictions was not statistically significant.
Weighted estimates for States were obtained with SUDAAN software. Group estimates give equal weight to each State in the group. Totals may not sum to 100 due to rounding.
Significant differences in means and proportions between State groups are noted by * (0.05 level), ** (0.01 level).
Connecticut and Oklahoma required purchase of the least expensive brand of eggs.
Source: Survey of WIC Participants.
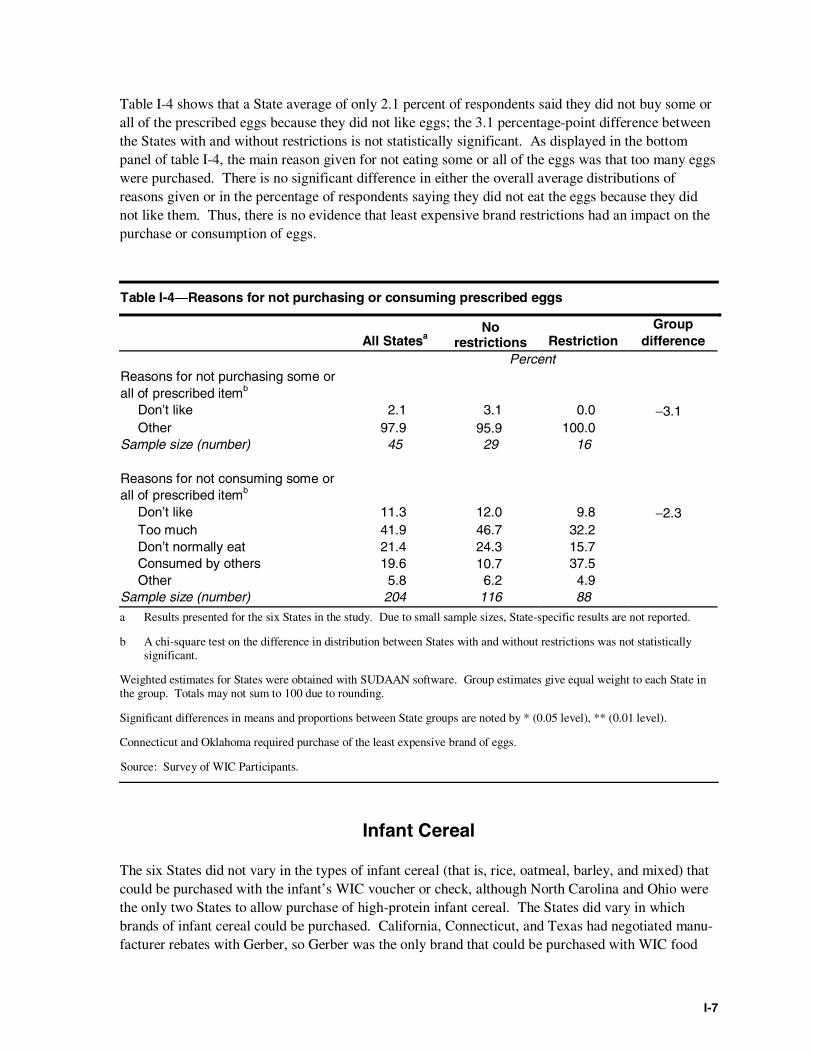
I-7
Table I-4 shows that a State average of only 2.1 percent of respondents said they did not buy some orall of the prescribed eggs because they did not like eggs; the 3.1 percentage-point difference betweenthe States with and without restrictions is not statistically significant. As displayed in the bottompanel of table I-4, the main reason given for not eating some or all of the eggs was that too many eggswere purchased. There is no significant difference in either the overall average distributions ofreasons given or in the percentage of respondents saying they did not eat the eggs because they didnot like them. Thus, there is no evidence that least expensive brand restrictions had an impact on thepurchase or consumption of eggs.
Table I-4―Reasons for not purchasing or consuming prescribed eggs
All StatesaNo
restrictions RestrictionGroup
differencePercent
Reasons for not purchasing some orall of prescribed itemb
Don’t like 2.1 3.1 0.0 −3.1Other 97.9 95.9 100.0
Sample size (number) 45 29 16
Reasons for not consuming some orall of prescribed itemb
Don’t like 11.3 12.0 9.8 −2.3Too much 41.9 46.7 32.2Don’t normally eat 21.4 24.3 15.7Consumed by others 19.6 10.7 37.5Other 5.8 6.2 4.9
Sample size (number) 204 116 88
a Results presented for the six States in the study. Due to small sample sizes, State-specific results are not reported.
b A chi-square test on the difference in distribution between States with and without restrictions was not statisticallysignificant.
Weighted estimates for States were obtained with SUDAAN software. Group estimates give equal weight to each State inthe group. Totals may not sum to 100 due to rounding.
Significant differences in means and proportions between State groups are noted by * (0.05 level), ** (0.01 level).
Connecticut and Oklahoma required purchase of the least expensive brand of eggs.
Source: Survey of WIC Participants.
Infant Cereal
The six States did not vary in the types of infant cereal (that is, rice, oatmeal, barley, and mixed) thatcould be purchased with the infant’s WIC voucher or check, although North Carolina and Ohio werethe only two States to allow purchase of high-protein infant cereal. The States did vary in whichbrands of infant cereal could be purchased. California, Connecticut, and Texas had negotiated manu-facturer rebates with Gerber, so Gerber was the only brand that could be purchased with WIC food
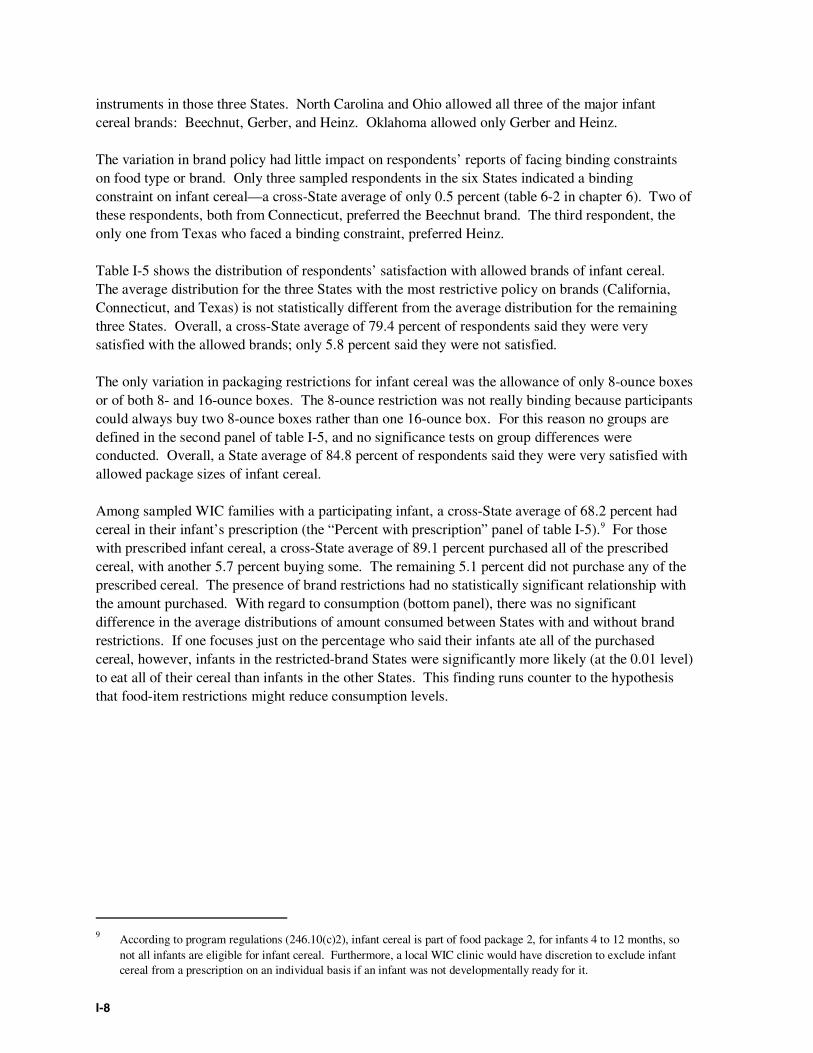
I-8
instruments in those three States. North Carolina and Ohio allowed all three of the major infantcereal brands: Beechnut, Gerber, and Heinz. Oklahoma allowed only Gerber and Heinz.
The variation in brand policy had little impact on respondents’ reports of facing binding constraintson food type or brand. Only three sampled respondents in the six States indicated a bindingconstraint on infant cereal—a cross-State average of only 0.5 percent (table 6-2 in chapter 6). Two ofthese respondents, both from Connecticut, preferred the Beechnut brand. The third respondent, theonly one from Texas who faced a binding constraint, preferred Heinz.
Table I-5 shows the distribution of respondents’ satisfaction with allowed brands of infant cereal.The average distribution for the three States with the most restrictive policy on brands (California,Connecticut, and Texas) is not statistically different from the average distribution for the remainingthree States. Overall, a cross-State average of 79.4 percent of respondents said they were verysatisfied with the allowed brands; only 5.8 percent said they were not satisfied.
The only variation in packaging restrictions for infant cereal was the allowance of only 8-ounce boxesor of both 8- and 16-ounce boxes. The 8-ounce restriction was not really binding because participantscould always buy two 8-ounce boxes rather than one 16-ounce box. For this reason no groups aredefined in the second panel of table I-5, and no significance tests on group differences wereconducted. Overall, a State average of 84.8 percent of respondents said they were very satisfied withallowed package sizes of infant cereal.
Among sampled WIC families with a participating infant, a cross-State average of 68.2 percent hadcereal in their infant’s prescription (the “Percent with prescription” panel of table I-5).9 For thosewith prescribed infant cereal, a cross-State average of 89.1 percent purchased all of the prescribedcereal, with another 5.7 percent buying some. The remaining 5.1 percent did not purchase any of theprescribed cereal. The presence of brand restrictions had no statistically significant relationship withthe amount purchased. With regard to consumption (bottom panel), there was no significantdifference in the average distributions of amount consumed between States with and without brandrestrictions. If one focuses just on the percentage who said their infants ate all of the purchasedcereal, however, infants in the restricted-brand States were significantly more likely (at the 0.01 level)to eat all of their cereal than infants in the other States. This finding runs counter to the hypothesisthat food-item restrictions might reduce consumption levels.
9 According to program regulations (246.10(c)2), infant cereal is part of food package 2, for infants 4 to 12 months, sonot all infants are eligible for infant cereal. Furthermore, a local WIC clinic would have discretion to exclude infantcereal from a prescription on an individual basis if an infant was not developmentally ready for it.
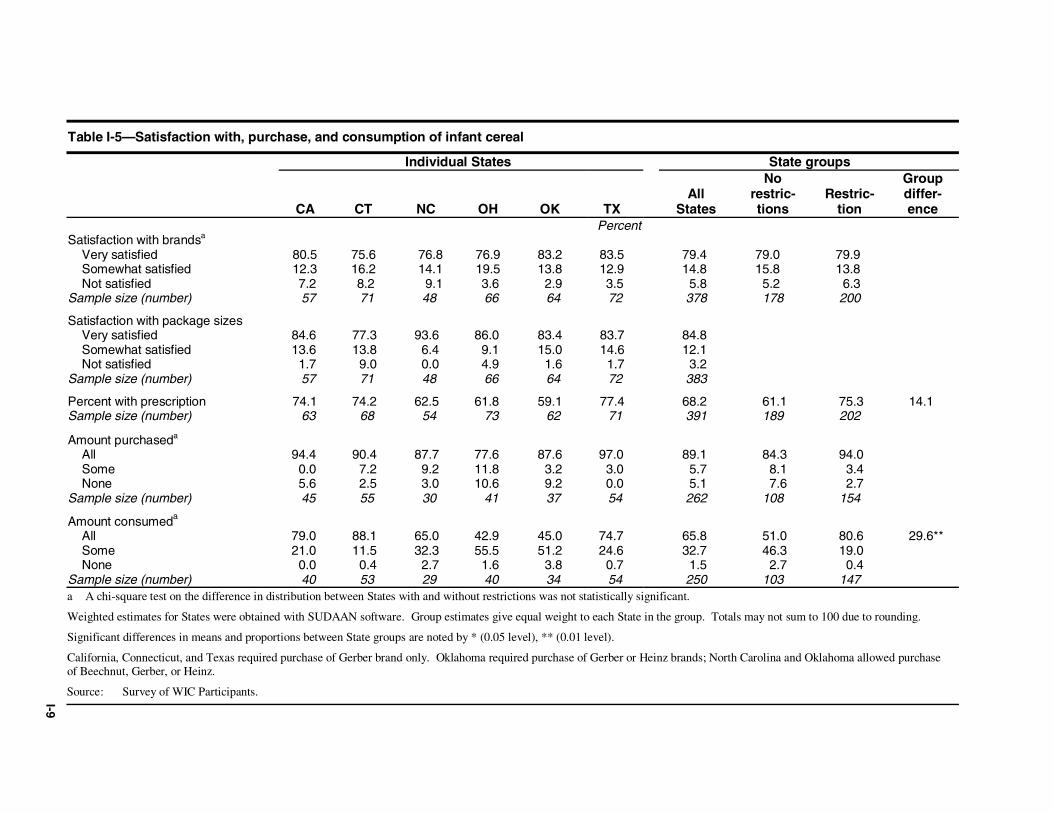
I-9
Table I-5—Satisfaction with, purchase, and consumption of infant cereal
Individual States State groups
CA CT NC OH OK TXAll
States
Norestric-tions
Restric-tion
Groupdiffer-ence
PercentSatisfaction with brandsa
Very satisfied 80.5 75.6 76.8 76.9 83.2 83.5 79.4 79.0 79.9Somewhat satisfied 12.3 16.2 14.1 19.5 13.8 12.9 14.8 15.8 13.8Not satisfied 7.2 8.2 9.1 3.6 2.9 3.5 5.8 5.2 6.3
Sample size (number) 57 71 48 66 64 72 378 178 200
Satisfaction with package sizesVery satisfied 84.6 77.3 93.6 86.0 83.4 83.7 84.8Somewhat satisfied 13.6 13.8 6.4 9.1 15.0 14.6 12.1Not satisfied 1.7 9.0 0.0 4.9 1.6 1.7 3.2
Sample size (number) 57 71 48 66 64 72 383
Percent with prescription 74.1 74.2 62.5 61.8 59.1 77.4 68.2 61.1 75.3 14.1Sample size (number) 63 68 54 73 62 71 391 189 202
Amount purchaseda
All 94.4 90.4 87.7 77.6 87.6 97.0 89.1 84.3 94.0Some 0.0 7.2 9.2 11.8 3.2 3.0 5.7 8.1 3.4None 5.6 2.5 3.0 10.6 9.2 0.0 5.1 7.6 2.7
Sample size (number) 45 55 30 41 37 54 262 108 154
Amount consumeda
All 79.0 88.1 65.0 42.9 45.0 74.7 65.8 51.0 80.6 29.6**Some 21.0 11.5 32.3 55.5 51.2 24.6 32.7 46.3 19.0None 0.0 0.4 2.7 1.6 3.8 0.7 1.5 2.7 0.4
Sample size (number) 40 53 29 40 34 54 250 103 147a A chi-square test on the difference in distribution between States with and without restrictions was not statistically significant.
Weighted estimates for States were obtained with SUDAAN software. Group estimates give equal weight to each State in the group. Totals may not sum to 100 due to rounding.
Significant differences in means and proportions between State groups are noted by * (0.05 level), ** (0.01 level).
California, Connecticut, and Texas required purchase of Gerber brand only. Oklahoma required purchase of Gerber or Heinz brands; North Carolina and Oklahoma allowed purchaseof Beechnut, Gerber, or Heinz.
Source: Survey of WIC Participants.
I-10
Given that most of the sampled families purchased all of the infant cereal prescribed, only 23 respon-dents were asked why they did not buy some or all of the prescribed cereal. Their responses areshown in table I-6. With a sample this small, it is not possible to test whether the average distribu-tions of responses in States with and without brand restrictions were significantly different. Theaverage percentage of those saying their infant did not like the cereal was higher in States withrestrictions (21.0 percent) than in States without (0.0 percent), and the 21.0 percentage-point differ-ence is significant at the 0.05 level. This difference, however, is based on only three participants inCalifornia who said their infants did not like Gerber cereal. Furthermore, there were no significantdifferences between groups in the reasons given for not eating all of the purchased cereal. The mostcommon reason was that there was too much to eat. The evidence, therefore, does not support afinding that brand restrictions reduced the purchase or consumption of infant cereal.
Table I-6―Reasons for not purchasing or consuming prescribed infant cereal
All StatesaNo
restrictions RestrictionGroup
differencePercent
Reasons for not purchasing some orall of prescribed itemb
Don’t like 10.5 0.0 21.0 21.0*Voucher expired or lost 11.9 0.0 23.9Too much 47.7 42.8 52.7Other 29.8 57.2 2.4
Sample size (number) 23 13 10
Reasons for not consuming some orall of prescribed itemb
Don’t like 32.7 35.6 29.8 −5.8Too much 42.0 36.0 48.0Don’t normally eat 6.4 4.5 8.3Other 18.9 24.0 13.9
Sample size (number) 94 49 45
a Results presented for the six States in the study. Due to small sample sizes, State-specific results are not reported.
b A chi-square test on the difference in distribution between States with and without restrictions was not statisticallysignificant.
Weighted estimates for States were obtained with SUDAAN software. Group estimates give equal weight to each State inthe group. Totals may not sum to 100 due to rounding.
Significant differences in means and proportions between State groups are noted by * (0.05 level), ** (0.01 level).
California, Connecticut, and Texas required purchase of Gerber brand only. Oklahoma required purchase of Gerber orHeinz brands; North Carolina and Oklahoma allowed purchase of Beechnut, Gerber, or Heinz.
Source: Survey of WIC Participants.
I-11
Adult Juice
Four States are considered “restrictive” with respect to adult juice. Connecticut and Texas requiredpurchase of least expensive brands for some or all of their approved juices. Oklahoma approved onlystore brands or private labels for most juice types. California and Texas allowed fewer types than theother States (see table 3-1 in chapter 3).
With respect to packaging, all of the case study States allowed frozen concentrates. North Carolina,Ohio, and Oklahoma also allowed liquid concentrates. Five of the six States limited purchase ofshelf-stable juices (bottles and cans) to the 46-ounce size; California, however, allowed only 64-ounce containers. Furthermore, Texas limited shelf-stable juices to 46-ounce cans; plastic bottleswere not allowed. Finally, Connecticut was the only State that allowed purchase of refrigeratedorange juice (64- or 128-ounce cartons).
California and Texas, at 13.3 and 12.1 percent, respectively, had the highest proportion of surveyrespondents indicating a binding constraint on juices (table 6-2). Thus, it appears that the limitedvariety of juices approved in California and the least expensive brand and container size policies inTexas did restrict participant choice. Connecticut, with its least expensive brand policy, ranked thirdin the percentage of respondents (7.2 percent) facing binding constraints on adult juice. In Oklahoma,however, only 3.1 percent of the survey respondents preferred a federally approved type or brand ofjuice that was not allowed by the State.
The most common binding constraint was for cranberry juice, mentioned by 24 of the 71 respondentswith a binding constraint on juice. 10 In addition, 4 of the 18 respondents in California with aconstraint listed grapefruit as a preferred juice. Juice blends and national brands were also commonresponses, mentioned by 10 and 9 of the 71 respondents, respectively.
Survey respondents’ satisfaction with allowed brands is displayed in the top panel of table I-7; across-State average of 78.7 percent of respondents said they were “very satisfied” with allowedbrands of juice, and 18.8 percent said they were “somewhat satisfied”. A chi-squared test indicatesthat there was not a statistically significant difference in the average distributions of satisfaction levelin the States with and without restrictions.
There was also a generally high level of satisfaction with allowed package sizes of juice (secondpanel of table I-7); a cross-State average of 79.9 percent was very satisfied. It is difficult to identifywhich package sizes WIC participants would view as most restrictive, because some participantsmight prefer large containers and others smaller ones. Furthermore, there is not a lot of State-by-State variation in satisfaction with package sizes. For this reason, the States have not been dividedinto groups to see if the distributions of responses varied by packaging restrictions on juices.
10 Only North Carolina and Ohio allowed purchase of cranberry juice.
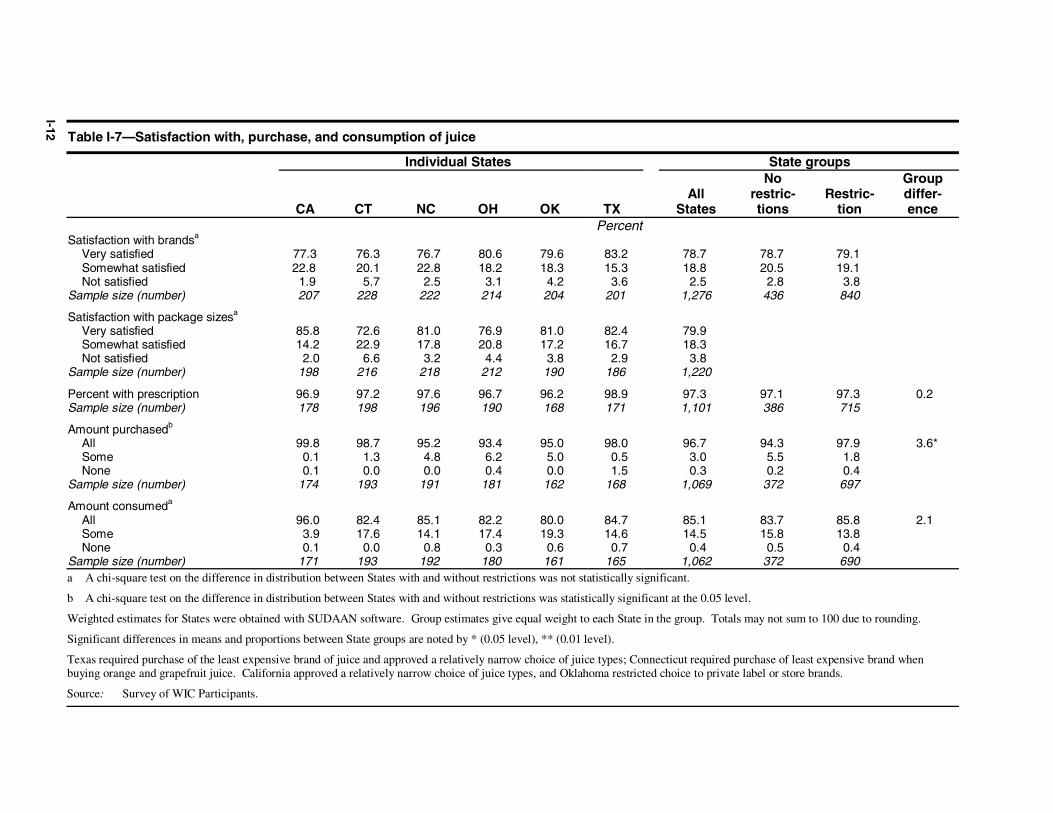
I-12 Table I-7—Satisfaction with, purchase, and consumption of juice
Individual States State groups
CA CT NC OH OK TXAll
States
Norestric-tions
Restric-tion
Groupdiffer-ence
PercentSatisfaction with brandsa
Very satisfied 77.3 76.3 76.7 80.6 79.6 83.2 78.7 78.7 79.1Somewhat satisfied 22.8 20.1 22.8 18.2 18.3 15.3 18.8 20.5 19.1Not satisfied 1.9 5.7 2.5 3.1 4.2 3.6 2.5 2.8 3.8
Sample size (number) 207 228 222 214 204 201 1,276 436 840
Satisfaction with package sizesa
Very satisfied 85.8 72.6 81.0 76.9 81.0 82.4 79.9Somewhat satisfied 14.2 22.9 17.8 20.8 17.2 16.7 18.3Not satisfied 2.0 6.6 3.2 4.4 3.8 2.9 3.8
Sample size (number) 198 216 218 212 190 186 1,220
Percent with prescription 96.9 97.2 97.6 96.7 96.2 98.9 97.3 97.1 97.3 0.2Sample size (number) 178 198 196 190 168 171 1,101 386 715
Amount purchasedb
All 99.8 98.7 95.2 93.4 95.0 98.0 96.7 94.3 97.9 3.6*Some 0.1 1.3 4.8 6.2 5.0 0.5 3.0 5.5 1.8None 0.1 0.0 0.0 0.4 0.0 1.5 0.3 0.2 0.4
Sample size (number) 174 193 191 181 162 168 1,069 372 697
Amount consumeda
All 96.0 82.4 85.1 82.2 80.0 84.7 85.1 83.7 85.8 2.1Some 3.9 17.6 14.1 17.4 19.3 14.6 14.5 15.8 13.8None 0.1 0.0 0.8 0.3 0.6 0.7 0.4 0.5 0.4
Sample size (number) 171 193 192 180 161 165 1,062 372 690a A chi-square test on the difference in distribution between States with and without restrictions was not statistically significant.
b A chi-square test on the difference in distribution between States with and without restrictions was statistically significant at the 0.05 level.
Weighted estimates for States were obtained with SUDAAN software. Group estimates give equal weight to each State in the group. Totals may not sum to 100 due to rounding.
Significant differences in means and proportions between State groups are noted by * (0.05 level), ** (0.01 level).
Texas required purchase of the least expensive brand of juice and approved a relatively narrow choice of juice types; Connecticut required purchase of least expensive brand whenbuying orange and grapefruit juice. California approved a relatively narrow choice of juice types, and Oklahoma restricted choice to private label or store brands.
Source: Survey of WIC Participants.
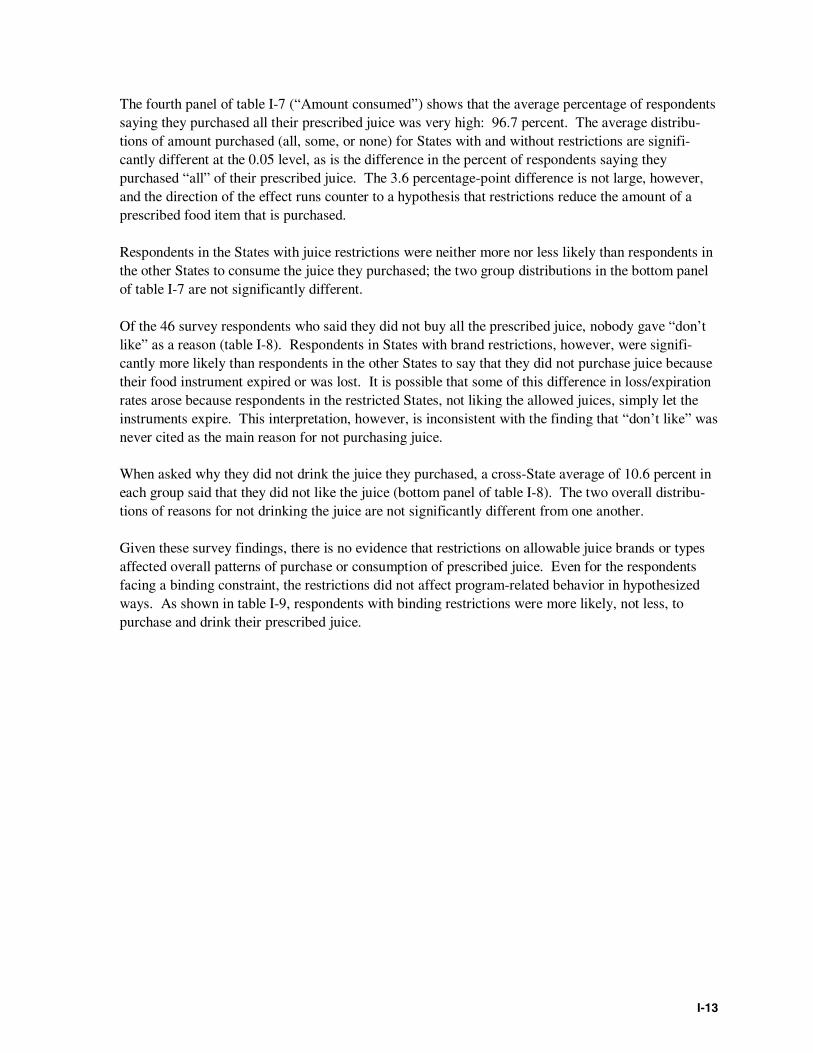
I-13
The fourth panel of table I-7 (“Amount consumed”) shows that the average percentage of respondentssaying they purchased all their prescribed juice was very high: 96.7 percent. The average distribu-tions of amount purchased (all, some, or none) for States with and without restrictions are signifi-cantly different at the 0.05 level, as is the difference in the percent of respondents saying theypurchased “all” of their prescribed juice. The 3.6 percentage-point difference is not large, however,and the direction of the effect runs counter to a hypothesis that restrictions reduce the amount of aprescribed food item that is purchased.
Respondents in the States with juice restrictions were neither more nor less likely than respondents inthe other States to consume the juice they purchased; the two group distributions in the bottom panelof table I-7 are not significantly different.
Of the 46 survey respondents who said they did not buy all the prescribed juice, nobody gave “don’tlike” as a reason (table I-8). Respondents in States with brand restrictions, however, were signifi-cantly more likely than respondents in the other States to say that they did not purchase juice becausetheir food instrument expired or was lost. It is possible that some of this difference in loss/expirationrates arose because respondents in the restricted States, not liking the allowed juices, simply let theinstruments expire. This interpretation, however, is inconsistent with the finding that “don’t like” wasnever cited as the main reason for not purchasing juice.
When asked why they did not drink the juice they purchased, a cross-State average of 10.6 percent ineach group said that they did not like the juice (bottom panel of table I-8). The two overall distribu-tions of reasons for not drinking the juice are not significantly different from one another.
Given these survey findings, there is no evidence that restrictions on allowable juice brands or typesaffected overall patterns of purchase or consumption of prescribed juice. Even for the respondentsfacing a binding constraint, the restrictions did not affect program-related behavior in hypothesizedways. As shown in table I-9, respondents with binding restrictions were more likely, not less, topurchase and drink their prescribed juice.
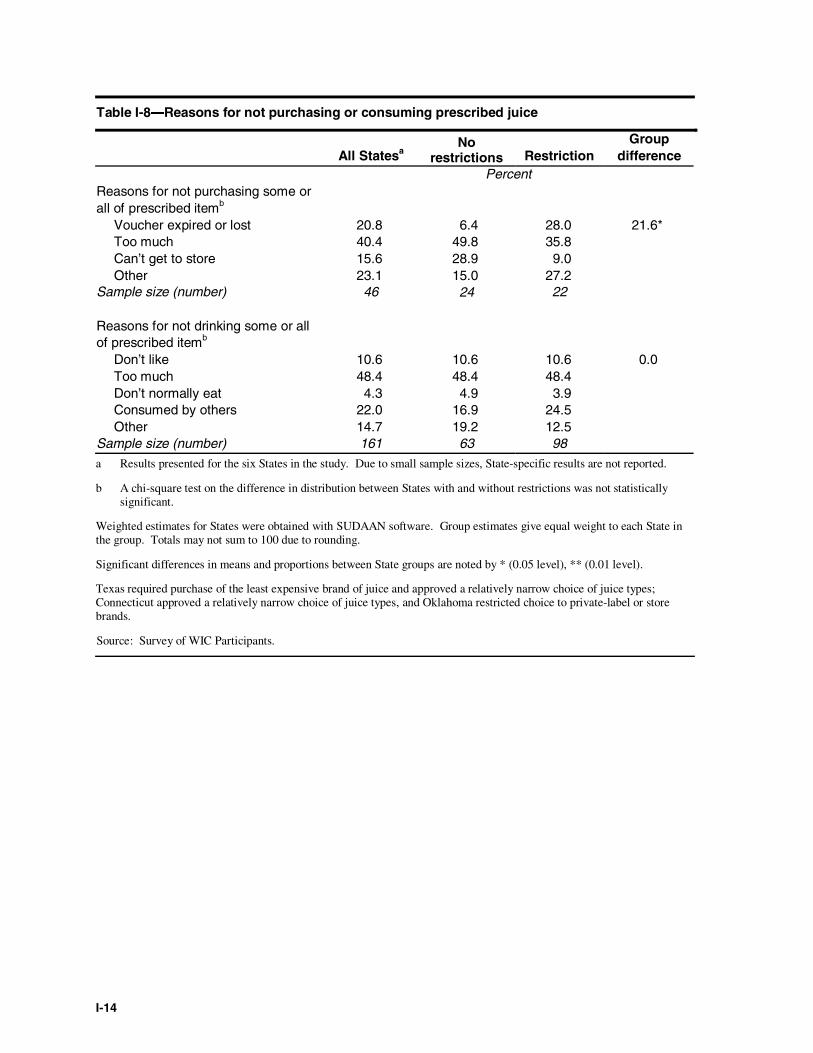
I-14
Table I-8―Reasons for not purchasing or consuming prescribed juice
All StatesaNo
restrictions RestrictionGroup
differencePercent
Reasons for not purchasing some orall of prescribed itemb
Voucher expired or lost 20.8 6.4 28.0 21.6*Too much 40.4 49.8 35.8Can’t get to store 15.6 28.9 9.0Other 23.1 15.0 27.2
Sample size (number) 46 24 22
Reasons for not drinking some or allof prescribed itemb
Don’t like 10.6 10.6 10.6 0.0Too much 48.4 48.4 48.4Don’t normally eat 4.3 4.9 3.9Consumed by others 22.0 16.9 24.5Other 14.7 19.2 12.5
Sample size (number) 161 63 98
a Results presented for the six States in the study. Due to small sample sizes, State-specific results are not reported.
b A chi-square test on the difference in distribution between States with and without restrictions was not statisticallysignificant.
Weighted estimates for States were obtained with SUDAAN software. Group estimates give equal weight to each State inthe group. Totals may not sum to 100 due to rounding.
Significant differences in means and proportions between State groups are noted by * (0.05 level), ** (0.01 level).
Texas required purchase of the least expensive brand of juice and approved a relatively narrow choice of juice types;Connecticut approved a relatively narrow choice of juice types, and Oklahoma restricted choice to private-label or storebrands.
Source: Survey of WIC Participants.
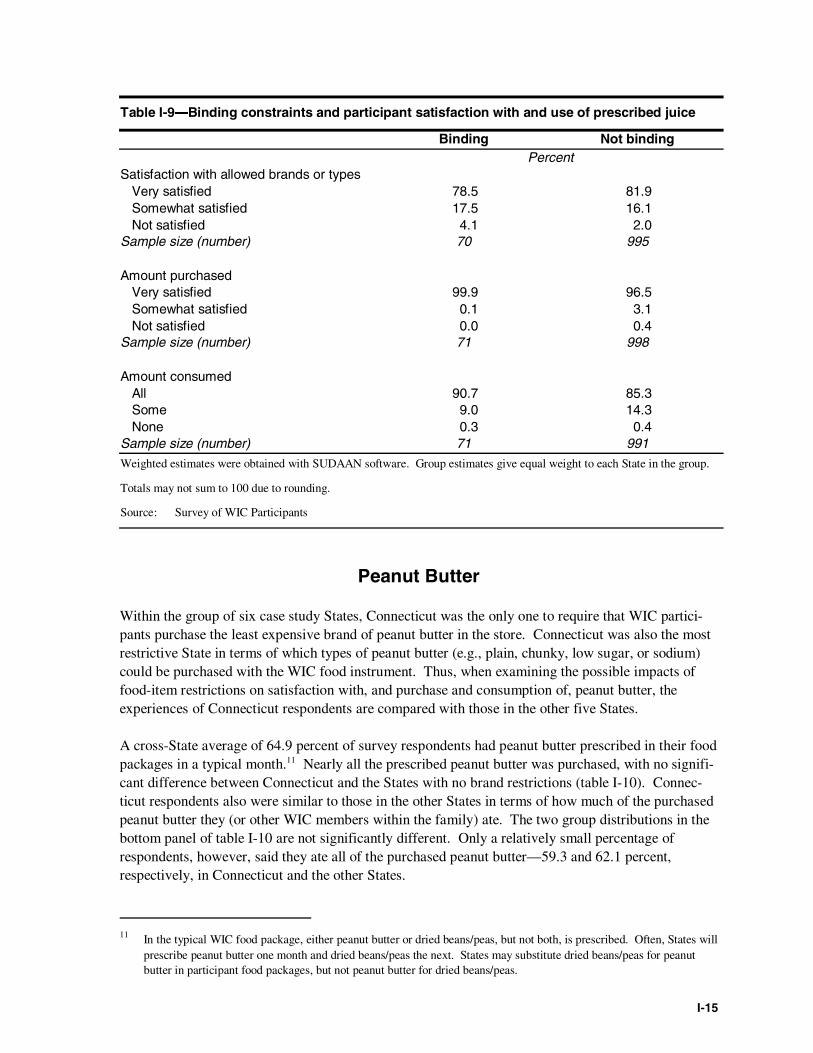
I-15
Table I-9―Binding constraints and participant satisfaction with and use of prescribed juice
Binding Not bindingPercent
Satisfaction with allowed brands or typesVery satisfied 78.5 81.9Somewhat satisfied 17.5 16.1Not satisfied 4.1 2.0
Sample size (number) 70 995
Amount purchasedVery satisfied 99.9 96.5Somewhat satisfied 0.1 3.1Not satisfied 0.0 0.4
Sample size (number) 71 998
Amount consumedAll 90.7 85.3Some 9.0 14.3None 0.3 0.4
Sample size (number) 71 991
Weighted estimates were obtained with SUDAAN software. Group estimates give equal weight to each State in the group.
Totals may not sum to 100 due to rounding.
Source: Survey of WIC Participants
Peanut Butter
Within the group of six case study States, Connecticut was the only one to require that WIC partici-pants purchase the least expensive brand of peanut butter in the store. Connecticut was also the mostrestrictive State in terms of which types of peanut butter (e.g., plain, chunky, low sugar, or sodium)could be purchased with the WIC food instrument. Thus, when examining the possible impacts offood-item restrictions on satisfaction with, and purchase and consumption of, peanut butter, theexperiences of Connecticut respondents are compared with those in the other five States.
A cross-State average of 64.9 percent of survey respondents had peanut butter prescribed in their foodpackages in a typical month.11 Nearly all the prescribed peanut butter was purchased, with no signifi-cant difference between Connecticut and the States with no brand restrictions (table I-10). Connec-ticut respondents also were similar to those in the other States in terms of how much of the purchasedpeanut butter they (or other WIC members within the family) ate. The two group distributions in thebottom panel of table I-10 are not significantly different. Only a relatively small percentage ofrespondents, however, said they ate all of the purchased peanut butter—59.3 and 62.1 percent,respectively, in Connecticut and the other States.
11 In the typical WIC food package, either peanut butter or dried beans/peas, but not both, is prescribed. Often, States willprescribe peanut butter one month and dried beans/peas the next. States may substitute dried beans/peas for peanutbutter in participant food packages, but not peanut butter for dried beans/peas.
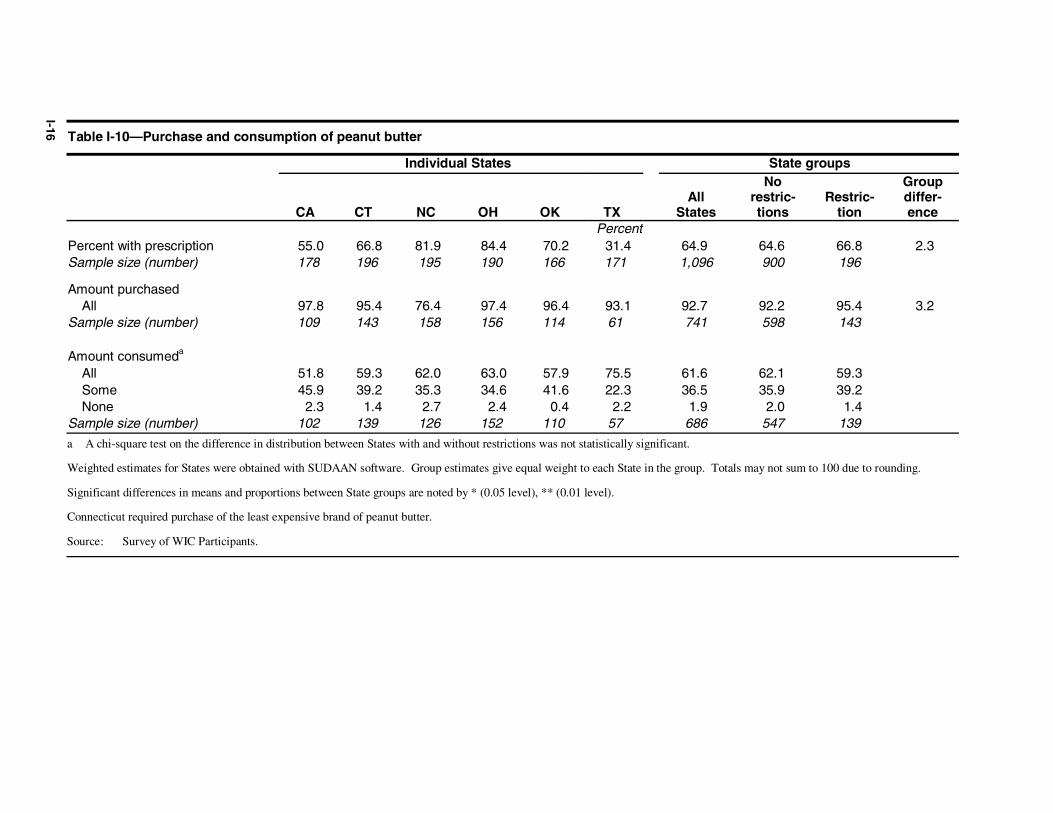
I-16 Table I-10—Purchase and consumption of peanut butter
Individual States State groups
CA CT NC OH OK TXAll
States
Norestric-tions
Restric-tion
Groupdiffer-ence
PercentPercent with prescription 55.0 66.8 81.9 84.4 70.2 31.4 64.9 64.6 66.8 2.3Sample size (number) 178 196 195 190 166 171 1,096 900 196
Amount purchasedAll 97.8 95.4 76.4 97.4 96.4 93.1 92.7 92.2 95.4 3.2
Sample size (number) 109 143 158 156 114 61 741 598 143
Amount consumeda
All 51.8 59.3 62.0 63.0 57.9 75.5 61.6 62.1 59.3Some 45.9 39.2 35.3 34.6 41.6 22.3 36.5 35.9 39.2None 2.3 1.4 2.7 2.4 0.4 2.2 1.9 2.0 1.4
Sample size (number) 102 139 126 152 110 57 686 547 139
a A chi-square test on the difference in distribution between States with and without restrictions was not statistically significant.
Weighted estimates for States were obtained with SUDAAN software. Group estimates give equal weight to each State in the group. Totals may not sum to 100 due to rounding.
Significant differences in means and proportions between State groups are noted by * (0.05 level), ** (0.01 level).
Connecticut required purchase of the least expensive brand of peanut butter.
Source: Survey of WIC Participants.
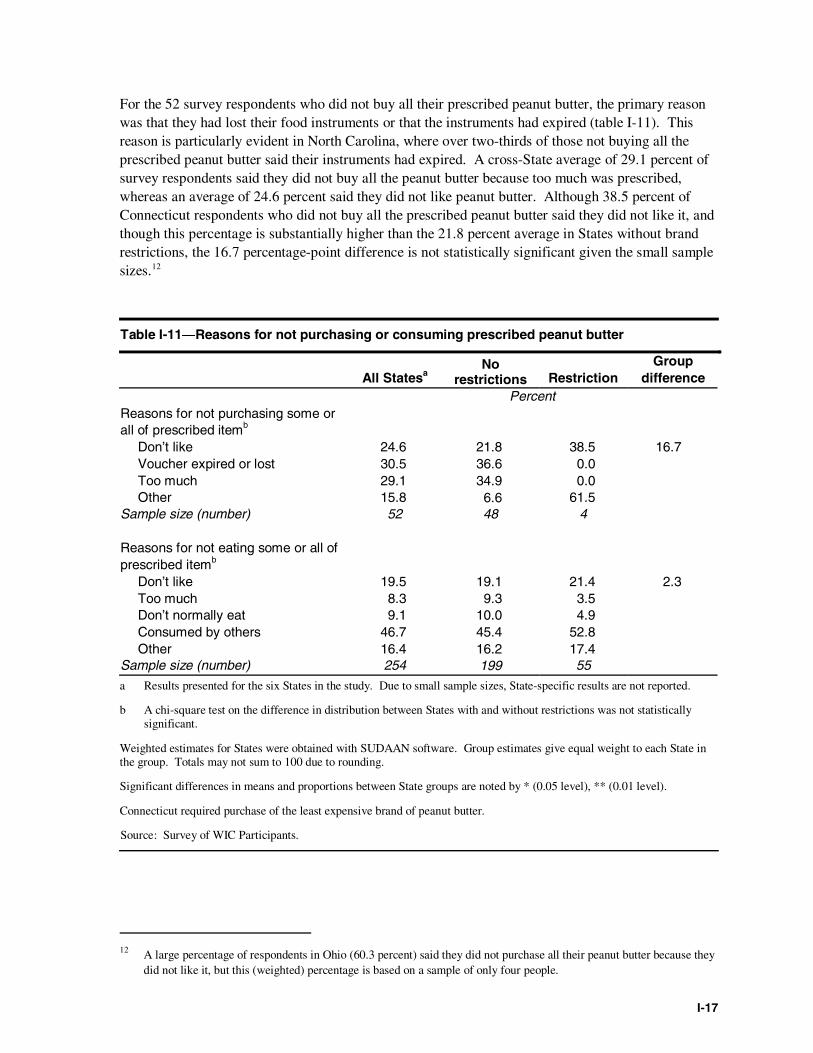
I-17
For the 52 survey respondents who did not buy all their prescribed peanut butter, the primary reasonwas that they had lost their food instruments or that the instruments had expired (table I-11). Thisreason is particularly evident in North Carolina, where over two-thirds of those not buying all theprescribed peanut butter said their instruments had expired. A cross-State average of 29.1 percent ofsurvey respondents said they did not buy all the peanut butter because too much was prescribed,whereas an average of 24.6 percent said they did not like peanut butter. Although 38.5 percent ofConnecticut respondents who did not buy all the prescribed peanut butter said they did not like it, andthough this percentage is substantially higher than the 21.8 percent average in States without brandrestrictions, the 16.7 percentage-point difference is not statistically significant given the small samplesizes.12
Table I-11―Reasons for not purchasing or consuming prescribed peanut butter
All StatesaNo
restrictions RestrictionGroup
differencePercent
Reasons for not purchasing some orall of prescribed itemb
Don’t like 24.6 21.8 38.5 16.7Voucher expired or lost 30.5 36.6 0.0Too much 29.1 34.9 0.0Other 15.8 6.6 61.5
Sample size (number) 52 48 4
Reasons for not eating some or all ofprescribed itemb
Don’t like 19.5 19.1 21.4 2.3Too much 8.3 9.3 3.5Don’t normally eat 9.1 10.0 4.9Consumed by others 46.7 45.4 52.8Other 16.4 16.2 17.4
Sample size (number) 254 199 55
a Results presented for the six States in the study. Due to small sample sizes, State-specific results are not reported.
b A chi-square test on the difference in distribution between States with and without restrictions was not statisticallysignificant.
Weighted estimates for States were obtained with SUDAAN software. Group estimates give equal weight to each State inthe group. Totals may not sum to 100 due to rounding.
Significant differences in means and proportions between State groups are noted by * (0.05 level), ** (0.01 level).
Connecticut required purchase of the least expensive brand of peanut butter.
Source: Survey of WIC Participants.
12 A large percentage of respondents in Ohio (60.3 percent) said they did not purchase all their peanut butter because theydid not like it, but this (weighted) percentage is based on a sample of only four people.
I-18
The relatively low percentages of respondents saying they ate all of their purchased peanut butter wasrelated to its consumption by non-WIC members of the family; a cross-State average of 46.7 percentgave that as the main reason for not eating all that they purchased (table I-11). Only about 20 percentsaid they did not like peanut butter, and the 2.3 percentage-point difference in group means is notsignificant.
Dried Beans/Peas
As was shown in table 3-1 in chapter 3, little variation existed among the six States as to the types ofdried beans/peas that could be purchased with a WIC food instrument, nor were there differences inallowable packaging. Oklahoma was the only State in the group, however, to restrict brands; its WICparticipants had to buy the least expensive brand of dried beans/peas available in the store.
As shown in table I-12, a cross-State average of 54.7 percent of survey respondents were prescribeddried beans/peas, and a cross-State average of 86.9 percent purchased all of them.13 There were nosignificant differences in the average responses between Oklahoma and the other States in thesemeasures. Respondents in Oklahoma, however, were less likely than the cross-State average ofrespondents in the nonrestrictive States to eat all the dried beans/peas they bought (57.2 vs. 72.0percent); the 14.8 percentage-point difference is statistically significant at the 0.05 level. The overalldistributions of consumption, however, were not significantly different from one another.
The survey evidence is inconclusive as to whether Oklahoma’s least expensive brand policy underlaythe difference in the percentage of respondents eating all the dried beans/peas they purchased. First,with regard to why respondents did not purchase all their prescribed dried beans/ peas, respondents inOklahoma were more likely than respondents in the other five States to say they did not like thesefoods (top panel of table I-13). The large 13.0 percentage-point difference between the two groups(39.6 vs. 26.6 percent) is not statistically significant, however, because the sample sizes are small.Second, respondents in Oklahoma were more likely, by 11.3 percentage points, to say they did not eatall the dried beans/peas they purchased because they did not like them.
Again, this difference is not statistically different from zero. Furthermore, chi-squared tests indicatethat the distributions of responses in the restrictive and nonrestrictive States were not different fromone another. Thus, although the direction of the impacts suggests that Oklahoma’s least expensivebrand policy may be related to less consumption of dried beans/peas, the hypothesis is not supporteddue to lack of statistical significance.
13 The survey questionnaire did not ask if “some” dried beans/peas were purchased, only if “all” or “none” were.
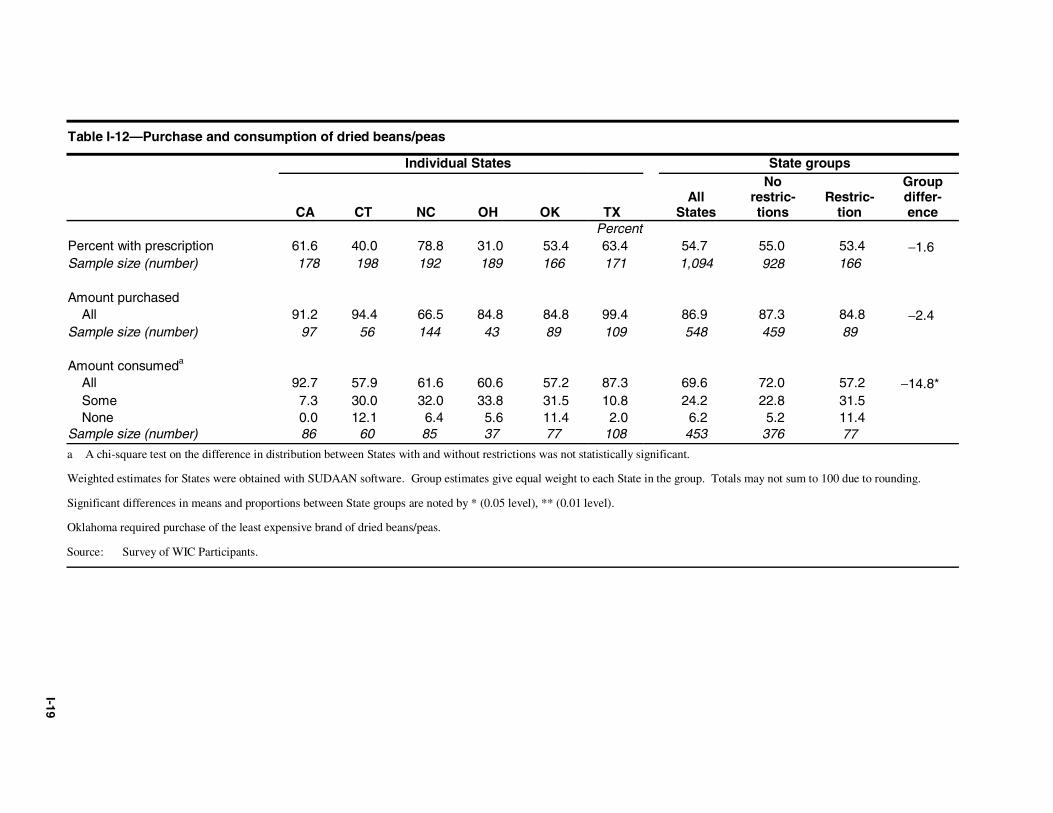
I-19
Table I-12—Purchase and consumption of dried beans/peas
Individual States State groups
CA CT NC OH OK TXAll
States
Norestric-tions
Restric-tion
Groupdiffer-ence
PercentPercent with prescription 61.6 40.0 78.8 31.0 53.4 63.4 54.7 55.0 53.4 −1.6Sample size (number) 178 198 192 189 166 171 1,094 928 166
Amount purchasedAll 91.2 94.4 66.5 84.8 84.8 99.4 86.9 87.3 84.8 −2.4
Sample size (number) 97 56 144 43 89 109 548 459 89
Amount consumeda
All 92.7 57.9 61.6 60.6 57.2 87.3 69.6 72.0 57.2 −14.8*Some 7.3 30.0 32.0 33.8 31.5 10.8 24.2 22.8 31.5None 0.0 12.1 6.4 5.6 11.4 2.0 6.2 5.2 11.4
Sample size (number) 86 60 85 37 77 108 453 376 77
a A chi-square test on the difference in distribution between States with and without restrictions was not statistically significant.
Weighted estimates for States were obtained with SUDAAN software. Group estimates give equal weight to each State in the group. Totals may not sum to 100 due to rounding.
Significant differences in means and proportions between State groups are noted by * (0.05 level), ** (0.01 level).
Oklahoma required purchase of the least expensive brand of dried beans/peas.
Source: Survey of WIC Participants.
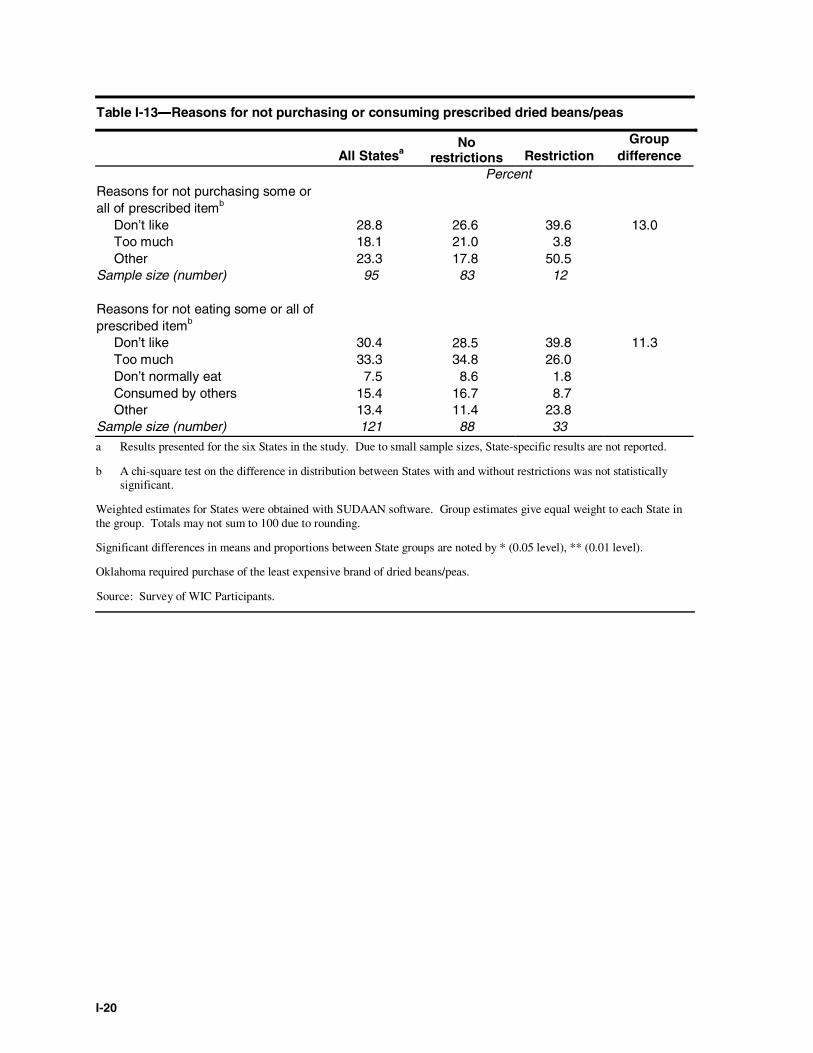
I-20
Table I-13―Reasons for not purchasing or consuming prescribed dried beans/peas
All StatesaNo
restrictions RestrictionGroup
differencePercent
Reasons for not purchasing some orall of prescribed itemb
Don’t like 28.8 26.6 39.6 13.0Too much 18.1 21.0 3.8Other 23.3 17.8 50.5
Sample size (number) 95 83 12
Reasons for not eating some or all ofprescribed itemb
Don’t like 30.4 28.5 39.8 11.3Too much 33.3 34.8 26.0Don’t normally eat 7.5 8.6 1.8Consumed by others 15.4 16.7 8.7Other 13.4 11.4 23.8
Sample size (number) 121 88 33
a Results presented for the six States in the study. Due to small sample sizes, State-specific results are not reported.
b A chi-square test on the difference in distribution between States with and without restrictions was not statisticallysignificant.
Weighted estimates for States were obtained with SUDAAN software. Group estimates give equal weight to each State inthe group. Totals may not sum to 100 due to rounding.
Significant differences in means and proportions between State groups are noted by * (0.05 level), ** (0.01 level).
Oklahoma required purchase of the least expensive brand of dried beans/peas.
Source: Survey of WIC Participants.
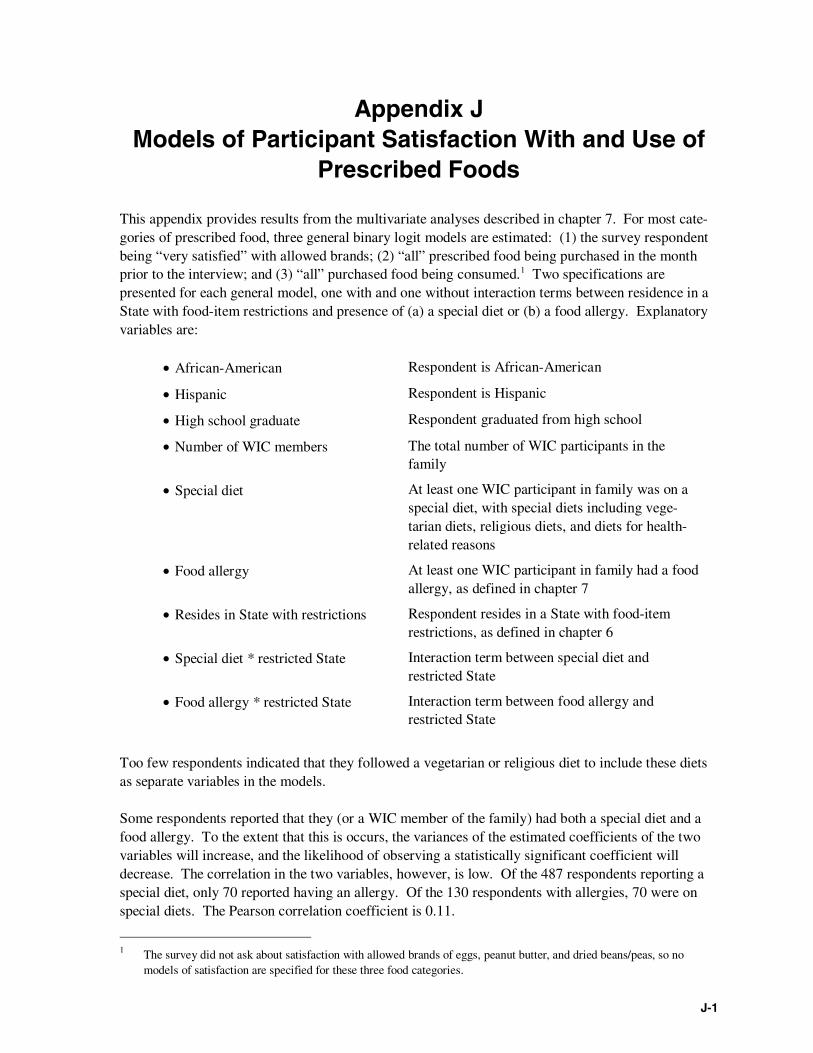
J-1
Appendix JModels of Participant Satisfaction With and Use of
Prescribed Foods
This appendix provides results from the multivariate analyses described in chapter 7. For most cate-gories of prescribed food, three general binary logit models are estimated: (1) the survey respondentbeing “very satisfied” with allowed brands; (2) “all” prescribed food being purchased in the monthprior to the interview; and (3) “all” purchased food being consumed.1 Two specifications arepresented for each general model, one with and one without interaction terms between residence in aState with food-item restrictions and presence of (a) a special diet or (b) a food allergy. Explanatoryvariables are:
• African-American Respondent is African-American
• Hispanic Respondent is Hispanic
• High school graduate Respondent graduated from high school
• Number of WIC members The total number of WIC participants in thefamily
• Special diet At least one WIC participant in family was on aspecial diet, with special diets including vege-tarian diets, religious diets, and diets for health-related reasons
• Food allergy At least one WIC participant in family had a foodallergy, as defined in chapter 7
• Resides in State with restrictions Respondent resides in a State with food-itemrestrictions, as defined in chapter 6
• Special diet * restricted State Interaction term between special diet andrestricted State
• Food allergy * restricted State Interaction term between food allergy andrestricted State
Too few respondents indicated that they followed a vegetarian or religious diet to include these dietsas separate variables in the models.
Some respondents reported that they (or a WIC member of the family) had both a special diet and afood allergy. To the extent that this is occurs, the variances of the estimated coefficients of the twovariables will increase, and the likelihood of observing a statistically significant coefficient willdecrease. The correlation in the two variables, however, is low. Of the 487 respondents reporting aspecial diet, only 70 reported having an allergy. Of the 130 respondents with allergies, 70 were onspecial diets. The Pearson correlation coefficient is 0.11.
1 The survey did not ask about satisfaction with allowed brands of eggs, peanut butter, and dried beans/peas, so nomodels of satisfaction are specified for these three food categories.
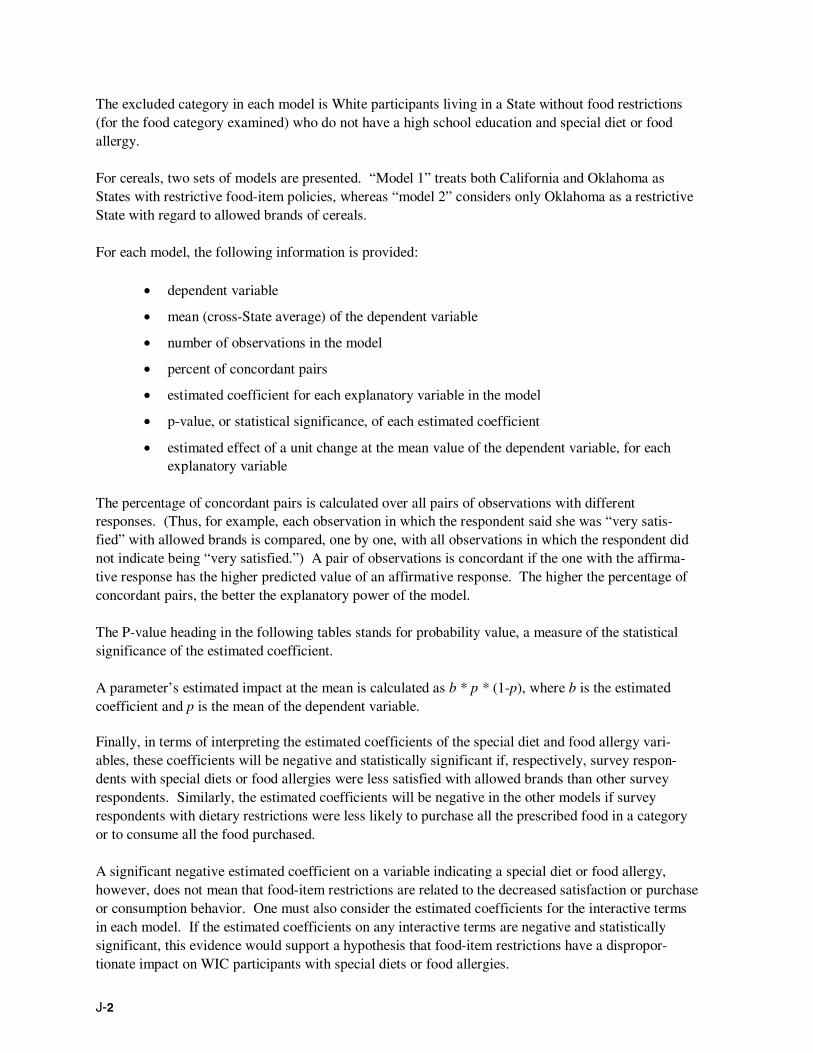
J-2
The excluded category in each model is White participants living in a State without food restrictions(for the food category examined) who do not have a high school education and special diet or foodallergy.
For cereals, two sets of models are presented. “Model 1” treats both California and Oklahoma asStates with restrictive food-item policies, whereas “model 2” considers only Oklahoma as a restrictiveState with regard to allowed brands of cereals.
For each model, the following information is provided:
• dependent variable
• mean (cross-State average) of the dependent variable
• number of observations in the model
• percent of concordant pairs
• estimated coefficient for each explanatory variable in the model
• p-value, or statistical significance, of each estimated coefficient
• estimated effect of a unit change at the mean value of the dependent variable, for eachexplanatory variable
The percentage of concordant pairs is calculated over all pairs of observations with differentresponses. (Thus, for example, each observation in which the respondent said she was “very satis-fied” with allowed brands is compared, one by one, with all observations in which the respondent didnot indicate being “very satisfied.”) A pair of observations is concordant if the one with the affirma-tive response has the higher predicted value of an affirmative response. The higher the percentage ofconcordant pairs, the better the explanatory power of the model.
The P-value heading in the following tables stands for probability value, a measure of the statisticalsignificance of the estimated coefficient.
A parameter’s estimated impact at the mean is calculated as b * p * (1-p), where b is the estimatedcoefficient and p is the mean of the dependent variable.
Finally, in terms of interpreting the estimated coefficients of the special diet and food allergy vari-ables, these coefficients will be negative and statistically significant if, respectively, survey respon-dents with special diets or food allergies were less satisfied with allowed brands than other surveyrespondents. Similarly, the estimated coefficients will be negative in the other models if surveyrespondents with dietary restrictions were less likely to purchase all the prescribed food in a categoryor to consume all the food purchased.
A significant negative estimated coefficient on a variable indicating a special diet or food allergy,however, does not mean that food-item restrictions are related to the decreased satisfaction or purchaseor consumption behavior. One must also consider the estimated coefficients for the interactive termsin each model. If the estimated coefficients on any interactive terms are negative and statisticallysignificant, this evidence would support a hypothesis that food-item restrictions have a dispropor-tionate impact on WIC participants with special diets or food allergies.
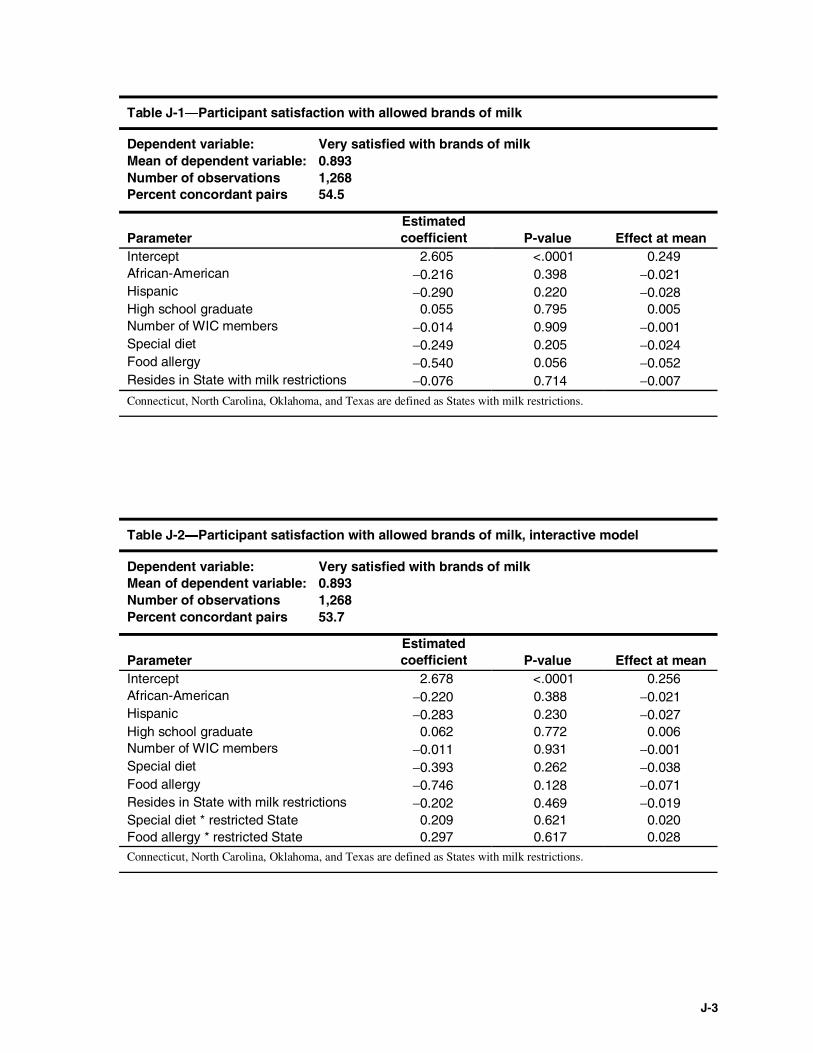
J-3
Table J-1―Participant satisfaction with allowed brands of milk
Dependent variable: Very satisfied with brands of milkMean of dependent variable: 0.893Number of observations 1,268Percent concordant pairs 54.5
ParameterEstimatedcoefficient P-value Effect at mean
Intercept 2.605 <.0001 0.249African-American −0.216 0.398 −0.021Hispanic −0.290 0.220 −0.028High school graduate 0.055 0.795 0.005Number of WIC members −0.014 0.909 −0.001Special diet −0.249 0.205 −0.024Food allergy −0.540 0.056 −0.052Resides in State with milk restrictions −0.076 0.714 −0.007
Connecticut, North Carolina, Oklahoma, and Texas are defined as States with milk restrictions.
Table J-2―Participant satisfaction with allowed brands of milk, interactive model
Dependent variable: Very satisfied with brands of milkMean of dependent variable: 0.893Number of observations 1,268Percent concordant pairs 53.7
ParameterEstimatedcoefficient P-value Effect at mean
Intercept 2.678 <.0001 0.256African-American −0.220 0.388 −0.021Hispanic −0.283 0.230 −0.027High school graduate 0.062 0.772 0.006Number of WIC members −0.011 0.931 −0.001Special diet −0.393 0.262 −0.038Food allergy −0.746 0.128 −0.071Resides in State with milk restrictions −0.202 0.469 −0.019Special diet * restricted State 0.209 0.621 0.020Food allergy * restricted State 0.297 0.617 0.028Connecticut, North Carolina, Oklahoma, and Texas are defined as States with milk restrictions.
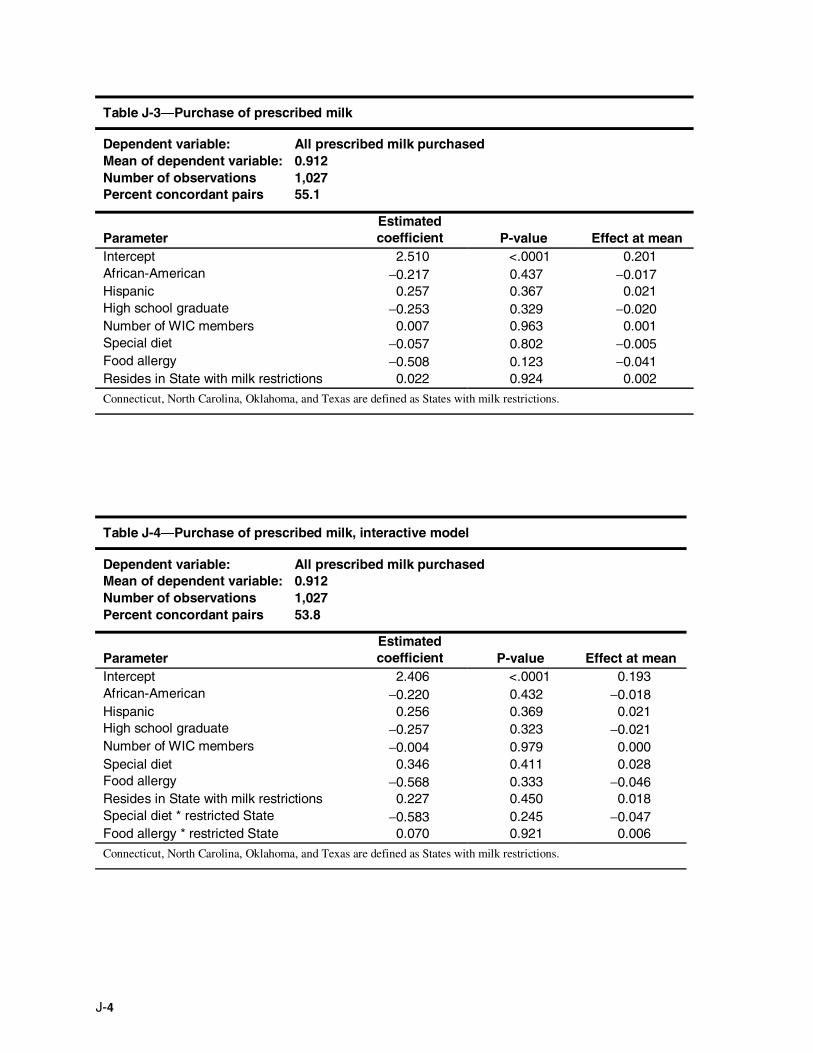
J-4
Table J-3―Purchase of prescribed milk
Dependent variable: All prescribed milk purchasedMean of dependent variable: 0.912Number of observations 1,027Percent concordant pairs 55.1
ParameterEstimatedcoefficient P-value Effect at mean
Intercept 2.510 <.0001 0.201African-American −0.217 0.437 −0.017Hispanic 0.257 0.367 0.021High school graduate −0.253 0.329 −0.020Number of WIC members 0.007 0.963 0.001Special diet −0.057 0.802 −0.005Food allergy −0.508 0.123 −0.041Resides in State with milk restrictions 0.022 0.924 0.002
Connecticut, North Carolina, Oklahoma, and Texas are defined as States with milk restrictions.
Table J-4―Purchase of prescribed milk, interactive model
Dependent variable: All prescribed milk purchasedMean of dependent variable: 0.912Number of observations 1,027Percent concordant pairs 53.8
ParameterEstimatedcoefficient P-value Effect at mean
Intercept 2.406 <.0001 0.193African-American −0.220 0.432 −0.018Hispanic 0.256 0.369 0.021High school graduate −0.257 0.323 −0.021Number of WIC members −0.004 0.979 0.000Special diet 0.346 0.411 0.028Food allergy −0.568 0.333 −0.046Resides in State with milk restrictions 0.227 0.450 0.018Special diet * restricted State −0.583 0.245 −0.047Food allergy * restricted State 0.070 0.921 0.006
Connecticut, North Carolina, Oklahoma, and Texas are defined as States with milk restrictions.
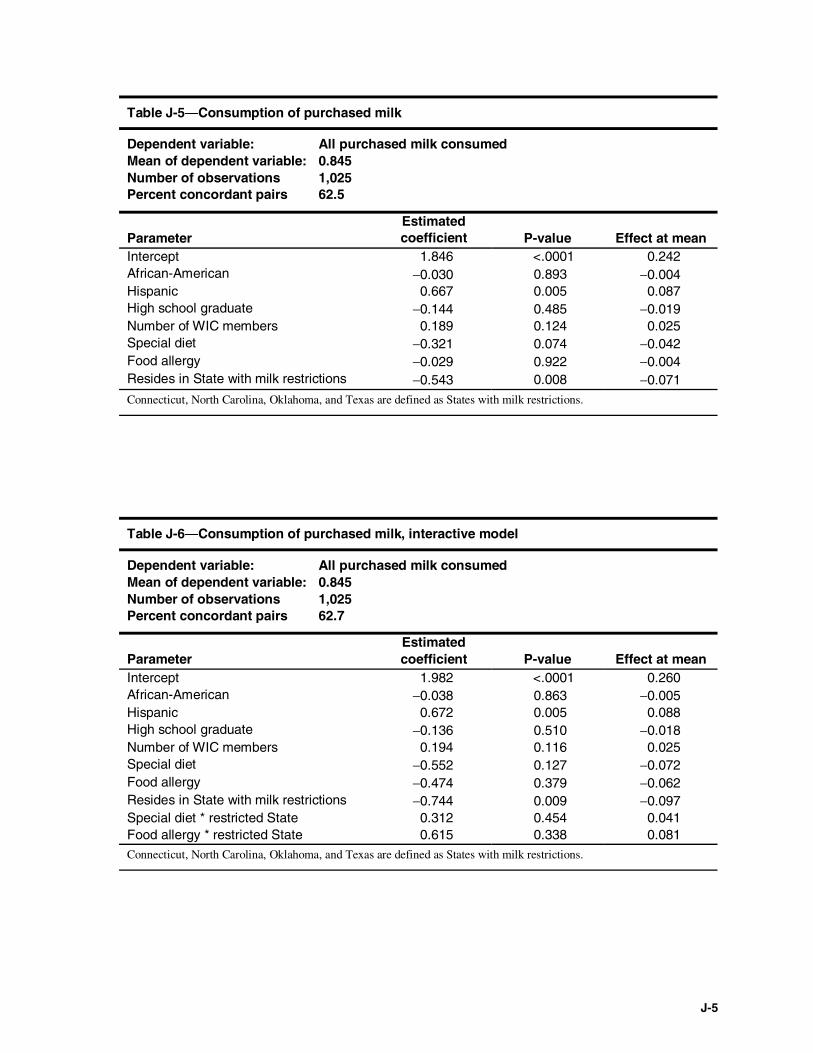
J-5
Table J-5―Consumption of purchased milk
Dependent variable: All purchased milk consumedMean of dependent variable: 0.845Number of observations 1,025Percent concordant pairs 62.5
ParameterEstimatedcoefficient P-value Effect at mean
Intercept 1.846 <.0001 0.242African-American −0.030 0.893 −0.004Hispanic 0.667 0.005 0.087High school graduate −0.144 0.485 −0.019Number of WIC members 0.189 0.124 0.025Special diet −0.321 0.074 −0.042Food allergy −0.029 0.922 −0.004Resides in State with milk restrictions −0.543 0.008 −0.071Connecticut, North Carolina, Oklahoma, and Texas are defined as States with milk restrictions.
Table J-6―Consumption of purchased milk, interactive model
Dependent variable: All purchased milk consumedMean of dependent variable: 0.845Number of observations 1,025Percent concordant pairs 62.7
ParameterEstimatedcoefficient P-value Effect at mean
Intercept 1.982 <.0001 0.260African-American −0.038 0.863 −0.005Hispanic 0.672 0.005 0.088High school graduate −0.136 0.510 −0.018Number of WIC members 0.194 0.116 0.025Special diet −0.552 0.127 −0.072Food allergy −0.474 0.379 −0.062Resides in State with milk restrictions −0.744 0.009 −0.097Special diet * restricted State 0.312 0.454 0.041Food allergy * restricted State 0.615 0.338 0.081Connecticut, North Carolina, Oklahoma, and Texas are defined as States with milk restrictions.

J-6
Table J-7―Participant satisfaction with allowed brands of cheese
Dependent variable: Very satisfied with allowed brands of cheeseMean of dependent variable: 0.836Number of observations 1,255Percent concordant pairs 56.4
ParameterEstimatedcoefficient P-value Effect at mean
Intercept 2.087 <.0001 0.286African-American −0.165 0.427 −0.023Hispanic 0.129 0.535 0.018High school graduate −0.129 0.486 −0.018Number of WIC members 0.010 0.926 0.001Special diet −0.160 0.329 −0.022Food allergy −0.436 0.069 −0.060Resides in State with cheese restrictions −0.420 0.013 −0.058Connecticut and Oklahoma are defined as States with cheese restrictions.
Table J-8―Participant satisfaction with allowed brands of cheese, interactive model
Dependent variable: Very satisfied with allowed brands of cheeseMean of dependent variable: 0.836Number of observations 1,255Percent concordant pairs 57.0
ParameterEstimatedcoefficient P-value Effect at mean
Intercept 2.143 <.0001 0.294African-American −0.162 0.436 −0.022Hispanic 0.119 0.568 0.016High school graduate −0.131 0.478 −0.018Number of WIC members 0.010 0.924 0.001Special diet −0.267 0.214 −0.037Food allergy −0.492 0.118 −0.067Resides in State with cheese restrictions −0.549 0.015 −0.075Special diet * restricted State 0.257 0.438 0.035Food allergy * restricted State 0.134 0.779 0.018Connecticut and Oklahoma are defined as States with cheese restrictions.
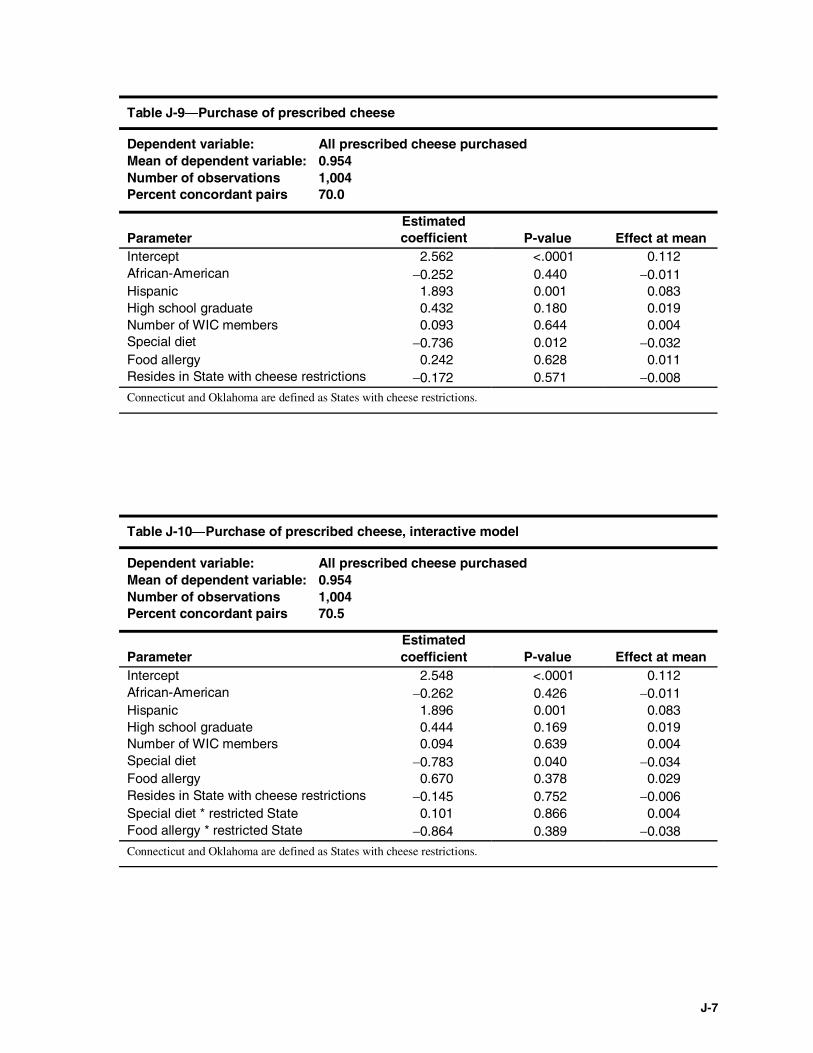
J-7
Table J-9―Purchase of prescribed cheese
Dependent variable: All prescribed cheese purchasedMean of dependent variable: 0.954Number of observations 1,004Percent concordant pairs 70.0
ParameterEstimatedcoefficient P-value Effect at mean
Intercept 2.562 <.0001 0.112African-American −0.252 0.440 −0.011Hispanic 1.893 0.001 0.083High school graduate 0.432 0.180 0.019Number of WIC members 0.093 0.644 0.004Special diet −0.736 0.012 −0.032Food allergy 0.242 0.628 0.011Resides in State with cheese restrictions −0.172 0.571 −0.008Connecticut and Oklahoma are defined as States with cheese restrictions.
Table J-10―Purchase of prescribed cheese, interactive model
Dependent variable: All prescribed cheese purchasedMean of dependent variable: 0.954Number of observations 1,004Percent concordant pairs 70.5
ParameterEstimatedcoefficient P-value Effect at mean
Intercept 2.548 <.0001 0.112African-American −0.262 0.426 −0.011Hispanic 1.896 0.001 0.083High school graduate 0.444 0.169 0.019Number of WIC members 0.094 0.639 0.004Special diet −0.783 0.040 −0.034Food allergy 0.670 0.378 0.029Resides in State with cheese restrictions −0.145 0.752 −0.006Special diet * restricted State 0.101 0.866 0.004Food allergy * restricted State −0.864 0.389 −0.038
Connecticut and Oklahoma are defined as States with cheese restrictions.
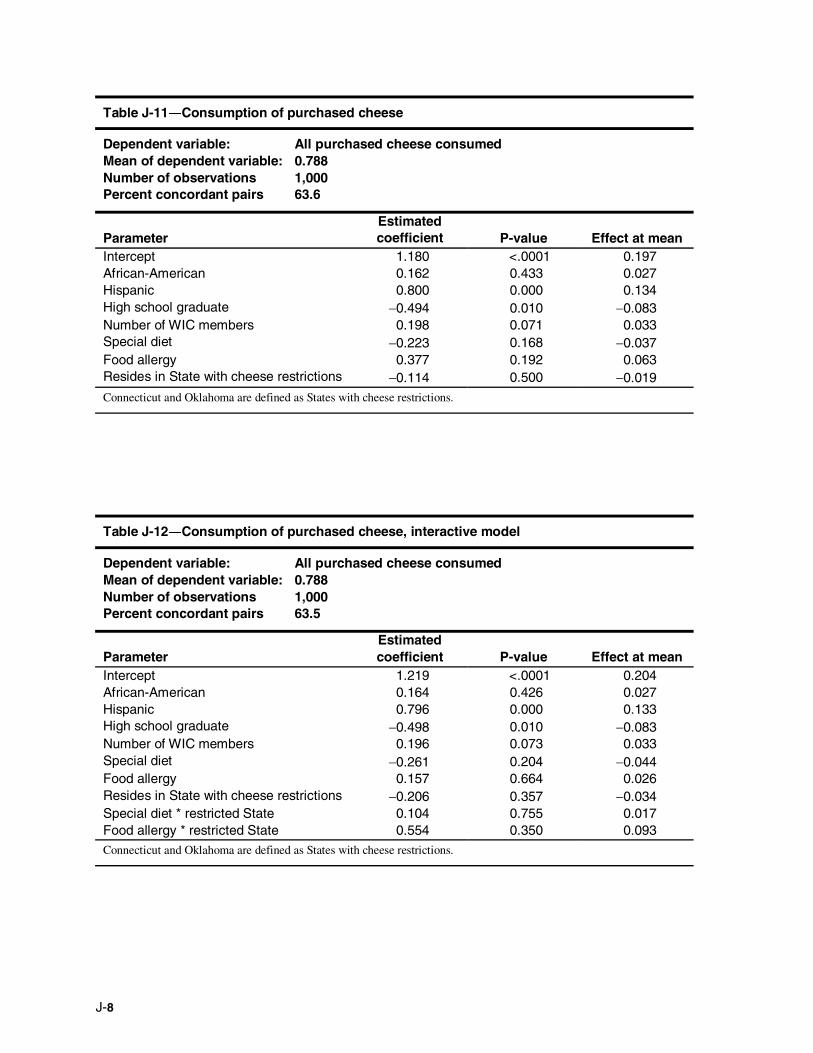
J-8
Table J-11―Consumption of purchased cheese
Dependent variable: All purchased cheese consumedMean of dependent variable: 0.788Number of observations 1,000Percent concordant pairs 63.6
ParameterEstimatedcoefficient P-value Effect at mean
Intercept 1.180 <.0001 0.197African-American 0.162 0.433 0.027Hispanic 0.800 0.000 0.134High school graduate −0.494 0.010 −0.083Number of WIC members 0.198 0.071 0.033Special diet −0.223 0.168 −0.037Food allergy 0.377 0.192 0.063Resides in State with cheese restrictions −0.114 0.500 −0.019Connecticut and Oklahoma are defined as States with cheese restrictions.
Table J-12―Consumption of purchased cheese, interactive model
Dependent variable: All purchased cheese consumedMean of dependent variable: 0.788Number of observations 1,000Percent concordant pairs 63.5
ParameterEstimatedcoefficient P-value Effect at mean
Intercept 1.219 <.0001 0.204African-American 0.164 0.426 0.027Hispanic 0.796 0.000 0.133High school graduate −0.498 0.010 −0.083Number of WIC members 0.196 0.073 0.033Special diet −0.261 0.204 −0.044Food allergy 0.157 0.664 0.026Resides in State with cheese restrictions −0.206 0.357 −0.034Special diet * restricted State 0.104 0.755 0.017Food allergy * restricted State 0.554 0.350 0.093Connecticut and Oklahoma are defined as States with cheese restrictions.

J-9
Table J-13―Purchase of prescribed eggs
Dependent variable: All prescribed eggs purchasedMean of dependent variable: 0.955Number of observations 1,012Percent concordant pairs 62.1
ParameterEstimatedcoefficient P-value Effect at mean
Intercept 3.109 <.0001 0.134African-American −0.085 0.816 −0.004Hispanic 1.107 0.011 0.048High school graduate 0.334 0.313 0.014Number of WIC members −0.247 0.164 −0.011Special diet −0.317 0.295 −0.014Food allergy −0.262 0.552 −0.011Resides in State with egg restrictions 0.009 0.978 0.000
Connecticut and Oklahoma are defined as States with egg restrictions.
Table J-14―Purchase of prescribed eggs, interactive model
Dependent variable: All prescribed eggs purchasedMean of dependent variable: 0.955Number of observations 1,012Percent concordant pairs 62.6
ParameterEstimatedcoefficient P-value Effect at mean
Intercept 3.082 <.0001 0.132African-American −0.095 0.796 −0.004Hispanic 1.111 0.012 0.048High school graduate 0.350 0.294 0.015Number of WIC members −0.243 0.173 −0.010Special diet −0.398 0.291 −0.017Food allergy 0.181 0.778 0.008Resides in State with egg restrictions 0.064 0.887 0.003Special diet * restricted State 0.193 0.760 0.008Food allergy * restricted State −0.971 0.270 −0.042Connecticut and Oklahoma are defined as States with egg restrictions.

J-10
Table J-15―Consumption of purchased eggs
Dependent variable: All purchased eggs consumedMean of dependent variable: 0.790Number of observations 1,008Percent concordant pairs 67.9
ParameterEstimatedcoefficient P-value Effect at mean
Intercept 0.817 0.003 0.135African-American 0.192 0.332 0.032Hispanic 1.555 <.0001 0.258High school graduate −0.294 0.126 −0.049Number of WIC members 0.258 0.020 0.043Special diet −0.138 0.396 −0.023Food allergy −0.139 0.589 −0.023Resides in State with egg restrictions −0.245 0.141 −0.041
Connecticut and Oklahoma are defined as States with egg restrictions.
Table J-16―Consumption of purchased eggs, interactive model
Dependent variable: All purchased eggs consumedMean of dependent variable: 0.790Number of observations 1,008Percent concordant pairs 68.4
ParameterEstimatedcoefficient P-value Effect at mean
Intercept 0.739 0.008 0.123African-American 0.195 0.325 0.032Hispanic 1.569 <.0001 0.260High school graduate −0.285 0.138 −0.047Number of WIC members 0.262 0.019 0.043Special diet −0.036 0.866 −0.006Food allergy 0.057 0.872 0.009Resides in State with egg restrictions −0.084 0.707 −0.014Special diet * restricted State −0.259 0.435 −0.043Food allergy * restricted State −0.438 0.396 −0.073
Connecticut and Oklahoma are defined as States with egg restrictions.
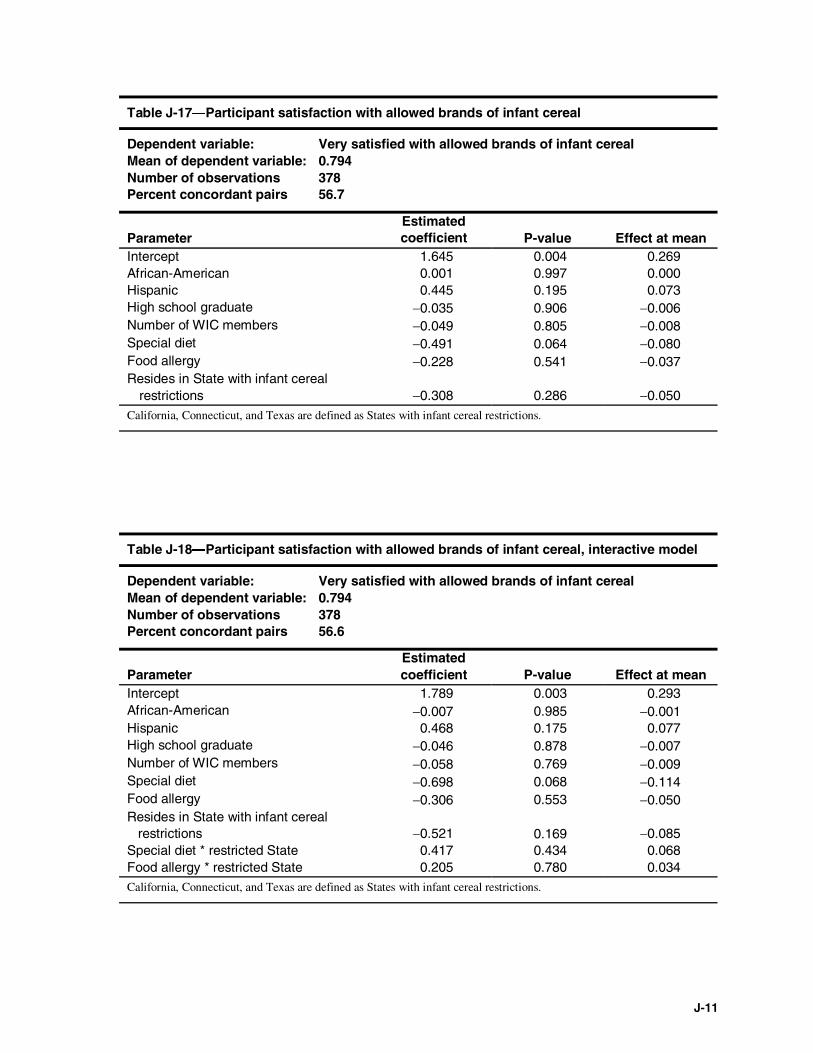
J-11
Table J-17―Participant satisfaction with allowed brands of infant cereal
Dependent variable: Very satisfied with allowed brands of infant cerealMean of dependent variable: 0.794Number of observations 378Percent concordant pairs 56.7
ParameterEstimatedcoefficient P-value Effect at mean
Intercept 1.645 0.004 0.269African-American 0.001 0.997 0.000Hispanic 0.445 0.195 0.073High school graduate −0.035 0.906 −0.006Number of WIC members −0.049 0.805 −0.008Special diet −0.491 0.064 −0.080Food allergy −0.228 0.541 −0.037Resides in State with infant cereal
restrictions −0.308 0.286 −0.050California, Connecticut, and Texas are defined as States with infant cereal restrictions.
Table J-18―Participant satisfaction with allowed brands of infant cereal, interactive model
Dependent variable: Very satisfied with allowed brands of infant cerealMean of dependent variable: 0.794Number of observations 378Percent concordant pairs 56.6
ParameterEstimatedcoefficient P-value Effect at mean
Intercept 1.789 0.003 0.293African-American −0.007 0.985 −0.001Hispanic 0.468 0.175 0.077High school graduate −0.046 0.878 −0.007Number of WIC members −0.058 0.769 −0.009Special diet −0.698 0.068 −0.114Food allergy −0.306 0.553 −0.050Resides in State with infant cereal
restrictions −0.521 0.169 −0.085Special diet * restricted State 0.417 0.434 0.068Food allergy * restricted State 0.205 0.780 0.034California, Connecticut, and Texas are defined as States with infant cereal restrictions.
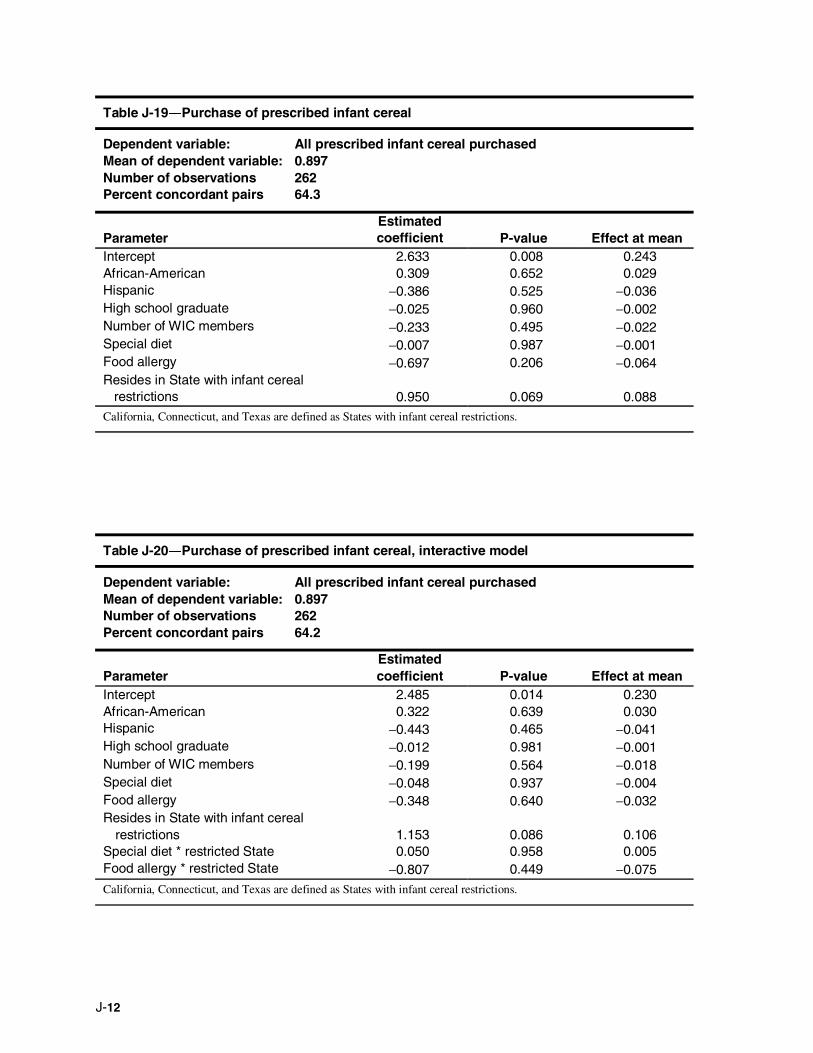
J-12
Table J-19―Purchase of prescribed infant cereal
Dependent variable: All prescribed infant cereal purchasedMean of dependent variable: 0.897Number of observations 262Percent concordant pairs 64.3
ParameterEstimatedcoefficient P-value Effect at mean
Intercept 2.633 0.008 0.243African-American 0.309 0.652 0.029Hispanic −0.386 0.525 −0.036High school graduate −0.025 0.960 −0.002Number of WIC members −0.233 0.495 −0.022Special diet −0.007 0.987 −0.001Food allergy −0.697 0.206 −0.064Resides in State with infant cereal
restrictions 0.950 0.069 0.088California, Connecticut, and Texas are defined as States with infant cereal restrictions.
Table J-20―Purchase of prescribed infant cereal, interactive model
Dependent variable: All prescribed infant cereal purchasedMean of dependent variable: 0.897Number of observations 262Percent concordant pairs 64.2
ParameterEstimatedcoefficient P-value Effect at mean
Intercept 2.485 0.014 0.230African-American 0.322 0.639 0.030Hispanic −0.443 0.465 −0.041High school graduate −0.012 0.981 −0.001Number of WIC members −0.199 0.564 −0.018Special diet −0.048 0.937 −0.004Food allergy −0.348 0.640 −0.032Resides in State with infant cereal
restrictions 1.153 0.086 0.106Special diet * restricted State 0.050 0.958 0.005Food allergy * restricted State −0.807 0.449 −0.075California, Connecticut, and Texas are defined as States with infant cereal restrictions.
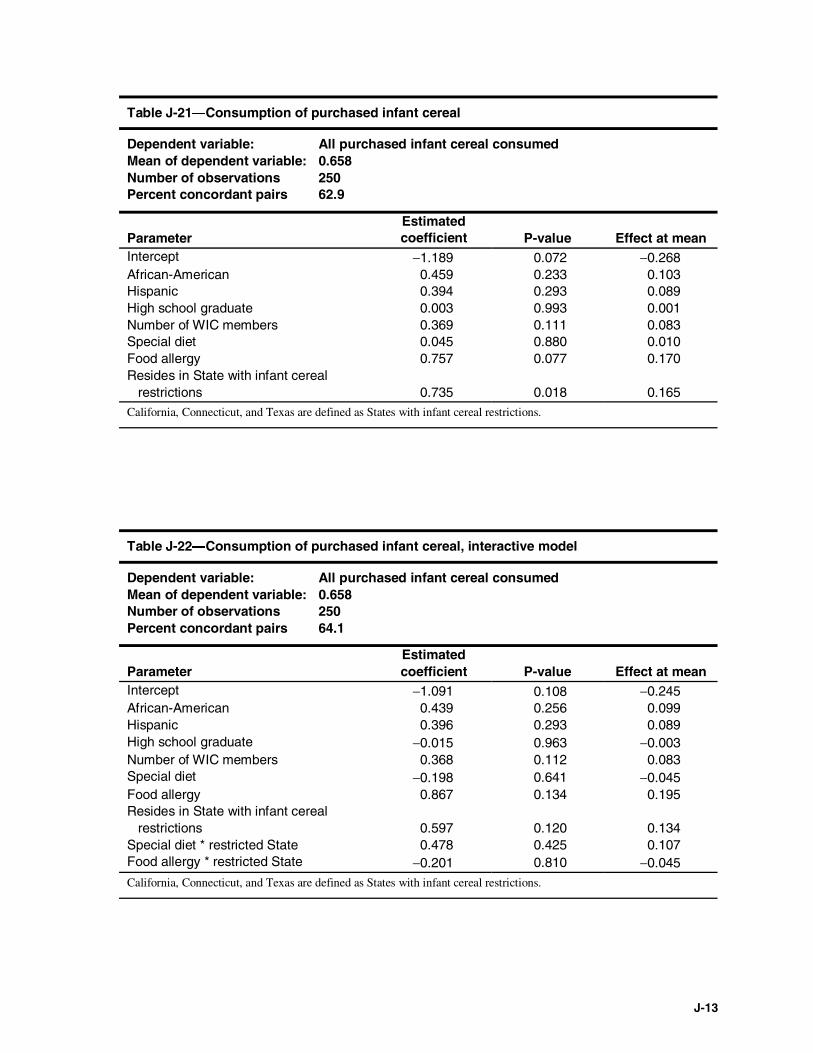
J-13
Table J-21―Consumption of purchased infant cereal
Dependent variable: All purchased infant cereal consumedMean of dependent variable: 0.658Number of observations 250Percent concordant pairs 62.9
ParameterEstimatedcoefficient P-value Effect at mean
Intercept −1.189 0.072 −0.268African-American 0.459 0.233 0.103Hispanic 0.394 0.293 0.089High school graduate 0.003 0.993 0.001Number of WIC members 0.369 0.111 0.083Special diet 0.045 0.880 0.010Food allergy 0.757 0.077 0.170Resides in State with infant cereal
restrictions 0.735 0.018 0.165California, Connecticut, and Texas are defined as States with infant cereal restrictions.
Table J-22―Consumption of purchased infant cereal, interactive model
Dependent variable: All purchased infant cereal consumedMean of dependent variable: 0.658Number of observations 250Percent concordant pairs 64.1
ParameterEstimatedcoefficient P-value Effect at mean
Intercept −1.091 0.108 −0.245African-American 0.439 0.256 0.099Hispanic 0.396 0.293 0.089High school graduate −0.015 0.963 −0.003Number of WIC members 0.368 0.112 0.083Special diet −0.198 0.641 −0.045Food allergy 0.867 0.134 0.195Resides in State with infant cereal
restrictions 0.597 0.120 0.134Special diet * restricted State 0.478 0.425 0.107Food allergy * restricted State −0.201 0.810 −0.045California, Connecticut, and Texas are defined as States with infant cereal restrictions.
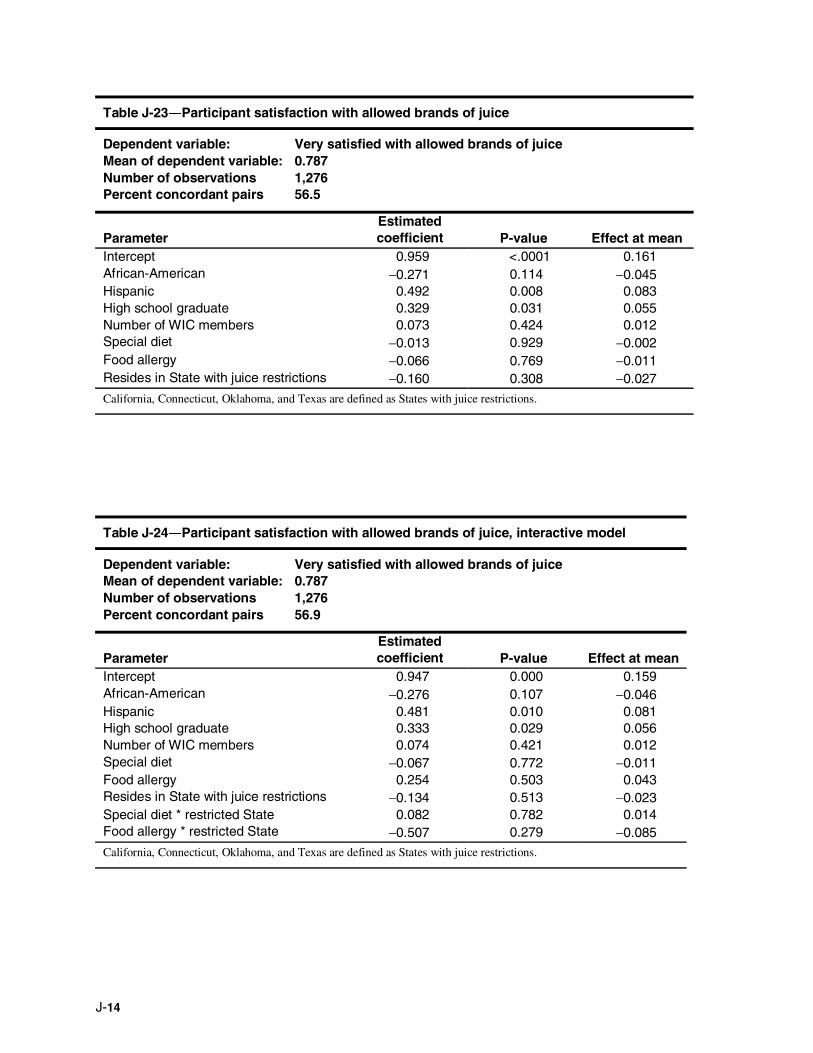
J-14
Table J-23―Participant satisfaction with allowed brands of juice
Dependent variable: Very satisfied with allowed brands of juiceMean of dependent variable: 0.787Number of observations 1,276Percent concordant pairs 56.5
ParameterEstimatedcoefficient P-value Effect at mean
Intercept 0.959 <.0001 0.161African-American −0.271 0.114 −0.045Hispanic 0.492 0.008 0.083High school graduate 0.329 0.031 0.055Number of WIC members 0.073 0.424 0.012Special diet −0.013 0.929 −0.002Food allergy −0.066 0.769 −0.011Resides in State with juice restrictions −0.160 0.308 −0.027
California, Connecticut, Oklahoma, and Texas are defined as States with juice restrictions.
Table J-24―Participant satisfaction with allowed brands of juice, interactive model
Dependent variable: Very satisfied with allowed brands of juiceMean of dependent variable: 0.787Number of observations 1,276Percent concordant pairs 56.9
ParameterEstimatedcoefficient P-value Effect at mean
Intercept 0.947 0.000 0.159African-American −0.276 0.107 −0.046Hispanic 0.481 0.010 0.081High school graduate 0.333 0.029 0.056Number of WIC members 0.074 0.421 0.012Special diet −0.067 0.772 −0.011Food allergy 0.254 0.503 0.043Resides in State with juice restrictions −0.134 0.513 −0.023Special diet * restricted State 0.082 0.782 0.014Food allergy * restricted State −0.507 0.279 −0.085California, Connecticut, Oklahoma, and Texas are defined as States with juice restrictions.
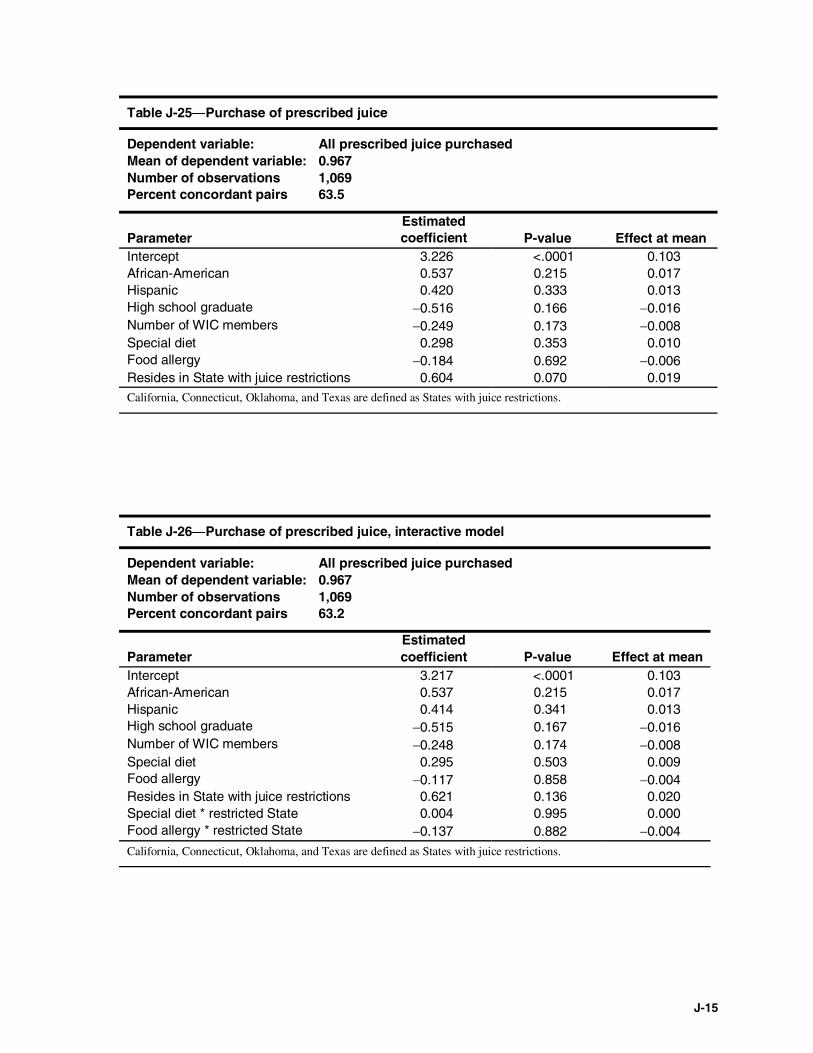
J-15
Table J-25―Purchase of prescribed juice
Dependent variable: All prescribed juice purchasedMean of dependent variable: 0.967Number of observations 1,069Percent concordant pairs 63.5
ParameterEstimatedcoefficient P-value Effect at mean
Intercept 3.226 <.0001 0.103African-American 0.537 0.215 0.017Hispanic 0.420 0.333 0.013High school graduate −0.516 0.166 −0.016Number of WIC members −0.249 0.173 −0.008Special diet 0.298 0.353 0.010Food allergy −0.184 0.692 −0.006Resides in State with juice restrictions 0.604 0.070 0.019California, Connecticut, Oklahoma, and Texas are defined as States with juice restrictions.
Table J-26―Purchase of prescribed juice, interactive model
Dependent variable: All prescribed juice purchasedMean of dependent variable: 0.967Number of observations 1,069Percent concordant pairs 63.2
ParameterEstimatedcoefficient P-value Effect at mean
Intercept 3.217 <.0001 0.103African-American 0.537 0.215 0.017Hispanic 0.414 0.341 0.013High school graduate −0.515 0.167 −0.016Number of WIC members −0.248 0.174 −0.008Special diet 0.295 0.503 0.009Food allergy −0.117 0.858 −0.004Resides in State with juice restrictions 0.621 0.136 0.020Special diet * restricted State 0.004 0.995 0.000Food allergy * restricted State −0.137 0.882 −0.004
California, Connecticut, Oklahoma, and Texas are defined as States with juice restrictions.
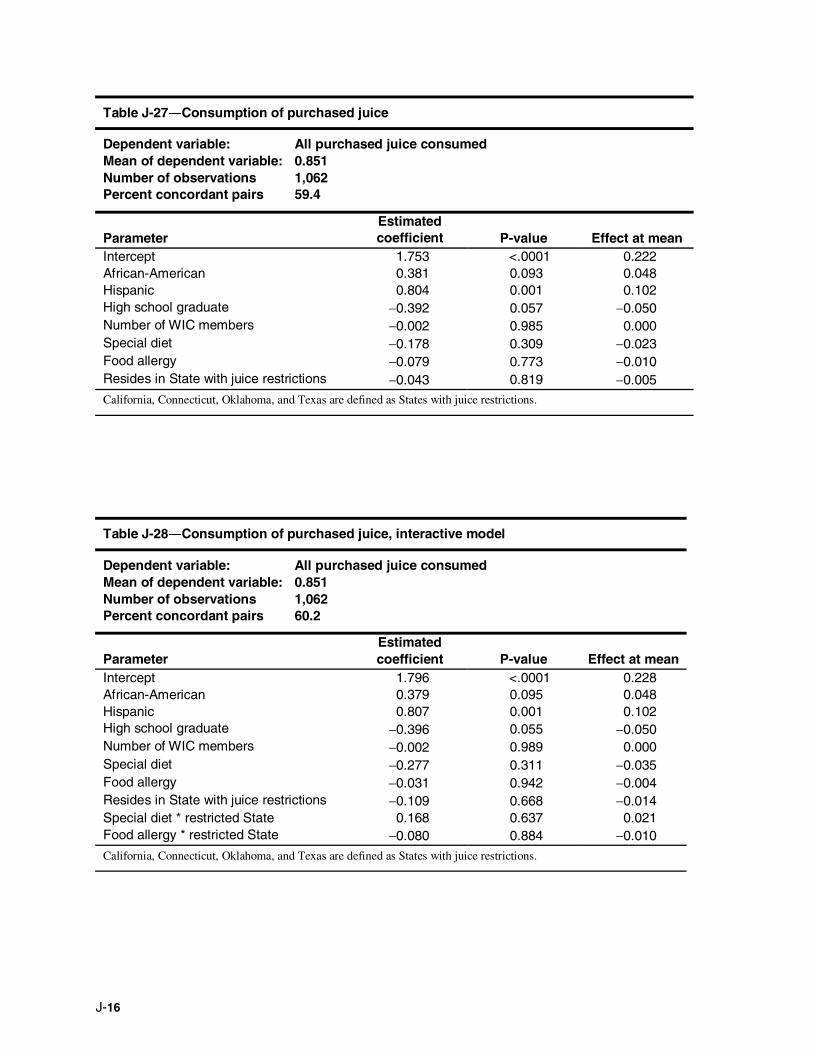
J-16
Table J-27―Consumption of purchased juice
Dependent variable: All purchased juice consumedMean of dependent variable: 0.851Number of observations 1,062Percent concordant pairs 59.4
ParameterEstimatedcoefficient P-value Effect at mean
Intercept 1.753 <.0001 0.222African-American 0.381 0.093 0.048Hispanic 0.804 0.001 0.102High school graduate −0.392 0.057 −0.050Number of WIC members −0.002 0.985 0.000Special diet −0.178 0.309 −0.023Food allergy −0.079 0.773 −0.010Resides in State with juice restrictions −0.043 0.819 −0.005California, Connecticut, Oklahoma, and Texas are defined as States with juice restrictions.
Table J-28―Consumption of purchased juice, interactive model
Dependent variable: All purchased juice consumedMean of dependent variable: 0.851Number of observations 1,062Percent concordant pairs 60.2
ParameterEstimatedcoefficient P-value Effect at mean
Intercept 1.796 <.0001 0.228African-American 0.379 0.095 0.048Hispanic 0.807 0.001 0.102High school graduate −0.396 0.055 −0.050Number of WIC members −0.002 0.989 0.000Special diet −0.277 0.311 −0.035Food allergy −0.031 0.942 −0.004Resides in State with juice restrictions −0.109 0.668 −0.014Special diet * restricted State 0.168 0.637 0.021Food allergy * restricted State −0.080 0.884 −0.010
California, Connecticut, Oklahoma, and Texas are defined as States with juice restrictions.
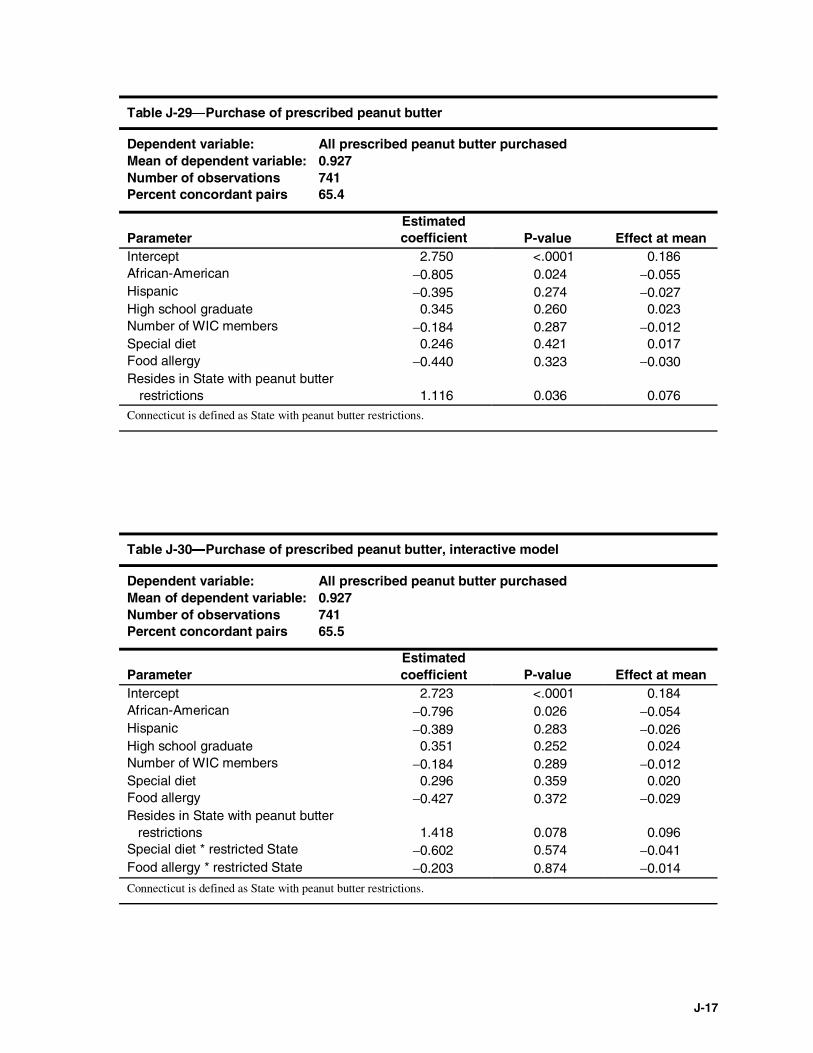
J-17
Table J-29―Purchase of prescribed peanut butter
Dependent variable: All prescribed peanut butter purchasedMean of dependent variable: 0.927Number of observations 741Percent concordant pairs 65.4
ParameterEstimatedcoefficient P-value Effect at mean
Intercept 2.750 <.0001 0.186African-American −0.805 0.024 −0.055Hispanic −0.395 0.274 −0.027High school graduate 0.345 0.260 0.023Number of WIC members −0.184 0.287 −0.012Special diet 0.246 0.421 0.017Food allergy −0.440 0.323 −0.030Resides in State with peanut butter
restrictions 1.116 0.036 0.076Connecticut is defined as State with peanut butter restrictions.
Table J-30―Purchase of prescribed peanut butter, interactive model
Dependent variable: All prescribed peanut butter purchasedMean of dependent variable: 0.927Number of observations 741Percent concordant pairs 65.5
ParameterEstimatedcoefficient P-value Effect at mean
Intercept 2.723 <.0001 0.184African-American −0.796 0.026 −0.054Hispanic −0.389 0.283 −0.026High school graduate 0.351 0.252 0.024Number of WIC members −0.184 0.289 −0.012Special diet 0.296 0.359 0.020Food allergy −0.427 0.372 −0.029Resides in State with peanut butter
restrictions 1.418 0.078 0.096Special diet * restricted State −0.602 0.574 −0.041Food allergy * restricted State −0.203 0.874 −0.014
Connecticut is defined as State with peanut butter restrictions.

J-18
Table J-31―Consumption of purchased peanut butter
Dependent variable: All purchased peanut butter consumedMean of dependent variable: 0.616Number of observations 686Percent concordant pairs 58.0
ParameterEstimatedcoefficient P-value Effect at mean
Intercept 0.483 0.065 0.114African-American −0.408 0.049 −0.097Hispanic 0.013 0.950 0.003High school graduate −0.060 0.742 −0.014Number of WIC members 0.148 0.159 0.035Special diet −0.375 0.022 −0.089Food allergy 0.212 0.430 0.050Resides in State with peanut butter
restrictions −0.045 0.823 −0.011
Connecticut is defined as State with peanut butter restrictions.
Table J-32―Consumption of purchased peanut butter, interactive model
Dependent variable: All purchased peanut butter consumedMean of dependent variable: 0.616Number of observations 686Percent concordant pairs 57.9
ParameterEstimatedcoefficient P-value Effect at mean
Intercept 0.547 0.040 0.129African-American −0.423 0.043 −0.100Hispanic 0.002 0.991 0.001High school graduate −0.075 0.683 −0.018Number of WIC members 0.145 0.168 0.034Special diet −0.451 0.014 −0.107Food allergy 0.072 0.820 0.017Resides in State with peanut butter
restrictions −0.298 0.272 −0.070Special diet * restricted State 0.424 0.293 0.100Food allergy * restricted State 0.553 0.358 0.131
Connecticut is defined as State with peanut butter restrictions.

J-19
Table J-33―Purchase of prescribed beans
Dependent variable: All prescribed beans purchasedMean of dependent variable: 0.869Number of observations 548Percent concordant pairs 73.5
ParameterEstimatedcoefficient P-value Effect at mean
Intercept 0.027 0.946 0.003African-American 0.251 0.379 0.029Hispanic 2.094 <.0001 0.238High school graduate 0.103 0.699 0.012Number of WIC members 0.319 0.048 0.036Special diet 0.354 0.159 0.040Food allergy −0.354 0.362 −0.040Resides in State with bean restrictions 0.787 0.029 0.090Oklahoma is defined as State with bean restrictions.
Table J-34―Purchase of prescribed beans, interactive model
Dependent variable: All prescribed beans purchasedMean of dependent variable: 0.869Number of observations 548Percent concordant pairs 74.1
ParameterEstimatedcoefficient P-value Effect at mean
Intercept −0.032 0.935 −0.004African-American 0.237 0.409 0.027Hispanic 2.125 <.0001 0.242High school graduate 0.103 0.699 0.012Number of WIC members 0.313 0.054 0.036Special diet 0.483 0.075 0.055Food allergy −0.233 0.577 −0.027Resides in State with bean restrictions 1.195 0.014 0.136Special diet * restricted State −0.834 0.273 −0.095Food allergy * restricted State −0.592 0.594 −0.067Oklahoma is defined as State with bean restrictions.

J-20
Table J-35―Consumption of purchased beans
Dependent variable: All purchased beans consumedMean of dependent variable: 0.696Number of observations 453Percent concordant pairs 76.5
ParameterEstimatedcoefficient P-value Effect at mean
Intercept 0.428 0.275 0.091African-American 0.408 0.181 0.086Hispanic 1.808 <.0001 0.383High school graduate −0.688 0.008 −0.146Number of WIC members 0.172 0.235 0.036Special diet −0.267 0.265 −0.056Food allergy −0.175 0.667 −0.037Resides in State with bean restrictions −0.367 0.226 −0.078
Oklahoma is defined as State with bean restrictions.
Table J-36―Consumption of purchased beans, interactive model
Dependent variable: All purchased beans consumedMean of dependent variable: 0.696Number of observations 453Percent concordant pairs 76.2
ParameterEstimatedcoefficient P-value Effect at mean
Intercept 0.457 0.249 0.097African-American 0.418 0.172 0.088Hispanic 1.783 <.0001 0.377High school graduate −0.695 0.008 −0.147Number of WIC members 0.179 0.219 0.038Special diet −0.352 0.190 −0.075Food allergy −0.081 0.852 −0.017Resides in State with bean restrictions −0.507 0.191 −0.107Special diet * restricted State 0.491 0.425 0.104Food allergy * restricted State −0.969 0.462 −0.205
Oklahoma is defined as State with bean restrictions.
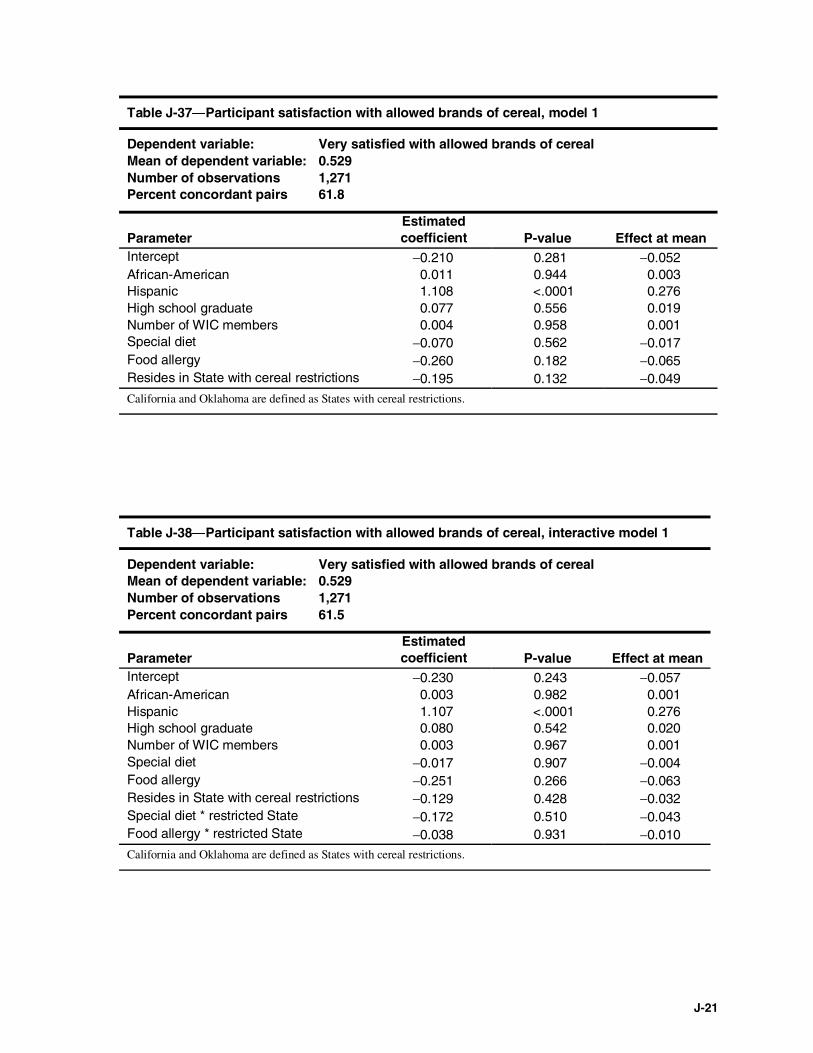
J-21
Table J-37―Participant satisfaction with allowed brands of cereal, model 1
Dependent variable: Very satisfied with allowed brands of cerealMean of dependent variable: 0.529Number of observations 1,271Percent concordant pairs 61.8
ParameterEstimatedcoefficient P-value Effect at mean
Intercept −0.210 0.281 −0.052African-American 0.011 0.944 0.003Hispanic 1.108 <.0001 0.276High school graduate 0.077 0.556 0.019Number of WIC members 0.004 0.958 0.001Special diet −0.070 0.562 −0.017Food allergy −0.260 0.182 −0.065Resides in State with cereal restrictions −0.195 0.132 −0.049
California and Oklahoma are defined as States with cereal restrictions.
Table J-38―Participant satisfaction with allowed brands of cereal, interactive model 1
Dependent variable: Very satisfied with allowed brands of cerealMean of dependent variable: 0.529Number of observations 1,271Percent concordant pairs 61.5
ParameterEstimatedcoefficient P-value Effect at mean
Intercept −0.230 0.243 −0.057African-American 0.003 0.982 0.001Hispanic 1.107 <.0001 0.276High school graduate 0.080 0.542 0.020Number of WIC members 0.003 0.967 0.001Special diet −0.017 0.907 −0.004Food allergy −0.251 0.266 −0.063Resides in State with cereal restrictions −0.129 0.428 −0.032Special diet * restricted State −0.172 0.510 −0.043Food allergy * restricted State −0.038 0.931 −0.010California and Oklahoma are defined as States with cereal restrictions.
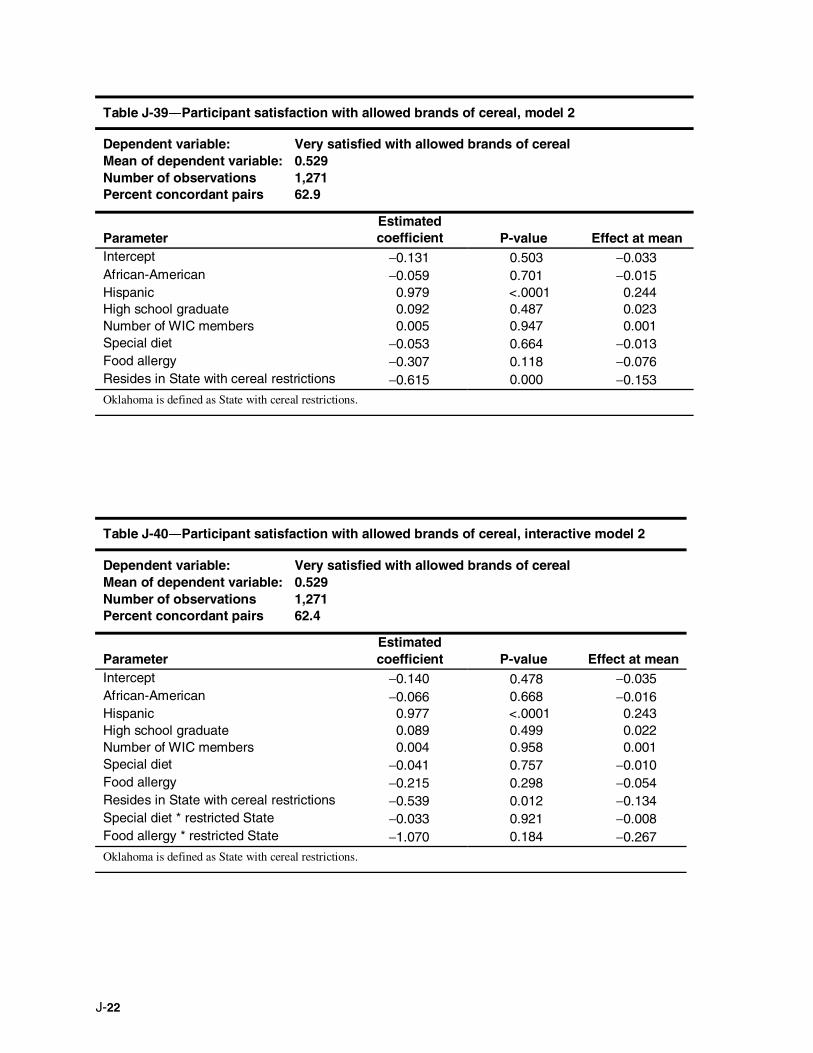
J-22
Table J-39―Participant satisfaction with allowed brands of cereal, model 2
Dependent variable: Very satisfied with allowed brands of cerealMean of dependent variable: 0.529Number of observations 1,271Percent concordant pairs 62.9
ParameterEstimatedcoefficient P-value Effect at mean
Intercept −0.131 0.503 −0.033African-American −0.059 0.701 −0.015Hispanic 0.979 <.0001 0.244High school graduate 0.092 0.487 0.023Number of WIC members 0.005 0.947 0.001Special diet −0.053 0.664 −0.013Food allergy −0.307 0.118 −0.076Resides in State with cereal restrictions −0.615 0.000 −0.153Oklahoma is defined as State with cereal restrictions.
Table J-40―Participant satisfaction with allowed brands of cereal, interactive model 2
Dependent variable: Very satisfied with allowed brands of cerealMean of dependent variable: 0.529Number of observations 1,271Percent concordant pairs 62.4
ParameterEstimatedcoefficient P-value Effect at mean
Intercept −0.140 0.478 −0.035African-American −0.066 0.668 −0.016Hispanic 0.977 <.0001 0.243High school graduate 0.089 0.499 0.022Number of WIC members 0.004 0.958 0.001Special diet −0.041 0.757 −0.010Food allergy −0.215 0.298 −0.054Resides in State with cereal restrictions −0.539 0.012 −0.134Special diet * restricted State −0.033 0.921 −0.008Food allergy * restricted State −1.070 0.184 −0.267Oklahoma is defined as State with cereal restrictions.

J-23
Table J-41―Purchase of prescribed cereal, model 1
Dependent variable: All prescribed cereal purchasedMean of dependent variable: 0.916Number of observations 1,041Percent concordant pairs 64.5
ParameterEstimatedcoefficient P-value Effect at mean
Intercept 2.498 <.0001 0.192African-American 0.325 0.268 0.025Hispanic 1.336 <.0001 0.103High school graduate −0.104 0.689 −0.008Number of WIC members −0.237 0.076 −0.018Special diet 0.131 0.567 0.010Food allergy −0.445 0.160 −0.034Resides in State with cereal restrictions −0.319 0.194 −0.025California and Oklahoma are defined as States with cereal restrictions.
Table J-42―Purchase of prescribed cereal, interactive model 1
Dependent variable: All prescribed cereal purchasedMean of dependent variable: 0.916Number of observations 1,041Percent concordant pairs 64.8
ParameterEstimatedcoefficient P-value Effect at mean
Intercept 2.530 <.0001 0.195African-American 0.338 0.250 0.026Hispanic 1.346 <.0001 0.104High school graduate −0.103 0.693 −0.008Number of WIC members −0.236 0.079 −0.018Special diet 0.002 0.994 0.000Food allergy −0.357 0.329 −0.027Resides in State with cereal restrictions −0.434 0.157 −0.033Special diet * restricted State 0.469 0.363 0.036Food allergy * restricted State −0.405 0.574 −0.031
California and Oklahoma are defined as States with cereal restrictions.

J-24
Table J-43―Purchase of prescribed cereal, model 2
Dependent variable: All prescribed cereal purchasedMean of dependent variable: 0.916Number of observations 1,041Percent concordant pairs 64.5
ParameterEstimatedcoefficient P-value Effect at mean
Intercept 2.509 <.0001 0.193African-American 0.304 0.302 0.023Hispanic 1.195 0.000 0.092High school graduate −0.102 0.696 −0.008Number of WIC members −0.235 0.079 −0.018Special diet 0.136 0.551 0.010Food allergy −0.458 0.150 −0.035Resides in State with cereal restrictions −0.412 0.128 −0.032
Oklahoma is defined as State with cereal restrictions.
Table J-44―Purchase of prescribed cereal, interactive model 2
Dependent variable: All prescribed cereal purchasedMean of dependent variable: 0.916Number of observations 1,041Percent concordant pairs 65.4
ParameterEstimatedcoefficient P-value Effect at mean
Intercept 2.548 <.0001 0.196African-American 0.321 0.278 0.025Hispanic 1.177 0.000 0.091High school graduate −0.096 0.713 −0.007Number of WIC members −0.229 0.089 −0.018Special diet −0.029 0.909 −0.002Food allergy −0.390 0.265 −0.030Resides in State with cereal restrictions −0.642 0.055 −0.049Special diet * restricted State 0.850 0.158 0.065Food allergy * restricted State −0.563 0.504 −0.043Oklahoma is defined as State with cereal restrictions.
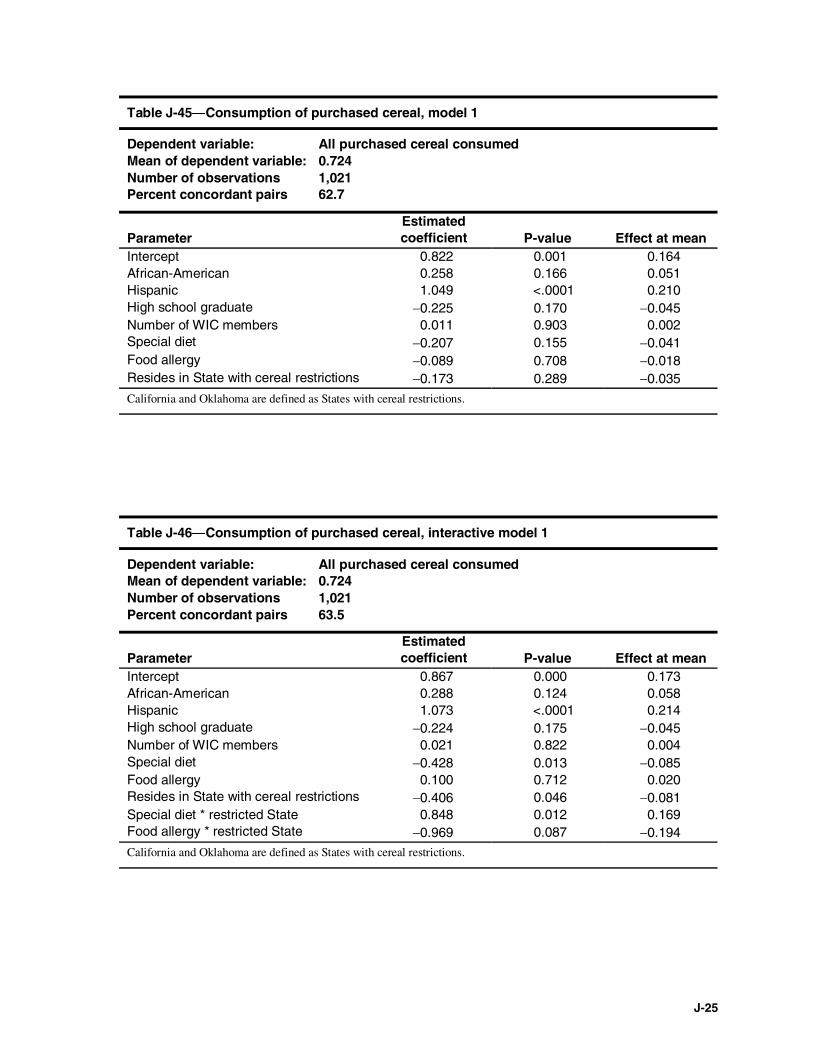
J-25
Table J-45―Consumption of purchased cereal, model 1
Dependent variable: All purchased cereal consumedMean of dependent variable: 0.724Number of observations 1,021Percent concordant pairs 62.7
ParameterEstimatedcoefficient P-value Effect at mean
Intercept 0.822 0.001 0.164African-American 0.258 0.166 0.051Hispanic 1.049 <.0001 0.210High school graduate −0.225 0.170 −0.045Number of WIC members 0.011 0.903 0.002Special diet −0.207 0.155 −0.041Food allergy −0.089 0.708 −0.018Resides in State with cereal restrictions −0.173 0.289 −0.035
California and Oklahoma are defined as States with cereal restrictions.
Table J-46―Consumption of purchased cereal, interactive model 1
Dependent variable: All purchased cereal consumedMean of dependent variable: 0.724Number of observations 1,021Percent concordant pairs 63.5
ParameterEstimatedcoefficient P-value Effect at mean
Intercept 0.867 0.000 0.173African-American 0.288 0.124 0.058Hispanic 1.073 <.0001 0.214High school graduate −0.224 0.175 −0.045Number of WIC members 0.021 0.822 0.004Special diet −0.428 0.013 −0.085Food allergy 0.100 0.712 0.020Resides in State with cereal restrictions −0.406 0.046 −0.081Special diet * restricted State 0.848 0.012 0.169Food allergy * restricted State −0.969 0.087 −0.194California and Oklahoma are defined as States with cereal restrictions.
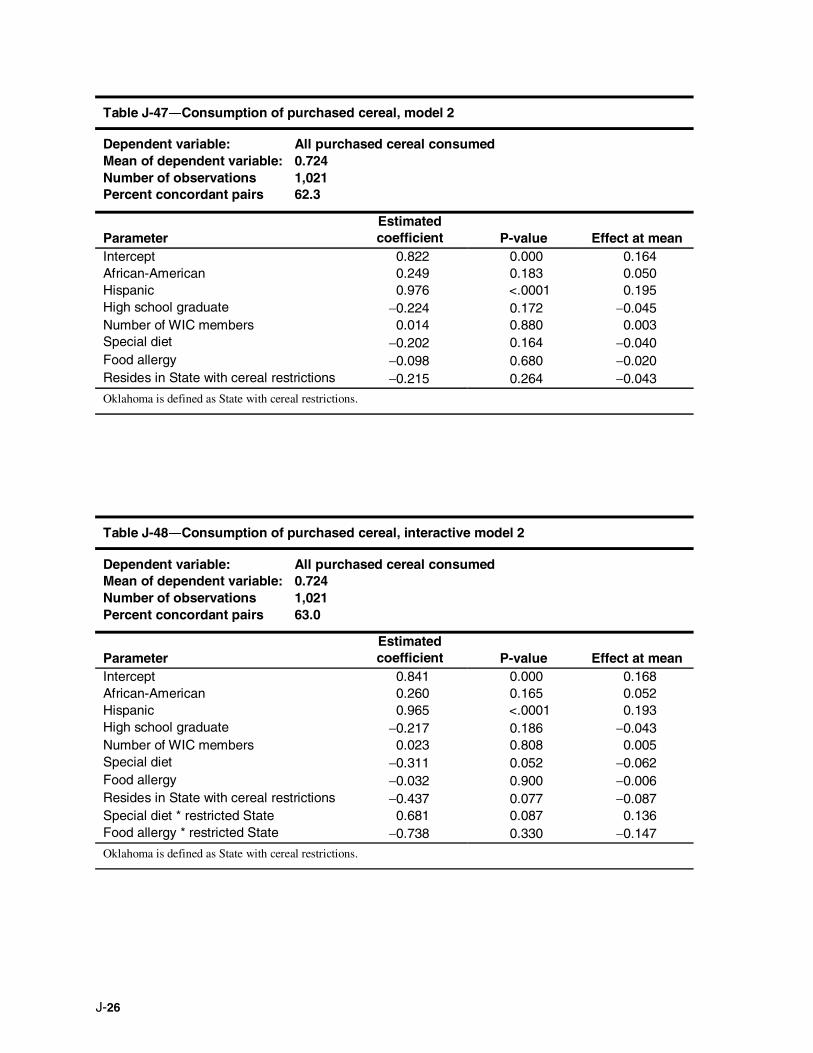
J-26
Table J-47―Consumption of purchased cereal, model 2
Dependent variable: All purchased cereal consumedMean of dependent variable: 0.724Number of observations 1,021Percent concordant pairs 62.3
ParameterEstimatedcoefficient P-value Effect at mean
Intercept 0.822 0.000 0.164African-American 0.249 0.183 0.050Hispanic 0.976 <.0001 0.195High school graduate −0.224 0.172 −0.045Number of WIC members 0.014 0.880 0.003Special diet −0.202 0.164 −0.040Food allergy −0.098 0.680 −0.020Resides in State with cereal restrictions −0.215 0.264 −0.043
Oklahoma is defined as State with cereal restrictions.
Table J-48―Consumption of purchased cereal, interactive model 2
Dependent variable: All purchased cereal consumedMean of dependent variable: 0.724Number of observations 1,021Percent concordant pairs 63.0
ParameterEstimatedcoefficient P-value Effect at mean
Intercept 0.841 0.000 0.168African-American 0.260 0.165 0.052Hispanic 0.965 <.0001 0.193High school graduate −0.217 0.186 −0.043Number of WIC members 0.023 0.808 0.005Special diet −0.311 0.052 −0.062Food allergy −0.032 0.900 −0.006Resides in State with cereal restrictions −0.437 0.077 −0.087Special diet * restricted State 0.681 0.087 0.136Food allergy * restricted State −0.738 0.330 −0.147
Oklahoma is defined as State with cereal restrictions.
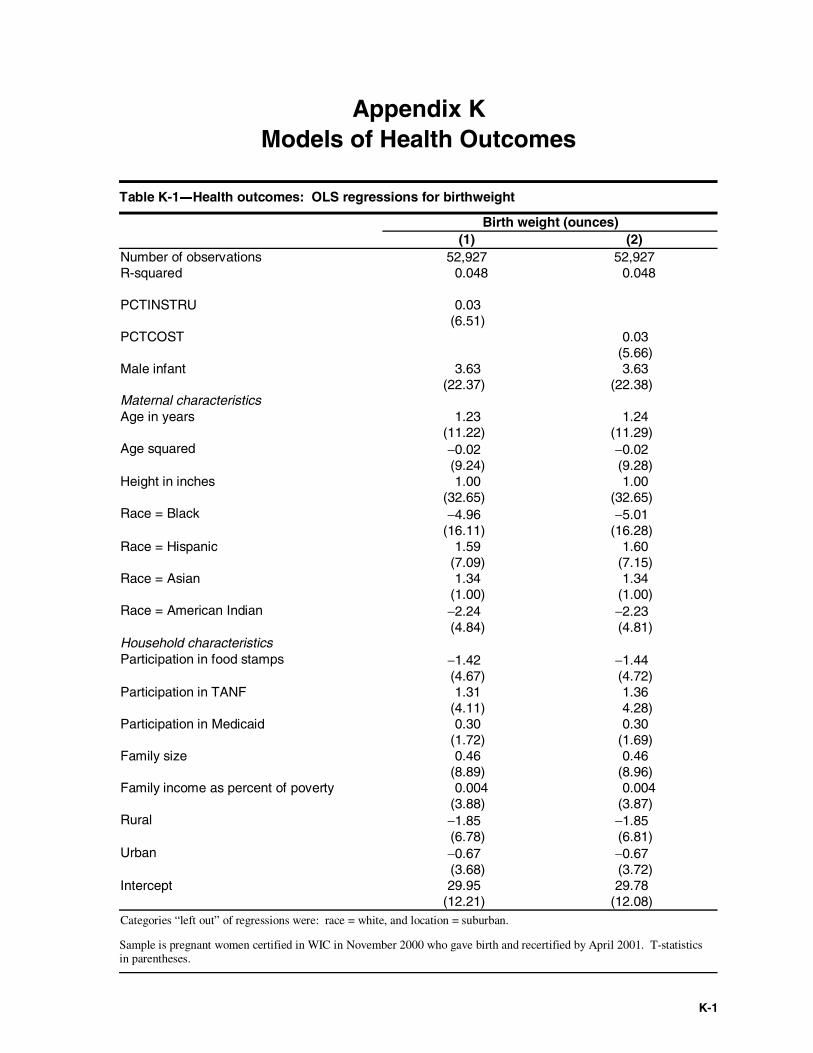
K-1
Appendix KModels of Health Outcomes
Table K-1―Health outcomes: OLS regressions for birthweight
Birth weight (ounces)(1) (2)
Number of observations 52,927 52,927R-squared 0.048 0.048
PCTINSTRU 0.03(6.51)
PCTCOST 0.03(5.66)
Male infant 3.63 3.63(22.37) (22.38)
Maternal characteristicsAge in years 1.23 1.24
(11.22) (11.29)Age squared −0.02 −0.02
(9.24) (9.28)Height in inches 1.00 1.00
(32.65) (32.65)Race = Black −4.96 −5.01
(16.11) (16.28)Race = Hispanic 1.59 1.60
(7.09) (7.15)Race = Asian 1.34 1.34
(1.00) (1.00)Race = American Indian −2.24 −2.23
(4.84) (4.81)Household characteristicsParticipation in food stamps −1.42 −1.44
(4.67) (4.72)Participation in TANF 1.31 1.36
(4.11) 4.28)Participation in Medicaid 0.30 0.30
(1.72) (1.69)Family size 0.46 0.46
(8.89) (8.96)Family income as percent of poverty 0.004 0.004
(3.88) (3.87)Rural −1.85 −1.85
(6.78) (6.81)Urban −0.67 −0.67
(3.68) (3.72)Intercept 29.95 29.78
(12.21) (12.08)Categories “left out” of regressions were: race = white, and location = suburban.
Sample is pregnant women certified in WIC in November 2000 who gave birth and recertified by April 2001. T-statisticsin parentheses.
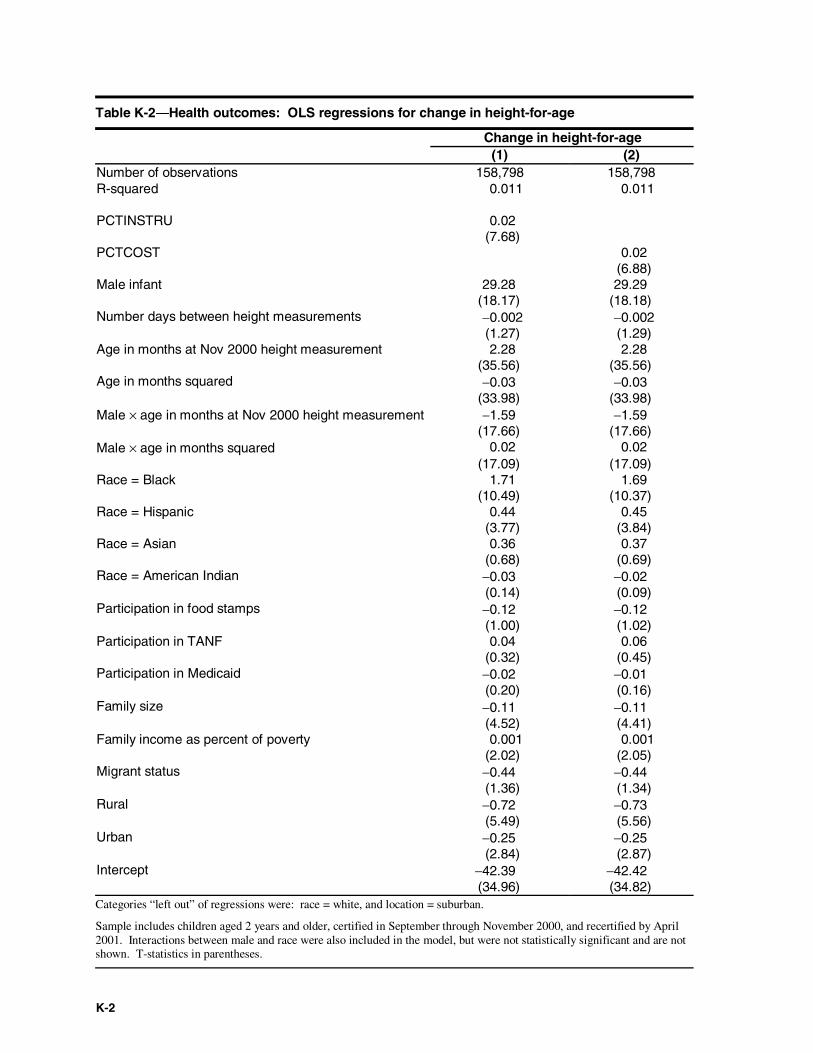
K-2
Table K-2―Health outcomes: OLS regressions for change in height-for-age
Change in height-for-age(1) (2)
Number of observations 158,798 158,798R-squared 0.011 0.011
PCTINSTRU 0.02(7.68)
PCTCOST 0.02(6.88)
Male infant 29.28 29.29(18.17) (18.18)
Number days between height measurements −0.002 −0.002(1.27) (1.29)
Age in months at Nov 2000 height measurement 2.28 2.28(35.56) (35.56)
Age in months squared −0.03 −0.03(33.98) (33.98)
Male × age in months at Nov 2000 height measurement −1.59 −1.59(17.66) (17.66)
Male × age in months squared 0.02 0.02(17.09) (17.09)
Race = Black 1.71 1.69(10.49) (10.37)
Race = Hispanic 0.44 0.45(3.77) (3.84)
Race = Asian 0.36 0.37(0.68) (0.69)
Race = American Indian −0.03 −0.02(0.14) (0.09)
Participation in food stamps −0.12 −0.12(1.00) (1.02)
Participation in TANF 0.04 0.06(0.32) (0.45)
Participation in Medicaid −0.02 −0.01(0.20) (0.16)
Family size −0.11 −0.11(4.52) (4.41)
Family income as percent of poverty 0.001 0.001(2.02) (2.05)
Migrant status −0.44 −0.44(1.36) (1.34)
Rural −0.72 −0.73(5.49) (5.56)
Urban −0.25 −0.25(2.84) (2.87)
Intercept −42.39 −42.42(34.96) (34.82)
Categories “left out” of regressions were: race = white, and location = suburban.
Sample includes children aged 2 years and older, certified in September through November 2000, and recertified by April2001. Interactions between male and race were also included in the model, but were not statistically significant and are notshown. T-statistics in parentheses.
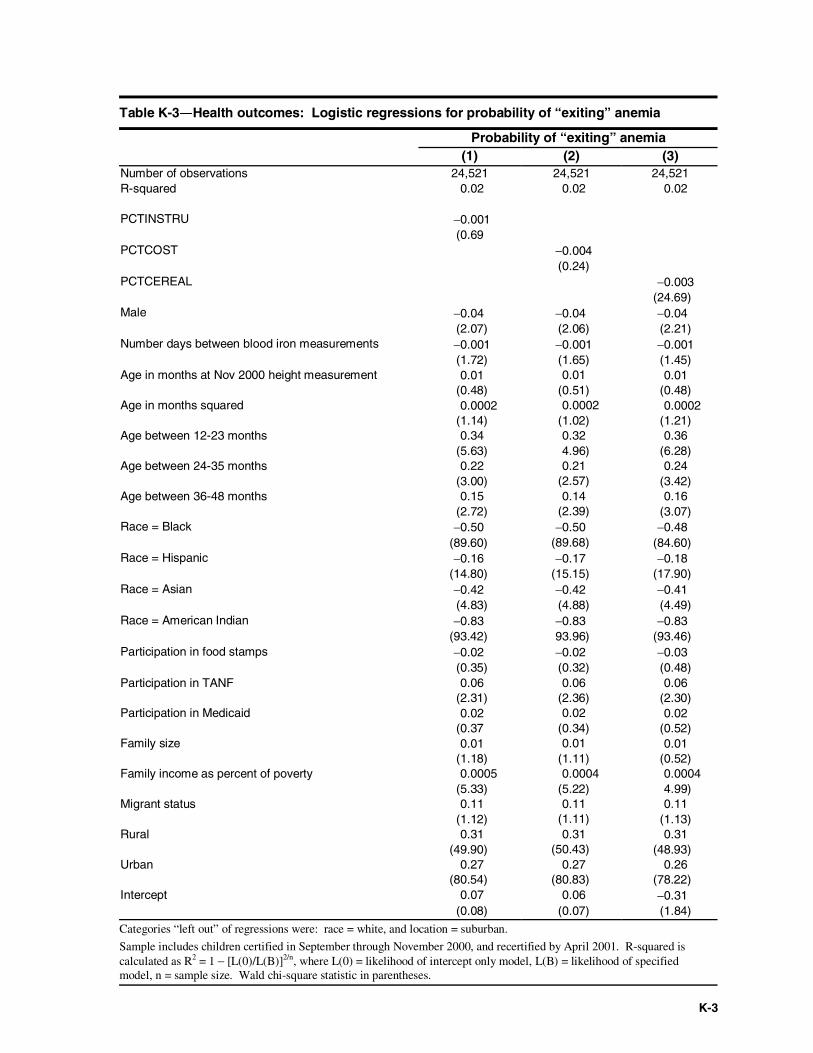
K-3
Table K-3―Health outcomes: Logistic regressions for probability of “exiting” anemia
Probability of “exiting” anemia(1) (2) (3)
Number of observations 24,521 24,521 24,521R-squared 0.02 0.02 0.02
PCTINSTRU −0.001(0.69
PCTCOST −0.004(0.24)
PCTCEREAL −0.003(24.69)
Male −0.04 −0.04 −0.04(2.07) (2.06) (2.21)
Number days between blood iron measurements −0.001 −0.001 −0.001(1.72) (1.65) (1.45)
Age in months at Nov 2000 height measurement 0.01 0.01 0.01(0.48) (0.51) (0.48)
Age in months squared 0.0002 0.0002 0.0002(1.14) (1.02) (1.21)
Age between 12-23 months 0.34 0.32 0.36(5.63) 4.96) (6.28)
Age between 24-35 months 0.22 0.21 0.24(3.00) (2.57) (3.42)
Age between 36-48 months 0.15 0.14 0.16(2.72) (2.39) (3.07)
Race = Black −0.50 −0.50 −0.48(89.60) (89.68) (84.60)
Race = Hispanic −0.16 −0.17 −0.18(14.80) (15.15) (17.90)
Race = Asian −0.42 −0.42 −0.41(4.83) (4.88) (4.49)
Race = American Indian −0.83 −0.83 −0.83(93.42) 93.96) (93.46)
Participation in food stamps −0.02 −0.02 −0.03(0.35) (0.32) (0.48)
Participation in TANF 0.06 0.06 0.06(2.31) (2.36) (2.30)
Participation in Medicaid 0.02 0.02 0.02(0.37 (0.34) (0.52)
Family size 0.01 0.01 0.01(1.18) (1.11) (0.52)
Family income as percent of poverty 0.0005 0.0004 0.0004(5.33) (5.22) 4.99)
Migrant status 0.11 0.11 0.11(1.12) (1.11) (1.13)
Rural 0.31 0.31 0.31(49.90) (50.43) (48.93)
Urban 0.27 0.27 0.26(80.54) (80.83) (78.22)
Intercept 0.07 0.06 −0.31(0.08) (0.07) (1.84)
Categories “left out” of regressions were: race = white, and location = suburban.
Sample includes children certified in September through November 2000, and recertified by April 2001. R-squared iscalculated as R2 = 1 − [L(0)/L(B)]2/n, where L(0) = likelihood of intercept only model, L(B) = likelihood of specifiedmodel, n = sample size. Wald chi-square statistic in parentheses.
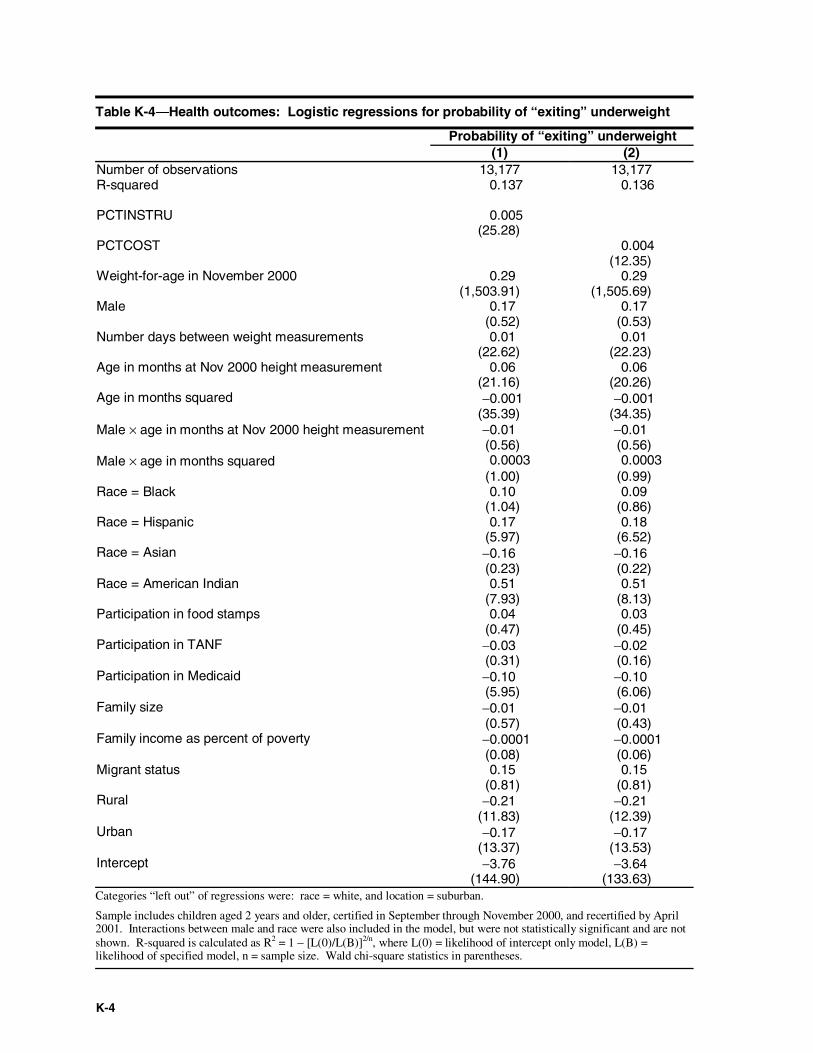
K-4
Table K-4―Health outcomes: Logistic regressions for probability of “exiting” underweight
Probability of “exiting” underweight(1) (2)
Number of observations 13,177 13,177R-squared 0.137 0.136
PCTINSTRU 0.005(25.28)
PCTCOST 0.004(12.35)
Weight-for-age in November 2000 0.29 0.29(1,503.91) (1,505.69)
Male 0.17 0.17(0.52) (0.53)
Number days between weight measurements 0.01 0.01(22.62) (22.23)
Age in months at Nov 2000 height measurement 0.06 0.06(21.16) (20.26)
Age in months squared −0.001 −0.001(35.39) (34.35)
Male × age in months at Nov 2000 height measurement −0.01 −0.01(0.56) (0.56)
Male × age in months squared 0.0003 0.0003(1.00) (0.99)
Race = Black 0.10 0.09(1.04) (0.86)
Race = Hispanic 0.17 0.18(5.97) (6.52)
Race = Asian −0.16 −0.16(0.23) (0.22)
Race = American Indian 0.51 0.51(7.93) (8.13)
Participation in food stamps 0.04 0.03(0.47) (0.45)
Participation in TANF −0.03 −0.02(0.31) (0.16)
Participation in Medicaid −0.10 −0.10(5.95) (6.06)
Family size −0.01 −0.01(0.57) (0.43)
Family income as percent of poverty −0.0001 −0.0001(0.08) (0.06)
Migrant status 0.15 0.15(0.81) (0.81)
Rural −0.21 −0.21(11.83) (12.39)
Urban −0.17 −0.17(13.37) (13.53)
Intercept −3.76 −3.64(144.90) (133.63)
Categories “left out” of regressions were: race = white, and location = suburban.
Sample includes children aged 2 years and older, certified in September through November 2000, and recertified by April2001. Interactions between male and race were also included in the model, but were not statistically significant and are notshown. R-squared is calculated as R2 = 1 − [L(0)/L(B)]2/n, where L(0) = likelihood of intercept only model, L(B) =likelihood of specified model, n = sample size. Wald chi-square statistics in parentheses.