Assessment of Water Quality From Selected Boreholes in ...
143
UNIVERSITY OF NAIROBI ASSESSMENT OF WATER QUALITY FROM SELECTED BOREHOLES IN NAIVASHA SUBCOUNTY, NAKURU COUNTY BY MOENGA DAVID NYAMWEYA I56/80972/2015 Thesis Submitted in Partial Fulfillment for the Award of Degree of Master of Science in Analytical Chemistry of the University of Nairobi. 2020
Transcript of Assessment of Water Quality From Selected Boreholes in ...

UNIVERSITY OF NAIROBI
ASSESSMENT OF WATER QUALITY FROM SELECTED BOREHOLES IN
NAIVASHA SUBCOUNTY, NAKURU COUNTY
BY
MOENGA DAVID NYAMWEYA
I56/80972/2015
Thesis Submitted in Partial Fulfillment for the Award of Degree of Master of
Science in Analytical Chemistry of the
University of Nairobi.
2020


ii
ABSTRACT
This study was undertaken to assess the quality of borehole water from Naivasha area in
Nakuru County. High fluoride levels and the economic activities surrounding the area have
raised a major concern over the quality of borehole water within the area. This study was
conducted during the months of June 2017 to September 2018. Water samples were taken from
7 different boreholes namely: Matangi NNE (Karagita Area), Koinange Car Wash (Police Line
Area), Ushirika Water Project (Kayole Area), Shamba House (Kabati Area), Keroche Borehole
(Karate Area), Joywel School and a private borehole belonging to Geoffrey Kinyanjui. Each
water sample was tested for pH and electrical conductivity using the pH/conductivity meter
(Model: Jenway 3540), turbidity using the bench top turbidimeter (Model: HACH TU 5200) ,
total suspended and dissolved solids (gravimetrically using dry filter papers and beakers), water
color using the color analyzer (Model: LUTRON RGB-1002), fluoride using the EXTECH ®
fluoride meter , chloride using the MOHR’s method with AgNO3 standardized with M NaCl,
chlorine using the EXTECH ® chlorine meter, total hardness by complexometric titration with
EDTA standardized with CaCO3, alkalinity - acid-base titration with H2SO4 standardized with
Na2CO3 , manganese, cadmium, lead, copper, iron, chromium, sodium, potassium, zinc – using
the AAS (Model: Shimadzu AA-6300), with respective standards and hollow cathode lamps,
nitrates, sulfates were determined using the UV/Vis spectrophotometer (Model: Shimadzu UV-
1800 ), and E-coli – using the multiple tube fermentation technique (MTF). A comparison was
made with the East African Standard and the WHO drinking water guidelines. The results
obtained were: pH (7.03-8.45); electrical conductivity (412-1218 µS/cm); turbidity (0.095-
0.355 NTU); total suspended solids (1.93-48.00 mg/L); total dissolved solids (43-421 mg/L);
water color (2-10 TCU); fluoride (1.20-5.00 mg/L); chloride (27.5-79.9 mg/L); chlorine (0.01-
0.08 mg/L); sulfates (154.88-263.88 mg/L); nitrates (6.04-9.94 mg/L); sodium (8.74-17.81
mg/L); potassium (11.80-17.48 mg/L); alkalinity (168.62-511.35 mg/L); total hardness (28.6-
85.78 mg/L as CaCO3); manganese <0.01 mg/L; lead (0.0469-0.1962 mg/L); copper (0.1419-
0.2139 mg/L); zinc (0.0236-0.0374 mg/L); iron (0.0210-0.1369 mg/L); chromium and
cadmium were not detected and E-coli was found to be absent. The results were then compared
with the East African Standard and the WHO guidelines for drinking water. The study showed
that the total suspended solids, chlorine, fluoride and lead levels were higher than the WHO
guideline values while the rest of the parameters met the guideline values. Based on the East
African Standard and the WHO guideline for drinking water, none of the sampled borehole
water was suitable for drinking purposes and therefore, there was need for some remediation
before the water would be safe for drinking.

iii
DEDICATION
This is dedicated to Prof. C.O. Ondari, my friend the late Richard ‘Jadha’ Sidindi and the Moenga’s
family, my supervisors and everyone who in one way or another assisted me in making this a success.

iv
ACKNOWLEDGEMENT
I would like to acknowledge my Director Dr. Hezekiah K. Chepkwony for His support through
my MSc studies, my Unit head Dr. Serah Muteru, National Quality Control Laboratory
Research & Technological Development Deputy Director Dr. Nicholas Mwaura, Prof Isaac
Kibwage for the motivation through my studies, my supervisors Dr. John O. Onyatta, Prof Amir
O. Yusuf, my friend Shadrack Korir who helped me out with the sampling and transport of the
samples back to the laboratory, Duncan Oluoch who helped with biological analysis, George
Okowa who helped me with some elemental analysis, John Odhiambo who helped me with
locating the boreholes in Naivasha, my uncle Prof. Clive Ondari who inspired me to begin the
course and my family who supported me throughout the entire course.
v
TABLE OF CONTENTS
DECLARATION ................................................................................................................................. i
ABSTRACT ....................................................................................................................................... ii
DEDICATION .................................................................................................................................. iii
ACKNOWLEDGEMENT ................................................................................................................. iv
LIST OF TABLES ............................................................................................................................. x
LIST OF FIGURES ......................................................................................................................... xiv
LIST OF ABBREVIATIONS, SYMBOLS AND ACRONYMS ................................................... xvi
CHAPTER ONE ................................................................................................................................. 1
INTRODUCTION .............................................................................................................................. 1
1.1 Background .............................................................................................................................. 1
1.2 Statement of the problem ......................................................................................................... 4
1.3 Objectives of the study ............................................................................................................. 4
1.3.1 General Objective ............................................................................................................. 4
1.3.2 Specific Objectives ........................................................................................................... 4
1.4 Justification and significance of the study ............................................................................... 5
CHAPTER TWO ................................................................................................................................ 6
LITERATURE REVIEW ................................................................................................................... 6
2.1 Water quality ............................................................................................................................ 6
2.2 Physicochemical parameters of water ...................................................................................... 6
2.2.1 pH ...................................................................................................................................... 6
2.2.2 Turbidity ........................................................................................................................... 7
2.2.3 Electrical conductivity ...................................................................................................... 7
2.2.4 Water color........................................................................................................................ 8
2.2.5 Total Suspended Solids (TSS) .......................................................................................... 8
2.2.6 Total dissolved solids (TDS) ............................................................................................ 8
2.3 Inorganic constituents .............................................................................................................. 9
2.3.1 Fluoride ............................................................................................................................. 9
2.3.2 Water hardness ................................................................................................................ 10
2.3.3 Sulfates ............................................................................................................................ 10
2.3.4 Manganese ...................................................................................................................... 11
vi
2.3.5 Iron .................................................................................................................................. 11
2.3.6 Chloride........................................................................................................................... 12
2.4 Heavy metals .......................................................................................................................... 12
2.4.1 Cadmium ......................................................................................................................... 13
2.4.2 Chromium ....................................................................................................................... 13
2.4.3 Lead................................................................................................................................. 14
2.4.4 Zinc ................................................................................................................................. 14
2.4.5 Copper ............................................................................................................................. 15
2.5 Biological water quality parameters ....................................................................................... 15
2.5.1 Escherichia coli (E.coli) ................................................................................................. 15
2.6 Instrumental methods of analysis ........................................................................................... 16
2.6.1 Fluoride Ion-selective electrode ...................................................................................... 16
2.6.2 Atomic absorption spectrometry (AAS) ......................................................................... 17
2.6.3 UV/Vis spectrometry ...................................................................................................... 18
2.6.4 Laser Turbidimeter.......................................................................................................... 19
2.7 Other methods of analysis ...................................................................................................... 20
2.7.1 Escherichia coli (E.coli) ................................................................................................. 20
CHAPTER THREE .......................................................................................................................... 22
MATERIALS AND METHODS ...................................................................................................... 22
3.1 Study area ............................................................................................................................... 22
3.2 The sampling locations........................................................................................................... 23
3.3 Sample collection ................................................................................................................... 28
3.4 Experimental procedure ......................................................................................................... 29
3.4.1 pH .................................................................................................................................... 29
3.4.2 Electrical conductivity .................................................................................................... 29
3.4.3 Turbidity ......................................................................................................................... 30
3.4.4 Water color...................................................................................................................... 30
3.4.5 Total suspended solids (TSS).......................................................................................... 30
3.4.6 Total dissolved solids (TDS) .......................................................................................... 31
3.4.7 Alkalinity ........................................................................................................................ 31
3.4.8 Total Hardness determination ......................................................................................... 33

vii
3.5 Determination of anions in the water samples ....................................................................... 35
3.5.1 Chloride........................................................................................................................... 35
3.5.2 Sulfates ............................................................................................................................ 36
3.5.3 Nitrates ............................................................................................................................ 38
3.6 Elemental determination of the borehole water samples ....................................................... 39
3.6.1 Determination of sodium ................................................................................................ 39
3.6.2 Determination of potassium ............................................................................................ 39
3.6.3 Determination of manganese .......................................................................................... 40
3.6.4 Determination of cadmium ............................................................................................. 40
3.6.5 Determination of lead ..................................................................................................... 41
3.6.6 Determination of copper ................................................................................................. 41
3.6.7 Determination of iron ...................................................................................................... 42
3.6.8 Determination of chromium ............................................................................................ 42
3.6.9 Determination of zinc ..................................................................................................... 43
3.6.10 Determination of Escherichia coli (E.coli) ..................................................................... 44
CHAPTER FOUR ............................................................................................................................ 46
RESULTS AND DISCUSSION ....................................................................................................... 46
4.1 pH ........................................................................................................................................... 46
4.2 Electrical conductivity............................................................................................................ 47
4.3 Turbidity ................................................................................................................................. 49
4.4 Water color ............................................................................................................................. 51
4.5 Total suspended solids ........................................................................................................... 52
4.6 Total dissolved solids ............................................................................................................. 54
4.7 Total hardness ........................................................................................................................ 56
4.7.1 0.01M calcium carbonate standard ................................................................................. 56
4.7.2 EDTA Standardization with 0.01M calcium carbonate standard ................................... 57
4.8 Alkalinity ................................................................................................................................ 59
4.8.1 0.01M Sodium carbonate standard ................................................................................. 59
4.8.2 H2SO4 Standardization with 0.0081957M Na2CO3 standard .......................................... 59
4.9 Concentration of anions in the water samples. ....................................................................... 62
4.10 Concentration of chloride in the water samples ................................................................. 62
viii
4.10.1 0.1M Sodium chloride standard ...................................................................................... 62
4.10.2 Silver nitrate standardization with 0.0999M NaCl standard ........................................... 63
4.10.3 Determination of the blank ............................................................................................. 64
4.11 Chlorine .............................................................................................................................. 66
4.11.1 Chlorine determination in the samples ........................................................................... 66
4.12 Fluoride ............................................................................................................................... 67
4.12.1 Fluoride determination in the samples ............................................................................ 68
4.13 Concentration of sulfates in the samples ............................................................................ 69
4.14 Concentration of nitrates in the samples ............................................................................. 71
4.15 Concentration of cations in the water samples ................................................................... 73
4.16 Concentration of sodium in the samples ............................................................................. 73
4.17 Concentration of potassium in the samples ........................................................................ 75
4.18 Concentration of manganese in the samples ....................................................................... 77
4.19 Concentration of copper in the samples ............................................................................. 79
4.20 Concentration of iron in the samples .................................................................................. 81
4.21 Concentration of cadmium in the samples ......................................................................... 83
4.22 Concentration of lead in the samples .................................................................................. 85
4.23 Concentration of chromium in the samples ........................................................................ 87
4.24 Concentration of zinc in the samples .................................................................................. 89
4.25 Escherichia coli (E.coli) ..................................................................................................... 91
CHAPTER FIVE .............................................................................................................................. 92
CONCLUSIONS AND RECOMMENDATIONS ........................................................................... 92
5.1 Conclusions ............................................................................................................................ 92
5.2 Recommendations .................................................................................................................. 93
References ........................................................................................................................................ 94
APPENDICES ................................................................................................................................ 100
Appendix AI: Calculation of water hardness for Matangi Nne borehole ....................................... 100
Appendix AII: Calculation of water hardness for Shamba House borehole ................................... 101
Appendix AIII: Calculation of water hardness for Ushirika Water Project borehole ..................... 101
Appendix AIV: Calculation of water hardness for Joywel School borehole .................................. 102
Appendix AV: Calculation of water hardness for Keroche borehole ............................................. 102

ix
Appendix AVI: Calculation of water hardness for Geoffrey Kinyanjui borehole .......................... 103
Appendix AVII: Calculation of water hardness for Koinange Car wash borehole ........................ 103
Appendix AVIII: Calculation of water hardness for Bottled water (control sample) ..................... 104
Appendix BI: Calculations for the alkalinity of Matangi Nne borehole ......................................... 105
Appendix BII: Calculations for the alkalinity of Shamba House borehole .................................... 106
Appendix BIII: Calculations for the alkalinity for Ushirika water project borehole ...................... 107
Appendix BIV: Calculations for the alkalinity for Geoffrey Kinyanjui borehole .......................... 108
Appendix BV: Calculations for the alkalinity for Koinange car wash borehole ............................ 109
Appendix BVI: Calculations for the alkalinity for Keroche borehole ............................................ 110
Appendix BVII: Calculations for the alkalinity for Joywel School borehole ................................. 111
Appendix BVIII: Calculations for the alkalinity for Bottled water (control) ................................. 112
Appendix CI: Calculations for the chloride for Matangi Nne borehole ......................................... 114
Appendix CII: Calculations for the chloride for Koinange Car wash borehole ............................. 115
Appendix CIII: Calculations for the chloride for Ushirika Water Project borehole ....................... 115
Appendix CIV: Calculations for the chloride for Geoffrey Kinyanjui borehole. ........................... 116
Appendix CV: Calculations for the chloride for Shamba House borehole ..................................... 116
Appendix CVI: Calculations for the chloride for Keroche borehole .............................................. 117
Appendix CVI: Calculations for the chloride for Joywel School borehole .................................... 117
Appendix DI: Values for Matangi Nne borehole compared to WHO and EAS ............................. 118
Appendix DII: Values for Ushirika Water Project borehole compared to WHO and EAS ............ 119
Appendix DIII: Values for Koinange Car Wash borehole compared to WHO and EAS ............... 120
Appendix DIV: Values for Geoffrey Kinyanjui borehole compared to WHO and EAS................ 121
Appendix DV: Values for Shamba House borehole compared to WHO and EAS ........................ 122
Appendix DVI: Values for Keroche borehole compared to WHO and EAS ................................. 123
Appendix DVII: Values for Joywel School borehole compared to WHO and EAS ...................... 124
Appendix DVIII: Borehole sample information form .................................................................... 125
x
LIST OF TABLES
Table 3.1: AAS conditions for elemental analysis………………………………………………..43
Table 4.1: pH of the borehole water samples……………………………………………………..46
Table 4.2 Electrical conductivity of the borehole water samples………………………….….….48
Table 4.3: Turbidity of the borehole water samples ……………………………………………...49
Table 4.4: Water color of the borehole water samples……….…………………………………...51
Table 4.5: Total suspended solids of the sampled boreholes……………………………………..53
Table 4.6: Total dissolved solids of the sampled boreholes …………………….…….………….55
Table 4.7: EDTA Standardization with 0.009991 M Calcium standard……………………….…57
Table 4.8: Hardness values for the water samples………………..……………………………....58
Table 4.9: H2SO4 Standardization with 0.009991 M Na2CO3 standard………...………………....60
Table 4.10: Phenolphthalein and Total alkalinity for the water samples…….…….………….….61
Table 4.11: Silver nitrate standardization with 0.0999 M NaCl standard……………….………..63
Table 4.12: Determination of the blank…………………………………………….……...….….64
Table 4.13: Chloride values for the water samples……………………………………………....65
Table 4.14: Amount of Chlorine in the borehole Samples…………………………….…………67
Table 4.15: Amount of Fluoride in the borehole Samples………………………………..………68
Table 4.16: Absorbance vs conc. of sulfates calibration standards………………….……….......69
Table 4.17: Actual amounts of sulfates in the samples…………………………….…………….70
Table 4.18: Absorbance vs conc. of nitrates calibration standards…………….……….………..71
Table 4.19: Actual amounts of nitrates in the samples……………………………..…………….72
Table 4.20: Emission vs conc. of sodium calibration standards………………………………….73
Table 4.21: Actual amounts of sodium in the samples………………………………………..….74

xi
Table 4.22: Emission vs conc. of potassium calibration standards……………………….…...75
Table 4.23: Actual amounts of potassium in the samples………………………………….….76
Table 4.24: Absorbance vs conc. of manganese calibration standards…………….………….77
Table 4.25: Actual amount of manganese in the samples………………………………….….78
Table 4.26: Absorbance vs conc. of copper calibration standards…………………………….79
Table 4.27: Actual amount of copper in the samples…………………………………...……..80
Table 4.28: Absorbance vs conc. of iron calibration standards………………………………..81
Table 4.29: Actual amount of iron in the samples……………………………………………..82
Table 4.30: Absorbance vs conc. of cadmium calibration standards…………………………..83
Table 4.31: Actual amount of cadmium in the samples………………………………………..84
Table 4.32: Absorbance vs conc. of lead calibration standards………………………………..85
Table 4.33: Actual amount of lead in the samples………………………………………...…..86
Table 4.34: Absorbance vs conc. of chromium calibration standards…………………….…..87
Table 4.35: Actual amount of chromium in the samples…………………………………..….88
Table 4.36: Absorbance vs conc. of zinc calibration standards……………………….…....…89
Table 4.37: Actual amount of zinc in the samples…...……………………………….….……90
Table 4.38: Presence of E.coli in the samples…........................................................................91
Table 5.1: Matangi Nne borehole water hardness determination………………………………100
Table 5.2: Shamba House borehole water hardness determination………………………….....101
Table 5.3: Ushirika water project borehole water hardness determination ……………………101
Table 5.4: Joywel school borehole water hardness determination……………….…..….…..…102
Table 5.5: Keroche borehole water hardness determination…………….…………..…….……102
Table 5.6: Geoffrey Kinyanjui borehole water hardness determination……………...…………103

xii
Table 5.7: Koinange car wash borehole water hardness determination…………….….………..103
Table 5.8: Bottled water hardness determination…………………………………………...……104
Table 5.9: Matangi Nne borehole phenolphthalein alkalinity determination…….………….…..105
Table 5.10: Matangi Nne borehole total alkalinity determination……………………….….……106
Table 5.11: Shamba House borehole phenolphthalein alkalinity determination………….….…..106
Table 5.12: Shamba House borehole total alkalinity determination…………………………..….107
Table 5.13: Ushirika Water project borehole phenolphthalein alkalinity determination……...….107
Table 5.14: Ushirika water project borehole total alkalinity determination……………………...108
Table 5.15: Geoffrey Kinyanjui borehole phenolphthalein alkalinity determination…...……..…108
Table 5.16: Geoffrey Kinyanjui borehole total alkalinity determination..........................…….....109
Table 5.17: Koinange car wash borehole phenolphthalein alkalinity determination………….....109
Table 5.18: Koinange car wash borehole total alkalinity determination………………….……..110
Table 5.19: Keroche borehole phenolphthalein alkalinity determination……………….……….110
Table 5.20: Keroche borehole total alkalinity determination……………………….……………111
Table 5.21: Joywel school borehole phenolphthalein alkalinity determination….………………111
Table 5.22: Joywel school borehole total alkalinity determination……………….……………...112
Table 5.23: Bottled water phenolphthalein alkalinity determination…………..….……...........…112
Table 5.24: Bottled water total alkalinity determination……………………………...………….113
Table 5.25: Matangi Nne borehole chloride determination………………………………...…....114
Table 5.26: Koinange car wash borehole chloride determination………………….……….…...115
Table 5.27: Ushirika water project borehole chloride determination……………………….…...115
Table 5.28: Geoffrey Kinyanjui borehole chloride determination……………….………………116
Table 5.29: Shamba House borehole chloride determination………………….…….….…….....116

xiii
Table 5.30: Keroche borehole chloride determination………………………….………….…....117
Table 5.31: Joywel school borehole chloride determination…………………………………….117

xiv
LIST OF FIGURES
Figure 1.1: Deformation of bones caused by skeletal fluorosis……………….…………..…….9
Figure 1.2: Manifestation of dental fluorosis exhibited on a child’s teeth…………..…………..9
Figure 2.1: Schematic diagram of an AAS………………………………………….………….18
Figure 2.2: Schematic diagram of a double beam UV/Vis spectrometer…………….…………19
Figure 2.3: Schematic diagram of a Nephelometric turbidimeter…………………….……...…20
Figure 3.1: Map of Naivasha Subcounty showing the boreholes numbered 1-7……...…..……22
Figure 3.2: Sampling at the Joywel primary school borehole …………………...…………..…24
Figure 3.3: Ushirika water project borehole in Kayole Area …………………………………..25
Figure 3.4: Geoffrey Kinyanjui borehole …………………………………………………...….26
Figure 3.5: Sampling at the Kabati Area – Shamba house …………………….……………….27
Figure 3.6: Keroche Industries borehole in Karate area ……………………………………..…28
Figure 4.1: Summary of the pH of the borehole water samples…………………………..…….47
Figure 4.2: Summary of the electrical conductivity of the borehole water samples……….…..49
Figure 4.3: Summary of the Turbidity of the borehole water samples……………………..…..50
Figure 4.4: Summary of the water color of the borehole water samples………………….……52
Figure 4.5: Summary of the TSS values for the sampled boreholes…………………………...54
Figure 4.6: Summary of the TDS values for the sampled boreholes…………………………..56
Figure 4.7: Summary of the total hardness of the borehole water samples……………………59
Figure 4.8: Summary of the PA and TA of the borehole water samples………………………62
Figure 4.9: Summary of the chloride of the borehole water samples ……………………...….66
Figure 4.10: Calibration curve for analysis of sulfates…………………………………...……69
Figure 4.11: Calibration curve for analysis of nitrates…………………………………………71
xv
Figure 4.12: Calibration curve for sodium analysis………………………………………….73
Figure 4.13: Calibration curve for potassium analysis………………………………………75
Figure 4.14: Calibration curve for manganese analysis……………………………………..77
Figure 4.15: Calibration curve for copper analysis…………………………………….……79
Figure 4.16: Calibration curve for iron analysis………………………………………….....81
Figure 4.17: Calibration curve for cadmium analysis……………………………………….83
Figure 4.18: Calibration curve for lead analysis…………………………………………….85
Figure 4.19: Calibration curve for chromium analysis……………………………………...87
Figure 4.20: Calibration curve for zinc analysis…………………………………………….89

xvi
LIST OF ABBREVIATIONS, SYMBOLS AND ACRONYMS
AAS - Atomic absorption Spectrometer
AMD - Acid mine drainage
BH - Borehole
BGLB - Brilliant green lactose bile broth
CW - Car wash
EBT - Eriochrome black-T indicator
EAS - East African Standard
EC - Electrical conductivity
E.Coli - Escherichia Coli
EDTA - Ethylenediaminetetraacetic acid
EOLSS - Encyclopoedia of life support systems
EPA - Environmental Protection Agency
GK - Geoffrey Kinyanjui
HSE - House
ISE - Ion-selective Electrode
ISO - International Organization for Standardization
KEBS - Kenya Bureau of Standards
KSPCA - Kenya Society for the Protection and Care of Animals
LST - Lauryl sulfate tryptose broth
MTF - Multiple tube fermentation technique
ND - Not detected
NEMA - National Environment Management Authority

xvii
NGO - Non Governmental Organization
NMT - Not more than
NTU - Nephelometric turbidity units
PA - Phenolphthalein alkalinity
SCH - School
TA - Total alkalinity
TCU - True color units
TDS - Total dissolved solids
TH - Total hardness
TOC - Total organic carbon
TSS - Total suspended solids
UNESCO - United Nations Educational Scientific and Cultural Organization
UTI - Urinary tract infections
UV/Vis - Ultra Violet/ Visible Spectrophotometer
WHO - World Health Organization
WP - Water project
W/V - Weight to volume

1
CHAPTER ONE
INTRODUCTION
1.1 Background
Contamination of surface and groundwater has become an increased environmental concern
in Kenya (Kenya National Water Development report, 2005). This is due to many different
natural and anthropogenic activities that impact on the quality and the quantity of
groundwater. This contamination is mainly due to rapid technological advances and
population increase (Baba and Tayfur, 2011). Good quality water is an integral part of the
environment, animals and human life (Shafqat et al., 2012). Besides water covering an
enormous percentage of the Earth’s surface (about 70 %), it makes up to about 70 % of the
human body mass (Shakhashiri, 2011). Its use for domestic consumption, agriculture and in
industries is widespread. The sources of water in Kenya comprise of surface waters
(wetlands, rivers, springs and lakes) and groundwater. Oceans and seas are the major
sources of the world’s precipitation, which constitutes about 97.5 %. Fresh water makes up
the remaining 2.5 % of which 68.9 % is trapped in glaciers and ice caps, 30.8 % is
underground water (boreholes and wells) and 0.3 % is the surface water (rivers and lakes)
(UNESCO, 2003).
Increased human consumption, receding wetlands, pressure of the rising population, rainfall
variability and climatic changes have put a strain on the availability of water. For the said
reasons, Kenya has become vulnerable to most of the economic activities that are water
dependent. Activities such as: tourism, trade, agriculture and manufacturing rely heavily on
water (Ministry of Water and Irrigation Report, 2016). These activities also offer avenues
2
through which water is polluted. Continuous strain on the Earth’s water supply has resulted
in its scarcity which in turn has necessitated a search for new sources. Among these sources
is groundwater which offers a great alternative source of water to the general public.
Groundwater therefore is among the Nation's important natural resources (Kalanithi et al.,
2015; Hari et al., 2016) It provides a significant input to the National public water supply
mainly through Boreholes and Wells. Conditions of recharge, rock conditions and
anthropogenic activities cause variations in quality of groundwater resources. Groundwater
is considered fit for such uses as domestic, industrial use and for irrigation (Jadhav et al.,
2012; Ministry of Water and Irrigation Report, 2016).
A number of urban centres in Kenya rely greatly on groundwater for public and private
water supply. These include: Nakuru, Naivasha, Wajir, Mandera and Lodwar (Mumma et
al.,2011). To the North West of Nairobi lies Naivasha, an urban centre at about 2084 m
above the sea level. Naivasha derives its name from the Masaai community, ‘Nai’ Posha’ to
mean a place of ‘Rough Water’. Just like other emerging urban centres, there is rapidly
growing low-income settlements that have resulted from the floricultural practises within
the locality (Norman and Parker, 2011). Following the 2009 census report (KNBS, 2009),
the populace of Naivasha was reported to be 376,243 which has increased steadily (about
35% increase) and currently (2019) stands at approximately 507,928 persons. Water use in
Naivasha is to a large extent dictated by the land use within the catchment area or the
activities that require water within the area. A significant amount of the water is used for
irrigation in flower farms and for domestic purposes. Besides the mentioned activities, urban
centres have witnessed an increased rise in car washing stations, water recreational parks

3
and water vending kiosks that heavily rely on groundwater. The natural water catchment
areas have been adversely affected by climatic changes and degradation of the catchment
areas because of increased farming activities and river flows that are continually declining.
The quality of the water has been adversely affected for various reasons among them being
natural and other anthropogenic activities (De jong, 2011). The Naivasha Municipality’s
population is largely distributed around Lake Naivasha and the hills nearby. The low-
income settlement areas include: Mirera, Karagita, Kamere and Kasarani. An NGO, Water
and Sanitation for the Urban Poor (WSUP) has tried to improve on the availability of water
in the area by construction of boreholes and supplying water to the locals through water
kiosks (Norman and Parker, 2011).
Water quality is among the concerns of the regulator before borehole construction
commences. This however is performed at the time of licensing but subsequent monitoring
is often neglected (UNDP, 2011).
Considerable emphasis has been laid upon groundwater as an important source of clean
water in many urban set ups and rural areas. In semi-arid areas, the general population relies
entirely on groundwater. As much as groundwater contains a variety of essential minerals
ranging from trace to high concentrations; it also contains contaminants such as fluoride
which is found in the Kenyan rift (Gaciri and Davies, 1993). Apart from microbiological
contamination, groundwater is also contaminated by heavy metals from natural and
anthropogenic activities. These factors have greatly impacted on the quality of groundwater
(NWSS,2016).

4
Since the local population in Naivasha have relied on boreholes as a crucial drinking water
source and for other household purposes, this study was aimed at assessing the parameters
that affect water quality in the area with the aim of establishing suitability for domestic use.
1.2 Statement of the problem
Borehole water quality in Naivasha is of concern because boreholes are considered a vital
source of drinking water in the locality. However, there are some parameters that are a threat
to the quality of water such as high fluoride levels above the WHO recommendation (1.5
mg/l) that have been reported in Naivasha area in rivers, soils, air and lake Naivasha
(Rombo and Muoki, 2012).
1.3 Objectives of the study
1.3.1 General Objective
The general objective of this study was to assess some the water quality parameters in
selected boreholes in Naivasha sub county, Nakuru County.
1.3.2 Specific Objectives
The specific objectives of this study were:
i. To determine the physicochemical properties of selected borehole water in Naivasha sub
county, Nakuru County.
ii. To determine the levels of some selected anions and cations in borehole water.
iii. To determine the levels of some selected heavy metals in the borehole water.
iv. To determine the level of E.coli in the borehole water.

5
v. To evaluate the water quality based on permissible levels of the water quality
parameters.
1.4 Justification and significance of the study
Borehole water assessment is often conducted at the time of commissioning of the borehole
but subsequent assessment is seldom conducted (UNDP, 2011). Therefore, there was need
to assess the quality of these borehole waters by determining some water quality parameters
since there were no records as to when any water quality assessment was conducted in the
area. The assessment provided information on the nature of human activities within the area
and their impact on groundwater quality The Ministry of Water and Irrigation Report (
2016) had raised concerns on human activities around the boreholes and the ground water
quality. The results from this study would serve as an information source on the borehole
water quality and its suitability for its use by the area residents. The study identified the
human activities that are of concern to water quality and their impact on the suitability of the
borehole water. Furthermore, the results are significant in forming the basis for further
studies on borehole water quality in the area and in formulation of regulatory strategies for
the management of underground water in Naivasha.

6
CHAPTER TWO
LITERATURE REVIEW
2.1 Water quality
These are the physicochemical and biological attributes of water whose levels define its
suitability for the intended use. The levels of these parameters differ widely and are set
depending on the intended use (EPA, 2001). Water quality varies rapidly and sometimes
fails depending on the prevailing environmental conditions. (WHO, 2006).
2.2 Physicochemical parameters of water
The quality of water may be described by its physical and chemical attributes. Researchers
have applied physicochemical properties to assess the drinking water quality (Manjare et al.,
2010). In this study, physicochemical properties of borehole water from Naivasha were
analyzed. The parameters included:
2.2.1 pH
This is the measure of the negative hydrogen ion logarithm. Water becomes more acidic
when the pH decreases and more basic as it increases. pH changes in water may affect the
concentrations of other components to more toxic forms. An increase in soluble mercury in
water may be caused by a decrease in the pH. An increase on the other hand, enhances
conversion of the ammonium ion to toxic ammonia. The pH of water is also affected by
dissolved gases. The pH of a substance is measured using a pH meter (ILMB,BC 1998). The
acceptable values of pH for drinking water according to the East African Standard and the
WHO guideline for drinking water is given as 6.5 – 8.5 (WHO, 2011).

7
2.2.2 Turbidity
Turbidity and color of water are parameters that impact on the appearance of water.
Turbidity in water is effected by suspended or dissolved particles which cause light
scattering and gives the water a murky or cloudy appearance. It occurs when there is
reduced transparency as a result of the presence of particulate matter or suspended
sediments such as: fine organic matter, plankton or microscopic organisms and clay or silt.
The sediments can carry pathogens, pollutants and nutrients. In the aquatic life, they are
responsible for clogging of fish gills (ILMB,BC 1998). Turbidity causes light scattering or
absorption causing water to appear murky or cloudy (Minesota Pollution Control Agency,
2008). It is determined by use of a Nephelometric laser turbidimeter and reported in
Nephelometric Turbidity Units (NTU). The maximum allowable value for turbidity is given
as 1 NTU for the East African Standard and the WHO guideline for drinking water (WHO,
2011).
2.2.3 Electrical conductivity
It is the attribute that makes water able to conduct an electric charge. This occurs because of
the existence of free charges in water. It is used to estimate the total ionic concentration in
water. Conductivity is reported in microsiemens per centimeter (µS/cm) or millisiemens per
centimeter (Compendium for Watershed Monitoring and Assessment, 2010), by use of a
conductivity meter. The maximum acceptable limit of conductivity for drinking water
according to the East African Standard and the WHO guidelines for drinking water is given
as 2500 µS/cm (WHO, 2011).

8
2.2.4 Water color
Water color is brought about by colored organic matter usually humic and fulvic acids and
inorganic ions that are present in water due to soil humus. Industrial effluents also play a
crucial role in giving water color and so does corrosion products, as well as natural
impurities. Water color is measured in true color units (TCU) using a color analyzer. The
maximum acceptable limit of color for drinking water according to the East African
Standard and the WHO guidelines for drinking water is given as 15 TCU (WHO, 2011).
2.2.5 Total Suspended Solids (TSS)
TSS is matter that is not dissolved completely in water. The solids can be filtered and hence
remain on a filter when water is filtered through (ISO 3025 part 16). The suspended material
gives water a poor aesthetic value and provide sites for adsorption of biological as well as
chemical agents (ISO 3025 part 16). The amount of suspended solids is determined
gravimetrically. The East African Standard and the WHO guideline for drinking water
however state that there should not be any suspended solids in drinking water (WHO, 2011).
2.2.6 Total dissolved solids (TDS)
This is matter that is dissolved completely in water. The solids can be filtered and are
always left behind as a residue in a vessel whenever water is evaporated and further dried at
a specified temperature (ISO 3025 part 16). High values of TDS in water makes it
unsuitable for domestic use (ILMB,BC 1998). The dissolved solids lead to scaling in
boilers, corrosion and degradation of metallic products (ISO 3025 part 16). The amount of
dissolved solids is determined gravimetrically. The East African Standard and the WHO
guidelines for drinking water give the maximum value of dissolved solids as NMT 1500
mg/L (WHO, 2011).
9
2.3 Inorganic constituents
Ionic constituents that may affect water quality include: fluoride (F-), chloride (Cl-), nitrates
(NO3- ), ammonium (NH4
+), sodium (Na+), calcium (Ca2+), magnesium (Mg2+) and sulfates
(SO42- ) among others (Ndungu et al., 2015).
2.3.1 Fluoride
Fluoride occurs in nature as fluorspar (CaF2), cryolite (Na3AlF6) and fluoroapatite (Ca5
(PO4)3F) (Mutonga, 2014). Most of the Kenyan water fluoride is as a result of volcanic
activity arising from the weathering of rocks and rift valley formation (Gaciri and Davies,
1993).
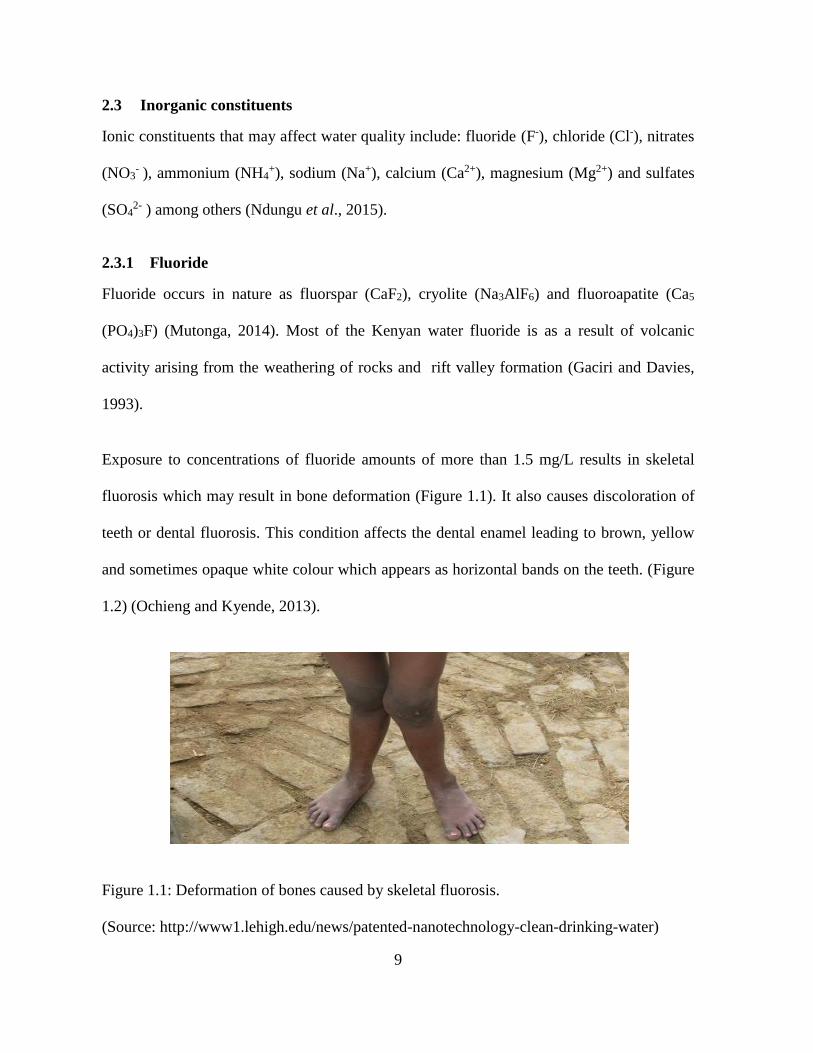
Exposure to concentrations of fluoride amounts of more than 1.5 mg/L results in skeletal
fluorosis which may result in bone deformation (Figure 1.1). It also causes discoloration of
teeth or dental fluorosis. This condition affects the dental enamel leading to brown, yellow
and sometimes opaque white colour which appears as horizontal bands on the teeth. (Figure
1.2) (Ochieng and Kyende, 2013).
Figure 1.1: Deformation of bones caused by skeletal fluorosis.
(Source: http://www1.lehigh.edu/news/patented-nanotechnology-clean-drinking-water)

10
Figure 1.2: Manifestation of Dental fluorosis exhibited on this child’s teeth.
(Source: http://www.de-fluoride.net/fluorosis.htmL)
2.3.2 Water hardness
This results from the presence of calcium and magnesium ions. Calcium ions result from the
dissolution of carbonate rocks by the carbonic acid in water or from gypsum that is common
in sedimentary rocks. Ca 2+ ions are the majority of all cations in low-mineralized water.
Magnesium ion is more abundant in water compared to calcium. The increase in
concentration of Mg 2+ ion in water is enhanced due to its weaker biological activity
(Nikanorov and Brazhnikova, 2009). These two ions when present in water cause hardness
and scale-forming properties. Hardness is determined titrimetrically using standard EDTA.
The maximum allowable amount is given as 300 mg/L as CaCO3 (WHO, 2011).
2.3.3 Sulfates
Most of the surface and ground water contain SO4 2- ions that originates from various
sedimentary rocks or from oxidation of sulfide and hydrogen sulfide. The presence of SO4 2-
ions in water is however limited by the formation of CaSO4 that is slightly soluble in water
11
(Nikanorov and Brazhnikova, 2009). High levels of sulfates have an over laxative effect and
give water a bitter test when combined with other ions (Driscoll et al., 2002). The mineral
content of water has a great contribution of sulfates as barite, epsomite and gypsum (ISO
3025 Part 24). Acid Mine Drainage (AMD) makes a generous contribution of sulfates to
ground water is through oxidation of pyrite (ISO 3025 Part 24). The East African Standard
and the WHO guidelines for drinking water have however not indicated the maximum
allowable values for sulfates.
2.3.4 Manganese
The element manganese occurs naturally in the Earth’s crust constituting about 0.1%. Its
occurrence is not in the pure form. It occurs at low levels in water and food resulting from
many human activities including production of matches, fireworks, dry-cell batteries and
fertilizers (EPA, 2003). At trace levels, manganese is a vital element to human life. It is
mostly found in bones, adrenal and pituitary glands and other body tissues with a major role
of digestive enzymes activation, production of energy, and metabolism of iron and anemia
prevention. In high amounts, manganese causes a syndrome known as manganism that
further leads to Parkinson disease, anorexia, muscle pain and slowed speech (WHO, 2011).
2.3.5 Iron
Iron is found in soil material partly in an oxidized solid state or in a dissolved form. Its
presence in aquifers is dependent on the oxygen state of the aquifer, its structure and the
aquifer characteristics (Hatva. 1989). Iron is an essential mineral being a major component
of hemoglobin which transports oxygen throughout the body tissues. It occurs naturally in
foods and also as a dietary supplement. Owing to its ability to create free radicals, iron has

12
to be kept within balance in the body and this is because it may lead to damage to the body
tissues due to iron overload or anemia in case of deficiencies (Abbaspour et al., 2014). The
most allowable amount of iron in water for drinking is given as 0.3 mg/L (WHO, 2011)
2.3.6 Chloride
Chloride occurs naturally in water. It occurs as halite or sodium chloride, potassium chloride
and calcium chloride in the Earth’s crust (Kelly et al., 2012). The high solubility of these
chloride salts is responsible for the high migratory ability of the Cl - ion. High
concentrations of the Cl – ion in water causes corrosion of metallic pipes (Driscoll et al.,
2002). Chloride gives a salty taste when combined with sodium to make sodium chloride
(NaCl). High levels of chloride are not thought to be harmful however, high levels of
sodium are known to cause hypertension, heart and kidney failure (WHO, 2003). The
maximum allowable level for chloride in water for drinking is given as 250 mg/L (WHO,
2011).
2.4 Heavy metals
Heavy metals are metallic elements whose density and atomic weight that is more than 5
times that of water (Tchounwou et al., 2012). They occur naturally in varying amounts
depending on the location. Significant amounts of heavy metals finds their way into
groundwater through various avenues. Some of them come from industrial production and
emissions, leaching during transportation and other human activities like farming through
application of fertilizers and deliberate disposal of the heavy metals in landfills. These
metals consequently find their way into the human body through drinking of polluted water,
inhalation of their dust or consumption of vegetables that have taken up the metals through

13
their roots (Nazir et al.,2015). The properties of some of the selected heavy metals are
described below:
2.4.1 Cadmium
The Earth’s crust contains about 0.1 mg/kg of cadmium accumulated largely on sedimentary
rocks. It has found widespread use in industry in production of batteries, pigments and
alloys. Humans are exposed to cadmium through: direct inhalation and ingestion of foods
that may contain trace amounts like fish from polluted waters. Cadmium finds its way
around the body through the blood circulatory system and as a consequence causes
gastrointestinal corrosion, pulmonary irritation, renal failure and possibly death. Lung
damage is another effect of cadmium to the body and this occurs as a result of inhalation of
high levels of cadmium (Tchounwou et al., 2012). The most allowable amount of cadmium
in water for drinking is given as 0.03 mg/L (WHO, 2011)
2.4.2 Chromium
Most of the sedimentary rocks contain chromium and chromium compounds. These
compounds may then leach into groundwater. Chromium has gained great repute for its use
as metal protective coating, magnetic tapes, metal alloys and as pigments for rubber,
cement, paints, floor tiles and other materials. Chromium (III) is a known essential nutrient
while, chromium (VI) compounds are harmful to the body. Inhalation of high levels of
chromium is reported to cause ulcers in the nose lining, breathing complications like
asthma, chronic coughs and wheezing. Contact with the skin also causes skin ulcers whereas
long term exposures are a major contributing factor to liver damage and neurotic damage
(Centre for Hazardous Substance Research, 2009). The utmost allowable level of chromium
in water for drinking is given as 0.05 mg/L (WHO, 2011)
14
2.4.3 Lead
Lead is toxic. However, it has been used for decades as an additive to petroleum products,
productions of batteries, ammunition and shielding devices for X-rays. Other uses include
production of paints and solder wires. Exposure to lead is through: drinking of water
contaminated with lead in old water pipes in older homes, use of lead containing cosmetics
and lead based paints among others (Jaishankar et al. 2014). Long term exposure to lead has
been reported to cause nervous system impairment, weakness in joints, blood pressure
increase and anemia. Accumulated amounts of lead results in brain and kidney damage that
would lead to death. It can also cause miscarriages in expectant women. In men, it is known
to cause low sperm count due to damage to the reproductive organs (Centre for Hazardous
Substance Research, 2009). The maximum permissible amount of lead in water for drinking
is given as 0.01 mg/L (WHO, 2011)
2.4.4 Zinc
Anthropogenic accumulation is the leading cause of the unnatural increase of zinc in the
environment. Industrial activities like mining, processing of steel and combustion of waste
have made a significant contribution to the increase of zinc amounts in the environment.
Drinking of zinc polluted water is also a known avenue through which zinc enters the
human body. This occurs normally by drinking water stored for a long time in zinc
containing metallic tanks. Zinc deficiencies may cause birth deformities and for such
reasons, it is essential in trace quantities to the human development. However, high amounts
of zinc are a health concern as it causes stomach cramps, nausea and vomiting (Wuana and
Okieimen, 2011). The utmost allowable level of zinc in water for drinking is given as 5
mg/L (WHO, 2011)
15
2.4.5 Copper
Ground water contains copper, however its presence is primarily as complexes. Its amounts
are mainly affected by such factors as, hardness, pH and the availability of copper around
the aquifers (WHO, 2011). Nutritionaly, copper is an essential element in the formation of
connective tissues and the proper function of the nervous and immune system, muscle
functions and production of red blood cells. It is also essential in prevention of bone defects.
In high doses copper can be toxic leading to nausea, kidney failure and sometimes death.
The maximum allowable value for copper is given as 2 mg/L (WHO, 2011)
2.5 Biological water quality parameters
2.5.1 Escherichia coli (E.coli)
This is a bacterial type that makes up the total coliform group of bacteria. It is likely to be
found in the intestines of mammals, humans included. It is normally harmless in the
intestines however in other parts of the body, it causes such disease as urinary tract
infections (UTIs), meningitis and bacteracemia among others (WHO, 2006). Escherichia
coli presents itself in large amounts in human and animal faeces and thus can cause faecal
water pollution if the wastes find their way into any water body (Servais et al., 2002). The
level of E.coli can therefore be used as a biological quality indicator for drinking water and
is determined in terms of colony forming units in 100 mL of the sample (CFU/100mL)
(New Hampshire Water Well Board, 2010)
16
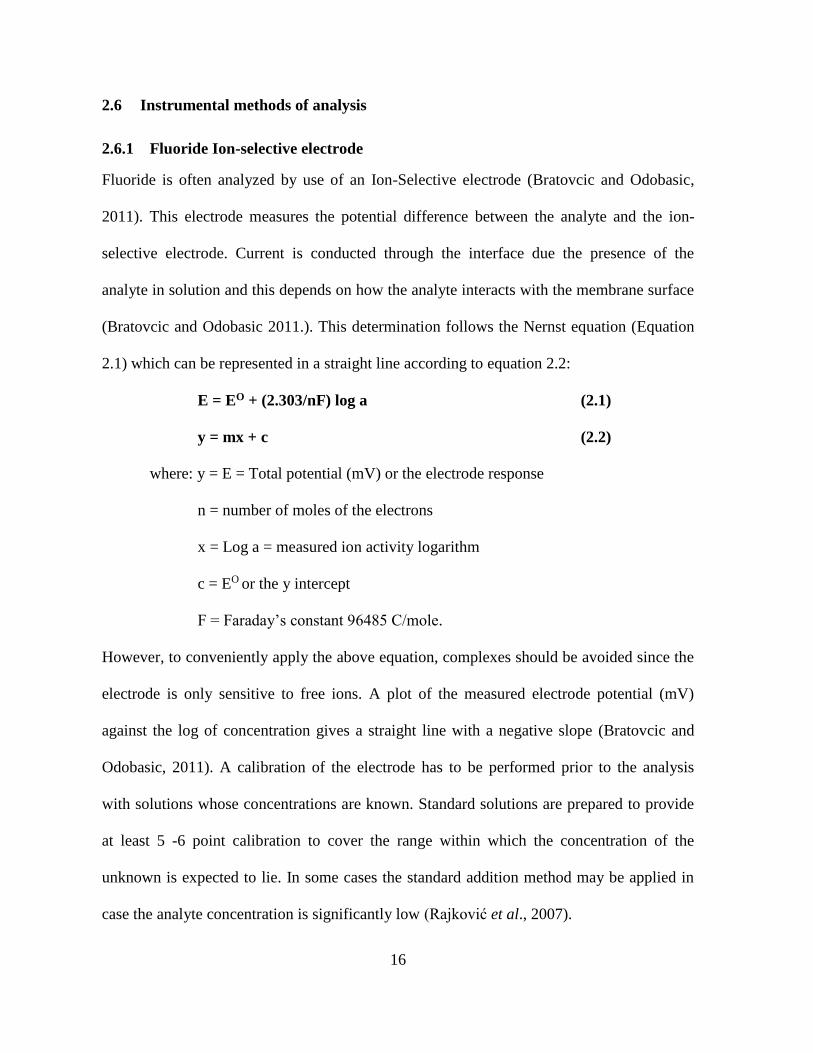
2.6 Instrumental methods of analysis
2.6.1 Fluoride Ion-selective electrode
Fluoride is often analyzed by use of an Ion-Selective electrode (Bratovcic and Odobasic,
2011). This electrode measures the potential difference between the analyte and the ion-
selective electrode. Current is conducted through the interface due the presence of the
analyte in solution and this depends on how the analyte interacts with the membrane surface
(Bratovcic and Odobasic 2011.). This determination follows the Nernst equation (Equation
2.1) which can be represented in a straight line according to equation 2.2:
E = EO + (2.303/nF) log a (2.1)
y = mx + c (2.2)
where: y = E = Total potential (mV) or the electrode response
n = number of moles of the electrons
x = Log a = measured ion activity logarithm
c = EO or the y intercept
F = Faraday’s constant 96485 C/mole.
However, to conveniently apply the above equation, complexes should be avoided since the
electrode is only sensitive to free ions. A plot of the measured electrode potential (mV)
against the log of concentration gives a straight line with a negative slope (Bratovcic and
Odobasic, 2011). A calibration of the electrode has to be performed prior to the analysis
with solutions whose concentrations are known. Standard solutions are prepared to provide
at least 5 -6 point calibration to cover the range within which the concentration of the
unknown is expected to lie. In some cases the standard addition method may be applied in
case the analyte concentration is significantly low (Rajković et al., 2007).
17
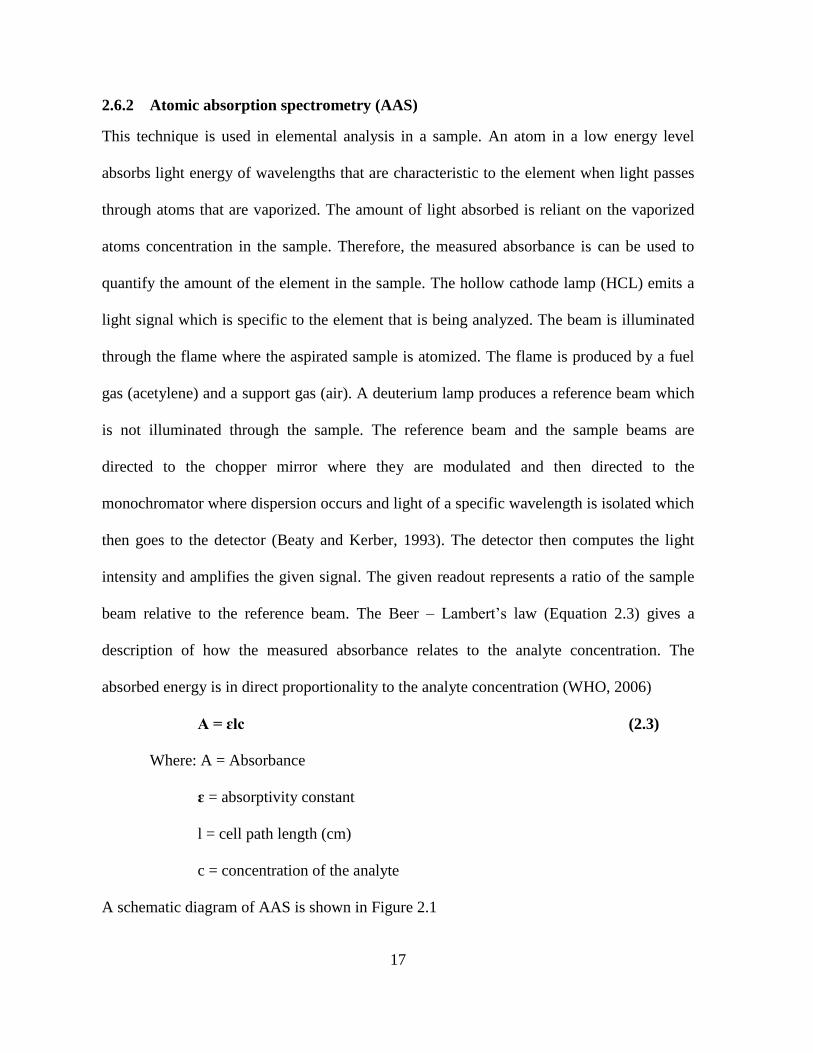
2.6.2 Atomic absorption spectrometry (AAS)
This technique is used in elemental analysis in a sample. An atom in a low energy level
absorbs light energy of wavelengths that are characteristic to the element when light passes
through atoms that are vaporized. The amount of light absorbed is reliant on the vaporized
atoms concentration in the sample. Therefore, the measured absorbance is can be used to
quantify the amount of the element in the sample. The hollow cathode lamp (HCL) emits a
light signal which is specific to the element that is being analyzed. The beam is illuminated
through the flame where the aspirated sample is atomized. The flame is produced by a fuel
gas (acetylene) and a support gas (air). A deuterium lamp produces a reference beam which
is not illuminated through the sample. The reference beam and the sample beams are
directed to the chopper mirror where they are modulated and then directed to the
monochromator where dispersion occurs and light of a specific wavelength is isolated which
then goes to the detector (Beaty and Kerber, 1993). The detector then computes the light
intensity and amplifies the given signal. The given readout represents a ratio of the sample
beam relative to the reference beam. The Beer – Lambert’s law (Equation 2.3) gives a
description of how the measured absorbance relates to the analyte concentration. The
absorbed energy is in direct proportionality to the analyte concentration (WHO, 2006)
A = ɛlc (2.3)
Where: A = Absorbance
ɛ = absorptivity constant
l = cell path length (cm)
c = concentration of the analyte
A schematic diagram of AAS is shown in Figure 2.1

18
Figure 2.1 : Schematic diagram of an AAS.
(https://www.shimadzu.com/an/elemental/aa/aa6200-3.htmL)
2.6.3 UV/Vis spectrometry
This is a colorimetric analytical technique that has a basis on the Beer-Lambert’s law
(Equation 2.3). The proportion of the absorbed electromagnetic radiation by a sample is
measured at a specific wavelength. UV or Visible light is illuminated through a sample in a
cell and the transmitted intensity is measured. A visible or ultra violet beam from the source
is reflected by a mirror and then directed to the monochromator where it is split into its
components by a prism. The monochromatic beam is divided into two beams of similar
intensity by the half mirror. The beam of the sample goes through a cuvette holding the
sample in a suitable diluent while the reference beam goes through another cuvette with the
diluent. The beams then go to the detector where their intensities are determined (Sanda et
al., 2012).
The analyte concentration in a given sample determine the intensity of the absorbed
radiation. A calibration curve is then obtained by use of known concentrations which is

19
subsequently used to quantify the sample analyte concentration. Compounds that have a
chromophore absorb UV light of wavelength between 190–380 nm relative to their
concentration. UV/Vis therefore can be used to identify and quantify organic substances,
because of the presence of a chromophore in organic compounds (WHO, 2006).
A schematic diagram of a UV/Vis spectrometer is shown in Figure 2.2
Figure 2.2: Schematic diagram of a double beam UV/Vis spectrometer.
(Source: https://www.researchgate.net/figure/A-dual-beam-UV-vis-spectrophotometer-
8_fig20_314081363).
2.6.4 Laser Turbidimeter
Foreign particles suspended in water cause scattering of incident light and a subsequent
change of direction. Particles like clay, silt, algae and other organic matter particles cause
directional changes to the illuminated light. The resolution of determined turbidity is in
direct proportionality to the angle of incident light and the position of the detector. The 90º

20
angle is the most sensitive (Omar and MatJafri, 2009). The higher the turbidity, the greater
the scattering of light. Turbidimeters measure scattering of a portion of light through a 90º
angle to that of the incident. (Omar and MatJafri, 2009).
A schematic diagram of a nephelometric turbidimeter is shown in Figure 2.3
Figure 2.3: Schematic diagram of a Nephelometric turbidimeter
(Source: Omar and MatJafri, 2009)
2.7 Other methods of analysis
2.7.1 Escherichia coli (E.coli)
This is determined by use of the multiple tube fermentation technique (MTF). Serial
dilutions of the water samples are made and then the samples are analyzed. Each of the
samples are used to inoculate tubes of culture medium. In the presumptive/ isolation test, a
series of tubes containing lauryl tryptose (lactose) culture medium are inoculated with

21
appropriate sample dilutions incubated at a defined temperature for a stated amount of time.
Turbidity in the culture medium, presence of gas and/or pH change indicate presence of
coliforms. Brilliant green lactose bile broth (BGLB) is used as the culture media in the
confirmation test for total coliforms and E. coli medium for faecal coliforms (UNEP/WHO,
1996).

22
CHAPTER THREE
MATERIALS AND METHODS
3.1 Study area
The research was carried out within Naivasha Sub County, Nakuru County. Naivasha is a
commercial town located to the North Western side of Nairobi (about 90 km from Nairobi)
and forms part of the county of Nakuru. It is at 2086 m above the level of the sea and 0° 43′
0′′ S and 36° 26′ 0′′ E (latitude and longitude respectively). The soil in the area is generally
volcanic and alkaline in nature. It is quite permeable and contains high amounts of sodium,
fluoroapatite, fluorspar, zeolite, and ammonia among other minerals (Becht et al., 2005).
The map of Naivasha Sub County is given in Figure 3.1.
Figure 3.1: Map of Naivasha Sub Count, Nakuru County showing the boreholes numbered
1-7.

23
3.2 The sampling locations
Water was sampled from Seven (7) boreholes in different locations in Naivasha Sub County.
The sampling locations were selected based on their proximity to horticultural farms (to
check whether they impacting on the water quality), proximity to auto repair garages and
other small scale industries, ownership of the boreholes and population that the boreholes
served in a day. All the seven (7) sampled boreholes were sealed.
Matangi Nne Borehole (1) is located at 0° 46′ 29.84′′ S, 36° 26′ 9.97′′ E in the Karagita
Area. The borehole was drilled and constructed in 2002 with a depth of about 180 feet. It is
located next to the Wildfire Flower Farm. Four overhead water tanks were hoisted next to
the borehole hence the name “Matangi Nne”. The borehole serves most of the Karagita area
and is used for drinking, cooking, small scale farming and other domestic activities.
Surrounding the borehole are various activities among them: floricultural farming,
hospitality (Hoteliers) and small scale farming. There is also an elaborate piping network
whereby the borehole supplies treated and untreated water to the nearby estates, Kiwa
House and the Kenya society for the protection and care of animals (KSPCA) Naivasha.
Water quality tests had been conducted in the past.
Joywel Academy Borehole (2) is located at 0° 44′ 56.28′′ S, 36° 27′ 51.50′′ E. It was
constructed by the Joywel Primary School. It has a depth of about 165 feet. Water from this
borehole is used for domestic purposes, drinking, cooking and cleaning. Activities
surrounding the borehole include car washing and carpet cleaning, building and
construction. The water sampling process at the Joywel School borehole is shown in Figure
3.2.

24
Figure 3.2: Sampling at the Joywel Primary School borehole
Koinange Car Wash borehole (3) is located at 0° 43′ 23.65′′ S, 36° 26′ 29.80′′ E in Police
line Area of Naivasha town. The area is predominantly surrounded by motor vehicle
garages, car wash and carpet cleaning services and a trading center. This borehole was
constructed in July 2013, with a depth of > 150 feet and serves over 160 people per day.
There is a water tower present at the borehole site. Domestic use, carpet cleaning and car
washing are the main uses of water from Koinange Car Wash borehole. At the time of
sampling no previous tests had been conducted on the said borehole.
The Ushirika Water Project borehole (4) is located at 0° 44′ 55.49′′ S, 36° 28′ 6.53′′ E in
Kayole Area about 200 meters off the Naivasha-Nakuru highway. This borehole was
constructed in June 2012 after the previous one was blocked. It is 226 feet in depth. It serves
over 160 people who use the water mostly for domestic purposes, farming, drinking and

25
cooking, car washing and animal raring. Water bowsers also fetch water from this borehole.
Quality tests had been conducted in 2015. The borehole did not have a water tower present.
The Ushirika Water Project borehole in Kayole Area is shown in Figure 3.3.
Figure 3.3: Ushirika Water Project borehole in Kayole Area.
The Geoffrey Kinyanjui borehole (5) is located at 0° 44′ 50.67′′ S, 36° 28′ 11.11′′ E within
the Kayole area. The owner of this borehole had constructed the borehole in 2014 solely for
cattle raring and processing of milk and milk products. The borehole is about 230 feet deep
with a water tower. The borehole serves the owner’s domestic use, farming, cattle raring and
milk processing and about 100 to 150 other people in a day. Main activities surrounding the
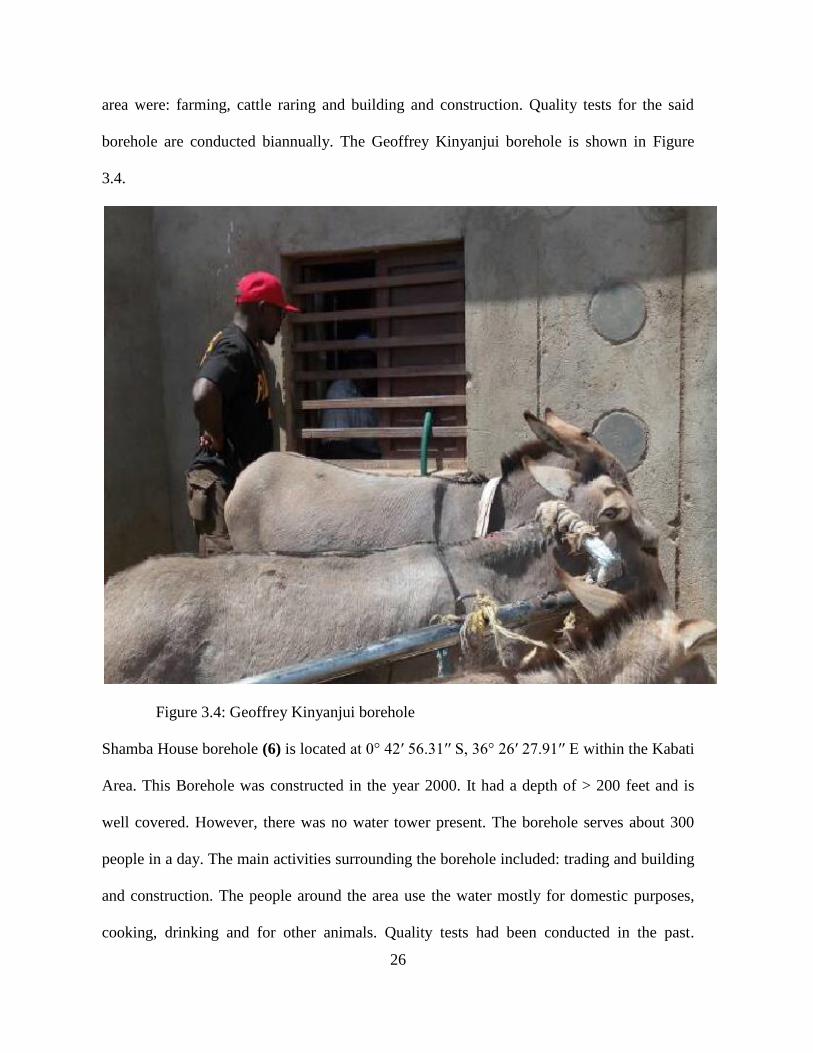
26
area were: farming, cattle raring and building and construction. Quality tests for the said
borehole are conducted biannually. The Geoffrey Kinyanjui borehole is shown in Figure
3.4.
Figure 3.4: Geoffrey Kinyanjui borehole
Shamba House borehole (6) is located at 0° 42′ 56.31′′ S, 36° 26′ 27.91′′ E within the Kabati
Area. This Borehole was constructed in the year 2000. It had a depth of > 200 feet and is
well covered. However, there was no water tower present. The borehole serves about 300
people in a day. The main activities surrounding the borehole included: trading and building
and construction. The people around the area use the water mostly for domestic purposes,
cooking, drinking and for other animals. Quality tests had been conducted in the past.
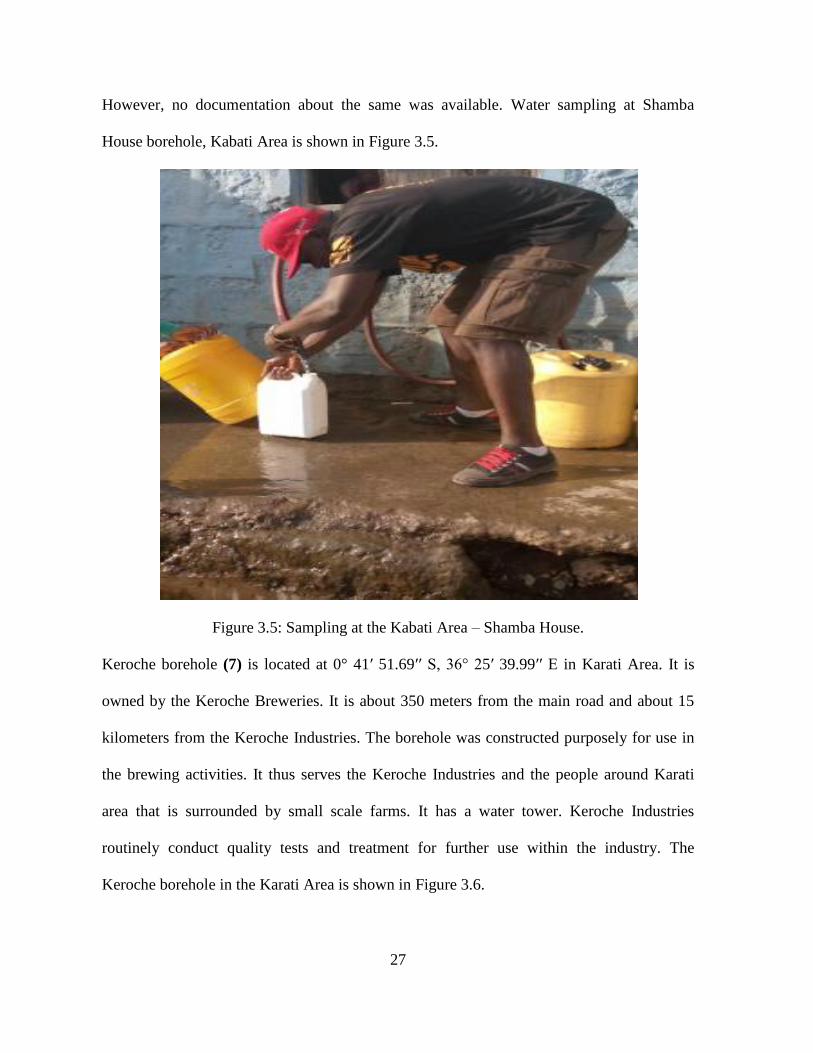
27
However, no documentation about the same was available. Water sampling at Shamba
House borehole, Kabati Area is shown in Figure 3.5.
Figure 3.5: Sampling at the Kabati Area – Shamba House.
Keroche borehole (7) is located at 0° 41′ 51.69′′ S, 36° 25′ 39.99′′ E in Karati Area. It is
owned by the Keroche Breweries. It is about 350 meters from the main road and about 15
kilometers from the Keroche Industries. The borehole was constructed purposely for use in
the brewing activities. It thus serves the Keroche Industries and the people around Karati
area that is surrounded by small scale farms. It has a water tower. Keroche Industries
routinely conduct quality tests and treatment for further use within the industry. The
Keroche borehole in the Karati Area is shown in Figure 3.6.

28
Figure 3.6: Keroche Industries Borehole in Karati area
3.3 Sample collection
The samples were taken into previously cleaned and dried plastic containers. Water from the
borehole was used to rinse the plastic containers at least twice. The samples were then taken
into the containers and stoppered to avoid contamination. The containers were then labeled
with such information as: The date of sampling, amount sampled, name of the personnel
conducting the sampling, name of the borehole and the location where the borehole was
located. For total metal analysis, the samples were taken into different containers and about
2 mL of conc. nitric acid was then added. Other information was filled in the sample
collection form which included: the name of the borehole, a reference number given to the
sample, amount of sample collected, the date of drilling and construction, presence or
absence of a water tower, the population the borehole served per day, economic activities
29
surrounding the area, major uses of the borehole water and the mode of water collection
from the area and whether quality tests had been conducted in the past. The form also had
the type of tests conducted at the point of sampling namely: The samples temperature, pH
and the electrical conductivity. The samples were transported to the laboratory. Some
samples were kept in clean sterile 100 mL bottles for biological testing in a refrigerator at a
temperature of between 2-8 °C.
3.4 Experimental procedure
3.4.1 pH
To determine the samples pH, the Jenway 3540 pH and conductivity meter was used. It was
first calibrated before use at room temperature using pre-prepared buffers of pH 2.0, 4.0 and
7.0. After calibration, each of the samples was poured into a previously cleaned and dried
100 mL beakers. The samples pH were then determined dipping the pH probe into the
samples while stirring using a magnetic stirrer. Three determinations were made for each
sample then the average values were taken as the samples pH.
3.4.2 Electrical conductivity
The Jenway 3540 pH and conductivity meter was used to ascertain the samples Electrical
conductivity. The probe was calibrated by use of a 12.88 µS/cm KCl solution at 25 ° C.
Each of the samples were placed into 100 mL beakers and their Electrical conductivity
determined by placing the conductivity probe into each of the samples. Three
determinations were made for each sample and the averages recorded.

30
3.4.3 Turbidity
The HACH TU5200 bench top turbidimeter was used to ascertain the turbidity of the
samples. A 2 point standard calibration (std 1: 20 NTU, std 1: 600NTU) was done on the
instrument and thereafter a standard verification (10 NTU) before the samples analysis. The
sample cell was then rinsed using deionised water. Each of the samples were taken into the
sample cell and then placed into the sample holding compartment for subsequent
determination. The displayed value was then recorded.
3.4.4 Water color
The water color determination was performed using the LUTRON RGB-1002 color
analyzer. The machine was calibrated using the provided white color calibration card in the
no light mode. The samples were place in clear 100 mL beakers. The measurement probe
was then held firmLy against the beaker and the displayed value recorded.
3.4.5 Total suspended solids (TSS)
Filter papers were labeled for the respective samples and placed on evaporating dishes. They
were then dried for 2 hours in a vacuum oven at 105 ° C. The filter papers were then
weighed after cooling them for 45 minutes in a desiccator and their respective initial weights
recorded (W1). 300 mL of the respective samples was then passed through the respective
filter papers which were again placed on the evaporating dishes and dried for 2 hours in the
oven at 105 C and then cooled for 45 minutes in a desiccator. They were then weighed and
their final weights recorded (W2). The formula below was used to ascertain the sample’s
total suspended solids
Formula: Total suspended solids (TDS mg/L) = (W2 - W1) x 1000/ Vol.

31
Where: W1 = Initial filter paper weight (mg)
W2 = Final filter paper weight (mg)
Vol. = Volume of the sample (mL)
The TSS in the samples were given in mg/L.
3.4.6 Total dissolved solids (TDS)
250 mL beakers that had been previously dried for 2 hours in the oven at 105 ° C and cooled
in the desiccator for 30 minutes were weighed and their weights documented (W1). 200 mL
of each of the filtered samples were taken into the respective beakers and then evaporated to
dryness on a heating mantle. The empty beakers plus the residues were then cooled for 45
minutes in a desiccator. They were subsequently weighed and their final weights recorded
(W2).
Formula: Total dissolved solids (TDS mg/L) = (W2 - W1) x 1000 / Vol.
Where: W1 = Initial weight of the beaker (mg)
W2 = Final weight of the beaker (mg)
Vol. = Sample volume (mL)
The TDS in the samples were given in mg/L.
3.4.7 Alkalinity
3.4.7.1 Standard sodium carbonate (0.01M Na2CO3)
About 5.0 g of sodium carbonate (98.5%) was taken into a drying dish and oven dried for 2
hours at 100 °C. The dish was left to cool in the desiccator for 30 minutes. 0.86866 g of the
dried Na2CO3 was then weighed and diluted with distilled water to 1000 mL. This solution
had a concentration of 0.01M Na2CO3 and was used to standardize the sulfuric acid.

32
3.4.7.2 Mixed indicator
10.02 mg of methyl red and 50.05 mg of bromocresol green indicators were weighed in a
weighing boat then transferred to a 50 mL volumetric flask and dissolved to volume using
95% aqueous ethanol.
3.4.7.3 Phenolphthalein Indicator (1 % w/v)
200.04 mg of phenolphthalein indicator was weighed in a weighing boat and dissolved in a
20 mL volumetric flask and topped up to the mark using 95% aqueous ethanol.
3.4.7.4 Standardization of sulfuric acid (0.01M) with standard Na2CO3
To prepare 0.01M H2SO4, 30 mL of 0.35M H2SO4 was taken into a 1000 mL volumetric
flask and slowly making to volume using deionized water. It was then standardized using
sodium carbonate Na2CO3 standard. 20 mL of the standard Na2CO3 was taken into a
previously cleaned 250 mL conical flasks using a clean pipette, 2 drops of phenolphthalein
indicator were then added making the solution pink. This solution was then titrated against
H2SO4 till the pink color cleared. The volume of the H2SO4 used was then recorded. To the
same solution, 2 drops of the mixed indicator were also added, making the solution blue and
the titration proceeded till the solution became red. The H2SO4 volume was recorded. The
combined volumes of the H2SO4 for the two titrations were then used to determine the actual
concentration of the sulfuric acid.
3.4.7.5 Alkalinity determination in the samples
20 mL of the borehole water sample was measured then taken into a 100 mL conical flask
with a further addition of 2 drops of phenolphthalein indicator which turned the sample
pink. The sample was then titrated with the standardized sulfuric acid till the pink color
33
vanished. The average volume of the sulfuric acid (V1) was recorded which was then used to
calculate the phenolphthalein alkalinity. Furthermore, 2 drops of the mixed indicator were
added to the same sample in flask, turning the solution blue. The titration then proceeded
with the sulfuric acid until the solution turned red. The combined volume of sulfuric acid
(V2) was then used to determine the sample’s total alkalinity.
3.4.8 Total Hardness determination
3.4.8.1 Standard calcium carbonate (0.01M CaCO3)
5.0 g of CaCO3 (98.5%) was taken into a drying dish and dried for 2 hours at 100 °C. It was
then cooled for 30 minutes. 0.9997 g of the anhydrous CaCO3 was then weighed in a
weighing boat and carefully transferred to a 250 mL conical flask. A small amount of a
mixture of water and hydrochloric acid (1:1) was added while swirling the flask. 200 mL of
water was then added then 2 drops of methyl red solution followed by a dropwise addition
of ammonium hydroxide solution until an intermediate orange solution formed. The solution
was then topped up to 1000 mL using deionized water. This solution had a concentration of
0.01M CaCO3.
3.4.8.2 Ammonia-Ammonium chloride Buffer preparation
50 mL of deionised water was taken into a 500 mL beaker. 1.17902 g of Ethylene di-amine
tetra acetic acid disodium salt (EDTA) (99.0%) was weighed and transferred into the same
beaker and dissolved thoroughly. 16.89993 g of anhydrous ammonium chloride and 780.01
mg of magnesium sulfate were also weighed and added to the contents of the beaker. Using
a measuring cylinder, 143 mL of ammonium hydroxide solution was added to the same
beaker. This solution was then carefully transferred into a 250 mL volumetric flask while
34
rinsing it thoroughly and topped up to volume. The ammonia-ammonium chloride buffer
was used to keep the water pH between 9 and 10.
3.4.8.3 Eriochrome Black-T indicator
0.12485 g of eriochrome black-T indicator was taken into a 25 mL volumetric flask and then
diluted to volume using deionized water. This was used to indicate the titration end point.
3.4.8.4 Standardization of EDTA (0.01M) with standard CaCO3
The EDTA was standardized by titrating it against standard calcium carbonate. 3.7231 g of
EDTA was weighed and put in a 1 liter volumetric flask and then made to the mark with
deionized water. This solution had a concentration of 0.01M EDTA. To standardize the
EDTA solution, 20 mL of the standard CaCO3 was measured into 4 clean 250 mL conical
flasks followed by 2 mL of the buffer. Subsequently, 2 drops of the eriochrome black-T
indicator was also added turning the solution to wine red. This solution was then titrated
using the standardized EDTA until the solution became steel blue in color. The EDTA
volume was recorded. The average volumes of the four determinations was subsequently
used to calculate the true molarity of the EDTA solution.
3.4.8.5 Total hardness determination in the samples
20 mL of the borehole water sample was measured into a 100 mL conical flask, 2mL of the
ammonia buffer solution was then added to it. This was done to keep the analysis pH
between 9 and 10. This was followed by an addition of six drops of the eriochrome black - T
indicator and the color changed to wine red. The sample was then titrated with the
standardized EDTA until the solution color turned to blue indicating the complexing of all
the Mg2+ and the Ca2+ ions in the sample and hence the end point. The standard EDTA

35
volume (V) used was recorded which was then used to calculate the total hardness in the
samples.
3.5 Determination of anions in the water samples
3.5.1 Chloride
The following reagents were prepared for the chloride ion determination:
3.5.1.1 Standard sodium chloride (0.1M)
2.92192 g of previously dried sodium chloride (99.0%) was accurately weighed in a washed
down completely with distilled water into a 500 mL volumetric flask and made to the mark
using deionized water.
3.5.1.2 Potassium chromate Indicator
2.5 g of anhydrous potassium chromate (99.8%) was accurately weighed into a 100 mL
beaker that had a small amount of water. A few drops of a solution of silver nitrate were
added to the formation of a slight red precipitate was formed. This solution was further let to
stand for about 12 hours and then topped up to 100 mL volumetric flask with distilled water.
3.5.1.3 Standardization of silver nitrate using standard 0.1M NaCl
16.98875 g of silver nitrate (99.9%) was accurately weighed and carefully transferred by
completely washing it with distilled water into a 1000 mL flask and then made to volume
using deionized water. This solution was standardized using standard sodium chloride. 20
mL of the standard 0.1M NaCl was measured into a clean 100 mL volumetric flask. 2 mL of
potassium chromate indicator was then added to the flask causing the solution to turn to
yellow. The solution was subsequntly titrated with the standard silver nitrate until it turned
36
to wine red. Four readings were taken and the average volume of the silver nitrate solution
was used to determine its concentration.
3.5.1.4 Determination of chloride ion in the samples
20 mL of the borehole water sample was measured into a clean 100 mL conical flask. 1 mL
of the potassium chromate indicator was then added to the flask with the sample, the color
turned to yellow. This sample solution was then titrated with the standard silver nitrate until
the color turned to brick red. The silver nitrate volume used was recorded. Four
determinations were conducted for each sample and the average recorded. A blank titration
was conducted by pipetting 20 mL of distilled water into a clean 100 mL conical flask with
a further addition of 1 mL of the potassium chromate indicator. Immediately, the solution
was then titrated using the standardized silver nitrate until the color changed to brick red.
The volume for the four determinations were then recorded.
3.5.2 Sulfates
The following reagents were prepared for the determination of sulfates:
3.5.2.1 Conditioning reagent
25 mL of glycerol was measured and carefully poured into a previously cleaned and dried
beaker. To the same beaker, 15 mL of conc. hydrochloric acid was added. This was then
followed by 50 mL of 95% isopropyl alcohol and the solution was properly mixed. 37.5 g of
sodium chloride was accurately weighed and dissolved in about 100 mL of distilled water.
The mixtures were then transferred into a 250 mL volumetric flask and topped up to the
mark using distilled water.

37
3.5.2.2 Stock sulfate standard solution
1.479 g of anhydrous sodium sulfate was carefully weighed in a weighing boat and
transferred into a 1000 mL volumetric flask dissolved and made up to the mark using
deionized water. 1 mL was corresponded to 1.0 mg SO42- .
3.5.2.3 Blank preparation, standards and testing of the samples
Six 50 mL volumetric flasks were taken for standards. 2.5 mL of the standard sulfate
solution was taken into the first volumetric flask (50 mg/L), 5 mL to the second (100 mg/L),
10 mL to the third (200 mg/L), 20 mL to the fourth (400 mg/L), 30 mL to the fifth (600
mg/L) and 40 mL to the sixth (800 mg/L) respectively and labeled appropriately. Seven 50
mL volumetric flasks were also taken for the respective samples and 20 mL of the samples
added into each of them. 5 mL of the conditioning reagent was added to all the volumetric
flasks and topped up to volume using deionized water. A few crystals of barium chloride
was then added to each of the volumetric flasks. One 50 mL volumetric flask was taken and
filled with deionized water and subsequently used as the blank. The sulfate determination
was done using the UV/VIS Spectrophotometer at a 420 nm.

38
3.5.3 Nitrates
The following reagents were prepared for the determination of nitrates:
3.5.3.1 Salicylic acid (5%)
2.49996 g of salicylic acid was weighed in a weighing boat. It was taken into a 50 mL
volumetric flask. 10 mL conc. sulfuric acid was added to dissolve then made to volume with
conc. sulfuric acid.
3.5.3.2 Sodium hydroxide (4M)
40.0268 g of sodium hydroxide was weighed in a weighing boat. It was transferred into a
500 mL volumetric flask. 200 mL of deionised water was added and placed in an ultra-sonic
bath. The solution was then cooled in the fume chamber for 30 minutes and made to volume
using distilled water.
3.5.3.3 Nitrate standards preparation
1.6473 g of anhydrous potassium nitrate (99.0%) was accurately weighed in a weighing boat
and taken into a 1000 mL volumetric flask. 200 mL of deionized water was then added to
the flask. It was treated by ultra-sonic waves until it dissolved and then topped to the mark
with deionized water. The stock solution contained 1000 mg/L nitrates. A 100 mg/L
solution was then made from the original solution using: C1V1 = C2V2. Subsequent dilutions
to 2.0 mg/L, 4.0 mg/L, 6.0 mg/L, 12.0 mg/L, 16.0 mg/L and 20.0 mg/L were prepared from
the 100 mg/L solution
39
3.5.3.4 Preparation of the samples for analysis
Eight clean 100 mL volumetric flasks were taken for each of the samples. 25 mL of the
samples were carefully measured into the respective volumetric flasks using a clean pipette.
25 mL of deionized water was taken into one of the flasks which was used as the blank. 5
mL of 5% salicylic acid was subsequently added to each of the flasks. The volumetric flasks
were then vortexed for two minutes and left to stand in a fume hood for 30 minutes. 50 mL
of 4M sodium hydroxide was also added to each of the flasks, vortexed and left to stand for
one hour. The standards and samples absorbance was then determined by use of the
Shimadzu UV/Vis spectrometer at a 410 nm.
3.6 Elemental determination of the borehole water samples
3.6.1 Determination of sodium
This was determined using the emission mode on the Shimadzu AA6300 Atomic absorption
spectrophotometer. Preparation of standard sodium (1000 mg/L) was done by accurately
weighing 2.54455 g of sodium chloride (99.0%) in a weighing boat and completely washing
it into a 1000 mL volumetric flask and making up to the mark using deionized water. The
stock solution contained 1000 mg/L sodium. A 100 mg/L solution was made from the
original solution using: C1V1 = C2V2. Subsequent dilutions to 2.0 mg/L, 4.0 mg/L, 6.0
mg/L, 8.0 mg/L and 10.0 mg/L were then prepared from the 100 mg/L solution. These
standards were used to obtain a calibration curve on the AAS.
3.6.2 Determination of potassium
This was determined using the emission mode on the Shimadzu AA6300 Atomic absorption
spectrophotometer. Preparation of standard potassium (1000 mg/L) was done by accurately
40
weighing 1.9087 g of potassium chloride (99.2%) in a weighing boat and diluting to volume
to 1000 mL in a volumetric flask using distilled water. This contained 1000 mg/L of
potassium. A solution of 100 mg/L was then made from the stock solution by use of the
formula C1V1 = C2V2. Subsequent dilutions to 2.0 mg/L, 3.0 mg/L, 4.0 mg/L, 5.0 mg/L, 6.0
mg/L, 8.0 mg/L and 10.0 mg/L were made from the 100 mg/L solution. These calibration
standards were used to obtain a calibration curve on the AAS.
3.6.3 Determination of manganese
Standard manganese (1000 mg/L) was prepared by accurately weighing 3.60604 g of
manganese chloride (98.9%) in a weighing boat and washing it into a 1000 mL volumetric
flask and a subsequent addition of 50 mL of conc. hydrochloric acid to dissolve the powder
and then made up to volume with deionized water. Using the formula: C1V1 = C2V2, a
solution of 10 mg/L was made from the 1000 mg/L. 10 mL of the standard manganese
standard solution (1000 mg/L) was pipetted into a 1000 mL volumetric flask and made up to
the mark using deionized water. Subsequent dilutions to 0.2 mg/L, 0.3 mg/L 0.4 mg/L, 0.6
mg/L, 0.8 mg/L, 1.2 mg/L, and 2.0 mg/L were prepared from the 10 mg/L solution. The
calibration standards were used to obtain a calibration curve on the AAS.
3.6.4 Determination of cadmium
Cadmium hollow cathode lamp was used for this analysis. Preparation of standard cadmium
(1000 mg/L) was done by weighing 1.63244 g of cadmium chloride (99.6%) in a weighing
boat and washed it into a 1000 mL volumetric flask and then made to the mark using
deionized water to make a 1000 mg/L of cadmium. Using the formula: C1V1 = C2V2, a
solution of 10 mg/L was made from the 1000 mg/L solution. 10 mL of the cadmium

41
standard (1000 mg/L) was pipetted into a 1000 mL volumetric flask and topped up to the
mark using deionized water. Subsequent dilutions to 0.2 mg/L, 0.3 mg/L 0.4 mg/L, 0.6
mg/L, 0.8 mg/L and 1.2 mg/L were prepared from the 10 mg/L solution. These calibration
standards were used to obtain a calibration curve on the AAS.
3.6.5 Determination of lead
A lead hollow cathode lamp was used for this analysis. Preparation of standard lead (1000
mg/L) was done by weighing 1.61502 g of lead nitrate (99.0%) in a weighing boat and taken
into a 1000 mL volumetric flask and then dissolved using deionized water to make 1000
mg/L of lead solution. Using the formula: C1V1 = C2V2, a stock standard solution of 10
mg/L was made from the 1000 mg/L lead standard. 10mL of the 1000 mg/L lead standard
was pipetted into a 1000 mL volumetric flask and topped up to the mark with deionized
water. Subsequent dilutions to 0.2 mg/L, 0.3 mg/L 0.4 mg/L, 0.6 mg/L, 0.8 mg/L, 1.2 mg/L,
2.0 mg/L and 2.5 mg/L were prepared from the 10 mg/L standard. These standards were
used to obtain a calibration curve on the AAS.
3.6.6 Determination of copper
A copper hollow cathode lamp was used for this analysis. Preparation of standard copper
(1000 mg/L) was done by weighing 3.92915 g of copper (II) sulfate pentahydrate (98.7%) in
a weighing boat and diluted to volume in a 1000 mL volumetric flask using deionized water.
This standard contained 1000 mg/L of copper. A 100 mg/L standard was then made from
the stock standard by use of C1V1 = C2V2. Subsequent dilutions of 0.2 mg/L, 0.4 mg/L 0.6
mg/L, 0.8 mg/L, 2.0 mg/L and 2.5 mg/L were prepared from the 10 mg/L solution. These
standards were used to obtain a calibration curve on the AAS.
42
3.6.7 Determination of iron
An Iron hollow cathode lamp was used for this analysis. Preparation of standard iron (1000
mg/L) was done by weighing 4.85668 g of ferric chloride hexahydrate (99.3%) and diluting
it to make 1000 mL using deionized water to make 1000 mg/L of iron standard. Then using
the formula: C1V1 = C2V2, a stock standard of 10 mg/L was made from the 1000 mg/L Iron
standard. This was prepared by taking 5 mL of the 1000 mg/L stock solution into a 500 mL
volumetric flask and making up to the mark with deionized water. Subsequent dilutions to
0.4 mg/L, 0.6 mg/L 0.8 mg/L, 1.0 mg/L, 1.4 mg/L, 1.8 mg/L, and 2.0 mg/L were prepared
from the 10 mg/L standard. These standards were used to obtain a calibration curve on the
AAS.
3.6.8 Determination of chromium
Chromium hollow cathode lamp was used for this analysis. Preparation of standard
chromium (1000 mg/L) was done by weighing 2.83175 g of potassium dichromate (99.9%)
in a weighing boat and diluted to volume to make 1000 mL using distilled water to make
1000 mg/L of chromium standard. Using the formula: C1V1 = C2V2, a solution of 10 mg/L
was made from the 1000 mg/L. 5 mL of the standard chromium stock solution (1000 mg/L)
was pipetted into a 500 mL volumetric flask and topped up to the mark using distilled water.
Subsequent dilutions to 0.2 mg/L, 0.3 mg/L 0.5 mg/L, 0.8 mg/L, 1.0 mg/L, 1.6 mg/L and 2.0
mg/L were made from the 10 mg/L standard. These calibration standards were used to
obtain a calibration curve on the AAS.

43
3.6.9 Determination of zinc
The zinc hollow cathode lamp was used for this analysis. Preparation of standard zinc (1000
mg/L) was done by weighing 1.0002 g of (99.6% pure) zinc granules in a weighing boat and
transferred into a 1000 mL volumetric flask. 30 mL of 5 M HCl was added to dissolve the
granules and then made to volume using deionized water. Using the formula: C1V1 = C2V2, a
stock standard of 10 mg/L was made from the 1000 mg/L. 5 mL of the standard zinc
standard solution (1000 mg/L) was pipetted into a 500 mL volumetric flask and made up to
the mark using deionized water. Subsequent dilutions to 0.2 mg/L, 0.3 mg/L 0.4 mg/L, 0.6
mg/L, 0.8 mg/L, 1.2 mg/L, 2.0 mg/L and 2.5 mg/L were made from the 10 mg/L solution.
These standards were used to obtain a calibration curve on the AAS.
Table 3.1 shows the elements analyzed and the respective AAS set up for their analysis.
Table 3.1 AAS conditions for analysis
Element Wavelength (nm) Slit width (mm) Lamp mode Flame type
Sodium 589.0 0.2 Emission Air - Acetylene
Potassium 766.5 0.7 Emission Air - Acetylene
Manganese 279.5 0.2 Absorption Air - Acetylene
Cadmium 228.8 0.7 Absorption Air - Acetylene
Lead 283.3 07 Absorption Air - Acetylene
Copper 324.8 0.7 Absorption Air - Acetylene
Iron 248.3 0.2 Absorption Air - Acetylene
Chromium 357.9 0.7 Absorption Air - Acetylene
Zinc 213.9 1.0 Absorption Air - Acetylene

44
3.6.10 Determination of Escherichia coli (E.coli)
Escherichia coli was determined by use of the multiple tube fermentation technique (MTF).
This was done in the Biological Analysis Unit in the National Quality Control Laboratory.
The media was sterilized in the autoclave and the analysis performed in the Bioban
Biosafety cabinet.
3.6.10.1 Preparation of lauryl sulfate tryptose broth (LST)
20 g of tryptose and 5 g of lactose were dissolved in 500 mL distilled water in a previously
cleaned and dried 1000 mL conical flask. 2.75 g of dibasic potassium orthophosphate, 2.75
g of monobasic potassium orthophosphate, 5 g of sodium chloride and 0.1 g sodium dodecyl
sulfate were also added to the flask. This solution was then topped up to 1000 mL with
distilled water. The final pH of this solution was 6.8. 10 mL portions of the solution was
dispensed into 20 × 150 mm tubes containing inverted 10 × 75 mm fermentation tubes and
autoclaved for 15 minutes at 121°C.
3.6.10.2 Preparation of brilliant green lactose bile broth
10 g of peptone and 10 g of lactose were dissolved in 500 mL distilled water in a previously
cleaned and dried 1000 mL conical flask. 20 g of anhydrous oxgall previously dissolved in
200 mL deionized water was added. 275 mL deionized water was added to make 975 mL
and 13.3 mL of 0.1% aqueous brilliant green was added and the solution was then topped up
to 1000 mL with water. The final pH of the solution was found to be 7.2. The media was
then dispensed into fermentation tubes, while ensuring that fluid level covered inverted vials
and then autoclaved for 15 minutes at 121°C.

45
3.6.10.3 Microbiological analysis of the water samples
3.6.10.3.1 Presumptive test
100 mL of samples were taken into 100 mL previously sterilized bottles. 5 tubes with 10 mL
of the lauryl sulfate tryptose (LST) medium were inoculated with 10 mL of undiluted
samples. The tubes were set in an incubator at 35°C. After 24 hours elapsed, the tubes were
taken out of the incubator and examined for growth and gas formation what would have
been evidenced if the medium had been displaced in the fermentation tubes or the medium
effervescenced as the tubes were gently agitated. The tubes were then put back into the
incubator for another 24 h and re- examined.
3.6.10.3.2 Confirmed test
This test was carried out on the tubes from the presumptive test earlier. Each of the
presumptive tube was lightly shaken then by use of a sterile loop of 3.0 mm, two full loops
of the LST broth from the presumptive tubes were transferred fully into the brilliant green
lactose bile broth (BGLB broth) tubes. These tubes were put a 35°C incubator for 48 hours
and then checked for production of gas.
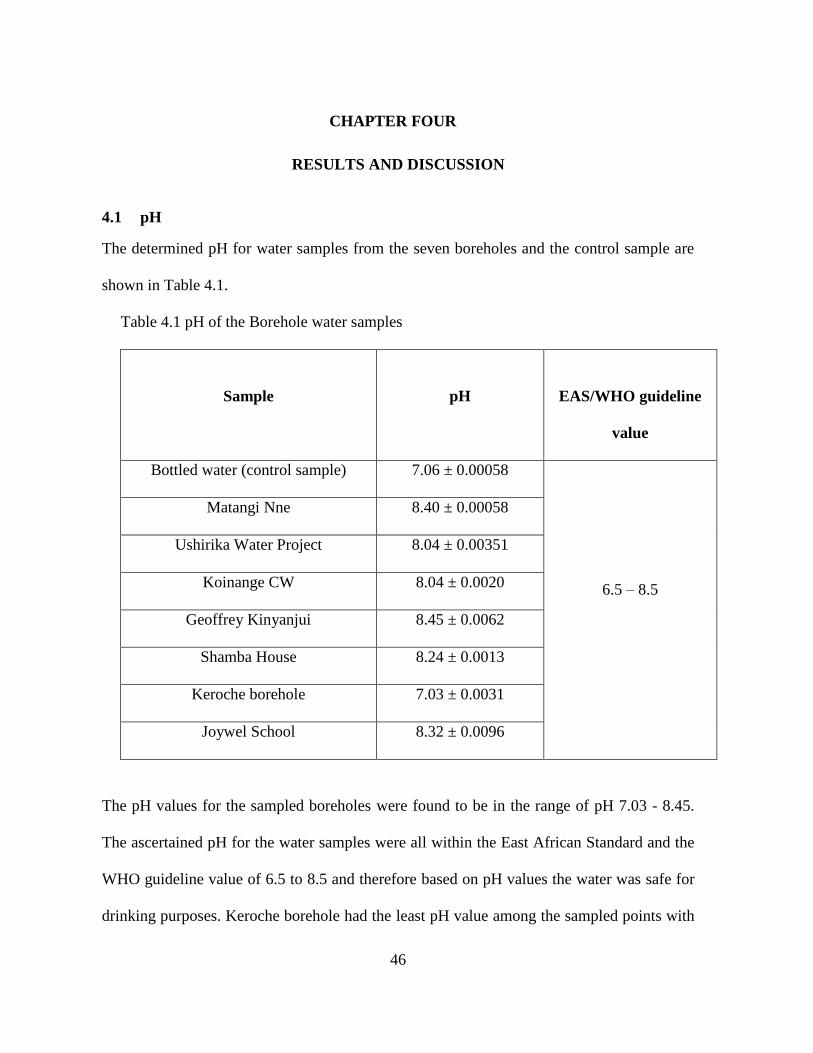
46
CHAPTER FOUR
RESULTS AND DISCUSSION
4.1 pH
The determined pH for water samples from the seven boreholes and the control sample are
shown in Table 4.1.
Table 4.1 pH of the Borehole water samples
Sample
pH
EAS/WHO guideline
value
Bottled water (control sample) 7.06 ± 0.00058
6.5 – 8.5
Matangi Nne 8.40 ± 0.00058
Ushirika Water Project 8.04 ± 0.00351
Koinange CW 8.04 ± 0.0020
Geoffrey Kinyanjui 8.45 ± 0.0062
Shamba House 8.24 ± 0.0013
Keroche borehole 7.03 ± 0.0031
Joywel School 8.32 ± 0.0096
The pH values for the sampled boreholes were found to be in the range of pH 7.03 - 8.45.
The ascertained pH for the water samples were all within the East African Standard and the
WHO guideline value of 6.5 to 8.5 and therefore based on pH values the water was safe for
drinking purposes. Keroche borehole had the least pH value among the sampled points with

47
a pH of 7.03 while the borehole belonging to Geofrey Kinyanjui had the highest pH value of
8.45. This was an indication that there might have been slightly more anions in the water
than there were cations and therefore low acidity. The summary of the pH values of the
water samples is shown in Figure 4.1. The summary shows how the pH of the water samples
and the control sample compared to the East African Standard and the WHO guideline for
drinking water.
Figure 4.1: Summary of the pH of the Borehole water samples
4.2 Electrical conductivity
The values of the electrical conductivity of the water samples determined in the laboratory
are given in Table 4.2.
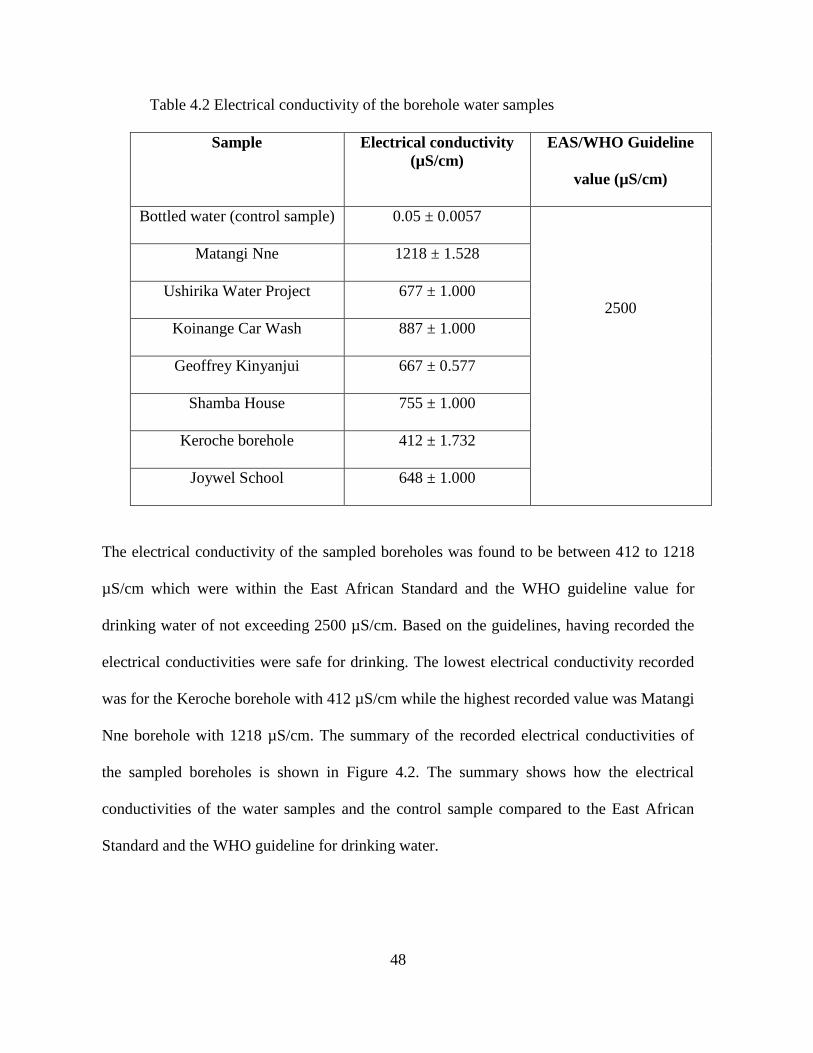
48
Table 4.2 Electrical conductivity of the borehole water samples
Sample Electrical conductivity
(µS/cm)
EAS/WHO Guideline
value (µS/cm)
Bottled water (control sample) 0.05 ± 0.0057
2500
Matangi Nne 1218 ± 1.528
Ushirika Water Project 677 ± 1.000
Koinange Car Wash 887 ± 1.000
Geoffrey Kinyanjui 667 ± 0.577
Shamba House 755 ± 1.000
Keroche borehole 412 ± 1.732
Joywel School 648 ± 1.000
The electrical conductivity of the sampled boreholes was found to be between 412 to 1218
µS/cm which were within the East African Standard and the WHO guideline value for
drinking water of not exceeding 2500 µS/cm. Based on the guidelines, having recorded the
electrical conductivities were safe for drinking. The lowest electrical conductivity recorded
was for the Keroche borehole with 412 µS/cm while the highest recorded value was Matangi
Nne borehole with 1218 µS/cm. The summary of the recorded electrical conductivities of
the sampled boreholes is shown in Figure 4.2. The summary shows how the electrical
conductivities of the water samples and the control sample compared to the East African
Standard and the WHO guideline for drinking water.

49
Figure 4.2: Summary of the electrical conductivity of the borehole water samples
4.3 Turbidity
The turbidity measurements for water samples in the seven boreholes are given in Table 4.3.
Table 4.3 Turbidity of the borehole water samples
Sample Point Turbidity (NTU) EAS/WHO Guideline Value
(NTU)
Bottled water (control sample) 0.157 ± 0.152
1
Matangi nne 0.135 ± 0.001
Ushirika Water Project 0.099 ± 0.001
Koinange Car Wash 0.116 ± 0.000
Geoffrey Kinyanjui 0.095 ± 0.001
Shamba House 0.108 ± 0.001
Keroche borehole 0.210 ± 0.002
Joywel School 0.355 ± 0.002
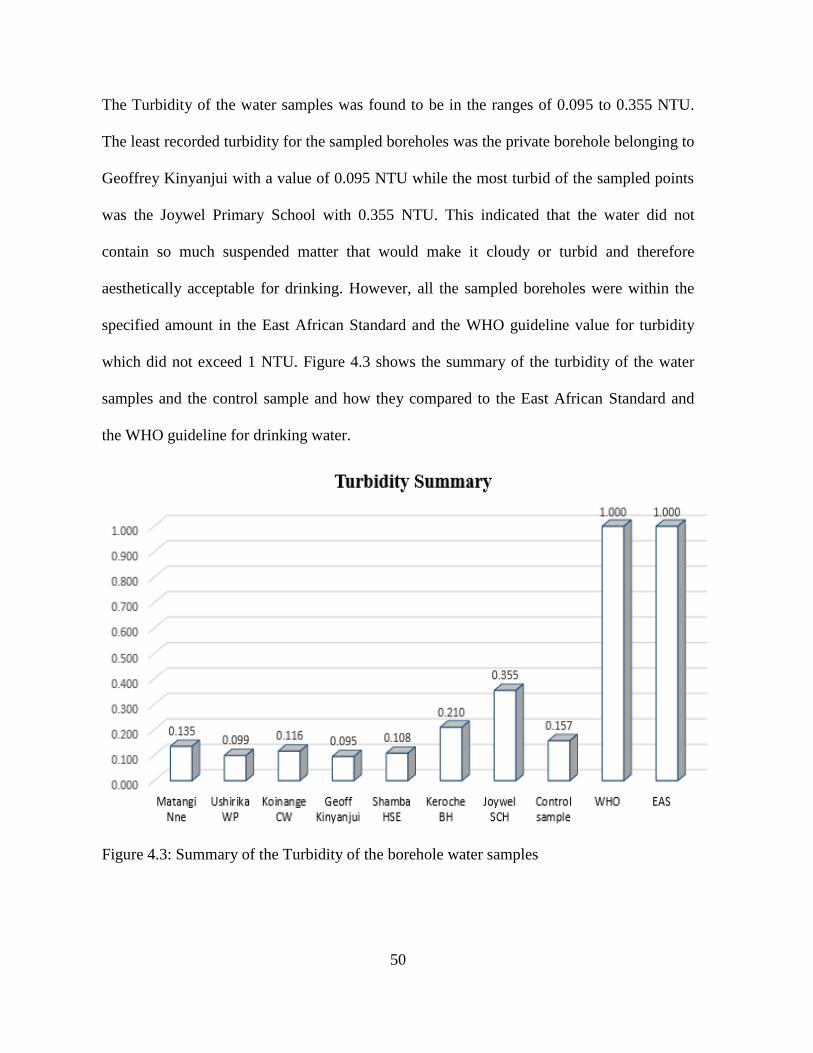
50
The Turbidity of the water samples was found to be in the ranges of 0.095 to 0.355 NTU.
The least recorded turbidity for the sampled boreholes was the private borehole belonging to
Geoffrey Kinyanjui with a value of 0.095 NTU while the most turbid of the sampled points
was the Joywel Primary School with 0.355 NTU. This indicated that the water did not
contain so much suspended matter that would make it cloudy or turbid and therefore
aesthetically acceptable for drinking. However, all the sampled boreholes were within the
specified amount in the East African Standard and the WHO guideline value for turbidity
which did not exceed 1 NTU. Figure 4.3 shows the summary of the turbidity of the water
samples and the control sample and how they compared to the East African Standard and
the WHO guideline for drinking water.
Figure 4.3: Summary of the Turbidity of the borehole water samples
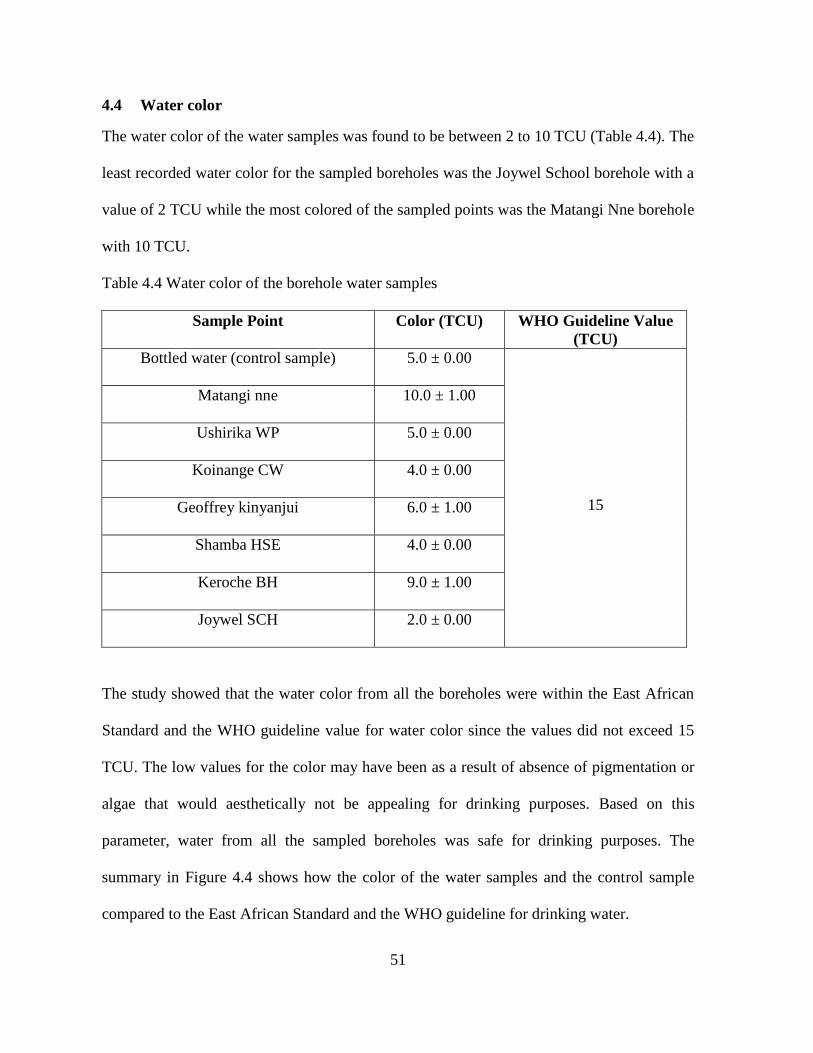
51
4.4 Water color
The water color of the water samples was found to be between 2 to 10 TCU (Table 4.4). The
least recorded water color for the sampled boreholes was the Joywel School borehole with a
value of 2 TCU while the most colored of the sampled points was the Matangi Nne borehole
with 10 TCU.
Table 4.4 Water color of the borehole water samples
Sample Point Color (TCU) WHO Guideline Value
(TCU)
Bottled water (control sample) 5.0 ± 0.00
15
Matangi nne 10.0 ± 1.00
Ushirika WP 5.0 ± 0.00
Koinange CW 4.0 ± 0.00
Geoffrey kinyanjui 6.0 ± 1.00
Shamba HSE 4.0 ± 0.00
Keroche BH 9.0 ± 1.00
Joywel SCH 2.0 ± 0.00
The study showed that the water color from all the boreholes were within the East African
Standard and the WHO guideline value for water color since the values did not exceed 15
TCU. The low values for the color may have been as a result of absence of pigmentation or
algae that would aesthetically not be appealing for drinking purposes. Based on this
parameter, water from all the sampled boreholes was safe for drinking purposes. The
summary in Figure 4.4 shows how the color of the water samples and the control sample
compared to the East African Standard and the WHO guideline for drinking water.
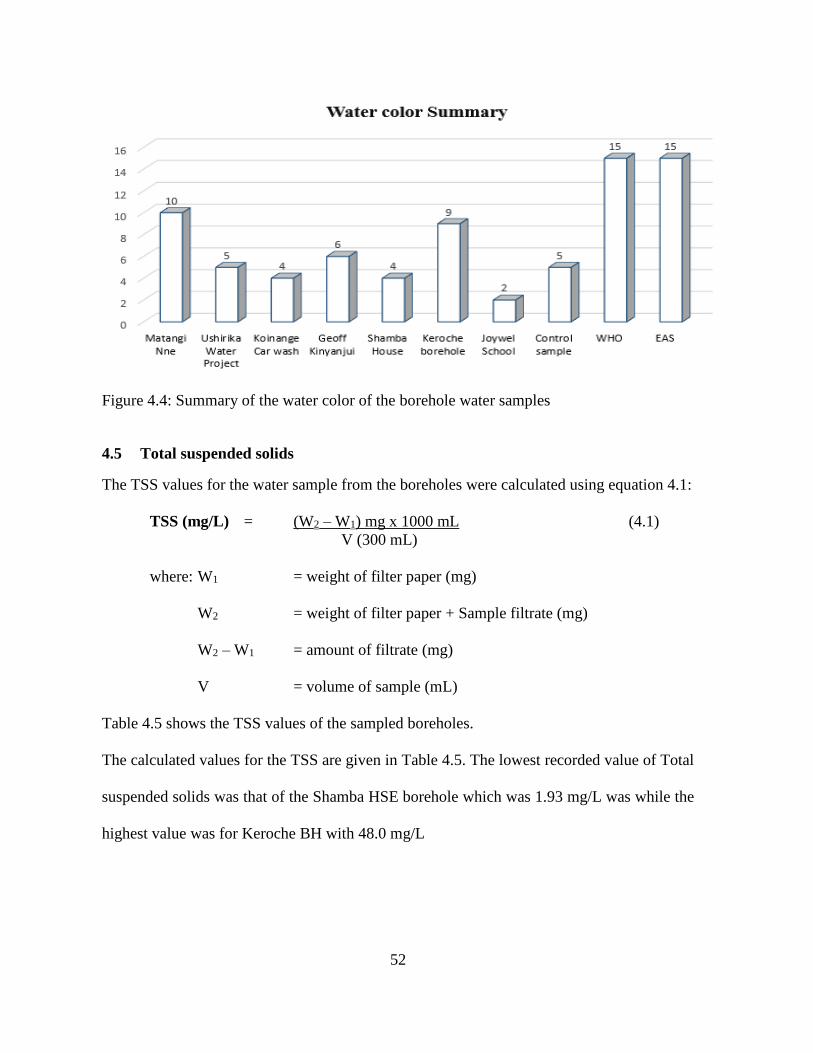
52
Figure 4.4: Summary of the water color of the borehole water samples
4.5 Total suspended solids
The TSS values for the water sample from the boreholes were calculated using equation 4.1:
TSS (mg/L) = (W2 – W1) mg x 1000 mL (4.1)
V (300 mL)
where: W1 = weight of filter paper (mg)
W2 = weight of filter paper + Sample filtrate (mg)
W2 – W1 = amount of filtrate (mg)
V = volume of sample (mL)
Table 4.5 shows the TSS values of the sampled boreholes.
The calculated values for the TSS are given in Table 4.5. The lowest recorded value of Total
suspended solids was that of the Shamba HSE borehole which was 1.93 mg/L was while the
highest value was for Keroche BH with 48.0 mg/L

53
Table 4.5 Total suspended solids values of the sampled boreholes
Sampling
point
(borehole)
Weight of
filter paper
W1 (mg)
Weight of filter
paper + sample
filtrate W2 (mg)
Amount of
filtrate (W2 - W1)
(mg)
TSS
Value
mg/L
EAS/WHO
guideline
value (mg/L)
Matangi Nne 920.89 921.85 0.96 3.33
ND
Joywel School 912.17 912.77 0.60 2.00
Koinange CW 896.84 903.83 6.99 23.30
Ushirika WP 906.03 909.76 3.73 12.43
Geof. Kinyanjui 898.20 908.69 10.49 34.97
Shamba House 926.21 926.79 0.58 1.93
Keroche BH 893.34 907.74 14.4 48.00
The study showed that there was suspended matter present in the water samples. This may
have resulted from little particles of dirt that may have been present in the boreholes. The
East African Standard and the WHO guideline have however state that no suspended matter
should be present in drinking water hence none of the sampled boreholes met that said
criteria and therefore it would be necessary to filter the borehole water before consumption.
Based on this parameter, water from all the sampled boreholes was not safe for drinking
purposes. Figure 4.5 shows the summary of the TSS values of the water samples and the
control sample and how they compared to the East African Standard and the WHO guideline
for drinking water.

54
Figure 4.5: Summary of the TSS values for the sampled boreholes
4.6 Total dissolved solids
Total dissolved solids for the water samples from the boreholes were calculated using
equation 4.2:
TDS (mg/L) = (W2 – W1) mg x 1000 mL (4.2)
V (200 mL)
Where: W1 = weight of empty beaker (mg)
W2 = weight of beaker + sample residue (mg)
W2 – W1 = amount of residue (mg)
V = volume of sample (mL)
The calculated values for the TDS in the sampled boreholes is given in Table 4.6

55
Table 4.6 Total dissolved solids of the sampled boreholes.
Sampling
point
(borehole)
Weight of
beaker W1
(mg)
Weight of
beaker + sample
residue W2 (mg)
Amount of residue
(W2 - W1) (mg)
TDS Value
mg/L
EAS/WHO
guideline
value (mg/L)
Matangi Nne 99995.00 100079.20 84.20 421.00
NMT 1500
Joywel School 101250.00 101302.20 52.20 261.00
Koinange CW 98760.00 98768.60 8.60 43.00
Ushirika WP 100250.00 100299.20 49.20 246.00
Geof. Kinyanjui 100660.00 100702.20 42.20 211.00
Shamba House 99860.00 99918.20 58.20 291.00
Keroche BH 100610.00 100645.80 35.80 179.00
From the sampled boreholes, the least value of the TDS was recorded for Koinange Car
Wash borehole which had 43 mg/L. Matangi Nne borehole had the highest value of TDS
with 421 mg/L, this may have been due to its close proximity to the Wildfire flower farm
and possibly many contaminants from the use of chemical based herbicides and pesticides in
the farm finding their way into the borehole. However, the East African Standard and the
WHO guideline value for the TDS is 1500 mg/L whereby all the sampled boreholes met this
criteria. Therefore, based on this parameter, water from all the sampled boreholes was safe
for drinking purposes. Figure 4.6 shows how the TDS for the water samples and the control
sample compared to the East African Standard and the WHO guideline for drinking water.

56
Figure 4.6: Summary of the TDS values for the sampled boreholes
4.7 Total hardness
The hardness for the samples was calculated as outlined in the following sections:
4.7.1 0.01M calcium carbonate standard
The calcium standard solution was prepared as follows:
Amount of CaCO3 weighed = 0.99997 g
No. of moles of CaCO3 = 0.99997 g = 0.009991 moles of Ca2+
100.0869g/mole
Concentration of CaCO3 = 0.009991 moles of CaCO3
x 1000 = 0.0099991M
1000 mL

57
4.7.2 EDTA Standardization with 0.01M calcium carbonate standard
The stoichiometric reaction between calcium carbonate and EDTA is as follows:
CaCO3 + Na2EDTA Ca (EDTA) + Na2CO3
The reaction ratio between standard CaCO3 and 0.01M EDTA from the stoichiometric
reaction above is 1:1. 0.01M EDTA was titrated against 20 mL standard CaCO3. The results
for standardization of EDTA with standard calcium carbonate are given in Table 4.7.
Table 4.7: EDTA Standardization with 0.0099991M calcium standard
Titration No.
Vol. of CaCO3 (mL)
Burette Reading (mL)
Volume of EDTA
(mL) Final Initial
1 20 19.7 0.0 19.7
2 20 39.7 19.7 19.8
3 20 19.8 0.0 19.9
4 20 39.8 20.0 19.8
Av. volume of EDTA (mL) = 19.7 + 19.8 + 19.9 + 19.8 = 19.8 mL ± 0.0816
4
No. of moles of CaCO3 = Molarity x Volume taken = 0.0099991 M x 20 mL
1000 mL 1000 mL
= 1.9982 x 10⁻⁴ moles of EDTA
Actual Molarity of EDTA = 1.9982 x 10⁻⁴ moles x 1000 mL = 0.01009M
19.8 mL
The formula (4.3) was used to quantify the water hardness in mg/L as CaCO3
(4.3)
Volume of sample used = 20 mL
Molar mass of CaCO3 = 100.09 g/mole
Molarity of EDTA = 0.01009M

58
The calculated hardness for the water samples are shown in Table 4.8.
The calculations for the hardness of individual water samples are shown in Appendices AI
to AVIII.
Table 4.8: Hardness values for the water samples.
Sampling point (Borehole) Hardness as CaCO3
(mg/L)
EAS/WHO guideline
value
Matangi Nne 47.13
300 mg/L
Ushirika Water Project 43.76
Koinange Car Wash 43.76
Geoffrey Kinyanjui 31.97
Shamba House 31.97
Keroche Borehole 85.84
Joywel School 28.62
Bottled water (control) 2.52
From the sampled boreholes (Table 4.8), the TDS for the boreholes was found to be 28.62
mg/L for the lowest value which was recorded for Joywel School borehole. The highest
recorded value was 47.13 mg/L for Matangi Nne borehole. This may have resulted from its
close proximity to a flower farm that may be using calcium and magnesium based farm
chemicals which over time may have leached into the aquifers. However, based on the East
African and the WHO guideline value, all the sampled boreholes were within the acceptable
value that is set as300 mg/L. Based on this parameter, water from all the sampled boreholes
was safe for drinking purposes. Figure 4.7 shows the summary of the calculated water
hardness for the water samples and the control sample and how they compared with the East
African Standard and the WHO guideline for drinking water.

59
Figure 4.7: Summary of the Total hardness values for the sampled boreholes.
4.8 Alkalinity
The alkalinity of water was calculated as outlined in the following sections.
4.8.1 0.01M Sodium carbonate standard
The concentration of sodium carbonate standard was determined as follows:
No. of moles of Na2CO3 = 0.86866 g = 0.0081957 moles
105.99g/mole
Concentration of Na2CO3 = 0. 0081957 moles x 1000 = 0.0081957M
1000 mL
4.8.2 H2SO4 Standardization with 0.0081957M Na2CO3 standard
Table 4.9 shows the standardization of 0.01M H2SO4 using standard 0.0081957M Na2CO3.
Four determinations were made from which the actual concentration of H2SO4 was
calculated.

60
Table 4.9: H2SO4 Standardization with 0.0081957M Na2CO3 standard
Titration No.
Vol. of Na2CO3
(mL)
Burette Reading (mL)
Volume of H2SO4 (mL) Final Initial
1 20 16.2 0.0 16.2
2 20 31.9 16.2 15.7
3 20 15.6 0.0 15.6
4 20 31.3 15.6 15.7
Average volume of H2SO4 (mL) = 16.2 + 15.7 + 15.6 + 15.7 = 15.8 mL ± 0.271
4
No. of moles of Na2CO3 in 20 mL = Molarity x Volume taken = 0. 0081957M x 20 mL
1000 mL 1000 mL
= 1.63914 x 10⁻⁴ moles of Na2CO3
Actual Conc. of H2SO4 = 1. 63914 x 10-4 moles x 1000 mL
15.8 mL
Determined H2SO4 concentration = 0.0103743M
The formula (4.4) was used to calculate the Phenolphthalein/Total (P/T) alkalinity of the
water samples:
(4.4)
Molar mass of Na2CO3 = 105.987
Volume of borehole water taken = 20 mL
Concentration of H2SO4 = 0.0103743M
The determined phenolphthalein alkalinity and the total alkalinity for the borehole water
samples are shown in Table 4.10. The individual calculations are shown in Appendices BI to
BVIII.
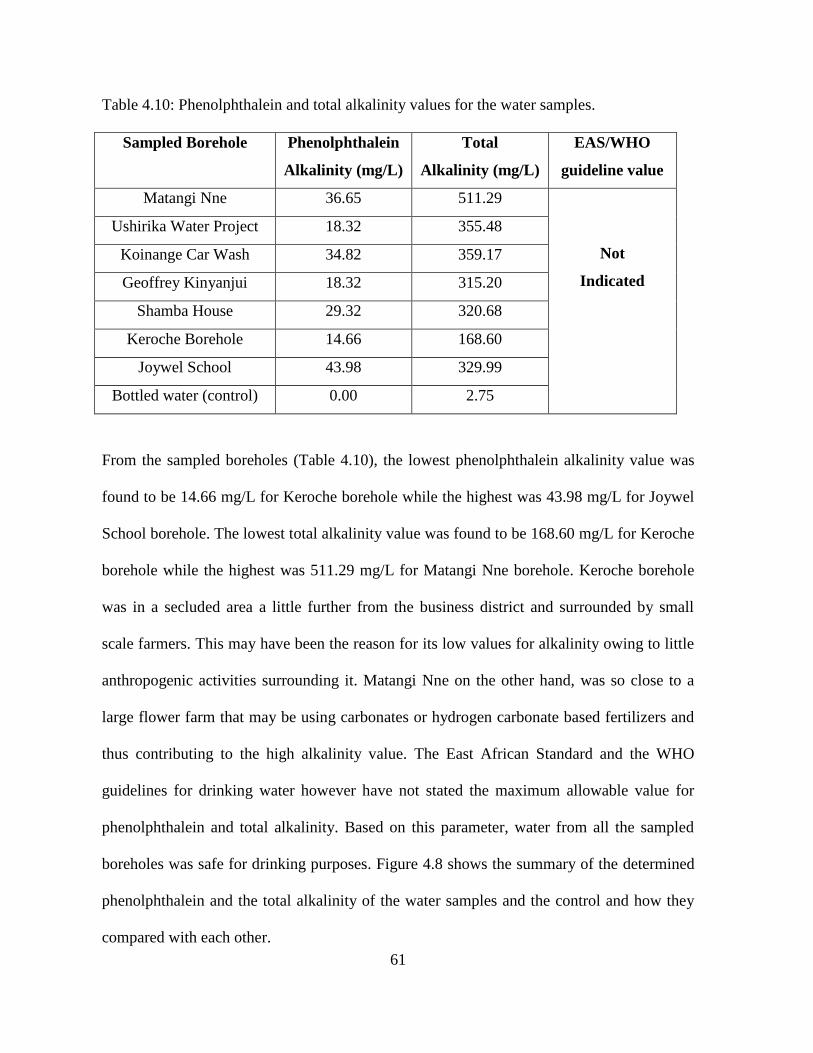
61
Table 4.10: Phenolphthalein and total alkalinity values for the water samples.
Sampled Borehole Phenolphthalein
Alkalinity (mg/L)
Total
Alkalinity (mg/L)
EAS/WHO
guideline value
Matangi Nne 36.65 511.29
Not
Indicated
Ushirika Water Project 18.32 355.48
Koinange Car Wash 34.82 359.17
Geoffrey Kinyanjui 18.32 315.20
Shamba House 29.32 320.68
Keroche Borehole 14.66 168.60
Joywel School 43.98 329.99
Bottled water (control) 0.00 2.75
From the sampled boreholes (Table 4.10), the lowest phenolphthalein alkalinity value was
found to be 14.66 mg/L for Keroche borehole while the highest was 43.98 mg/L for Joywel
School borehole. The lowest total alkalinity value was found to be 168.60 mg/L for Keroche
borehole while the highest was 511.29 mg/L for Matangi Nne borehole. Keroche borehole
was in a secluded area a little further from the business district and surrounded by small
scale farmers. This may have been the reason for its low values for alkalinity owing to little
anthropogenic activities surrounding it. Matangi Nne on the other hand, was so close to a
large flower farm that may be using carbonates or hydrogen carbonate based fertilizers and
thus contributing to the high alkalinity value. The East African Standard and the WHO
guidelines for drinking water however have not stated the maximum allowable value for
phenolphthalein and total alkalinity. Based on this parameter, water from all the sampled
boreholes was safe for drinking purposes. Figure 4.8 shows the summary of the determined
phenolphthalein and the total alkalinity of the water samples and the control and how they
compared with each other.

62
Figure 4.8: Summary of the Phenolphthalein and Total Alkalinity values for the
sampled boreholes
4.9 Concentration of anions in the water samples.
4.10 Concentration of chloride in the water samples
The determination of Chloride ion was done using Mohr’s method
4.10.1 0.1M Sodium chloride standard
The concentration of the sodium chloride standard was determined as follows:
Weight of the NaCl taken = 2.92192 g
Topped up to 500 mL using deionized water.
No. of moles of NaCl = 2.92192 g = 0.04999 moles
58.44g/mole
Concentration of NaCl = 0.4999 moles x 1000 = 0.0999M
500 mL

63
4.10.2 Silver nitrate standardization with 0.0999M NaCl standard
Titration values for the standardization of silver nitrate with standard sodium are shown in
Table 4.11. Four determinations were made from which the actual concentration of the
silver nitrate was calculated.
Table 4.11: Silver nitrate standardization with 0.0999M NaCl standard
Titration No. Vol. of NaCl (mL) Burette Reading (mL) Volume of AgNO3 (mL)
Final Initial
1 15 15.1 0.0 15.1 ± 0.10 mL
2 20 35.3 15.1 20.2 ± 0.10 mL
3 25 24.9 0.0 24.9 ± 0.10 mL
4 30 30.1 0.0 30.1 ± 0.10 mL
No. of moles of NaCl in 15 mL = Molarity x Volume taken = 0.09999M x 15 mL
1000 mL 1000 mL
= 1.4999 x 10⁻³ moles of AgNO3
Conc. of AgNO3= 1. 4999 x 10-3 moles x 1000 mL = 0.09933M
15.1 mL
No. of moles of NaCl in 20 mL = Molarity x Volume taken = 0.09999M x 20 mL
1000 mL 1000 mL
= 1.9998 x 10⁻³ moles of AgNO3
Conc. of AgNO3= 1. 9998 x 10-3 moles x 1000 mL = 0.0990M
20.2 mL
No. of moles of NaCl in 25 mL = Molarity x Volume taken = 0.09999M x 25 mL
1000 mL 1000 mL
= 2.4999 x 10⁻³ moles of AgNO3
Conc. of AgNO3= 2.4999 x 10⁻³ moles x 1000 mL = 0.10040M
24.9 mL
No. of moles of NaCl in 30 mL = Molarity x Volume taken = 0.09999M x 30 mL
1000 mL 1000 mL
= 2.999 x 10⁻³ moles of AgNO3
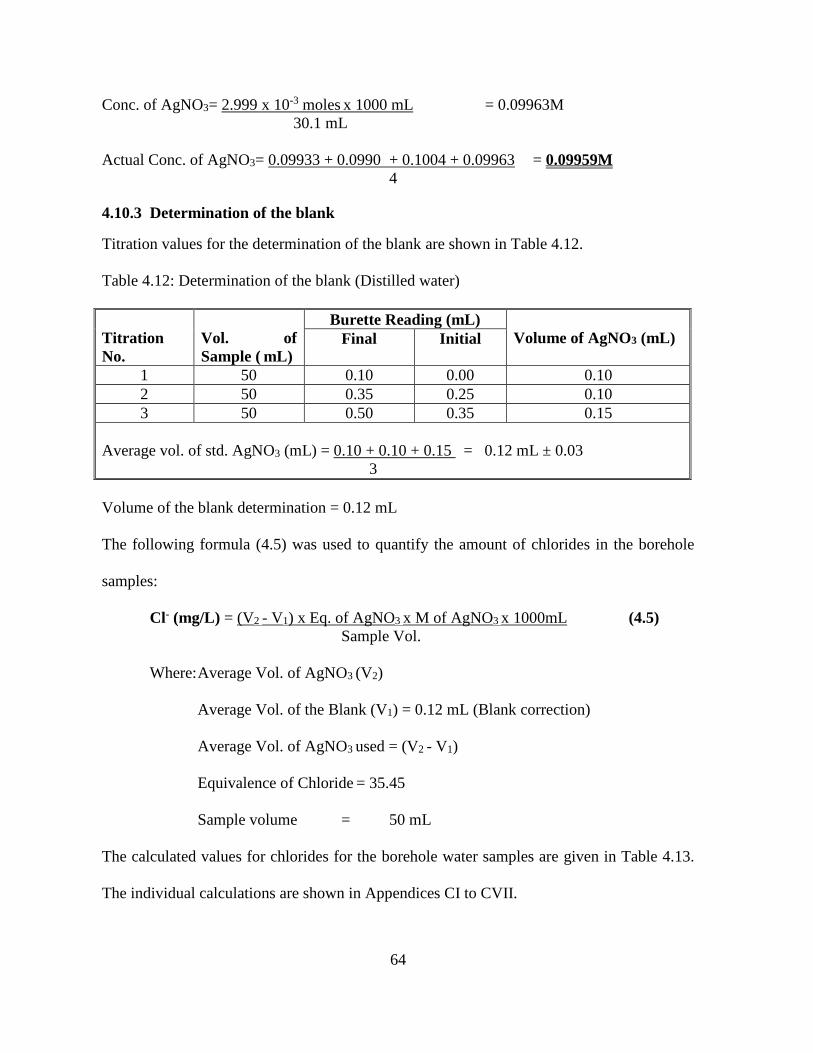
64
Conc. of AgNO3= 2.999 x 10⁻³ moles x 1000 mL = 0.09963M
30.1 mL
Actual Conc. of AgNO3= 0.09933 + 0.0990 + 0.1004 + 0.09963 = 0.09959M
4
4.10.3 Determination of the blank
Titration values for the determination of the blank are shown in Table 4.12.
Table 4.12: Determination of the blank (Distilled water)
Titration
No.
Vol. of
Sample ( mL)
Burette Reading (mL)
Volume of AgNO3 (mL) Final Initial
1 50 0.10 0.00 0.10
2 50 0.35 0.25 0.10
3 50 0.50 0.35 0.15
Average vol. of std. AgNO3 (mL) = 0.10 + 0.10 + 0.15 = 0.12 mL ± 0.03
3
Volume of the blank determination = 0.12 mL
The following formula (4.5) was used to quantify the amount of chlorides in the borehole
samples:
Cl- (mg/L) = (V2 - V1) x Eq. of AgNO3 x M of AgNO3 x 1000mL (4.5)
Sample Vol.
Where: Average Vol. of AgNO3 (V2)
Average Vol. of the Blank (V1) = 0.12 mL (Blank correction)
Average Vol. of AgNO3 used = (V2 - V1)
Equivalence of Chloride = 35.45
Sample volume = 50 mL
The calculated values for chlorides for the borehole water samples are given in Table 4.13.
The individual calculations are shown in Appendices CI to CVII.

65
Table 4.13: Chloride values for the water samples
Sampling point (Borehole) Chloride as -Cl
(mg/L)
EAS/WHO
guideline value
Matangi Nne 79.78
250 mg/L
Ushirika Water Project 26.65
Koinange Car Wash 52.80
Geoffrey Kinyanjui 36.24
Shamba House 53.98
Keroche Borehole 30.36
Joywel School 29.18
From the sampled boreholes, the lowest determined value for the chlorides was found to be
25.65 mg/L for Ushirika Water Project borehole in Kayole Area, that may have resulted
from the naturally occurring chloride salts in the natural rocks while the highest value was
79.78 mg/L for Matangi Nne borehole that may have resulted from chloride based chemicals
that may be used in the flower farm close by. The relatively higher amounts of chlorides in
the Shamba House and Koinange Carwash borehole may have resulted from improper
disposal of chloride batteries from motor vehicle repair shops close by. However, all the
sampled boreholes met the East African Standard and the WHO guideline value for the
chloride set at NMT 250 mg/L therefore, this parameter was within acceptable limits. Based
on this parameter, water from all the sampled boreholes was safe for drinking purposes.
Figure 4.9 shows the summary of calculated chlorides content of the water samples and the
control sample and how they compared with the East African Standard and the WHO
guideline for drinking water.

66
Figure 4.9: Summary of the chlorides content for the sampled boreholes
4.11 Chlorine
Chlorine determination was done using the Extech® digital chlorine meter.
4.11.1 Chlorine determination in the samples
The chlorine levels in the water samples from the seven boreholes are shown in Table 4.14.

67
Table 4.14: Amount of chlorine in the borehole samples
Sampling point (Borehole) Sample Volume
(mL)
Amount of chlorine
(mg/L)
EAS/WHO
guideline value
Distilled water 20 0.00 ± 0.00
5 mg/L
Matangi Nne 20 0.01± 0.0058
Ushirika Water Project 20 0.01 ± 0.00
Koinange Car Wash 20 0.01 ± 0.058
Geoffrey Kinyanjui 20 0.08 ± 0.01
Shamba House 20 0.01± 0.00
Keroche Borehole 20 0.01 ± 0.00
Joywel School 20 0.06 ± 0.015
Bottled water (control) 20 0.01 ± 0.00
From the sampled boreholes (Table 4.14), the amount of free chlorine was found to be 0.01
mg/L for all sampled boreholes except Geoffrey Kinyanjui and Joywel School boreholes
whose values were 0.08 mg/L and 0.06 mg/L of chlorine respectively. The presence of free
chlorine in the area may have been caused by use of chlorine based bleaches in the
surrounding industries or from the sodium hypochloride (JIK) that is often used as a
household bleaching agent that may have leached into the underground water. The East
African Standard and the WHO guidelines value is given as 5 mg/L whereby all the sampled
boreholes complied with this criteria. Based on this parameter, water from all the sampled
boreholes was safe for drinking purposes.
4.12 Fluoride
The fluoride ion determination was done using the Extech digital fluoride meter.
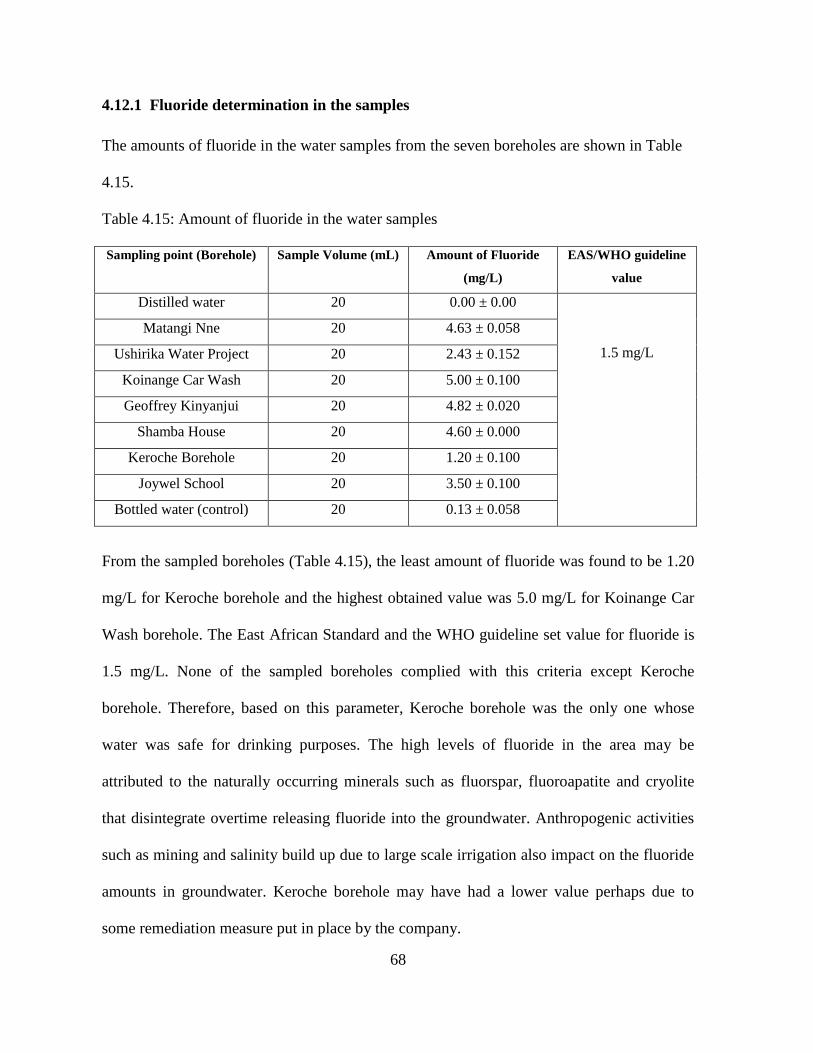
68
4.12.1 Fluoride determination in the samples
The amounts of fluoride in the water samples from the seven boreholes are shown in Table
4.15.
Table 4.15: Amount of fluoride in the water samples
Sampling point (Borehole) Sample Volume (mL) Amount of Fluoride
(mg/L)
EAS/WHO guideline
value
Distilled water 20 0.00 ± 0.00
1.5 mg/L
Matangi Nne 20 4.63 ± 0.058
Ushirika Water Project 20 2.43 ± 0.152
Koinange Car Wash 20 5.00 ± 0.100
Geoffrey Kinyanjui 20 4.82 ± 0.020
Shamba House 20 4.60 ± 0.000
Keroche Borehole 20 1.20 ± 0.100
Joywel School 20 3.50 ± 0.100
Bottled water (control) 20 0.13 ± 0.058
From the sampled boreholes (Table 4.15), the least amount of fluoride was found to be 1.20
mg/L for Keroche borehole and the highest obtained value was 5.0 mg/L for Koinange Car
Wash borehole. The East African Standard and the WHO guideline set value for fluoride is
1.5 mg/L. None of the sampled boreholes complied with this criteria except Keroche
borehole. Therefore, based on this parameter, Keroche borehole was the only one whose
water was safe for drinking purposes. The high levels of fluoride in the area may be
attributed to the naturally occurring minerals such as fluorspar, fluoroapatite and cryolite
that disintegrate overtime releasing fluoride into the groundwater. Anthropogenic activities
such as mining and salinity build up due to large scale irrigation also impact on the fluoride
amounts in groundwater. Keroche borehole may have had a lower value perhaps due to
some remediation measure put in place by the company.
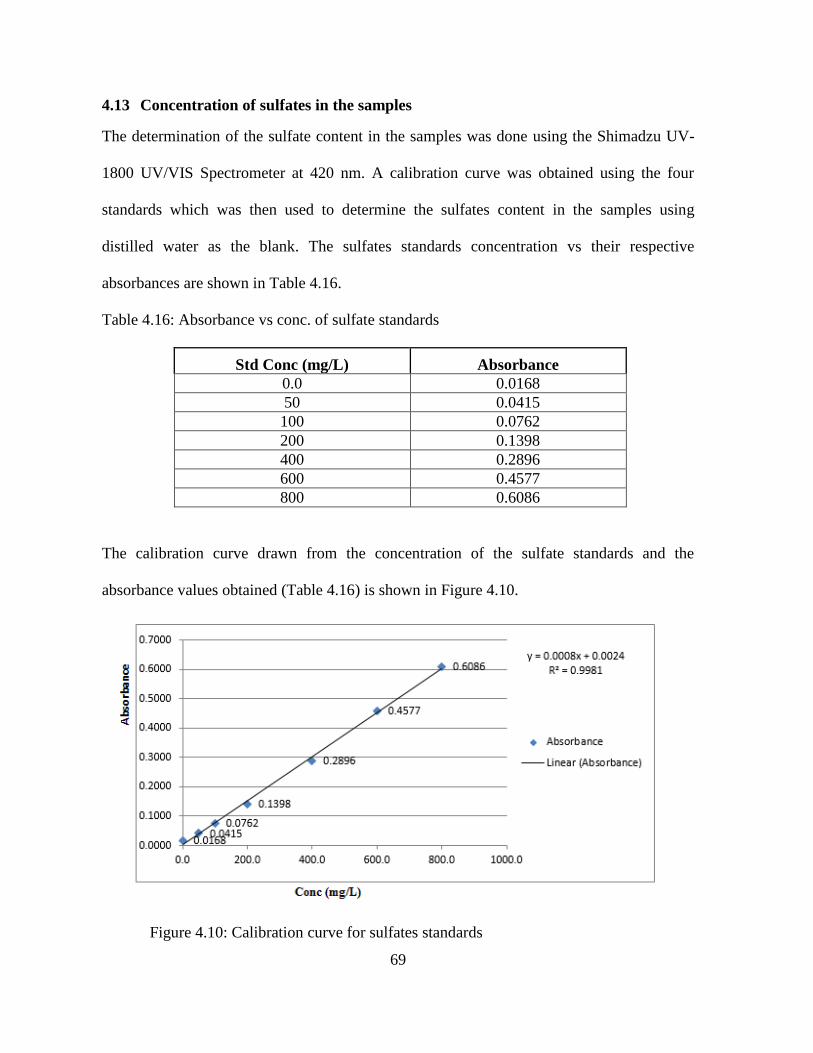
69
4.13 Concentration of sulfates in the samples
The determination of the sulfate content in the samples was done using the Shimadzu UV-
1800 UV/VIS Spectrometer at 420 nm. A calibration curve was obtained using the four
standards which was then used to determine the sulfates content in the samples using
distilled water as the blank. The sulfates standards concentration vs their respective
absorbances are shown in Table 4.16.
Table 4.16: Absorbance vs conc. of sulfate standards
Std Conc (mg/L) Absorbance
0.0 0.0168
50 0.0415
100 0.0762
200 0.1398
400 0.2896
600 0.4577
800 0.6086
The calibration curve drawn from the concentration of the sulfate standards and the
absorbance values obtained (Table 4.16) is shown in Figure 4.10.
Figure 4.10: Calibration curve for sulfates standards

70
The calculated amounts of sulfates in the boreholes samples are shown in Table 4.17.
Table 4.17: Actual amount of sulfates in the samples
Sampling point
(Borehole)
Absorbance
(y- Axis)
x = y – 0.0024
0.008
Actual Conc.
(mg/L)
= X * 20 mL
Limit of
Detection
LOD
EAS/WHO
guideline
value
Matangi Nne 0.1080 13.194 263.88
0.0028
500 mg/L
Koinange Car
Wash
0.0856 10.400 208.00
Ushirika Water
Project
0.0962 11.719 234.38
Shamba House 0.1020 12.456 249.13
Joywel School 0.0918 11.181 223.63
Geoffrey
Kinyanjui
0.0943 11.488 229.75
Keroche Borehole 0.0644 7.744 154.88
Bottled water
(control)
0.0061 0.463 9.25
From the analysis (Table 4.17), the borehole with the least amount of sulfates was Keroche
borehole with 154.88 mg/L while the highest amount was obtained from Matangi Nne
borehole which had 263.88 mg/L of sulfates. The values for the amounts of sulfates
obtained may have been as a result of natural occurrence e.g. gypsum or geological
processes for instance oxidation of pyrites. The other sources would be anthropogenic such
as use of ammonium sulfate fertilizers, pesticides (for the case of Matangi Nne borehole)
and decomposition of urban waste for the rest of the boreholes. The East African Standard
as well as the WHO guideline value of 500 mg/L was however met by all the sampled
points and therefore, water from all the sampled boreholes was safe for drinking purposes
based on this parameter.

71
4.14 Concentration of nitrates in the samples
The nitrate ion determination was determined by the UV/Vis spectrometer. The nitrates
calibration standards against their obtained absorbances are shown in Table 4.18.
Table 4.18: Absorbance vs conc. of nitrates standards
Std Conc (mg/L) Absorbance
0.0 0.0005
2.0 0.1240
4.0 0.2380
6.0 0.3600
12.0 0.7330
16.0 0.9568
20.0 1.1897
The calibration curve drawn from the concentration of the nitrates standards and the
absorbance values obtained (Table 4.18) is shown in Figure 4.11.
Figure 4.11: Calibration curve for nitrate standards

72
The calculated amounts of nitrates in the boreholes samples are shown in Table 4.19.
Table 4.19: Actual amount of nitrates in the samples
Sampling point
(Borehole)
Absorbance
(y- Axis)
x = y – 0.002
0.0597
Actual Conc.
(mg/L)
= X * 25
Limit of
Detection
LOD
EAS/WHO
guideline
value
Matangi Nne 0.0166 0.2448 6.12
0.0161
50 mg/L
Koinange Car Wash 0.0255 0.3936 9.84
Ushirika Water Project 0.0256 0.3960 9.90
Shamba House 0.0164 0.2416 6.04
Joywel School 0.0257 0.3976 9.94
Geoffrey Kinyanjui 0.0221 0.3364 8.41
Keroche borehole 0.0228 0.3476 8.69
Bottled water (control) 0.0149 0.2164 5.41
From the analysis (Table 4.19), the borehole with the least amount of nitrates was Shamba
House borehole with 6.04 mg/L while the largest amount was obtained from Joywel School
borehole which had 9.94 mg/L of nitrates. The values obtained in the study may have
resulted from use of nitrogen fertilizers within the area, improper septic systems and
spreading of manure whereby small amounts are leached through surface runoffs into the
ground. However, these values were much lower than the East African Standard and the
WHO guideline value set at 50 mg/L. Water from all the sampled boreholes was safe for
drinking purposes Based on this parameter.

73
4.15 Concentration of cations in the water samples
4.16 Concentration of sodium in the samples
The sodium content for the samples was ascertained using the AAS in the emission mode at
a wavelength of 588.76 nm. The emission values obtained from the respective sodium
calibration standards are shown in Table 4.20.
Table 4.20: Emission vs conc. of sodium calibration standards
Std Conc (mg/L) Emission
2.00 0.2897
4.00 0.5144
6.00 0.7005
8.00 0.9015
10.00 1.1256
The calibration curve drawn from the concentration of the sodium standards and the
emission values obtained (Table 4.20) is shown in Figure 4.12.
Figure 4.12: Calibration curve for sodium standards

74
The calculated amounts of sodium in the boreholes samples are shown in Table 4.21.
Table 4.21: Actual amount of sodium in the samples
Sampling point
(Borehole)
Emission
(y- Axis)
Actual Conc.
(mg/L)
x = y – 0.0887
0.1029
Limit of
Detection
LOD
EAS/WHO
guideline
value
Matangi Nne 1.5891 14.58
0.1404
200 mg/L
Koinange Car Wash 1.8001 16.63
Ushirika Water Project 1.9213 17.81
Shamba House 1.3274 12.04
Joywel School 1.7798 16.43
Geoffrey Kinyanjui 1.2356 11.15
Keroche borehole 0.9885 8.74
Bottled water (control) 0.4413 3.43
From the analysis (Table 4.21), the borehole with the least amount of sodium was Keroche
borehole with 8.74 mg/L while the highest amount was obtained from the Ushirika Water
Project borehole which had 17.81 mg/L of sodium. The amounts of sodium obtained may
have been as a result of natural occurrence of sodium compounds that erode overtime
depositing it into groundwater or anthropogenic where road salt is infiltrated into the ground
and also from leaching landfills. The East African Standard as well as the WHO guidelines
for drinking water have stated the maximum allowable limits for sodium as 200 mg/L
therefore, all the sampled boreholes met this criteria. Based on this parameter, water from all
the sampled boreholes was safe for drinking purposes.

75
4.17 Concentration of potassium in the samples
The potassium content in all the samples was ascertained using the AAS in the emission
mode. The emission values obtained from the respective potassium calibration standards are
shown in Table 4.22.
Table 4.22: Emission vs conc. of potassium calibration standards
Std Conc (mg/L) Emission
2.00 0.3988
3.00 0.4899
4.00 0.5789
5.00 0.6587
6.00 0.7277
8.00 0.8710
10.00 0.9991
The calibration curve drawn from the concentration of the potassium standards and the
emission values obtained (Table 4.22) is shown in Figure 4.13.
Figure 4.13: Calibration curve for potassium standards

76
The calculated amounts of potassium in the borehole samples are shown in Table 4.23.
Table 4.23: Actual amount of potassium in the samples
Sampling point
(Borehole)
Emission
(y- Axis)
Actual Conc.
(mg/L)
x = y – 0.2702
0.0745
Limit of Detection
LOD
EAS/WHO
guideline value
Matangi Nne 1.1491 11.80
0.3242
Not Indicated
Koinange Car Wash 1.3654 14.70
Ushirika Water
Project
1.5715 17.47
Shamba House 1.2637 13.34
Joywel School 1.5726 17.48
Geoffrey Kinyanjui 1.2887 13.67
Keroche borehole 1.5672 14.40
Bottled water
(control)
0.6587 5.21
From the analysis of potassium (Table 4.23), the borehole with the least amount of
potassium was Matangi Nne borehole with 11.80 mg/L while the highest amount was
obtained from Joywel School borehole which had 17.48 mg/L of potassium. The values
obtained may have been an indication of long term use of potassium based fertilizers in the
area which over time leach into the underground aquifers. The maximum allowable amount
of potassium has not been stated by neither the East African Standard nor the WHO
guidelines for drinking water.

77
4.18 Concentration of manganese in the samples
The manganese content for each of the samples was determined using an atomic absorption
spectrophotometer at 279.5 nm. The absorbance values obtained from the respective
manganese standard concentration values are shown in Table 4.24.
Table 4.24: Absorbance vs conc. of manganese standard concentrations
Std Conc (mg/L) Absorbance
0.20 0.0427
0.30 0.0654
0.40 0.0862
0.60 0.1304
0.80 0.1720
1.20 0.2546
2.00 0.4185
The calibration curve drawn from the concentration of the manganese standards and the
absorbance values obtained (Table 4.24) is shown in Figure 4.14.
Figure 4.14: Calibration curve for manganese standards.

78
The calculated amounts of manganese in the borehole samples are shown in Table 4.25.
Table 4.25: Actual amount of manganese in the samples
Sampling point
(Borehole)
Absorbance
(y- Axis)
Actual Conc.
(mg/L)
x = y – 0.0034
0.2084
Limit of Detection
LOD
EAS/WHO
guideline value
Matangi Nne 0.0009 -0.0120
0.0873
0.1 mg/L
Koinange Car Wash 0.0016 -0.0086
Ushirika Water Project 0.0026 0.0038
Shamba House 0.0011 -0.0110
Joywel School 0.0019 -0.0072
Geoffrey Kinyanjui 0.0011 -0.0110
Keroche borehole 0.0023 -0.0053
Bottled water (control) 0.0012 -0.0106
From the analysis of manganese above (Table 4.25), all the boreholes assessed had levels
that were below the detection limit of Manganese which was 0.0873. This means that
manganese release in the underground water was minimal indicating the of presence of
dissolved oxygen in water and therefore the Mn(IV) present in the bedrocks was not being
reduced to the soluble form Mn(II). The East African Standard as well as the WHO
guideline value for manganese is set at 0.1 mg/L whereby all the sampled points met this
criteria. Based on this parameter, water from all the sampled boreholes was safe for drinking
purposes.
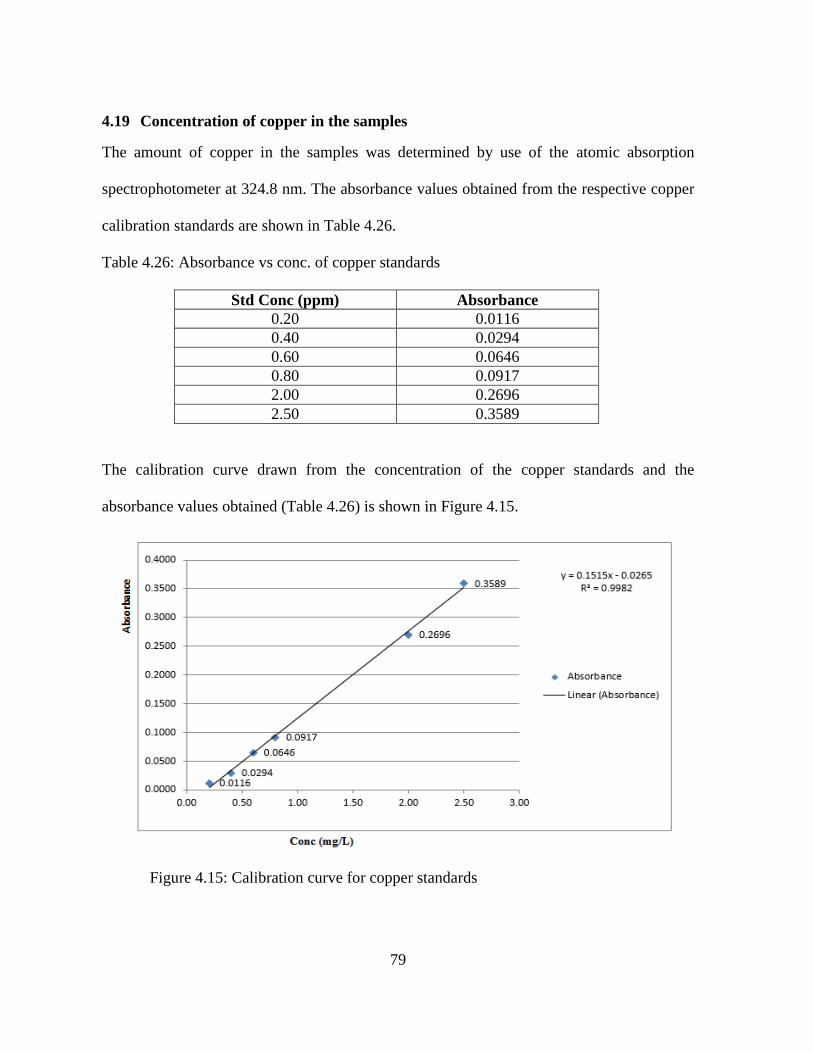
79
4.19 Concentration of copper in the samples
The amount of copper in the samples was determined by use of the atomic absorption
spectrophotometer at 324.8 nm. The absorbance values obtained from the respective copper
calibration standards are shown in Table 4.26.
Table 4.26: Absorbance vs conc. of copper standards
Std Conc (ppm) Absorbance
0.20 0.0116
0.40 0.0294
0.60 0.0646
0.80 0.0917
2.00 0.2696
2.50 0.3589
The calibration curve drawn from the concentration of the copper standards and the
absorbance values obtained (Table 4.26) is shown in Figure 4.15.
Figure 4.15: Calibration curve for copper standards
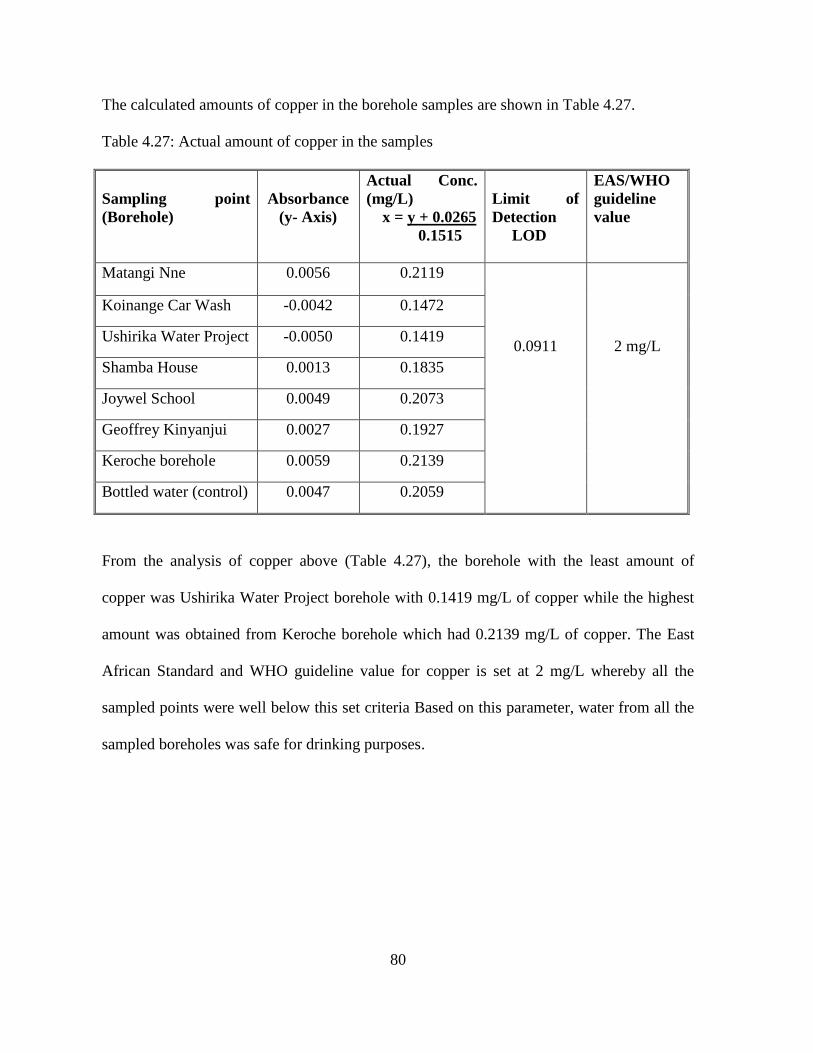
80
The calculated amounts of copper in the borehole samples are shown in Table 4.27.
Table 4.27: Actual amount of copper in the samples
Sampling point
(Borehole)
Absorbance
(y- Axis)
Actual Conc.
(mg/L)
x = y + 0.0265
0.1515
Limit of
Detection
LOD
EAS/WHO
guideline
value
Matangi Nne 0.0056 0.2119
0.0911
2 mg/L
Koinange Car Wash -0.0042 0.1472
Ushirika Water Project -0.0050 0.1419
Shamba House 0.0013 0.1835
Joywel School 0.0049 0.2073
Geoffrey Kinyanjui 0.0027 0.1927
Keroche borehole 0.0059 0.2139
Bottled water (control) 0.0047 0.2059
From the analysis of copper above (Table 4.27), the borehole with the least amount of
copper was Ushirika Water Project borehole with 0.1419 mg/L of copper while the highest
amount was obtained from Keroche borehole which had 0.2139 mg/L of copper. The East
African Standard and WHO guideline value for copper is set at 2 mg/L whereby all the
sampled points were well below this set criteria Based on this parameter, water from all the
sampled boreholes was safe for drinking purposes.

81
4.20 Concentration of iron in the samples
The iron content for the borehole samples was done using the atomic absorption
spectrophotometer at 248.3 nm. The absorbance versus iron concentration values of
standards are shown in Table 4.28.
Table 4.28: Absorbance vs conc. of iron standards
Std Conc (mg/L) Absorbance
0.4 0.0272
0.6 0.0447
0.8 0.0593
1.0 0.0779
1.4 0.1086
1.8 0.1413
2.0 0.1575
The calibration curve drawn from the iron standards concentration and the absorbance
values obtained (Table 4.28) is shown in Figure 4.16.
Figure 4.16: Calibration curve for iron standards.
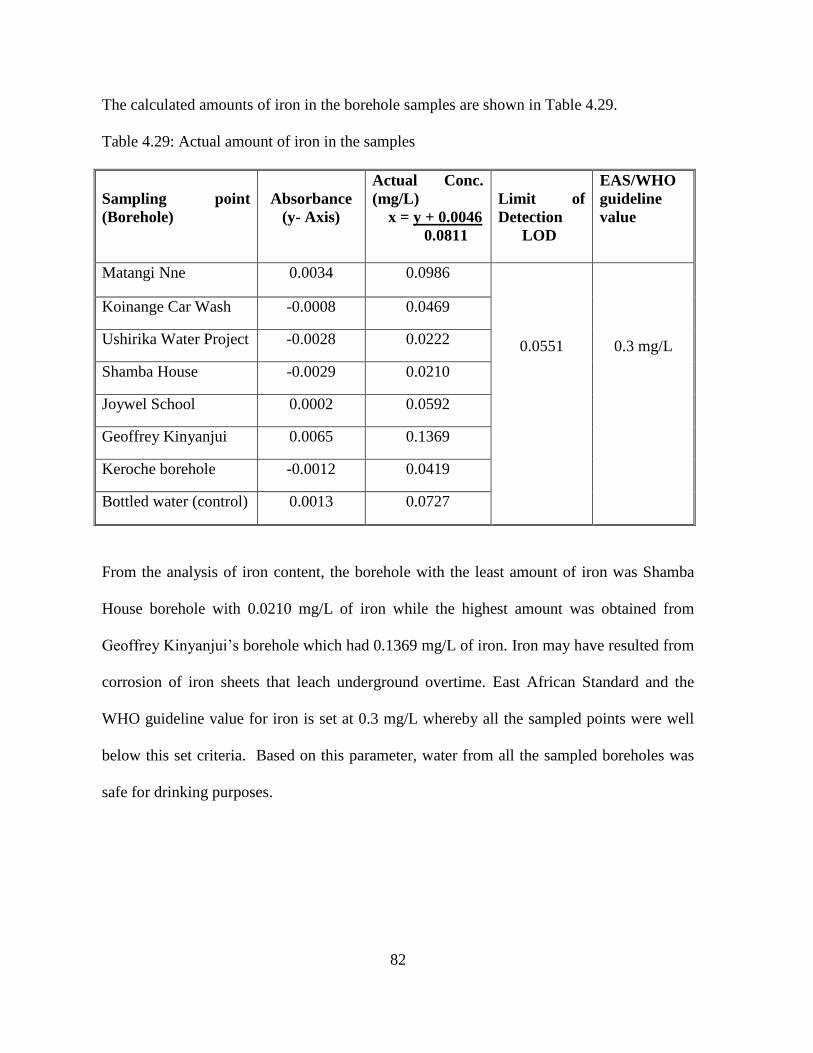
82
The calculated amounts of iron in the borehole samples are shown in Table 4.29.
Table 4.29: Actual amount of iron in the samples
Sampling point
(Borehole)
Absorbance
(y- Axis)
Actual Conc.
(mg/L)
x = y + 0.0046
0.0811
Limit of
Detection
LOD
EAS/WHO
guideline
value
Matangi Nne 0.0034 0.0986
0.0551
0.3 mg/L
Koinange Car Wash -0.0008 0.0469
Ushirika Water Project -0.0028 0.0222
Shamba House -0.0029 0.0210
Joywel School 0.0002 0.0592
Geoffrey Kinyanjui 0.0065 0.1369
Keroche borehole -0.0012 0.0419
Bottled water (control) 0.0013 0.0727
From the analysis of iron content, the borehole with the least amount of iron was Shamba
House borehole with 0.0210 mg/L of iron while the highest amount was obtained from
Geoffrey Kinyanjui’s borehole which had 0.1369 mg/L of iron. Iron may have resulted from
corrosion of iron sheets that leach underground overtime. East African Standard and the
WHO guideline value for iron is set at 0.3 mg/L whereby all the sampled points were well
below this set criteria. Based on this parameter, water from all the sampled boreholes was
safe for drinking purposes.

83
4.21 Concentration of cadmium in the samples
Cadmium content in the samples was determined at 228.8 nm.
The absorbance values versus concentration of cadmium standards are shown in Table 4.30.
Table 4.30: Absorbance vs conc. of cadmium standards
Std Conc (ppm) Absorbance
0.20 0.0703
0.30 0.1101
0.40 0.1531
0.60 0.2211
0.80 0.2969
1.20 0.4315
The calibration curve drawn from the concentration of the cadmium standards and the
absorbance values obtained (Table 4.30) is shown in Figure 4.17.
Figure 4.17: Calibration curve for cadmium standards.

84
The calculated amounts of cadmium in the borehole samples are shown in Table 4.31.
Table 4.31: Actual amount of cadmium in the samples
Sampling point
(Borehole)
Absorbance
(y- Axis)
Actual Conc.
(mg/L)
x = y - 0.0038
0.3601
Limit of
Detection
LOD
EAS/WHO
guideline
value
Matangi Nne -0.0006 -0.0122
0.2640
0.003 mg/L
Koinange Car Wash -0.0002 -0.0111
Ushirika Water Project -0.0014 -0.0144
Shamba House -0.0015 -0.0147
Joywel School -0.0016 -0.0150
Geoffrey Kinyanjui -0.0016 -0.0150
Keroche borehole -0.0019 -0.0158
Bottled water (control) -0.0014 -0.0144
From the analysis of cadmium above (Table 4.31), all the sampled boreholes had
undetectable amounts of cadmium the limit of detection being 0.2640. The East African
Standard and the WHO guideline value for cadmium is set at 0.003 mg/L whereby all the
sampled points were well below this set value. Based on this parameter, water from all the
sampled boreholes was safe for drinking purposes.

85
4.22 Concentration of lead in the samples
Lead content for each of the samples was done using atomic absorption spectrophotometer
at 283.3 nm. The absorbance values versus the concentration of the lead standards are
shown in Table 4.32.
Table 4.32: Absorbance vs conc. of lead standards
Std Conc (mg/L) Absorbance
0.20 0.0011
0.30 0.0027
0.40 0.0049
0.60 0.0071
0.80 0.0114
1.20 0.0175
2.00 0.0295
2.50 0.0377
The calibration curve drawn from the concentration of the lead standards and the absorbance
values obtained (Table 4.32) is shown in Figure 4.18.
Figure 4.18: Calibration curve of lead standards

86
The calculated amounts of lead in the borehole samples are shown in Table 4.33.
Table 4.33: Actual amount of Lead in the samples
Sampling point
(Borehole)
Absorbance
(y- Axis)
Actual Conc.
(mg/L)
x = y + 0.0018
0.0158
Limit of
Detection
LOD
EAS/WHO
guideline
value
Matangi Nne 0.0013 0.1962
0.0261
0.01 mg/L
Koinange Car Wash -0.0003 0.0949
Ushirika Water Project -0.0009 0.0570
Shamba House -0.0003 0.0949
Joywel School -0.0004 0.0886
Geoffrey Kinyanjui 0.0009 0.1709
Keroche borehole -0.0008 0.0633
Bottled water (control) -0.0019 -0.0063
From the analysis of lead above (Table 4.33), the borehole with the least amount of lead was
Ushirika Water Project borehole with 0.0570 mg/L of lead while the highest amount was
obtained from Matangi Nne borehole which had 0.1962 mg/L of lead. The high values may
have been due to the long term use of lead based paints, pesticides and improper disposal of
lead acid batteries. The East African Standard and the WHO guideline value for lead is set at
0.01 mg/L. All the samples had lead values above the WHO guideline value. Based on this
parameter, water from all the sampled boreholes was not safe for drinking purposes.

87
4.23 Concentration of chromium in the samples
The chromium determination was performed at 357.9 nm. The absorbance versus
concentration of chromium standards are shown in Table 4.34.
Table 4.34: Absorbance vs conc. of chromium calibration standards
Std Conc (ppm) Absorbance
0.20 0.0087
0.30 0.0138
0.50 0.0222
0.80 0.0360
1.00 0.0445
1.60 0.0683
2.00 0.0848
The calibration curve drawn from the chromium standards concentration and the absorbance
values obtained (Table 4.34) is shown in Figure 4.19.
Figure 4.19: Calibration curve for chromium standards.

88
The calculated amounts of chromium in the borehole samples are shown in Table 4.35.
Table 4.35: Actual amount of chromium in the samples
Sampling point
(Borehole)
Absorbance
(y- Axis)
Actual Conc.
(mg/L)
x = y – 0.0013
0.042
Limit of
Detection
LOD
EAS/WHO
guideline
value
Matangi Nne -0.0006 -0.0452
0.0554
0.05 mg/L
Koinange Car Wash 0.0007 -0.0143
Ushirika Water Project 0.0006 -0.0167
Shamba House 0.0002 -0.0262
Joywel School -0.0007 -0.0476
Geoffrey Kinyanjui 0.0006 -0.0167
Keroche borehole 0.0000 -0.0310
Bottled water(control) 0.0005 -0.0190
From the analysis of chromium, all the samples had undetectable amounts of the cation. The
limit of detection was 0.0554.
The East African Standard and the WHO guideline value for chromium is set at 0.05 mg/L.
Therefore, all of the samples had chromium amounts lower than this set value. Based on this
parameter, water from all the sampled boreholes was safe for drinking purposes

89
4.24 Concentration of zinc in the samples
The zinc content for the borehole samples was determined by the AAS. The absorbance
values obtained from the respective zinc standards are shown in Table 4.36.
Table 4.36: Absorbance vs conc. of zinc standards
Std Conc (ppm) Absorbance
0.20 0.0221
0.30 0.0298
0.40 0.0426
0.60 0.0547
0.80 0.0687
1.20 0.0966
2.00 0.1544
2.50 0.1901
The calibration curve drawn from the zinc standards concentration and the absorbance
values obtained (Table 4.36) is shown in Figure 4.20.
Figure 4.20: Calibration curve for zinc standards.

90
The calculated amounts of zinc in the borehole samples are shown in Table 4.37.
Table 4.37: Actual amount of zinc in the samples
Sampling point
(Borehole)
Absorbance
(y- Axis)
Actual Conc.
(mg/L)
x = y – 0.0103
0.0721
Limit of
Detection
LOD
EAS/WHO
guideline
value
Matangi Nne 0.0128 0.0347
0.0713
5 mg/L
Koinange Car Wash 0.0121 0.0251
Ushirika Water
Project
0.0124 0.0291
Shamba House 0.0125 0.0305
Joywel School 0.0126 0.0319
Geoffrey Kinyanjui 0.0130 0.0374
Keroche borehole 0.0120 0.0236
Bottled water(control) 0.0114 0.0153
From the analysis of zinc (Table 4.37), the borehole with the least amount was Keroche
Borehole with 0.0236 mg/L while the highest amount was obtained from Geoffrey
Kinyanjui Borehole which had 0.0374 mg/L. Long term use of galvanized roofing sheets
may have been a major contributor to the values obtained. Erosion of these sheets over a
prolonged time period may have caused zinc to leach into the underground water. The East
African Standard and the WHO guideline value for zinc is 5.0 mg/L. Thus the samples were
within the specified guideline value. Based on this parameter, water from all the sampled
boreholes was safe for drinking purposes.

91
4.25 Escherichia coli (E.coli)
The test was done by use of the multiple tube fermentation technique. None of the tested
samples showed evidence of gas production or turbidity change in the presumptive test.
However, the confirmed test was performed for each of the samples to eliminate doubt
whereby none of the samples failed. Table 4.38 shows the results recorded for the presence
of E. coli.
Table 4.38: Presence of E.coli in the samples
Sampling point (Borehole)
E.coli Presence (counts/100 mL)
Matangi Nne Nil
Koinange Car Wash Nil
Ushirika Water Project Nil
Shamba House Nil
Joywel School Nil
Geoffrey Kinyanjui Nil
Keroche borehole Nil
Bottled water (control) Nil
There was no E.coli present in any of the samples. The WHO guideline assert that there
should not be any E.coli present in drinking water. All the samples had no E.coli. Based on
this parameter, water from all the sampled boreholes was safe for drinking purposes
92
CHAPTER FIVE
CONCLUSIONS AND RECOMMENDATIONS
5.1 Conclusions
The water quality parameters such as: pH, electrical conductivity, turbidity, water color,
total dissolved solids, alkalinity, water hardness, chloride, chlorine, sulfates, nitrates,
sodium, potassium, iron, cadmium, chromium, zinc and copper levels for the sampled
boreholes were within the East African Standard and the WHO guideline values for drinking
water. There was no E.coli present in the tested boreholes. The fluoride concentrations in all
the sampled boreholes except Keroche borehole (1.2 mg/L) were higher than the East
African Standard and the WHO guideline value (1.5 mg/L). The lead amount in all the
sampled boreholes were higher than the East African Standard and the WHO guideline
value (0.01 mg/L). Suspended solids were present in all the sampled boreholes despite the
fact that, East African Standard and the WHO guideline states that suspended solids should
not be present.
The high fluoride levels in the water samples may have been due to the disintegration of the
naturally occurring fluoride minerals (fluorspar, fluoroapatite and cryolite) into the
underground water. Mining and salinity buildup due to irrigation may also have made a
contribution. The volcanic and alkaline soils found in this area are quite permeable and
contain high amounts of sodium, fluoroapatite, fluorspar, zeolite, and ammonia among other
minerals (Becht et al., 2005). However, in the case of Keroche borehole where fluoride

93
concentration was low, may have been due to some control measure that may have been
installed by the industry in the area.
The high lead concentrations for the boreholes may have been as a result of large scale use
of lead based pesticides from large scale horticultural farming. Improper disposal of lead
acid batteries over a prolonged time period may also have caused lead to leach into the
underground water. The suspended solids may have been as a result of algae and sediments
or silt present in the underground water. The results obtained from the assessment revealed
that none of the sampled borehole water was of good quality for drinking purposes based on
the East African Standard and the WHO guidelines for drinking water. Therefore,
appropriate treatment methods are required for each of the boreholes to make the water
suitable for drinking.
5.2 Recommendations
Therefore from this study, it is recommended that:
1. Water purification methods such as boiling, use of iodine solution, tablets or
crystals; use of chlorine drops, water filter, use of ultraviolet light, distillation and
other adsorption techniques be used to make water safe drinking.
2. Biopesticides and bioherbicides be used in floricultural farming to reduce the
amount of lead and other heavy metals that may leach into the underground water.
3. Frequent water quality testing be conducted on the borehole waters.
4. Testing be conducted on other boreholes within the area that were not covered
during the study.

94
References
Abbaspour, N. H. R and Kelishad, R. (2014). Review of Iron and its importance for human
health. J Res Med Sci, 19:74
Baba A. and Tayfur G. (2011). Groundwater contamination and its effect on health in Turkey.
J Environ Monit Assess, 183:77–94.
Beaty R. D. and Kerber J. D. (1993). Concepts, instrumentation and techniques in atomic
absorption spectrophotometry, 2nd Edition, Perkin - Elmer Corporation, Norwalk, USA
pp17 - 22.
Becht R., Odada E.O. and Higgins S. (2005). Lake Naivasha: Experience and lessons learned
Brief. University of Twente, Eschede: pp279 - 281.
Bratovcic A. and Odobasic A. (2011). Determination of Fluoride and Chloride Contents in
Drinking Water by Ion Selective Electrode. University of Tuzla Press, Herzegovina:
pp109 - 114.
Compendium for Watershed Monitoring and assessment (2010). The clean water team
guidance for watershed monitoring and assessment state Water Resources Control Board.
SOP 3.1.0.
De Jong T. (2011). Water abstraction survey in Lake Naivasha basin, Kenya. Internship
Report.
Driscoll, D.G. Carter, J.M. Williamson, J.E. and Putnam L.D.(2002). Hydrology of Black Hills
area, South Dakota. Water-Resources Investigations Report 02-4094.
EPA. (2001). Parameters of Water quality, Interpretation and standards, ISBN 1-84096-015-3
Wexford, Ireland.

95
EPA. (2003). Health effects support Document for Manganese, EPA 822-R-03-003
Washington DC 20460, USA.
EPA. (2010). Method 1103.1 Escherichia Coli (E.coli) in water by Membrane Filtration Using
membrane-Thermotolerant Escherichia coli Agar ( mTEC ). Publication No.EPA-821-R-
10-002 Washington, DC. USA.
Gaciri, S.J. and Davies, T.C. (1993). The occurrence and geochemistry of fluoride some
natural waters of Kenya in, J HYDROL, 143: 395–412.
Hari, B. B., Suresh, P. Ramesh, A., Swana K. L. and Swamy, A. V. V.(2016). Determination
of fluoride concentration in ground water of Yerraguntla and Jammalamadugu areas of
YsrKadapa district of Andrapradesh (INDIA),Rayasan J.Chem 9 : 222–226.
Hatva, T.(1989). Iron and manganese in groundwater in Finland: occurance in glacifluvial
aquifers and removal by biofiltration Report, National Board of Waters and Environment,
Helsinki. ,pp 6.
ILMB , BC (1998). Guide to Interpreting Ambient Water and Effluent Variables.British
Columbia.
ISO 3025 Part 16 (1984). Methods of sampling and testing (physical and chemical) for water
and wastewater, part 16: Filtrable residue (Total dissolved solids) First edition.Name of
standard : Bureau of India standard.
ISO 3025 Part 24 (1984). Methods of sampling and testing (physical and chemical) for water
and wastewater, part 24: sulfates. First edition.Name of standard : Bureau of India
standard.
Jadhav, S.D., Sawant, R.S., Godghate, S.R., Patil, S.R.and Patil, R.S. (2012). Assessment of
Ground Water Quality of Ajara. Rasayan J Chem, 5: 246–249.
96
Jaishankar, M., Tenzin, T., Naresh, A., Blessy, B. M. and Krishnamurthy, N. B. (2014).
Toxicity, mechanism and health effects of some heavy metals. Intediscip toxicol. 7: 60-72
Kalanithi, M., Dhanapackiam, S., Tamilarasi, K., Kanagavalli, C. and Amutha, S. (2015).
Estimation of fluoride ion in ground water of some areas of Theni district by
spectrophotometric method. Int J. Environ. Sci, 6: 252-259
Kelly W. R., Panno S. V. and Hackley K. (2012). The sources, distribution and trends of
Chloride in the water of Illinois. University of Illinois, Champaign, Illinois: pp1-4
Kenya National Water Development Report, (2005). 2nd UN World Water Development
Report. No. UN-WATER/WWAP/2006/12
Manjare, S.A., Vhanalakar, S.A., and Muley, D. V. (2010). Analysis of water quality using
physico-chemical parameters tamdalge tank in Kolhapur District , Maharashtra .
IJABR, 1: 115–119.
Martin, S. and Grisworld, W. (2009). Health Effects of Heavy Metals,Environmental Science
and Technology Briefs for Citizens, Afri.J. Environ. Sci. Technol, 15:1 - 6
Minesota Polution Control Agency.(2008). Turbidity, policy on Groundwater Resources
Development and Management Report.
Ministry of Water and Irrigation.(2016). The National Policy on Groundwater Resources
Development and Management Report.
Mumma, A., Lane, M., Kairu, E., Tuinhof, A. and Hirji, R.(2011). Kenya groundwater
governance. Case study Report.
Mutonga, M.(2014). Baringo-Bogoria geothermal area in Kenya Paper Title, Fluoride ions in
groundwater case study. Proceedings of the 5th African Rift Geothermal Conference,
Arusha. pp.29–31.

97
Nazir, R., Khan, M., Masab, M., Rehman, H.U., Rafu, N.U., Shahab, S., Ameer, N., Sajed,
M., Ullah, M., Rafeeq, M., and Shaheen, Z.(2015). Accumulation of Heavy Metals (Ni,
Cu, Cd, Cr, Pb, Zn, Fe) in the soil, water and plants and analysis of physico-chemical
parameters of soil and water Collected from Tanda Dam kohat. Int. J. Pharm. Sci.Res.
7: 89-97
New Hampshire Water Well Board. (2010). Interpreting the Presence of Coliform Bacteria in
Drinking Water.Publication No. WD-DWGB-4-1
Ndungu, J., Augustijn, D.C.M., Hulscher, S.J.M.H. Fulanda, B., Kitaka, N. and Mathooko,
J.M.(2015). A multivariate analysis of water quality in Lake Naivasha, Kenya. Mar.
Freshwater Res. 66: 1-11
Nikanorov, A.M. and Brazhnikova, L. V B.(2009). Types and properties of water - Vol II.
Water Chemical composition of rivers, lakes and wetlands.Encyclopaedia of life support
systems(EOLSS).
Norman, G.,and Parker, S. (2011). Topic brief: Business model for delegated management of
local water services: experience from Naivasha, Water and Sanitation for Urban Poor
press. London: pp.1–13.
Ochieng M. A, and Kyende M. E. (2013). The influence of residents’ awareness and
demographic characteristics on their use of defluoridated water in Nakuru town, Kenya.
IJAR, 1 : 400–408.
Omar, A. F. and MatJafri, M. Z. (2009). Turbidimeter design and analysis: A review on
optical fiber sensors for the measurement of water turbidity, School of Physics,
University of Science Malaysia pp 8312
Rajković, M.B. and Novaković, I.D. (2007). Determination of fluoride content in drinking

98
water and tea infusions using fluoride ion selective electrode. J AGRI SCI, 52 : 155–168.
Rombo, G.O. and Muoki, M. (2012). Rickets in rift valley: A review of manifestation and
links with flouride contents of drinking water supplies and food. GARJBB, 1 : 19–25.
Sanda, M.F. Macocian, E.V. Toderas, A.M. and Caraban, A.(2012). Basic theory for UV/Vis
spectroscophotometric measurements (Internal report), University of Oradea, Romania.
pp 1-16.
Servais, P. Baudart, J. and Rompre, A. (2002). Detection and enumeration of coliforms in
drinking water : current methods and emerging approaches. J. Microbial. Methods 49:
31–54.
Shafqat, A.U.P., Firdaus, T. and Yadav, S. (2012). Analysis of fluoride in the water of bore-
wells of Azamgarh city. Int. J. Int sci. Inn. Tech., 1 : 21–23.
Shakhashiri B.(2011). General Chemistry: Chemical of the week - Water.www.scifun.org.
Tchounwou, P.B.,Yedjou C. G.,Patlolla A.K. and Sutton D.J.(2012). Heavy metal toxicity and
the environment. Jackson State University,Jackson: pp 133-164.
The Kenya Population and Housing Census. (2009). , IC. pp 174
UNDP. (2011) Small-Scale Water Providers in Kenya: Pioneers or Predators New York USA.
UNEP/ WHO.(1996). Water quality monitoring - A practical guide to the design and
implementation of Freshwater Quality studie and Monitoring Programmes. Chapter -
Microbiological Analyses.
UNESCO.(2003). World Water Resources at the Beginning of the Twenty-First Century
Cambridge University Press. Cambridge,UK.
World Health Organization (WHO). (2003). Chloride in Drinking-water Quality Backgound
document for development of WHO Guidelines for drinking - water Quality.

99
WHO/SDE/WSH/03.04/03.
World Health Organization (WHO). (2006). Guidelines for Drinking-water Quality First
addendum to 3rd Edition. WHO, Geneva.
World Health Organization (WHO). (2011). Guidelines for Drinking-water Quality 4TH
Edition. WHO, Geneva.
Wuana, R.A. and Okieimen, F.E., (2011). Heavy Metals in Contaminated Soils: A Review of
Sources, Chemistry, Risks and Best Available Strategies for Remediation. ISRN Ecology,
2011: 1-20.
INTERNET REFERENCES
http://www.de-fluoride.net/fluorosis.htmL 14/06/2018 11.51 am.
http://www1.lehigh.edu/news/patented-nanotechnology-clean-drinking-water 19/06/2018
09.29 am.
https://www.researchgate.net/figure/A-dual-beam-UV-vis-spectrophotometer-
8_fig20_314081363 20/06/2018 08.13 pm.
https://www.shimadzu.com/an/elemental/aa/aa6200-3.htmL, 20/06/2018 10.43 pm.
https://www.fda.gov/food/foodscienceresearch/laboratorymethods/ucm064948.htm, 29/06/2018
10.23am.
https://microbeonline.com/probable-number-mpn-test-principle-procedure-results/
29/08/2018 10.55am.
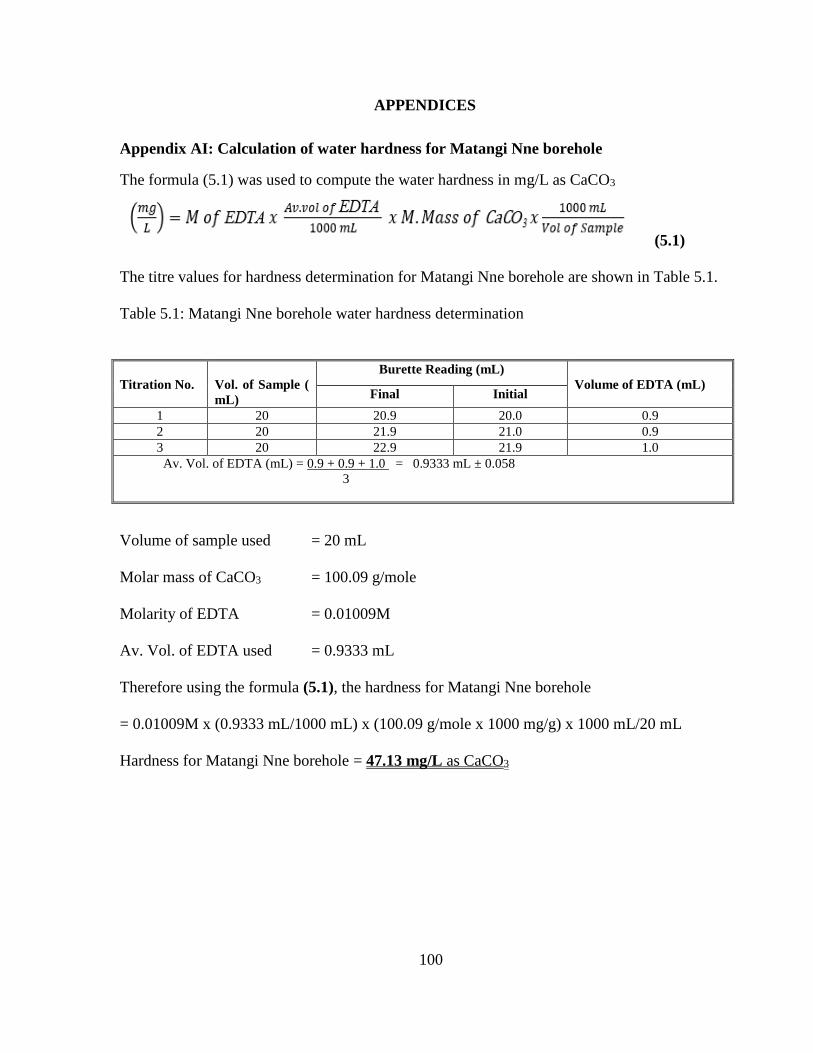
100
APPENDICES
Appendix AI: Calculation of water hardness for Matangi Nne borehole
The formula (5.1) was used to compute the water hardness in mg/L as CaCO3
(5.1)
The titre values for hardness determination for Matangi Nne borehole are shown in Table 5.1.
Table 5.1: Matangi Nne borehole water hardness determination
Titration No.
Vol. of Sample (
mL)
Burette Reading (mL)
Volume of EDTA (mL) Final Initial
1 20 20.9 20.0 0.9
2 20 21.9 21.0 0.9
3 20 22.9 21.9 1.0
Av. Vol. of EDTA (mL) = 0.9 + 0.9 + 1.0 = 0.9333 mL ± 0.058
3
Volume of sample used = 20 mL
Molar mass of CaCO3 = 100.09 g/mole
Molarity of EDTA = 0.01009M
Av. Vol. of EDTA used = 0.9333 mL
Therefore using the formula (5.1), the hardness for Matangi Nne borehole
= 0.01009M x (0.9333 mL/1000 mL) x (100.09 g/mole x 1000 mg/g) x 1000 mL/20 mL
Hardness for Matangi Nne borehole = 47.13 mg/L as CaCO3

101
Appendix AII: Calculation of water hardness for Shamba House borehole
The titre values for hardness determination for Shamba house borehole are shown in Table 5.2.
Table 5.2: Shamba House borehole water hardness determination
Titration No.
Vol. of Sample ( mL)
Burette Reading (mL)
Volume of EDTA (mL) Final Initial
1 20 2.6 2.0 0.6
2 20 3.2 2.6 0.6
3 20 3.9 3.2 0.7
Av. Vol. of EDTA (mL) = 0.6 + 0.6 + 0.7 = 0.6333 mL ± 0.058
3
Av. Vol. of EDTA used = 0.6333 mL
Therefore using the formula (5.1), the hardness for Shamba House borehole
= 0.01009M x (0.6333 mL/1000 mL) x (100.09 g/mole x 1000 mg/g) x 1000 mL/20 mL
Hardness for Shamba House borehole = 31.97 mg/L as CaCO3
Appendix AIII: Calculation of water hardness for Ushirika Water Project borehole
The titre values for hardness determination for Ushirika water project borehole are shown in
Table 5.3.
Table 5.3: Ushirika water project borehole water hardness determination
Titration No.
Vol. of Sample ( mL)
Burette Reading (mL)
Volume of EDTA (mL) Final Initial
1 20 17.9 17.0 0.9
2 20 18.8 18.0 0.8
3 20 19.7 18.8 0.9
Av. Vol. of EDTA (mL) = 0.9 + 0.8 + 0.9 = 0.8667 mL ± 0.058
3
Av. Vol. of EDTA used = 0.8667 mL
Therefore using the formula (5.1), the hardness for Ushirika Water Project borehole
= 0.01009M x (0.8667 mL/1000 mL) x (100.09 g/mole x 1000 mg/g) x 1000 mL/20 mL
Hardness for Ushirika Water Project borehole = 43.76 mg/L as CaCO3
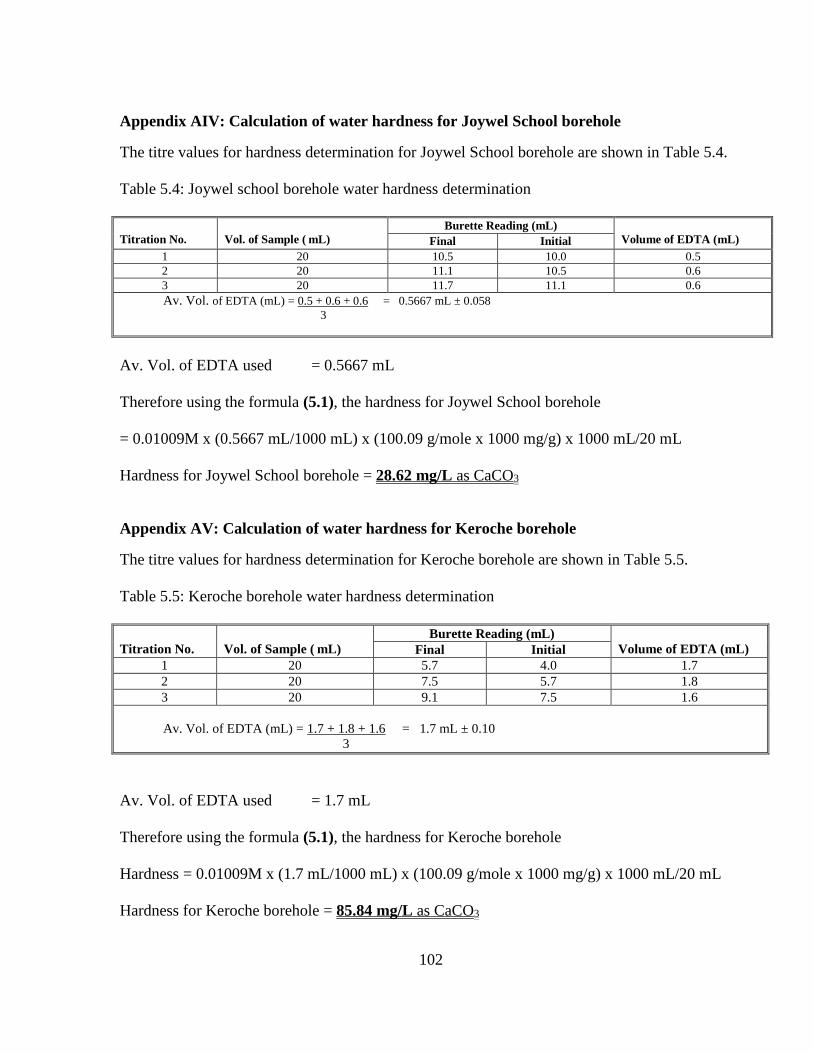
102
Appendix AIV: Calculation of water hardness for Joywel School borehole
The titre values for hardness determination for Joywel School borehole are shown in Table 5.4.
Table 5.4: Joywel school borehole water hardness determination
Titration No.
Vol. of Sample ( mL)
Burette Reading (mL)
Volume of EDTA (mL) Final Initial
1 20 10.5 10.0 0.5
2 20 11.1 10.5 0.6
3 20 11.7 11.1 0.6
Av. Vol. of EDTA (mL) = 0.5 + 0.6 + 0.6 = 0.5667 mL ± 0.058
3
Av. Vol. of EDTA used = 0.5667 mL
Therefore using the formula (5.1), the hardness for Joywel School borehole
= 0.01009M x (0.5667 mL/1000 mL) x (100.09 g/mole x 1000 mg/g) x 1000 mL/20 mL
Hardness for Joywel School borehole = 28.62 mg/L as CaCO3
Appendix AV: Calculation of water hardness for Keroche borehole
The titre values for hardness determination for Keroche borehole are shown in Table 5.5.
Table 5.5: Keroche borehole water hardness determination
Titration No.
Vol. of Sample ( mL)
Burette Reading (mL)
Volume of EDTA (mL) Final Initial
1 20 5.7 4.0 1.7
2 20 7.5 5.7 1.8
3 20 9.1 7.5 1.6
Av. Vol. of EDTA (mL) = 1.7 + 1.8 + 1.6 = 1.7 mL ± 0.10
3
Av. Vol. of EDTA used = 1.7 mL
Therefore using the formula (5.1), the hardness for Keroche borehole
Hardness = 0.01009M x (1.7 mL/1000 mL) x (100.09 g/mole x 1000 mg/g) x 1000 mL/20 mL
Hardness for Keroche borehole = 85.84 mg/L as CaCO3

103
Appendix AVI: Calculation of water hardness for Geoffrey Kinyanjui borehole
The titre values for hardness determination for Geoffrey Kinyanjui borehole are shown in Table
5.6.
Table 5.6: Geoffrey Kinyanjui borehole water hardness determination
Titration No.
Vol. of Sample ( mL)
Burette Reading (mL)
Volume of EDTA (mL) Final Initial
1 20 12.6 12.0 0.6
2 20 13.3 12.6 0.7
3 20 13.9 13.3 0.6
Av. Vol. of EDTA (mL) = 0.6 + 0.7 + 0.6 = 0.6333 mL ± 0.058
3
Av. Vol. of EDTA used = 0.6333 mL
Therefore using the formula (5.1), the hardness for Geoffrey Kinyanjui borehole
= 0.01009M x (0.6333 mL/1000 mL) x (100.09 g/mole x 1000 mg/g) x 1000 mL/20 mL
Hardness for Geoffrey Kinyanjui borehole = 31.97 mg/L as CaCO3
Appendix AVII: Calculation of water hardness for Koinange Car wash borehole
The titre values for hardness determination for Koinange Car Wash are shown in Table 5.2.
Table 5.7: Koinange Car Wash borehole water hardness determination
Titration No.
Vol. of Sample ( mL)
Burette Reading (mL)
Volume of EDTA (mL) Final Initial
1 20 14.8 14.0 0.8
2 20 15.7 14.8 0.9
3 20 16.6 15.7 0.9
Av. Vol. of EDTA (mL) = 0.8 + 0.9 + 0.9 = 0.8667 mL ± 0.058
3
Av. Vol. of EDTA used = 0.8667 mL
Therefore using the formula (5.1), the hardness for Koinange car wash borehole
= 0.01009M x (0.8667 mL/1000 mL) x (100.09 g/mole x 1000 mg/g) x 1000 mL/20 mL
Hardness for Koinange car wash borehole = 43.76 mg/L as CaCO3

104
Appendix AVIII: Calculation of water hardness for Bottled water (control sample)
The titre values for hardness determination for Bottled water (control) are shown in Table 5.8.
Table 5.8: Bottled water hardness determination
Titration No.
Vol. of Sample ( mL)
Burette Reading (mL)
Volume of EDTA (mL) Final Initial
1 20 1.55 1.50 0.05
2 20 2.55 2.50 0.05
3 20 2.65 2.60 0.05
Av. Vol. of EDTA (mL) = 0.05 + 0.05 + 0.05 = 0.05 mL ± 0.00
3
Av. Vol. of EDTA used = 0.0.05 mL
Therefore using the formula (5.1), the hardness for Bottled water (control sample)
= 0.01009M x (0.05 mL/1000 mL) x (100.09 g/mole x 1000 mg/g) x 1000 mL/20 mL
Hardness for Bottled water (control sample) = 2.52 mg/L as CaCO3

105
Appendix BI: Calculations for the alkalinity of Matangi Nne borehole
The formula (5.2) was used to calculate the Phenolphthalein/Total (P/T) alkalinity of the water
samples:
(5.2)
Phenolphthalein Alkalinity
The titration for P.A determination for Matangi Nne borehole is shown in Table 5.9.
Table 5.9: Matangi Nne borehole phenolphthalein alkalinity determination
Titration No.
Vol. of Sample (
mL)
Burette Reading (mL)
Volume of H2SO4 (mL) Final Initial
1 20 0.8 0.0 0.8
2 20 10.5 9.9 0.6
3 20 20.6 20.0 0.6
Av. Vol. of H2SO4 (mL) = 0.8 + 0.6 + 0.6 = 0.6667 mL ± 0.115
3
Molar mass of Na2CO3 = 105.987
Volume of borehole water taken = 20 mL
Concentration of H2SO4 = 0.0103743M
Av. Vol. of H2SO4 used = 0.6667 mL
Therefore using the formula (5.2), the phenolphthalein alkalinity for Matangi Nne borehole:
= 0.0103743M x (0.06667 mL/1000 mL) x (105.987 g/mole x 1000 mg/g) x (1000 mL/20 mL)
Phenolphthalein Alkalinity for Matangi Nne borehole = 36.65 mg/L as Na2CO3
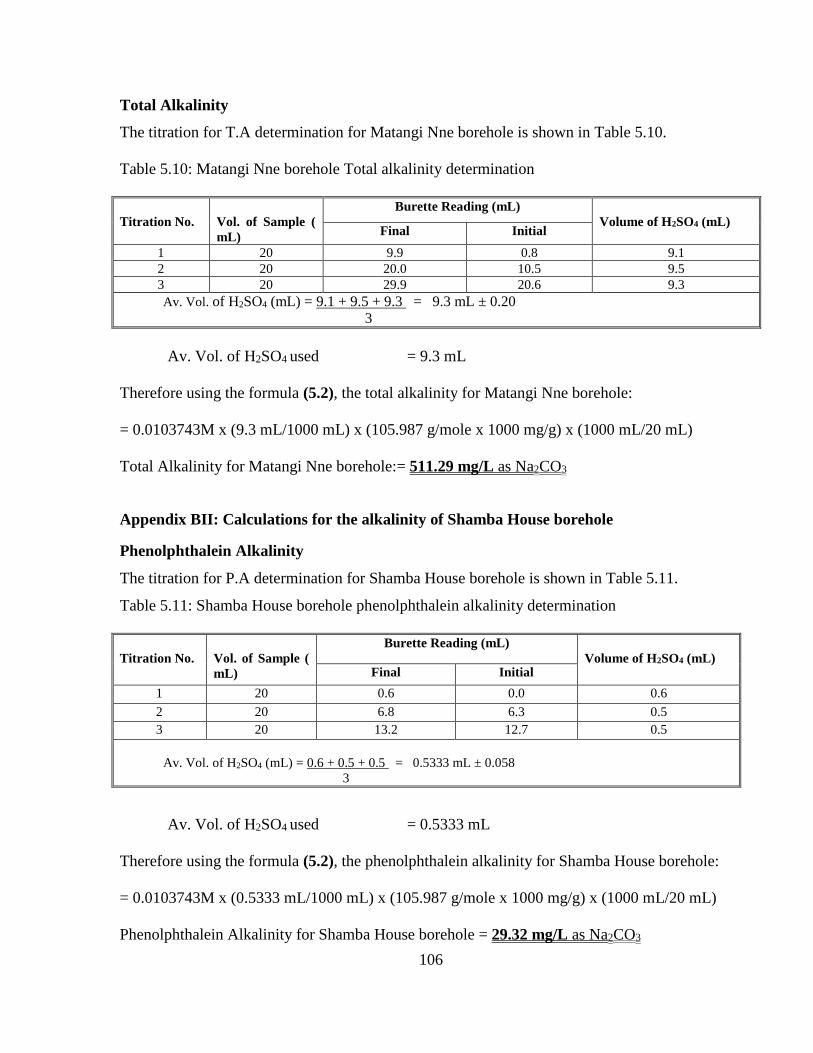
106
Total Alkalinity
The titration for T.A determination for Matangi Nne borehole is shown in Table 5.10.
Table 5.10: Matangi Nne borehole Total alkalinity determination
Titration No.
Vol. of Sample (
mL)
Burette Reading (mL)
Volume of H2SO4 (mL) Final Initial
1 20 9.9 0.8 9.1
2 20 20.0 10.5 9.5
3 20 29.9 20.6 9.3
Av. Vol. of H2SO4 (mL) = 9.1 + 9.5 + 9.3 = 9.3 mL ± 0.20
3
Av. Vol. of H2SO4 used = 9.3 mL
Therefore using the formula (5.2), the total alkalinity for Matangi Nne borehole:
= 0.0103743M x (9.3 mL/1000 mL) x (105.987 g/mole x 1000 mg/g) x (1000 mL/20 mL)
Total Alkalinity for Matangi Nne borehole:= 511.29 mg/L as Na2CO3
Appendix BII: Calculations for the alkalinity of Shamba House borehole
Phenolphthalein Alkalinity
The titration for P.A determination for Shamba House borehole is shown in Table 5.11.
Table 5.11: Shamba House borehole phenolphthalein alkalinity determination
Titration No.
Vol. of Sample (
mL)
Burette Reading (mL)
Volume of H2SO4 (mL) Final Initial
1 20 0.6 0.0 0.6
2 20 6.8 6.3 0.5
3 20 13.2 12.7 0.5
Av. Vol. of H2SO4 (mL) = 0.6 + 0.5 + 0.5 = 0.5333 mL ± 0.058
3
Av. Vol. of H2SO4 used = 0.5333 mL
Therefore using the formula (5.2), the phenolphthalein alkalinity for Shamba House borehole:
= 0.0103743M x (0.5333 mL/1000 mL) x (105.987 g/mole x 1000 mg/g) x (1000 mL/20 mL)
Phenolphthalein Alkalinity for Shamba House borehole = 29.32 mg/L as Na2CO3
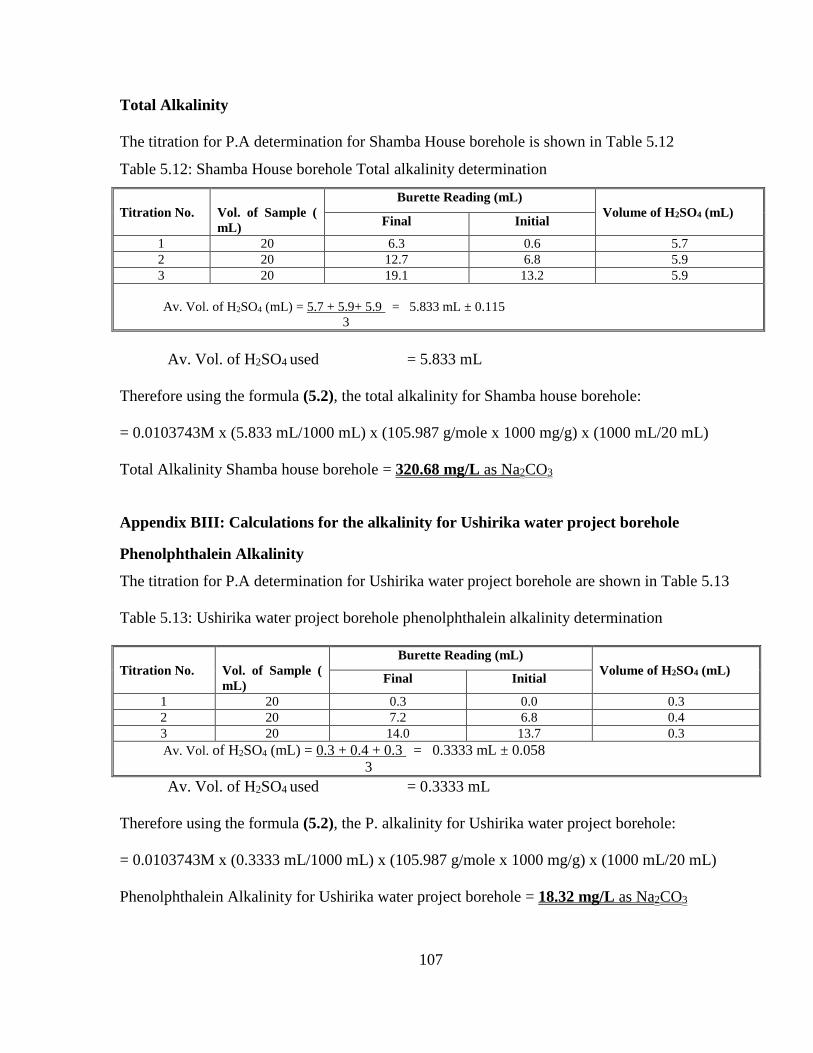
107
Total Alkalinity
The titration for P.A determination for Shamba House borehole is shown in Table 5.12
Table 5.12: Shamba House borehole Total alkalinity determination
Titration No.
Vol. of Sample (
mL)
Burette Reading (mL)
Volume of H2SO4 (mL) Final Initial
1 20 6.3 0.6 5.7
2 20 12.7 6.8 5.9
3 20 19.1 13.2 5.9
Av. Vol. of H2SO4 (mL) = 5.7 + 5.9+ 5.9 = 5.833 mL ± 0.115
3
Av. Vol. of H2SO4 used = 5.833 mL
Therefore using the formula (5.2), the total alkalinity for Shamba house borehole:
= 0.0103743M x (5.833 mL/1000 mL) x (105.987 g/mole x 1000 mg/g) x (1000 mL/20 mL)
Total Alkalinity Shamba house borehole = 320.68 mg/L as Na2CO3
Appendix BIII: Calculations for the alkalinity for Ushirika water project borehole
Phenolphthalein Alkalinity
The titration for P.A determination for Ushirika water project borehole are shown in Table 5.13
Table 5.13: Ushirika water project borehole phenolphthalein alkalinity determination
Titration No.
Vol. of Sample (
mL)
Burette Reading (mL)
Volume of H2SO4 (mL) Final Initial
1 20 0.3 0.0 0.3
2 20 7.2 6.8 0.4
3 20 14.0 13.7 0.3
Av. Vol. of H2SO4 (mL) = 0.3 + 0.4 + 0.3 = 0.3333 mL ± 0.058
3
Av. Vol. of H2SO4 used = 0.3333 mL
Therefore using the formula (5.2), the P. alkalinity for Ushirika water project borehole:
= 0.0103743M x (0.3333 mL/1000 mL) x (105.987 g/mole x 1000 mg/g) x (1000 mL/20 mL)
Phenolphthalein Alkalinity for Ushirika water project borehole = 18.32 mg/L as Na2CO3
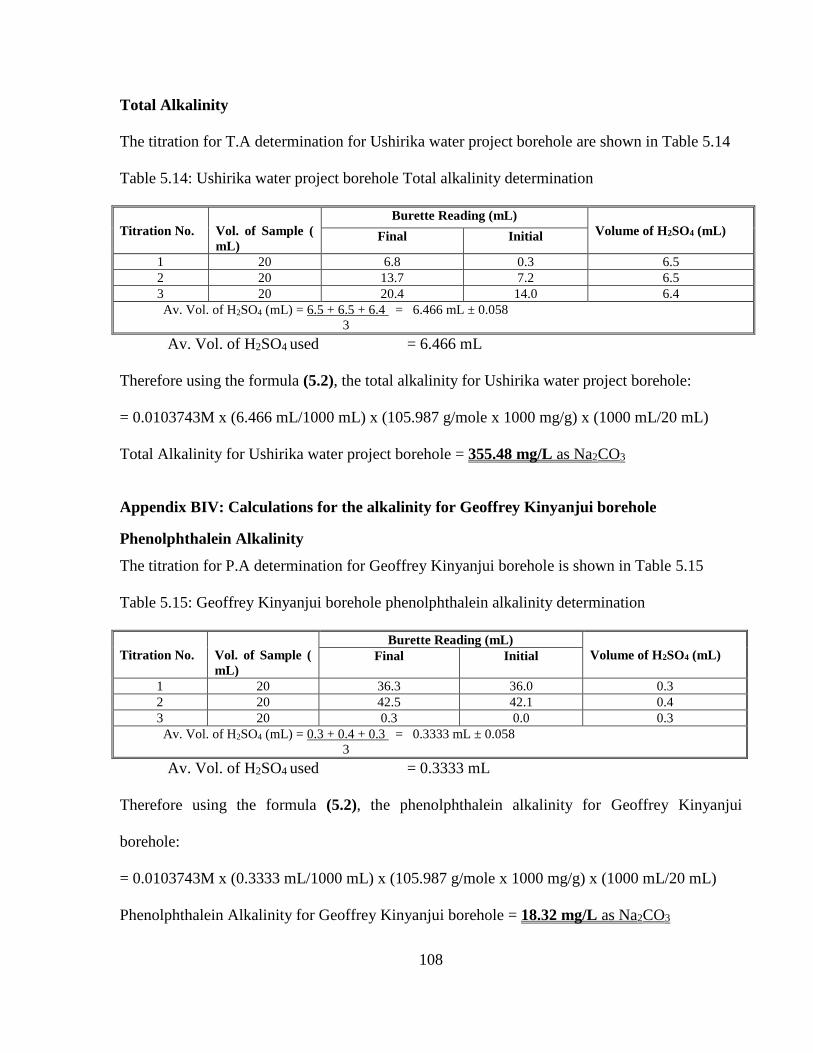
108
Total Alkalinity
The titration for T.A determination for Ushirika water project borehole are shown in Table 5.14
Table 5.14: Ushirika water project borehole Total alkalinity determination
Titration No.
Vol. of Sample (
mL)
Burette Reading (mL)
Volume of H2SO4 (mL) Final Initial
1 20 6.8 0.3 6.5
2 20 13.7 7.2 6.5
3 20 20.4 14.0 6.4
Av. Vol. of H2SO4 (mL) = 6.5 + 6.5 + 6.4 = 6.466 mL ± 0.058
3
Av. Vol. of H2SO4 used = 6.466 mL
Therefore using the formula (5.2), the total alkalinity for Ushirika water project borehole:
= 0.0103743M x (6.466 mL/1000 mL) x (105.987 g/mole x 1000 mg/g) x (1000 mL/20 mL)
Total Alkalinity for Ushirika water project borehole = 355.48 mg/L as Na2CO3
Appendix BIV: Calculations for the alkalinity for Geoffrey Kinyanjui borehole
Phenolphthalein Alkalinity
The titration for P.A determination for Geoffrey Kinyanjui borehole is shown in Table 5.15
Table 5.15: Geoffrey Kinyanjui borehole phenolphthalein alkalinity determination
Titration No.
Vol. of Sample (
mL)
Burette Reading (mL)
Volume of H2SO4 (mL) Final Initial
1 20 36.3 36.0 0.3
2 20 42.5 42.1 0.4
3 20 0.3 0.0 0.3
Av. Vol. of H2SO4 (mL) = 0.3 + 0.4 + 0.3 = 0.3333 mL ± 0.058
3
Av. Vol. of H2SO4 used = 0.3333 mL
Therefore using the formula (5.2), the phenolphthalein alkalinity for Geoffrey Kinyanjui
borehole:
= 0.0103743M x (0.3333 mL/1000 mL) x (105.987 g/mole x 1000 mg/g) x (1000 mL/20 mL)
Phenolphthalein Alkalinity for Geoffrey Kinyanjui borehole = 18.32 mg/L as Na2CO3

109
Total Alkalinity
The titration for T.A determination for Geoffrey Kinyanjui borehole is shown in Table 5.16
Table 5.16: Geoffrey Kinyanjui borehole total alkalinity determination
Titration No.
Vol. of Sample (
mL)
Burette Reading (mL)
Volume of H2SO4 (mL) Final Initial
1 20 42.1 36.3 5.8
2 20 48.2 42.5 5.7
3 20 6.0 0.3 5.7
Av. Vol. of H2SO4 (mL) = 5.8 + 5.7 + 5.7 = 5.7333 mL ± 0.058
3
Av. Vol. of H2SO4 used = 5.7333 mL
Therefore using the formula (5.2), the total alkalinity for Geoffrey Kinyanjui borehole:
= 0.0103743M x (5.7333 mL/1000 mL) x (105.987 g/mole x 1000 mg/g) x (1000 mL/20 mL)
Total Alkalinity for Geoffrey Kinyanjui = 315.20 mg/L as Na2CO3
Appendix BV: Calculations for the alkalinity for Koinange car wash borehole
Phenolphthalein alkalinity
The titration for P.A determination for Koinange Car Wash borehole is shown in Table 5.17
Table 5.17: Koinange Car Wash borehole phenolphthalein alkalinity determination
Titration No.
Vol. of Sample (
mL)
Burette Reading (mL)
Volume of H2SO4 (mL) Final Initial
1 20 14.5 14.0 0.5
2 20 21.7 21.0 0.7
3 20 29.0 28.3 0.7
Av. Vol. of H2SO4 (mL) = 0.5 + 0.7 + 0.7 = 0.6333 mL ± 0.115
3
Av. Vol. of H2SO4 used = 0.6333 mL
Therefore using the formula (5.2), the P. alkalinity for Koinange car wash borehole:
= 0.0103743M x (0.6333 mL/1000 mL) x (105.987 g/mole x 1000 mg/g) x (1000 mL/20 mL)
Phenolphthalein Alkalinity for Koinange car wash borehole = 34.82 mg/L as Na2CO3

110
Total Alkalinity
The titration for T.A determination for Koinange Car Wash borehole is shown in Table 5.18
Table 5.18: Koinange Car Wash borehole total alkalinity determination
Titration No.
Vol. of Sample (
mL)
Burette Reading (mL)
Volume of H2SO4 (mL) Final Initial
1 20 21.0 14.5 6.5
2 20 28.3 21.7 6.6
3 20 35.5 29.0 6.5
Av. Vol. of H2SO4 (mL) = 6.5 + 6.6 + 6.5 = 6.533 mL ± 0.058
3
Av. Vol. of H2SO4 used = 6.533 mL
Therefore using the formula (5.2), the total alkalinity for Koinange car wash borehole:
= 0.0103743M x (6.533 mL/1000 mL) x (105.987 g/mole x 1000 mg/g) x (1000 mL/20 mL)
Total Alkalinity for Koinange car wash borehole = 359.17 mg/L as Na2CO3
Appendix BVI: Calculations for the alkalinity for Keroche borehole
Phenolphthalein Alkalinity
The titration for P.A determination for Keroche borehole is shown in Table 5.19.
Table 5.19: Keroche borehole phenolphthalein alkalinity determination
Titration No.
Vol. of Sample (
mL)
Burette Reading (mL)
Volume of H2SO4 (mL) Final Initial
1 20 26.7 26.5 0.2
2 20 30.1 29.8 0.3
3 20 33.4 33.1 0.3
Av. Vol. of H2SO4 (mL) = 0.2 + 0.3 + 0.3 = 0.2667 mL ± 0.058l
3
Av. Vol. of H2SO4 used = 0.2667 mL
Therefore using the formula (5.2), the phenolphthalein alkalinity for Keroche borehole:
= 0.0103743M x (0.2667 mL/1000 mL) x (105.987 g/mole x 1000 mg/g) x (1000 mL/20 mL)
Phenolphthalein Alkalinity for Keroche borehole = 14.66 mg/L as Na2CO3
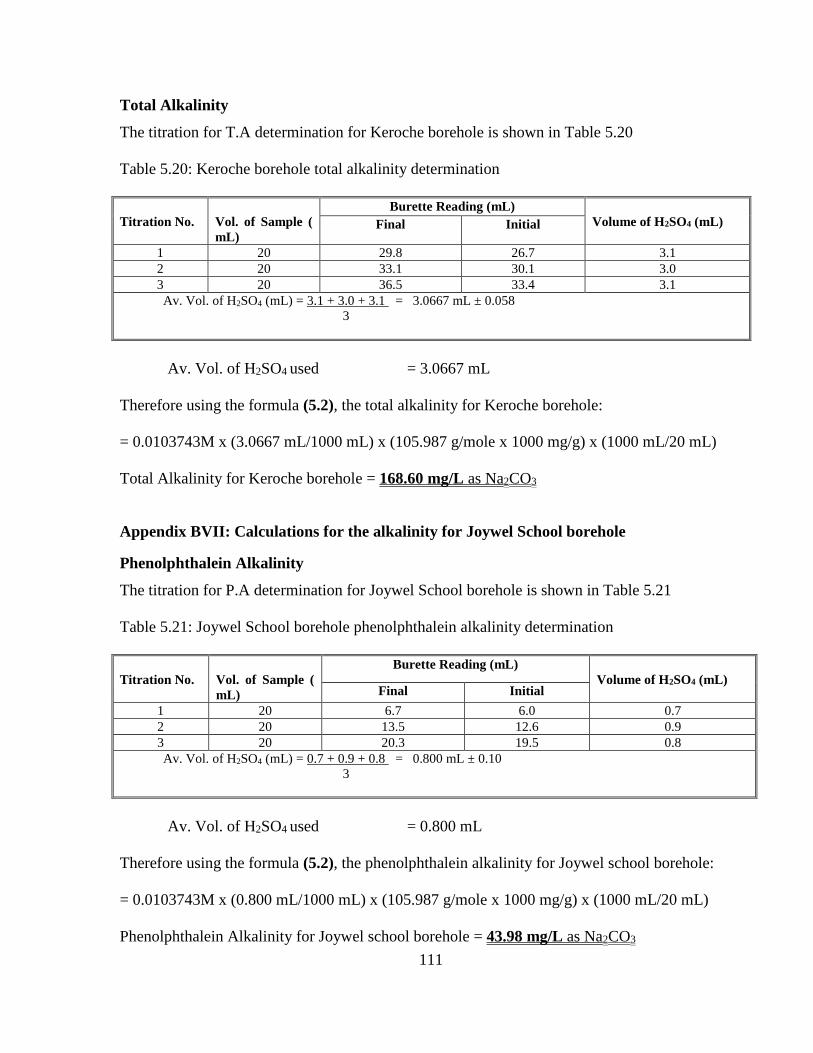
111
Total Alkalinity
The titration for T.A determination for Keroche borehole is shown in Table 5.20
Table 5.20: Keroche borehole total alkalinity determination
Titration No.
Vol. of Sample (
mL)
Burette Reading (mL)
Volume of H2SO4 (mL) Final Initial
1 20 29.8 26.7 3.1
2 20 33.1 30.1 3.0
3 20 36.5 33.4 3.1
Av. Vol. of H2SO4 (mL) = 3.1 + 3.0 + 3.1 = 3.0667 mL ± 0.058
3
Av. Vol. of H2SO4 used = 3.0667 mL
Therefore using the formula (5.2), the total alkalinity for Keroche borehole:
= 0.0103743M x (3.0667 mL/1000 mL) x (105.987 g/mole x 1000 mg/g) x (1000 mL/20 mL)
Total Alkalinity for Keroche borehole = 168.60 mg/L as Na2CO3
Appendix BVII: Calculations for the alkalinity for Joywel School borehole
Phenolphthalein Alkalinity
The titration for P.A determination for Joywel School borehole is shown in Table 5.21
Table 5.21: Joywel School borehole phenolphthalein alkalinity determination
Titration No.
Vol. of Sample (
mL)
Burette Reading (mL)
Volume of H2SO4 (mL) Final Initial
1 20 6.7 6.0 0.7
2 20 13.5 12.6 0.9
3 20 20.3 19.5 0.8
Av. Vol. of H2SO4 (mL) = 0.7 + 0.9 + 0.8 = 0.800 mL ± 0.10
3
Av. Vol. of H2SO4 used = 0.800 mL
Therefore using the formula (5.2), the phenolphthalein alkalinity for Joywel school borehole:
= 0.0103743M x (0.800 mL/1000 mL) x (105.987 g/mole x 1000 mg/g) x (1000 mL/20 mL)
Phenolphthalein Alkalinity for Joywel school borehole = 43.98 mg/L as Na2CO3
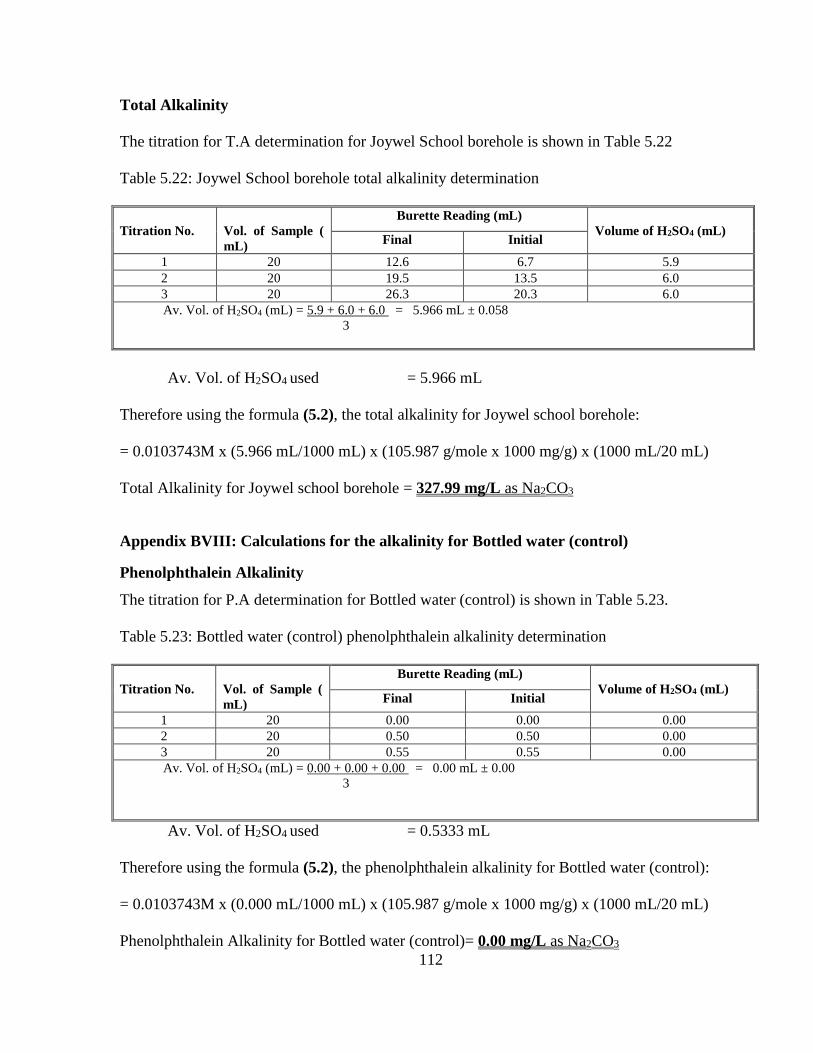
112
Total Alkalinity
The titration for T.A determination for Joywel School borehole is shown in Table 5.22
Table 5.22: Joywel School borehole total alkalinity determination
Titration No.
Vol. of Sample (
mL)
Burette Reading (mL)
Volume of H2SO4 (mL) Final Initial
1 20 12.6 6.7 5.9
2 20 19.5 13.5 6.0
3 20 26.3 20.3 6.0
Av. Vol. of H2SO4 (mL) = 5.9 + 6.0 + 6.0 = 5.966 mL ± 0.058
3
Av. Vol. of H2SO4 used = 5.966 mL
Therefore using the formula (5.2), the total alkalinity for Joywel school borehole:
= 0.0103743M x (5.966 mL/1000 mL) x (105.987 g/mole x 1000 mg/g) x (1000 mL/20 mL)
Total Alkalinity for Joywel school borehole = 327.99 mg/L as Na2CO3
Appendix BVIII: Calculations for the alkalinity for Bottled water (control)
Phenolphthalein Alkalinity
The titration for P.A determination for Bottled water (control) is shown in Table 5.23.
Table 5.23: Bottled water (control) phenolphthalein alkalinity determination
Titration No.
Vol. of Sample (
mL)
Burette Reading (mL)
Volume of H2SO4 (mL) Final Initial
1 20 0.00 0.00 0.00
2 20 0.50 0.50 0.00
3 20 0.55 0.55 0.00
Av. Vol. of H2SO4 (mL) = 0.00 + 0.00 + 0.00 = 0.00 mL ± 0.00
3
Av. Vol. of H2SO4 used = 0.5333 mL
Therefore using the formula (5.2), the phenolphthalein alkalinity for Bottled water (control):
= 0.0103743M x (0.000 mL/1000 mL) x (105.987 g/mole x 1000 mg/g) x (1000 mL/20 mL)
Phenolphthalein Alkalinity for Bottled water (control)= 0.00 mg/L as Na2CO3

113
Total Alkalinity
The titration for T.A determination for Bottled water (control) is shown in Table 5.24
Table 5.24: Bottled water (control) total alkalinity determination
Titration No.
Vol. of Sample (
mL)
Burette Reading (mL)
Volume of H2SO4 (mL) Final Initial
1 20 0.05 0.00 0.05
2 20 0.55 0.50 0.05
3 20 0.60 0.55 0.05
Av. Vol. of H2SO4 (mL) = 0.05 + 0.05 + 0.05 = 0.05 mL ± 0.00
3
Av. Vol. of H2SO4 used = 9.3 mL
Therefore using the formula (5.2), the total alkalinity for Bottled water (control):
= 0.0103743M x (0.05 mL/1000 mL) x (105.987 g/mole x 1000 mg/g) x (1000 mL/20 mL)
Total Alkalinity for Bottled water (control) = 2.75 mg/L as Na2CO3
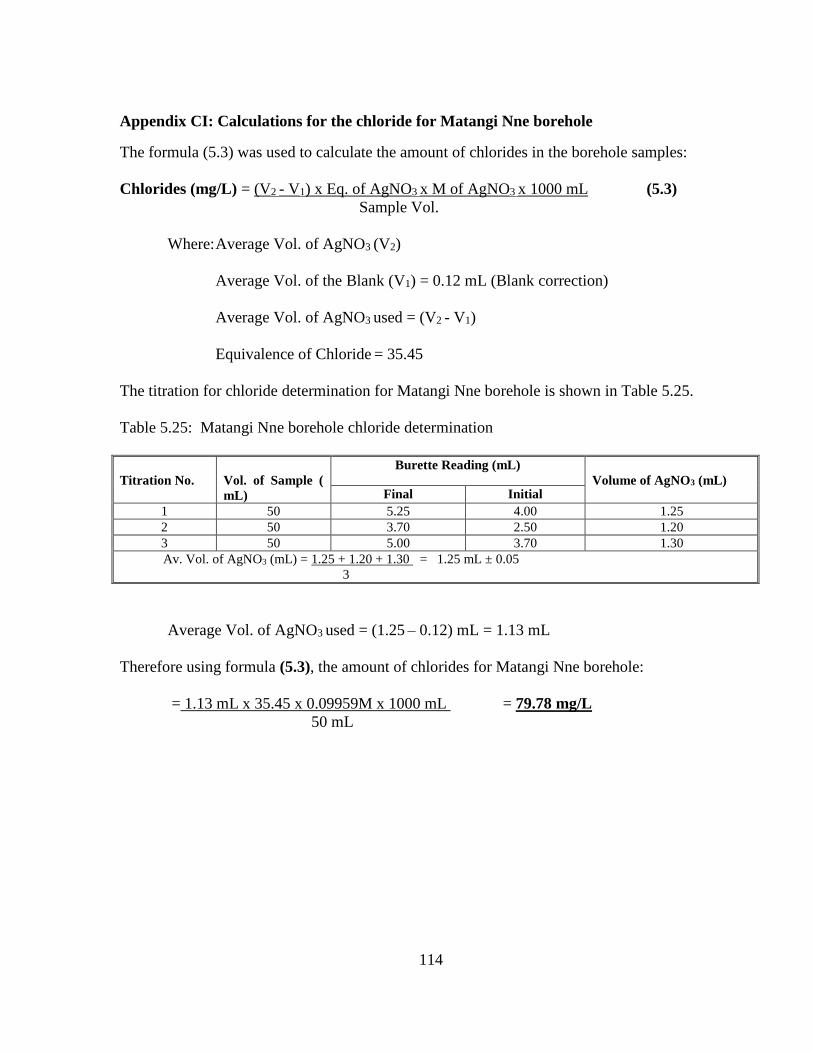
114
Appendix CI: Calculations for the chloride for Matangi Nne borehole
The formula (5.3) was used to calculate the amount of chlorides in the borehole samples:
Chlorides (mg/L) = (V2 - V1) x Eq. of AgNO3 x M of AgNO3 x 1000 mL (5.3)
Sample Vol.
Where: Average Vol. of AgNO3 (V2)
Average Vol. of the Blank (V1) = 0.12 mL (Blank correction)
Average Vol. of AgNO3 used = (V2 - V1)
Equivalence of Chloride = 35.45
The titration for chloride determination for Matangi Nne borehole is shown in Table 5.25.
Table 5.25: Matangi Nne borehole chloride determination
Titration No.
Vol. of Sample (
mL)
Burette Reading (mL)
Volume of AgNO3 (mL) Final Initial
1 50 5.25 4.00 1.25
2 50 3.70 2.50 1.20
3 50 5.00 3.70 1.30
Av. Vol. of AgNO3 (mL) = 1.25 + 1.20 + 1.30 = 1.25 mL ± 0.05
3
Average Vol. of AgNO3 used = (1.25 – 0.12) mL = 1.13 mL
Therefore using formula (5.3), the amount of chlorides for Matangi Nne borehole:
= 1.13 mL x 35.45 x 0.09959M x 1000 mL = 79.78 mg/L
50 mL

115
Appendix CII: Calculations for the chloride for Koinange Car wash borehole
The titration for chloride determination for Koinange car wash borehole is shown in Table 5.26
Table 5.26: Koinange Car Wash borehole chloride determination
Titration No.
Vol. of Sample (
mL)
Burette Reading (mL)
Volume of AgNO3 (mL) Final Initial
1 50 2.85 2.00 0.85
2 50 4.90 4.00 0.90
3 50 0.85 0.00 0.85
Av. Vol. of AgNO3 (mL) = 0.85 + 0.90 + 0.85 = 0.8667 mL ± 0.03
3
Average Vol. of AgNO3 used = (0.8667 – 0.12) mL = 0.7467 mL
Therefore using formula (5.3), the amount of chlorides for Koinange car wash borehole:
= 0.7467 mL x 35.45 x 0.09959M x 1000 mL = 52.80 mg/L
50 mL
Appendix CIII: Calculations for the chloride for Ushirika Water Project borehole
The titration for chloride determination for Ushirika Water Project borehole is shown in Table
5.27
Table 5.27: Ushirika Water Project borehole chloride determination
Titration No.
Vol. of Sample (
mL)
Burette Reading (mL)
Volume of AgNO3 (mL) Final Initial
1 50 1.45 1.00 0.45
2 50 2.00 1.45 0.55
3 50 2.45 2.00 0.45
Av. Vol. of AgNO3 (mL) = 0.45 + 0.55 + 0.45 = 0.4833 mL ± 0.06
3
Average Vol. of AgNO3 used = (0.4833 – 0.12) mL = 0.3633 mL
Therefore using formula (5.3), the amount of chlorides for Ushirika Water Project borehole:
= 0.3633 mL x 35.45 x 0.09959M x 1000 mL = 25.65 mg/L
50 mL
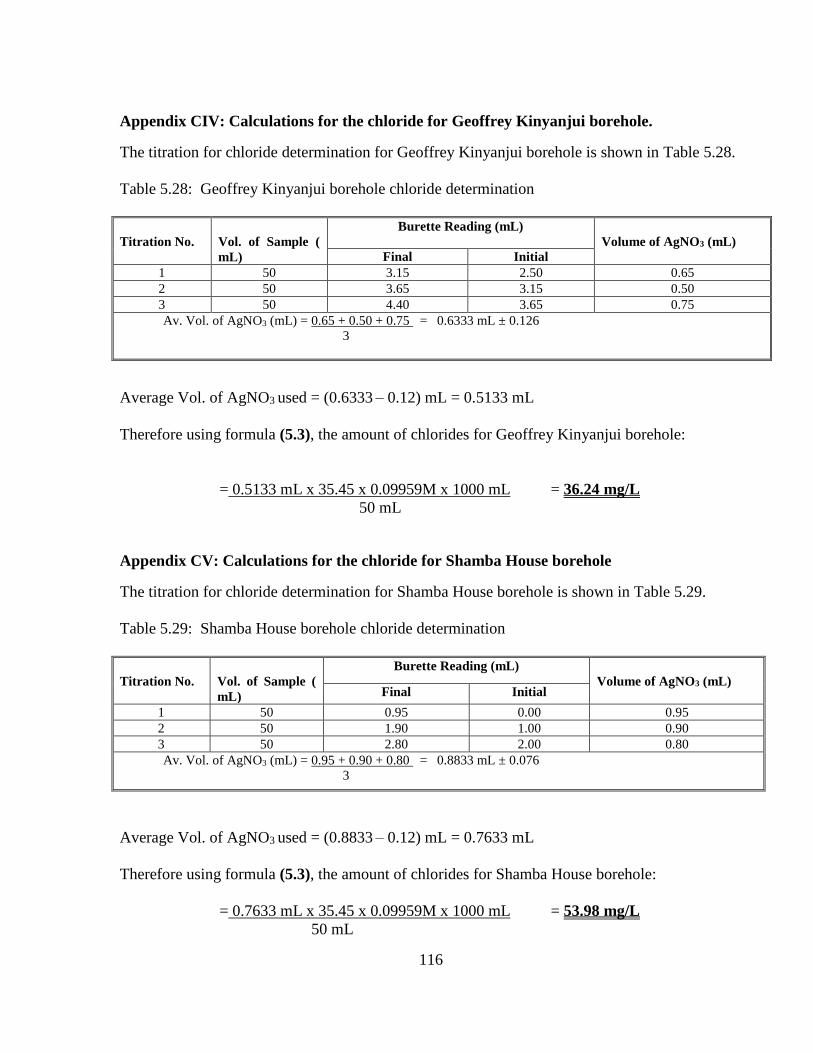
116
Appendix CIV: Calculations for the chloride for Geoffrey Kinyanjui borehole.
The titration for chloride determination for Geoffrey Kinyanjui borehole is shown in Table 5.28.
Table 5.28: Geoffrey Kinyanjui borehole chloride determination
Titration No.
Vol. of Sample (
mL)
Burette Reading (mL)
Volume of AgNO3 (mL)
Final Initial
1 50 3.15 2.50 0.65
2 50 3.65 3.15 0.50
3 50 4.40 3.65 0.75
Av. Vol. of AgNO3 (mL) = 0.65 + 0.50 + 0.75 = 0.6333 mL ± 0.126
3
Average Vol. of AgNO3 used = (0.6333 – 0.12) mL = 0.5133 mL
Therefore using formula (5.3), the amount of chlorides for Geoffrey Kinyanjui borehole:
= 0.5133 mL x 35.45 x 0.09959M x 1000 mL = 36.24 mg/L
50 mL
Appendix CV: Calculations for the chloride for Shamba House borehole
The titration for chloride determination for Shamba House borehole is shown in Table 5.29.
Table 5.29: Shamba House borehole chloride determination
Titration No.
Vol. of Sample (
mL)
Burette Reading (mL)
Volume of AgNO3 (mL) Final Initial
1 50 0.95 0.00 0.95
2 50 1.90 1.00 0.90
3 50 2.80 2.00 0.80
Av. Vol. of AgNO3 (mL) = 0.95 + 0.90 + 0.80 = 0.8833 mL ± 0.076
3
Average Vol. of AgNO3 used = (0.8833 – 0.12) mL = 0.7633 mL
Therefore using formula (5.3), the amount of chlorides for Shamba House borehole:
= 0.7633 mL x 35.45 x 0.09959M x 1000 mL = 53.98 mg/L
50 mL
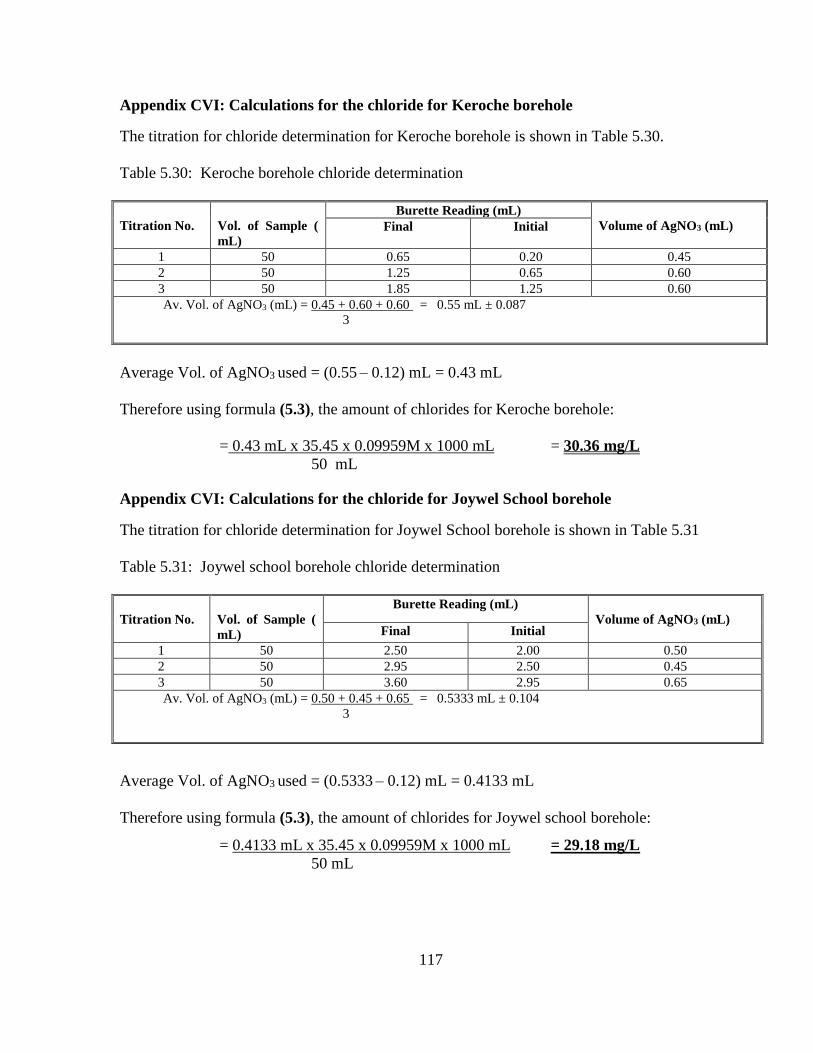
117
Appendix CVI: Calculations for the chloride for Keroche borehole
The titration for chloride determination for Keroche borehole is shown in Table 5.30.
Table 5.30: Keroche borehole chloride determination
Titration No.
Vol. of Sample (
mL)
Burette Reading (mL)
Volume of AgNO3 (mL) Final Initial
1 50 0.65 0.20 0.45
2 50 1.25 0.65 0.60
3 50 1.85 1.25 0.60
Av. Vol. of AgNO3 (mL) = 0.45 + 0.60 + 0.60 = 0.55 mL ± 0.087
3
Average Vol. of AgNO3 used = (0.55 – 0.12) mL = 0.43 mL
Therefore using formula (5.3), the amount of chlorides for Keroche borehole:
= 0.43 mL x 35.45 x 0.09959M x 1000 mL = 30.36 mg/L
50 mL
Appendix CVI: Calculations for the chloride for Joywel School borehole
The titration for chloride determination for Joywel School borehole is shown in Table 5.31
Table 5.31: Joywel school borehole chloride determination
Titration No.
Vol. of Sample (
mL)
Burette Reading (mL)
Volume of AgNO3 (mL) Final Initial
1 50 2.50 2.00 0.50
2 50 2.95 2.50 0.45
3 50 3.60 2.95 0.65
Av. Vol. of AgNO3 (mL) = 0.50 + 0.45 + 0.65 = 0.5333 mL ± 0.104
3
Average Vol. of AgNO3 used = (0.5333 – 0.12) mL = 0.4133 mL
Therefore using formula (5.3), the amount of chlorides for Joywel school borehole:
= 0.4133 mL x 35.45 x 0.09959M x 1000 mL = 29.18 mg/L
50 mL

118
Appendix DI: Values for Matangi Nne borehole compared to WHO and EAS
Borehole Name MATANGI NNE BOREHOLE
TEST
PARAMETER UNITS
TEST
RESULTS
GUIDELINE
VALUE
WHO EAS
pH - 8.402 6.5-8.5 6.5-8.5
Elect. Conductivity µS/cm 1218 2500 2500
Turbidity NTU 0.135 1 1
Water Color TCU 10 15 15
TSS mg/L 3.33 ND ND
TDS mg/L 421 1500 1500
Total Hardness mg/L 47.09 300 300
Alkalinity (P.A) mg/L 36.66 - -
(T.A) mg/L 511.35 - -
Chloride mg/L 79.9 250 250
Chlorine mg/L 0.01 5 5
Fluoride mg/L 4.63 1.5 1.5
Sulfates mg/L 263.88 - -
Nitrates mg/L 6.12 50 45
Sodium mg/L 14.58 - 200
Potassium mg/L 11.8 - -
Manganese mg/L ND 0.4 0.4
Copper mg/L 0.2119 2 2
Iron mg/L 0.0986 0.3 0.3
Cadmium mg/L ND 0.003 0.003
Lead mg/L 0.1962 0.01 0.01
Chromium mg/L ND 0.05 0.05
Zinc mg/L 0.0347 5 5
E.coli - Nil Nil Nil
Comments: All parameters comply except TSS, Fluorides and Lead which are
outside the guideline values.

119
Appendix DII: Values for Ushirika Water Project borehole compared to WHO and EAS
Borehole Name
USHIRIKA WATER PROJECT
BOREHOLE
TEST
PARAMETER
UNIT
S
TEST
RESULTS
GUIDELINE
VALUE
WHO EAS
pH - 8.042 6.5-8.5 6.5-8.5
Elect.
Conductivity µS/cm
677 2500 2500
Turbidity NTU 0.099 1 1
Water Color TCU 5 15 15
TSS mg/L 12.43 ND ND
TDS mg/L 246 1500 1500
Total Hardness mg/L 43.73 300 300
Alkalinity (P.A) mg/L 18.33 - -
(T.A) mg/L 355.53 - -
Chloride mg/L 25.7 250 250
Chlorine mg/L 0.01 5 5
Fluoride mg/L 2.43 1.5 1.5
Sulfates mg/L 234.38 - -
Nitrates mg/L 9.90 50 45
Sodium mg/L 17.81 - 200
Potassium mg/L 17.47 - -
Manganese mg/L 0.0038 0.4 0.4
Copper mg/L 0.1419 2 2
Iron mg/L 0.0222 0.3 0.3
Cadmium mg/L ND 0.003 0.003
Lead mg/L 0.0570 0.01 0.01
Chromium mg/L ND 0.05 0.05
Zinc mg/L 0.0291 5 5
E.coli - Nil Nil Nil
Comments: All parameters comply except TSS, Fluorides and Lead which are
outside the guideline values.

120
Appendix DIII: Values for Koinange Car Wash borehole compared to WHO and EAS
Borehole Name KOINANGE CAR WASH BOREHOLE
TEST
PARAMETER UNITS
TEST
RESULTS
GUIDELINE
VALUE
WHO EAS
pH - 8.035 6.5-8.5 6.5-8.5
Elect. Conductivity µS/cm 887 2500 2500
Turbidity NTU 0.116 1 1
Water Color TCU 4 15 15
TSS mg/L 23.30 ND ND
TDS mg/L 43 1500 1500
Total Hardness mg/L 43.73 300 300
Alkalinity (P.A) mg/L 34.83 - -
(T.A) mg/L 359.23 - -
Chloride mg/L 52.8 250 250
Chlorine mg/L 0.01 5 5
Fluoride mg/L 5.0 1.5 1.5
Sulfates mg/L 208.00 - -
Nitrates mg/L 9.84 50 45
Sodium mg/L 16.63 - 200
Potassium mg/L 14.40 - -
Manganese mg/L ND 0.4 0.4
Copper mg/L 0.1472 2 2
Iron mg/L 0.0469 0.3 0.3
Cadmium mg/L ND 0.003 0.003
Lead mg/L 0.0949 0.01 0.01
Chromium mg/L ND 0.05 0.05
Zinc mg/L 0.0251 5 5
E.coli - Nil Nil Nil
Comments: All parameters comply except TSS, Fluorides and Lead which are
outside the guideline values.

121
Appendix DIV: Values for Geoffrey Kinyanjui borehole compared to WHO and EAS
Borehole Name GEOFFREY KINYANJUI BOREHOLE
TEST
PARAMETER
UNIT
S
TEST
RESULTS
GUIDELINE
VALUE
WHO EAS
pH - 8.452 6.5-8.5 6.5-8.5
Elect.
Conductivity µS/cm
667 2500 2500
Turbidity NTU 0.095 1 1
Water Color TCU 6 15 15
TSS mg/L 34.97 ND ND
TDS mg/L 211 1500 1500
Total Hardness mg/L 31.95 300 300
Alkalinity (P.A) mg/L 18.33 - -
(T.A) mg/L 315.24 - -
Chloride mg/L 36.3 250 250
Chlorine mg/L 0.08 5 5
Fluoride mg/L 4.82 1.5 1.5
Sulfates mg/L 229.75 - -
Nitrates mg/L 8.41 50 45
Sodium mg/L 11.15 - 200
Potassium mg/L 13.67 - -
Manganese mg/L ND 0.4 0.4
Copper mg/L 0.1927 2 2
Iron mg/L 0.1369 0.3 0.3
Cadmium mg/L ND 0.003 0.003
Lead mg/L 0.1709 0.01 0.01
Chromium mg/L ND 0.05 0.05
Zinc mg/L 0.0374 5 5
E.coli - Nil Nil Nil
Comments: All parameters comply except TSS, Fluorides and Lead which are
outside the guideline values.

122
Appendix DV: Values for Shamba House borehole compared to WHO and EAS
Borehole Name SHAMBA HOUSE BOREHOLE
TEST
PARAMETER
UNIT
S
TEST
RESULTS
GUIDELINE
VALUE
WHO EAS
pH - 8.235 6.5-8.5 6.5-8.5
Elect.
Conductivity µS/cm
755 2500 2500
Turbidity NTU 0.108 1 1
Water Color TCU 4 15 15
TSS mg/L 1.93 ND ND
TDS mg/L 291 1500 1500
Total Hardness mg/L 31.95 300 300
Alkalinity (P.A) mg/L 29.32 - -
(T.A) mg/L 320.72 - -
Chloride mg/L 53.9 250 250
Chlorine mg/L 0.01 5 5
Fluoride mg/L 4.6 1.5 1.5
Sulfates mg/L 249.13 - -
Nitrates mg/L 6.04 50 45
Sodium mg/L 12.04 - 200
Potassium mg/L 13.34 - -
Manganese mg/L ND 0.4 0.4
Copper mg/L 0.1835 2 2
Iron mg/L 0.0210 0.3 0.3
Cadmium mg/L ND 0.003 0.003
Lead mg/L 0.0949 0.01 0.01
Chromium mg/L ND 0.05 0.05
Zinc mg/L 0.0305 5 5
E.coli - Nil Nil Nil
Comments: All parameters comply except Fluorides and Lead which are outside
the guideline values.
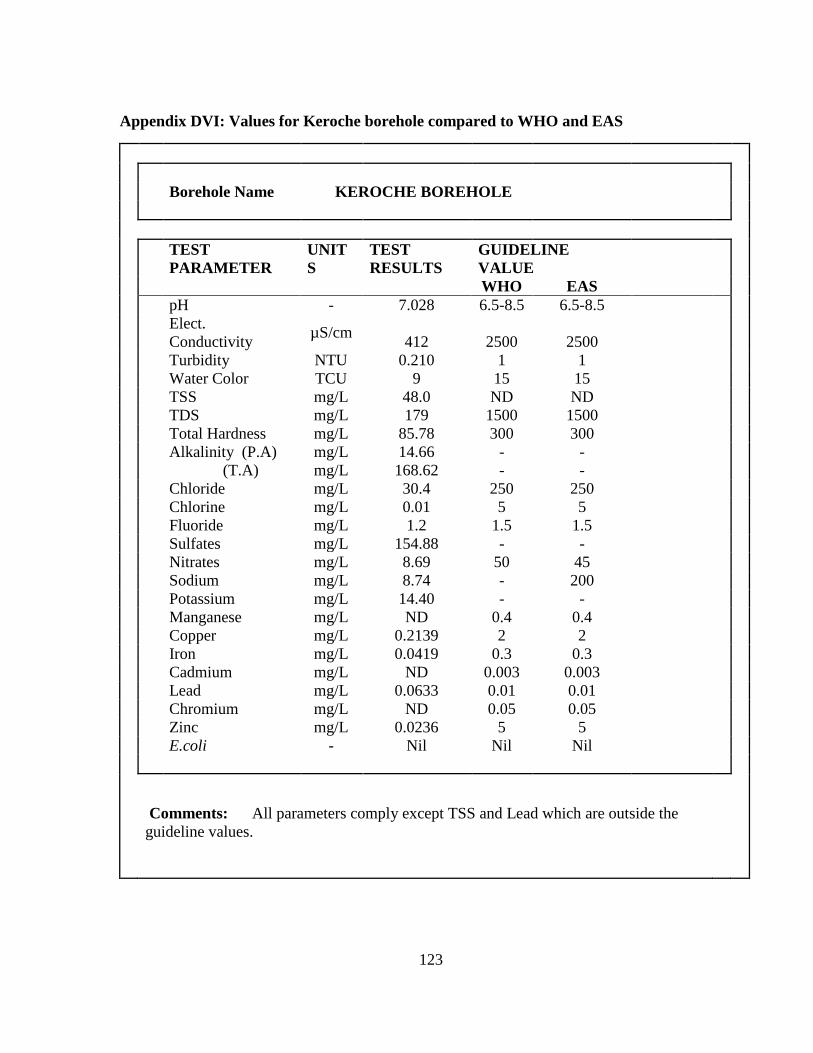
123
Appendix DVI: Values for Keroche borehole compared to WHO and EAS
Borehole Name KEROCHE BOREHOLE
TEST
PARAMETER
UNIT
S
TEST
RESULTS
GUIDELINE
VALUE
WHO EAS
pH - 7.028 6.5-8.5 6.5-8.5
Elect.
Conductivity µS/cm
412 2500 2500
Turbidity NTU 0.210 1 1
Water Color TCU 9 15 15
TSS mg/L 48.0 ND ND
TDS mg/L 179 1500 1500
Total Hardness mg/L 85.78 300 300
Alkalinity (P.A) mg/L 14.66 - -
(T.A) mg/L 168.62 - -
Chloride mg/L 30.4 250 250
Chlorine mg/L 0.01 5 5
Fluoride mg/L 1.2 1.5 1.5
Sulfates mg/L 154.88 - -
Nitrates mg/L 8.69 50 45
Sodium mg/L 8.74 - 200
Potassium mg/L 14.40 - -
Manganese mg/L ND 0.4 0.4
Copper mg/L 0.2139 2 2
Iron mg/L 0.0419 0.3 0.3
Cadmium mg/L ND 0.003 0.003
Lead mg/L 0.0633 0.01 0.01
Chromium mg/L ND 0.05 0.05
Zinc mg/L 0.0236 5 5
E.coli - Nil Nil Nil
Comments: All parameters comply except TSS and Lead which are outside the
guideline values.

124
Appendix DVII: Values for Joywel School borehole compared to WHO and EAS
Borehole Name JOYWEL SCHOOL BOREHOLE
TEST
PARAMETER
UNIT
S
TEST
RESULTS
GUIDELINE
VALUE
WHO EAS
pH - 8.317 6.5-8.5 6.5-8.5
Elect.
Conductivity µS/cm
648 2500 2500
Turbidity NTU 0.335 1 1
Water Color TCU 2 15 15
TSS mg/L 2.00 ND ND
TDS mg/L 261 1500 1500
Total Hardness mg/L 28.60 300 300
Alkalinity (P.A) mg/L 43.99 - -
(T.A) mg/L 328.03 - -
Chloride mg/L 29.2 250 250
Chlorine mg/L 0.06 5 5
Fluoride mg/L 3.5 1.5 1.5
Sulfates mg/L 223.63 - -
Nitrates mg/L 9.94 50 45
Sodium mg/L 16.43 - 200
Potassium mg/L 17.348 - -
Manganese mg/L ND 0.4 0.4
Copper mg/L 0.2073 2 2
Iron mg/L 0.0592 0.3 0.3
Cadmium mg/L ND 0.003 0.003
Lead mg/L 0.0886 0.01 0.01
Chromium mg/L ND 0.05 0.05
Zinc mg/L 0.0319 5 5
E.coli - Nil Nil Nil
Comments: All parameters comply except TSS, Fluorides and Lead which are
outside the guideline values.

125
Appendix DVIII: Borehole sample information form
Borehole sample information form
1. Name and location of Borehole:
2. Borehole Ref No:
3. Date of Sample collection:
4. Amount of Sample collected:
5. Depth in Meters:
6. Date of Drilling:
7. Open or Closed:
Is the Borehole covered or Open?
Yes No
8. Date of Construction:
9. Population the Borehole serves: ________
10. Economic activities around the Borehole:
i.
11. Uses of the Borehole water:
i.
12. Test conducted in the past:
Have quality tests been conducted in the past?
Yes No
13. Presence of a water tower:
Is a water tower present?
Yes No
14. Tests conducted on Site:
i. pH ---------------------------------------------------------------------
ii. Conductivity ------------------------------------------------------------
iii. Temperature ------------------------------------------------------------
iv. Others -------------------------------------------------------------
Name and Signature:


![Assessment of the Water Quality of Boreholes in Selected ......environment [2]. It is however essential to all living things and its environment [3]. Ground water is the water beneath](https://static.fdocuments.in/doc/165x107/5fe8dfbe5fefb17de93abb21/assessment-of-the-water-quality-of-boreholes-in-selected-environment-2.jpg)