
ITER In-Vessel Coils (IVC) Interim Design Review Requirements & Design Point
Assessment of Vessel Requirements for the U.S. Offshore Wind Sector
Prepared for the Department of Energy as subtopic 5.2 of the
U.S. Offshore Wind: Removing Market Barriers
Grant Opportunity
24th September 2013

Disclaimer
This Report is being disseminated by the Department of Energy. As such, the document was prepared in compliance with Section 515 of the Treasury and General Government Appropriations Act for Fiscal Year 2001 (Public Law 106-554) and information quality guidelines issued by the Department of Energy. Though this Report does not constitute “influential” information, as that term is defined in DOE’s information quality guidelines or the Office of Management and Budget's Information Quality Bulletin for Peer Review (Bulletin), the study was reviewed both internally and externally prior to publication. For purposes of external review, the study and this final Report benefited from the advice and comments of offshore wind industry stakeholders. A series of project-specific workshops at which study findings were presented for critical review included qualified representatives from private corporations, national laboratories, and universities.

Acknowledgements
Preparing a report of this scope represented a year-long effort with the assistance of many people from government, the consulting sector, the offshore wind industry and our own consortium members. We would like to thank our friends and colleagues at Navigant and Garrad Hassan for their collaboration and input into our thinking and modeling. We would especially like to thank the team at the National Renewable Energy Laboratory (NREL) who prepared many of the detailed, technical analyses which underpinned much of our own subsequent modeling. We spoke to many in the industry, but none treated us with greater kindness and consideration than Rick Palmer of Weeks Marine. Rick was ever patient in explaining to us the economics and practice of offshore wind installation in the US, and much of our analysis would not have been possible without his help. We would like to thank the American Wind Energy Association (AWEA) for providing us an opportunity to present our findings to the broader public. Our project was a product of teamwork, and the team from the Department of Energy deserves special mention. Cash Fitzpatrick and Michael Hahn provided valuable oversight of our efforts, and Gary Norton contributed his expertise and supported our work tirelessly. Gretchen Andrus oversaw our administrative management. We were fortunate to have a strong consortium with outstanding team members. Doug Frongillo of Knud E Hansen, one of the world’s leading designers of offshore wind vessels, was invaluable in providing us details about vessels, fleets and maritime practice. The Clean Energy Group provided us a broad overview of the policies supporting the offshore wind industry throughout a range of states. The Great Lakes Commission has contributed greatly to our understanding of the unique conditions of the Great Lakes region and its offshore wind development. And finally, we would like to thank Fara Courtney of the US Offshore Wind Collaborative. Fara handled our outreach efforts, including three webinars and four conferences. We thank her for her efforts on behalf of the project and for her unflagging commitment to the cause of offshore wind. The Douglas-Westwood LLC Project Team February 28, 2013
Table of Contents
Executive Summary Key Findings .................................................................................................... 6 Executive Summary ......................................................................................................................................7 Summary of Findings .................................................................................................................................13 Industry Drivers and Policy Considerations ............................................................................................15 Opportunities for US and International Companies ................................................................................17 US Offshore Wind Development Scorecard .............................................................................................19 Part 1 Vessel-Related Aspects of the Offshore Wind Industry ................................ 22 Chapter 1 Development of the Offshore Wind Industry to Date ..................................... 24 1.1 The European Installation Experience................................................................................................25 1.2 Overview of Current Offshore Wind Projects in the US ...................................................................32
Chapter 2 Installation Methods ....................................................................................... 35 2.1 Foundation Installation.........................................................................................................................37 2.2 Wind Turbine Installation .....................................................................................................................39 2.3 Cable-lay (Array and Export) Operations ...........................................................................................44 2.4 Offshore Substation Installation .........................................................................................................46
Chapter 3 Vessel Types .................................................................................................. 47 3.1 Survey Vessels ......................................................................................................................................54 3.2 Jackup Vessels .....................................................................................................................................55 3.3 Turbine Installation Vessels (TIVs) .....................................................................................................57 3.4 Cable-Lay Vessels.................................................................................................................................59 3.5 Heavy Lift Vessels.................................................................................................................................64 3.6 Tugs ........................................................................................................................................................67 3.7 Barges ....................................................................................................................................................69 3.8 Supply Vessels ......................................................................................................................................70 3.9 Personnel Transfer Vessels .................................................................................................................71 3.10 Heavy Maintenance Vessels ..............................................................................................................72
Chapter 4 Vessel Components ....................................................................................... 74 4.1 Jackup Legs...........................................................................................................................................75 4.2 Dynamic Positioning.............................................................................................................................77 4.3 Heave Compensation............................................................................................................................78 4.4 Navigation ..............................................................................................................................................79 4.5 Cranes ....................................................................................................................................................80 4.6 Power ......................................................................................................................................................81 4.7 Hammer ..................................................................................................................................................82
Chapter 5 Regulations and Certifications....................................................................... 83 5.1 The Jones Act ....................................................................................................................................... 84 5.2 Certifications ......................................................................................................................................... 86 5.3 Classifications ...................................................................................................................................... 88
Chapter 6 Supply Chain and Industry Participants ........................................................ 89 6.1 Installation Companies ........................................................................................................................ 90 6.2 Major Installation Companies ............................................................................................................. 91 6.3 Shipyards .............................................................................................................................................. 92 6.4 Major Shipbuilders ............................................................................................................................... 93
Part 2 Vessel Requirements for the US Offshore Wind Industry ............................. 97 Chapter 7 Rollout Scenarios ......................................................................................... 100 7.1 US Overview ........................................................................................................................................ 101 7.2 Atlantic Coast ..................................................................................................................................... 104 7.3 Great Lakes ......................................................................................................................................... 105 7.4 Gulf Coast............................................................................................................................................ 106 7.5 Pacific Coast ....................................................................................................................................... 107
Chapter 8 Vessel Strategies.......................................................................................... 109 8.1 Installation Strategies ........................................................................................................................ 110 8.2 Case Study: Cape Wind Turbine Installation Strategies ................................................................ 111 8.3 Vessel Economics .............................................................................................................................. 113
Chapter 9 Vessel Requirements & Gap Analysis ......................................................... 116 9.1 Gap Analysis by Vessel Type............................................................................................................ 117 9.2 Overall US Vessel Requirements ...................................................................................................... 120 9.3 Atlantic Coast Vessel Requirements................................................................................................ 122 9.4 Great Lakes Vessel Requirements ................................................................................................... 125 9.5 Gulf Coast Vessel Requirements ...................................................................................................... 128 9.6 Pacific Coast Vessel Requirements ................................................................................................. 130
Appendices Appendix 1 - Installation Vessel Profiles ..................................................... 132 Appendix 2 - Modeling Assumtions ............................................................. 184 Appendix 3 - Detailed Modeling Results ...................................................... 200 Appendix 4 - Offshore Wind in the Great Lakes Region .............................. 212
Table of Contents
List of Figures Figure 1: Annual Installation Rate in Each Scenario – US Total..............................................................7 Figure 2: Annual Construction Vessel Requirements in the US – “US TIV” Installation Strategy ......9 Figure 3: Annual Other Vessel Requirements in the US – “US TIV” Installation Strategy ...................9 Figure 4: Jackup and TIV Demand in the US – Modeled vs. Estimated Actual Units ..........................11 Figure 5: Annual Offshore Wind Capacity Additions in Europe ............................................................25 Figure 6: Cumulative Market Share of Offshore Wind Manufacturers ..................................................26 Figure 7: Key Offshore Wind Markets – Asia and Europe ......................................................................27 Figure 8: Offshore Wind Capacity and Specialized Vessel Additions in Europe ................................28 Figure 9: Offshore Wind Investments in Europe in 2012 by Investor Type ..........................................29 Figure 10: Leading European Offshore Wind Installation Vessel Operators .......................................29 Figure 11: Growing Trend in Average Water Depth and Distance From Shore ...................................30 Figure 12: Average Wind Farm and Turbine Size in Europe ..................................................................31 Figure 13: Foundation Types Installed in Europe in 2012 ......................................................................31 Figure 14: Overview of the Offshore Wind Farm Installation Process..................................................36 Figure 15: Widely-Used Offshore Wind Turbine Foundation Types .....................................................37 Figure 16: Vessel Demand Model ..............................................................................................................99 Figure 17: Annual Installation Rate in Each Scenario – US Total....................................................... 103 Figure 18: Annual Installation Rate in Each Scenario – Atlantic Coast ............................................. 104 Figure 19: Annual Installation Rate in Each Scenario – Great Lakes Region ................................... 105 Figure 20: Annual Installation Rate in Each Scenario – Gulf Coast ................................................... 106 Figure 21: Annual Installation Rate in Each Scenario – Pacific Coast .............................................. 107 Figure 22: Percent of Days for Sea State Thresholds in Northeastern US ........................................ 115 Figure 23: US Total – Annual Construction Vessel Requirements – US Jackup Strategy .............. 120 Figure 24: US Total – Annual Other Vessel Requirements – US Jackup Strategy ........................... 120 Figure 25: US Total – Annual Construction Vessel Requirements – US TIV Strategy ..................... 121 Figure 26: US Total – Annual Other Vessel Requirements – US TIV Strategy .................................. 121 Figure 27: US Total – Annual Construction Vessel Requirements – EU TIV Strategy ..................... 121 Figure 28: US Total – Annual Other Vessel Requirements – EU TIV Strategy .................................. 121 Figure 29: Atlantic Coast – Annual Construction Vessel Requirements – US Jackup Strategy .... 122 Figure 30: Atlantic Coast – Annual Other Vessel Requirements – US Jackup Strategy ................. 122 Figure 31: Atlantic Coast – Annual Construction Vessel Requirements – US TIV Strategy ........... 123 Figure 32: Atlantic Coast – Annual Other Vessel Requirements – US TIV Strategy ........................ 123 Figure 33: Atlantic Coast – Annual Construction Vessel Requirements – EU TIV Strategy ........... 124 Figure 34: Atlantic Coast – Annual Other Vessel Requirements – EU TIV Strategy ........................ 124 Figure 35: Great Lakes – Annual Construction Vessel Requirements – US Jackup Strategy ........ 125 Figure 36: Great Lakes – Annual Other Vessel Requirements – US Jackup Strategy ..................... 125 Figure 37: Great Lakes – Annual Construction Vessel Requirements – US TIV Strategy ............... 126 Figure 38: Great Lakes – Annual Other Vessel Requirements – US TIV Strategy ............................ 126 Figure 39: Gulf Coast – Annual Construction Vessel Requirements – US Jackup Strategy........... 128 Figure 40: Gulf Coast – Annual Other Vessel Requirements – US Jackup Strategy ....................... 128 Figure 41: Gulf Coast – Annual Construction Vessel Requirements – US TIV Strategy ................. 129 Figure 42: Gulf Coast – Annual Other Vessel Requirements – US TIV Strategy .............................. 129 Figure 43: Pacific Coast – Annual Construction Vessel Requirements – Floating Turbine Strategy ....................................................................................................................................... 131 Figure 44: Pacific Coast – Annual Other Vessel Requirements – Floating Turbine Strategy ......... 131 Figure 45: Overview of Modeling Logic ................................................................................................. 185 Figure 46: Key Characteristics of Various Sections of the St. Lawrence Seaway ........................... 214
List of Tables Table 1: Summary of Rollout Scenarios .................................................................................................... 7 Table 2: Key Offshore Wind Sector Characteristics in the US and Europe ......................................... 12 Table 3: Opportunities for Various Stakeholders in the US Offshore Wind Supply Chain ................ 18 Table 4: Probable Offshore Wind Projects in the US ............................................................................. 32 Table 5: DOE Demonstration Projects Selected for First Phase Funding ........................................... 34 Table 6: Indicative Size and Weight Dimensions of Various Turbine Classes .................................... 39 Table 7: Current and Planned TIVs and Jackup Vessels Available for Offshore Wind Turbine Installation .................................................................................................................................... 58 Table 8: Selected Foreign-Flagged Cable-Lay Vessels .......................................................................... 60 Table 9: Key Characteristics of Selected Foreign-Flagged Heavy Lift Vessels .................................. 66 Table 10: Indicative Specification of Selected Offshore Wind Vessel Types ...................................... 73 Table 11: Active Large Shipyards in the United States .......................................................................... 93 Table 12: Medium-Sized Shipyards in the United States ....................................................................... 94 Table 13: Summary of Rollout Scenarios .............................................................................................. 101 Table 14: Summary of Technology Assumptions................................................................................. 102 Table 15: Definition of High and Low Technology ............................................................................... 102 Table 16: Installation Rates in Each Scenario – Atlantic Coast .......................................................... 104 Table 17: Installation Rates in Each Scenario – Great Lakes .............................................................. 105 Table 18: Installation Rates in Each Scenario – Gulf Coast ................................................................ 106 Table 19: Installation Rates in Each Scenario – Pacific Coast ............................................................ 107 Table 20: Indicative Vessel Economics for Turbine Installation ......................................................... 113 Table 21: Overview of Rollout Scenarios............................................................................................... 185 Table 22: Cape Wind-Related Assumptions .......................................................................................... 186 Table 23: Overview of Modeling Assumptions ..................................................................................... 192 Table 24: Modeling Results – US Total – US Jackup Strategy ............................................................ 201 Table 25: Modeling Results – US Total – US TIV Strategy ................................................................... 202 Table 26: Modeling Results – US Total – EU TIV Strategy ................................................................... 203 Table 27: Modeling Results – Atlantic Coast – US Jackup Strategy .................................................. 204 Table 28: Modeling Results – Atlantic Coast – US TIV Strategy ......................................................... 205 Table 29: Modeling Results – Atlantic Coast – EU TIV Strategy ......................................................... 206 Table 30: Modeling Results – Great Lakes – US Jackup Strategy ...................................................... 207 Table 31: Modeling Results – Great Lakes – US TIV Strategy ............................................................. 208 Table 32: Modeling Results – Gulf Coast – US Jackup Strategy ........................................................ 209 Table 33: Modeling Results – Gulf Coast – US TIV Strategy ............................................................... 210 Table 34: Modeling Results – Pacific Coast – Floating Turbine Strategy .......................................... 211 Table 35: Selected Physical Parameters of the Great Lakes ............................................................... 217
List of Boxes Box 1: Cross Check: The European Installation Fleet versus Our Model Forecasts ......................... 10
© Douglas-Westwood Page 6
Executive Summary Key Findings
Key Findings
© Douglas-Westwood Page 7
Executive Summary Douglas-Westwood was commissioned by the US Department of Energy (DOE) to investigate the anticipated demand for various vessel types associated with offshore wind development in the United States through 2030, as well as to assess related market barriers and mitigating policy options. This Report contains our findings. It is intended to provide guidance on all vessel-related aspects of offshore wind installation to a wide range of audiences, including federal and state-level government agencies, research institutions, prospective project developers, installation companies, vessel operators and shipbuilders, as well as the general public.
To develop scenarios of potential vessel demand, Douglas-Westwood, in conjunction with Navigant Consulting and the National Renewable Energy Laboratory (NREL) and in cooperation with the Department of Energy (DOE), established detailed rollout scenarios for four US offshore wind regions, respectively Atlantic Coast, Great Lakes, Gulf Coast and Pacific Coast. Rollout scenarios were based on DOE-provided offshore wind capacity targets by region in three sets of variations, reflecting several possible rates of wind farm installation and differing levels of technology advancement prior to 2030. The highest growth scenario reflects the potential for 54 GW of capacity installed by 2030 in alignment with the National Offshore Wind Strategy issued in 2011 by DOE and the Department of the Interior.
The resulting scenarios used throughout this Report are referred to as the High Growth – High Technology (HH) scenario, the Medium Growth – High Technology (MH) scenario, and the Low Growth – Low Technology (LL) scenario. These scenarios inform our views of the vessel requirements in the US offshore wind sector through 2030. Each scenario falls into two phases: Phase 1 covers 2013 to 2020, while Phase 2 covers 2021 to 2030. The rollout scenarios are discussed in detail in Chapter 7 of this Report.
Table 1: Summary of Rollout Scenarios
Source: Douglas-Westwood, Department of Energy, NREL, Navigant
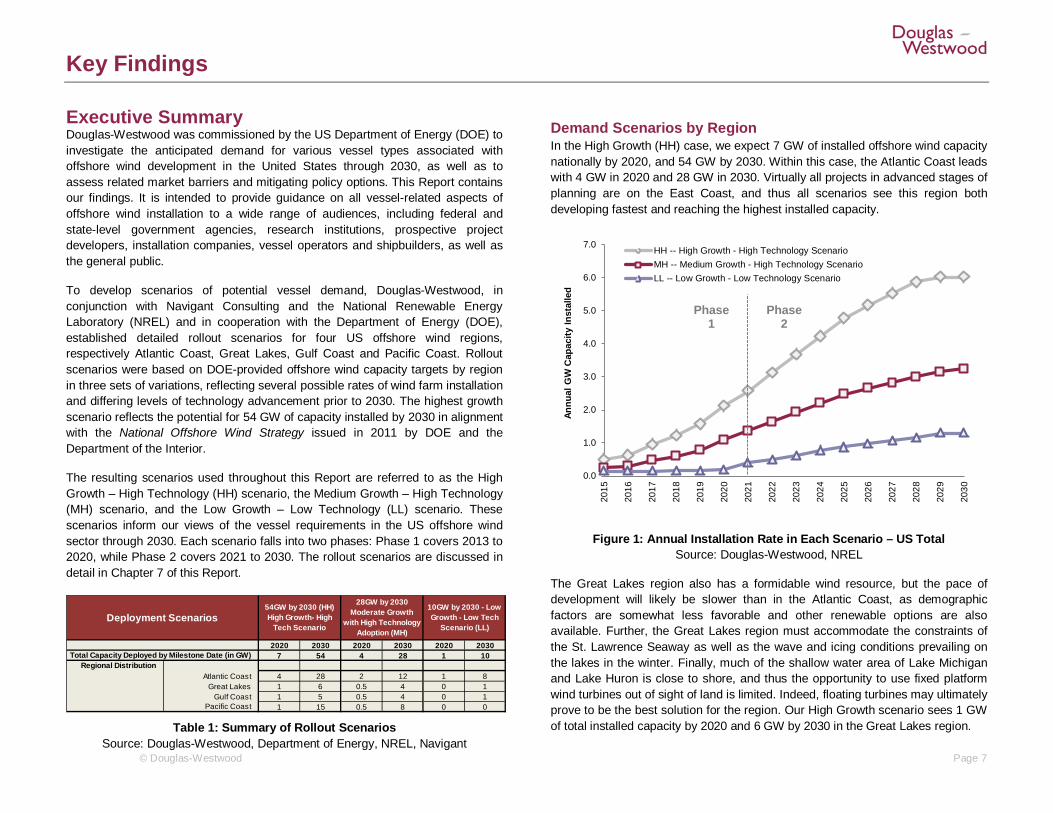
Demand Scenarios by Region In the High Growth (HH) case, we expect 7 GW of installed offshore wind capacity nationally by 2020, and 54 GW by 2030. Within this case, the Atlantic Coast leads with 4 GW in 2020 and 28 GW in 2030. Virtually all projects in advanced stages of planning are on the East Coast, and thus all scenarios see this region both developing fastest and reaching the highest installed capacity.
Figure 1: Annual Installation Rate in Each Scenario – US Total Source: Douglas-Westwood, NREL
The Great Lakes region also has a formidable wind resource, but the pace of development will likely be slower than in the Atlantic Coast, as demographic factors are somewhat less favorable and other renewable options are also available. Further, the Great Lakes region must accommodate the constraints of the St. Lawrence Seaway as well as the wave and icing conditions prevailing on the lakes in the winter. Finally, much of the shallow water area of Lake Michigan and Lake Huron is close to shore, and thus the opportunity to use fixed platform wind turbines out of sight of land is limited. Indeed, floating turbines may ultimately prove to be the best solution for the region. Our High Growth scenario sees 1 GW of total installed capacity by 2020 and 6 GW by 2030 in the Great Lakes region.
2020 2030 2020 2030 2020 20307 54 4 28 1 10
Regional DistributionAtlantic Coast 4 28 2 12 1 8
Great Lakes 1 6 0.5 4 0 1Gulf Coast 1 5 0.5 4 0 1
Pacific Coast 1 15 0.5 8 0 0
Deployment Scenarios54GW by 2030 (HH)High Growth- High
Tech Scenario
28GW by 2030Moderate Growth
with High Technology Adoption (MH)
10GW by 2030 - Low Growth - Low Tech
Scenario (LL)
Total Capacity Deployed by Milestone Date (in GW)
0.0
1.0
2.0
3.0
4.0
5.0
6.0
7.0
2015
2016
2017
2018
2019
2020
2021
2022
2023
2024
2025
2026
2027
2028
2029
2030
Annu
al G
W C
apac
ity In
stal
led
HH -- High Growth - High Technology ScenarioMH -- Medium Growth - High Technology ScenarioLL -- Low Growth - Low Technology Scenario
Phase 1
Phase 2
Key Findings
© Douglas-Westwood Page 8
The US Gulf Coast has a rich history of offshore development, primarily associated with the oil and gas sector. This legacy provides considerable experience and assets required for fixed and floating platform design, construction and maintenance. These capabilities can be readily applied to the offshore wind sector.
The wind resource in the Gulf of Mexico is generally inferior to the East Coast or the Great Lakes. At the same time, the region is more prone to hurricanes. Furthermore, the region has ample alternatives to offshore wind. Texas, with nearly 11 GW of lower cost, onshore wind capacity, leads the nation by far. Our High Growth scenario sees 1 GW of installed capacity in the Gulf Coast by 2020, and 5 GW by 2030.
The Pacific Coast is characterized by a rapidly dropping shelf, with water depths quickly exceeding the limits of fixed platforms. The region also suffers from NIMBY issues (NIMBY is an acronym for "Not in My Back Yard") which will limit the ability to put turbines near shore. The northwest of the region is amply served by hydropower, limiting the need for more expensive offshore wind alternatives. On the other hand, California is a leader in renewable energy policy, and offshore wind should find support there, if a suitable technology can be developed. Overall, the Pacific Coast would be an ideal location for floating turbines—a technology which is both promising and progressing, but not yet proven. However, if such floating technology proves to be cost effective on a large scale, then offshore wind could become a competitive alternative power source for California. Our High Growth scenario for the Pacific Coast sees 1 GW offshore wind capacity installed by 2020 and a total of 15 GW installed by 2030.
These scenarios inform our views of the need for offshore wind vessels. We present the results of our vessel demand forecasting exercise in detail in Chapter 9, and provide a brief overview of the results below. We note that the scenarios should not be interpreted as forecasts. This Report takes no position on the likely pace of offshore wind development; rather we look at the vessel-related implications of a given set of potential development paths.
Vessel Requirements under Each Demand Scenario The rollout scenarios combined with three potential vessel strategies drive the anticipated vessel requirements (expressed in annualized vessel equivalent numbers) for a range of vessel types in various offshore wind capacity development scenarios. The related model and the underlying assumptions are covered in Chapter 8 and in Appendix 2.
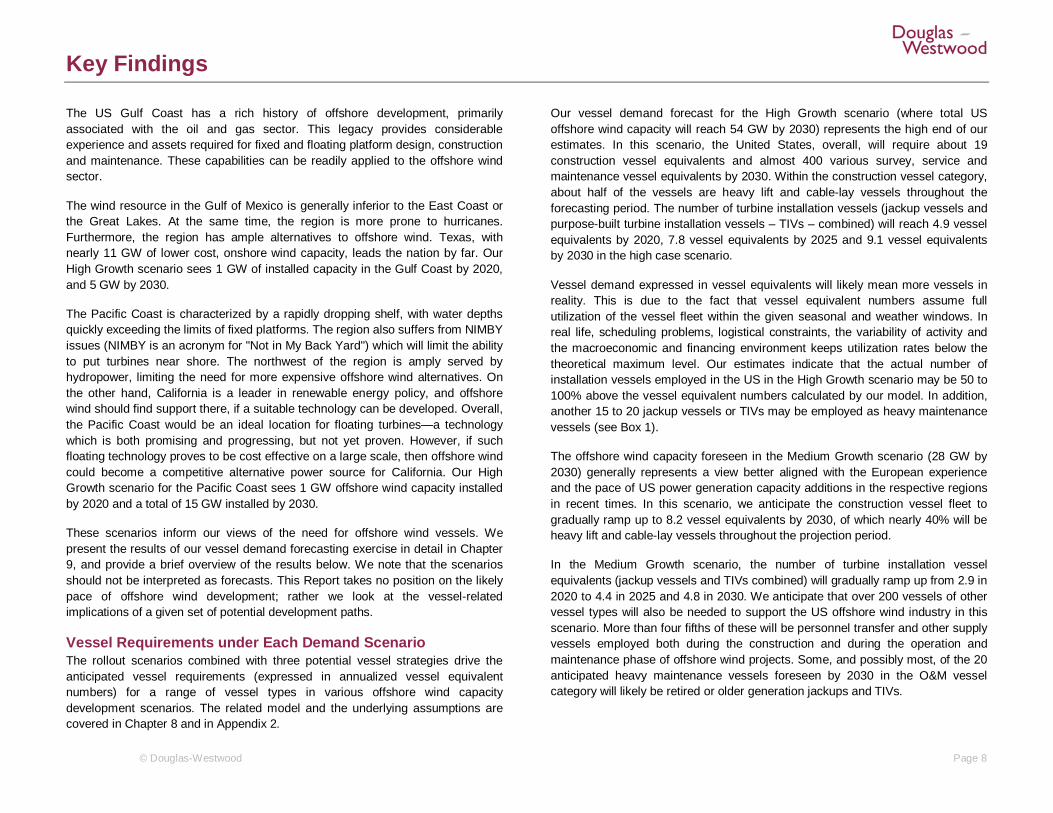
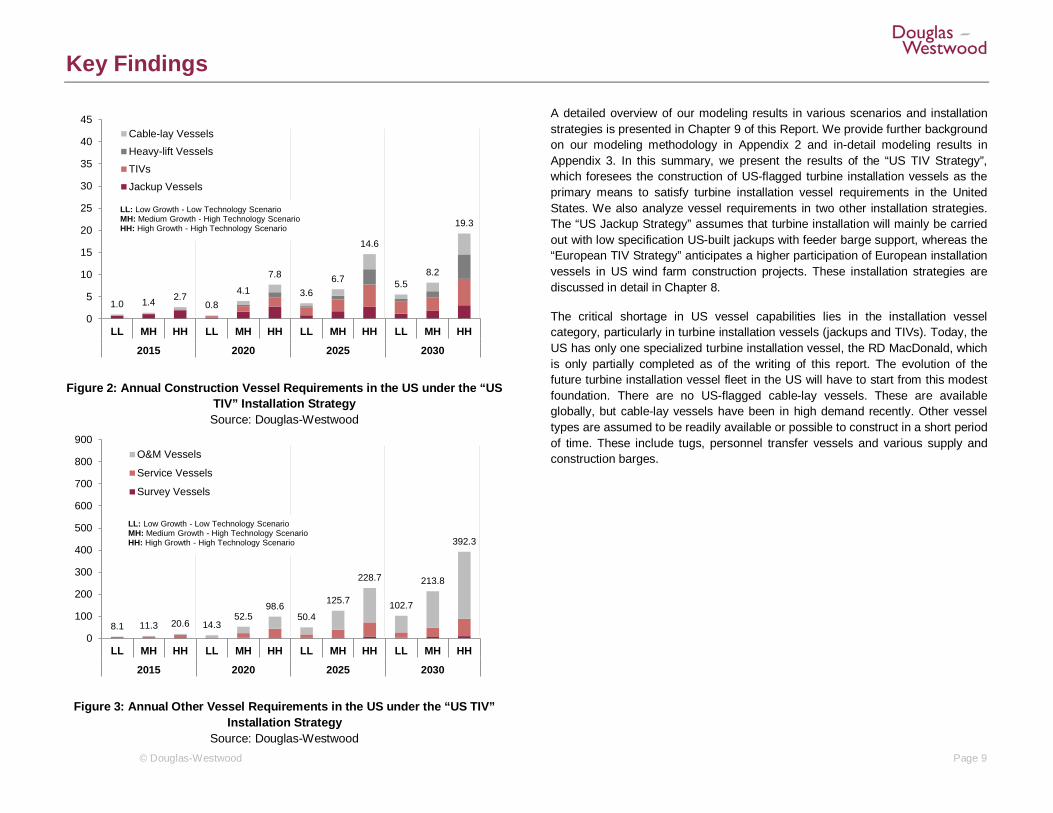
Our vessel demand forecast for the High Growth scenario (where total US offshore wind capacity will reach 54 GW by 2030) represents the high end of our estimates. In this scenario, the United States, overall, will require about 19 construction vessel equivalents and almost 400 various survey, service and maintenance vessel equivalents by 2030. Within the construction vessel category, about half of the vessels are heavy lift and cable-lay vessels throughout the forecasting period. The number of turbine installation vessels (jackup vessels and purpose-built turbine installation vessels – TIVs – combined) will reach 4.9 vessel equivalents by 2020, 7.8 vessel equivalents by 2025 and 9.1 vessel equivalents by 2030 in the high case scenario.
Vessel demand expressed in vessel equivalents will likely mean more vessels in reality. This is due to the fact that vessel equivalent numbers assume full utilization of the vessel fleet within the given seasonal and weather windows. In real life, scheduling problems, logistical constraints, the variability of activity and the macroeconomic and financing environment keeps utilization rates below the theoretical maximum level. Our estimates indicate that the actual number of installation vessels employed in the US in the High Growth scenario may be 50 to 100% above the vessel equivalent numbers calculated by our model. In addition, another 15 to 20 jackup vessels or TIVs may be employed as heavy maintenance vessels (see Box 1).
The offshore wind capacity foreseen in the Medium Growth scenario (28 GW by 2030) generally represents a view better aligned with the European experience and the pace of US power generation capacity additions in the respective regions in recent times. In this scenario, we anticipate the construction vessel fleet to gradually ramp up to 8.2 vessel equivalents by 2030, of which nearly 40% will be heavy lift and cable-lay vessels throughout the projection period.
In the Medium Growth scenario, the number of turbine installation vessel equivalents (jackup vessels and TIVs combined) will gradually ramp up from 2.9 in 2020 to 4.4 in 2025 and 4.8 in 2030. We anticipate that over 200 vessels of other vessel types will also be needed to support the US offshore wind industry in this scenario. More than four fifths of these will be personnel transfer and other supply vessels employed both during the construction and during the operation and maintenance phase of offshore wind projects. Some, and possibly most, of the 20 anticipated heavy maintenance vessels foreseen by 2030 in the O&M vessel category will likely be retired or older generation jackups and TIVs.
Key Findings
© Douglas-Westwood Page 9
Figure 2: Annual Construction Vessel Requirements in the US under the “US TIV” Installation Strategy Source: Douglas-Westwood
Figure 3: Annual Other Vessel Requirements in the US under the “US TIV” Installation Strategy
Source: Douglas-Westwood
A detailed overview of our modeling results in various scenarios and installation strategies is presented in Chapter 9 of this Report. We provide further background on our modeling methodology in Appendix 2 and in-detail modeling results in Appendix 3. In this summary, we present the results of the “US TIV Strategy”, which foresees the construction of US-flagged turbine installation vessels as the primary means to satisfy turbine installation vessel requirements in the United States. We also analyze vessel requirements in two other installation strategies. The “US Jackup Strategy” assumes that turbine installation will mainly be carried out with low specification US-built jackups with feeder barge support, whereas the “European TIV Strategy” anticipates a higher participation of European installation vessels in US wind farm construction projects. These installation strategies are discussed in detail in Chapter 8.
The critical shortage in US vessel capabilities lies in the installation vessel category, particularly in turbine installation vessels (jackups and TIVs). Today, the US has only one specialized turbine installation vessel, the RD MacDonald, which is only partially completed as of the writing of this report. The evolution of the future turbine installation vessel fleet in the US will have to start from this modest foundation. There are no US-flagged cable-lay vessels. These are available globally, but cable-lay vessels have been in high demand recently. Other vessel types are assumed to be readily available or possible to construct in a short period of time. These include tugs, personnel transfer vessels and various supply and construction barges.
1.0 1.4 2.70.8
4.1
7.8
3.66.7
14.6
5.58.2
19.3
0
5
10
15
20
25
30
35
40
45
LL MH HH LL MH HH LL MH HH LL MH HH
2015 2020 2025 2030
Cable-lay Vessels
Heavy-lift Vessels
TIVs
Jackup Vessels
LL: Low Growth - Low Technology ScenarioMH: Medium Growth - High Technology Scenario HH: High Growth - High Technology Scenario
8.1 11.3 20.6 14.352.5
98.650.4
125.7
228.7
102.7
213.8
392.3
0
100
200
300
400
500
600
700
800
900
LL MH HH LL MH HH LL MH HH LL MH HH
2015 2020 2025 2030
O&M Vessels
Service Vessels
Survey Vessels
LL: Low Growth - Low Technology ScenarioMH: Medium Growth - High Technology Scenario HH: High Growth - High Technology Scenario
Key Findings
© Douglas-Westwood Page 10
Box 1 Cross Check: The European Installation Fleet versus Our Model Forecasts Model predictions do not always align with reality. Competitive pressures, logistical constraints, the variability of activity, and the macroeconomic and financing environment often mean that forecast quantities can vary from observed values. As a means to cross check our vessel forecasts, we compare these to the actual European installation fleet and the pace of turbine installation there. To this end, we have run our model with past and projected European offshore wind capacity additions, and calculated theoretical vessel equivalent requirements for Europe in a similar fashion as we did for the US.
Our analysis indicates that in the early phase of offshore wind development, there appears to be a large mismatch between calculated vessel equivalent numbers and the actual size of the available vessel fleet. At the end of 2008, there were about 14 installation vessels in the European vessel fleet which were used in offshore wind projects at some point in their lifetime. Only two of these vessels were purpose-built TIVs as late as 2008. Offshore wind installation often required improvised solutions, and many of these vessels were generic offshore construction vessels used mainly in port, bridge, or oil & gas-related construction projects. Importantly, many of these vessels were employed only at one or two offshore wind projects and not on a continuous basis.
By 2011, the vast majority of new installation vessel additions were purpose-built TIVs, and this trend is expected to continue going forward. It may be therefore more accurate to compare only the actual TIV fleet to model results for the post 2011 period. Between 2011 and 2014, actual TIV and calculated installation vessel numbers are more or less in line with each other in Europe. The notable jump in the size of the actual European TIV fleet in 2012 (with a total of eight new TIV deliveries in 2012 alone) reflects the anticipation of a rapid increase of installation vessel demand, as projected by our model, from 2013 onwards. The apparent overcapacity that will develop in the 2012- 2014 period will likely be absorbed only around 2018, providing that new vessel capacity additions slow down significantly after 2014.
We can reasonably assume that TIVs will dominate European offshore wind installation projects after 2011, and for practical purposes, only count purpose-built TIVs as actual installation vessels in Europe. In this case, our calculations indicate that the available installation vessels in Europe will install 24 full turbines sets per year on average in the 2011-2014 period. It is important to emphasize that this number includes the installation of foundations, transition pieces and turbine components alike. Overall, the average 24 turbine sets per installation vessel rate corresponds to an effective utilization rate of around 60%. Our comparable model estimate for the US indicates that an installation vessel equivalent will install an average 49 full turbine sets per year over the 15-year period between 2015 and 2030.
If we try to estimate the actual number of installation vessels to be used in the US based on the observed European installation rate (i.e. 24 turbine sets per available installation vessel), then the actual US vessel numbers are expected to be roughly twice as high as the vessel equivalent numbers calculated by our model. The 9.1 installation vessel equivalents in the US will likely mean approximately 18 actual specialized installation vessels in the water.
Part of the future heavy maintenance fleet will also likely be jackups or TIVs, probably older generation or retired units. This will further add to the number of offshore wind-qualified vessels operating in the US market. However, there is not enough reliable information in Europe about maintenance practices to determine what the exact ratio might be. As the cumulative offshore wind capacity increases, the number of jackup vessels or TIVs which are primarily employed in maintenance operations may easily match or even exceed the number used mainly for installation work in the post-2020 period, thus an additional 15-20 installation vessels of some sort may be used for maintenance by 2030.
Key Findings
© Douglas-Westwood Page 11
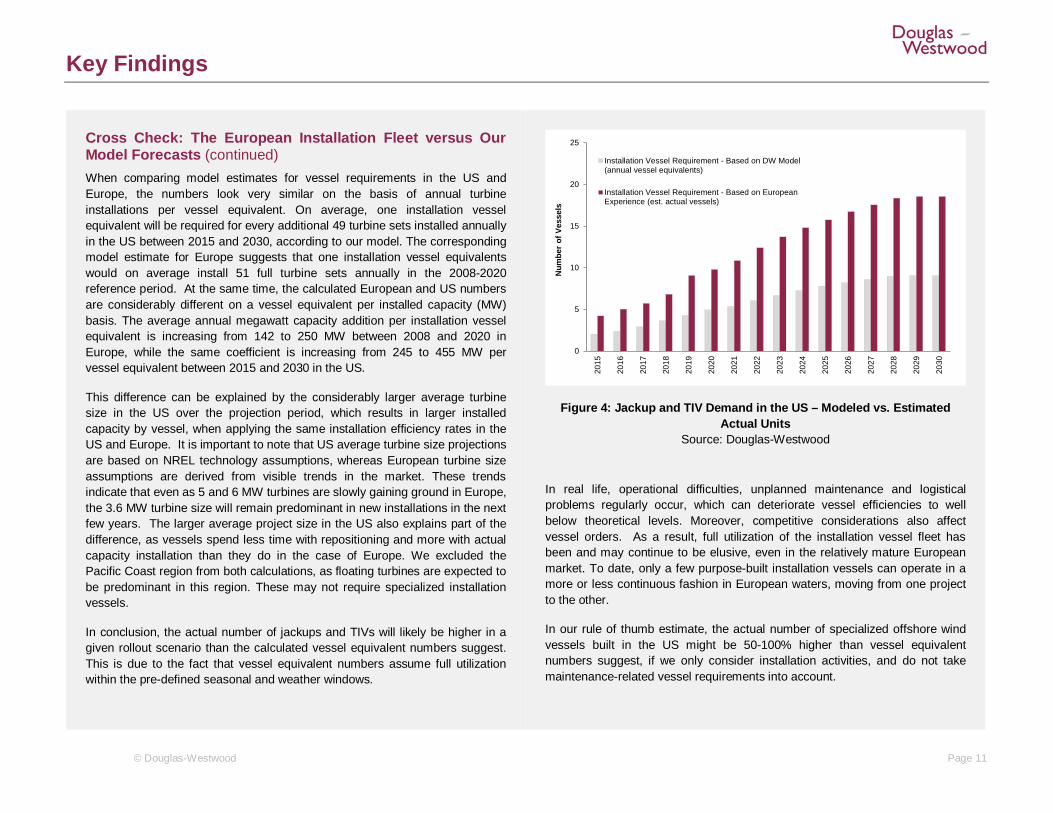
Cross Check: The European Installation Fleet versus Our Model Forecasts (continued) When comparing model estimates for vessel requirements in the US and Europe, the numbers look very similar on the basis of annual turbine installations per vessel equivalent. On average, one installation vessel equivalent will be required for every additional 49 turbine sets installed annually in the US between 2015 and 2030, according to our model. The corresponding model estimate for Europe suggests that one installation vessel equivalents would on average install 51 full turbine sets annually in the 2008-2020 reference period. At the same time, the calculated European and US numbers are considerably different on a vessel equivalent per installed capacity (MW) basis. The average annual megawatt capacity addition per installation vessel equivalent is increasing from 142 to 250 MW between 2008 and 2020 in Europe, while the same coefficient is increasing from 245 to 455 MW per vessel equivalent between 2015 and 2030 in the US.
This difference can be explained by the considerably larger average turbine size in the US over the projection period, which results in larger installed capacity by vessel, when applying the same installation efficiency rates in the US and Europe. It is important to note that US average turbine size projections are based on NREL technology assumptions, whereas European turbine size assumptions are derived from visible trends in the market. These trends indicate that even as 5 and 6 MW turbines are slowly gaining ground in Europe, the 3.6 MW turbine size will remain predominant in new installations in the next few years. The larger average project size in the US also explains part of the difference, as vessels spend less time with repositioning and more with actual capacity installation than they do in the case of Europe. We excluded the Pacific Coast region from both calculations, as floating turbines are expected to be predominant in this region. These may not require specialized installation vessels.
In conclusion, the actual number of jackups and TIVs will likely be higher in a given rollout scenario than the calculated vessel equivalent numbers suggest. This is due to the fact that vessel equivalent numbers assume full utilization within the pre-defined seasonal and weather windows.
Figure 4: Jackup and TIV Demand in the US – Modeled vs. Estimated Actual Units
Source: Douglas-Westwood
In real life, operational difficulties, unplanned maintenance and logistical problems regularly occur, which can deteriorate vessel efficiencies to well below theoretical levels. Moreover, competitive considerations also affect vessel orders. As a result, full utilization of the installation vessel fleet has been and may continue to be elusive, even in the relatively mature European market. To date, only a few purpose-built installation vessels can operate in a more or less continuous fashion in European waters, moving from one project to the other.
In our rule of thumb estimate, the actual number of specialized offshore wind vessels built in the US might be 50-100% higher than vessel equivalent numbers suggest, if we only consider installation activities, and do not take maintenance-related vessel requirements into account.
0
5
10
15
20
25
2015
2016
2017
2018
2019
2020
2021
2022
2023
2024
2025
2026
2027
2028
2029
2030
Num
ber
of V
esse
ls
Installation Vessel Requirement - Based on DW Model(annual vessel equivalents)
Installation Vessel Requirement - Based on EuropeanExperience (est. actual vessels)
Key Findings
© Douglas-Westwood Page 12
Cross Check: The European Installation Fleet versus Our Model Forecasts (continued)
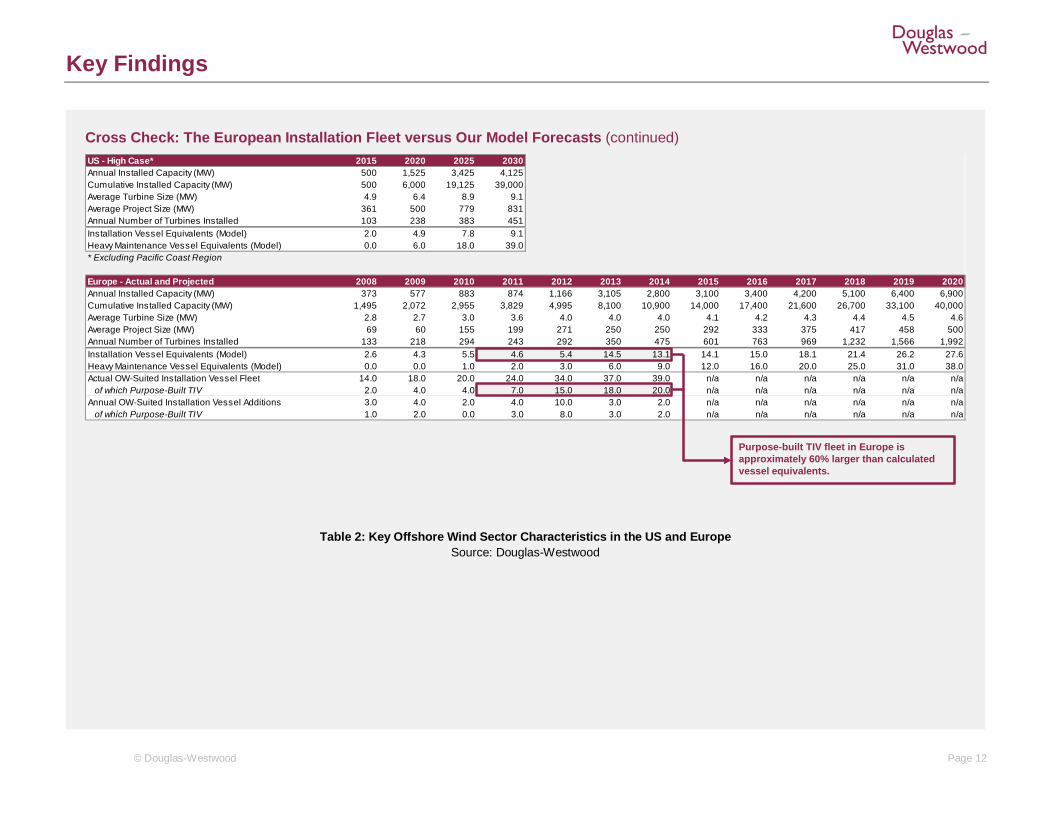
Table 2: Key Offshore Wind Sector Characteristics in the US and Europe Source: Douglas-Westwood
US - High Case* 2015 2020 2025 2030Annual Installed Capacity (MW) 500 1,525 3,425 4,125Cumulative Installed Capacity (MW) 500 6,000 19,125 39,000Average Turbine Size (MW) 4.9 6.4 8.9 9.1Average Project Size (MW) 361 500 779 831Annual Number of Turbines Installed 103 238 383 451Installation Vessel Equivalents (Model) 2.0 4.9 7.8 9.1Heavy Maintenance Vessel Equivalents (Model) 0.0 6.0 18.0 39.0* Excluding Pacific Coast Region
Europe - Actual and Projected 2008 2009 2010 2011 2012 2013 2014 2015 2016 2017 2018 2019 2020Annual Installed Capacity (MW) 373 577 883 874 1,166 3,105 2,800 3,100 3,400 4,200 5,100 6,400 6,900Cumulative Installed Capacity (MW) 1,495 2,072 2,955 3,829 4,995 8,100 10,900 14,000 17,400 21,600 26,700 33,100 40,000Average Turbine Size (MW) 2.8 2.7 3.0 3.6 4.0 4.0 4.0 4.1 4.2 4.3 4.4 4.5 4.6Average Project Size (MW) 69 60 155 199 271 250 250 292 333 375 417 458 500Annual Number of Turbines Installed 133 218 294 243 292 350 475 601 763 969 1,232 1,566 1,992Installation Vessel Equivalents (Model) 2.6 4.3 5.5 4.6 5.4 14.5 13.1 14.1 15.0 18.1 21.4 26.2 27.6Heavy Maintenance Vessel Equivalents (Model) 0.0 0.0 1.0 2.0 3.0 6.0 9.0 12.0 16.0 20.0 25.0 31.0 38.0Actual OW-Suited Installation Vessel Fleet 14.0 18.0 20.0 24.0 34.0 37.0 39.0 n/a n/a n/a n/a n/a n/a
of which Purpose-Built TIV 2.0 4.0 4.0 7.0 15.0 18.0 20.0 n/a n/a n/a n/a n/a n/aAnnual OW-Suited Installation Vessel Additions 3.0 4.0 2.0 4.0 10.0 3.0 2.0 n/a n/a n/a n/a n/a n/a
of which Purpose-Built TIV 1.0 2.0 0.0 3.0 8.0 3.0 2.0 n/a n/a n/a n/a n/a n/a
Purpose-built TIV fleet in Europe is approximately 60% larger than calculated vessel equivalents.
Key Findings
© Douglas-Westwood Page 13
Summary of Findings 1. The conditions leading to the development of a large fleet of dedicated offshore wind turbine installation vessels in Europe are presently absent in the US. Generous feed-in tariff-based support schemes, aggressive renewable energy targets, and a willingness of major utility players to invest in large renewable projects have ensured a steady flow of large-scale offshore wind projects in Northern Europe. This in turn has spurred European ship owners to invest in a new generation of highly sophisticated, purpose-built turbine installation vessels. By contrast, the US system—based heavily on state-level programs and incentives, more lightly capitalized developers, and negotiated power purchase agreements seeking to minimize renewable energy costs—has slowed the development of the US offshore wind industry.
2. The European experience provides critical insights about installation methods and vessel-specific requirements for potential American developers, installers and shipbuilders alike. The construction of offshore wind installations has more or less become a standardized and streamlined process as the industry has matured in Europe. Installation requires the concerted operation of a number of specialized vessel types at various project phases. The European experience informs US expectations, and permits us to define the most important vessel types involved in this process, including their specific technical and operational parameters and critical components, such as jackup legs, dynamic positioning and heave compensation systems, which are essential for efficient installation operations. The average installation rates and costs which European operators were able to achieve, provide a useful reference for prospective US developers and vessel operators alike. (See Chapter 3 for more details on average dayrates by various vessel types and Chapter 8.3 for more details on vessel economics in various installation strategies).
3. The Jones Act is not an insurmountable obstacle, but it will likely increase cost and may cause delays in future US offshore wind projects. The Jones Act does not prevent foreign-flagged vessels from engaging in offshore wind farm construction in US waters, but it does prevent foreign vessels from loading cargo and personnel in US ports and then transporting these to a US offshore wind farm construction site. Therefore, foreign-flagged installation vessels will have to be supported by various Jones Act-compliant feeder barges and other support vessels when operating on US wind farm projects. The Jones Act will not present an insurmountable obstacle to the development of the US offshore wind industry, but it will likely increase costs and delay installation in some cases.
4. A large fleet of advanced construction vessels is available in Europe for contracted work in the US, but the limitations resulting from the Jones Act represent a major obstacle for their deployment overseas. This Report catalogues the vessels available for the construction of offshore wind installations on both sides of the Atlantic. A significant number of installation vessels in Europe could potentially participate in future offshore wind projects in the United States. Some of the established European installation companies are actively investigating US offshore wind market opportunities, but a confluence of factors is holding these companies back at the moment. The most important obstacles are excess demand for vessels in Europe, the lack of a visible US project flow, and the operational difficulties imposed by the Jones Act.
Key Findings
© Douglas-Westwood Page 14
5. US shipyards lack the experience in building specialized turbine installation vessels and could only build them at a significant cost premium over more competitive Asian shipyards. US shipyards are aware of the potential that lies in offshore wind turbine installation. Most of the major yards have tracked the industry for years. However, US shipbuilders have no experience in building advanced, purpose-built turbine installation vessels (TIVs). In all likelihood, these yards will be capable of constructing such vessels in the future, should the need arise, but they can only do so at a high cost premium compared to Asian yards. Estimates vary, but a US-built TIV would likely cost 60% to 200% more than a comparable vessel built in an Asian shipyard. This cost premium would likely be reflected in expected dayrates as well, thereby burdening the economics of future US offshore wind projects with an incremental cost of about $20-40 million per 100 turbines installed, roughly $50,000 per MW of installed capacity, or 0.2 cents per kWh.
6. The offshore wind turbine installation fleet will evolve gradually from lower cost, more basic vessels to larger, more expensive and sophisticated ones. More basic solutions will likely dominate in the initial phases of development, mainly relying on the modest fleet of existing US vessels over the course of the first few projects. These vessels have only limited capabilities, both in terms of deck space and lifting capacity. The long mobilization time and the higher dayrates of advanced European TIVs make the use of these vessels in US offshore wind projects a distinctly high-cost proposition, even before considering the difficulties resulting from the Jones Act. Nevertheless, these will be used if US solutions are unavailable. Over time, as the US industry evolves, the European experience suggests that US vessel owners will have an incentive to construct their own fleet, which will grow more complex and sophisticated as the flow of projects becomes larger and more predictable. (See Chapter 8.3 for more details on vessel economics in various installation strategies).
7. Long-term vessel demand appears manageable, even in the most aggressive rollout scenario. The results of our modeling exercise indicate that the projected demand for various vessel types associated with the construction and maintenance of offshore wind installations can be met by a number of means, including US newbuilds, use of contracted European vessels, and reliance on non-specialized US vessels. Our model suggests that the US turbine installation vessel fleet would have to grow progressively and reach a total of 9-10 vessel equivalents by 2030 to achieve the 54 GW of installed capacity foreseen in the High Growth scenario. This 9-10 vessel equivalents will likely mean more actual vessels in practice (see Box 1). Notwithstanding, even the most aggressive expansion of US offshore wind will require only about one specialized installation vessel equivalent be constructed per year, not a large number by any standard. To the extent these will be newbuild units constructed in the US, the economic benefits will likely be concentrated around Gulf Coast shipyards located in the coastal areas between Florida and Texas. Supply chain benefits related to vessel kitting, local services and O&M support will be distributed more evenly among US offshore wind regions.
Key Findings
© Douglas-Westwood Page 15
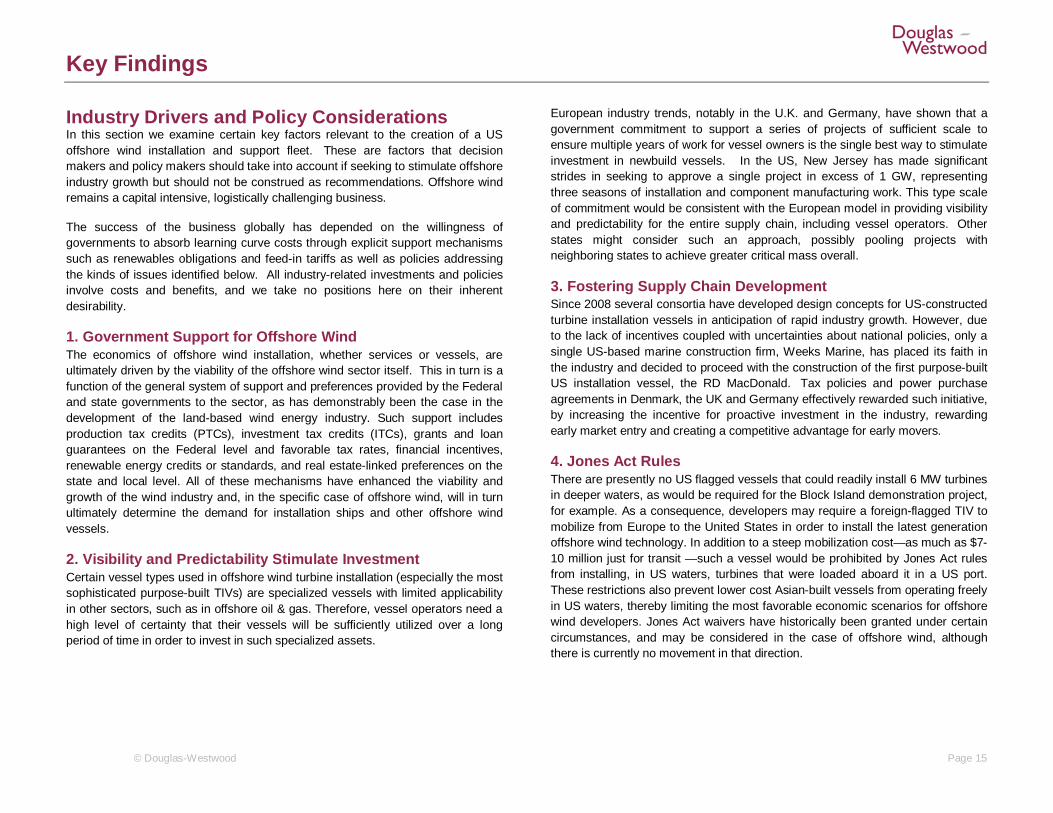
Industry Drivers and Policy Considerations In this section we examine certain key factors relevant to the creation of a US offshore wind installation and support fleet. These are factors that decision makers and policy makers should take into account if seeking to stimulate offshore industry growth but should not be construed as recommendations. Offshore wind remains a capital intensive, logistically challenging business.
The success of the business globally has depended on the willingness of governments to absorb learning curve costs through explicit support mechanisms such as renewables obligations and feed-in tariffs as well as policies addressing the kinds of issues identified below. All industry-related investments and policies involve costs and benefits, and we take no positions here on their inherent desirability.
1. Government Support for Offshore Wind The economics of offshore wind installation, whether services or vessels, are ultimately driven by the viability of the offshore wind sector itself. This in turn is a function of the general system of support and preferences provided by the Federal and state governments to the sector, as has demonstrably been the case in the development of the land-based wind energy industry. Such support includes production tax credits (PTCs), investment tax credits (ITCs), grants and loan guarantees on the Federal level and favorable tax rates, financial incentives, renewable energy credits or standards, and real estate-linked preferences on the state and local level. All of these mechanisms have enhanced the viability and growth of the wind industry and, in the specific case of offshore wind, will in turn ultimately determine the demand for installation ships and other offshore wind vessels.
2. Visibility and Predictability Stimulate Investment Certain vessel types used in offshore wind turbine installation (especially the most sophisticated purpose-built TIVs) are specialized vessels with limited applicability in other sectors, such as in offshore oil & gas. Therefore, vessel operators need a high level of certainty that their vessels will be sufficiently utilized over a long period of time in order to invest in such specialized assets.
European industry trends, notably in the U.K. and Germany, have shown that a government commitment to support a series of projects of sufficient scale to ensure multiple years of work for vessel owners is the single best way to stimulate investment in newbuild vessels. In the US, New Jersey has made significant strides in seeking to approve a single project in excess of 1 GW, representing three seasons of installation and component manufacturing work. This type scale of commitment would be consistent with the European model in providing visibility and predictability for the entire supply chain, including vessel operators. Other states might consider such an approach, possibly pooling projects with neighboring states to achieve greater critical mass overall.
3. Fostering Supply Chain Development Since 2008 several consortia have developed design concepts for US-constructed turbine installation vessels in anticipation of rapid industry growth. However, due to the lack of incentives coupled with uncertainties about national policies, only a single US-based marine construction firm, Weeks Marine, has placed its faith in the industry and decided to proceed with the construction of the first purpose-built US installation vessel, the RD MacDonald. Tax policies and power purchase agreements in Denmark, the UK and Germany effectively rewarded such initiative, by increasing the incentive for proactive investment in the industry, rewarding early market entry and creating a competitive advantage for early movers.
4. Jones Act Rules There are presently no US flagged vessels that could readily install 6 MW turbines in deeper waters, as would be required for the Block Island demonstration project, for example. As a consequence, developers may require a foreign-flagged TIV to mobilize from Europe to the United States in order to install the latest generation offshore wind technology. In addition to a steep mobilization cost—as much as $7-10 million just for transit —such a vessel would be prohibited by Jones Act rules from installing, in US waters, turbines that were loaded aboard it in a US port. These restrictions also prevent lower cost Asian-built vessels from operating freely in US waters, thereby limiting the most favorable economic scenarios for offshore wind developers. Jones Act waivers have historically been granted under certain circumstances, and may be considered in the case of offshore wind, although there is currently no movement in that direction.
Key Findings
© Douglas-Westwood Page 16
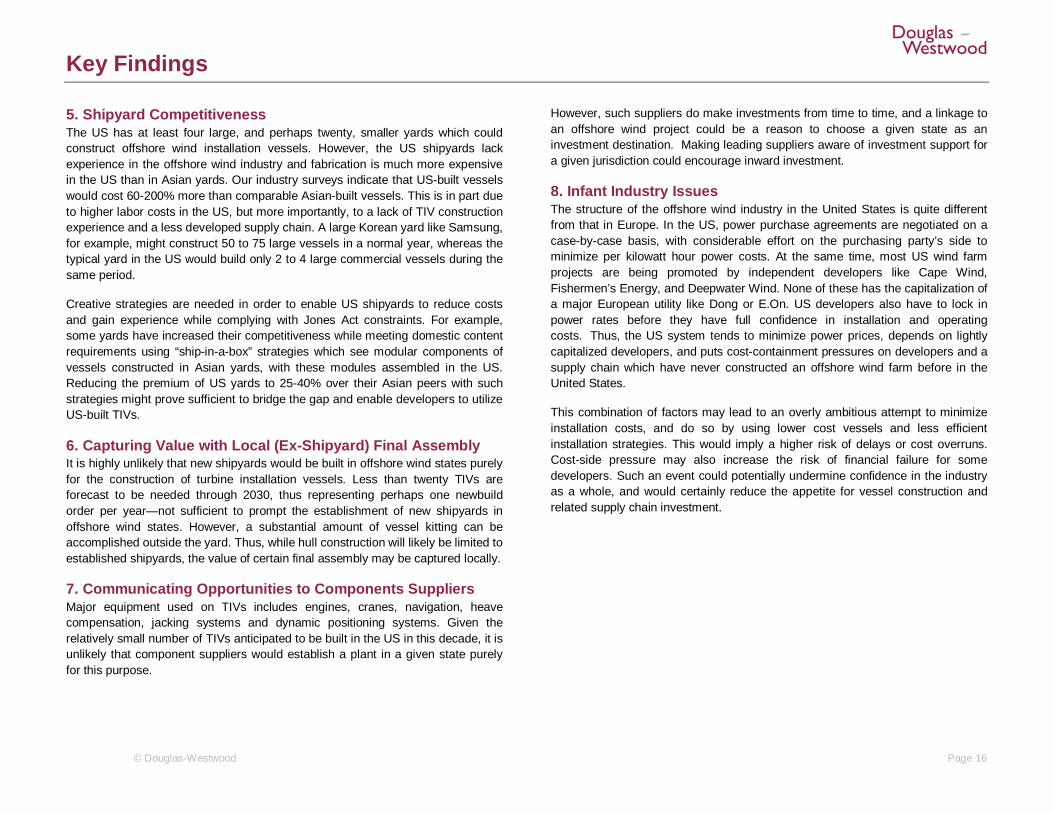
5. Shipyard Competitiveness The US has at least four large, and perhaps twenty, smaller yards which could construct offshore wind installation vessels. However, the US shipyards lack experience in the offshore wind industry and fabrication is much more expensive in the US than in Asian yards. Our industry surveys indicate that US-built vessels would cost 60-200% more than comparable Asian-built vessels. This is in part due to higher labor costs in the US, but more importantly, to a lack of TIV construction experience and a less developed supply chain. A large Korean yard like Samsung, for example, might construct 50 to 75 large vessels in a normal year, whereas the typical yard in the US would build only 2 to 4 large commercial vessels during the same period.
Creative strategies are needed in order to enable US shipyards to reduce costs and gain experience while complying with Jones Act constraints. For example, some yards have increased their competitiveness while meeting domestic content requirements using “ship-in-a-box” strategies which see modular components of vessels constructed in Asian yards, with these modules assembled in the US. Reducing the premium of US yards to 25-40% over their Asian peers with such strategies might prove sufficient to bridge the gap and enable developers to utilize US-built TIVs.
6. Capturing Value with Local (Ex-Shipyard) Final Assembly It is highly unlikely that new shipyards would be built in offshore wind states purely for the construction of turbine installation vessels. Less than twenty TIVs are forecast to be needed through 2030, thus representing perhaps one newbuild order per year—not sufficient to prompt the establishment of new shipyards in offshore wind states. However, a substantial amount of vessel kitting can be accomplished outside the yard. Thus, while hull construction will likely be limited to established shipyards, the value of certain final assembly may be captured locally.
7. Communicating Opportunities to Components Suppliers Major equipment used on TIVs includes engines, cranes, navigation, heave compensation, jacking systems and dynamic positioning systems. Given the relatively small number of TIVs anticipated to be built in the US in this decade, it is unlikely that component suppliers would establish a plant in a given state purely for this purpose.
However, such suppliers do make investments from time to time, and a linkage to an offshore wind project could be a reason to choose a given state as an investment destination. Making leading suppliers aware of investment support for a given jurisdiction could encourage inward investment.
8. Infant Industry Issues The structure of the offshore wind industry in the United States is quite different from that in Europe. In the US, power purchase agreements are negotiated on a case-by-case basis, with considerable effort on the purchasing party’s side to minimize per kilowatt hour power costs. At the same time, most US wind farm projects are being promoted by independent developers like Cape Wind, Fishermen’s Energy, and Deepwater Wind. None of these has the capitalization of a major European utility like Dong or E.On. US developers also have to lock in power rates before they have full confidence in installation and operating costs. Thus, the US system tends to minimize power prices, depends on lightly capitalized developers, and puts cost-containment pressures on developers and a supply chain which have never constructed an offshore wind farm before in the United States.
This combination of factors may lead to an overly ambitious attempt to minimize installation costs, and do so by using lower cost vessels and less efficient installation strategies. This would imply a higher risk of delays or cost overruns. Cost-side pressure may also increase the risk of financial failure for some developers. Such an event could potentially undermine confidence in the industry as a whole, and would certainly reduce the appetite for vessel construction and related supply chain investment.
Key Findings
© Douglas-Westwood Page 17
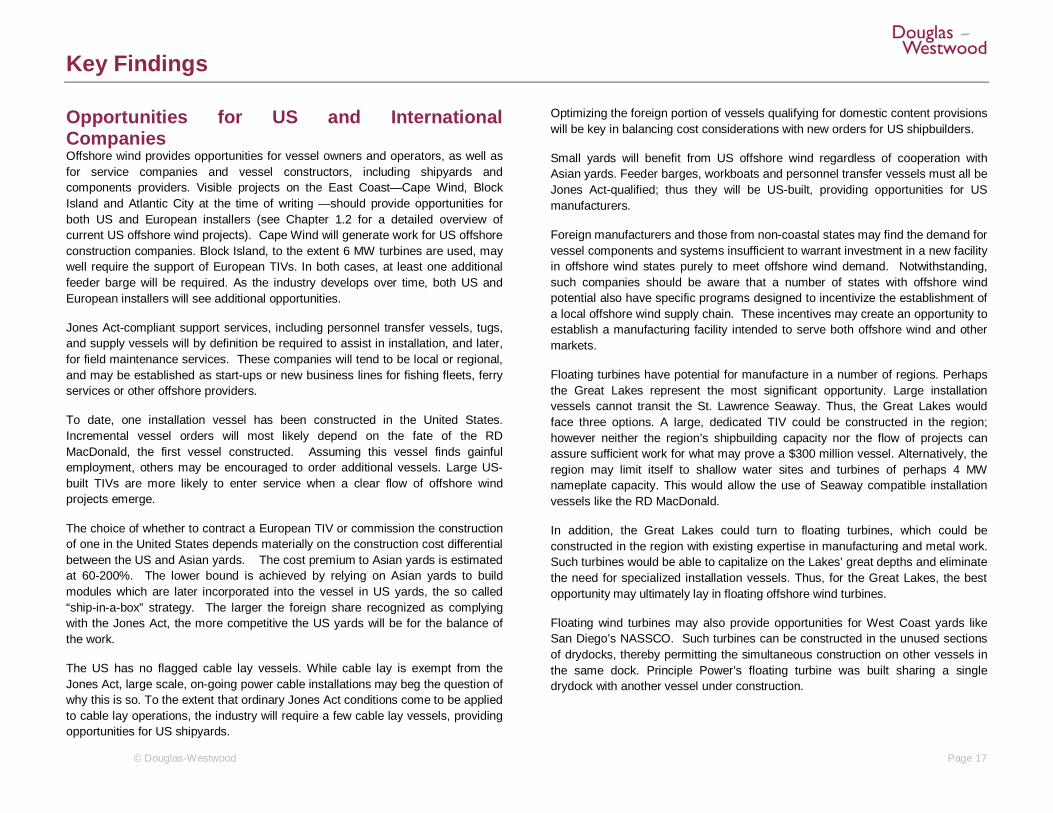
Opportunities for US and International Companies Offshore wind provides opportunities for vessel owners and operators, as well as for service companies and vessel constructors, including shipyards and components providers. Visible projects on the East Coast—Cape Wind, Block Island and Atlantic City at the time of writing —should provide opportunities for both US and European installers (see Chapter 1.2 for a detailed overview of current US offshore wind projects). Cape Wind will generate work for US offshore construction companies. Block Island, to the extent 6 MW turbines are used, may well require the support of European TIVs. In both cases, at least one additional feeder barge will be required. As the industry develops over time, both US and European installers will see additional opportunities.
Jones Act-compliant support services, including personnel transfer vessels, tugs, and supply vessels will by definition be required to assist in installation, and later, for field maintenance services. These companies will tend to be local or regional, and may be established as start-ups or new business lines for fishing fleets, ferry services or other offshore providers.
To date, one installation vessel has been constructed in the United States. Incremental vessel orders will most likely depend on the fate of the RD MacDonald, the first vessel constructed. Assuming this vessel finds gainful employment, others may be encouraged to order additional vessels. Large US-built TIVs are more likely to enter service when a clear flow of offshore wind projects emerge.
The choice of whether to contract a European TIV or commission the construction of one in the United States depends materially on the construction cost differential between the US and Asian yards. The cost premium to Asian yards is estimated at 60-200%. The lower bound is achieved by relying on Asian yards to build modules which are later incorporated into the vessel in US yards, the so called “ship-in-a-box” strategy. The larger the foreign share recognized as complying with the Jones Act, the more competitive the US yards will be for the balance of the work.
The US has no flagged cable lay vessels. While cable lay is exempt from the Jones Act, large scale, on-going power cable installations may beg the question of why this is so. To the extent that ordinary Jones Act conditions come to be applied to cable lay operations, the industry will require a few cable lay vessels, providing opportunities for US shipyards.
Optimizing the foreign portion of vessels qualifying for domestic content provisions will be key in balancing cost considerations with new orders for US shipbuilders.
Small yards will benefit from US offshore wind regardless of cooperation with Asian yards. Feeder barges, workboats and personnel transfer vessels must all be Jones Act-qualified; thus they will be US-built, providing opportunities for US manufacturers.
Foreign manufacturers and those from non-coastal states may find the demand for vessel components and systems insufficient to warrant investment in a new facility in offshore wind states purely to meet offshore wind demand. Notwithstanding, such companies should be aware that a number of states with offshore wind potential also have specific programs designed to incentivize the establishment of a local offshore wind supply chain. These incentives may create an opportunity to establish a manufacturing facility intended to serve both offshore wind and other markets.
Floating turbines have potential for manufacture in a number of regions. Perhaps the Great Lakes represent the most significant opportunity. Large installation vessels cannot transit the St. Lawrence Seaway. Thus, the Great Lakes would face three options. A large, dedicated TIV could be constructed in the region; however neither the region’s shipbuilding capacity nor the flow of projects can assure sufficient work for what may prove a $300 million vessel. Alternatively, the region may limit itself to shallow water sites and turbines of perhaps 4 MW nameplate capacity. This would allow the use of Seaway compatible installation vessels like the RD MacDonald.
In addition, the Great Lakes could turn to floating turbines, which could be constructed in the region with existing expertise in manufacturing and metal work. Such turbines would be able to capitalize on the Lakes’ great depths and eliminate the need for specialized installation vessels. Thus, for the Great Lakes, the best opportunity may ultimately lay in floating offshore wind turbines.
Floating wind turbines may also provide opportunities for West Coast yards like San Diego’s NASSCO. Such turbines can be constructed in the unused sections of drydocks, thereby permitting the simultaneous construction on other vessels in the same dock. Principle Power’s floating turbine was built sharing a single drydock with another vessel under construction.
Key Findings
© Douglas-Westwood Page 18
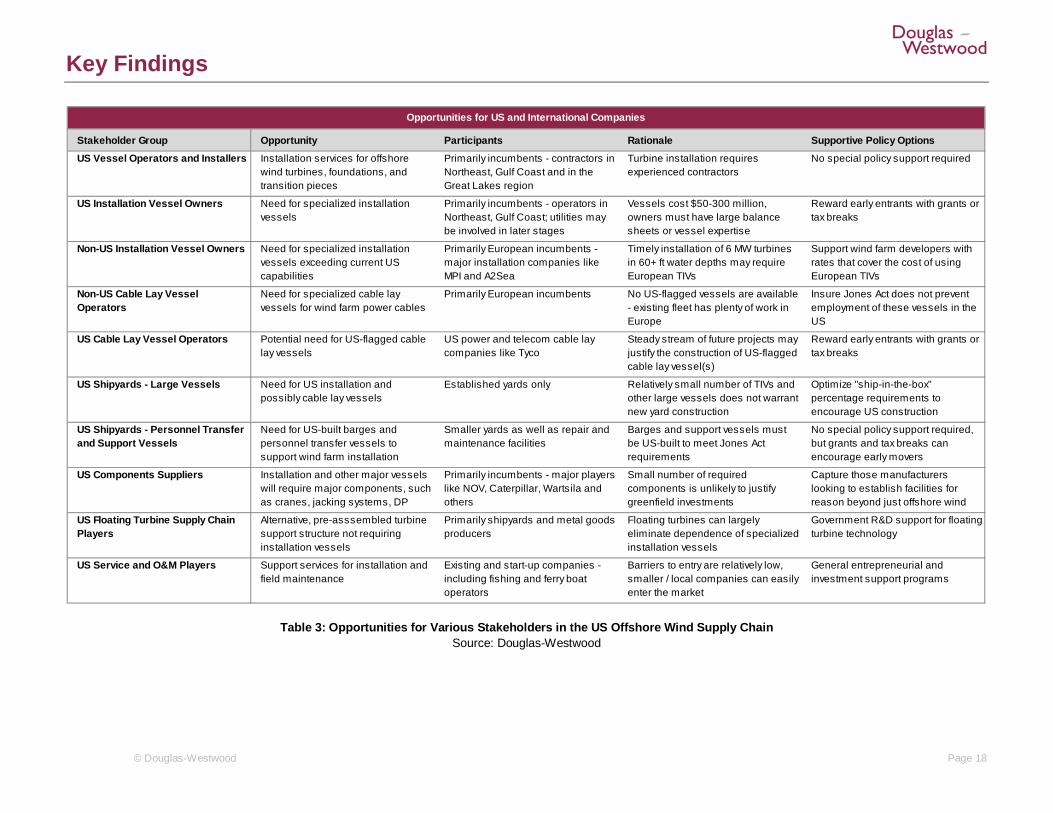
Table 3: Opportunities for Various Stakeholders in the US Offshore Wind Supply Chain Source: Douglas-Westwood
Stakeholder Group Opportunity Participants Rationale Supportive Policy Options
US Vessel Operators and Installers Installation services for offshore wind turbines, foundations, and transition pieces
Primarily incumbents - contractors in Northeast, Gulf Coast and in the Great Lakes region
Turbine installation requires experienced contractors
No special policy support required
US Installation Vessel Owners Need for specialized installation vessels
Primarily incumbents - operators in Northeast, Gulf Coast; utilities may be involved in later stages
Vessels cost $50-300 million, owners must have large balance sheets or vessel expertise
Reward early entrants with grants or tax breaks
Non-US Installation Vessel Owners Need for specialized installation vessels exceeding current US capabilities
Primarily European incumbents - major installation companies like MPI and A2Sea
Timely installation of 6 MW turbines in 60+ ft water depths may require European TIVs
Support wind farm developers with rates that cover the cost of using European TIVs
Non-US Cable Lay Vessel Operators
Need for specialized cable lay vessels for wind farm power cables
Primarily European incumbents No US-flagged vessels are available - existing fleet has plenty of work in Europe
Insure Jones Act does not prevent employment of these vessels in the US
US Cable Lay Vessel Operators Potential need for US-flagged cable lay vessels
US power and telecom cable lay companies like Tyco
Steady stream of future projects may justify the construction of US-flagged cable lay vessel(s)
Reward early entrants with grants or tax breaks
US Shipyards - Large Vessels Need for US installation and possibly cable lay vessels
Established yards only Relatively small number of TIVs and other large vessels does not warrant new yard construction
Optimize "ship-in-the-box" percentage requirements to encourage US construction
US Shipyards - Personnel Transfer and Support Vessels
Need for US-built barges and personnel transfer vessels to support wind farm installation
Smaller yards as well as repair and maintenance facilities
Barges and support vessels must be US-built to meet Jones Act requirements
No special policy support required, but grants and tax breaks can encourage early movers
US Components Suppliers Installation and other major vessels will require major components, such as cranes, jacking systems, DP
Primarily incumbents - major players like NOV, Caterpillar, Wartsila and others
Small number of required components is unlikely to justify greenfield investments
Capture those manufacturers looking to establish facilities for reason beyond just offshore wind
US Floating Turbine Supply Chain Players
Alternative, pre-asssembled turbine support structure not requiring installation vessels
Primarily shipyards and metal goods producers
Floating turbines can largely eliminate dependence of specialized installation vessels
Government R&D support for floating turbine technology
US Service and O&M Players Support services for installation and field maintenance
Existing and start-up companies - including fishing and ferry boat operators
Barriers to entry are relatively low, smaller / local companies can easily enter the market
General entrepreneurial and investment support programs
Opportunities for US and International Companies
Key Findings
© Douglas-Westwood Page 19
US Offshore Wind Development Scorecard
Env
ironm
enta
l Sur
vey
Ves
sels
Geo
phys
ical
Sur
vey
Ves
sels
Geo
tech
nica
l Sur
vey
Ves
sels
Inst
alla
tion
Ves
sels
Hea
vy L
ift V
esse
ls
Cab
le L
ay B
arge
s(n
ear-s
hore
)
Cab
le L
ay V
esse
ls(o
pen
ocea
n)
Tugs
Feed
er B
arge
s /
Jack
up B
arge
s
Gen
eric
Bar
ges
/ O
ffsho
re S
uppl
y V
esse
ls
Per
sonn
el T
rans
fer V
esse
ls
Hea
vy M
aint
enan
ce V
esse
ls
Per
sonn
el T
rans
fer V
esse
ls
Atlantic Coast
Great Lakes
Gulf Coast
Pacific Coast
No vessels available meeting Jones Act requirements
Vessels in short supply, but available on global market
Work around with existing vessels feasible
Vessels readily available
2013
Legend
US Offshore Wind Development ScorecardVessel-Related Aspects
Pre-ConstructionPhase
ConstructionPhase
Post-ConstructionPhase
Survey VesselAvailability
Construction VesselAvailability
Support VesselAvailability
O&M Vessel Availability
Key Findings
© Douglas-Westwood Page 20
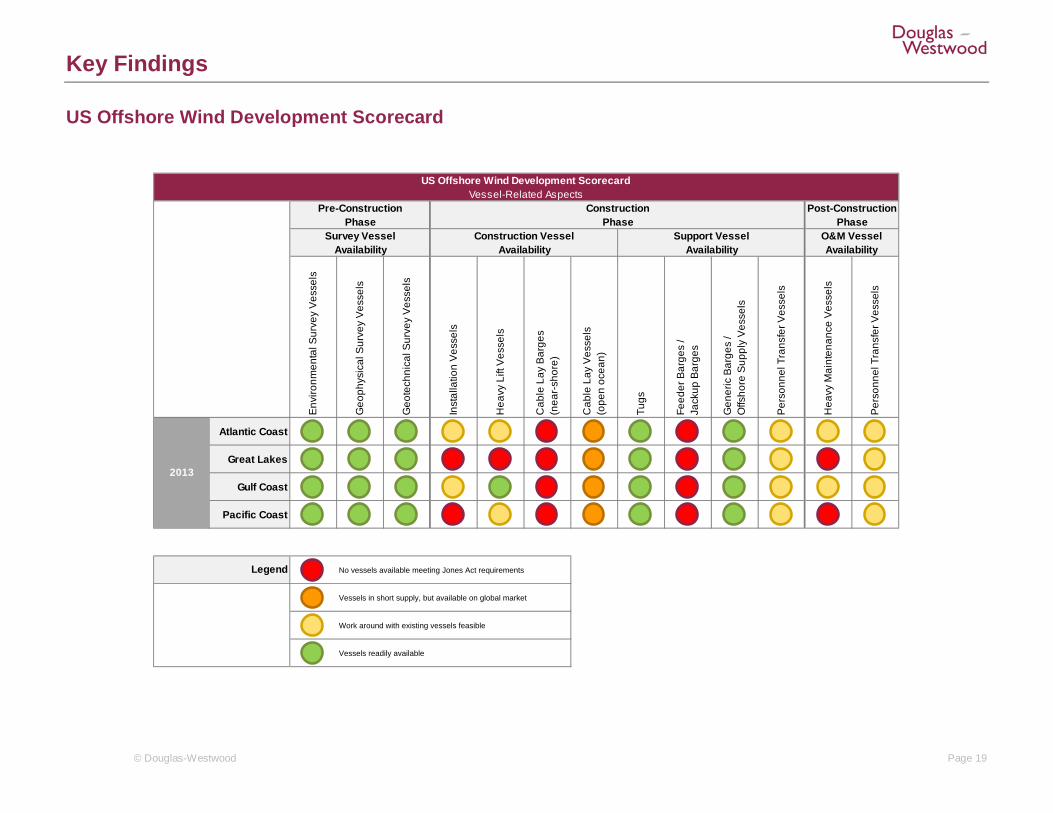
The scorecard above provides a snapshot of our most important findings related to the current availability of various vessel types along the offshore wind supply chain in the four potential US offshore wind regions. The scorecard is intended to highlight key bottlenecks, which can potentially hinder the development the US offshore wind industry, and to track progress towards the elimination of these obstacles on a regular basis.
Survey Vessels The availability of survey vessels will be primarily a function of scheduling and price, neither of which should pose a material obstacle to the development of the offshore wind industry in the US. Survey vessels are assumed to be widely available across the US, as these vessels are used for a wide range of activities, including for scientific and naval research as well as for seismic studies for the offshore oil and gas industry.
Environmental surveys and relatively unsophisticated bathymetric analysis, the assessment of water depth and seabed conditions, can be completed by various vessel types equipped with sensors or by autonomous underwater vehicles (AUVs). Such sensors and AUVs are comparatively affordable and readily available on the market. Geophysical surveys encompassing seismic surveys of the seabed can be conducted by the US geophysical fleet, which is primarily employed in the oil and gas sector. Geotechnical surveys involving core samples can also be accomplished using any kind of fixed platforms with drilling equipment welded to the deck. Core sampling is routinely conducted in coastal waters for projects like bridge or dock construction, and the existing fleet could, in all likelihood, be augmented by the jackup drilling fleet in the Gulf of Mexico, part of which is currently stacked and idle.
Construction Vessels The most problematic areas in the offshore wind supply chain lie in the construction vessel category. Offshore wind farm construction is carried out by a number of specialized vessel types, which either have to be built domestically or contracted from the global marketplace, once offshore wind development reaches a meaningful scale in the US.
The critical shortage in US vessel capabilities lies in the installation vessel category, particularly in turbine installation vessels. Today, the US has only one dedicated turbine installation vessel, the RD MacDonald, which has relatively modest capabilities and was only partially completed as of mid-2013. The Atlantic Coast and Gulf Coast regions have a certain degree of access to installation solutions, which can be suitable in the early stages of offshore wind development. The RD MacDonald was primarily designed to serve the Atlantic Coast and the Great Lakes regions. Additionally, the Atlantic Coast is the best-positioned to mobilize European installation vessels, if it becomes necessary. This would likely entail extra costs and operational difficulties arising from Jones Act restrictions. The Gulf Coast region has a large fleet of offshore installation vessels, primarily serving the oil and gas industry. Improvised installation solutions based on the existing fleet, such as retooled jackup barges or heavy lift vessels, will likely be able to meet some or all of the installation vessel demand in the Gulf Coast region, which is projected to be relatively modest in any scenario. Vessel access to the Great Lakes is limited by the size of the locks along the St Lawrence Seaway system. The region will therefore have to rely on smaller installation vessels and turbine sizes, or develop its own installation vessel fleet. Both solutions can prove challenging for project economics. In the Pacific Coast, only floating platform solutions appear feasible on a commercial scale. These can be assembled in a port and floated to the installation site using tugboats. In this case, the challenges related to the availability of installation vessels do not apply. However, certain floating platform designs may require specialized installation vessels, such as the PelaStar support barge, which was developed specifically for the installation of the PelaStar tension leg platform (see Chapter 9.6).
The Atlantic Coast, the Gulf Coast and the Pacific Coast regions have varying degree of ready access to heavy lift vessels. A large number of heavy lift vessels are serving the offshore oil & gas industry in the Gulf of Mexico, these vessels can also be deployed to offshore wind-related installation projects both in the Gulf Coast and in the Atlantic Coast. The Pacific Coast region appears to be amply served by the region’s own heavy lift vessel fleet, which can be deployed to offshore wind projects as well. Heavy lift vessel access to the Great Lakes system is problematic due to the size limitations along the St. Lawrence Seaway. This means that the region will either have to use smaller substations, which can be lifted with “Seawaymax” sized heavy lift vessels, or build a large heavy lift vessel that will most likely be “locked in” to the Great Lakes system.
Key Findings
© Douglas-Westwood Page 21
There are no US-flagged cable lay vessels in operation today. Foreign-flagged cable-lay are generally available in the global marketplace, although cable-lay capacity is increasingly tight, which may cause bottlenecks in offshore wind construction projects in the future. Cable-lay barges are used in shallow waters near the shore, where large cable-lay vessels are not practicable. These tend to be smaller, domestic-built vessels. Such cable-lay barges are currently not available in the US, but existing barges could be adapted without great difficulty.
Service Vessels Service vessels will have to US-built and US crewed due to Jones Act requirements. Tugs, non-fixed barges and improvised personnel transfer vessel (PTV) solutions are readily available. Jackup barges will be needed for offshore wind construction; more optimized PTV solutions will likely develop over time.
Tugs are readily available in the US and they will be used in other applications when not employed in offshore wind work. As a result, there will be no exclusive offshore wind tug fleet in the US.
To the extent the turbine installation vessels remain in the field, they must be supported by feeder barges which ferry turbine components from the staging port to the wind farm site. Turbine manufacturers require that these vessels be stabilized prior to the removal of turbine components. This may be accomplished by using a jackup barge. There are currently no suitable jackup barges in the US, thus at least one would likely be required prior to the inception of any offshore wind projects. We anticipate that such barges will be constructed in timely fashion to support US wind industry. The transport of most foundation types does not require fixed barges. Such non-fixed vessels are readily available in the US.
A wide range of vessel types can be applied as PTVs, including some of the current fishing fleet and even certain pleasure craft. We assume that personnel and supply vessels of some sort will be available for offshore wind-related operations in the US. Initially, these will most likely be general purpose or multiuse vessels enlisted to support offshore projects. As the offshore wind industry matures in the US, purpose-built vessels optimized for wind installation are likely to emerge.
Operation & Maintenance Vessels O&M vessels will have to US-built and US crewed due to Jones Act requirements. Retired installation vessels will most likely be used for heavy maintenance work over time; improvised PTVs are readily available and will increasingly specialize over time.
Wind farms will require access to maintenance vessels with the ability to replace heavier components, such as turbine blades. No such vessels exist today in the US; during the first several years of project deployment, existing wind farms will most likely turn to the installation vessel fleet when major maintenance must be conducted on operating turbines. As a result, the same regional characteristics apply to heavy maintenance vessels as in the case of installation vessels. Later on, as economies of scale are attained, a dedicated maintenance fleet is likely to emerge. Lower spec early generation installation vessels may be retired to maintenance duty over time, as larger and more capable vessels displace them from construction projects. We assume that maintenance vessels will be available as needed, with the caveat that installation vessels may play this role for some time.
PTVs used during the O&M phase are the same type of vessels used for construction support. PTVs are used to transport maintenance crews to the wind farm site for planned maintenance operations and to carry out smaller repairs. A wide range of vessel types can be applied as PTVs for offshore wind O&M support. Initially, these will likely be general purpose or multiuse vessels. As the offshore wind industry matures in the US, purpose-built PTVs optimized for offshore wind operations will likely appear.


