Assessment of Tropical Cyclone Induced … of Tropical Cyclone Induced Transgression of the...
9
Assessment of Tropical Cyclone Induced Transgression of the Chandeleur Islands for Restoration and Wildlife Management B.S. Mitchell, R.R. Reahard, A.M. Billiot, T.J. Brown, and L.M. Childs NASA DEVELOP Program, Stennis Space Center, MS 39529 .Abstract-The Chandeleur Islands are the first line of defense against tropical storms and hurricanes for coastal Louisiana. They provide habitats for birds species and are a wildlife refuge; however, distressingly, they are eroding and transgressing at an alarming rate. In 1998, Hurricane Georges caused severe damage to the chain, prompting restoration and monitoring efforts by both Federal and State agencies. Since then, storm events have steadily diminished the condition of the islands. Quantification of shoreline erosion, vegetation, and land loss, from 1979 to 2009, was achieved through the analysis of imagery from Landsat 2-4 Multispectral Scanner, Landsat 4 & 5 Thematic Mapper, and Advanced Spaceborne Thermal Emission and Reflection Radiometer sensors. QuickBird imagery was used to validate the accuracy of these results. In addition, this study presents an application of Moderate Resolution Imaging Spectroradiometer data to assist in tracking the transgression of the Chandeleur Islands. The use of near infrared reflectance calculated from MOD09 surface reflectance data from 2000 to 2009 was analyzed using the Time Series Product Tool. The scope of this project includes not only assessments of the tropical cyclonic events during this time period, but also the effects of tides, winds, and cold fronts on the spatial extent of the islands. Partnering organizations, such as the Pontchartrain Institute for Environmental Research, will utilize those results in an effort to better monitor and address the continual change of the island chain. I. INTRODUCTION A. Shish Area The Chandeleur Islands are located south-southeast of St. Bernard Parish, Louisiana (Fig. 1). They began as a long island that has since been segmented into several islets covering 80 km. The Chandeleurs were formed over 2,000 years ago and are uninhabited [1]. Dozens of hurricanes and other severe storms have fragmented these islands, resulting in severe erosion of the island chain's land mass over time. The islands serve as a migratory stop for birds, provide habitat for nesting bird species, and are part of the second oldest National GVildlife Refuge in the United States. The Chandeleur Islands are a diverse landscape, composed of beaches, dunes, and marshes. The northern portion of the islands is dominated by beaches that have multiple bars and washover fans that are separated by dune fields. The dunes are vegetated by grasses and shrubs that grade into a high salt marsh, also populated by black mangroves. The southern portion of the islands is more narrow and lower in elevation than the northern portion, leading to shoals separated by tidal inlets and small island fragments. To the west over the St. Bernard Delta surface, the Chandeleur Islands are rapidly transgressing. The long-term Gulf shoreline erosion rates estimate a minimum 2 m/yr loss in the north-central portion and greater than 12 m/yr loss at the northern and southern ends of the islands [2]. The deterioration of the islands is caused not only by the frequency of Gulf storms but also by the subsidence of the St. Bernard Delta sediments and Fig. I study area. absence of a rejuvenating sediment supply. There have also been sea floor landslides, which may have caused stronger waves and greater erosional impact to the Chandeleur Islands as well. [3]. Over the past decade, tropical cyclones have decimated the Chandeleur Islands, destroying pre-existin g vegetation, ruining habitats, and eroding the shoreline. In 2004, when Hurricane Ivan passed approximately 95 kilometers east of the islands, it destroyed the restoration progress of the Chandeleur Islands. Almost all of the vegetation on the islands was lost and the washover charnels increased in number from 20 to over 100. The 2005 hurricane season further delayed any rebuilding progress that could have been made in the islands. Hurricanes Dennis, Katrina, Cindy, and Rita all occurred during the 2005 hurricane season, resulting in severe damage to the islands. In particular. Hurricanes Dennis and Katrina reduced and redistributed many terrestrial parts of the islands into sub-surface formations and shoals. Katrina also caused a severe amount of overwash, and consequently all of the plantin g sites created during previous restoration efforts became open water [3]. Y 1 .4 0 fhan M a ,WR W, https://ntrs.nasa.gov/search.jsp?R=20100021175 2018-07-15T08:17:36+00:00Z
Transcript of Assessment of Tropical Cyclone Induced … of Tropical Cyclone Induced Transgression of the...
Assessment of Tropical Cyclone InducedTransgression of the Chandeleur Islands for
Restoration and Wildlife ManagementB.S. Mitchell, R.R. Reahard, A.M. Billiot, T.J. Brown, and L.M. Childs
NASA DEVELOP Program, Stennis Space Center, MS 39529
.Abstract-The Chandeleur Islands are the first line of defense against tropical storms and hurricanes for coastal Louisiana. Theyprovide habitats for birds species and are a wildlife refuge; however, distressingly, they are eroding and transgressing at an alarmingrate. In 1998, Hurricane Georges caused severe damage to the chain, prompting restoration and monitoring efforts by both Federal andState agencies. Since then, storm events have steadily diminished the condition of the islands. Quantification of shoreline erosion,vegetation, and land loss, from 1979 to 2009, was achieved through the analysis of imagery from Landsat 2-4 Multispectral Scanner,Landsat 4 & 5 Thematic Mapper, and Advanced Spaceborne Thermal Emission and Reflection Radiometer sensors. QuickBird imagerywas used to validate the accuracy of these results. In addition, this study presents an application of Moderate Resolution ImagingSpectroradiometer data to assist in tracking the transgression of the Chandeleur Islands. The use of near infrared reflectancecalculated from MOD09 surface reflectance data from 2000 to 2009 was analyzed using the Time Series Product Tool. The scope of thisproject includes not only assessments of the tropical cyclonic events during this time period, but also the effects of tides, winds, and coldfronts on the spatial extent of the islands. Partnering organizations, such as the Pontchartrain Institute for Environmental Research,will utilize those results in an effort to better monitor and address the continual change of the island chain.
I. INTRODUCTION
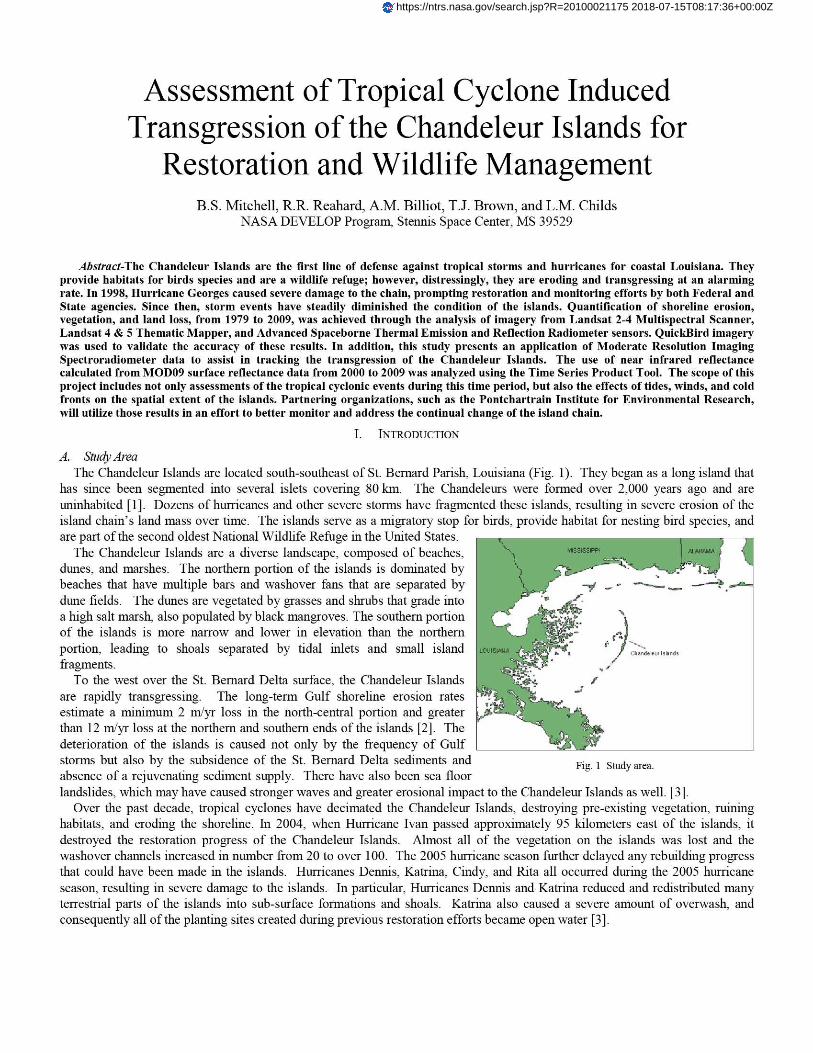
A. Shish AreaThe Chandeleur Islands are located south-southeast of St. Bernard Parish, Louisiana (Fig. 1). They began as a long island that
has since been segmented into several islets covering 80 km. The Chandeleurs were formed over 2,000 years ago and areuninhabited [1]. Dozens of hurricanes and other severe storms have fragmented these islands, resulting in severe erosion of theisland chain's land mass over time. The islands serve as a migratory stop for birds, provide habitat for nesting bird species, andare part of the second oldest National GVildlife Refuge in the United States.
The Chandeleur Islands are a diverse landscape, composed of beaches,dunes, and marshes. The northern portion of the islands is dominated bybeaches that have multiple bars and washover fans that are separated bydune fields. The dunes are vegetated by grasses and shrubs that grade intoa high salt marsh, also populated by black mangroves. The southern portionof the islands is more narrow and lower in elevation than the northernportion, leading to shoals separated by tidal inlets and small islandfragments.
To the west over the St. Bernard Delta surface, the Chandeleur Islandsare rapidly transgressing. The long-term Gulf shoreline erosion ratesestimate a minimum 2 m/yr loss in the north-central portion and greaterthan 12 m/yr loss at the northern and southern ends of the islands [2]. Thedeterioration of the islands is caused not only by the frequency of Gulfstorms but also by the subsidence of the St. Bernard Delta sediments and Fig. I study area.absence of a rejuvenating sediment supply. There have also been sea floorlandslides, which may have caused stronger waves and greater erosional impact to the Chandeleur Islands as well. [3].
Over the past decade, tropical cyclones have decimated the Chandeleur Islands, destroying pre-existin g vegetation, ruininghabitats, and eroding the shoreline. In 2004, when Hurricane Ivan passed approximately 95 kilometers east of the islands, itdestroyed the restoration progress of the Chandeleur Islands. Almost all of the vegetation on the islands was lost and thewashover charnels increased in number from 20 to over 100. The 2005 hurricane season further delayed any rebuilding progressthat could have been made in the islands. Hurricanes Dennis, Katrina, Cindy, and Rita all occurred during the 2005 hurricaneseason, resulting in severe damage to the islands. In particular. Hurricanes Dennis and Katrina reduced and redistributed manyterrestrial parts of the islands into sub-surface formations and shoals. Katrina also caused a severe amount of overwash, andconsequently all of the planting sites created during previous restoration efforts became open water [3].
Y1
.4
0fhan Ma ,WR W,
https://ntrs.nasa.gov/search.jsp?R=20100021175 2018-07-15T08:17:36+00:00Z
The 2008 hurricane season marked another disastrous year of hurricane impacts for the Chandeleur Islands, since they had notrecovered from Hurricane Katrina by the time Tropical Storm Edouard passed the islands in August. Immediately followingEdouard, two major hurricanes, Ike and Gustav, passed or made landfall near the Chandeleurs, further counteractin g the smallamount of restoration progress in terms of land accretion that had been made prior to Katrina.
B. Relevance to National ConcernsThis project pertains to two of NASA's Applied Sciences' applications of national priority: natural disasters and ecological
forecasting. Natural disaster applications regard the assessment and prediction of natural disaster impacts and risks to helpminimize impact and aid in resource and response planning. Hurricanes are a major threat and source of damage to the GulfCoast, making it necessary for decision makers to be equipped with accurate and timely data that not only aid in response but alsohelp to minimize losses. The purpose of this project is to assess the impact of tropical cyclonic events on the Chandeleur Islandsand provide the potential to aid resource managers in restoration projects that can benefit the islands. The aim of ecologicalforecasting is to provide decision makers with reliable forecasts of living systems changes and estimations across time through thecombination of satellite data, in situ data, and forecasting models [4]. The Pontchartrain Institute for Environmental Sciences(PIES) has not been able to quantify the transgression of the islands or assess impacts of recent hurricanes including Gustav in2008 because of limited resources. Therefore; this project examined a method for effectively utilizing data acquired from NASAEarth Observing Systems (EOS) to evaluate and analyze the state of the Chandeleur Islands to support the assessment needs of thePIES.
II. METHODOLOGY
A. Data Utilized
For analysis of island land area change; vegetated area change, and island transgression, Earth observation and ancillary datawere acquired from the following sources:
• Advanced Spaceborne Thermal Emission and Reflection Radiometer (ASTER) onboard the Terra satellite platform• Landsat 2-4 MSS
Landsat 4 & 5 TM• Moderate Resolution Imaging Spectroradiometer (MODIS) onboard Terra and Aqua• QuickBird
National Climatic Data Center (NCDC) Hourly Global Surface DataLandsat 2-4 MSS and Landsat 4 and 5 TM imagery were downloaded using the U.S. Geological Survey (USGS) Global
Visualization Viewer (G1oVis) at the Earth Resources Observation and Science Center at http:'-glovis.usgys.go„ %'. Images wereacquired for path 21, row 39 (World Reference System: the images downloaded were over the Chandeleur Islands, cloud-free, andpreceding and following 27 tropical cyclonic events that occurred between 1979 and 2009-
ASTER data were downloaded from the Land Processes Distributed Active Archive Center (LP DAAC)at https:/ Ipdaac.usp-s.gov/, using the NASA Warehouse Inventory Search Tool.
Post-Hurricane Gustav aerial photography was downloaded from the National Oceanic and Atmospheric Administration's(NOAA) National Geodetic Survey Web site http://ngs.woc.noaa.9 ^ov/gustav/.
MODIS data were obtained from the LP DAAC, which is an organization that collects, processes, and archives data collectedby NASA EOS. Images were acquired daily from 2000 to 2008-
A QuickBird image from August 22, 2007, was provided by PIES. This QuickBird imagery was used as ground reference datato conduct an accuracy assessment on a 2007 land/water classified ASTER image.
Hourly Global Surface Data were downloaded from the NCDC Web site. Data were acquired for Buoy 42007 from 01/01/1981to 06/18/2009. The MATLAB ® file Wind rose was downloaded from the file exchange on the MATLAB Central Web site(http://www.mathworks.coin/matlabcentral./fileexchange . Resulting wind roses are found in Figs. 14 and 15.
B. Image ProcessingUnsupervised ISODATA (Iterative Self-Organizing Data Analysis Technique Algorithm) classifications were conducted on
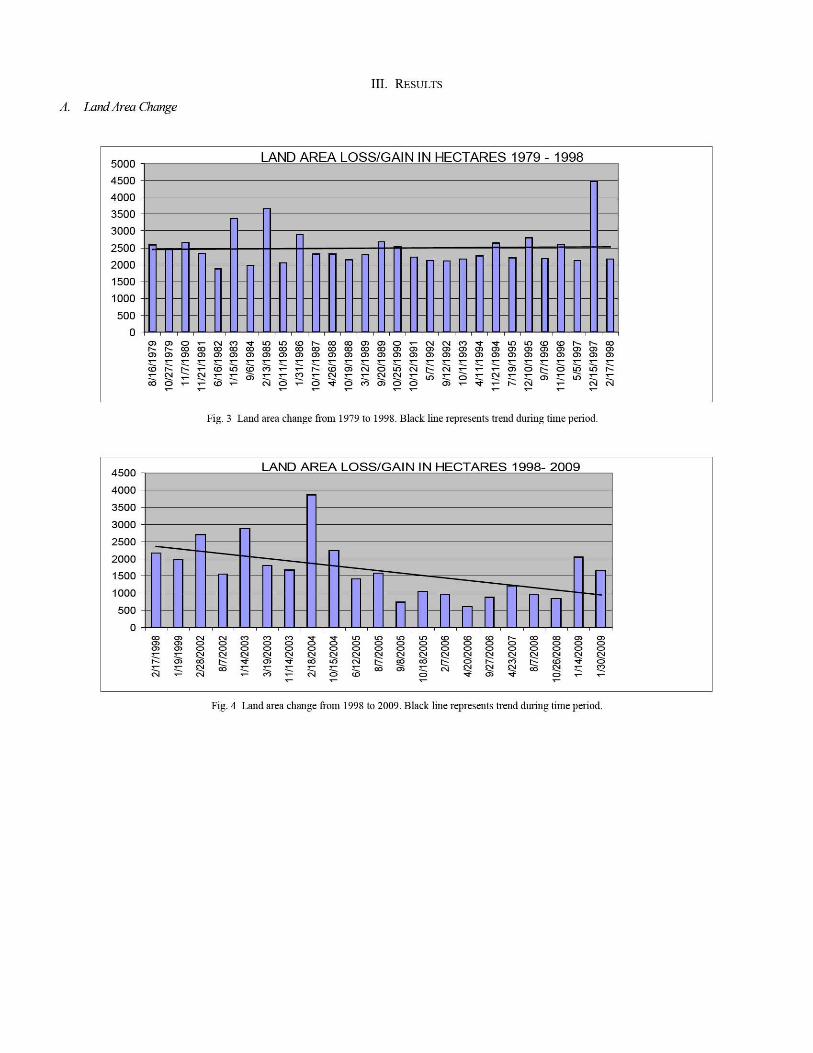
Landsat and ASTER datasets using ERDAS IMAGINE' on each of the subset ima ges using 150 classes, 150 iterations, and aconvergence threshold of .995. The classified ima ges were then manually aggregated into two classes: water and land. The landand water classifications used to determine land area and calculations are found in Figs. 3 and 4. Pixels classified as water wereused to create a mask covering the water surrounding the islands for each date to help ensure that Normalized DifferenceVegetation Index (NDVI) calculations (as described in Section C) did not include surrounding water areas [5].
MODIS images were processed using the Time Series Product Tool (TSPT), a program created at John C. Stennis Space Centerfor use in the "automated, rapid, large-scale regional surveillance” of vegetation; free of any atmospheric effects. TSPT, designedfor use in MATLAB, provides a means to process MODIS data and other satellite sensor products by automatically correcting forcloud cover and by removing undesirable pixels [6]. It uses a number of modules to create images that are cloud and noise free.
The output of the TSPT includes single image displays of satellite imagery, time-series plots for specific locations, or videos thatshow single images over a specified time frame [6] [7].
For this project, TSPT was set to apply MODIS data from the Terra and Aqua platforms. Images collected daily from 2000 to2008 were used. MOD 09 GQ and GA were used to aid in tracking the transgression of the Chandeleur Islands over an 8-yearperiod.
C. AD T17NDVI is used to measure vegetation health. This project calculated NDVI to assess vegetated area cover change (as described
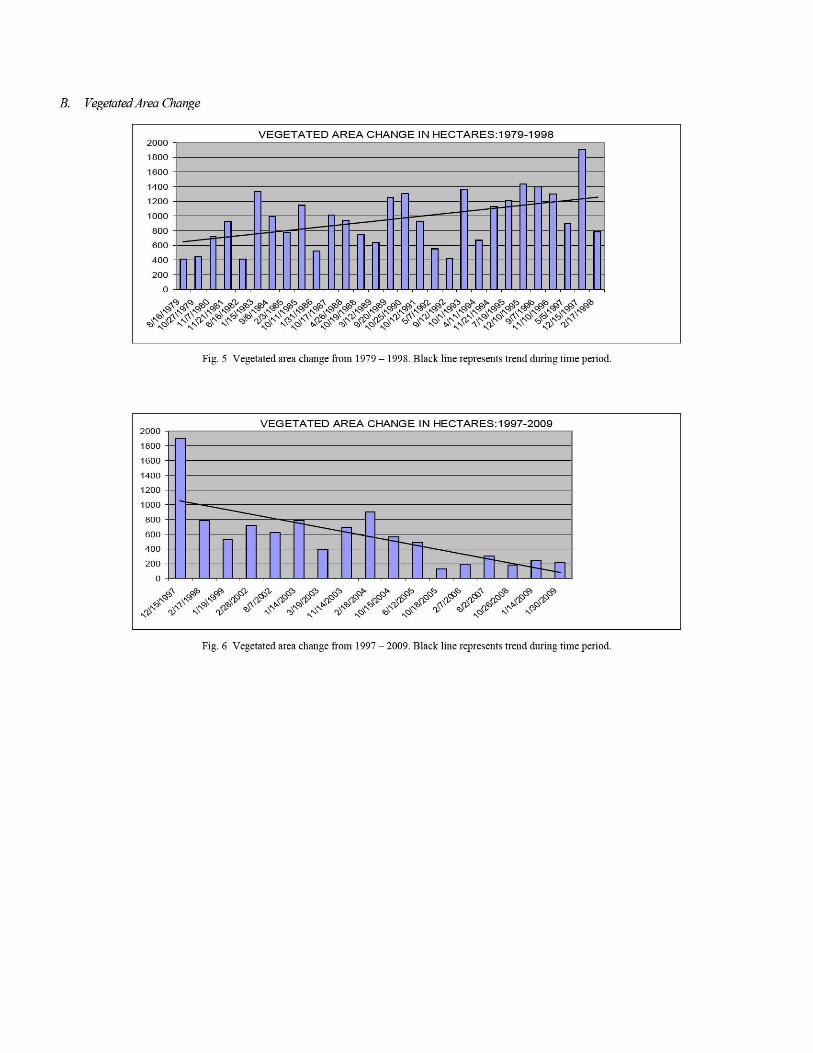
below) and did not include surrounding water areas vegetation coverage of the islands. Landsat and ASTER data calculationswere processed in ERDAS IMAGINE spatial modeler. During image analysis, values ranging from 0.0 to 0.02 were classified assand. In calculating vegetated areas, since most of the vegetation on the Chandeleur Islands is sparse grass and shrubs, pixels withNDVI values greater than 0.02 were assessed as vegetation. Measurements of vegetation in hectares were computed in ERDASIMAGINE for each image. Vegetated area quantification results are found in Figs. 5 and 6.
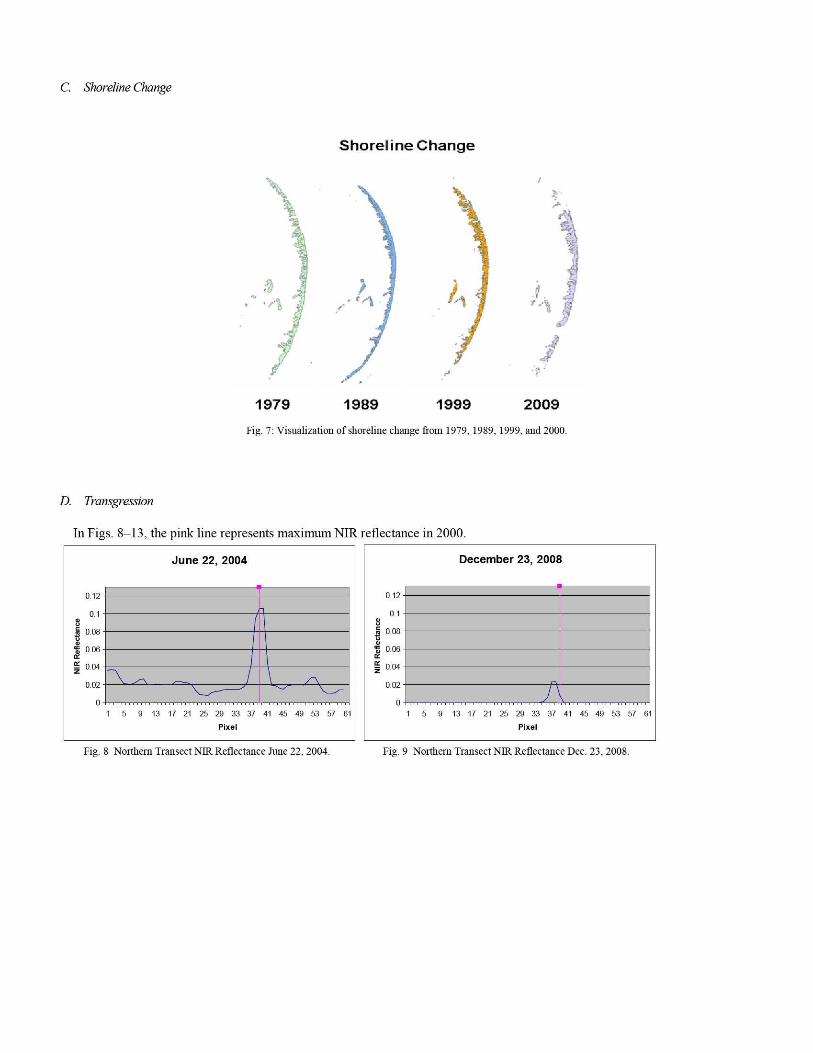
D. LandlShorelme ChangeTo display shoreline change for the Chandeleur Islands over the past 30 years, a series of maps were created in ESRI ArcMap .
Then water masks from 1979, 1989, 1999, and 2009 were applied to Landsat images of the islands and converted into shapefilesand compared to visualize land area changes. The visualization of these changes is found in Fig. 7.
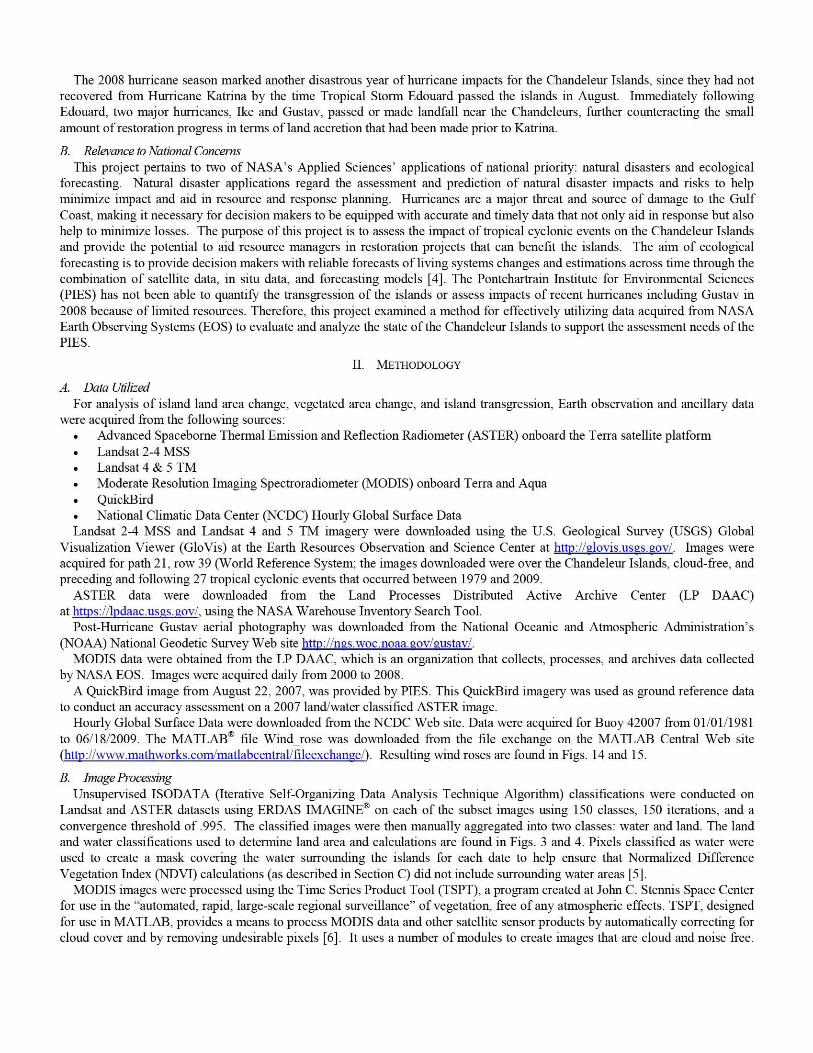
E. Transgression MethodsAfter MODIS data were processed using the TSPT, ima ges were displayed in ENVIO. For the analysis of island transgression,
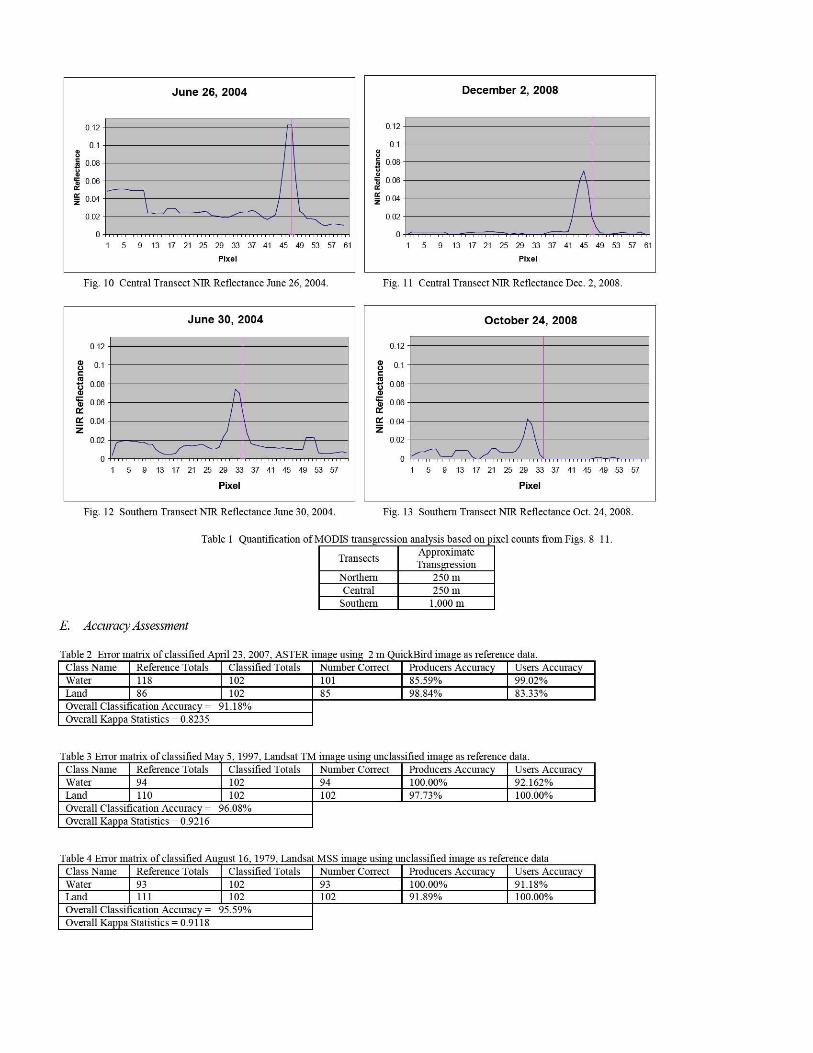
three transects were selected in the islands—north, central, and south—as seen in Fig. 2. Horizontal profiles of the near infrared(NIR) value of each pixel in each transect were compared over time to show the transgression of the islands through movement ofthe maximum NIR value. The maximum NIR value in the first MODIS image was shown as a solid line in graphs; change in peakNIR value was extrapolated to analyze transgression. Transgression results are included in Figs. 8-13 and Table 1.
F. Accuracy Assessment of ClassificationsAccuracy assessments evaluate the quality of information derived from a particular dataset and are an essential part of the
research to determine how classification methods affect results. Accuracy assessments in remote sensing are performed byselecting a number of points in the classified image and checking them against reference data; such as field survey results or highresolution imagery (usually less than 2 m) of the region [8]. Mien adequate ground reference data or aerial photography are notavailable, visual interpretation of the original data by a skilled individual familiar with the land cover types and ground conditionsmay be the only reasonable option to conduct the necessary accuracy assessments [9]. For this study, thematic map accuracyassessment was based upon visual interpretation of Landsat MSS and TM data as ground reference data [10].
The binomial probability theory equation was used to determine the number of points that should be selected for the accuracyassessment [8]. The equation (1) states
N = Z2 (P)(a1 (1)E`'
where N is the sample size, Z = 2 from the standard deviate of 1.96 for the 95% two-sided confidence level, p is the expectedaccuracy for the entire map, q = 100 —p, and E is the allowable error [8].
Two hundred four points were randomly placed in each of the classified iniages. TheEqualized Random point selection method was used to distribute the points to ensure thateach class received the same number of points. Each land cover type had 102 points thathad to be checked against the reference dataset. Each point on the classified image waschecked against the reference dataset. Once the process was complete, the accuracystatistics were computed for each land cover type and for the image collectively. Resultsfrom the accuracy assessment are found in Tables 2-4.
G. Wind DataNCDC hourly wind speed and wind direction data from 1981 to 2009 were input into =
MATLAB as the variables D and V. respectively. The command Wind-rose (90-D,V) was
used to create a wind rose, which illustrates the wind profiles near the Chandeleur Islands.
Fig. gr
sssion .analysislsects selected in
This process was repeated with seasonal data (April—September and October—March) fromthe same time period to create summer and winter wind roses.
H s a, Q S
era' w
NN
WW
AA
OO
O O
OO
OO
OO
O O
O O
OO
OO
O
2/17
/199
8
1/19
/199
9
2/28
/200
2
8/7/
2002
1/14
/200
3
3/19
/200
3D Z
11/1
4/20
03D D
2/18
/200
4
10/1
5/20
04D
MEKr
6/12
/200
50
8/7/
2005
C)9/
8/20
05D Z
10/1
8/20
05Z
2/7/
2006
mm
4/20
/200
6D
9/27
/200
6m
94/
23/2
007
08/
7/20
080 co
10/2
6/20
08N 0 0
1/14
/200
9
1/30
/200
9
IN
N W
Ul
O N
O N
0O
O O
O O
OO
O O
O O
O O
Ul
W A
O O
O O
OA C3
1O Ol
O0 O O
8/16
/197
910
1271
1979
11
/7/1
980
11/2
1/19
816/
16/1
982
1/15
/198
39/
6/19
842/
13/1
985
10/1
1/19
85ZD
1/31
/198
6D
10/1
7/19
87m
4/26
/198
8D
10/1
9/19
88r- 0
3112
1198
9Cl
)
9/20
/198
910
/25/
1990
D10
/12/
1991
Z5/
7/19
92Z
9112
1199
2m
10/1
/199
3n
4/11
/199
4D
11/2
1/19
94m
7/19
/199
512
/10/
1995
9/7/
1996
4
11/1
0/19
965/
5/19
9700
12/1
5/19
972/
17/1
998
C r H
B. Vegetated Area Change
VEGETATED AREA CHANGE IN HECTARES: 1979-19982000
1800
1600
1400
1200
1000
800
600
400
200
0' q>o^^
T1
0L 0 ^0P pP ^Q0^4'1^oq>4^^^0 ^$^ ^^^o^^ ^`L^^`L^^^R^Ra ^ Z ^e^^o ^pA, ^^,A^^0b
Fig. 5 Vegetated area change from 1979 — 1998. Black line represents trend durin g time period.
VEGETATED AREA CHANGE IN HECTARES: 1997-20092000
1800
1600
1400
1200
1000
800
600
400
200
0
\^c^^^\ti^^\^oo ^\^^^ p\ ^ \moo \^ory^^\^\e \T," 19 ^\\ \ ry \ryoo \ oo IZ\IT
Fig. 6 Vegetated area change from 1997 — 2009. Black line represents trend during time period.
C. Shoreline Change
Shoreline Change
%, i`
f
cn
^^
1979 1989 1999 2009
Fig. 7: Visualization of shoreline change from 1979, 1989, 1999. and 2000.
D. Transgression
In Figs. 8-13, the pink line represents maximum NIR reflectance in 2000.
June 22, 2004
0.12
m0.1
0.08am 0.06zz 0.04
0.02
0
1 5 9 13 17 21 25 29 33 37 41 45 49 53 57 61
Pixel
Fig. 8 Northern Transect NIR Reflectance Ame 22, 2004. rig. v iNormern Transect iNitc i<enectance uec. lj, zuuu.
June 26, 2004
0.12
0.1
0.08um
0.06rcz 0.04
0.02
0
1 5 9 13 17 21 25 29 33 37 41 45 49 53 57 61
Pixel
Fig. 10 Central Transect NIR Reflectance June 26, 2004. rig. 11 l entral Transect N. K KeIlectance Dec. 2, 2UM5.
June 30, 2004 October 24, 2008
0.120.12
0.1ccc
0.1c
0.08 0.08m my 0.06 0.06
W 0.04 ^_ 0.04Z Z
0.020.02
0 01 5 9 13 17 21 25 29 33 37 41 45 49 53 57 1 5 9 13 17 21 25 29 33 37 41 45 49 53 57
Pixel Pixel
Fig. 12 Southern Transect NIR Reflectance June 30. 2004. Fig. 13 Southern Transect NIR Reflectance Oct. 24. 2008,
Table 1 Quantification of MODIS transgression analysis based on pixel counts from Figs. 8-11.
TransectsApproximateTransgression
Northern 250 inCentral 250 in
Southern 1.000111
E. Accin-acy Assessment
Table 2 Error matrix of classified Anril 23 2007 .ASTER ima ge wrin g 2 in OnickRird ima ge as reference dataClass Name Reference Totals Classified Totals Number Correct Producers Accurac y Users AccuracyWater 118 102 101 8559% 99.02%Land 86 102 85 98.84% 83.33%Overall Classification Accuracy = 91.18%Overall Kappa Statistics = 0.8235
Table 3 Error matrix of classified Mav 5. 1997_ Tandsat TM ima ge usin g unclassified ima ge as reference dataClass Nanle Reference Totals Classified Totals Number Correct Producers Accuracy Users AccuracyWater 94 102 94 100.00% 92.162%Land 110 102 102 97.73% 100.00%
Overall Classification Accuracy = 96.08%Overall Kappa Statistics = 0.9216
Table 4 Error matrix of classified August 16. 1979_ T.andsst MSS ima ge usin g unclassified ima ge as reference dataClass Name Reference Totals Classified Totals Number Correct Producers Accuracy Users AccuracyWater 93 102 93 100.00% 91.18%Land 111 102 102 91.89% 100.00%Overall Classification Accuracy = 95.59%Overall Kappa Statistics = 0.9118
6% .
4%
SNEST V EST.:.....
SOUTH SOUTH
E60.1200 55 -60q 5a-55
EAST: F145-50q 40.45q 35-40q 30.35q 25-30q 20.25q 15-20M10-15E5-10N0-5
DSO-55X45-50©40-45q 35-40q 30-35q 25.30q 20-25915-20M10-15E5-10E0-5
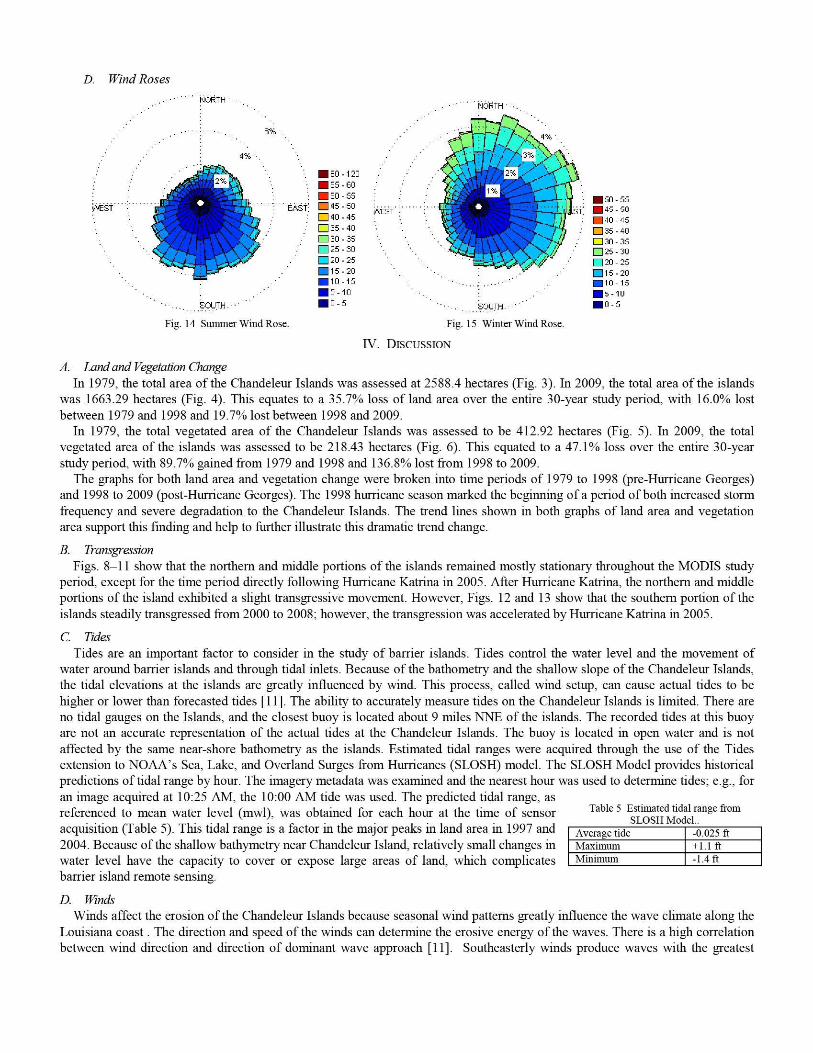
D. Wind Roses
NORTH • -NORTH-
Fig. 14 Sununer Wind Rose.
Fig. 15 Winter Wind Rose.
IV- DISCUSSION
A. Land and Vegetation ChangeIn 1979, the total area of the Chandeleur Islands was assessed at 2588.4 hectares (Fig. 3). In 2009, the total area of the islands
was 1663.29 hectares (Fig. 4). This equates to a 35-7% loss of land area over the entire 30-year study period, with 16.0% lostbetween 1979 and 1998 and 19.7% lost between 1998 and 2009-
In 1979, the total vegetated area of the Chandeleur Islands was assessed to be 412.92 hectares (Fig. 5). In 2009, the totalvegetated area of the islands was assessed to be 218.43 hectares (Fig. 6). This equated to a 47.1% loss over the entire 30-yearstudy period; with 89.7% gained from 1979 and 1998 and 136.8% lost from 1998 to 2009-
The graphs for both land area and vegetation change were broken into time periods of 1979 to 1998 (pre-Hurricane Georges)and 1998 to 2009 (post-Hurricane Georges). The 1998 hurricane season marked the beginning of a period of both increased stormfrequency and severe degradation to the Chandeleur Islands. The trend lines shown in both graphs of land area and vegetationarea support this finding and help to further illustrate this dramatic trend change.
B. TransgressionFigs. 8-11 show that the northern and muddle portions of the islands remained mostly stationary throughout the MODIS study
period, except for the time period directly following Hurricane Katrina in 2005- After Hurricane Katrina, the northern and middleportions of the island exhibited a slight transgressive movement. However, Figs. 12 and 13 show that the southern portion of theislands steadily transgressed from 2000 to 2008: however, the transgression was accelerated by Hurricane Katrina in 2005.
C. TidesTides are an important factor to consider in the study of barrier islands. Tides control the water level and the movement of
water around barrier islands and through tidal inlets. Because of the bathometry and the shallow slope of the Chandeleur Islands,the tidal elevations at the islands are greatly influenced by wind. This process, called wind setup, can cause actual tides to behigher or lower than forecasted tides [I I ]. The ability to accurately measure tides on the Chandeleur Islands is limited. There areno tidal gauges on the Islands, and the closest buoy is located about 9 miles NNE of the islands. The recorded tides at this buoyare not an accurate representation of the actual tides at the Chandeleur Islands. The buoy is located in open water and is notaffected by the same near-shore bathometry as the islands. Estimated tidal ranges were acquired through the use of the Tidesextension to NOAA's Sea, Lake, and Overland Surges from Hurricanes (SLOSH) model. The SLOSH Model provides historicalpredictions of tidal range by hour. The imagery metadata was examined and the nearest hour was used to determine tides, e.g., foran image acquired at 10:25 AM, the 10:00 AM tide was used. The predicted tidal range, asreferenced to mean water level (cowl), was obtained for each hour at the time of sensor Table 5 Estimated tidal range from
SLOSH Model..acquisition (Table 5). This tidal range is a factor in the major peaks in land area in 1997 and Average tide 0.22004. Because of the shallow bathyrnetry near Chandeleur Island. relatively small changes in 1v4axinnun
water level have the capacity to cover or expose large areas of land; which complicatesbarrier island remote sensing.
5+1.1 ft
Niiniunun -1.4 ft
D. WindsWinds affect the erosion of the Chandeleur Islands because seasonal wind patterns greatly influence the wave climate along the
Louisiana coast. The direction and speed of the winds can determine the erosive energy of the waves. There is a high correlationbetween wind direction and direction of dominant wave approach [11]. Southeasterly winds produce waves with the greatest
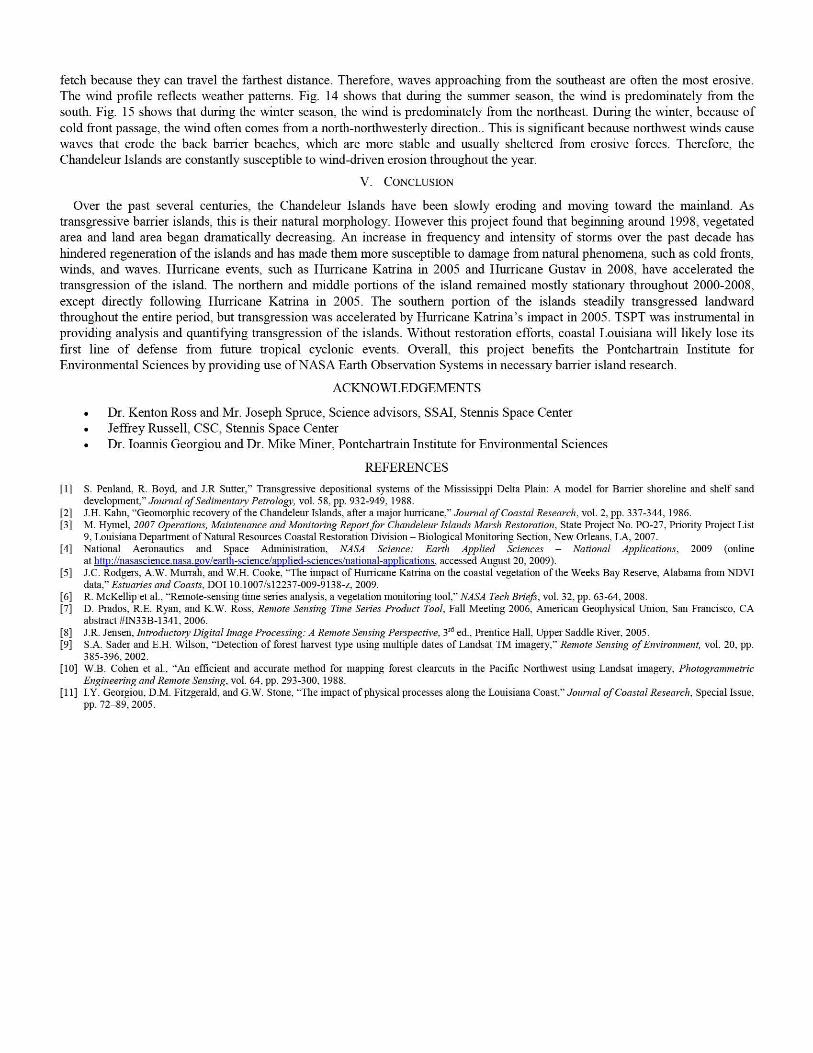
fetch because they can travel the farthest distance. Therefore, waves approaching from the southeast are often the most erosive.The wind profile reflects weather patterns. Fig. 14 shows that during the summer season, the wind is predominately from thesouth. Fig. 15 shows that during the winter season, the wind is predommately from the northeast. During the winter, because ofcold front passage, the wind often comes from a north-north-,vesterly direction.. This is significant because northwest winds causewaves that erode the back barrier beaches, which are more stable and usually sheltered from erosive forces. Therefore, theChandeleur Islands are constantly susceptible to wind-driven erosion throughout the year.
V. CONCLUSION
Over the past several centuries, the Chandeleur Islands have been slowly erodin g and moving toward the mainland. Astransgressive barrier islands, this is their natural morphology. However this project found that beginning around 1998, vegetatedarea and land area began dramatically decreasing. An increase in frequency and intensity of storms over the past decade hashindered regeneration of the islands and has made them more susceptible to damage from natural phenomena, such as cold fronts,winds, and waves. Hurricane events, such as Hurricane Katrina in 2005 and Hurricane Gustav in 2008, have accelerated thetransgression of the island. The northern and middle portions of the island remained mostly stationary throughout 2000-2008,except directly following Hurricane Katrina in 2005- The southern portion of the islands steadily transgressed landwardthroughout the entire period, but transgression was accelerated by Hurricane Katrina's impact in 2005. TSPT was instrumental inproviding analysis and quantifying transgression of the islands. Without restoration efforts, coastal Louisiana will likely lose itsfirst line of defense from future tropical cyclonic events. Overall, this project benefits the Pontchartrain Institute forEnvironmental Sciences by providing use of NASA Earth Observation Systems in necessary barrier island research.
ACKNOWLEDGEMENTS
• Dr. Kenton Ross and Mr. Joseph Spruce, Science advisors, SSAI, Stennis Space Center• Jeffrey Russell, CSC, Stennis Space Center• Dr. Ioannis Georgiou and Dr. Mike Miner, Pontchartrain Institute for Environmental Sciences
REFERENCES
[1] S. Penland, R. Boyd, and J.R Sutter," Transgressive depositional systems of the Mississippi Delta Plain: A model for Barrier shoreline and shelf sanddevelopment," Journal of Sedinnentary Petrology-, vol. 58, pp. 932-949.. 1988.
[2] J.H. Kahn, "Geomorphic recovery of the Chandeleur Islands, after a major hurricane," Journal of Coastal Research, vol. 2, pp. 337-344, 1986.[3] M. Hylnel, 2007 Operations, Maintenance and Monitoring Report for Chandeleur Islands Marsh Restoration, State Project No. PO-27, Priority Project List
9, Louisiana Department of Natural Resources Coastal Restoration Division — Biological Monitoring Section, New Orleans, LA, 2007.[4] National Aeronautics and Space Administration, NASA Science: Earth Applied Sciences — National Applications, 2009 (online
at httu:r/nasascience.nasa.gov/earth-science/applied-sciences/national-applications . accessed August 20, 2009).[5] J.C. Rodgers, A.W. Murrah, and W.H. Cooke, "The impact of Hurricane Katrina oil coastal vegetation of the Weeks Bay Reserve, Alabama from NDVI
data" Estuaries and Coasts. DOI 10.1007,`sl2237-009-9138-z, 2009.[6] R. McKellip et al., "Remote-sensing time series analysis, a vegetation monitoring tool," NASA Tech Briefs, vol. 32. pp. 63-64, 2008.[7] D. Prados, R.E. Ryan, and K.W. Ross, Remote Sensing Dine Series Product Tool, Fall Meeting 2006, American Geophysical Union, San Francisco, CA
abstract #IN33B-1341. 2006.[8] J.R. Jensen, Introductory Digital linage Processing: A Remote Sensing Perspective, 3rd ed., Prentice Hall, Upper Saddle River, 2005.[9] S.A. Sader and E.H. Wilson, "Detection of forest harvest type using multiple dates of Landsat TM imagery," Remote Sensing of Environment, vol. 20, pp.
385-396,2002.[10] W.B. Cohen et al., "Ali efficient and accurate method for mapping forest clearcuts in the Pacific Northwest using Landsat imagery, Photogrammetric
Engineering and Remote Sensing, vol. 64, pp. 293-300.. 1988.[11] I.Y. Georgiou, D.M. Fitzgerald, and G.W. Stone, "The impact of physical processes along the Louisiana Coast," Journal of Coastal Research, Special Issue,
pp.72-89,2005,