Dissolved carbon and nitrogen leaching following variable logging ...

Assessment of Trendsand Leaching of Nitrogenat ICP Waters Sites(Europe and North America)
54/2001

CONVENTION ON LONG-RANGE TRANSBOUNDARY AIR POLLUTION
INTERNATIONAL COOPERATIVE PROGRAMME ON ASSESSMENT AND MONITORING OF ACIDIFICATION OF RIVERS AND LAKES
Assessment of Trends and Leaching of Nitrogen at ICP Waters Sites (Europe and North America)
Prepared by the Programme Centre Norwegian Institute for Water Research Oslo, August 2001
ICP Waters report 54/2001
Preface
The International Cooperative Programme on Assessment and Monitoring of Rivers and Lakes (ICP Waters) was established under the Executive Body of the Convention on Long-Range Transboundary Air Pollution at its third session in Helsinki in July 1985. The Executive Body also accepted Norway's offer to provide facilities for the Programme Centre, which has been established at the Norwegian Institute for Water Research, NIVA. Berit Kvæven, Norwegian State Pollution Control Authority, has led the ICP Waters programme. This report is a continuation of previous work within the ICP Waters programme about assessment of nitrogen in surface water. The report has been made in cooperation with European Monitoring and Assessment Programme (EMEP) Meteorological Synthesising Centre - West (MSC-W) through Leonor Tarrason and Chemical Coordination centre for Chemistry (CCC) through Kjetil Tørseth. The idea is to compare status and trends in nitrogen concentrations in surface waters with those in deposition. Many individuals and institutions have assisted in the preparation of this report. We thank all national Focal Centres for submitting the necessary data to the ICP Waters Programme Centre, and for giving valuable comments to the report. At NIVA we thank Liv Bente Skancke and Torulv Tjomsland for technical assistance, and Ann Kristin Buan for database management. We acknowledge the contribution in kind from EMEP in preparation of this report. The Norwegian State Pollution Control Authority (SFT) provided financial support to the work of the Programme Centre.
Oslo, August 2001
Brit Lisa Skjelkvåle
Project manager

ICP Waters report 54/2001
Contents
Summary and conclusions 5
1. Background 7
2. Introduction 7
3. Methods and Site Selection 8
4. Results 11 4.1 Trends in Nitrate Concentrations in Surface Waters 11 4.2 Trends in deposition 14 4.3 Nitrate in Runoff 16 4.4 Relative importance of Nitrate and Sulphate 19 4.5 Nitrogen Deposition and Inorganic Nitrogen in Runoff 22 4.6 Classification of Nitrogen saturation 23 4.7 Relationship between N deposition and N saturation Stage 27
5. Reference List 28
Appendix A. Data 31
Appendix B. Major Programme Findings 37
Appendix C. Reports and publications from the programme 41

ICP Waters report 54/2001
Summary and conclusions
The ICP Waters database currently holds data for 204 sites in Europe and North America. These data were evaluated with respect to status and trends in nitrate (NO3
-) concentrations. Status • About 1/3 of the ICP sites have mean annual concentrations of NO3
- < 5 µeq L-1. More than half of the sites have NO3
- concentrations > 10 µeq L-1. In total, the results suggest that a large fraction of the ICP Waters sites have NO3
concentrations above those expected from catchments with no impact from nitrogen (N) deposition.
• In about 5% of the sites, NO3- makes a greater contribution to acidification than sulphate (SO4
2-). This means that for the majority of ICP Waters sites, on annual mean basis, SO4
2- is still the dominant acidifying ion.
• SO42- is the most important acidifying anion, but NO3
- constitutes more than 10% of the non-marine acid anions at 50% of the ICP Waters sites.
• The ICP Waters data support the general picture that increased N leakage occurs in catchments receiving N deposition above a threshold of 5-10 kg N ha-1 yr-1.
• About half of the 108 European ICP Waters sites exhibit a high degree of N saturation (Stage 2 or 3) in 1998. Such sites are found predominantly in Central Europe. Most of the sites in the Scandinavian countries are classified in Stage 0 or 1. In Eastern US 26% of the sites show high degree of N saturation (Stage 2) and no sites are classified in Stage 3.
• There is a clear connection between N deposition from air and N Stage at European ICP Waters sites. N-deposition levels are all below 10 kg N ha-1 year-1 at Stages 0 and 1, while at Stages 3 no sites had air deposition below 10 kg N ha-1 year-1.
Trend • Deposition of both oxidised and reduced airborne N in Europe increased during the 1900’s and
levelled out in the 1970’s and 1980’s. Trend analyses on the EMEP data conducted by Barrett et al. 2000a and Barrett et al. 2000b indicate a decline in deposition of N of approximately 20% in Central Germany and Southern Scandinavia during the period 1989-1998. This is interpreted as a response to declining emissions of N compounds during the 1990s.
• Of 16 EMEP sites situated in the same region as the ICP Waters sites only three sites show significant changes in N deposition in the 10-year period 1989-1998. Measured wet deposition of N compounds at EMEP sites shows relatively large year-to-year variations, probably mainly due to natural variations in meteorological conditions such as amount of precipitation. This “noise” in the record thus means that trends in N deposition, therefore, must be relatively large before they become statistically significant. This probably explains why there are no significant trends in N deposition during the 1990s at many of the EMEP sites.
• The majority of the 98 ICP Waters sites with sufficient data for trend analysis showed no significant trends in NO3
- for the time period 1989-1998. Only 8 sites showed significant increase and 11 showed significant decrease. Previous results from the ICP Waters programme (Stoddard et al. 1999, Lükewille et al. 1997) showed that in the 1980s for the ICP Waters program as a whole, more sites exhibited upward trends of NO3
- concentrations (33%) than downward (8%). The data for the 1990s now indicate that this increasing trend has stopped.
• The frequency distribution of NO3- concentrations is approximately the same for 150 sites with
data from 1990/92 and 1999. A division of data between US and Europe reveals that most of the increase in NO3
- from 1990/92 to 1999 has occurred in the US sites, while in the European sites there is a tendency towards a decrease in NO3
-. • NO3
- plays a larger role in acidification in 1999 relative to 1990/92. This is mostly due to the decline in SO4
2- concentration over this period, rather than an increase in NO3- concentrations.

ICP Waters report 54/2001
• Of 36 ICP Waters sites in Europe classified relative to N-saturation stages in 1990/92 and 1998 in 1990/92, 24 had no change in N saturation stage, while 8 went down and 4 went up.
• The results indicate that progression to increased N-saturation stages is a slow process with a time scale of decades.
• The results show that there is no consistent pattern of trends in NO3- in the ICP waters sites. The
overall lack of significant trends in NO3- concentrations in surface waters may be the result of 2
opposing factors (Wright et al. 2001); Continued high deposition of nitrogen (above the 10 kgN ha-1 yr-1 threshold) should tend to increase N saturation and give increased nitrate concentrations in runoff, whereas the decline in N deposition over the past 5-10 years in large parts of Europe should give decreased nitrate concentrations in runoff. Short and long-term variations in climate affect nitrate concentrations in streamwater, and thus contribute “noise” which masks long-term trends.

ICP Waters report 54/2001
7
1. Background
The International Cooperative Programme on Assessment and Monitoring of Acidification of Rivers and Lakes (ICP Waters) was established under the Executive Body of the Convention on Long-Range Transboundary Air Pollution (LRTAP) at its third session in Helsinki in July 1985 (EB AIR/7, Annex/V). It is one of six ICPs (Waters, Forests, Materials, Crops, Integrated Monitoring, Mapping and Modelling). The LRTAP convention went into effect in 1983 and was the first step to enforce emission reduction measures in the international sphere. ICP Waters is designed to assess the degree and geographical extent of acidification of surface waters, evaluate dose/response relationships and long-term trends in aquatic chemistry and biota. During the 13 years of operation, the programme has produced yearly reports and an in-depth report every three years; 3-year report (Wathne 1991), 6-year report (Skjelkvåle et al. 1994), 9-year report (Lükewille et al. 1997), and the latest 12-year report (Skjelkvåle et al. 2000). The major findings of the ICP Waters programme are listed in Appendix B. Reports and publications from the programme are listed in Appendix C. An assessment of N leaching in the ICP Waters sites based on data through 1992 is reported in Traaen and Stoddard 1995) and Stoddard and Traaen 1995) and through 1995 in Lükewille et al. (1997). Here we use ICP Waters data through 1998 and 1999 to update this assessment.
2. Introduction
During the 1900’s large regions of Europe received elevated deposition of N compounds. Emissions of oxidised N species from combustion of fossil fuels and emissions of reduced N compounds from agriculture increased dramatically in Europe during the 1900’s to reach peak levels about 1980. (Which reference?) European emissions of nitrogen to the atmosphere have levelled off during the 1980s and a slight decrease of approx. 15 % has been reported between 1990 and 1998. The European averaged decrease in N deposition from air during the 1990s is somewhat smaller than the reported emission decrease although there are significant differences from country to country(Tarrason and Schaug 2000). Excess N deposition has long been viewed as a threat to the nutrient balance and health of forest and semi-natural terrestrial ecosystems. N is usually the growth-limiting nutrient in these ecosystems. Chronic excess N deposition can lead to N saturation, defined by Aber et al. 1989) as “the availability of ammonium and NO3
- in excess of total combined plant and microbial nutritional demand”. By this definition N saturation is manifest by increased leaching of inorganic N (generally NO3
-) below the routing zone. Inasmuch as NO3
- is a strong acid anion, increased leaching of NO3 enhances acidification of soils and surface waters. Increased concentrations of inorganic N in runoff (streamwater) thus indicate N saturation of catchment ecosystems, under the conditions, of course, that there are no significant sources of N in the catchment (such as fertilisers, municipal and industrial wastewater). The importance of NO3
- in the acidification of surface waters has received much-deserved attention, especially as the importance of SO4
2- declines. Results from the ICP Waters programme have shown that significant decreases in SO4
2- concentrations at European and North American ICP Waters sites can be explained by a decline in sulphur (S) deposition due to successful emission reduction measures (Stoddard et al. 1999, Skjelkvåle et al. 2000). At many catchments, increasing NO3
- concentrations

ICP Waters report 54/2001
8
during the 1980s and decreasing values during the 1990s can be observed (Lükewille et al. 1997). The pattern cannot be explained by patterns in air deposition or other changes in the catchments, such as point sources, agriculture, clearcutting and forest fire. Hence, dose/response relationships are much more complicated for N than for S. Changes in N deposition may not always be directly correlated with changes in NO3 leaching. The “nitrogen status” of an ecosystem, or changes in N-status, seems to be an important indicator of N-saturation. Reports of increased NO3
- concentrations in runoff first appeared in the 1980s. The Norwegian 1000 lake survey in 1986 revealed that NO3
- concentrations in some areas in Southern Norway had almost doubled since investigations in 1974-75 (Henriksen and Brakke 1988). Increasing trends in NO3
--
concentrations were also revealed in the U.S. EPA’s Long-term Monitoring Project. Nine of 15 drainage lakes monitored in the Adirondack area showed increases in NO3
- concentrations, ranging from 0.5 to 2.0 µeq L-1 yr-1 in the period 1982-1990 (Driscoll and van Dreason 1993). Further, 5 of 8 streams in the Catskill area exhibited significant upward trends in NO3
-, ranging from 1.3 to almost 3 µeq L-1 yr-1 in the period 1983 - 1989 (Murdoch and Stoddard 1993). These trends have largely disappeared in the 1990s (Stoddard et al. 1998), a phenomenon that can also be observed at many ICP Waters sites. Even if NO3
- concentrations are relatively unchanging, however, leaching of NO3- from
forested catchments will have the effect of removing base cations from soil and mobilising aluminium and H+ ions, contributing to catchment acidification. The aim of this report is to: • give an updated report (since the evaluation of Lükewille et al. 1997) on status of NO3
- in surface waters at ICP Waters sites in Europe and North America and
• give a more detailed assessment on trends in N in surface waters in subregions as a follow up from the 12-year report (Skjelkvåle et al. 2000), and relate these to trends in N deposition from air.
3. Methods and Site Selection
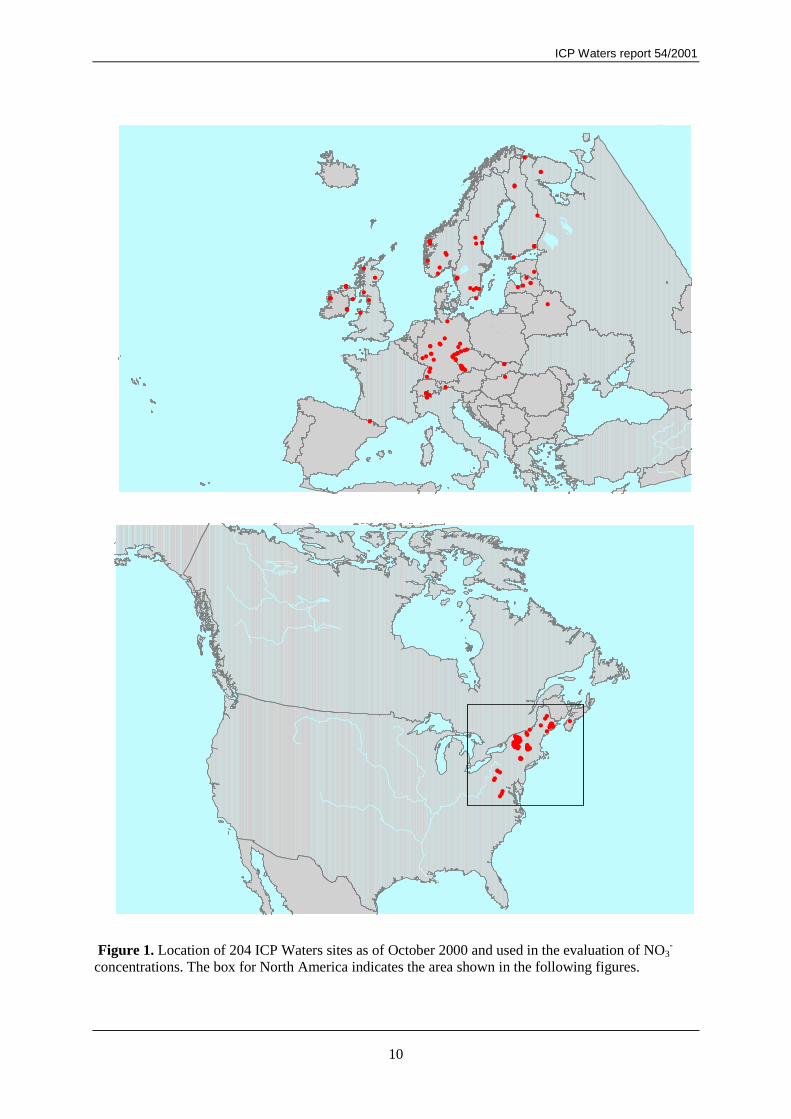
The surface water data used in this report are from the ICP Waters Programme, and the deposition data are from EMEP (European Monitoring and Assessment Programme). The ICP Waters data comprise 204 sites in Europe (Austria, Belarus, Czech Republic, Estonia, Finland, Germany, Hungary, Italy, Ireland, Latvia, Norway, Poland, Russia, Spain, Sweden, Switzerland and UK) and North America (Canada, United States) (Figure 1). All sites were selected according to the Programme Manual (Norwegian Institute for Water Research 1996) to increase the likelihood of their being representative of acid-sensitive terrain in each country. In accordance with these criteria, the sites are lakes and streams draining headwater catchments and are free from local disturbance. Sampling frequencies vary, but all sites included here have as a minimum both summer/fall baseflow and spring runoff samples. Nitrate concentrations reported in ICP Waters are measured using a variety of analytical methods. Annual cross-comparisons of methods using audit samples of known concentration, conducted by ICP Waters (Hovind, 2000) show excellent agreement among all of the national labs participating. Data used for assessment of N-status are from 1998 and 1999; trends data are from 1989-1998. The data in the ICP Waters database illustrates a problem with large international databases, based on voluntary contributions. Even if the programme has a manual and the data are checked carefully before they are stored in the database at the ICP programme centre, there are many sites that does not

ICP Waters report 54/2001
9
have sufficient data for all types of analysis. In the figures in the text it is always presented how many sites that are used in the particular analysis. For overview, this information is also given in Table 1. Name, location and most of the results presented in this report is listed in Appendix A. Criteria for selection of sites used for assessment of N-saturation stages were the same as used by Stoddard and Traaen 1995), which is minimum 3 samples for the year 1998 and these are spread among seasons. Criteria for selection of sites used for assessment of trends were the same as used in the 12-year report (Skjelkvåle et al. 2000), which is minimum 2 samples per year, and that there are data for at least 7 of the 10 years 1989-98. All deposition data used here are provided from European Monitoring and Assessment Programme (EMEP) both from Meteorological Synthesising Centre - West (MSC-W) and Coordination centre for Chemistry (CCC). Deposition from EMEP is only for European sites. Results reported here are measured wet deposition at EMEP stations located in the same region as the streamwater sites (Barrett et al. 2000a), and modelled total (wet + dry) deposition by country (Tarrason and Schaug 2000). The data are modelled deposition in 50x50 km grid squares in Europe. The model uses estimated annual emissions and actual meteorology for each year to calculate wet and dry deposition of S, oxidised N and reduced N compounds. Table 1. Number of ICP Waters sites used in the different type of assessments
Total number of ICP Waters sites with data in 1999 204
Number of sites with NO3- data both from 1990/92 and 1999 150
Number of sites with nitrogen data both for deposition and runoff in
1999 (only European sites)
99
Number of sites with sufficient NO3- data to estimate N-saturation
stages
198
Number of sites with sufficient NO3- data to estimate N-saturation
stages both for 1990/92 and 1998
36
Number of sites with deposition and sufficient data for estimation of
N-saturation stages
82
Number of sites with sufficient data for trend analysis 96 .
ICP Waters report 54/2001
10
Legend for Europa2
#
#
###
####
#
# #
#
# #
#
#
##
###
#
#
### #
#
#
##
#
#
##
##
#
#
#
#
###
##
#
#
#
####
###
#####
######
### #
#
#
#
#
#
#
###
#
##
##
#
##
##
#
##
##
#
#
#
#
#
#
##
###
###
####
##
####
#############################
############
###
# ###
#
#
#
####
##
#
#
##
#
##
#
######
##
Figure 1. Location of 204 ICP Waters sites as of October 2000 and used in the evaluation of NO3-
concentrations. The box for North America indicates the area shown in the following figures.
ICP Waters report 54/2001
11
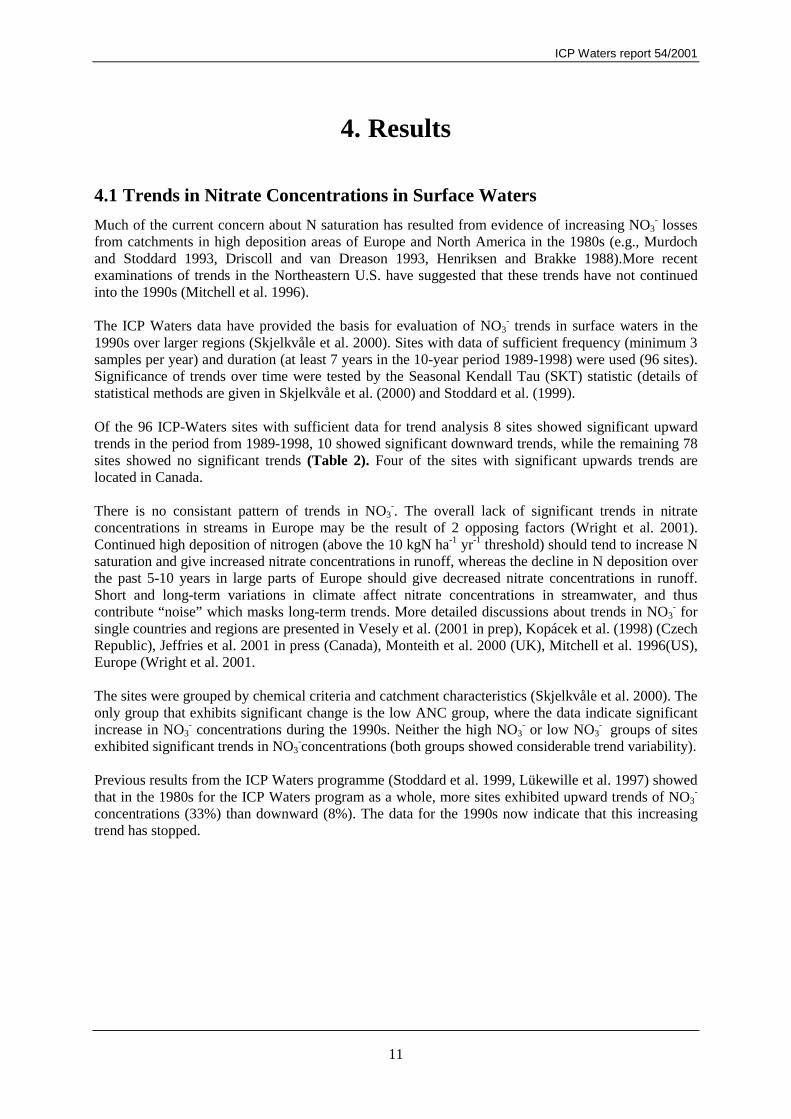
4. Results
4.1 Trends in Nitrate Concentrations in Surface Waters
Much of the current concern about N saturation has resulted from evidence of increasing NO3- losses
from catchments in high deposition areas of Europe and North America in the 1980s (e.g., Murdoch and Stoddard 1993, Driscoll and van Dreason 1993, Henriksen and Brakke 1988).More recent examinations of trends in the Northeastern U.S. have suggested that these trends have not continued into the 1990s (Mitchell et al. 1996). The ICP Waters data have provided the basis for evaluation of NO3
- trends in surface waters in the 1990s over larger regions (Skjelkvåle et al. 2000). Sites with data of sufficient frequency (minimum 3 samples per year) and duration (at least 7 years in the 10-year period 1989-1998) were used (96 sites). Significance of trends over time were tested by the Seasonal Kendall Tau (SKT) statistic (details of statistical methods are given in Skjelkvåle et al. (2000) and Stoddard et al. (1999). Of the 96 ICP-Waters sites with sufficient data for trend analysis 8 sites showed significant upward trends in the period from 1989-1998, 10 showed significant downward trends, while the remaining 78 sites showed no significant trends (Table 2). Four of the sites with significant upwards trends are located in Canada. There is no consistant pattern of trends in NO3
-. The overall lack of significant trends in nitrate concentrations in streams in Europe may be the result of 2 opposing factors (Wright et al. 2001). Continued high deposition of nitrogen (above the 10 kgN ha-1 yr-1 threshold) should tend to increase N saturation and give increased nitrate concentrations in runoff, whereas the decline in N deposition over the past 5-10 years in large parts of Europe should give decreased nitrate concentrations in runoff. Short and long-term variations in climate affect nitrate concentrations in streamwater, and thus contribute “noise” which masks long-term trends. More detailed discussions about trends in NO3
- for single countries and regions are presented in Vesely et al. (2001 in prep), Kopácek et al. (1998) (Czech Republic), Jeffries et al. 2001 in press (Canada), Monteith et al. 2000 (UK), Mitchell et al. 1996(US), Europe (Wright et al. 2001. The sites were grouped by chemical criteria and catchment characteristics (Skjelkvåle et al. 2000). The only group that exhibits significant change is the low ANC group, where the data indicate significant increase in NO3
- concentrations during the 1990s. Neither the high NO3- or low NO3
- groups of sites exhibited significant trends in NO3
-concentrations (both groups showed considerable trend variability). Previous results from the ICP Waters programme (Stoddard et al. 1999, Lükewille et al. 1997) showed that in the 1980s for the ICP Waters program as a whole, more sites exhibited upward trends of NO3
-
concentrations (33%) than downward (8%). The data for the 1990s now indicate that this increasing trend has stopped.

ICP Waters report 54/2001
12
Trend results - Nitrate in surface waters 1989-1998
0
2
4
6
8
10
12
14
16
-1.96 1.96
SKT Z-score
n s
ites
0
Figure 2. Trend results showing SKT Z-scores for NO3
-, for all the analysed sites (n=98). Negative scores indicate decreasing trends, while positive scores indicate increasing trends. Scores > 1.96 or < -1.96 are significantly different from 0 at p< 0.05. The positive slopes are blue and the negative are red.

ICP Waters report 54/2001
13
Table 2. Trends in NO3 concentration at ICP Waters sites in each country 1989-1998. Z-score > 1.96 or < -1.96 are significant at p<0.05. Statistically significant trends are indicated in bold. Unit of slope is µeq L-1. The results are taken from Skjelkvåle et al. 2000).
Site Z-score Slope Site Z-score Slope Site Z-score Slope Site Z-score Slope
CA01 0.84 0.1 DE06 -1.98 -6.5 IT01 -1.19 -0.6 UK01 1.10 0.0
CA02 1.13 0.3 DE07 -2.56 -7.1 IT03 0.08 0.0 UK04 2.02 1.3
CA03 1.95 0.6 DE08 -0.73 -0.2 IT05 1.89 1.6 UK07 2.62 0.8
CA04 2.38 0.4 DE10 0.43 0.6 IT06 1.72 1.5 UK10 0.33 0.3
CA05 0.77 0.2 DE11 -1.80 -1.0 NO01 -2.29 -0.3 UK15 0.76 0.3
CA06 0.89 0.0 DE12 -2.63 -1.6 NO03 1.19 0.0 UK21 1.07 1.0
CA07 1.64 0.2 DE15 -1.50 -1.3 NO04 1.86 0.0 US07 0.00 0.0
CA08 -1.81 -0.2 DE17 -0.76 -0.8 NO05 1.98 0.1 US08 0.19 0.0
CA09 2.49 0.3 DE18 -0.36 0.0 NO06 -0.35 -0.1 US09 0.00 0.0
CA11 1.27 0.0 DE20 0.95 0.7 NO07 0.84 0.1 US10 -0.16 0.0
CA13 2.48 0.1 DE21 -1.93 -7.1 NO08 -0.26 0.0 US11 -1.79 -0.4
CA14 2.33 0.1 DE22 -1.56 -3.8 NO09 2.00 0.2 US12 -0.35 -0.3
CA16 0.00 0.0 DE23 -2.87 -1.8 NO10 -0.44 -0.1 US13 -1.37 -1.0
CA17 1.18 0.0 DE26 -1.69 -1.7 PL01 -2.65 -2.8 US14 -1.07 -0.4
CZ01 -1.64 -1.3 DE27 -1.63 -1.3 PL02 -1.90 -1.5 US15 -1.80 -1.0
CZ02 -1.67 -1.4 DE31 -1.46 -11.4 SE01 -0.97 -0.1 US16 -1.66 -0.9
CZ03 -0.74 -0.9 DE32 -0.51 -0.3 SE02 0.75 0.1 US17 -1.34 -0.6
CZ04 0.98 0.7 DE33 -3.03 -5.4 SE03 -0.97 -0.3 US19 -0.46 0.0
CZ05 0.20 0.3 FI01 1.28 0.2 SE05 -0.25 0.0 US20 0.40 0.0
CZ06 -0.08 0.0 FI02 0.92 0.1 SE06 -1.10 0.0 US21 -0.10 0.0
DE01 1.66 0.5 FI03 -0.31 0.0 SE08 0.91 0.3 US22 -1.94 -5.6
DE02 1.71 0.6 FI05 -0.85 0.0 SE09 -2.25 -0.8 US23 -2.10 -2.5
DE03 1.67 1.2 FI06 -1.15 0.0 SE10 1.14 0.1 US24 -1.82 -1.9
DE05 -0.35 0.0 FI08 0.91 0.1 SE11 -1.68 -0.1
SE12 -2.90 -0.6
Table 3. Number of sites with significant increasing or decreasing (p< 0.05) NO3
- trends from 1989-1998 in the different countries. Number of Sites with: Country Total Number of
Sites Upward Trends
Downward Trends
Canada 14 4 Czech republic 6 Finland 6 Germany 22 5 Italy 4 Norway 9 2 1 Poland 2 1 Sweden 10 2 U.K. 6 2 U.S. 17 1 Total 96 8 10

ICP Waters report 54/2001
14
4.2 Trends in deposition
Emissions and following deposition of oxidized and reduced N (NO3+NH4 )have increased substantially the last 50-100 years, and reached their maximum in the late 1980ies and early 1990ies. Levels have decreased somewhat during the late 1990s in Central and Northern Europe, in response to modest declines in emissions (Tarrason and Schaug 2000). Trend analyses on the EMEP data conducted by Barrett et al. 2000a) and Barrett et al. 2000b) indicate a decline in deposition of N of approximately 20% in Central Germany and Southern Scandinavia during the period 1989-1998. This is interpreted as a response to declining emissions of N compounds during the 1990s. For a selection of EMEP sites situated in the same region as the ICP Waters sites (Table 4 and Figure 3) we have calculated trends in NO3+NH4 deposition for the time period 1989-1998. Only the Finnish and the Swedish sites show significant changes in N deposition in this period, and in Sweden one site shows an increasing and the other a decreasing trend. Measured wet deposition of N compounds at EMEP sites shows relatively large year-to-year variations, probably mainly due to natural variations in meteorological conditions such as advections patterns and amount of precipitation. This “noise” in the record thus means that trends in N deposition, therefore, must be relatively large before they become statistically significant. This probably explains why there are no significant trends in N deposition during the 1990s at many of the EMEP sites. Table 4. Linear regression of annual NO3+NH4 deposition 1989-98 at 16 EMEP sites in 9 countries in Europe. Significant trends indicated in bold. NS: not significant. Units: kg N ha-1 yr-1. Country EMEP-site slope r2 p
Czech Republic CZ01 Svratouch +.05 0.04 NS
Germany DE02 Langenbrügge -.10 0.05 NS
DE03 Schauinland -.42 0.28 NS
DE05 Brotjackriegel -.12 0.07 NS
Finland FI04 Ahtari -.24 0.66 <0.05
FI09 Uto -.08 0.90 <0.05
UK GB 06 Lough Navar -.11 0.30 NS
GB02 Eskdalemuir +.22 0.37 NS
GB15 Strath Vaich -.05 0.29 NS
Italy IT04 Ispra -.52 0.20 NS
Norway NO01 Birkenes -.42 0.48 NS
NO08 Skreådalen -.34 0.29 NS
Poland PL02 Jarczew 0 0 NS
Sweden SE02 Rorvik -.43 0.70 <0.05
SE12 Aspvreten +.23 0.64 <0.05
Switzerland CH01 Jungfraujoch -.23 0.42 NS

ICP Waters report 54/2001
15
Germany
0
10
20
30
80 82 84 86 88 90 92 94 96 98Year
kgN
ha-
1 yr
-1
DE02 LangenbrüggeDE03 SchauinslandDE05 Brotjackriegel
Norway
0
10
20
30
80 82 84 86 88 90 92 94 96 98
Year
kgN
ha-
1 yr
-1
NO01 Birkenes
NO08 Skreådalen
UK
0
10
20
30
80 82 84 86 88 90 92 94 96 98Year
kgN
ha-
1 yr
-1
GB 06 Lough Navar
GB02 Eskdalemuir
GB15 Strath Vaich
Czech Republic, Poland
0
10
20
30
80 82 84 86 88 90 92 94 96 98Year
kgN
ha-
1 yr
-1
CZ01 Svratouch
PL02 Jarczew
Sweden
0
10
20
30
80 82 84 86 88 90 92 94 96 98Year
kgN
ha-
1 yr
-1
SE02 Rorvik
SE12 Aspvreten
Italy, Switzerland
0
10
20
30
80 82 84 86 88 90 92 94 96 98Year
kgN
ha-
1 yr
-1
IT04 Ispra
CH01 Jungfraujoch
Finland
0
10
20
30
80 82 84 86 88 90 92 94 96 98Year
kgN
ha-
1 yr
-1
FI04 Ahtari
FI09 Uto
Figure 3. Measured wet deposition of nitrogen (NO3 + NH4) at several EMEP stations in Europe (data from EMEP Chemical Coordinating Centre http://www.nilu.no/projects/ccc , Barrett et al. 2000a).

ICP Waters report 54/2001
16
4.3 Nitrate in Runoff
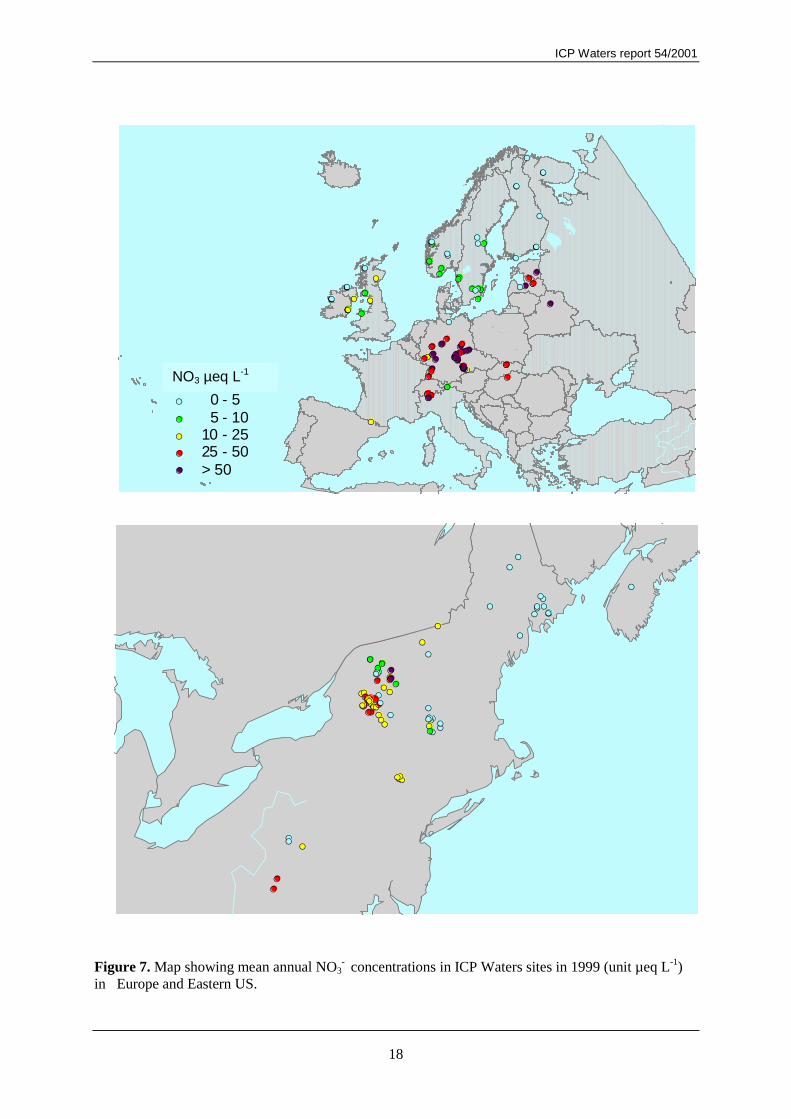
About 1/3 of the ICP sites (located primarily in the Nordic countries, Ireland, Canada and the U.S.) have mean annual concentrations of NO3
- below 5 µeq L-1 (Figure 4). More than half of the sites have NO3
- concentrations above 10 µeq L-1. Due to the episodic pattern of NO3- at many sites, the
significance of NO3- in acidification is often greater than shown by average figures. Mean
concentrations greater than 50 µeq L-1 are found at 14% of the sites, mainly in Germany, Latvia, Estonia, Italy, Czech Republic, Belarus and Hungary. In total, the results suggest that a large fraction of the ICP Waters sites have NO3
- concentrations above those expected from catchments with no impact from N deposition (Stoddard 1994). Although all sites are among the least disturbed in each country, agricultural influences may affect some of the highest NO3
- concentrations. Unweighted mean values, as used here, may underestimate actual annual means, particularly in catchments with heavy snowmelt in spring. The results for the ICP Waters sites should therefore be considered conservative estimates of mean NO3
- concentrations.
Nitrate 1999All sites n=204
0
10
20
30
40
0-5 >5-10 >10-25 >25-50 > 50
Nitrate, µeq L-1
%
Figure 4. Frequency distribution of mean annual NO3
- concentrations for the 204 ICP Waters sites with data from 1999 (a few sites 1998; see Appendix A).

ICP Waters report 54/2001
17
The frequency distribution of NO3 concentrations is approximately the same for 150 sites with data from 1990/92 and 1999 (Figure 5). There has been some increase in sites with NO3
- in the range from 25-50 µeq L-1, and decrease in all the other groups.
All sites n=150
0
10
20
30
40
0-5 >5-10 >10-25 >25-50 >50
Nitrate, µeq L-1
%
90/92
99
Figure 5. Frequency distribution of mean annual NO3- concentrations at 150 ICP Waters sites with
data from 1999 and the period 1990-92. A division of data between Europe and US reveals that most of the increase in NO3
- from 1990/92 to 1999 has occurred in the US sites, while the European sites show tendency towards decrease in NO3
-
(Figure 6).
European sites n=91
0
10
20
30
40
0-5 >5-10 >10-25 >25-50 >50
Nitrate, µeq L-1
%
90/92
99
US sites n=59
0
10
20
30
40
0-5 >5-10 >10-25 >25-50 >50
Nitrate, µeq L-1
%
90/92
99
Figure 6. The same data shown in Figure 5 but divided between North America and Europe.
ICP Waters report 54/2001
18
#S
#S
#S#S#S#S#S#S#S
#S
#S #S
#S
#S#S
#S
#S
#S#S
#S#S#S
#S
#S
#S#S#S #S#S
#S
#S#S
#S#S
#S#S#S#S
#S#S
#S
#S
#S#S#S
#S#S
#S
#S
#S
#S#S#S#S
#S#S#S
#S#S#S#S#S
#S#S#S#S#S#S
#S#S#S #S#S
#S
#S
#S
#S#S
#S#S#S
#S
#S#S
#S#S
#S
#S#S
#S#S
#S
#S#S
#S#S
#S#S
#S#S
#S
#S
#S#S
#S#S
#S
#S#S#S
#S
#S
#S
#S#S#S#S
#S#S#S#S#S #S
#S#S
#S#S#S#S#S#S #S#S#S#S#S#S#S #S
#S#S
#S#S#S
#S
#S
#S
#S
#S
#S#S#S#S
#S
#S#S#S
#S
#S
#S#S
#S#S
#S
#S
#S
#S
#S
#S
#S#S
#S
#S
#S
#S
#S
#S#S
#S
#S#S
#S
#S#S
#S#S
#S#S
#S
#S
NO3N (µeq/l)#S 0 - 5#S 5 - 10#S 10 - 25#S 25 - 50#S > 50
Figure 7. Map showing mean annual NO3
- concentrations in ICP Waters sites in 1999 (unit µeq L-1) in Europe and Eastern US.
NO3 µeq L-1

ICP Waters report 54/2001
19
4.4 Relative importance of Nitrate and Sulphate
The importance of NO3- in acidification relative to SO4
2- can be quantified by ratio N/S defined as the concentration of NO3
- divided by the sum of non-marine SO42- (denoted by asterisk) and NO3
- (µeq L-1): N/S = NO3
- /(SO4* + NO3-).
N/S is > 0.1 at about 55% of the 204 ICP-sites in 1999 (Figure 8), but only 5% have N/S values > 0.5. At these sites NO3
- makes a greater contribution to acidification than SO42-. These sites are situated in
Germany and Italy (Figure 11). This means that for the majority of ICP Waters sites, on annual mean basis, SO4
2- is still the dominant acidifying ion.
N/S 1999All sites n=204
0
10
20
30
40
0-0.05 0.05-0.1 0.1-0.25 0.25-0.5 >0.5
N/S
%
Figure 8. Relative importance of NO3
- in acidification in 204 sites with data from 1999 (a few sites from 1998 (see Appendix A. ).

ICP Waters report 54/2001
20
Comparison with the frequency distribution of N/S in the 1990/92 data from 147 ICP sites indicates that there has been a systematic shift to larger values (Figure 9). NO3
- plays a larger role in acidification in 1999 relative to 1990/92. This is most certainly due to the decline in SO4
2- concentration over this period, rather than an increase in NO3
- concentrations.
All sites n=147
0
10
20
30
40
0-0.05 >0.05-0.10 >0.10-0.25 >0.25-0.50 >0.50
N/S
%
90/92
99
Figure 9. Relative importance of NO3
- in acidification at 147 ICP Waters sites in 1999 compared to the period 1990/92 for the same sites. A division of data between US and Europe (Figure 10) show that for the US sites, there has been a shift towards higher N/S from a median value of 0.07 in 1990/92 to 0.16 in 1999, while for the European sites there has been a shift from N/S at 0.16 to 0.20 from 1990/92 to 1999.
European sites n=88
0
10
20
30
40
50
60
70
0-0.05 >0.05-0.10
>0.10-0.25
>0.25-0.50
>0.50
N/S
%
90/92
99
US sites n=59
0
10
20
30
40
50
60
70
0-0.05 >0.05-0.10
>0.10-0.25
>0.25-0.50
>0.50
N/S
%
90/92
99
Figure 10. The same data as shown in Figure 9 but divided between North America and Europe.

ICP Waters report 54/2001
21
#S
#S
#S#S#S#S#S#S#S
#S
#S #S
#S
#S#S
#S
#S
#S#S
#S#S#S
#S
#S
#S#S#S #S#S
#S
#S #S#S
#S#S#S#S#S
#S#S
#S
#S
#S#S#S
#S#S
#S
#S
#S
#S#S#S#S
#S#S#S
#S#S#S#S
#S#S#S#S#S#S
#S#S#S #S#S
#S
#S
#S
#S#S
#S#S#S
#S
#S#S
#S#S
#S
#S#S
#S#S
#S
#S#S
#S#S
#S#S
#S#S
#S
#S
#S#S
#S#S
#S
#S#S#S
#S
#S
#S
#S#S#S#S
#S#S#S#S#S #S
#S#S
#S#S#S#S#S#S #S#S#S#S#S#S#S #S
#S#S
#S#S#S
#S
#S
#S
#S
#S
#S#S#S#S
#S
#S#S#S
#S
#S
#S#S
#S#S
#S
#S
#S
#S
#S
#S
#S#S
#S
#S
#S
#S
#S
#S#S
#S
#S#S
#S
#S#S
#S#S
#S#S
#S
#S
KNS#S 0 - 0.05#S 0.05 - 0.10#S 0.10 - 0.25#S 0.25 - 0.50#S > 0.5 0
Figure 11. Map showing N/S (ICP Waters sites in 1999 Europe and Eastern US. N/S = NO3
- /(SO4* + NO3
- ) in µeq L-1.
N/S

ICP Waters report 54/2001
22
4.5 Nitrogen Deposition and Inorganic Nitrogen in Runoff
Empirical data from forested ecosystems in Europe show a relationship between N deposition and N loss (Dise and Wright 1995, Gundersen et al. 1998). These data indicate very little NO3
- leaching occurs at N deposition below 9-10 kg N ha-1 yr-1, leaching can occur at intermediate deposition between 9 and 25 kg N ha-1 yr-1, and significant leaching occurs at most all sites receiving deposition greater than 25 kg N ha-1 yr-1. These thresholds are based on data from monitoring plots across a gradient of current N deposition in Europe and from several experimental sites. Input/output data for NO3
- are not available for most of the ICP Waters sites. However, a general view of N leakage is obtained by comparing the concentrations in runoff (NO3
- + NH4+) and estimated total
(wet + dry) N deposition fluxes (Figure 12). Deposition fluxes are values for the 50x50 km EMEP grids in which the respective ICP Waters sites are situated. The North American sites are not included in this analysis. The results support the general picture that increased N leakage occurs in catchments receiving N deposition above some threshold. Some catchments have a pronounced NO3
- leakage at a total N deposition as low as 5 kg N ha-1 yr-1. In the case of the Latvian, Estonian and the Belarussian sites (marked with open circles in the figure) influence of agriculture (e.g., pasture land) on water quality cannot be excluded. For North American sites (Stoddard 1994) observed substantial N-leakage at wet deposition as low as 2.5 kg N ha-1 yr-1, corresponding to a wet + dry deposition of approximately 5 kg N ha-1 yr-1. The possible difference in threshold values between the European and North American continents is an interesting phenomenon whose explanation is not yet available.
N in runoff and deposition (1998) for European sites n = 99
0
50
100
150
200
250
0 5 10 15 20 25 30 35
N-deposition kg N ha-1 yr-1
run
off
NO
3- + N
H4+ µ
eq L
-1
lower threshold value upper threshold value
Figure 12. Nitrogen (NO3
- + NH4+) concentration in runoff and total N deposition fluxes (wet + dry)
for 99 European ICP Waters sites in 1999. The deposition data are 1998 values for the EMEP 50*50 grids in which the respective sites are situated (data from Tarrason and Schaug 2000). Threshold values of 10 and 25 kg N ha-1 yr-1 are from Dise and Wright 1995). Absolute threshold values for ICP Waters sites are uncertain for several reasons: the deposition data are not site specific; the sampling frequency is low at many sites; the amount of N leaked is influenced

ICP Waters report 54/2001
23
by both deposition and the duration of the deposition; N concentrations in runoff (instead of N fluxes) were compared with modelled N deposition fluxes; the site selection does not necessarily include the most sensitive sites with respect to N leakage; the threshold may be different for non-forested ecosystems; for lakes there may be a significant amount of retention of N in the lake itself. Despite these uncertainties, the data in Figure 12 are in reasonably good agreement with the data from Dise and Wright 1995) and Gundersen et al. 1998).
4.6 Classification of Nitrogen saturation
Nitrogen is the growth-limiting nutrient in many terrestrial ecosystems. Long-term atmospheric N deposition may lead to a situation where the availability of inorganic N is in excess of the total amounts required for the growth of plants and soil micro-organisms. N saturation is defined here as persistent losses of NO3
- and/or NH4+ in streamflow or groundwater discharge, which may be
accompanied by increases in N mineralisation and nitrification in soil (Stoddard 1994). Stoddard 1994) has elaborated the term “persistent” by addressing short-term temporal variations in NO3
- leaching from catchments thus considering the seasonality of biological N turnover processes. He names different stages in a hypothetical time course through which ecosystems can pass if atmospheric N deposition remains high or increases. The N cycle at Stage 0 is dominated by forest and microbial uptake governing the seasonal NO3
-
pattern of runoff water. Nitrate concentrations are very low during most of the year, and measurable concentrations may only be found during snowmelt or major hydrologic events. At Stage 1, this pattern is amplified: the switch from physical to nutrient limitation in spring is postponed. Substantial NO3
- may leave the catchment during extreme hydrological events, resulting in peaks of episodically high NO3
- concentrations. In Stage 2, the seasonal onset of N limitation is even further delayed so that biological demand no longer controls NO3
- concentrations in winter and spring. The period of N limitation during the growing season is much reduced. Additional nitrification, stimulated by a build-up of NH4 in soils, results in an increase in NO3
- baseflow concentrations to levels as high as those found in deposition. Stage 3 is characterised by a lack of any coherent seasonal pattern in NO3
-
output. Mineralisation of stored N can add substantially to NO3- output in surface waters, which may,
together with gaseous emissions (N2O), exceed inputs from N deposition alone. The original criteria of Stoddard 1994) were adapted for the range of sampling frequencies that are used to collect the ICP Waters data (for details see Stoddard and Traaen 1995; Traaen and Stoddard 1995). Separate criteria for sites with frequent samples and infrequent samples were developed in order to characterise the majority of available ICP Waters; the inclusion of sites with relatively infrequent samples (<4 times per year) made it difficult to separate Stages 0 and 1, and Stages 2 and 3, and resulted in two classifications in addition to Stoddard’s Stages 0 through 3 (Stage 0/1 and Stage 2/3). Typical seasonal NO3
- patterns for sites in each country in various N saturation stages are illustrated in Figure 13. The distribution of N saturation stages in 1998 among all of the sites in ICP Waters is shown in Figure 14 and Figure 16. About half of the 108 ICP sites exhibit a high degree of N saturation (Stage 2 or 3) in 1998. Such sites are found predominantly in Central Europe, although 2 of the Swedish sites are also classed as Stage 2. Most of the sites in the Scandinavian countries are classed Stage 0 or 1 (Figure 16). Thirty-six of the sites were also classified in 1990/92. Of these 24 had no change in N-saturation stage from 1990/92 to 1998, while 8 went down and 4 went up (Figure 15).

ICP Waters report 54/2001
24
Figure 13. Seasonal NO3
- patterns for typical sites illustrating the various N saturation stages.
Stage 3 - DE27 Vorderer Schachtenbach, Germany
0
400
800
1200
1600
2000
89 90 91 92 93 94 95 96 97 98 99 00
NO
3-N
µg
L-1
Stage 2 - SE08 Brunnsjøn, Sweden
0
100
200
300
400
89 90 91 92 93 94 95 96 97 98 99 00
NO
3-N
µg
L-1
Stage 1 - US11 Arbutus Lake, Adirondacks, US
0
200
400
600
800
89 90 91 92 93 94 95 96 97 98 99 00
NO
3-N
µg
L-1
Stage 0 - NO03 Langtjern, Norway
0
50
100
150
89 90 91 92 93 94 95 96 97 98 99 00
NO
3-N
µg
L-1

ICP Waters report 54/2001
25
N-saturation stages 1998 - US n=90
0
10
20
30
40
0 0/1 1 1/2 2 2/3 3
N-saturation stages
Num
ber
of s
ites
US
N-saturation stages in 1998 - Europe n=108
0
10
20
30
40
0 0/1 1 1/2 2 2/3 3
N-saturation stage
Num
ber
of s
ites
Europe
Figure 14. Number of ICP Waters sites in various stages of N saturation in 1998 (stages modified from Stoddard (1994); criteria for assigning sites to stages explained in Traaen and Stoddard (1995)) for US and European and ICP Waters sites.
N-saturation stages 1990/92 and 1998 n=36
0
5
10
15
20
0 1 2 3stages
n s
ites
90/92
1998
Figure 15. Comparison of N-saturation stages between 1998 and 1990/92 for 36 ICP sites.

ICP Waters report 54/2001
26
Figure 16. Map showing N-saturation stages in ICP Waters sites in Europe. N saturation stages modified from Stoddard (1994); criteria for assigning sites to stages explained in Traaen and Stoddard (1995).

ICP Waters report 54/2001
27
4.7 Relationship between N deposition and N saturation Stage
There is a clear connection between N deposition and Stage classification at European ICP Waters sites (Figure 17). N deposition levels are all below 10 kg N ha-1 yr-1 at Stages 0 and 1, while at Stages 3 no sites had deposition below 10 kg N ha-1 yr-1. This is the same general picture as found in the evaluation of 1990/92 data (Traaen and Stoddard 1995). The picture confirms that there is a correlation between N-saturation stages and the general deposition level.
Deposition vs. N-stages for European sites 1998 n=82
N saturation stage
Dep
osi
tio
n,
kg N
ha
-1 y
r-1
0 1 2 3
4.35.5
14.8
18.3
10
20
30
40
Figure 17. Relationship between N deposition (wet + dry, estimated from EMEP grid data) and stages of N saturation in 1998 for 82 European ICP Waters sites (North America not included). Average values are indicated by horizontal bars, and the numbers indicate average deposition value in kg N ha-1 yr-1.
ICP Waters report 54/2001
28
5. Reference List
Aber, J. D., Nadelhoffer, K. J., Steudler, P., and Melillo, J. 1989. Nitrogen saturation in northern forest
ecosystems. Bioscience 39: 378-386.
Barrett, K., Aas, W., Hjellbrekke, A. G., Tarrason, L., and Schaug, J. 2000. An evaluation of trends for concentrations in air and precipitation, p.41-58, In: Tarrason, L. and Schaug, J., Transboundary Acidification and Eutrophication in Europe. EMEP Summary Report 2000, Norwegian Meteorological Institute, Oslo, Norway.
Barrett, K., Schaug, J., Bartonova, A., Semb, A., Hjellbrekke, A. G., and Hanssen, J. E. 2000. A contribution from CCC to the reevaluation of the observed trends in sulphur and nitrogen in Europe 1978–1998. CCC Report 7/2000, Norwegian Institute for Air Research, Kjeller, Norway. 205 pp.
Dise, N. B. and Wright, R. F. 1995. Nitrogen leaching from European forests in relation to nitrogen deposition. For.Ecol.Manage. 71: 153-162.
Driscoll, C. T. and van Dreason, R. 1993. Seasonal and long-term temporal patterns in the chemistry of Adirondack lakes. Water Air Soil Pollut. 67: 319-344.
Gundersen, P., Callesen, I., and de Vries, W. 1998. Nitrate leaching in forest ecosystems is controlled by forest floor C/N ratio. Environ.Pollut. 102: 403-407.
Henriksen, A. and Brakke, D. F. 1988. Increasing contributions of nitrogen to the acidity of surface waters in Norway. Water Air Soil Pollut. 42: 183-201.
Hovind, H. 2000. Trends in intercomparisons 8701-9812: pH, K25, NO3 + NO2, Cl, SO4, Ca, Mg, Na, K and aluminium - reactive and nonlabile, TOC, COD-Mn. NIVA-Report SNO 4281-2000, ICP Waters Report 56/2000. ISBN 82-577-3910-3.
Jeffries, D.S. Semkin, R.G., Beall, F.D. and franklyn, J. 2001. Temporal trends in water chemistry in the Turkey Lakes Watershed, Ontario, Canada, 1982-1999. Water Air Soil Pollut.:Focus.: in press.
Kopácek, J., Stuchlík, E., Fott, J., Veselý, J., and Hejzlar, J. 1998. Reversibility of acidification of mountain lakes after reduction in nitrogen and sulfur emissions in central Europe. Limnol.Oceanog. 43: 357-361.
Lükewille, A., Jeffries, D. S., Johannessen, M., Raddum, G. G., Stoddard, J. L., and Traaen, T. S. 1997. The Nine Year Report: Acidification of surface water in Europe and North America - Long-term Developments (1980s and 1990s). ICP-Waters Report 41/97 NIVA-report SNO 3637-97, Norwegian Institute for Water Research, Oslo. 168 pp.
Mitchell, M. J., Driscoll, C. T., Kahl, J. S., Likens, G. E., Murdoch, P. S., and Pardo, L. H. 1996. Climatic control of nitrate loss from forested watersheds in the Northeast United States. Environ.Sci.Technol. 30: 2609-2612.

ICP Waters report 54/2001
29
Monteith, D. T., Evans, C. D., and Reynolds, B. 2000. Are temporal variations in the nitrate content of UK upland freshwaters linked to the North Atlantic Oscillation? Hydrological Processes 14: 1745-1749.
Murdoch, P. S. and Stoddard, J. L. 1993. Chemical characteristics and temporal trends in eight streams of the Catskill Mountains, New York. Water Air Soil Pollut. 67: 367-395.
Norwegian Institute for Water Research. 1996. Progamme Manual. NIVA-report SNO 3547-96, Norwegian Institute for Water Research, Oslo, Norway. 37 pp.
Skjelkvåle, B. L., Andersen, T., Halvorsen, G. A., Heegaard, E., Stoddard, J. L., and Wright, R. F. 2000. The 12-year report; Acidification of surface water in Europe and North America; trends, biological recovery and heavy metals. SNO 4208/2000, ICP Waters report 52/2000, Norwegian Institute for Water Research, 108 pp.
Skjelkvåle, B. L., Newell, A. D., Raddum, G. G., Johannessen, M., Hovind, H., Tjomsland, T., and Wathne, B. M. 1994. The six year report: Acidification of surface water in Europe and North America. Dose/response relationships and long-term trends. NIVA-report SNO 3041-94, Norwegian Institute for Water Research, Oslo, Norway. 135 pp.
Stoddard, J. L. 1994. Long-Term Changes in Watershed Retention of Nitrogen: its causes and aquatic consequences, p.223-284, In: Baker, L. A., Environmental Chemistry of Lakes and Reservoirs, ACS Advances in Chemistry Series no. 237., American Chemical Society, Washington,DC.
Stoddard, J. L., Driscoll, C. T., Kahl, J. S., and Kellogg, J. H. 1998. A regional analysis of lake acidification trends for the northeastern U.S., 1982-1994. Environmental Monitoring and Assessment 51: 399-413.
Stoddard, J. L., Jeffries, D. S., Lükewille, A., Clair, T. A., Dillon, P. J., Driscoll, C. T., Forsius, M., Johannessen, M., Kahl, J. S., Kellogg, J. H., Kemp, A., Mannio, J., Monteith, D., Murdoch, P. S., Patrick, S., Rebsdorf, A., Skjelkvåle, B. L., Stainton, M. P., Traaen, T. S., van Dam, H., Webster, K. E., Wieting, J., and Wilander, A. 1999. Regional trends in aquatic recovery from acidification in North America and Europe 1980-95. Nature 401: 575-578.
Stoddard, J. L. and Traaen, T. S. 1995. The stages of nitrogen saturation: Classification of catchments included in "ICP on waters"., p.69-76, In: Hornung, M., Sutton, M. A., and Wilson, R. B., Mapping and modelling of critical loads for nitrogen - a workshop report. Proceedings of the Grange-over-Sands Workshop 24-26 October 1994, Institute of Terrestrial Ecology, Edinburgh, UK.
Tarrason, L. and Schaug, J. 2000. Transboundary Acidification and Eutrophication in Europe. EMEP Summary Report 2000. EMEP/MSC-W 1/2000, Norwegian Meteorological Institute, Oslo, Norway. 264 pp.
Traaen, T. S. and Stoddard, J. L. 1995. An Assessment of Nitrogen Leaching from Watersheds included in ICP on Waters. Convention on Long-Range Transboundary Air Pollution SNO 3201-95, Norwegian Institute for Waters Research, Oslo. 39 pp.
UN/ECE. 1996. Manual on Methodologies and Criteria for Mapping Critical Levels/Loads and Geographical Areas where They are Exceeded. UN/ECE Convention on Long-range Transboundary Air Pollution Texte 71/96, Federal Environmental Agency (Umweltbundesamt), Berlin.

ICP Waters report 54/2001
30
Vesely, J. Majer, V. and Norton S.A. 2001. Heterogeneous response of Central European Freshwaters to decreased acidic atmospheric deposition. Submitted to Environmental Poll.
Wathne, B. M. 1991. The Three Year Report: Summary and Results 1987-1989. Norwegian Institute for Water Research, Oslo, Norway. 205 pp.
Wright, R. F., Alewell, C., Cullen, J., Evans, C. D., Marchetto, A., Moldan, F., Prechtel, A., and Rogora, M. 2001. Trends in nitrogen deposition and leaching in acid-sensitve streams in Europe. Hydrol.Earth System Sci. in press:

ICP Waters report 54/2001
31
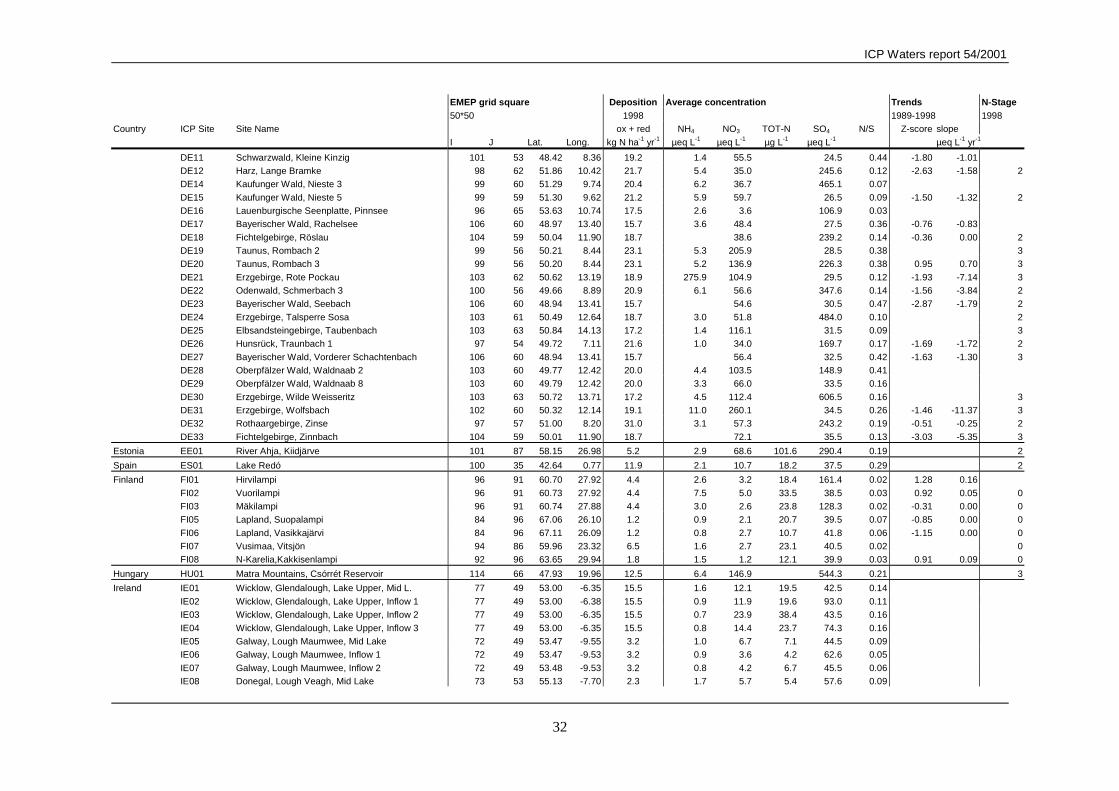
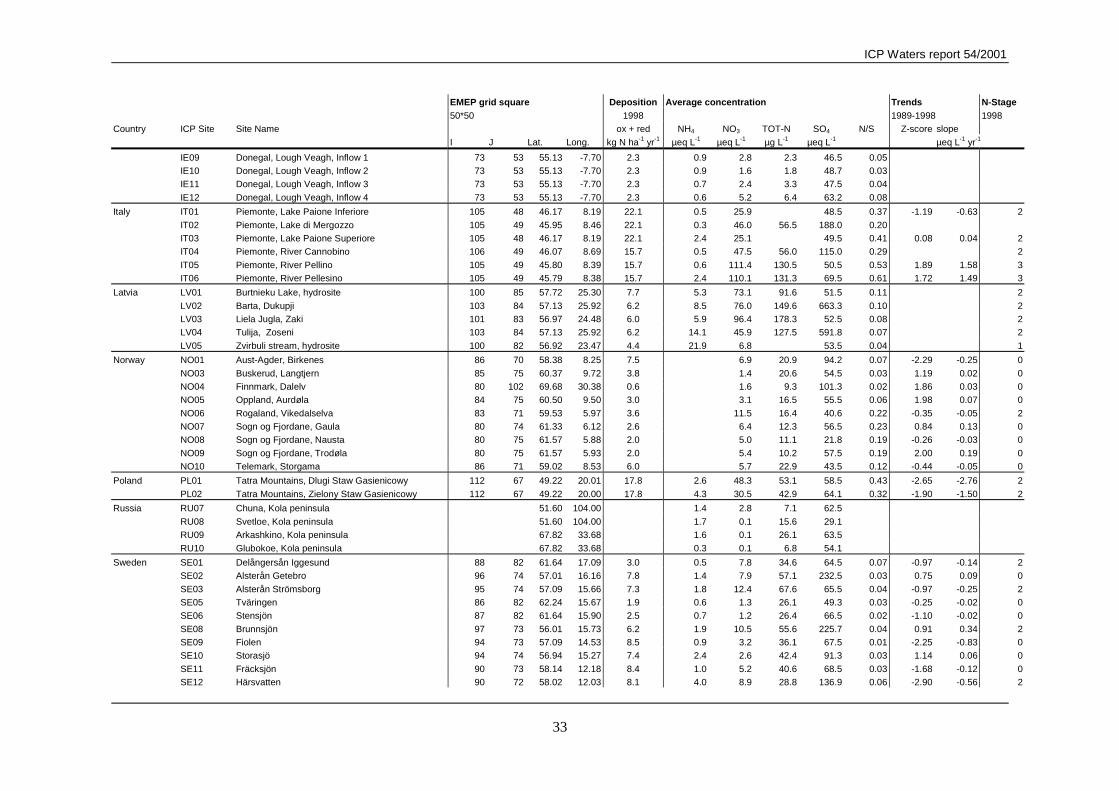
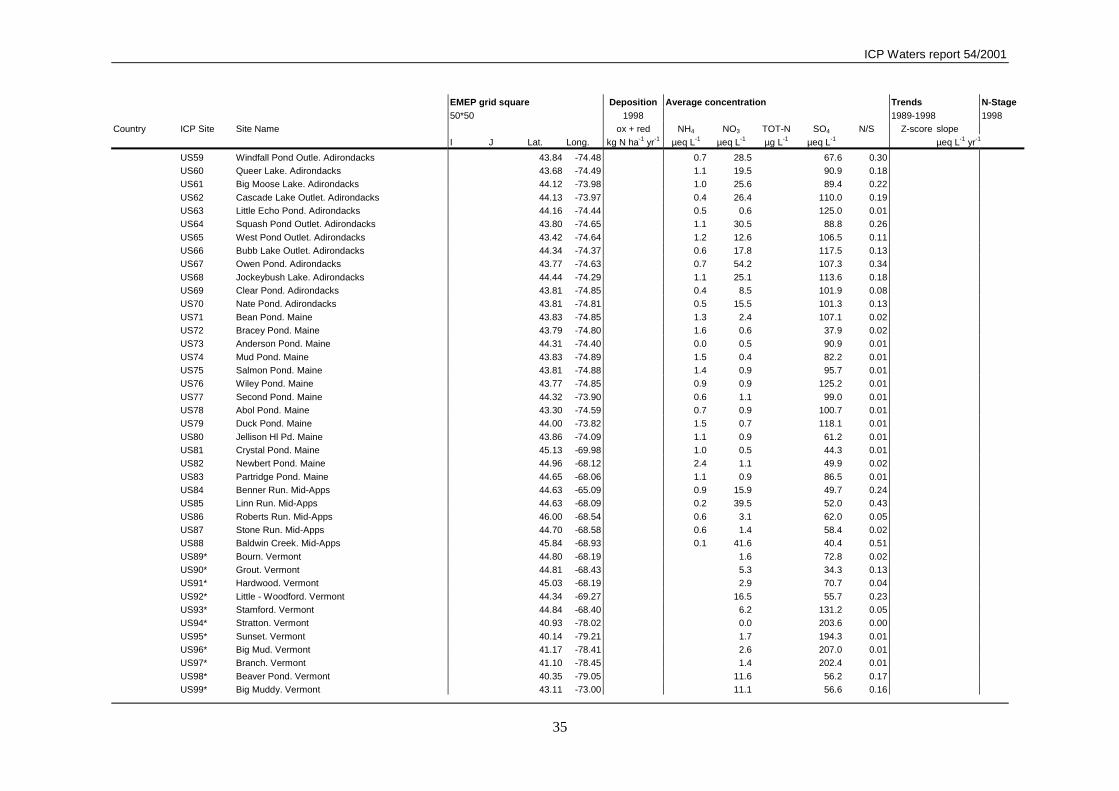
Appendix A. Data
Results from single sites are listed in this table. • Location, EMEP 50*50 grid cell (EMEP grid cell do not exist for US and Canda) • Deposition 1998 for the EMEP grid cell • Average concentration in 1998/1999 (* indicates data only from 1998, ** data only from 1997) • N/S is (NO3
-/(NO3-+SO4
2-)). • SKT Z-scores and Theil trend slope for NO3
- for the period 1989-1998. Negative scores indicate decreasing trends, while positive scores indicate increasing trends. Scores > 1.96 or < -1.96 are significantly different from 0 at the p <0.05 level.
• Estimated N-stage, based on 1998 data.
EMEP grid square Deposition Average concentration Trends N-Stage 50*50 1998 1989-1998 1998
Country ICP Site Site Name ox + red NH4 NO3 TOT-N SO4 N/S Z-score slope
I J Lat. Long. kg N ha-1 yr-1 µeq L-1 µeq L-1 µg L-1 µeq L-1 µeq L-1 yr-1
Austria AU03 Tirol, Schwarzsee ob Sölden 107 54 46.96 10.94 19.6 0.6 7.5 105.2 0.07
Belarus BY01 Berezinsky Biosphere Reserve 108 84 54.73 28.35 11.1 28.9 47.8 77.6 7.5 0.24 3
Canada CA01 Ontario, Algoma Region, Batchawana Lake 47.06 -84.39 4.7 19.9 40.6 95.1 0.17 0.84 0.08
CA02 Ontario, Algoma Region, Wishart Lake 47.04 -84.40 2.4 36.2 41.9 8.5 0.27 1.13 0.33 CA03 Ontario, Algoma Region, Little Turkey Lake 47.04 -84.41 3.3 33.2 39.9 100.7 0.25 1.95 0.61
CA04 Ontario, Algoma Region, Turkey Lake 47.05 -84.41 2.8 30.1 36.0 9.5 0.22 2.38 0.38 CA11 Nova Scotia, Mountain Lake 44.32 -65.26 1.4 5.9 34.9 0.04 1.27 0.00 CA13 Nova Scotia, Kejimkujik Lake 50.58 -60.38 1.4 7.7 38.1 0.04 2.48 0.10
Switzerland CH05 Laghetti (Lago Inferiore), Ticino 1.4 19.9 39.5
Czech CZ01 Bohemian Forest, erné 106 59 49.18 13.18 20.5 2.1 69.2 16.5 0.42 -1.64 -1.30 3
Republic CZ02 Bohemian Forest, ertovo 106 59 49.17 13.20 20.5 5.4 47.3 112.7 0.30 -1.67 -1.38 2 CZ03 Bohemian Forest, Plešné 107 60 48.78 13.87 16.5 2.1 32.0 17.5 0.20 -0.74 -0.90 2 CZ04 Bohemian Forest, Prášilské 106 59 49.08 13.40 20.5 1.9 39.6 66.1 0.37 0.98 0.68 2
CZ05 Bohemian Forest, Laka 106 59 49.12 13.33 20.5 2.1 42.6 18.5 0.46 0.20 0.33 2 CZ06 Bohemian Forest, Zd´árské 106 60 48.93 13.65 15.7 1.4 6.6 136.2 0.05 -0.08 0.00 (2)
Germany DE01 Schwarzwald, Dürreychbach 101 54 48.75 8.44 21.1 1.6 88.9 19.5 0.54 1.66 0.51
DE02 Fichtelgebirge, Eger 103 59 50.09 11.82 20.1 56.4 100.0 0.36 1.71 0.59 3 DE03 Rothaargebirge, Elberndorfer Bach 97 58 50.99 8.20 30.4 3.2 78.9 20.5 0.22 1.67 1.22 3
DE04 Sächsische Tieflandsbucht, Ettelsbach 102 62 51.12 12.76 18.2 6.6 163.9 3591.7 0.04 3 DE05 Schwarzwald, Goldersbach 101 52 47.87 8.06 19.3 1.9 41.6 21.5 0.37 -0.35 0.00 DE06 Hunsrück, Gräfenbach 98 56 49.92 7.62 22.4 1.5 40.6 522.3 0.07 -1.98 -6.46 2
DE07 Erzgebirge, Grosse Pyra 103 61 50.41 12.53 18.7 14.3 80.1 22.5 0.15 -2.56 -7.10 3 DE08 Bayerischer Wald, Grosse Ohe 106 60 48.93 13.41 15.7 2.4 64.9 68.2 0.49 -0.73 -0.23 3 DE09 Sächsische Tieflandsbucht, Heidelbach 102 63 51.43 12.92 17.0 23.5 87.5 23.5 0.02
DE10 Bayerischer Wald, Hinterer Schachtenbach 106 60 48.94 13.41 15.7 92.6 64.9 0.59 0.43 0.60 3
ICP Waters report 54/2001
32
EMEP grid square Deposition Average concentration Trends N-Stage 50*50 1998 1989-1998 1998
Country ICP Site Site Name ox + red NH4 NO3 TOT-N SO4 N/S Z-score slope
I J Lat. Long. kg N ha-1 yr-1 µeq L-1 µeq L-1 µg L-1 µeq L-1 µeq L-1 yr-1
DE11 Schwarzwald, Kleine Kinzig 101 53 48.42 8.36 19.2 1.4 55.5 24.5 0.44 -1.80 -1.01 DE12 Harz, Lange Bramke 98 62 51.86 10.42 21.7 5.4 35.0 245.6 0.12 -2.63 -1.58 2 DE14 Kaufunger Wald, Nieste 3 99 60 51.29 9.74 20.4 6.2 36.7 465.1 0.07
DE15 Kaufunger Wald, Nieste 5 99 59 51.30 9.62 21.2 5.9 59.7 26.5 0.09 -1.50 -1.32 2 DE16 Lauenburgische Seenplatte, Pinnsee 96 65 53.63 10.74 17.5 2.6 3.6 106.9 0.03 DE17 Bayerischer Wald, Rachelsee 106 60 48.97 13.40 15.7 3.6 48.4 27.5 0.36 -0.76 -0.83
DE18 Fichtelgebirge, Röslau 104 59 50.04 11.90 18.7 38.6 239.2 0.14 -0.36 0.00 2 DE19 Taunus, Rombach 2 99 56 50.21 8.44 23.1 5.3 205.9 28.5 0.38 3 DE20 Taunus, Rombach 3 99 56 50.20 8.44 23.1 5.2 136.9 226.3 0.38 0.95 0.70 3
DE21 Erzgebirge, Rote Pockau 103 62 50.62 13.19 18.9 275.9 104.9 29.5 0.12 -1.93 -7.14 3 DE22 Odenwald, Schmerbach 3 100 56 49.66 8.89 20.9 6.1 56.6 347.6 0.14 -1.56 -3.84 2 DE23 Bayerischer Wald, Seebach 106 60 48.94 13.41 15.7 54.6 30.5 0.47 -2.87 -1.79 2
DE24 Erzgebirge, Talsperre Sosa 103 61 50.49 12.64 18.7 3.0 51.8 484.0 0.10 2 DE25 Elbsandsteingebirge, Taubenbach 103 63 50.84 14.13 17.2 1.4 116.1 31.5 0.09 3 DE26 Hunsrück, Traunbach 1 97 54 49.72 7.11 21.6 1.0 34.0 169.7 0.17 -1.69 -1.72 2
DE27 Bayerischer Wald, Vorderer Schachtenbach 106 60 48.94 13.41 15.7 56.4 32.5 0.42 -1.63 -1.30 3 DE28 Oberpfälzer Wald, Waldnaab 2 103 60 49.77 12.42 20.0 4.4 103.5 148.9 0.41 DE29 Oberpfälzer Wald, Waldnaab 8 103 60 49.79 12.42 20.0 3.3 66.0 33.5 0.16
DE30 Erzgebirge, Wilde Weisseritz 103 63 50.72 13.71 17.2 4.5 112.4 606.5 0.16 3 DE31 Erzgebirge, Wolfsbach 102 60 50.32 12.14 19.1 11.0 260.1 34.5 0.26 -1.46 -11.37 3 DE32 Rothaargebirge, Zinse 97 57 51.00 8.20 31.0 3.1 57.3 243.2 0.19 -0.51 -0.25 2
DE33 Fichtelgebirge, Zinnbach 104 59 50.01 11.90 18.7 72.1 35.5 0.13 -3.03 -5.35 3
Estonia EE01 River Ahja, Kiidjärve 101 87 58.15 26.98 5.2 2.9 68.6 101.6 290.4 0.19 2
Spain ES01 Lake Redó 100 35 42.64 0.77 11.9 2.1 10.7 18.2 37.5 0.29 2
Finland FI01 Hirvilampi 96 91 60.70 27.92 4.4 2.6 3.2 18.4 161.4 0.02 1.28 0.16
FI02 Vuorilampi 96 91 60.73 27.92 4.4 7.5 5.0 33.5 38.5 0.03 0.92 0.05 0 FI03 Mäkilampi 96 91 60.74 27.88 4.4 3.0 2.6 23.8 128.3 0.02 -0.31 0.00 0 FI05 Lapland, Suopalampi 84 96 67.06 26.10 1.2 0.9 2.1 20.7 39.5 0.07 -0.85 0.00 0
FI06 Lapland, Vasikkajärvi 84 96 67.11 26.09 1.2 0.8 2.7 10.7 41.8 0.06 -1.15 0.00 0 FI07 Vusimaa, Vitsjön 94 86 59.96 23.32 6.5 1.6 2.7 23.1 40.5 0.02 0 FI08 N-Karelia,Kakkisenlampi 92 96 63.65 29.94 1.8 1.5 1.2 12.1 39.9 0.03 0.91 0.09 0
Hungary HU01 Matra Mountains, Csórrét Reservoir 114 66 47.93 19.96 12.5 6.4 146.9 544.3 0.21 3
Ireland IE01 Wicklow, Glendalough, Lake Upper, Mid L. 77 49 53.00 -6.35 15.5 1.6 12.1 19.5 42.5 0.14
IE02 Wicklow, Glendalough, Lake Upper, Inflow 1 77 49 53.00 -6.38 15.5 0.9 11.9 19.6 93.0 0.11 IE03 Wicklow, Glendalough, Lake Upper, Inflow 2 77 49 53.00 -6.35 15.5 0.7 23.9 38.4 43.5 0.16
IE04 Wicklow, Glendalough, Lake Upper, Inflow 3 77 49 53.00 -6.35 15.5 0.8 14.4 23.7 74.3 0.16 IE05 Galway, Lough Maumwee, Mid Lake 72 49 53.47 -9.55 3.2 1.0 6.7 7.1 44.5 0.09 IE06 Galway, Lough Maumwee, Inflow 1 72 49 53.47 -9.53 3.2 0.9 3.6 4.2 62.6 0.05
IE07 Galway, Lough Maumwee, Inflow 2 72 49 53.48 -9.53 3.2 0.8 4.2 6.7 45.5 0.06 IE08 Donegal, Lough Veagh, Mid Lake 73 53 55.13 -7.70 2.3 1.7 5.7 5.4 57.6 0.09
ICP Waters report 54/2001
33
EMEP grid square Deposition Average concentration Trends N-Stage 50*50 1998 1989-1998 1998
Country ICP Site Site Name ox + red NH4 NO3 TOT-N SO4 N/S Z-score slope
I J Lat. Long. kg N ha-1 yr-1 µeq L-1 µeq L-1 µg L-1 µeq L-1 µeq L-1 yr-1
IE09 Donegal, Lough Veagh, Inflow 1 73 53 55.13 -7.70 2.3 0.9 2.8 2.3 46.5 0.05 IE10 Donegal, Lough Veagh, Inflow 2 73 53 55.13 -7.70 2.3 0.9 1.6 1.8 48.7 0.03 IE11 Donegal, Lough Veagh, Inflow 3 73 53 55.13 -7.70 2.3 0.7 2.4 3.3 47.5 0.04
IE12 Donegal, Lough Veagh, Inflow 4 73 53 55.13 -7.70 2.3 0.6 5.2 6.4 63.2 0.08
Italy IT01 Piemonte, Lake Paione Inferiore 105 48 46.17 8.19 22.1 0.5 25.9 48.5 0.37 -1.19 -0.63 2
IT02 Piemonte, Lake di Mergozzo 105 49 45.95 8.46 22.1 0.3 46.0 56.5 188.0 0.20 IT03 Piemonte, Lake Paione Superiore 105 48 46.17 8.19 22.1 2.4 25.1 49.5 0.41 0.08 0.04 2 IT04 Piemonte, River Cannobino 106 49 46.07 8.69 15.7 0.5 47.5 56.0 115.0 0.29 2
IT05 Piemonte, River Pellino 105 49 45.80 8.39 15.7 0.6 111.4 130.5 50.5 0.53 1.89 1.58 3 IT06 Piemonte, River Pellesino 105 49 45.79 8.38 15.7 2.4 110.1 131.3 69.5 0.61 1.72 1.49 3
Latvia LV01 Burtnieku Lake, hydrosite 100 85 57.72 25.30 7.7 5.3 73.1 91.6 51.5 0.11 2
LV02 Barta, Dukupji 103 84 57.13 25.92 6.2 8.5 76.0 149.6 663.3 0.10 2 LV03 Liela Jugla, Zaki 101 83 56.97 24.48 6.0 5.9 96.4 178.3 52.5 0.08 2 LV04 Tulija, Zoseni 103 84 57.13 25.92 6.2 14.1 45.9 127.5 591.8 0.07 2
LV05 Zvirbuli stream, hydrosite 100 82 56.92 23.47 4.4 21.9 6.8 53.5 0.04 1
Norway NO01 Aust-Agder, Birkenes 86 70 58.38 8.25 7.5 6.9 20.9 94.2 0.07 -2.29 -0.25 0
NO03 Buskerud, Langtjern 85 75 60.37 9.72 3.8 1.4 20.6 54.5 0.03 1.19 0.02 0 NO04 Finnmark, Dalelv 80 102 69.68 30.38 0.6 1.6 9.3 101.3 0.02 1.86 0.03 0 NO05 Oppland, Aurdøla 84 75 60.50 9.50 3.0 3.1 16.5 55.5 0.06 1.98 0.07 0
NO06 Rogaland, Vikedalselva 83 71 59.53 5.97 3.6 11.5 16.4 40.6 0.22 -0.35 -0.05 2 NO07 Sogn og Fjordane, Gaula 80 74 61.33 6.12 2.6 6.4 12.3 56.5 0.23 0.84 0.13 0 NO08 Sogn og Fjordane, Nausta 80 75 61.57 5.88 2.0 5.0 11.1 21.8 0.19 -0.26 -0.03 0
NO09 Sogn og Fjordane, Trodøla 80 75 61.57 5.93 2.0 5.4 10.2 57.5 0.19 2.00 0.19 0 NO10 Telemark, Storgama 86 71 59.02 8.53 6.0 5.7 22.9 43.5 0.12 -0.44 -0.05 0
Poland PL01 Tatra Mountains, Dlugi Staw Gasienicowy 112 67 49.22 20.01 17.8 2.6 48.3 53.1 58.5 0.43 -2.65 -2.76 2
PL02 Tatra Mountains, Zielony Staw Gasienicowy 112 67 49.22 20.00 17.8 4.3 30.5 42.9 64.1 0.32 -1.90 -1.50 2
Russia RU07 Chuna, Kola peninsula 51.60 104.00 1.4 2.8 7.1 62.5
RU08 Svetloe, Kola peninsula 51.60 104.00 1.7 0.1 15.6 29.1 RU09 Arkashkino, Kola peninsula 67.82 33.68 1.6 0.1 26.1 63.5
RU10 Glubokoe, Kola peninsula 67.82 33.68 0.3 0.1 6.8 54.1
Sweden SE01 Delångersån Iggesund 88 82 61.64 17.09 3.0 0.5 7.8 34.6 64.5 0.07 -0.97 -0.14 2 SE02 Alsterån Getebro 96 74 57.01 16.16 7.8 1.4 7.9 57.1 232.5 0.03 0.75 0.09 0
SE03 Alsterån Strömsborg 95 74 57.09 15.66 7.3 1.8 12.4 67.6 65.5 0.04 -0.97 -0.25 2 SE05 Tväringen 86 82 62.24 15.67 1.9 0.6 1.3 26.1 49.3 0.03 -0.25 -0.02 0 SE06 Stensjön 87 82 61.64 15.90 2.5 0.7 1.2 26.4 66.5 0.02 -1.10 -0.02 0
SE08 Brunnsjön 97 73 56.01 15.73 6.2 1.9 10.5 55.6 225.7 0.04 0.91 0.34 2 SE09 Fiolen 94 73 57.09 14.53 8.5 0.9 3.2 36.1 67.5 0.01 -2.25 -0.83 0 SE10 Storasjö 94 74 56.94 15.27 7.4 2.4 2.6 42.4 91.3 0.03 1.14 0.06 0
SE11 Fräcksjön 90 73 58.14 12.18 8.4 1.0 5.2 40.6 68.5 0.03 -1.68 -0.12 0 SE12 Härsvatten 90 72 58.02 12.03 8.1 4.0 8.9 28.8 136.9 0.06 -2.90 -0.56 2

ICP Waters report 54/2001
34
EMEP grid square Deposition Average concentration Trends N-Stage 50*50 1998 1989-1998 1998
Country ICP Site Site Name ox + red NH4 NO3 TOT-N SO4 N/S Z-score slope
I J Lat. Long. kg N ha-1 yr-1 µeq L-1 µeq L-1 µg L-1 µeq L-1 µeq L-1 yr-1
United UK01 Scotland, Loch Coire nan Arr 73 59 57.42 -5.65 2.7 3.1 11.1 69.5 0.07 1.10 0.00 Kingdom UK04 Scotland, Lochnagar 76 60 56.76 -3.22 6.4 22.1 25.4 55.3 0.29 2.02 1.25
UK07 Scotland, Round Loch of Glenhead 77 55 55.09 -4.42 10.0 12.5 22.3 70.5 0.17 2.62 0.75
UK10 England, Scoat Tarn 79 55 54.48 -3.29 12.6 25.9 30.7 59.9 0.30 0.33 0.34 UK15 Wales, Llyn Llagi 80 51 53.01 -4.01 9.0 12.6 20.4 71.5 0.18 0.76 0.27 UK21 N.Ireland, Blue Lough 76 52 54.15 -5.97 15.9 37.2 51.9 91.1 0.29 1.07 1.00
United US05 Maine, Little Long Pond 44.64 -68.08 1.6 0.3 66.6 0.00 States US06 Maine, Tilden Pond 44.63 -68.07 1.6 0.3 54.1 0.01
US11 New York, Adirondack Mnt., Arbutus 43.99 -74.24 0.9 22.8 114.4 0.17 -1.79 -0.44 US12 New York, Adirondack Mnt., Constable 43.83 -74.80 0.3 18.2 111.5 0.14 -0.35 -0.33 US13 New York, Adirondack Mnt., Dart Lake 43.80 -74.86 2.3 14.6 99.2 0.13 -1.37 -0.99
US14 New York, Adirondack Mnt., Heart Lake 44.18 -73.97 2.9 14.2 92.1 0.13 -1.07 -0.35 US15 New York, Adirondack Mnt., Lake Rondaxe 43.76 -74.91 1.6 13.1 99.8 0.12 -1.80 -1.01 US17 New York, Adirondack Mnt., Otter Lake 43.79 -74.85 2.4 13.4 111.3 0.11 -1.34 -0.60
US23 New York, Catskill Mnt., E. Br. Neversink, Headw. 43.19 -74.50 0.5 26.1 100.7 0.21 -2.10 -2.54 US24 New York, Catskill Mnt., Rondout Creek 41.96 -74.45 2.6 4.1 90.5 0.04 -1.82 -1.94 US34* Little Clear Pond. Adirondacks 41.93 -74.38 3.4 9.9 93.2 0.10
US35 Loon Hollow Pond. Adirondacks 42.01 -74.41 2.9 24.1 96.5 0.20 US36 Willys Lake. Adirondacks 41.99 -74.50 0.1 25.3 81.3 0.24 US37 Woods Lake. Adirondacks 44.52 -74.13 0.4 31.6 82.4 0.28
US38 Middle Settlement Lake. Adirondacks 44.51 -74.13 2.6 11.8 50.1 0.19 US39 Grass Pond. Adirondacks 44.31 -74.37 0.4 34.4 52.0 0.40 US40 Middle Branch Lake. Adirondacks 44.34 -74.30 1.4 11.8 38.1 0.24
US41 Limekiln Lake. Adirondacks 44.35 -74.29 0.6 20.6 84.4 0.20 US42 Squaw Lake. Adirondacks 44.16 -73.95 0.3 10.6 35.4 0.23 US43 Indian Lake. Adirondacks 44.66 -74.50 0.6 20.5 37.4 0.35
US44 Brook Trout Lake. Adirondacks 44.66 -74.50 0.8 11.4 83.6 0.12 US45 Lost Pond. Adirondacks 43.96 -75.05 0.9 27.8 105.0 0.21 US46 South Lake. Adirondacks 43.97 -74.96 0.5 34.8 98.0 0.26
US47 North Lake. Adirondacks 43.87 -74.97 0.1 33.3 84.7 0.28 US48 Willis Lake. Adirondacks 43.68 -75.10 1.1 4.9 103.0 0.05 US49 Long Pond. Adirondacks 43.69 -75.06 0.8 3.6 91.5 0.04
US50 Carry Pond. Adirondacks 43.70 -75.10 1.6 2.0 96.1 0.02 US51 Lake Colden. Adirondacks 43.71 -74.81 0.6 45.7 91.9 0.33 US52 Avalanche Lake. Adirondacks 43.64 -74.74 1.1 59.5 95.7 0.38
US53 Little Simon Pond. Adirondacks 43.62 -74.76 0.6 42.7 89.2 0.32 US54 Raquette Lake Reservoir. Adirondacks 43.60 -74.66 0.2 28.6 90.9 0.24 US55 G Lake. Adirondacks 43.65 -74.56 0.4 19.9 86.1 0.19
US56 Middle Pond. Adirondacks 43.51 -74.88 3.4 7.1 98.2 0.07 US57 Sagamore Lake. Adirondacks 43.52 -74.95 0.3 27.1 92.6 0.23 US58 Black Pond Outlet. Adirondacks 43.37 -74.25 0.1 6.7 79.0 0.08
ICP Waters report 54/2001
35
EMEP grid square Deposition Average concentration Trends N-Stage 50*50 1998 1989-1998 1998
Country ICP Site Site Name ox + red NH4 NO3 TOT-N SO4 N/S Z-score slope
I J Lat. Long. kg N ha-1 yr-1 µeq L-1 µeq L-1 µg L-1 µeq L-1 µeq L-1 yr-1
US59 Windfall Pond Outle. Adirondacks 43.84 -74.48 0.7 28.5 67.6 0.30 US60 Queer Lake. Adirondacks 43.68 -74.49 1.1 19.5 90.9 0.18 US61 Big Moose Lake. Adirondacks 44.12 -73.98 1.0 25.6 89.4 0.22
US62 Cascade Lake Outlet. Adirondacks 44.13 -73.97 0.4 26.4 110.0 0.19 US63 Little Echo Pond. Adirondacks 44.16 -74.44 0.5 0.6 125.0 0.01 US64 Squash Pond Outlet. Adirondacks 43.80 -74.65 1.1 30.5 88.8 0.26
US65 West Pond Outlet. Adirondacks 43.42 -74.64 1.2 12.6 106.5 0.11 US66 Bubb Lake Outlet. Adirondacks 44.34 -74.37 0.6 17.8 117.5 0.13 US67 Owen Pond. Adirondacks 43.77 -74.63 0.7 54.2 107.3 0.34
US68 Jockeybush Lake. Adirondacks 44.44 -74.29 1.1 25.1 113.6 0.18 US69 Clear Pond. Adirondacks 43.81 -74.85 0.4 8.5 101.9 0.08 US70 Nate Pond. Adirondacks 43.81 -74.81 0.5 15.5 101.3 0.13
US71 Bean Pond. Maine 43.83 -74.85 1.3 2.4 107.1 0.02 US72 Bracey Pond. Maine 43.79 -74.80 1.6 0.6 37.9 0.02 US73 Anderson Pond. Maine 44.31 -74.40 0.0 0.5 90.9 0.01
US74 Mud Pond. Maine 43.83 -74.89 1.5 0.4 82.2 0.01 US75 Salmon Pond. Maine 43.81 -74.88 1.4 0.9 95.7 0.01 US76 Wiley Pond. Maine 43.77 -74.85 0.9 0.9 125.2 0.01
US77 Second Pond. Maine 44.32 -73.90 0.6 1.1 99.0 0.01 US78 Abol Pond. Maine 43.30 -74.59 0.7 0.9 100.7 0.01 US79 Duck Pond. Maine 44.00 -73.82 1.5 0.7 118.1 0.01
US80 Jellison Hl Pd. Maine 43.86 -74.09 1.1 0.9 61.2 0.01 US81 Crystal Pond. Maine 45.13 -69.98 1.0 0.5 44.3 0.01 US82 Newbert Pond. Maine 44.96 -68.12 2.4 1.1 49.9 0.02
US83 Partridge Pond. Maine 44.65 -68.06 1.1 0.9 86.5 0.01 US84 Benner Run. Mid-Apps 44.63 -65.09 0.9 15.9 49.7 0.24 US85 Linn Run. Mid-Apps 44.63 -68.09 0.2 39.5 52.0 0.43
US86 Roberts Run. Mid-Apps 46.00 -68.54 0.6 3.1 62.0 0.05 US87 Stone Run. Mid-Apps 44.70 -68.58 0.6 1.4 58.4 0.02 US88 Baldwin Creek. Mid-Apps 45.84 -68.93 0.1 41.6 40.4 0.51
US89* Bourn. Vermont 44.80 -68.19 1.6 72.8 0.02 US90* Grout. Vermont 44.81 -68.43 5.3 34.3 0.13 US91* Hardwood. Vermont 45.03 -68.19 2.9 70.7 0.04
US92* Little - Woodford. Vermont 44.34 -69.27 16.5 55.7 0.23 US93* Stamford. Vermont 44.84 -68.40 6.2 131.2 0.05 US94* Stratton. Vermont 40.93 -78.02 0.0 203.6 0.00
US95* Sunset. Vermont 40.14 -79.21 1.7 194.3 0.01 US96* Big Mud. Vermont 41.17 -78.41 2.6 207.0 0.01 US97* Branch. Vermont 41.10 -78.45 1.4 202.4 0.01
US98* Beaver Pond. Vermont 40.35 -79.05 11.6 56.2 0.17 US99* Big Muddy. Vermont 43.11 -73.00 11.1 56.6 0.16

ICP Waters report 54/2001
36
EMEP grid square Deposition Average concentration Trends N-Stage 50*50 1998 1989-1998 1998
Country ICP Site Site Name ox + red NH4 NO3 TOT-N SO4 N/S Z-score slope
I J Lat. Long. kg N ha-1 yr-1 µeq L-1 µeq L-1 µg L-1 µeq L-1 µeq L-1 yr-1
US100* Howe. Vermont 43.05 -72.95 4.3 65.9 0.06 US101* South - Marlboro. Vermont 44.47 -72.50 0.0 79.9 0.00 US102* Forester. Vermont 42.93 -73.07 0.0 76.1 0.00
US103 Paine Run. Virginia 42.82 -73.07 0.2 4.0 63.4 0.06 US104 Piney River. Virginia 43.10 -72.97 0.4 11.7 71.1 0.14 US105 Staunton River. Virginia 42.92 -72.68 2.4 2.5 59.1 0.04
US97* Branch. Vermont 43.31 -72.93 1.4 62.2 0.02 US98* Beaver Pond. Vermont 43.08 -73.02 11.6 72.6 0.14 US99* Big Muddy. Vermont 45.01 -71.94 11.1 55.5 0.17
US100* Howe. Vermont 44.76 -72.60 4.3 63.0 0.06 US101* South - Marlboro. Vermont 42.79 -72.99 0.0 82.8 0.00 US102* Forester. Vermont 42.84 -72.71 0.0 75.1 0.00
US103 Paine Run. Virginia 43.08 -72.87 0.2 4.0 116.3 0.03 US104 Piney River. Virginia 38.20 -78.79 0.4 11.7 70.1 0.14 US105 Staunton River. Virginia 38.70 -78.27 2.4 2.5 46.0 0.05
38.44 -78.37

ICP Waters report 54/2001
37
Appendix B. Major Programme Findings
The International Cooperative Programme on Assessment and Monitoring of Acidification of Rivers and Lakes (ICP Waters) is designed to assess the degree and geographical extent of acidification of surface waters, evaluate dose/response relationships and long-term trends in aquatic chemistry and biota. The major programme findings are listed here.
The 3-year period 1996-98 The ICP Waters database The ICP Waters database has been renovated into a new working database with sites and data selected on the basis of three criteria. (1) Only active sites are included in the new database. These are currently monitored and for which data in the period 1996-98 have been reported to the programme centre. (2) Only the required or optional parameters are included. In addition we have included total organic carbon (TOC), reactive and non-labile aluminium and colorimetric analysed SO4, where available. (3) Only the upper depth is included for lakes. The ICP Waters database now includes 142 sites with chemical data and 123 sites with biological data. Quality control of data is performed annually, and most laboratories have participated in intercalibration exercises in the period. Representativeness of the database Many of the sites included in the ICP Waters programme are especially sensitive to acidification. They need not be representative of all surface waters in a region, but rather represent the acid-sensitive surface waters. Most of the sites appear to be well suited to monitor changes in acidification in response to changes in acid deposition. The sites are generally representative of the lower ANC, lower critical load levels of the distributions for all the waters surveyed in the region. The ICP Waters sites cover most of the acid-sensitive areas in Europe that receive significant acid deposition. There are no ICP sites, however, in several regions that have been or are potentially affected. Furthermore there are insufficient data from many regions in Eastern Europe to adequately assess both the risk of acidification and the sensitivity of surface waters. For North America the ICP sites cover several, but not all of the acid-sensitive regions that receive significant acid deposition, and that can be expected to show changes in response to changing levels of deposition in the future. Trends in water chemistry Data from 98 ICP Waters sites with sufficient data were tested for trends in concentrations of major chemical components for the 10-year period 1989-1998 using the non-parametric Seasonal Kendall test (SKT). The sites were grouped into regions by means of meta-analysis. All of the regions had highly significant downward trends in sulphate (SO4). The majority of the single sites (67 out of 98) showed a significant decrease in SO4. Nitrate (NO3
-), on the other hand, showed no regional patterns of change. Central Europe did show some significant decreasing NO3
- trends, but the heterogeneity within the region was too large to identify a regional pattern. Decreasing trends in lake water NO3
- occurred in the so-called Black Triangle, while southwest Germany and Italy (Southern Alps) exhibited no or increasing NO3
- trends.
Recovery in acidification reflected by an increase in surface water ANC and pH is significant in the Nordic countries/UK region. Lack of recovery during the last decade at the single UK sites has been attributed to (a) the absence of significant S-deposition reductions in western areas, and (b) the impact of natural climatic variations on water chemistry (seasalt episodes). In Central Europe, there was a regional tendency toward increasing ANC, but significant heterogeneity; 10 out of 28 sites in this region showed no significant change in ANC. Two important regions failed to show significant recovery. In Eastern North America there was no regional pattern for ANC or pH, while northern Nordic countries showed increase in pH but no regional pattern for ANC. Concentrations of base cations declined in most regions. All of the regions showed tendencies towards increasing concentrations of dissolved organic carbon (DOC).

ICP Waters report 54/2001
38
The sites were also grouped according to several characteristics. Sites with low acid neutralising capacity (ANC) showed the largest rates of recovery. Neither the high NO3
- or low NO3-3 groups of sites exhibited significant
trends in NO3- concentrations. Non-forested sites showed clear and consistent signals of recovery in ANC and
pH, and appropriate (relative to SO4 trends) rates of base cation declines. Hence, the recovery observed, in fact, associated with declining SO4. Biology Effects of acidification are described for Ireland, UK, Scandinavia and Central Europe including lowland as well as mountain areas. Critical limits of ANC are suggested for the different regions. For Ireland, UK and Norway, ANC of 20 µeq L-1 are proposed. For Sweden, Germany and the Vosges Mountains of France the limit is set to 50 µeq L-1. In the high Alps and Pyrenees the present information indicates a limit of about 30 µeq L-1. For UK and most sites in Germany no statistically significant trend in acidification was recorded, but positive signals of improvements in the invertebrate fauna were observed. A clear positive trend was found for the Norwegian sites and for most of the Swedish sites. In the most acidic sites in Central Europe, improvements in water quality have not yet reached a level where stable effects on biology can be detected. Biological recovery of such sites requires considerable and stable improvements in water quality with respect to acidification. Heavy metals The ICP Waters database contains a number of sites with heavy metal data, and these sites are located in relatively few countries, and heavy metals are reported from fewer sites in each of these countries than major solutes. To be able to give a good picture of the general level of heavy metals in surface waters throughout Europe and North America, heavy metal data for more sites with a larger geographical cover are needed. Some Focal Centres reported that there exist data on heavy metals from additional rivers. These sites are not likely to be suitable for monitoring the effects of air-transported heavy metals to surface waters. Few sites have long time series on heavy metals. The analytical methods have changed and the detection limit has generally decreased through the monitoring period for the sites with long-term trends. Heavy metal data in the ICP Waters database has been analysed with different analytical methods and analytical precision. All the laboratories reporting data to ICP Waters participate in national and international intercalibrations. To be able to compare the data within the programme it is of great importance to conduct intercalibration of analysis of heavy metals for improvements of results. Future perspectives The ICP Waters programme is well positioned to monitor changes over the next years as the new Protocol on reductions in emissions of S and N compounds comes into effect. The trends already documented in water chemistry and biology in the ICP Waters data are thus likely to continue to reflect the reduced emissions of S and N. The results from the ICP Waters Programme, as reported here in the 12-year report, clearly show that surface waters respond to changes in atmospheric deposition. Indeed waters are much more responsive than either soils or terrestrial vegetation to changes in long-range transported acid pollutants. Lakes and rivers also have the advantage that they reflect responses integrated over the entire catchment area. The ICP site network is geographically extensive and includes long-term data series (> 15 years) for many sites. The network is thus well poised to document changes that result from implementation of the protocols. The ICP Waters programme is best developed with respect to major-ion chemistry and chemical parameters associated with acidification. Addition of new biological parameters and expansion of sampling programmes at individual sites to include existing biological parameters could substantially strengthen the network. As reported here, the invertebrate fauna responds to changes in water chemistry, and is a suitable group of organisms for monitoring purposes. As the acidification of surface waters continues to diminish in the future, the recovery of damaged groups of organisms should increase. The ICP Waters programme presently includes only a minor amount of data for heavy metal concentrations. An analysis of these data presented here indicates that ecological effects of long-range transported heavy metals are probably minor. Intercalibration of heavy metal analysis methods should be a part of the yearly intercalibration exercise. In the event that the Working Group on Effects (WGE) deems it prudent to include heavy metals in its
ICP Waters report 54/2001
39
activities, the ICP Waters sampling programme and database provides a ready vehicle for sampling, quality control and assessment of heavy metals in surface waters.
The 3-year period 1993-95
Trends in Surface Water Chemistry Trends in water chemistry indicate that SO4 concentrations are decreasing at almost all ICP Waters sites, and in almost all cases the decreases in the 1990s are larger than in the 1980s. NO3
- is of increasing importance as a strong-acid anion. In the Nordic countries (Finland, Sweden, and Norway) alkalinity decreased in the 1980s (acidification), but then increased in the 1990s (recovery). At many European sites (Italy, Germany, Netherlands, Denmark) alkalinity also increased in the 1980s, and the rate accelerated in the 1990s. Other regions (e.g. Adirondacks/Quebec, Midwestern North America, UK) show either no recovery or further acidification. Regions with declining SO4 that fail to show recovery in alkalinity in the 1990s (Adirondacks/Quebec, Midwestern North America) are characterised by strongly declining concentrations of sum base cations (SBC= Σ Ca, Mg, K, Na). SBC concentrations are no longer declining in the Nordic Countries. All of the hydrogen ion (H+) trends detectable at a regional level are consistent with the alkalinity trends observed within each region. The 1980s were characterised by increases in NO3
- in almost all regions. These increases have generally not continued in the 1990s. Regional-scale phenomena other than N deposition may be responsible for the development in the 1990s (e.g., changes in climate or climate extremes). Nitrogen Leaching from ICP Waters Sites SO4 is the most important acidifying anion at ICP Waters Sites, but NO3
- constitutes more than 10% of the non-marine acid anions at 63% of the sites. Exceptions are sites in Canada, Finland, Sweden and Russia. More than 50% of the sites have yearly-average NO3
- concentrations > 10 µeq L-1, and 27% are > 50 µeq L-1. Dutch sites have ammonium values > 100 µeq L-1. More than 50% of the ICP Waters sites show high degree of N saturation (stages 2 or 3 according to Stoddard’s classification system). There is a clear relationship between high N saturation stage and high N deposition load. Leaching of inorganic N occurs at sites with very high annual precipitation (Norway, Ireland, Italy, and UK) even though deposition is below the empirical threshold for leaching of 10 kg N ha-1 yr-1. Compared with sulphur (S), nitrogen (N) is much more involved in biological processes within ecosystems. Hence changes in N deposition may not always directly correlate with changes in inorganic N leaching in runoff. Besides N-deposition, the overall N-status of ecosystems, changes in climate or climate extremes and hydrology can strongly influence leaching of excess NO3
- (and ammonium) from a catchment. Effects of Acidification on Aquatic Fauna Water acidification (including acidic episodes) changes the composition of invertebrate assemblages in surface waters. Long-term monitoring of both water chemistry and biology is necessary to assess dose/response relationships. In areas with originally high pH (6.0 - 8.0) and high Ca-concentrations (e.g., Southern Sweden, Germany) a critical alkalinity limit of 50 µeq L-1 is proposed. In areas where fauna is adapted to water with low conductivity, low pH (5.5 - 6.5) and low calcium concentrations (e.g., Finland, Norway), alkalinity values should be ≥ 20 µeq L-1 to protect invertebrates and fish. These critical levels are the basis for setting critical loads of acidity for surface waters. By comparing invertebrate samples taken before and after 1990, improvements at many Norwegian and some German sites can be observed. This is confirmed by correlation analyses between time and acidity index applied to Norwegian long-term data series. Detrended canonical correspondence analysis (Norwegian datasets) shows a high correlation of invertebrate assemblages with pH and total aluminium (Al), and also a significant correlation with calcium. Trend analyses indicate recovery of the invertebrate fauna at many sites. Intercalibration Exercises The programme conducts yearly chemical and biological intercalibrations. The number of participating laboratories have increased from 9 in 1987 to 57 laboratories in 24 countries in the 13th chemical intercomparison in 1999. The investigated variables are pH, K25 (conductivity), HCO3
- (alkalinity), NO3- +NO2
-,

ICP Waters report 54/2001
40
Cl-, SO42-, Ca2+, Mg2+, Na+, K+, Al, reactive Al, non-labile Al, DOC and COD-Mn. The intercomparison
confirms that the results are generally compatible between laboratories. In 1998, 6 laboratories participated in the 4th intercalibration of invertebrates. The results from this intercalibration are the best of all tests performed so far. The biological intercalibration proved that the methods suggested in the Programme Manual are reliable and suitable to assess the effects of acidification on aquatic fauna. Implications for the Assessment of Critical Loads An assessment of the status for critical load and critical load exceedences, using the methods described in the mapping manual (UN/ECE 1996) showed that at 46% of the European sites the critical loads of acidity is less than 50 meq/m2/yr, and 68% of the sites have critical loads less than 100 meq/m2/yr. The corresponding figures for the North American sites are 40% and 75%, respectively. The results indicated that many of the selected ICP Waters sites are sensitive to acidification. This raises the question whether the sensitivity of the surface waters has been underestimated in large parts of Europe, and that in several of the EMEP-grid cells the low percentiles would be even lower if critical loads for surface waters had been included.
The 3-year period 1990-93
Trends in Water Chemistry Significantly decreasing SO4 concentrations were a major feature of the ICP Waters sites. A decline in Ca2+ was found at many European locations. Several surface waters were characterised by upward trends in NO3
- concentrations, and constant or increasing N deposition seemed to be the driving force. A combined decrease in Ca2+ and increase in NO3
- may account for the lack of recovery from acidification at sites with decreasing SO4. Correlation between Surface Water Trends and Deposition Statistically significant links between observed surface water trends and changes in deposition chemistry were not discovered. This was certainly due to the kind of deposition data used both in space and time. Information on atmospheric inputs was not available for the singles sites. Deposition from the nearest existing monitoring station, up to 160 km away, was paired with the surface waters, respectively. The development of S deposition at EMEP sites shows a steady decrease since the 1970s. The ICP on Waters Programme includes mainly data from 1980 onwards. Response to decreases in SO4 deposition at certain sites might have been influenced by earlier changes in deposition. Dose / Response Relationships In general, sensitive invertebrate species were associated with high ANC and conductivity and tolerant species with high Al, low pH and ANC. The chemical parameter most strongly related to fauna composition was pH. It was possible to predict pH from invertebrate assemblages at single sites. The effect of acidification on invertebrates varied from region to region, depending on Ca2+ concentrations, humic substances and ionic strength. In areas with originally oligotrophic waters, the fauna was adapted to low conductivity, pH values of 5.5 - 6.5 and an ANC of 10 - 30 µeq L-1. In Central Europe, the fauna was much more sensitive to acidification. It was adapted to waters with high ionic strength, rich in Ca2+, with pH values of 6.0 - 8.0 and an ANC of 50 - 200 µeq L-1. Intercalibration Exercises Chemical intercalibration exercises showed that the results were generally compatible between laboratories. Biological intercalibration in 1992 proved that the methods suggested in the Programme Manual are reliable and suitable to assess the effects of acidification on aquatic fauna. The tests included, however, only a selection of the species present at the various sites. Implications for the Assessment of Critical Loads The results of the ICP Waters monitoring activities from 1989 to 1991 stress the importance of considering multiple pollutants (i.e., S and N) which together affect sensitive organisms in freshwater ecosystems. Thus, critical load assessments should focus on deposition of both S and N compounds.

ICP Waters report 54/2001
41
Appendix C. Reports and publications from the programme
1. Manual for Chemical and Biological Monitoring. Programme Manual. Prepared by the Programme Centre, Norwegian Institute for Water Research. NIVA, Oslo 1987.
2. Norwegian Institute for Water Research, 1987. Intercalibration 8701. pH, Ks, SO4, Ca. Programme Centre, NIVA,
Oslo.
3. Norwegian Institute for Water Research, 1988. Data Report 1987 and available Data from Previous Years. Programme Centre, NIVA, Oslo.
4. Norwegian Institute for Water Research, 1988. Intercalibration 8802. pH, K25, HCO3, NO3, SO, Cl, Ca, Mg, Na, K. Programme Centre, NIVA, Oslo.
5. Proceedings of the Workshop on Assessment and Monitoring of Acidification in Rivers and Lakes, Espoo, Finland, 3rd to 5th October 1988. Prepared by the Finnish Acidification Research Project, HAPRO, Ministry of Environment, October 1988.
6. Norwegian Institute for Water Research, 1989. Intercalibration 8903: Dissolved organic carbon and aluminium fractions. Programme Centre, NIVA, Oslo. NIVA-Report SNO 2238-89. ISBN 82-577-1534-4.
7. Note: Some reflections about the determination of pH and alkalinity. Prepared by the Programme Centre, Norwegian Institute for Water Research. Håvard Hovind, NIVA, Oslo October 1989.
8. Hovind, H. 1990. Intercalibration 9004: pH and alkalinity. Programme Centre, NIVA, Oslo. NIVA-Report SNO 2465-90. ISBN 82-577-1776-2.
• Skjelkvåle, B.L. and Wright, R.F. 1990. Overview of areas sensitive to acidification: Europe. Programme Centre, NIVA, Oslo. Acid Rain Research Report 20/1990. NIVA-Report 2405-90. ISBN 82-577-1706-1.
9. Johannessen, M. 1990. Intercalibration in the framework of an international monitoring programme. Proceedings of the third annual Ecological Quality Assurance Workshop, Canada Centre for Inland Waters, Burlington Ontario. Programme Centre, NIVA, Oslo.
10. Norwegian Institute for Water Research, 1990. Data Report 1988. Programme Centre, NIVA, Oslo.
11. Norwegian Institute for Water Research, 1990. Data Report 1989. Programme Centre, NIVA, Oslo.
12. Proceedings for the 5th Meeting of the Programme Task Force Freiburg, Germany, October 17 -19, 1989. Prepared by the Umweltbundesamt, Berlin July 1990.
13. Hovind, H. 1991. Intercalibration 9105: pH, K25, HCO3, NO3 + NO2, Cl, SO4, Ca, Mg, Na, K and TOC. Programme Centre, NIVA, Oslo. NIVA-Report 2591-91. ISBN 82-577-1931-5.
14. Norwegian Institute for Water Research, 1991. The Three Year Report. Summary and results 1987 – 1989: Results from the International Co-operative Programme on Assessment and Monitoring of Acidification in Rivers and Lakes. Programme Centre, NIVA, Oslo.
15. Norwegian Institute for Water Research, 1991. Summary of The Three Year Report 1987 – 1989. Programme Centre, NIVA, Oslo.
16. Scientific papers presented at the Sixth Task Force meeting in Sweden 23 - 24 October 1990. Swedish Environmental Protection Agency, Sweden, September 1991.
17. Seventh Task Force meeting of international Co-operative Programme on Assessment and Monitoring of Acidification of Rivers and Lakes. Galway, Ireland. September 30 - October 3 1991. Proceedings.
18. Johannessen, M., Skjelkvåle, B.L. and Jeffries, D. 1992. International cooperative Programme on Assessment and Monitoring of Rivers and Lakes. In: Conference Abstracts, Intern. Conference on Acidic Deposition, Glasgow 16-21, sept. 1992, p. 449. Kluwer Academic Press.
19. Hovind, H. 1992. Intercalibration 9206: pH, K25, HCO3, NO3 + NO2, Cl, SO4, Ca, Mg, Na, K, Al and DOC. Programme Centre, NIVA, Oslo. NIVA-Report 2784-92. ISBN 82-577-2164-6.
20. Norwegian Institute for Water Research, 1992. Data Report 1990. Programme Centre, NIVA, Oslo.
ICP Waters report 54/2001
42
21. Norwegian Institute for Water Research, 1992. Evaluation of the International Co-operative Programme on Assessment and Monitoring of Acidification in Rivers and Lakes. Programme Centre, NIVA, Oslo.
22. Hovind, H. 1993. Intercalibration 9307: pH, k25, HCO3, NO3 + NO2, Cl, SO4, Ca, Mg, Na, K, total aluminium, reactive and non-labile aluminium, TOC and COD-Mn. Programme Centre, NIVA, Oslo. NIVA-Report 2948-93. ISBN 82-577-2370-3.
23. Raddum, G.G. 1993. Intercalibration of Invertebrate Fauna 9301. Programme Centre, NIVA, Oslo. NIVA-Report SNO 2952-93. ISBN 82-577-2376-2.
24. Proceedings of the 9th Task Force Meeting in Oisterwijk, the Netherlands, November 1-3, 1993. Programme Centre, NIVA, Oslo.
25. Skjelkvåle, B.L., Newell, A.D, and Johannessen, M. 1993. International Cooperative Programme on Assessment and Monitoring of Rivers and lakes: Status and Results. In: BIOGEOMON - Symposium on Ecosystem Behaviour: Evaluation of Integrated Monitoring in small catchments. Prague, September 18-20, 1993. Czech Geological Survey, Prague 1993. s. 274-275.
26. Hovind, H. 1994. Intercomparison 9408. pH, k25, HCO3, NO3 + NO2, Cl, SO4, Ca, Mg, Na, K, total aluminium, TOC and COD-Mn. Programme Centre, NIVA, Oslo. NIVA-Report SNO 3142-94. ISBN 82-577-2616-8.
27. Skjelkvåle, B.L., Newell, A.D., Raddum, G.G., Johannessen, M., Hovind, H., Tjomsland, T. and Wathne, B.M. 1994. The six year report: Acidification of surface water in Europe and North America. Dose/response relationships and long-term trends. Programme Centre, NIVA, Oslo. NIVA-Report SNO 3041-94. ISBN 82-577-2499-8.
28. Norwegian Institute for Water Research, 1994. Data Report 1991. Programme Centre, NIVA, Oslo. ISBN 82-577-2562-5.
29. Stoddard, J.L. and Traaen, T.S. 1994. The stages of Nitrogen Saturation: Classification of catchments included in "ICP on Waters". In: M. Hornung, M.A. Stutton and R.B. Wilson (eds.) Mapping and Modelling of Critical Loads for Nitrogen: a Workshop Report. Proceedings of a workshop held in Grange-over-Sands (UK), 24-26 October 1994. pp.69-76.
30. Hovind, H. 1995. Intercomparison 9509. pH, k25, HCO3, NO3 + NO2, Cl, SO4, Ca, Mg, Na, K, total aluminium, aluminium- reactive and nonlabile, TOC and COD-Mn. Programme Centre, NIVA, Oslo. NIVA-Report SNO 3331-95. ISBN 82-577-2849-7.
31. Traaen, T.S. and Stoddard, J.L. 1995. An Assessment of Nitrogen Leaching from Watersheds included in ICP on Waters. Programme Centre, NIVA, Oslo. NIVA-Report SNO 3201-95. ISBN 82-577-2699-0.
32. Norwegian Institute for Water Research, 1995. Data Report 1992-93. Draft 1994. Part 1, Introduction and Chemistry. Programme Centre, NIVA, Oslo. ISBN 82-577-2852-7.
33. Norwegian Institute for Water Research, 1995. Data Report 1992-1993. Draft 1994. Part 2, Biology and Site-data. Programme Centre, NIVA, Oslo. ISBN 82-577-2852-7.
34. Raddum, G.G. 1995. Aquatic Fauna. Dose/response and long term trends. Programme Centre, NIVA, Oslo. ISBN 82-577-2859-4
35. Raddum, G.G. 1995. Intercalibration of Invertebrate Fauna 9502. Programme Centre, NIVA, Oslo. ISBN 82-577-2834-9.
36. Raddum, G.G., and Skjelkvåle, B.L. 1995. Critical limits of acidification to invertebrates in different regions of Europe. Water Air Soil Poll. 85: 475-480.
37. Hovind, H. 1996. Intercomparison 9610. pH, K25, HCO3, NO3 + NO2, Cl, SO4, Ca, Mg, Na, K, total aluminium, aluminium - reactive and nonlabile, TOC and COD-Mn. Programme Centre, NIVA, Oslo. NIVA-Report SNO 3550-96. ISBN 82-577-3099-8.
38. Newell, A.D, and Skjelkvåle, B.L. 1996. Acidification trends in surface waters in the International Program on Acidification of Rivers and Lakes. Water Air Soil Poll. 93:27-57.
♦ Proceedings of the 10th Task Force Meeting in Budapest 1994. Prepared by the Programme Centre, NIVA, Oslo March 1996.
39. Norwegian Institute for Water Research, 1996. Programme Manual. Programme Centre, NIVA, Oslo. NIVA-Report SNO 3547-96. ISBN 82-577-3094-7.
40. Raddum, G.G. 1996. Intercalibration of invertebrate fauna 9603. Programme Centre, NIVA, Oslo. ISBN 82-577-3095-5.
41. Lükewille, A., Jeffries, D., Johannessen, M., Raddum, G.G., Stoddard, J.L and Traaen, T.S. 1997. The Nine Year Report. Acidification of Surface Water in Europe and North America. Long-term Developments (1980s and 1990s). Programme Centre, NIVA, Oslo. NIVA-Report SNO 3637-97. ISBN 82-577-3195-1.
ICP Waters report 54/2001
43
42. Hovind, H. 1997. Intercomparison 9711. pH, K25, HCO3, NO3 + NO2, Cl, SO4, Ca, Mg, Na, K, total aluminium, aluminium - reactive and nonlabile, TOC and COD-Mn. Programme Centre, NIVA, Oslo. NIVA-Report SNO 3716-97. ISBN 82-577-3284-2.
43. Johannessen, M., and Skjelkvåle, B.L. 1997. International Co-operative Programme on Assessment and Monitoring of Acidification of Rivers and Lakes - ICP-Waters; Programme objectives, organization and main results. In: Proceedings to "International Conference on management of Transboundary Waters in Europe" 22-25 September 1997 in Poland. Programme Centre, NIVA, Oslo. ICP-Waters Report 43/1997. ISBN 82-577-3297-4.
44. Henriksen, A. and Posch, M. 1998. Critical loads and their exceedances for ICP-Waters sites. Programme Centre,
NIVA, Oslo. NIVA-Report SNO 3821-98, ICP-Waters Report 44/1998. ISBN 82-577-3399-7 45. Smith, D. and Davis, I. 1997. International Co-operative programme on Assessment and Monitoring of Acidification of
Rivers and lakes: 8th Task Force Meeting, 1992. Can. Tech. Rep. Fish. Aquat. Sci. 2155: iv 68 p. 46. Summary of The Nine Year Report from the ICP Waters Programme. NIVA-Report SNO 3879-98, ICP-Waters report
46/1998. ISBN 82-577-3463-2. 47. Raddum, G.G. 1998. Intercalibration 9804: Invertebrate fauna. NIVA-Report SNO 3912-98, ICP-Waters Report
47/1998. ISBN 82-577-3500-0. 48. Larsen, S.E., Friberg, N. and Rebsdorf, Aa.. (eds.) 1999. Proceedings from the 12th Task Force Meeting in Silkeborg,
Denmark, October 23-25, 1996. National Environmental Research Institute, Denmark 52 pp NERI Technical Report, No. 271
49. Hovind, H. 1998. Intercomparison 9812. pH, K25, HCO3, NO3 + NO2, Cl, SO4, Ca, Mg, Na, K, total aluminium,
aluminium - reactive and nonlabile, TOC and COD-Mn. NIVA-Report SNO 3939-98, ICP-Waters Report 49/1998. ISBN 82-577-3530-2.
50. Rosseland, B.O., Raddum, G.G. and Bowman, J. 1999. Workshop on biological assessment and monitoring; evaluation
and models. NIVA-Report SNO 4091-99, ICP Waters Report 50/1999. ISBN 82-577-3698-8. 51. Hovind, H. 1999. Intercomparison 9913. pH, K25, HCO3, NO3 + NO2, Cl, SO4, Ca, Mg, Na, K, total aluminium,
aluminium - reactive and nonlabile, TOC and COD-Mn. NIVA-Report SNO 4093-99, ICP Waters Report 51/1999. ISBN 82-577-3700-3.
52. Skjelkvåle, B. L., Andersen, T., Halvorsen, G. A., Raddum, G.G., Heegaard, E., Stoddard, J. L., and Wright, R. F. 2000.
The 12-year report; Acidification of Surface Water in Europe and North America; Trends, biological recovery and heavy metals. NIVA-Report SNO 4208/2000, ICP Waters report 52/2000. ISBN 82-577-3827-1, 115 pp
53. Stoddard, J. L., Jeffries, D. S., Lükewille, A., Clair, T. A., Dillon, P. J., Driscoll, C. T., Forsius, M., Johannessen, M., Kahl, J. S., Kellogg, J. H., Kemp, A., Mannio, J., Monteith, D., Murdoch, P. S., Patrick, S., Rebsdorf, A., Skjelkvåle, B. L., Stainton, M. P., Traaen, T. S., van Dam, H., Webster, K. E., Wieting, J., and Wilander, A. 1999. Regional trends in aquatic recovery from acidification in North America and Europe 1980-95. Nature 401:575- 578.
54. Skjelkvåle, B.L. Olendrzynski, K., Stoddard, J. Traaen, T. and Wright, R.F. 2000 Draft report : Assessment of trends
and leaching in Nitrogen at ICP Waters Sites (Europe and North America) 55. Hovind, H. 2000. Intercomparison 0014. pH, K25, HCO3, NO3 + NO2, Cl, SO4, Ca, Mg, Na, K, total aluminium,
aluminium - reactive and nonlabile, TOC, COD-Mn. Fe, Mn, Cd, Pb, Cu, Ni and Zn. NIVA-Report SNO 4281-2000, ICP Waters Report 55/2000. ISBN 82-577-3910-3.
56. Hovind, H. 2000. Trends in intercomparisons 8701-9812: pH, K25, NO3 + NO2, Cl, SO4, Ca, Mg, Na, K and aluminium -
reactive and nonlabile, TOC, COD-Mn. NIVA-Report SNO 4281-2000, ICP Waters Report 56/2000. ISBN 82-577-3910-3.
57. Wright, R.F. 2000. Note on: Effect of year-to-year variations in climate on trends in acidification. NIVA-report SNO
4328-2001, ICP Waters report 57/2001. ISBN 82-577-3962-6. 58. Kvaeven, B. Ulstein, M.J., Skjelkvåle, B.L., Raddum, G.G. and Hovind. H. 2000. ICP Waters – An international
programme for surface water monitoring. In Press Water Air Soil Poll.:Focus 59. Skjelkvåle, B.L. Stoddard J.L. and Andersen, T. 2000. Trends in surface waters acidification in Europe and North
America (1989-1998). In Press Water Air Soil Poll.: Focus
ICP Waters report 54/2001
44
60. Stoddard, J. Traaen, T and Skjelkvåle, B.L. 2000. Assessment of Nitrogen leaching at ICP-Waters sites (Europe and
North America). In Press Water Air Soil Poll.: Focus 61. Raddum, G.G. and Skjekvåle B.L. 2000. Critical Load of Acidifying Compounds to Invertebrates In Different
Ecoregions of Europe. In Press Water Air Soil Poll. 62. Raddum.G.G. Intercalibration 0005: Invertebrate fauna. NIVA report SNO-4384-2001, ICP Waters report 62/2001
All reports and publications are available at: Norwegian Institute for Water Research P.O.Box. 173, Kjelsås N-0411 Oslo Norway