Assessment of the Seaweed Value chain in...
35
September 2007 This publication was produced for review by the United States Agency for International Development. It was prepared by Development Alternatives, Inc. Assessment of the Seaweed Value chain in Indonesia
Transcript of Assessment of the Seaweed Value chain in...

September 2007
This publication was produced for review by the United States Agency for International Development. It was prepared by Development Alternatives, Inc.
Assessment of the Seaweed Value chain in Indonesia

Assessment of the Seaweed Value Chain in Indonesia
DISCLAIMER
The authors’ views expressed in this publication do not necessarily reflect the views of the United States Agency for International Development or the United States Government.

BRI II Building, 28th Fl, Suite 2806
Jl. Jend. Sudirman 44-46, Jakarta 10210, Phone: 62-21-571 3548/49, Fax: 62-21-571 1388
“Helping Indonesia to Grow”
ASSESSMENT OF THE SEAWEED VALUE CHAIN IN INDONESIA
Iain C. Neish, Ph. D. of Yayasan Seaplant.net For the
U.S. AGENCY FOR INTERNATIONAL DEVELOPMENT
RAISE Plus IQC No. EDH-I-00-05-00004-00
Month, Year
A Project Implemented by Development Alternatives, Inc.

TEXT_GORONTALO_SEAPLANTS_1.doc 2
TABLE OF CONTENTS Glossary 1. Executive Summary 2. Project Overview
2.1 Background 2.2 Deliverables 2.3 Methodology 2.4 Value chain structure 2.5 General market trends 2.6 General technology trends
3. Status Quo of Gorontalo Province Seaplant Farming 3.1 Geographic setting 3.2 Production levels 3.3 Seasonality 3.4 Cultivar sources and types 3.5. Technical and financial support 3.6. Agronomics and post-harvest treatment 3.7. Value chain
4. Observations & Conclusions 5. Proposed Interventions 6. Next Steps APPENDIX A. MAPS
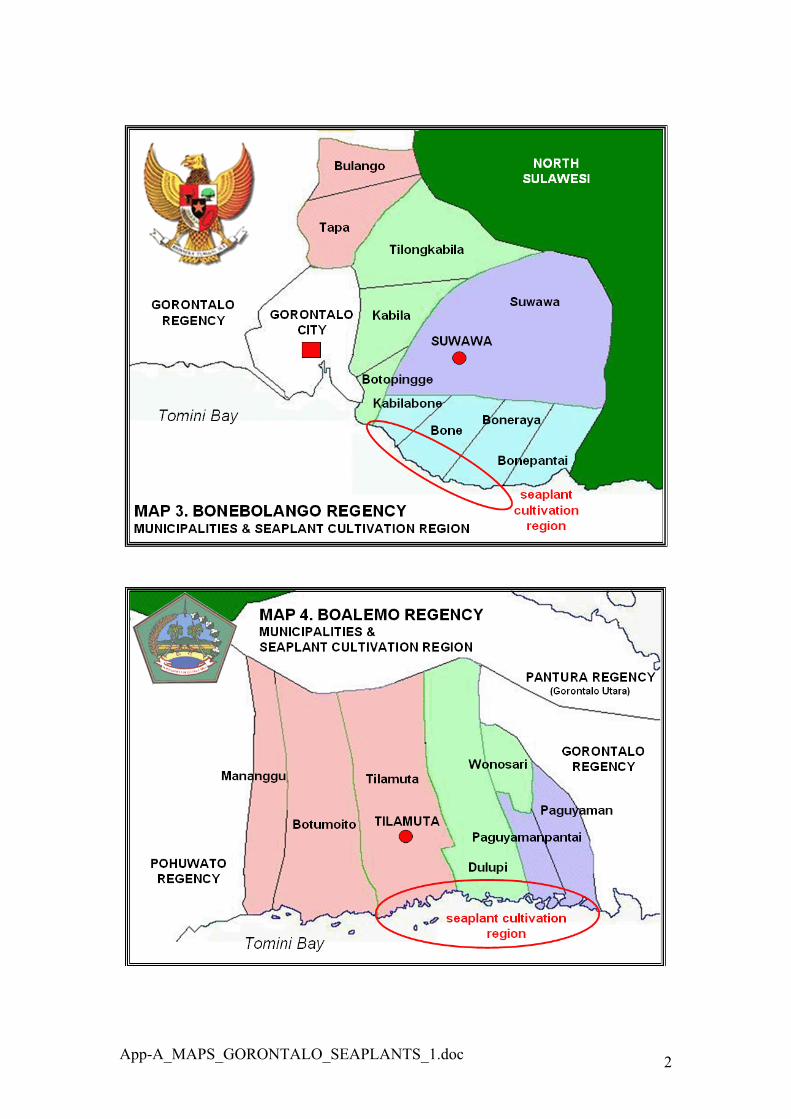
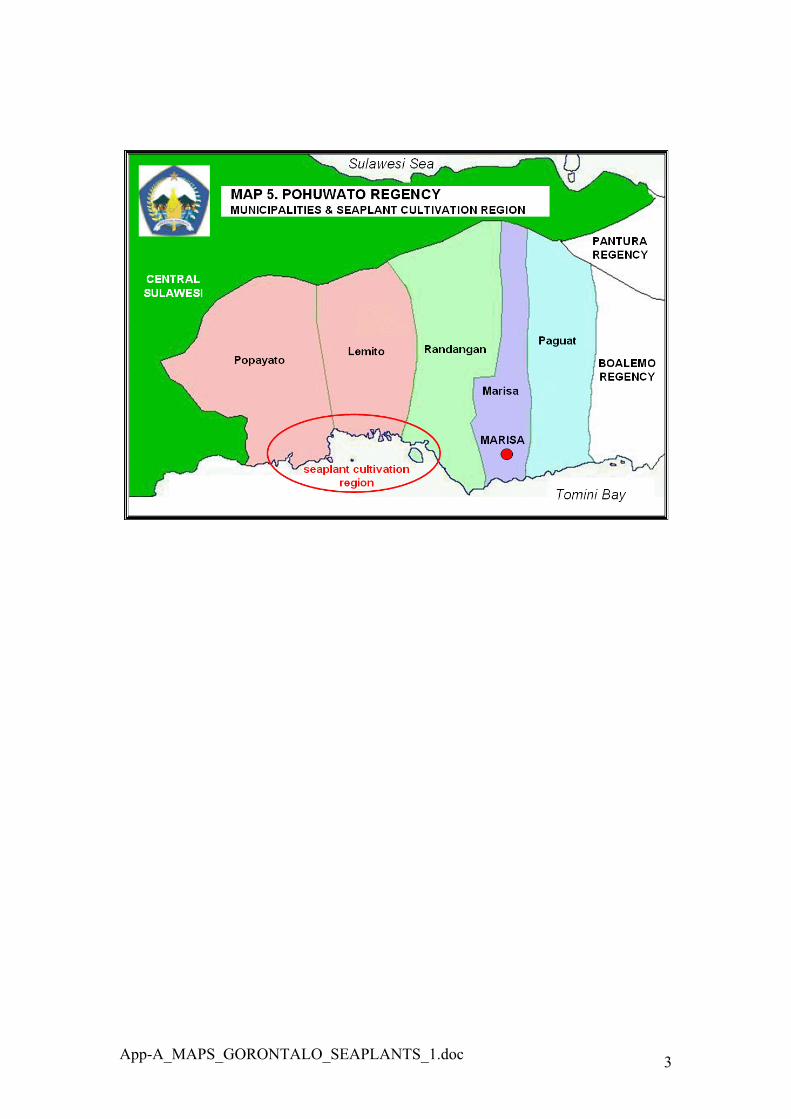
Map 1. Gorontalo Province and City Map 2. Gorontalo Regency Map 3. Bonebolango Regency Map 4. Boalemo Regency Map 5. Pohuwato Regency
APPENDIX B. TABLES Table 1. basic statistics for regencies and capital city region of Gorontalo Province. Table 2. Municipalities of Gorontalo Regency. Table 3. Municipalities of Bonebolango Regency. Table 4. Municipalities of Boalemo Regency. Table 5. Municipalities of Pohuwato Regency. Table 5. Municipalities of Pohuwato Regency. Table 6. Maximum temperatures Table 7. Minimum temperatures Table 8. Monthly rainfall (mm) Table 9. Rainy days Table 10. Average wind speed (km/hr) Table 11. Gusting winds speed (km/hr) Table 12. Direction of average wind Table 13. Direction of maximum wind
APPENDIX C. GRAPHS Graph 1. Gorontalo combined average monthly rainfall (mm) 1996-2006 Graph 2. Gorontalo average monthly rainfall (mm) for all years from 1996-2006 Graph 3. Gorontalo average monthly rainfall by year (mm) 1996-2006 Graph 4. Gorontalo average wind direction (degrees) 1996-2006
APPENDIX D. PLATES Plate 1. Pantura Regency (a.k.a. Gorontalo Utara) Plate 2. Bonebolango Regency at Desa Batotanuo Plate 3. Boalemo Regency at Desa Dulupi Plate 4. Pohuwato Regency at Desa Lemito

TEXT_GORONTALO_SEAPLANTS_1.doc 3
GLOSSARYATC - alkali-treated chips made from cottonii
Cottonii – Kappaphycus spp.
Cultivar – A clone derived from vegetative propagation originating from a single seaplant thallus.
DKP – Dinas Perikanan dan Kelautan (Fisheries and Oceans Office) of the Indonesian government
Eucheuma spp. - A red algal genus that is called “spinosum” of the trade; source of iota carrageenan.
Eucheuma seaplants – The marine macrophyte genera Kappaphycus and Eucheuma
Galactans – A class of polysaccharides that includes carrageenan and agar.
Gracilaria spp. – A red algal genus also called “gracilaria” in the trade; source of agar.
Kappaphycus spp.- A red algal genus that includes both “cottonii” of the trade and “sacol” of the trade; sources of kappa carrageenan
MSME – Micro, small and medium enterprises.
MT – metric ton
RAGS – Red Algal Galactan Seaweeds including Eucheuma, Gracilaria and Kappaphycus.
Spinosum – Eucheuma spp.
SRC – semi-refined carrageenan (a.k.a. processed eucheuma seaweed, PES or E407a)
USD – United States Dollar.

TEXT_GORONTALO_SEAPLANTS_1.doc 4
1. Executive Summary
Caveat: The present survey involved two days of field visits during late September, 2007; four days studying secondary source materials; and past industry experience of the field investigators. Extended field visits during all quarters of the year would reveal substantially greater information.
1. It seems that the development of seaplant farming in Gorontalo has “bogged down” over the years and there is insufficient crop production to support year-around processing activities. Any development of post-harvest or process technology must be built on programs that build crop production to commercially attractive levels.
2. It is not yet clear how slow progress with crop production development is related to natural and socio-economic parameters. If answers can be found there seems to be substantial unrealized potential for increasing production in Gorontalo.
3. Seaplant cultivation in Gorontalo Province was first tried in the early 1990s and commercial production commenced around 1995. The impetus for seaplant farming came primarily from carrageenan manufacturers operating through their suppliers to stimulate production. Industry initiatives were later joined by activities from government agencies and NGO activity.
4. Gorontalo seaplant production seems to be limited almost entirely to the cultivation of Kappaphycus spp. (cottonii of the trade) as a raw material for production of the hydrocolloid known as kappa carrageenan. Aside from small quantities of Eucheuma(spinosum of the trade) there was no sign of other genera being farmed or exploited from wild stocks. There was also no sign of seaplants being marketed through sea vegetable and nutrient product value chains.
5. Although no statistics have been found to date it seems from discussions with industry stakeholders that total monthly production from Gorontalo Province has ranged from negligible quantities during the “off-season” (especially quarter 3) to around 200 tons per month (or even as much as 500 tons) during peak production seasons (usually quarter 1).
6. Dried crops move to market from local collectors and traders through hubs at Gorontalo and Manado. Prices seem to track well with those observed in the rest of Indonesia.
7. Presently cottonii generally has a “seller’s market” Cottonii farm gate prices are on the order of 4,000 – 5,000 IDR per kilogram and there is a robust cottonii market that has projected growth of 12-15% per annum. This suggests that Indonesian cottonii production must increase 2-3 times present production to meet market demand projected over the next decade.
8. Seaplant production appears to be highly seasonal in all producing regions of Gorontalo except Lemito in Pohuwato Regency. It is not clear how much of this seasonality is due to natural forces and how much is caused by cultural factors or limitations in agronomic knowledge. For example the “rainy season” was mentioned extensively by value chain stakeholders as a defining event for determining planting cycles however the official weather data show that the magnitude and periodicity of rainfall varies considerably from year to year.
9. It seems to be difficult for farmers to obtain cuttings when they need to replant their farms. Year around nursery operations have not developed locally and regional sources such as Pulau Nain near Manado have had production failures in recent years.

TEXT_GORONTALO_SEAPLANTS_1.doc 5
10. Interventions likely to bring about an increase in seaplant crop production include: a. Development of local nurseries that make productive varieties of cultivar
available in sufficient quantities and on a timely basis for seasonal replanting. b. Development of financing programs that enable farmers to purchase cuttings
and planting materials. c. Improvements in agronomic practices, cultivar selection and post-harvest
treatment systems that can reduce the impacts of seasonality. d. Aggregation of farmers into strong enterprise units (e.g. formal cooperatives)
that can add value to crops and can do business with other value chain stakeholders.
e. Linking of farmer enterprise units to strong, progressive and supportive enterprises at the next value chain levels.
11. It is proposed that these interventions should focus initially around Lemito in Pohuwato Regency and around Kwandang/Anggrek in Gorontalo Utara (Pantura) Regency.
12. Care must be taken in developing linkages from farmer enterprises to players further up the value chain. Technology and applications for seaplant value chains are undergoing rapid change but the fundamental fact is that crop suppliers will have a strong position from which to build their enterprises.
2. Project Overview
2.1 Background AMARTA program staff undertook investigative trips to seaplant farming areas of Gorontalo Province in the second quarter of 2007 and found that seaplant production form the province is comprised primarily of Kappaphycus spp. (cottonii of the trade) and Eucheuma spp.(spinosum of the trade). Both of these seaplant genera (commonly called seaweeds) are utilized as raw materials for the hydrocolloid known as carrageenan. Collectors, exporters, and growers were interviewed with a view toward identifying the issues most seriously affecting product demand and returns to growers. These are listed as follows in order of importance:
1. Contamination of foreign materials in the seaweed bales and the subsequent expense to the factory for cleaning the product.
2. High moisture content and increased weight of the material caused by excessive salt in the bale.
3. Indirect marketing channels between the growers and the importer. AMARTA staff identified the post harvest handling process as the area of the value chain that requires the most immediate attention and the area where intervention could be most effective. The AMARTA program designers initially proposed to identify one or more reputable seaweed exporters who are willing to improve or set up a collection programs producing areas and return some of the increased revenues through improvement in quality of the product back to the growers. AMARTA proposed to work with small groups of seaweed growers who are supplying exporters either directly or indirectly, assisting them through a small grant to set up a small facility to grade, clean, dry, and bale seaweed to the specifications of the importer. The exporters could then arrange for the clean, export ready, product to be delivered portside for container stuffing and export. It became clear during value chain investigations that the production of carrageenan is increasingly involving Indonesian processors and there an increasing trend away from

TEXT_GORONTALO_SEAPLANTS_1.doc 6
exporting raw, dried seaweed from Indonesia. Approximately 22 Indonesian companies are now processing carrageenan and/or agar. It was therefore necessary to orient project work not only at exporting to foreign processors but also at dealing with domestic processors. As a next step toward developing action plans AMARTA contracted Seaplant.net Foundation in the person of Dr. Iain C. Neish to undertake the present study with the following Assignment Objectives and Specific Tasks (edited by the author): Assignment Objectives: Increased income to local seaweed farmers by putting farmer groups in a good position to become a preferred suppliers to exporters and processors.Specific Tasks:
1. Identify a progressive exporters or processors of seaweed that are willing to work with farmer groups to improve harvesting and post-harvest handling practices for seaweed and are willing to pass on some of the increase in profits to seaweed growers.
2. Meet with growers to identify farmer groups or associations that can be capable of aggregating, grading, packing, and shipping improved raw materials.
3. Identify the roles of stakeholders who can supervise collection, grading, shipment, and payment processes.
4. Collect and publicize the standards put forth by seaweed buyers using these standards to design best practices for producing seaweeds for further processing.
5. Provide best practices training for production, harvesting and handling of seaweed products.
6. Disburse a grant necessary for setting up a basic pack house complete with cleaning and grading tables, screens, drying racks and baling machines.
7. Work with the various players in the value chain to implement the best practices 8. Test the supply chain and response of exporters and processors. 9. Make necessary adjustments and improvements to the process.
2.2 Deliverables The present study was divided into a six-day preliminary phase that is to be followed by and 18 day follow up phase. The present report to the Chief of Party covers the six-day preliminary phase. The present report leads toward a final report that will address the points in the Specific Tasks noted above, and will include the following:
! Relevant findings and conclusions;
! Recommendations that address the importance and acceptability of adapting this added value chain product to the AMARTA project technical assistance plan, based on the criteria provided by USAID regarding impact on employment, sales, and competitiveness (sustainability);
! Baseline and projected increases to be achieved in a 3 year period of assistance;
! The main targets of assistance, and the preferred method of assistance, including financial (grants), technical, governmental, and/or institutional; and
! Action to be taken in the first year of the work plan to address the recommendations given above, on a monthly or quarterly basis.

TEXT_GORONTALO_SEAPLANTS_1.doc 7
2.3 Methodology Materials were researched from the available literature, from conversations with industry stakeholders, from Internet-based sources and from previous survey results from AMARTA – notably the May, 2007 report from Jeff Gucker to David Anderson (Appendix E). On-site visits in Gorontalo were undertaken by Iain Neish and Jeff Gucker during September 27 and 28. The method was simply to drive to sites in known seaweed producing areas and rent small boats locally where necessary to inspect seaweed farms. Informal interviews were conducted with farmers and local people and the current status quo was compared to previous observations. In addition weather data were obtained from the Jalaluddin airport, Gorontalo office of Badan Meteorologi dan Geofisika Indonesia and these were transposed to MS Excel for analysis.
2.4 Value chain structure The crops colloquially known in English as “seaweeds” are actually marine macro-algae. Other types of seaplants include micro-algae (e.g. phytoplankton and zooxanthellae) and vascular plants (e.g. mangroves, palms and sea grasses). Among the vascular seaplants the mangroves and palms (e.g. nipa) are generally handled as forestry resources although they also provide habitat for a vast array of algal seaplants and of sea animals. The value chains utilizing algae generally fall into the categories shown in Figure 1. Figure 1. General structure of value chains based on seaplant raw materials. In Gorontalo seaplant farming is linking only into the chain indicated by bold borders. It is almost entirely Kappaphycus spp. (cottonii) for use as carrageenan raw material.
Most commercially produced seaplants from Indonesia belong to the commercially distinct group known as RAGS (red algal galactan seaplants). In Indonesia there are five commercially distinct classes of RAGS produced. A quick summary follows:
1. Kappaphycus alvarezii (cottonii of the trade). Source of kappa carrageenan. Several cultivars known. Chronically in short supply for at least a decade. Prices have ranged from about 600 – 1,000 USD/dry ton FOB during that time.
2. Kappaphycus striatum (sacol of the trade). Source of a variant of kappa carrageenan. At least two cultivars known. Grows better than cottonii in shallow waters close to shore but breaks up in exposed at exposed sites. Chronically in short
redbrown
& green macroalgae(seaweeds)
andmicroalgae
andvascularplants
modificationextraction & milling
food, personal care& other products
nutrients &nutraceuticals
biopolymersin functional blends
human foodpet foodfish feed
stock feedsoil conditioners
nutrientsothers…
END USESSEAPLANTCROPS SOLUTIONSBUILDING
BLOCKS
modification, extraction& other processes
functionalblends
prepared nutrientsfor “fed” animals
processedpackaged foods
post-harvest treatment sea vegetables
post-harvest treatment
redbrown
& green macroalgae(seaweeds)
andmicroalgae
andvascularplants
modificationextraction & milling
food, personal care& other products
nutrients &nutraceuticals
biopolymersin functional blends
human foodpet foodfish feed
stock feedsoil conditioners
nutrientsothers…
END USESSEAPLANTCROPS SOLUTIONSBUILDING
BLOCKS END USESSEAPLANTCROPS SOLUTIONSBUILDING
BLOCKS
modification, extraction& other processes
functionalblends
prepared nutrientsfor “fed” animals
processedpackaged foods
post-harvest treatment sea vegetables
post-harvest treatment

TEXT_GORONTALO_SEAPLANTS_1.doc 8
supply since it was recognized as being commercially distinct within the past decade. Price generally the same as for cottonii.
3. Eucheuma denticulatum (spinosum of the trade). Source of iota carrageenan. Several cultivars known but only one common in Indonesia. Easily grown. Often planted in areas where Kappaphycus grows poorly seasonally – even when farm gate prices drop below 150 USD/ dry ton.
4. Gracilaria spp. Source of food-grade agar-agar. Generally grown in shrimp or milkfish ponds as an alternative or companion crop. Easy to and cheap to grow so production occurs as long as there is a market even when prices drop below 150 USD/ton.
5. Gelidium spp. or Gelidiella spp. Sources of bacteriological agar. Obtained from wild stocks. Slow growing small plants that are not yet commercially farmed. In chronic short supply worldwide. Can bring prices in the thousands of USD per dry ton.
In Gorontalo Province seaplant production appears to involve only the first value chain shown in Figure 1 (in bold borders). Specifically Gorontalo has produced dried Kappaphycus spp. (cottonii of the trade) as a raw material for production of kappa carrageenan and small amounts of Eucheuma spp. (spinosum of the trade) as raw material for the production of iota carrageenan. According to the available information development of seaplant farming in what is now Gorontalo Province began in the late 1980s. At that time the “big three” carrageenan producers dominated the industry. They worked through their suppliers to develop sources of kappa- and iota-carrageenan raw material. The original “big three” (originally SME) have now been acquired by larger companies and are now divisions of FMC Biopolymer; CP-Kelco; and Cargill.Seaplant cultivation in Gorontalo Province reached commercial levels by the mid 1990s. By then industry initiatives had been joined by activities from government agencies and there was also some NGO activity. Two of the major present buyers of Gorontalo seaweeds developed originally as suppliers to the “big three” and they have been responsible for supporting much of what production has developed in Gorontalo. Both buyers have a record of being responsible in dealing with farmers and both have spent about twenty years building both sources of seaplants and solid reputations in the marketplace. They are:
1. C.V. Sumber Rejeki (Marcel Taher and family) who supply Indonesian processors and also export to ‘Grade A” foreign processors.
2. P.T. Amarta Sari Lestari (Kang Siu Ming and family) who produce semi-refined carrageenan (SRC) from their factory near Surabaya and also export semi-processed of raw seaplant materials to ‘Grade A” foreign processors.
The type of chain through which most farmed seaplants from Gorontalo currently reach markets is summarized in Figure 2 A. The type of chain that Seaplant.net Foundation has been developing and that the AMARTA project can develop is shown in Figure 2 B. The main difference between the two chains is that Chain A emphasizes export of raw, dried “seaweeds” while Chain B. adds as much vale as possible as close to seaplant sources as possible and then exports ingredient building blocks and ingredient solutions.
2.5 General market trends As an initiative of IFC Advisory Services Seaplant.net has done trade data analyses and has commissioned market studies (notably for China) that indicate 12-15% market growth for kappa carrageenan from cottonii over the coming decade. It is expected that most of the increase must come from Indonesia. This means that Indonesian cottonii production must increase from its current level of about 100,000 dry tons per annum to the equivalent of about 300,000 tons per annum by 2017.

TEXT_GORONTALO_SEAPLANTS_1.doc 9
Figure 2. Value chains that link RAGS from Indonesian sources to global markets. A. Shows value chains that emphasize export of raw seaplants. B. Shows Value chains that emphasize adding value close to Indonesian sources. It is the latter type of value chain that the AMARTA project and Seaplant.net Foundation projects are designed to develop and implement.
2.6 General technology trends The technology involved in seaplant-based value chains is in the midst of a paradigm shift due to a variety of factors including the growing significance of seaplants and seaplant processing technology in:
1. Global carbon and nitrogen budgets (hence credit schemes) 2. Development of integrated multi-trophic aquaculture (IMTA) 3. Discoveries of nutritional and bioactive properties of seaplants. 4. Energy conservation and energy production.
building blocksolutionseaweed
Product
value addedvalue not added
Process
1. seaplantfarmers
2. localcollectors& traders
7.distributors
exportmarkets
5. “pure”solution
providers
4. manufacturers+ solutionproviders
6. end users
inside Indonesia outside Indonesia
exportmarket
4. “pure”solution
providers
5. end users
6.distributors
1. seaweedfarmers
3. manufacturers+ solutionproviders
2. farmerfranchise
enterprises
A. Value chains that emphasize export of raw seaplants
B. Value chains that emphasize adding value close to Indonesian sources.
3. Indonesia& overseas
traders
inside Indonesia outside Indonesia
INDEXbuilding block
solutionseaweed
Product
value addedvalue not added
Process
1. seaplantfarmers
2. localcollectors& traders
7.distributors
exportmarkets
5. “pure”solution
providers
4. manufacturers+ solutionproviders
6. end users
inside Indonesia outside Indonesia
exportmarket
4. “pure”solution
providers
5. end users
6.distributors
1. seaweedfarmers
3. manufacturers+ solutionproviders
2. farmerfranchise
enterprises
A. Value chains that emphasize export of raw seaplants
B. Value chains that emphasize adding value close to Indonesian sources.
3. Indonesia& overseas
traders
inside Indonesia outside Indonesia
INDEX

TEXT_GORONTALO_SEAPLANTS_1.doc 10
3. Status Quo of Gorontalo Province Seaplant Farming
3.1 Geographic setting Gorontalo Province was declared in the year of 2003. Gorontalo has four regencies and one municipality. (Appendix A Maps 1 - 5). The regencies are Pohuwatu,, Boleamo, Gorontalo and Bone Bolango. The municipality is Gorontalo City. Apparently the northern part of Gorontalo Regency (Gorontalo Utara) is in the process of being designated as Pantura Regency. Gorontalo Province sits only about 30 minutes if latitude north of the equator and has both northerly and southerly exposures. Seaplant farming has occurred on both coasts and has occurred in the regions circled in red in Maps 1-5. Thus, seaplant farming has occurred along most coastal regions except the south coast of Gorontalo Regency and within Gorontalo City. Gorontalo is a province that provides a variety of agriculture crops and fishery products. Seaplants are not yet a major factor in the Gorontalo economy. Most people derive their incomes from value chains bases on products such as copra, maize, sugar cane, captured fish and other captured seafood items. The demographics of Gorontalo are summarized in Appendix B Tables 1-5. Table 1 is also shown below. Table 1. Some basic statistics concerning the regencies and capital city region of Gorontalo Province.
MapNo.
Region(Capital)
Area(km2)
% of total
No. of municipalities
No.villages
Population(2004)
4 Boalemo Regency
(Tilamuta)
2,517 20.6 7 61 108,312
3 Bonebolango Regency
(Suwawa)
1,984 16.3 10 59 122,722
2 Gorontalo Regency
(Limboto)
3,409 27.9 17 186 415,672
5 Pohuwato Regency
(Marisa)
4,244 34.8 7 69 105,593
2 Gorontalo City 65 0.5 5 46 147,354
1 Gorontalo Province
(Gorontalo)
12,215 100 46 375 899,653

TEXT_GORONTALO_SEAPLANTS_1.doc 11
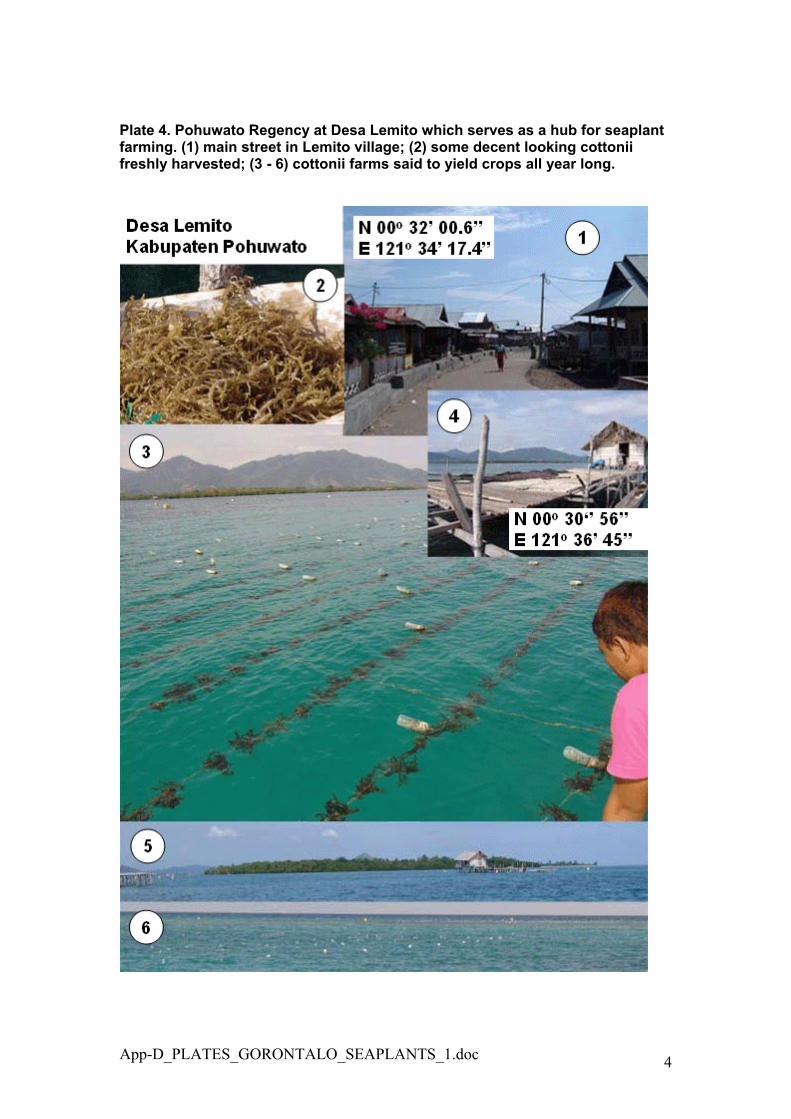
3.2. Production levels The present survey was undertaken during Ramadan at a time that is normally the off-season for seaplant farming and there seemed to be negligible production of seaplants from everywhere except the Lemito region of Pohuwato Regency (Appendix D plate 4). Other than around Lemito most farms inspected during the survey had been fully harvested (Appendix D Plates 1-3). The only exception was a few lines of spinosum that seemed to be growing well but showed signs of neglect and were overdue for harvesting (Appendix D Plate 1). Gorontalo seaplant production seems to be limited almost entirely to the production of Kappaphycus spp. (cottonii of the trade) as a raw material for production of the hydrocolloid known as kappa carrageenan. Aside from small quantities of Eucheuma (spinosum of the trade) there was no sign of other genera being farmed or exploited from wild stocks. There was also no sign of seaplants being produced for the sea vegetable and nutrient product markets.Although no statistics have been found to date it seems from discussions with industry stakeholders that total monthly production from Gorontalo Province has ranged from negligible quantities during the “off-season” (especially quarter 3) to around 200 tons per month (or even as much as 500 tons) during peak production seasons (usually quarter 1).
3.3. Seasonality In all regions of Gorontalo seasonality of cottonii production was reputed to be the norm. The only exception was at farm sites near Lemito, Pohuwatu where farming was still active and farmers interviewed in the field said that year-around farming was normally possible there even though production levels varied seasonally. There was a wide divergence of views among interviewed subjects as to what, exactly, was the cycle of planting seasons although there seems to be consensus that the quarter 3 was the “worst” time and quarter 1 was the “best” time. Production problems generally related to seasonality were:
1. Ice-ice during the dry season; 2. Barnacles (bia-bia) during the rainy season; 3. Heavy wave action at times during the rainy season; 4. Fresh water influxes and green algal (lumot) blooms during the rainy season.
Given the frequent references to “rainy season”, “dry season”, “East season” (musim timur) and “West season” (musim barat) the field team obtained monthly weather data from 1996-2006 from the Jalaluddin airport, Gorontalo office of Badan Meteorologi dan Geofisika Indonesia. These data were transposed to MS Excel for analysis. The data are shown in Appendix B Tables 6-13 and analyses of the results are depicted in Appendix C Graphs 1-4. When the eleven years of data were plotted as averages there were fairly distinct annual patterns with respect both to rainfall and to wind direction (Figure 3 and Appendix C Graphs 1 & 4). When year-to-year variations are examined, however, it can be seen that “seasonality” has been widely variable over the past decade. This is especially evident in Graph 2 (partly shown as Figure 4 below).

TEXT_GORONTALO_SEAPLANTS_1.doc 12
Figure 3. Average monthly weather data from Gorontalo’s Jalaluddin airport from 1996-2006. A. Shows average monthly rainfall in mm. B shows average monthly wind direction in degrees. (Data from Badan Meteorologi dan Geofisika Indonesia).
.Figure 4. Average rainy days per month showing the years 1996-2006 plotted individually. These data make it clear that annual variation is substantial. (Data from Badan Meteorologi dan Geofisika Indonesia).
A. Average Gorontalo mm rain per month (1996-2006)
020406080
100120140160
Jan Feb Mar Apr May Jun Jul Aug Sep Oct Nov DecQ 2Q 1 Q 3 Q 4
0100200300400
JanFeb
Mar
Apr
May
JunJul
Aug
Sep
Oct
Nov
Dec
B. Combined average wind directions at Gorontalo airport (1996-2006)
A. Average Gorontalo mm rain per month (1996-2006)
020406080
100120140160
Jan Feb Mar Apr May Jun Jul Aug Sep Oct Nov DecQ 2Q 1 Q 3 Q 4
020406080
100120140160
Jan Feb Mar Apr May Jun Jul Aug Sep Oct Nov DecQ 2Q 1 Q 3 Q 4
0100200300400
JanFeb
Mar
Apr
May
JunJul
Aug
Sep
Oct
Nov
Dec
0100200300400
JanFeb
Mar
Apr
May
JunJul
Aug
Sep
Oct
Nov
Dec
B. Combined average wind directions at Gorontalo airport (1996-2006)
0
5
10
15
20
25
30
Jan Feb Mar Apr May Jun Jul Aug Sep Oct Nov Dec0
5
10
15
20
25
30
Jan Feb Mar Apr May Jun Jul Aug Sep Oct Nov Dec
TEXT_GORONTALO_SEAPLANTS_1.doc 13
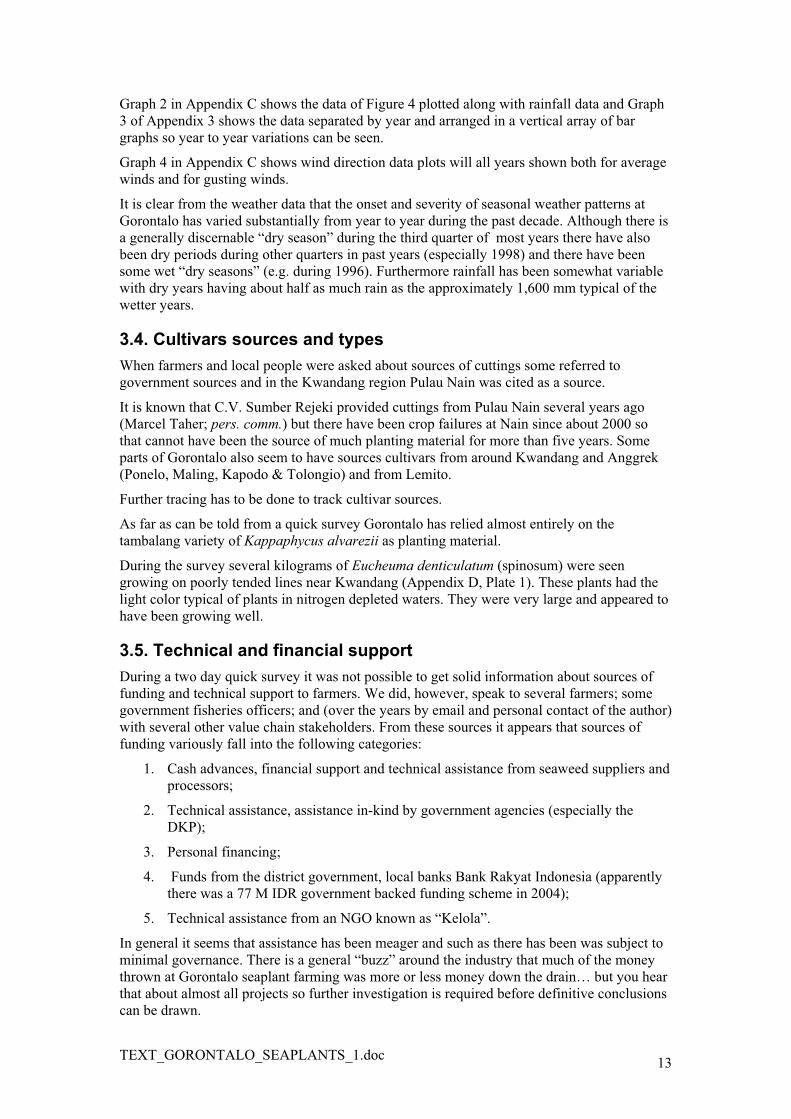
Graph 2 in Appendix C shows the data of Figure 4 plotted along with rainfall data and Graph 3 of Appendix 3 shows the data separated by year and arranged in a vertical array of bar graphs so year to year variations can be seen. Graph 4 in Appendix C shows wind direction data plots will all years shown both for average winds and for gusting winds. It is clear from the weather data that the onset and severity of seasonal weather patterns at Gorontalo has varied substantially from year to year during the past decade. Although there is a generally discernable “dry season” during the third quarter of most years there have also been dry periods during other quarters in past years (especially 1998) and there have been some wet “dry seasons” (e.g. during 1996). Furthermore rainfall has been somewhat variable with dry years having about half as much rain as the approximately 1,600 mm typical of the wetter years.
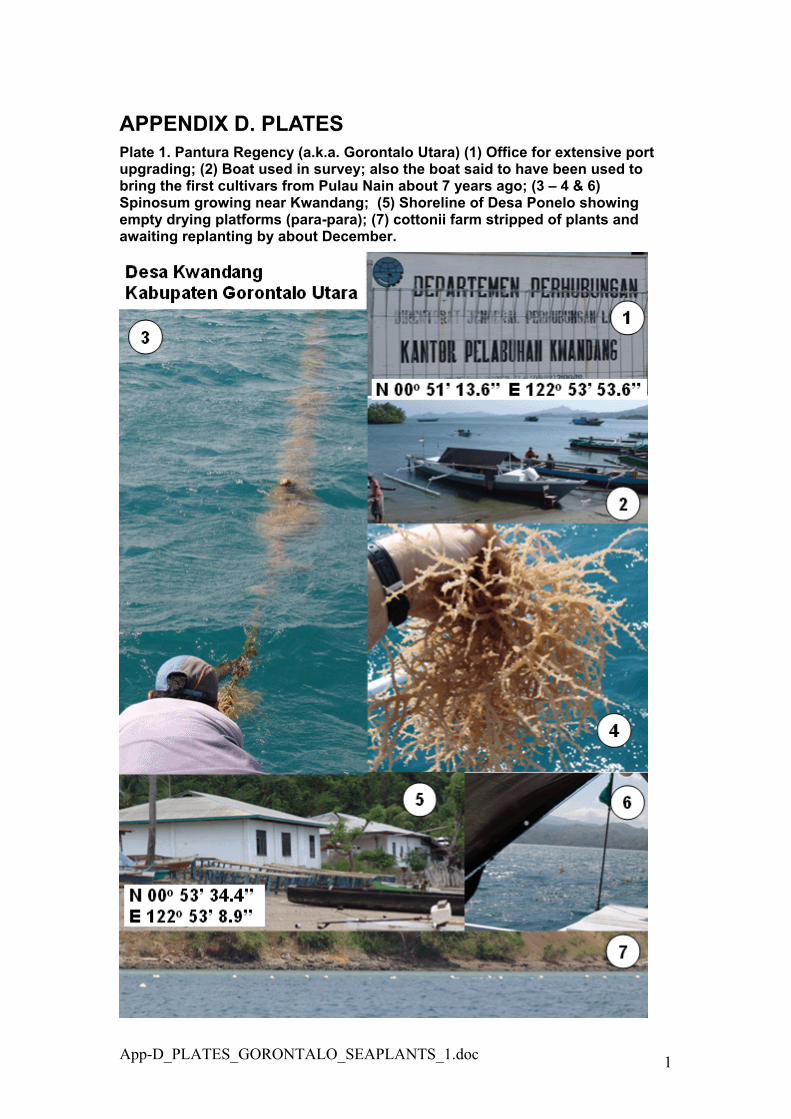
3.4. Cultivars sources and types When farmers and local people were asked about sources of cuttings some referred to government sources and in the Kwandang region Pulau Nain was cited as a source. It is known that C.V. Sumber Rejeki provided cuttings from Pulau Nain several years ago (Marcel Taher; pers. comm.) but there have been crop failures at Nain since about 2000 so that cannot have been the source of much planting material for more than five years. Some parts of Gorontalo also seem to have sources cultivars from around Kwandang and Anggrek (Ponelo, Maling, Kapodo & Tolongio) and from Lemito. Further tracing has to be done to track cultivar sources. As far as can be told from a quick survey Gorontalo has relied almost entirely on the tambalang variety of Kappaphycus alvarezii as planting material. During the survey several kilograms of Eucheuma denticulatum (spinosum) were seen growing on poorly tended lines near Kwandang (Appendix D, Plate 1). These plants had the light color typical of plants in nitrogen depleted waters. They were very large and appeared to have been growing well.
3.5. Technical and financial support During a two day quick survey it was not possible to get solid information about sources of funding and technical support to farmers. We did, however, speak to several farmers; some government fisheries officers; and (over the years by email and personal contact of the author) with several other value chain stakeholders. From these sources it appears that sources of funding variously fall into the following categories:
1. Cash advances, financial support and technical assistance from seaweed suppliers and processors;
2. Technical assistance, assistance in-kind by government agencies (especially the DKP);
3. Personal financing; 4. Funds from the district government, local banks Bank Rakyat Indonesia (apparently
there was a 77 M IDR government backed funding scheme in 2004); 5. Technical assistance from an NGO known as “Kelola”.
In general it seems that assistance has been meager and such as there has been was subject to minimal governance. There is a general “buzz” around the industry that much of the money thrown at Gorontalo seaplant farming was more or less money down the drain… but you hear that about almost all projects so further investigation is required before definitive conclusions can be drawn.

TEXT_GORONTALO_SEAPLANTS_1.doc 14
3.6. Agronomics and post-harvest treatment All sites seen during the September, 2007 survey seemed to be using “long-line” systems in fairly deep water (2 meters and more at low tide). A well tended farm at Lemito (Appendix D Plate 4) shows what these systems look like. Some farms are located near villages (Plate 1 at Ponelo Village) and others are far enough from villages that special working shelters are built on pilings over the sea (e.g. Appendix D Plate 4 at Lemito). There was evidence that drying flakes (para-para) or drying platforms are used for at least some post-harvest drying. Apparently there is no formal system of ownership for farm sites. Apparently sites are occupied on a “first-come-first-served” basis and then rights are endorsed at a village government level. Farmers apparently harvest their crops on 40-60 days cycles depending on growth rates and except when problems cause them to harvest sooner.
3.7. Value chain issues During this brief survey it was not possible to get an impression of how organized or cohesive local farmer groups are. It is know, however, that such groups exist throughout Gorontalo as they do for most of Indonesia. Before the present survey AMARTA pointed out that a “state owned company” of some sort may be set up in Gorontalo and that this company would do some level of processing. There was no follow-up on that possibility during the survey. One pf the main value chain issues that became obvious in connection with the survey is that Gorontalo is not over-populated and has some fertile land and seas. It therefore presents a fairly wide array of agricultural and fisheries opportunities to people of the province. Any resources applied to seaplant farming would have to be diverted from the production of maize, sugar cane, coconut products, captured fish and other items of agriculture and fisheries. In the Bonebolango district people also have the prospect of employment in Gorontalo City and eventually, perhaps, in the tourist business. This area has attractive beaches and is said to be of interest to divers.
4. OBSERVATIONS & CONCLUSIONS1. It seems that the development of seaplant farming in Gorontalo has “bogged down”
over the years and that the first priority for building a Gorontalo seaplant industry is to get production up to year-around, commercially useful levels. Any development of post-harvest or process technology must be built on programs that build crop production first.
2. During this initial survey it seemed to the survey team that there are large areas that are probably suitable for seaplant farming and for other forms of aquaculture. Under present circumstances it seems that even at peak planting seasons most suitable areas remain under-utilized.
3. It seems that the provision of some agronomy training might enable farmers to plant on a much less seasonal basis that is now done. It could be that much “seasonality” is a function of human behavior patterns and not simply a reflection of what “mother nature” is imposing on farmers.
4. It seems that farmers and local collectors are unfamiliar with the “big picture” in seaplant markets and there seems to be a general perception that seaplant prices are somewhat volatile and that markets are uncertain. If so, these perceptions can be brought into line with reality through training and information initiatives.

TEXT_GORONTALO_SEAPLANTS_1.doc 15
5. Agronomy practices seem rather rudimentary and there is heavy reliance on only one cultivar of cottonii. The use of methods such as test plots and seasonal shifting of farm sites are among methods that may help to get production up.
6. It seems evident that some sites around Gorontalo are much less seasonal than others. If so then this indicates a need for “nurseries” that can build planting stocks in good year-around sites for planting and grow-out at more seasonal sites.
7. Overall there seems to be a paucity of financing options that could finance nursery systems or farm expansion.
8. It appears that the two districts where farming has been most strongly established are the Lemito region in Pohuwato Regency on the south coast of Gorontalo Province and around the Kwandang/Anggrek region of Pantura (Gorontalo Utara). These places also seem to have some aggregation of farmer enterprise efforts. It therefore seems that priority should be given to these locations in ongoing AMARTA program development.
9. Development of Gorontalo seaplant farming so far seems to have been dependent largely on support from well established Indonesian exporters and processors with long-term market linkages. Experience in other regions of Indonesia suggest that the best path to further development is probably to work with enterprises such as these.
10. Care must be taken in developing linkages from farmer enterprises to players further up the value chain. Technology and applications for seaplant value chains are undergoing rapid change but the fundamental fact is that crop suppliers will have a strong position from which to build their enterprises. Farmer enterprises would probably be well served by keeping their options open while linking to value chain players with well established track records in the marketplace.
5. Proposed Interventions Based on the observations and conclusions cited in “4” above it seems that the interventions most likely to bring about the desired deliverables are:
1. Development of local nurseries that make productive varieties of cultivar available in sufficient quantities and on a timely basis for seasonal replanting;
2. Development of financing programs that enable farmers to purchase cuttings and planting materials;
3. Improvements in agronomic practices, cultivar selection and post-harvest treatment systems that can reduce the impacts of seasonality;
4. Aggregation of farmers into strong enterprise units (e.g. formal cooperatives) that can add value to crops and can do business with other value chain stakeholders;
5. Linking of farmer enterprise units to strong, progressive and supportive enterprises at the next value chain levels (both domestic and foreign).
6. Next steps 1. Iain Neish (and Jeff Gucker?) to meet with a David Anderson for debriefing on the
present report. 2. Develop an action plan for the remaining 18 days of activity under Contract number
EDH-I-04-05-00004-00

App-A_MAPS_GORONTALO_SEAPLANTS_1.doc 1
APPENDIX A - MAPS
App-A_MAPS_GORONTALO_SEAPLANTS_1.doc 2
App-A_MAPS_GORONTALO_SEAPLANTS_1.doc 3

App-B_TABLES_GORONTALO_SEAPLANTS_1.doc 1
APPENDIX B. TABLES
Table 1. Some basic statistics concerning the regencies and capital city region of Gorontalo Province.
MapNo.
Region(Capital)
Area(km2)
% of total
No. of municipalities
No.villages
Population(2004)
4 Boalemo Regency
(Tilamuta)
2,517 20.6 7 61 108,312
3 Bonebolango Regency
(Suwawa)
1,984 16.3 10 59 122,722
2 Gorontalo Regency
(Limboto)
3,409 27.9 17 186 415,672
5 Pohuwato Regency
(Marisa)
4,244 34.8 7 69 105,593
2 Gorontalo City 65 0.5 5 46 147,354
1 Gorontalo Province
(Gorontalo)
12,215 100 46 375 899,653

App-B_TABLES_GORONTALO_SEAPLANTS_1.doc 2
Table 2. Municipalities of Gorontalo Regency. Known seaplant growing areas shown in bold type.
Municipality (Capital)
No.villages
Gorontalo Regency village names
Anggrek 10 Dunu, Dudepo, Ilangata, Maling, Monano, Ponelo, Popalo, Tolongio,Tudi
Atinggola 12 Benteng, Bintana, Buata, Dumolodo, Gentuma, Ilomata, Imana, Ipilo, Kotajin, Molonggoto, Monggupo, Pinontoyonga.
Batudaa 12 Barakati, Bua, Huntu, Ilomangga, Iluta, Limehe Barat, Limene Timur, Lobuto, Moahudu, Motinelo, Payunga, Tabongo Barat
Batudaapantai 13 Biluhu Barat, Biluhu Tengah, Biluhu Timur, Bongo, Huwongo, Kayubulan, Lamu, Lobuto, Lopo, Luluou, Tantayuo
Boliyohuto 11 Bilato, Bumela, Diloniyohu, Ilomata, Lamahu, Motoduto, Parungi, Potanga, Sidodadi, Sidomulyo, Totopo.
Bongomeme 16 Ambara, Batulayar, Batuloreng, Bongomeme, Dulamayo, Dungaliyo, Kaliyoso, Lamu, Molas, Molopatodu, Otopade, Pangadaa, Upomela
Kwandang (Moluo) 13 Bulalo, Dambalo, Leboto, Molongkapoto, Molontadu, Moluo,Mootinelo, Motilango, Pontolo, Ponelo, Popalo, Posso, Tanjungkarang, Titidu, Tolongio
Limboto 12 Biyonga, Bolihuangga, Bongohulawa, Bulota, Dutulanaa, Hepuhulawa, Hunggaluwa, Hutuo, Kayubulan, Kayumerah, Molahu, Tenilo
Limboto Barat (Pone) 8 Daenaa, Huidu, Hutabohu, Ombulo, Padengo, Tunggulo, Yosonegoro
Mootilango (Paris) 10 Helumo, Huyula, Karyamukti, Pilomonu, Satria, Sidomukti, Sukamaju, Talumopatu
Pulubala (Pulubala) 9 Bakti, Molalahu, Molamahu, Mulyonegoro, Pongongaila, Puncak, Tridarma.
Sumalata 10 Biawu, Buladu, Bulontio Barat, Bulontio Timur, Deme I, Deme II, Dulukapa, Kasia, Wubudu
Telaga (Hulawa) 18 Buhu, Bulila, Bulota, Bunggalo, Dulomo, Hutadaa, Ilotidea, Lawonu, Luhu, Luwoo, Mongolato, Pilohiyanga, Tabumela, Tenggela, Tilote, Tualango
Telagabiru (Tuladenggi) 11 Dulamayo Selatan, Dulamayo Utara, Dumati, Lupoyo, Pantungo, Pentadio Barat, Pentadio Timur, Talumelito, Ulapato A, Ulapato B
Tibawa (Isimu Selatan) 12 Buhu, Datahu, Dunggala, Iloponu, Isimu Utara, Labanu, Molowahu, Motilango, Reksonegoro, Tolotio
Tolangohula 12 Bululi, Gandasari, Karyaindah, Lakeya, Mohiolo, Molohu, Sukamakmur
Tolinggula 11 Buloila, Didingga, Kikia, Limbato, Papulangi, Potangga, Tolinggulapantai, Tolinggula Tengah, Tolinggulaulu

App-B_TABLES_GORONTALO_SEAPLANTS_1.doc 3
Table 3. Municipalities of Bonebolango Regency. Known seaplant growing areas shown in bold type.
Municipality (Capital)
No.villages
Bonebolango Regency village names
Bone - -
Bonepantai 14 Bilungala, Kaidundu, Mamungaa, Molotabu, Monano, Oluhuta, Sogitia, Taludaa Barat, Taludaa Timur, Tamboo, Tolotio, Tombulilato, Tombulilato Barat, Tongo, Uabanga
Boneraya - Tombulilato
Botupingge (Timbuolo) 4 Buata, Luwohu, Panggulo
Bulango (Tupa) 6 Bandungan, Boidu, Longalo, Mongiilo, Owata
Kabila (Oluhuta) 4 Dutohe, Padengo, Pauwo, Poowo, Tanggilingo, Toto Selatan, Tumbihe
Kabilabone - Botutonuo, Molotabu, Oluhuta, Huangobotu
Suwawa (Boludawa) 14 Bonedaa, Bube, Bulontala, Duano, Dumbayabulan, Huluduotamo, Libungo, Lombongo, Lompotoo, Molintogupo, Pinogu, Tingohubu, Tulabolo
Tapa (Talulobutu) 9 Ayula Utara, Ayula Selatan, Bulotalangi, Dunggala¸ Huntu Selatan, Huntu Utara, Langge, Talumopato
Tilongkabila (Bongoime) 7 Bongopini, Lonuo, Moutong, Tamboo, Toto Utara, Tunggulo

App-B_TABLES_GORONTALO_SEAPLANTS_1.doc 4
Table 4. Municipalities of Boalemo Regency. Known seaplant growing areas shown in bold type.
Municipality (Capital)
No.villages
Boalemo Regency village names
Botumoito (Tutulo) 8 Bolihutuo, Botumoito, Hutamonu, Patoameme, Potanga, Rumbia, Tapadaa
Dulupi (Dulupi) 7 Kotajaya, Pangi, Polohungo, Tabongo, Tanahputih, Tanggajaya;
Mananggu (Tabulo) 7 Bendungan, Kaaruyan, Kramat, Mananggu, Pontolo, Salilama
Paguyaman 11 Bongo IV, Bongonol, Bongotua, Huwongo, Kualalumpur, Molombulahe, Mutiara, Saripi, Tenilo, Tongkobu, Wonggahu;
Paguyamanpantai 6 Apitalawu, Bangga, Bubaa, Bukitkarya, Limbatihu, Lito;
Tilamuta 11 Ayuhulalo, Bajo,Hungayonaa, Lahumbo, Lamu, Limbato, Modelomo, Mohungo, Pentadu Timur, Pentadu Barat, Piloliyanga
Wonosari 13 Bongo I, Bongo II, Bongo III, Dimito, Jatimulya, Mekarjaya, Pangeya, Raharja, Saritani, Sukamaju, Sukamulya, Tanjungharapan, Trirukun
Table 5. Municipalities of Pohuwato Regency. Known seaplant growing areas shown in bold type.
Municipality (Capital)
No.villages
Pohuwato Regency village names
Lemito 12 Lemito, Dudewulo, Torosiaje, Lomuli
Marisa (Marisa) 23 Balayo, Bulili, Buntulia Selatan, Buntulia Utara, Duhiadaa, Huluwa, Huyula, Iloheluma, Imbodu, Kalimas, Malango, Manawa, Manunggalkarya, Marisa Selatan, Marisa Utara, Motolohu, Pancakarsa, Pohuwato, Sidorukun, Sukamakmur, Taluduyunu, Teratai
Paguat 10 Bunuyo, Karangetang, Libuo, Otodjini, Padengo, Pentadu, Popaya, Siduana, Sipayo, Soginti
Patilanggio - Sukamakmur, Manawa
Popayato 12 Bukittingki, Bunto, Londoun, Maleo, Marisa, Milangodaa, Molosipat, Padengo, Popayato, Tahele, Telaga, Tunasjaya
Randangan - Ayula, Banoraja, Wonggarasi Barat, Wonggarasi Timur
Taluditi - Kalimas

App-B_TABLES_GORONTALO_SEAPLANTS_1.doc 5
Table 6. Maximum temperatures observed at Jalaluddin airport, Gorontalo (Badan Meteorologi dan Geofisika Indonesia)
1996 1997 1998 1999 2000 2001 2002 2003 2004 2005 2006 AVGJan 30.6 31.0 31.3 31.0 31.1 31.2 30.6 31.6 31.7 31.7 31.6 31.2Feb 30.2 30.9 32.3 31.4 31.4 31.1 31.2 31.1 30.9 31.4 31.2 31.2Mar 31.7 31.7 33.0 31.8 31.5 31.7 32.1 31.8 32.6 32.9 31.9 32.1Apr 32.4 32.0 33.0 32.3 31.5 32.3 32.9 32.4 33.2 32.0 32.2 32.4May 32.2 32.7 32.3 31.7 32.9 32.2 32.2 31.9 32.6 32.2 32.4 32.3Jun 31.3 32.6 31.9 31.3 30.9 31.3 31.6 32.4 32.0 32.0 31.3 31.7Jul 31.4 31.6 31.4 31.0 31.3 31.7 31.9 31.2 31.4 30.6 31.8 31.4Aug 31.6 32.5 31.3 31.6 31.5 31.3 32.2 32.2 31.9 32.5 31.8 31.9Sep 32.0 33.2 32.3 32.5 32.7 33.1 33.4 32.6 33.6 33.8 31.9 32.8Oct 32.2 34.7 32.3 32.4 31.9 33.2 34.6 33.5 34.2 33.5 33.2 33.2Nov 31.7 33.6 31.9 32.3 32.2 32.4 33.7 33.3 33.3 32.4 33.4 32.7Dec 31.2 31.9 31.9 32.1 32.1 31.4 32.5 31.3 32.7 31.9 31.9 31.9AVG 31.5 32.4 32.1 31.8 31.8 31.9 32.4 32.1 32.5 32.2 32.1
Table 7. Minimum temperatures observed at Jalaluddin airport, Gorontalo (Badan Meteorologi dan Geofisika Indonesia)
1996 1997 1998 1999 2000 2001 2002 2003 2004 2005 2006 AVGJan 23.6 23.1 23.8 23.7 23.5 23.5 23.5 23.7 23.8 23.4 23.8 23.6Feb 23.6 23.6 22.9 23.7 23.7 23.7 23.9 23.9 23.7 23.1 23.9 23.6Mar 24.2 23.3 23.1 23.7 23.4 23.9 23.9 23.8 23.8 23.7 23.9 23.7Apr 23.8 23.4 24.6 24.0 23.8 24.3 23.9 24.4 23.7 23.9 24.1 24.0May 24.0 23.4 25.1 23.6 23.8 23.8 23.6 24.1 23.7 23.8 24.0 23.9Jun 23.9 31.4 24.1 23.2 23.7 23.6 23.8 22.9 23.2 23.3 23.6 24.2Jul 23.5 23.1 23.9 22.7 22.9 22.9 21.5 22.9 22.5 23.0 22.3 22.8Aug 23.2 20.9 23.4 22.4 22.8 22.9 21.8 22.8 21.4 22.5 23.2 22.5Sep 23.1 21.1 23.3 22.8 22.9 22.8 21.6 22.5 22.1 22.7 21.8 22.4Oct 23.8 21.7 23.9 23.7 23.7 23.4 22.7 23.3 23.0 23.9 22.4 23.2Nov 23.6 23.7 23.9 23.7 24.1 24.0 24.0 24.1 23.8 23.7 23.3 23.8Dec 23.7 23.9 24.1 23.9 24.0 23.5 23.9 23.8 23.6 23.8 23.9 23.8AVG 23.7 23.6 23.8 23.4 23.5 23.5 23.2 23.5 23.2 23.4 23.4
Table 8. Monthly rainfall (mm) observed at Jalaluddin airport, Gorontalo (Badan Meteorologi dan Geofisika Indonesia)
1996 1997 1998 1999 2000 2001 2002 2003 2004 2005 2006 AVGJan 102 188 116 134 170 385 177 89 128 30 112 148Feb 179 124 1 72 268 205 4 56 100 103 143 114Mar 168 298 12 296 110 147 126 215 79 117 68 149Apr 89 97 82 146 99 141 117 266 175 105 162 134May 55 112 306 223 72 141 108 192 138 231 65 149Jun 286 3 90 113 263 262 82 11 50 84 257 136Jul 82 58 175 122 68 27 1 64 66 210 32 82Aug 167 0 59 76 68 30 0 46 0 17 3 42Sep 49 1 53 35 39 48 0 65 36 20 55 36Oct 226 3 152 160 185 60 34 35 122 223 3 109Nov 93 129 207 138 157 252 82 82 61 85 204 135Dec 88 81 299 92 98 145 127 234 77 132 122 136AVG 132 91 129 134 133 154 72 113 86 113 102
Table 9. Rainy days observed at Jalaluddin airport, Gorontalo (Badan Meteorologi dan Geofisika Indonesia)
1996 1997 1998 1999 2000 2001 2002 2003 2004 2005 2006 AVGJan 18 26 10 18 20 19 26 12 17 11 19 18Feb 24 13 2 11 21 15 6 12 17 11 14 13Mar 17 21 3 19 18 20 12 22 16 10 14 16Apr 13 17 12 15 17 19 10 17 16 23 16 16May 12 8 18 20 13 15 14 18 18 18 18 16Jun 23 2 21 12 19 18 18 6 14 16 26 16Jul 17 15 27 15 12 12 1 12 13 13 4 13Aug 21 0 19 9 16 5 0 12 0 5 4 8Sep 9 1 11 11 14 12 0 7 6 6 5 7Oct 12 3 17 21 21 8 6 10 8 22 3 12Nov 16 16 18 14 16 21 15 13 17 15 18 16Dec 16 17 24 18 17 17 9 26 16 19 16 18AVG 17 12 15 15 17 15 10 14 13 14 13

App-B_TABLES_GORONTALO_SEAPLANTS_1.doc 6
Table 10. Average wind speed (km/hr) observed at Jalaluddin airport, Gorontalo (Badan Meteorologi dan Geofisika Indonesia)
1996 1997 1998 1999 2000 2001 2002 2003 2004 2005 2006 AVGJan 2 3 4 2 2 2 2 3 2 3 2 2Feb 3 2 6 3 2 2 4 4 2 3 3 3Mar 3 3 6 2 2 3 2 3 2 3 3 3Apr 2 2 5 2 3 2 2 1 2 2 2 2May 2 3 2 2 2 3 2 2 2 2 1 2Jun 2 4 2 2 2 2 2 3 3 2 2 2Jul 2 5 2 3 3 3 5 3 3 2 3 3Aug 2 6 2 4 3 5 5 4 4 4 6 4Sep 2 4 3 3 3 3 4 3 4 3 4 3Oct 2 3 2 2 2 2 3 2 3 2 3 2Nov 2 2 2 2 2 2 2 2 1 2 1 2Dec 3 3 2 2 2 2 3 2 2 1 1 2AVG 2 3 3 2 2 3 3 3 3 2 3
Table 11. Gusting winds speed (km/hr) observed at Jalaluddin airport, Gorontalo (Badan Meteorologi dan Geofisika Indonesia)
1996 1997 1998 1999 2000 2001 2002 2003 2004 2005 2006 AVGJan 20 20 18 18 15 15 18 16 14 12 15 16Feb 18 15 20 23 15 15 20 20 19 19 15 18Mar 18 18 25 27 40 20 18 18 18 20 17 22Apr 15 15 25 20 16 15 15 15 15 14 14 16May 15 20 15 20 16 15 15 17 12 14 12 16Jun 12 20 15 18 15 18 16 18 16 15 15 16Jul 15 20 12 20 20 16 25 18 15 15 17 18Aug 25 25 15 17 18 21 20 24 15 16 18 19Sep 15 18 18 16 17 18 22 15 18 18 15 17Oct 17 17 15 17 19 18 20 16 15 16 18 17Nov 20 18 15 15 20 15 15 15 14 14 15 16Dec 25 15 15 20 15 18 20 16 15 15 13 17AVG 18 18 17 19 19 17 19 17 16 16 15
Table 12. Direction of average wind observed at Jalaluddin airport, Gorontalo (Badan Meteorologi dan Geofisika Indonesia)
1996 1997 1998 1999 2000 2001 2002 2003 2004 2005 2006 AVGJan 360 360 360 360 360 360 360 360 350 352 360 358Feb 360 360 360 360 360 360 360 360 360 360 350 359Mar 360 360 360 360 360 360 360 360 350 360 360 359Apr 360 360 360 360 360 360 360 360 350 360 360 359May 180 180 360 360 360 180 180 180 180 180 360 245Jun 180 180 180 180 180 180 150 180 140 180 120 168Jul 180 150 180 180 180 180 150 170 160 180 150 169Aug 160 180 180 180 180 150 180 160 170 180 130 168Sep 180 180 180 180 180 180 180 180 180 180 180 180Oct 180 180 180 90 360 180 180 180 180 180 18 173Nov 360 360 360 360 360 360 360 360 360 360 350 359Dec 360 360 360 360 360 360 360 360 360 360 350 359
Table 13. Direction of maximum wind observed at Jalaluddin airport, Gorontalo (Badan Meteorologi dan Geofisika Indonesia)
1996 1997 1998 1999 2000 2001 2002 2003 2004 2005 2006 AVGJan 360 360 360 360 360 330 360 360 360 351 330 354Feb 360 360 360 270 360 360 360 360 360 360 360 352Mar 360 360 360 360 270 360 360 360 360 340 350 349Apr 20 360 360 350 270 180 360 360 360 330 360 301May 270 180 360 130 330 130 180 180 180 170 180 208Jun 170 150 120 180 180 150 130 180 130 160 140 154Jul 180 150 180 130 270 120 180 120 160 180 150 165Aug 240 90 120 160 300 170 150 150 170 180 130 169Sep 180 180 150 160 180 130 180 180 180 180 150 168Oct 360 180 180 140 270 90 180 200 360 190 140 208Nov 360 180 270 180 360 220 360 280 360 150 170 263Dec 360 360 360 270 360 360 360 190 270 360 360 328

App-C_GRAPHS_GORONTALO_SEAPLANTS_1.doc 1
APPENDIX C. GRAPHS Graph 1. Gorontalo combined average monthly rainfall (mm) 1996-2006
Graph 2. Gorontalo average monthly rainfall (mm) for all years from 1996-2006
020406080
100120140160
02468
101214161820
Jan Feb Mar Apr May Jun Jul Aug Sep Oct Nov DecQ 2Q 1 Q 3 Q 4
Rainy days per month
Average mm rain per month
020406080
100120140160
02468
101214161820
Jan Feb Mar Apr May Jun Jul Aug Sep Oct Nov DecQ 2Q 1 Q 3 Q 4
Rainy days per month
Average mm rain per month
050
100150200250300350400450
0
5
10
15
20
25
30
Jan Feb Mar Apr May Jun Jul Aug Sep Oct Nov Dec
Rainy days per month
Average mm rain per month
050
100150200250300350400450
0
5
10
15
20
25
30
Jan Feb Mar Apr May Jun Jul Aug Sep Oct Nov Dec
050
100150200250300350400450
050
100150200250300350400450
0
5
10
15
20
25
30
Jan Feb Mar Apr May Jun Jul Aug Sep Oct Nov Dec0
5
10
15
20
25
30
Jan Feb Mar Apr May Jun Jul Aug Sep Oct Nov Dec
Rainy days per month
Average mm rain per month

App-C_GRAPHS_GORONTALO_SEAPLANTS_1.doc 2
Graph 3. Gorontalo average monthly rainfall by year (mm) 1996-2006
100
200
300
100
200
100
200
300
100
200
100
200
100
200
300
100
200
300
400
100200300
100
200300
Jan Feb Mar Apr May Jun Jul Aug Sep Oct Nov Dec
1996
1997
100
200300
1999
100
200
3001998
2000
2001
2002
2003
2004
2005
2006
Q 2Q 1 Q 3 Q 4
100
200
300
100
200
100
200
300
100
200
100
200
100
200
300
100
200
300
400
100200300
100
200300
Jan Feb Mar Apr May Jun Jul Aug Sep Oct Nov Dec
1996
1997
100
200300
1999
100
200
3001998
2000
2001
2002
2003
2004
2005
2006
Q 2Q 1 Q 3 Q 4

App-C_GRAPHS_GORONTALO_SEAPLANTS_1.doc 3
Graph 4. Gorontalo average wind direction (degrees) 1996-2006
100
200
300
400Jan
Feb
Mar
Apr
May
JunJul
Aug
Sep
Oct
Nov
Dec
100
200
300
400Jan
Feb
Mar
Apr
May
JunJul
Aug
Sep
Oct
Nov
Dec
0
100
200
300
400Jan
Feb
Mar
Apr
May
JunJul
Aug
Sep
Oct
Nov
DecCOMBINED AVERAGE
WINDDIRECTIONS(DEGREES)
ALLAVERAGE
WINDDIRECTIONS(DEGREES)
ALLGUSTING
WINDDIRECTIONS(DEGREES)
100
200
300
400Jan
Feb
Mar
Apr
May
JunJul
Aug
Sep
Oct
Nov
Dec
100
200
300
400Jan
Feb
Mar
Apr
May
JunJul
Aug
Sep
Oct
Nov
Dec
100
200
300
400Jan
Feb
Mar
Apr
May
JunJul
Aug
Sep
Oct
Nov
Dec
100
200
300
400Jan
Feb
Mar
Apr
May
JunJul
Aug
Sep
Oct
Nov
Dec
100
200
300
400Jan
Feb
Mar
Apr
May
JunJul
Aug
Sep
Oct
Nov
Dec
100
200
300
400Jan
Feb
Mar
Apr
May
JunJul
Aug
Sep
Oct
Nov
Dec
100
200
300
400Jan
Feb
Mar
Apr
May
JunJul
Aug
Sep
Oct
Nov
Dec
100
200
300
400Jan
Feb
Mar
Apr
May
JunJul
Aug
Sep
Oct
Nov
Dec
0
100
200
300
400Jan
Feb
Mar
Apr
May
JunJul
Aug
Sep
Oct
Nov
Dec
0
100
200
300
400Jan
Feb
Mar
Apr
May
JunJul
Aug
Sep
Oct
Nov
DecCOMBINED AVERAGE
WINDDIRECTIONS(DEGREES)
ALLAVERAGE
WINDDIRECTIONS(DEGREES)
ALLGUSTING
WINDDIRECTIONS(DEGREES)
App-D_PLATES_GORONTALO_SEAPLANTS_1.doc 1
APPENDIX D. PLATES Plate 1. Pantura Regency (a.k.a. Gorontalo Utara) (1) Office for extensive port upgrading; (2) Boat used in survey; also the boat said to have been used to bring the first cultivars from Pulau Nain about 7 years ago; (3 – 4 & 6) Spinosum growing near Kwandang; (5) Shoreline of Desa Ponelo showing empty drying platforms (para-para); (7) cottonii farm stripped of plants and awaiting replanting by about December.

App-D_PLATES_GORONTALO_SEAPLANTS_1.doc 2
Plate 2. Bonebolango Regency at Desa Batotanuo showing beach views toward the west (1) and the east (4); (2, 3 & 5) cottonii farm said to be sponsored by DKP stripped of plants and awaiting replanting by about December.

App-D_PLATES_GORONTALO_SEAPLANTS_1.doc 3
Plate 3. Boalemo Regency at Desa Dulupi which serves as a hub during seaplant farming season. (1) map at the town centre; (2) plastic service boats said to have been donated by DKP but apparently not in use; (3 - 6) cottonii farm areas stripped of plants and awaiting replanting by about December.
App-D_PLATES_GORONTALO_SEAPLANTS_1.doc 4
Plate 4. Pohuwato Regency at Desa Lemito which serves as a hub for seaplant farming. (1) main street in Lemito village; (2) some decent looking cottonii freshly harvested; (3 - 6) cottonii farms said to yield crops all year long.
APPENDIX E. MAY 2007 REPORT BY JEFF GUCKER TO DAVID ANDERSON
Hi David,
Here is a brief report on the results of my findings in regards to seaweed in Gorontalo. Before I go on to list discrepancies between the calculations given to us by the fisheries department and my findings, I must say that a revolving loan fund is definitely a viable intervention and growing seaweed, although problematic, is commercially viable for small operators.
The major problems that growers face are as follows.
If seaweed farmers try to grow seaweed year round they will more than likely have at least one complete crop failure during the year, loosing almost all of their seaweed stock. If growers only plant in the best growing seasons, they must purchase seaweed seed at least twice a year. This can be very expensive because the best times of the year for planting usually falls immediately after a time of year not conducive to production of seaweed so seed stock is expensive.
The two seasons generally not conducive to seaweed production are the peak of the rainy season when saline levels drop and water quality is compromised due to run off in the estuaries, and the end of an extended dry season when water temperature and salinity get to high.
Fresh seaweed seed must be transported in water and handled with care. Speed of movement is also important. Like produce, seaweed is a living organism, therefore fast boat or air freight is the preferred modes of transport. This impacts the cost of seed making it expensive but not necessarily cost prohibitive to purchase from other areas of Indonesia when stocks are low in Gorontalo.
Poor farmers do not have the capital required to buy seed for every planting therefore must attempt to grow seaweed year round in order to maintain stock. This makes their operations prone to complete crop failure in poor growing seasons. The availability of investment funds for the purchase of seed stock will go a long way to alleviate the need to carry stock through risky seasons.
Growers with capital make a practice of buying seed at least twice a year only saving seed one time after tying. This seems to be a practice that in the end is more profitable for growers.
If small growers can get a reliable source of seed at a fair price it seems that they could reduce the 30% losses in a year to 10% just by holding off production at risky times of the year.
Economic Assumptions
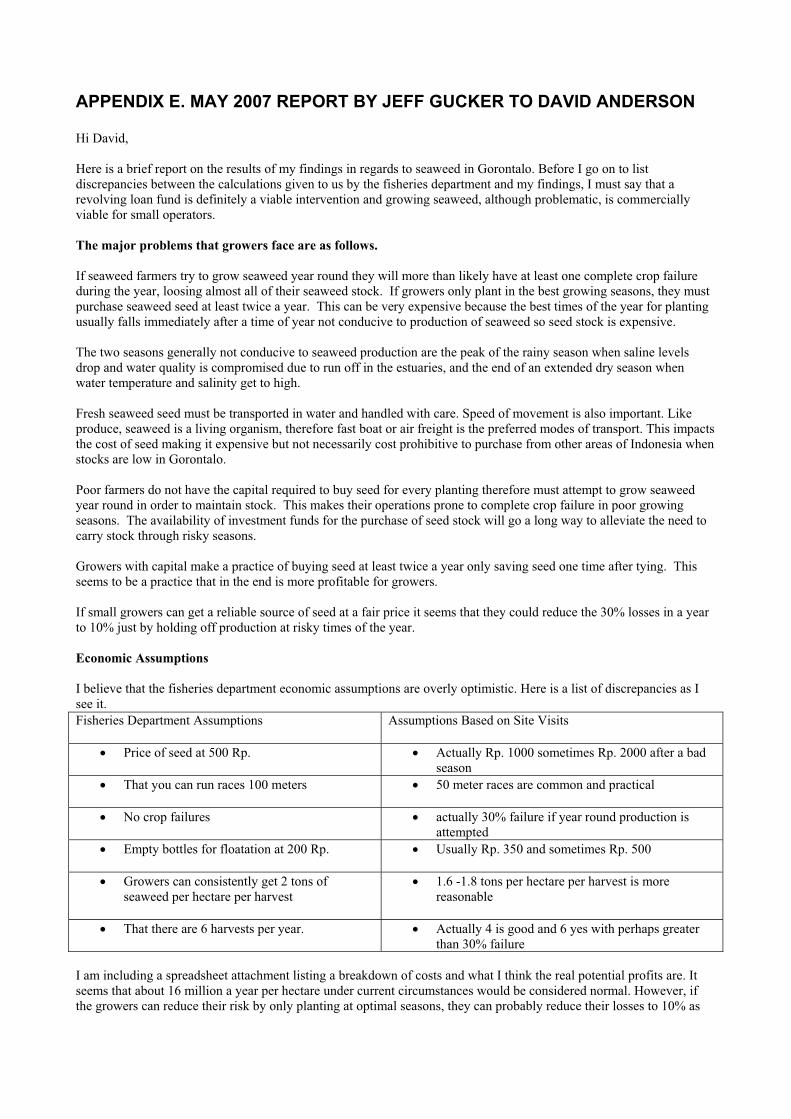
I believe that the fisheries department economic assumptions are overly optimistic. Here is a list of discrepancies as I see it.
I am including a spreadsheet attachment listing a breakdown of costs and what I think the real potential profits are. It seems that about 16 million a year per hectare under current circumstances would be considered normal. However, if the growers can reduce their risk by only planting at optimal seasons, they can probably reduce their losses to 10% as
Fisheries Department Assumptions Assumptions Based on Site Visits
! Price of seed at 500 Rp. ! Actually Rp. 1000 sometimes Rp. 2000 after a bad season
! That you can run races 100 meters ! 50 meter races are common and practical
! No crop failures ! actually 30% failure if year round production is attempted
! Empty bottles for floatation at 200 Rp. ! Usually Rp. 350 and sometimes Rp. 500
! Growers can consistently get 2 tons of seaweed per hectare per harvest
! 1.6 -1.8 tons per hectare per harvest is more reasonable
! That there are 6 harvests per year. ! Actually 4 is good and 6 yes with perhaps greater than 30% failure

opposed to 30%. This would increase net profits to about 24.5 million Rp. per hectare per year. This is a nice living for a family of three working men.
I am attaching the spreadsheet that tells the story in numbers. I would like to truth test this with the PENSA seaweed expert. If you don’t mind, please send me his number.
Institutional Arrangements
PT Gorontalo Fitrah Mandiri is the company that you and Rafael met with. It is a semi state owned company called Badan Usaha Milik Daerah Propinsi Gorontalo. That is a commercial body owned by the provincial government of Gorontalo.
I think that they are very capable of running a revolving loan fund that is both accountable and transparent. I will include as part of the budget some technical assistance with a bookkeeping system. There should probably be a memorandum of agreement in how the loan funds are handled that emphasizes the need for transparency.
PT Gorontalo Fitrah Mandiri has every incentive to successfully implement the revolving loan fund program because they are getting the concession for operating a factory from the Government for the production of semi refined carrageenan. They are going to need continuity of supply and quality assurance which can only be guaranteed by a good production system. Good production requires a seaweed grower credit scheme.
I would include funds in a program budget for a study tour. This is in addition to grant funds. This will allow some of the loan program staff and technical staff from fisheries that are assigned to support the loan fund to visit operations in the Philippines just to the north in order to; 1). Assess improved cultivation practices, 2). Identify improved strains of Cottoni seaweed that withstand higher temperatures and salinity, 3). Create alliances that may help trade in seaweed seed stock when it is economical to do so.
I am writing up the proposal for the loan program now and will include all the main points in my notes in the background section.
Attached is the P&L projection in excel.
All the best, Jeff