Assessment of the Rougheye and Blackspotted Rockfish stock ...
106
13. Assessment of the Rougheye and Blackspotted Rockfish stock complex in the Gulf of Alaska Jane Y. Sullivan, S. Kalei Shotwell, Dana H. Hanselman, Peter-John F. Hulson, Benjamin C. Williams, Ellen M. Yasumiishi, and Bridget E. Ferriss November 2021 Executive Summary The scheduled frequency for some stock assessments was recently changed in response to the National Stock Assessment Prioritization effort (Methot 2015; Hollowed et al. 2016). In previous years, all Gulf of Alaska (GOA) rockfish stocks were assessed on a biennial stock assessment schedule to coincide with the availability of new survey data. There was no change in this schedule for the rougheye and blackspotted (RE/BS) rockfish complex. For this on-cycle year, we present a full stock assessment document with updated assessment and projection model results to recommend harvest levels for the next two years. In off-cycle years, we present a partial assessment consisting of an executive summary with recent fishery catch and survey trends as well as recommend harvest levels for the next two years. We use a statistical age-structured model as the primary assessment tool for the GOA RE/BS rockfish complex which qualifies as a Tier 3 stock. This assessment consists of a population model, which uses survey and fishery data to generate a historical time series of population estimates, and a projection model, which uses results from the population model to predict future population estimates and recommended harvest levels. The data sets used in this assessment include total catch biomass, fishery age and size compositions, trawl and longline survey abundance estimates, trawl survey age compositions, and longline survey size compositions. For this assessment year, we use the last full assessment base model from 2019. Summary of Changes in Assessment Inputs Changes in the input data: New and updated data added to this model include the following: 1.) Updated catch estimate for 2020, new catch estimates used in projections for 2021-2023 (see Specified Catch Estimation subsection in Harvest Recommendations section) 2.) New fishery lengths for 2019 3.) New fishery ages for 2018 and 2020 4.) New bottom trawl survey biomass estimate for 2021. The 2019 trawl survey ages are still being processed and will be included in the next full assessment in 2023. 5.) New longline survey relative population numbers (RPN) for 2020 and 2021, and new longline survey RPN-weighted length frequencies for 2020 and 2021. Updated geographic area sizes and variance calculations were implemented in the longline database in 2021 which resulted in small changes to the longline survey data. The updated RPNs and RPN-weighted length frequencies are used in this assessment. A description of these data is provided in the AFSC Longline Abundance Index and AFSC Longline Size Compositions subsections of the Survey section. Changes in the assessment methodology: There were no changes in the assessment methodology. We continue to use the 2015 assessment model (15.4) that we also used in the 2019 full assessment. Please see Shotwell et al. (2015) for more details on the 2015, 2017, and 2019 assessment methodology (https://apps-afsc.fisheries.noaa.gov/refm/docs/2015/GOArougheye.pdf) and Shotwell et al. (2019) for
Transcript of Assessment of the Rougheye and Blackspotted Rockfish stock ...

13. Assessment of the Rougheye and Blackspotted Rockfish stock
complex in the Gulf of Alaska
Jane Y. Sullivan, S. Kalei Shotwell, Dana H. Hanselman, Peter-John F. Hulson,
Benjamin C. Williams, Ellen M. Yasumiishi, and Bridget E. Ferriss
November 2021
Executive Summary
The scheduled frequency for some stock assessments was recently changed in response to the National
Stock Assessment Prioritization effort (Methot 2015; Hollowed et al. 2016). In previous years, all Gulf of
Alaska (GOA) rockfish stocks were assessed on a biennial stock assessment schedule to coincide with the
availability of new survey data. There was no change in this schedule for the rougheye and blackspotted
(RE/BS) rockfish complex. For this on-cycle year, we present a full stock assessment document with
updated assessment and projection model results to recommend harvest levels for the next two years. In
off-cycle years, we present a partial assessment consisting of an executive summary with recent fishery
catch and survey trends as well as recommend harvest levels for the next two years.
We use a statistical age-structured model as the primary assessment tool for the GOA RE/BS rockfish
complex which qualifies as a Tier 3 stock. This assessment consists of a population model, which uses
survey and fishery data to generate a historical time series of population estimates, and a projection
model, which uses results from the population model to predict future population estimates and
recommended harvest levels. The data sets used in this assessment include total catch biomass, fishery
age and size compositions, trawl and longline survey abundance estimates, trawl survey age
compositions, and longline survey size compositions. For this assessment year, we use the last full
assessment base model from 2019.
Summary of Changes in Assessment Inputs
Changes in the input data: New and updated data added to this model include the following:
1.) Updated catch estimate for 2020, new catch estimates used in projections for 2021-2023 (see
Specified Catch Estimation subsection in Harvest Recommendations section)
2.) New fishery lengths for 2019
3.) New fishery ages for 2018 and 2020
4.) New bottom trawl survey biomass estimate for 2021. The 2019 trawl survey ages are still being
processed and will be included in the next full assessment in 2023.
5.) New longline survey relative population numbers (RPN) for 2020 and 2021, and new longline
survey RPN-weighted length frequencies for 2020 and 2021.
Updated geographic area sizes and variance calculations were implemented in the longline database in
2021 which resulted in small changes to the longline survey data. The updated RPNs and RPN-weighted
length frequencies are used in this assessment. A description of these data is provided in the AFSC Longline Abundance Index and AFSC Longline Size Compositions subsections of the Survey section.
Changes in the assessment methodology: There were no changes in the assessment methodology. We
continue to use the 2015 assessment model (15.4) that we also used in the 2019 full assessment. Please
see Shotwell et al. (2015) for more details on the 2015, 2017, and 2019 assessment methodology
(https://apps-afsc.fisheries.noaa.gov/refm/docs/2015/GOArougheye.pdf) and Shotwell et al. (2019) for

more details on the last full assessment (https://apps-
afsc.fisheries.noaa.gov/refm/docs/2019/GOArougheye.pdf).
Summary of Results
We recommend the maximum allowable ABC of 788 t from the updated projection model for the 2022
RE/BS fishery. This ABC is 35% lower than the 2022 projected ABC of 1,221 t from the 2020 partial
assessment. Reference values for the RE/BS rockfish stock complex are summarized in the following
table, with the recommended ABC and OFL values in bold.
As estimated or As estimated or
specified last year
for:
recommended this
year for:
Quantity/Status 2021 2022 2022 2023
M (natural mortality) 0.036 0.036 0.034 0.034
Tier 3a 3a 3a 3a
Projected total (age 3+) biomass (t) 40,432 40,454 26,060 25,997
Projected female spawning biomass (t) 12,540 12,563 8,648 8,627
B100% 20,658 20,658 14,776 14,776
B40% 8,263 8,263 5,911 5,911
B35% 7,230 7,230 5,172 5,172
FOFL 0.048 0.048 0.046 0.046
maxFABC 0.040 0.040 0.038 0.038
FABC 0.040 0.040 0.038 0.038
OFL (t) 1,456 1,467 947 937
max ABC (t) 1,212 1,221 788 781
ABC (t) 1,212 1,221 788 781
Status
As determined last
year for: As determined this
year for:
2019 2020 2020 2021
Overfishing No n/a No n/a
Overfished n/a No n/a No
Approaching overfished n/a No n/a No
*Projections are based on an estimated catch of 384 t for 2021, and estimates of 356 t and 345 t used in place of maximum permissible ABC for 2022 and 2023 in response to a Plan Team request to obtain more accurate two-year projections. Please see section on Specified Catch Estimation
subsection in the Harvest Recommendations section for more details regarding these calculations.
Relative to past assessments, the 2021 assessment model exhibited a strong positive retrospective pattern
(Mohn’s rho=0.611), indicating that estimates of spawning biomass in the terminal year decrease when a
subsequent year of data is added to the model. The 2021 trawl survey biomass estimate decreased 56%
from the 2019 estimate and is the lowest in the time series. The 2021 longline survey abundance estimate
decreased 36% since 2019, and 2020 was the lowest in the time series. These declines had significant
impacts on the parameters that govern the scale of the population. In particular, estimates of trawl survey
catchability increased from 1.7 to 2.2, longline survey catchability increased from 1.2 to nearly 1.7, and
mean recruitment decreased from approximately 1.6 to 1.2 million fish. These changes resulted in a
significant down grade in biomass trajectories, recruitment, and estimates of unfished spawning biomass.

The stock is not being subject to overfishing, is not currently overfished, nor is it approaching a condition
of being overfished. The test for determining whether overfishing is occurring is based on the 2020 catch
compared to OFL. The official total catch for 2020 is 383 t which is less than the 2020 OFL of 1,452 t;
therefore, the stock is not being subjected to overfishing. The tests for evaluating whether a stock is
overfished or approaching a condition of being overfished require examining model projections of female
spawning biomass relative to B35% for 2022 and 2023. The estimates of spawning biomass for 2022 and
2023 from the current year projection model are 8,648 t and 8,627 t, respectively. Both estimates are
above the B35% estimate of 5,172 t and, therefore, the stock is not currently overfished nor approaching an
overfished condition.
Area Allocation of Harvests
We use a two survey version of the random effects model, which equally weights the longline and trawl
survey relative abundance indices (see Area Allocation of Harvests subsection in the Harvest
Recommendations section below for more details). The following table shows the apportionment for the
2022 and 2023 fishery using the two survey random effects method.
Area Allocation Western GOA Central GOA Eastern GOA Total
23.3% 29.9% 46.8% 100.0%
2022 Area ABC (t) 184 235 369 788
OFL (t) 947
2023 Area ABC (t) 182 234 365 781
OFL (t) 937
Summaries for Plan Team
Species Year Biomass1 OFL ABC TAC Catch2
RE/BS complex
2020 40,336 1,452 1,209 1,209 383
2021 40,432 1,456 1,212 1,212 370
2022 26,062 947 788
2023 25,957 937 781
Stock/ 2021 2022 2023
Assemblage Area OFL ABC TAC Catch2 OFL ABC OFL ABC
RE/BS
complex
W 168 168 21 184 182
C 456 456 171 235 234
E 588 588 178 369 365
Total 1,456 1,212 1,212 370 947 788 937 781 1Total biomass (ages 3+) from the age-structured model
2Current as of October 25, 2021. Source: NMFS Alaska Regional Office Catch Accounting System via the AKFIN database
(http://www.akfin.org).
Responses to SSC and Plan Team Comments on Assessments in General
SSC and Plan Team comments related VAST, ESPs, spatial management, and other general topics not applicable to this assessment were omitted for brevity.
Risk Tables:

“The SSC requests that all authors fill out the risk table in 2019…” (SSC December 2018)
“…risk tables only need to be produced for groundfish assessments that are in ‘full’ year in the
cycle.” (SSC, June 2019)
“The Teams recommended that authors continue to fill out the risk tables for full assessments. The Teams
recommended that adjustment of ABC in response to levels of concern should be left to the discretion of
the author, the Team(s), and/or the SSC, but should not be mandated by the inclusion of a >1 level in any particular category. The Teams request clarification and guidance from the SSC regarding the previously
noted issues associated with completing the risk table, along with any issues noted by the assessment authors. The Teams plan to discuss the risk table process at the September meeting.” (Plan Team Nov
2019).
“The SSC continues to support that reductions from the maximum permissible ABC should be infrequent and only for exceptional circumstances (Appendix A, Preliminary Guidance and SSC recommendations,
bullet 9).” (SSC, June 2021)
“The SSC also recommends that stock assessment authors and the Plan Teams review all
recommendations and provide feedback.” (SSC, June 2021)
SSC Risk Table Guidelines (formalized SSC, October 2021, distributed via email by Anne Hallowed
October 25, 2021)
1. The SSC concluded that the risk table framework is working well. The tables have expanded
communication among assessment authors and between assessment authors and
ecosystem/process researchers. The framework is intended to provide a clear and transparent basis for communicating assessment-related and stock condition concerns that are not directly
captured in model-based uncertainty, the tier system, or harvest control rules. 2. The SSC recommended no changes to the language in the Risk Table template.
3. The SSC recognizes that within the context of the risk tables, “risk” is the risk of the ABC exceeding the true (but unknown) OFL. The risk tables are intended to inform the process of
adjusting the ABC from the maximum permissible when needed. Recommendations of an ABC
reduction from the maximum permissible requires justification. The risk tables provide an avenue
for articulating that justification.
4. The SSC recommends that consideration for reductions from maxABC be based on current year information unless relevant risk factors for a stock continue to be present from previous years.
5. The SSC recommends that for stocks managed in Tiers 1-3, that risk tables are produced for all
full assessments of groundfish (and perhaps crab) stocks and stock complexes in the fishery. Risk tables can be produced in other years at the discretion of the lead author if there have been
notable changes to previous conditions. 6. The SSC recommends that Risk Tables should not be mandatory for other Tiers; however, stock
assessments must include compelling rationale for why a Risk Table would not be informative.
7. For stock complexes, the SSC recommends that the decision concerning which species (or multiple species) to focus on be up to the author.
8. The SSC recommended maintaining the status quo, where authors are encouraged (but not required) to provide a recommendation on a reduction from maxABC, if warranted, and the Plan
Teams and SSC would then evaluate and modify the reductions (if needed) based on the
information available for the stock. 9. Risk scores should be specific to a given stock or stock complex. While comparison across species
(e.g., within a tier, with similar life histories) or stocks is useful for consistency, the SSC does not support trying to prescribe a common reduction from the maximum permissible ABC for a given
risk score across species or stocks because the processes underlying the score may differ among
species and stocks. The SSC recommends that considerations of reductions in ABCs below the maximum permissible continue to be made on a case-by-case basis with justification based on
risk scoring. The risk table rankings include qualitative information that requires a certain amount of subjective but well-informed interpretation of the available data by the author(s), the
Plan Teams and the SSC, and as such, the SSC feels that blanket comparisons across species or stocks for the purpose of explicitly defining reductions in ABC below the maximum permissible
are not prudent.
10. The SSC encourages the inclusion of LK/TK/S as a source of knowledge about the condition of
the stock, a shift in the spatial or temporal distribution of the resource, or changes in the size or
condition of species in the fishery. 11. The SSC recommends that the fishery/community performance column should focus on
information that would inform the biological status of the resource (e.g., an unexplained drop in CPUE that could indicate un-modelled stock decline, or a spatial shift indicating changes in
species’ range), and not the effects of proposed ABCs on the fishery or communities or bycatch-
related considerations. The SSC recognizes that the community impact information is critical for Council decision making and supports efforts to effectively communicate where this information
can be accessed. 12. The SSC appreciates the discussion of avoiding double-counting information, in the
assessment/Tier system and risk table, or among columns of the risk table. The SSC agrees that
authors should avoid inclusion of stock trends/processes that are incorporated in the assessment
or reflected in the Tier when scoring the risk tables. For cases where a process external to the
assessment is relevant to two or more risk categories, the SSC recommends that the narrative reflect the interconnected relationships that exist between rankings among risk categories.
13. The SSC suggests a revision to the category levels: from the existing four to three categories
(normal, increased, extreme). The SSC recommends postponing this change until 2022 as many authors have already begun working on risk tables for 2021.
14. The SSC reiterates that reductions in ABC below the maximum permissible should be applied sparingly and that the tier system should be regarded as the primary basis for establishing the
ABC. If they begin to become commonplace, that should warrant further review of the assessment
and/or the Tier system.
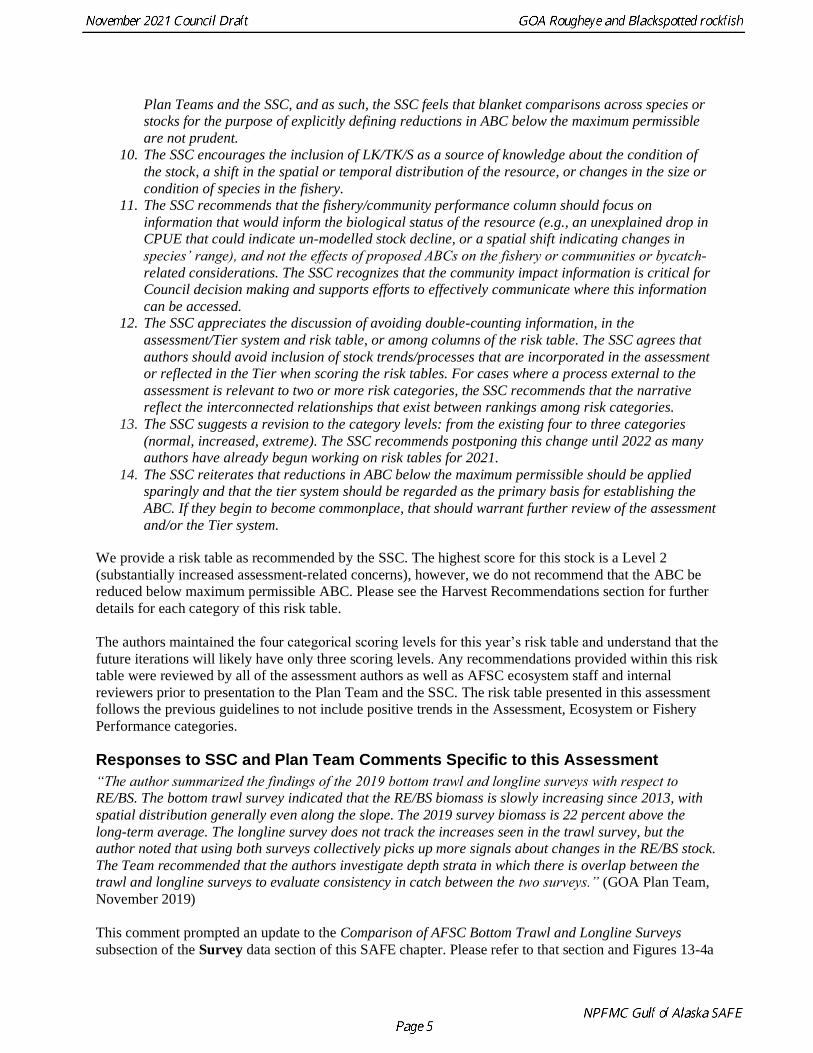
We provide a risk table as recommended by the SSC. The highest score for this stock is a Level 2
(substantially increased assessment-related concerns), however, we do not recommend that the ABC be
reduced below maximum permissible ABC. Please see the Harvest Recommendations section for further
details for each category of this risk table.
The authors maintained the four categorical scoring levels for this year’s risk table and understand that the
future iterations will likely have only three scoring levels. Any recommendations provided within this risk
table were reviewed by all of the assessment authors as well as AFSC ecosystem staff and internal
reviewers prior to presentation to the Plan Team and the SSC. The risk table presented in this assessment
follows the previous guidelines to not include positive trends in the Assessment, Ecosystem or Fishery
Performance categories.
Responses to SSC and Plan Team Comments Specific to this Assessment
“The author summarized the findings of the 2019 bottom trawl and longline surveys with respect to RE/BS. The bottom trawl survey indicated that the RE/BS biomass is slowly increasing since 2013, with
spatial distribution generally even along the slope. The 2019 survey biomass is 22 percent above the
long-term average. The longline survey does not track the increases seen in the trawl survey, but the author noted that using both surveys collectively picks up more signals about changes in the RE/BS stock.
The Team recommended that the authors investigate depth strata in which there is overlap between the trawl and longline surveys to evaluate consistency in catch between the two surveys.” (GOA Plan Team,
November 2019)
This comment prompted an update to the Comparison of AFSC Bottom Trawl and Longline Surveys
subsection of the Survey data section of this SAFE chapter. Please refer to that section and Figures 13-4a

and 13-4b for an analysis comparing the trawl and longline survey indices by geographic area and depth
stratum.
“The same model that was used in 2015 and 2017 was used for the 2019 assessment, with similar
parameters to 2017. Results included slightly higher survey catchability and slightly lower mean
recruitments, and the longline survey selectivity is now slightly dome-shaped in the 2019 assessment. The model fit was similar to that seen in 2017. The Team recommended that the author investigate how
selectivity is modeled. In particular, there were some abrupt changes between ages in the average fishery selectivity.” (Plan Team, November 2019)
We agree with the Plan Team and plan to explore these modeling concerns in the next off-year
assessment with results presented in the following full assessment. In light of the continued changes in
recruitment and survey catchability estimates in the 2021 assessment, we appreciate further comments
and recommendations from the Teams and SSC on this topic.
Multispecies stock assessment and species identification
“The issues of how to meaningfully assess and manage a two species complex remains. The authors noted
the SSC recommendation for an analysis that provides a more realistic range of management risk of combining RE/BS as one stock. Methods to enhance the assessment could include catch composition
analysis, genetic species identification, and maturity curve differences. The author noted that it could be
possible to use otolith morphometrics to address this in the future, but that methodology is not yet robust enough to use in the RE/BS model. The assessment includes an appendix that summarizes current efforts
related to RE/BS stock i.d., growth, and maturity analyses. The Team recommended that the authors incorporate additional information about species identification obtained through otolith morphology in
future assessments.” (GOA Plan Team, November 2019)
“An important ongoing issue with this assessment is that it is a complex of two distinct species. The SSC
appreciates the appendix that describes the current state of genetic research on mis-identification rates,
otolith morphology, growth and maturity for this complex. It is clear that a number of positive steps are
being made to understand how the species within this complex are both similar and different. As the author notes, many of these projects are ongoing. Of note is an updated maturity study on both species
(Conrath 2017) that clearly demonstrates a difference in age at 50% maturity (19.6 years and 27.4 years
for rougheye and blackspotted, respectively) between these species. The SSC continues to encourage effort to incorporate this information into the assessment as much as possible, to improve species-specific
information in this assessment and move towards splitting this complex. Alternative model configurations that incorporate these data would be highly encouraged as a step in this direction.” (SSC, December
2019)
“…the SSC registers some concern regarding age structure collections moving forward, particularly if
otolith morphology is a valid method for differentiating these species. Special collections may be appropriate if otolith metrics become an operational tool for species differentiation.” (SSC, December
2019)
We appreciate the SSC and Plan Team’s comments related to the challenges of doing a data limited,
multispecies stock assessment for long-lived and cryptic rockfish species. A recent study used otolith
shape analysis (i.e. morphometrics), weight, and age to accurately identify RE/BS rockfish 86% and 97%
of the time, respectively (Harris et al. 2019). In comparison, field-based identification rates range from
62-66% for rougheye rockfish and 92-94% for blackspotted rockfish. These findings, which were based
on 1,847 specimens collected during research surveys and confirmed using genetics, demonstrated that
otolith morphometrics can be used to improve species identification rates, especially for rougheye

rockfish. Although time consuming and potentially costly to implement, this method could be used to
reliably identify archived otoliths from the past 20-30 years.
The GOA RE/BS assessment is currently transitioning authors, and therefore we did not make substantial
model progress during the 2021 assessment cycle. In the future we will continue to provide updates on
relevant research projects related to RE/BS biology and species identification and make revisions to the
population model as needed to align with the best available science for this complex.
Apportionment:
“The Team accepted the new RE apportionment methodology, and recommended that this also be used in
the future.” (Plan Team, November 2019) “The methodology for area apportionment was re-evaluated in this assessment. Previously, a weighted
average of the area-specific biomass proportion from the last three trawl surveys was utilized. The authors responded directly to previous GPT and SSC comments by developing a random effects model
with equal weighting between the bottom trawl survey and the AFSC longline survey. The use of two
survey random effects method uses more information for apportioning than the previous method. A
comparison of both methods indicates a shift of ABC allocation to the eastern and western GOA from the
central GOA. The SSC supports the authors’ and GPT’s recommendation to use the two-survey random effects model for area allocation.” (SSC, December 2019)
We used the recommended two survey random effects model for apportionment in 2021.

Introduction
Life History and Distribution
Rougheye (Sebastes aleutianus) and blackspotted (S. melanostictus) rockfish inhabit the outer continental
shelf and upper continental slope of the northeastern Pacific. Their distribution extends around the arc of
the North Pacific from Japan to Point Conception, California and includes the Bering Sea (Kramer and
O’Connell 1988). The two species occur in sympatric distribution, with rougheye extending farther south
along the Pacific Rim and blackspotted extending into the western Aleutian Islands (Orr and Hawkins
2008). The overlap of the two species is quite extensive, ranging primarily from southeast Alaska through
the Alaska Peninsula (Gharrett et al. 2005, Orr and Hawkins 2008). The center of abundance for both
species appears to be Alaskan waters, particularly the eastern Gulf of Alaska (GOA). Adults in the GOA
inhabit a narrow band along the upper continental slope at depths of 300-500 m; outside of this depth
interval, abundance decreases considerably (Ito, 1999). These species often co-occur with shortraker
rockfish (S. borealis).
Though relatively little is known about their biology and life history, rougheye and blackspotted (RE/BS)
rockfish appear to be K-selected with late maturation, slow growth, extreme longevity, and low natural
mortality. As with other Sebastes species, RE/BS rockfish are ovoviviparous, where fertilization and
incubation of eggs is internal and embryos receive at least some maternal nourishment. There have been
no studies on fecundity of RE/BS in Alaska. One study on their reproductive biology indicated that
rougheye had protracted reproductive periods, and that parturition (larval release) may take place in
December through April (McDermott 1994). There is no information as to when males inseminate
females or if migrations for spawning/breeding occur. The larval stage is pelagic, but larval studies are
hindered because the larvae at present can only be positively identified by genetic analysis, which is
labor-intensive. The post-larvae and early young-of-the-year stages also appear to be pelagic (Matarese et
al. 1989, Gharrett et al. 2002). Genetic techniques have been used recently to identify post-larval RE/BS
rockfish from opportunistically collected samples in epipelagic waters far offshore in the Gulf of Alaska,
which is the only documentation of habitat preference for this life stage.
There is no information on when juvenile RE/BS rockfish become demersal. Juvenile RE/BS rockfish
(15- to 30-cm fork length) are frequently taken in Gulf of Alaska bottom trawl surveys, implying the use
of low relief, trawlable bottom substrates. They are generally found at shallower, more inshore areas than
adults and have been observed in a variety of locations, ranging from inshore fjords to offshore waters of
the continental shelf. Studies using manned submersibles have found that large numbers of small, juvenile
rockfish are frequently associated with rocky habitat on both the shallow and deep shelf of the GOA
(Carlson and Straty 1981, Straty 1987, Krieger 1993). Another submersible study on the GOA shelf
observed juvenile red rockfish closely associated with sponges that were growing on boulders (Freese and
Wing 2004). Although these studies did not specifically identify rougheye or blackspotted rockfish, it is
reasonable to suspect that juvenile RE/BS rockfish may be among the species that utilize this habitat as
refuge during their juvenile stage.
Adult RE/BS rockfish are demersal and are known to inhabit particularly steep, rocky areas of the
continental slope, with highest catch rates generally at depths of 300 to 400 m in longline surveys (Zenger
and Sigler 1992) and at depths of 300 to 500 m in bottom trawl surveys and in the commercial trawl
fishery (Ito 1999). Observations from a manned submersible in this habitat indicate that these species
prefer steep slopes and are often associated with boulders and sometimes with Primnoa spp. coral
(Krieger and Ito 1999, Krieger and Wing 2002). Within this habitat, rougheye rockfish tend to have a
relatively even distribution when compared with the highly aggregated and patchy distribution of other rockfish such as Pacific ocean perch (Sebastes alutus) (Clausen and Fujioka, 2007). A study developing
habitat-based indices of abundance for several species of rockfish found that a variety of environmental

factors such as local slope, bottom depth, and coral/sponge abundance were significant in the best-fitting
RE/BS rockfish habitat model (Rooper and Martin, 2012). A recent Essential Fish Habitat (EFH) analysis
(e.g. Laman et al. 2017) provided species distribution models from the bottom trawl survey for RE/BS
late juveniles and adults, separated by species. However, the at-sea identification was used to develop
these models (which can have high misidentification rates, please see the Evidence for Stock Structure
section below) and our recommendation was to combine the two species for the next EFH update and use
the models for general distribution of juveniles and adults but not abundance trends.
Food habit studies in Alaska indicate that the diet of adult RE/BS rockfish is primarily shrimp (especially
pandalids) and that fish species such as myctophids are also consumed (Yang and Nelson 2000, Yang
2003). However, juvenile RE/BS rockfish (less than 30-cm fork length) in the GOA also consume a
substantial amount of smaller invertebrates such as amphipods, mysids, and isopods (Yang and Nelson
2000). Recent food studies show the most common prey of RE/BS as pandalid shrimp, euphausiids, and
tanner crab (Chionoecetes bairdi). Other prey include octopi and copepods (Yang et al. 2006). Predators
of RE/BS rockfish likely include halibut (Hippoglossus stenolepis), Pacific cod (Gadus macrocephalus),
and sablefish (Anoplopoma fimbria).
The evolutionary strategy of spreading reproductive output over many years is a way of ensuring some
reproductive success through long periods of poor larval survival (Leaman and Beamish 1984). Fishing
generally selectively removes the older and faster-growing portion of the population. If there is a distinct
evolutionary advantage of retaining the oldest fish in the population, either because of higher fecundity or
because of different spawning times, age-truncation could be deleterious to a population with highly
episodic recruitment like rockfish (Longhurst 2002). Research on black rockfish (Sebastes melanops) has
shown that larval survival may dramatically increase with the age of the mother (Berkeley et al. 2004,
Bobko and Berkeley 2004). McGilliard et al. (2017) showed that this type of offspring size effect or
different spawning times by age may lead to increased recruitment variability with increased fishing
mortality. Pacific ocean perch and RE/BS rockfish were examined by de Bruin et al. (2004) for
senescence in reproductive activity of older fish, and they found that oogenesis continues at advanced
ages. Leaman (1991) showed that older Sebastes individuals have slightly higher egg dry weight than
their middle-aged counterparts. A study of Pacific ocean perch near Kodiak Island found a significant
effect of maternal age on offspring provisioning, which may imply greater fitness for older females
(Arnold et al. 2018). Despite empirical evidence supporting age-dependent fecundity and reproductive
success of Sebastes and other marine teleosts (Hixon et al. 2014), stock assessments for Alaska rockfish
assume that the reproductive success of mature fish is proportional to weight and therefore independent of
age.
Evidence of Stock Structure
Since 2007, we have responded to issues regarding the difficulty identifying RE/BS rockfish and the
development of a rationale for assessment decisions regarding this mixed stock. Reports have included
summaries of studies on the genetic and phenotypic differences between RE/BS rockfish, discussion of
the research regarding at-sea misidentification rates, and projects developed to understand species-
specific life history characteristics (Shotwell et al. 2008, 2009). We completed a full stock structure
evaluation of RE/BS rockfish following the template provided by the Stock Structure Working Group
(SSWG, Spencer et al. 2010) and provided this evaluation in Appendix A of the 2010 GOA RE/BS
rockfish executive summary SAFE report (Shotwell et. al 2010). Brief summaries of RE/BS rockfish
speciation and the stock structure template are provided below.
Rougheye and Blackspotted Speciation
Several studies on the genetic differences between the observed types of rougheye rockfish indicate two
distinct species (Gharrett et al. 2005, Hawkins et al. 2005, Orr and Hawkins 2006, summarized in

Shotwell et al. 2009). The proposed speciation was initiated by Tsuyuki and Westrheim (1970) after
electrophoretic studies of hemoglobin resolved distinct banding patterns in rougheye rockfish. Subsequent
allozyme-based studies demonstrated clear isolation between samples (Seeb 1986) and five
distinguishable loci for the two types of rougheye (Hawkins et al. 1997). A later extended allozyme study
found the two types occurred in sympatry (overlapping distribution without interbreeding), and samples
with depth information demonstrated a significantly deeper depth for what was later described as
blackspotted rockfish (Hawkins et al. 2005). Another study analyzed the variation in mitochondrial DNA
and microsatellite loci and distinguished the two species with relatively little hybridization (Gharrett et al.
2005).
In 2008, the presence of the two species was formally verified (Orr and Hawkins 2008). Rougheye
rockfish are typically pale with spots absent from the spinous dorsal fin and possibly has mottling on the
body. Blackspotted rockfish are darker with spotting almost always present on the dorsal fin and body.
However, the distributions of these phenotypic parameters tend to overlap with only slight differences in
gill rakers, body depth, and coloration (Gharrett et al. 2006). Spatially, rougheye rockfish has been
defined as the southern species extending farther south along the Pacific Rim, while blackspotted rockfish
was considered the northern species extending farther into the western Aleutian Islands and Bering Sea
(Orr and Hawkins 2008).
A recent study used otolith shape analysis (i.e. morphometrics), weight, and age to accurately identify
RE/BS rockfish 86% and 97% of the time, respectively (Harris et al. 2019). In comparison, field-based
identification rates range from 62-66% for rougheye rockfish and 92-94% for blackspotted rockfish.
These findings, which were based on 1,847 specimens collected during research surveys and confirmed
using genetics, demonstrated that otolith morphometrics can be used to improve species identification
rates, especially for rougheye rockfish. This method could be used to reliably identify archived otoliths
from the past 20-30 years.
Stock Structure Template Summary
We summarize the available information on stock structure for the GOA RE/BS rockfish complex in
Table 13-1. Since the formal verification of the two species has only recently occurred, most data on
RE/BS rockfish is for both species combined. We follow the example framework recommended by the
SSWG for defining spatial management units (Spencer et al. 2010) and elaborate on each category within
this template to evaluate stock structure for RE/BS rockfish. Please refer to Shotwell et al. (2010) for the
complete stock structure evaluation.
Non-genetic information suggests population structure by large management areas of eastern, central, and
western GOA. This is evident in opposite trajectories for population trends by area, significantly different
age, length, and growth parameters by area, and significant differences in parasite prevalence and
intensity by area. Genetic studies have generally been focused on the speciation of the RE/BS complex;
however, even studies on the two species separately suggested population structure at the size of the
management areas. One such study showed genetic structure consistent with a neighborhood model of
dispersion and significant isolation by distance for blackspotted rockfish (Gharrett et al. 2007). However,
these data have been reanalyzed with a much larger sample size, and no longer exhibit a significant
isolation by distance pattern in the Aleutian Islands and Bering Sea (see Spencer et al. 2014 BSAI
blackspotted/rougheye assessment for more details).
Currently, GOA RE/BS rockfish is managed as a Tier 3a species with area-specific Acceptable Biological
Catch (ABC) and gulf-wide Overfishing Level (OFL). Given the multiple layers of precaution instituted
with relatively low Maximum Retained Allowance (MRA) percentages, a bycatch only fishery status,
subarea ABCs and TACs, and the generally low area-specific harvest rates, we continue to recommend
the current management specifications for RE/BS rockfish.

Fishery
History
RE/BS rockfish have been managed as a “bycatch” only species complex since the creation of the
shortraker/rougheye rockfish management subgroup in the Gulf of Alaska in 1991. Since 1977, gulf-wide
catches of the RE/BS rockfish have been between 130-2,418 t (Table 13-2). Catches peaked in the late
80s and early 90s, declined rapidly in the mid-90s and have been relatively stable since 2010. RE/BS
rockfish are generally caught in either bottom trawls or with hook-and-line (i.e. “longline”) gear, with
approximately 55-75% taken in the trawl fisheries and 30-45% taken in the longline fisheries in recent
years.
The majority of the recent catch has been taken in the Central GOA bottom trawl fishery. Increases in
recent catch have also occurred in the Eastern GOA longline fishery, particularly in 2018 in Southeast.
Catches have remained relatively low and stable across both bottom trawl and longline gear in the
Western GOA. In 2021, approximately 50% of the catch was from bottom trawls, 35% from longline, and
10% from pelagic trawls. The majority of catch by trawl gear occurs in the rockfish, flatfish, and pollock
fisheries. For longline gear, nearly all the RE/BS catch appears to come as bycatch in the sablefish or
halibut longline fisheries. Since catch accounting was established separately for RE/BS rockfish complex
in 2005, between 20-60% of the TAC for RE/BS rockfish has been caught (Table 13-2). The 2021 catch is
at 31% of the TAC as of October 25, 2021.
The legalization of pot gear in the GOA IFQ sablefish fishery in 2017, coupled with the introduction of
the novel lightweight, collapsible ‘slinky’ pot to Alaska, has translated to a rapid increase in the
proportion of sablefish catch from pots. This shift in fishing behavior has resulted in an increase in the
percentage of RE/BS catch from pots (<0.001% prior to 2017 to 6% in 2021). Pot gear generally has less
bycatch of non-target species compared to hook-and-line gear, and we may expect an overall reduction in
bycatch rates in the sablefish fishery as pot gear increases in popularity. While there is some evidence of
decreased bycatch rates of RE/BS in the sablefish fishery in 2020 and 2021 (Figure below), anomalously
high bycatch rates in 2017-2019 in multiple regulatory areas confuse this trend. We will continue to
monitor bycatch trends and resultant changes in selectivity patterns as the sablefish pot fishery evolves.

Figure. The proportion of sablefish caught by hook-and-line gear as a function of RE/BS bycatch (total
catch of RE/BS / total catch of sablefish) on trips identified as targeting sablefish. A generalized additive
model (grey) smoother is added to aid in visualization.
In response to Annual Catch Limits (ACLs) requirements, assessments now document all removals
including catch that is not associated with a directed fishery and reported in the Catch Accounting System
(CAS). These types of removals may include sport fishery harvest, research catches, or subsistence catch.
Research catches of RE/BS rockfish have been reported in previous stock assessments and estimates of all
removals not associated with a directed fishery including research catches are presented in Appendix
13A. In summary, non-directed removals for RE/BS rockfish have typically been less than 10 t and
research catches of this magnitude do not pose a significant risk to the RE/BS stock in the GOA.
In 2013, the North Pacific Groundfish and Halibut Observer Program was restructured with the objective
to create a more rigorous scientific method for deploying observers onto more vessels in federal fisheries.
The extent that this program affected perceived catches of RE/BS rockfish in the small-boat fishery (due
to improved coverage) is uncertain. This program has subsequently shifted towards increased electronic
monitoring, first for fixed gear longline and pot vessels and more recently for trawl vessels.
Understanding the potential for catch accounting and stock assessment biases due to shifts in observer and
EM coverage and the resultant spatial distribution of biological samples from the fishery will require
further study.
Management Measures
In 1991, the North Pacific Fishery Management Council (NPFMC) divided the slope rockfish assemblage
in the Gulf of Alaska into three management subgroups: Pacific ocean perch, shortraker/rougheye
rockfish, and all other species of slope rockfish. Although each management subgroup was assigned its

own value of ABC (acceptable biological catch) and TAC (total allowable catch), shortraker/rougheye
rockfish and other slope rockfish were discussed in the same SAFE chapter because all species in these
groups were classified into tiers 4 or lower in the overfishing definitions. This resulted in an assessment
approach based primarily on survey biomass estimates rather than age-structured modeling. In 1993, a
fourth management subgroup, northern rockfish (S. polyspinis), was also created. In 2004, shortraker
rockfish and rougheye rockfish were divided into separate subgroups. These subgroups were established
to protect Pacific ocean perch, shortraker rockfish, rougheye rockfish, and northern rockfish (the four
most sought-after commercial species in the assemblage) from possible overfishing. Each subgroup is
now assigned an individual ABC and TAC, whereas prior to 1991, one ABC and TAC was assigned to
the entire assemblage. Each subgroup ABC and TAC is apportioned to the three management areas of the
Gulf of Alaska (Western, Central, and Eastern) based on the distribution of survey biomass.
In 2007 the Central Gulf of Alaska Rockfish Program was implemented to enhance resource conservation
and improve economic efficiency for harvesters and processors who participate in the Central Gulf of
Alaska rockfish fishery. This rationalization program established cooperatives among trawl vessels and
processors which receive exclusive harvest privileges for rockfish species. This implementation impacts
primary rockfish management groups but will affects secondary rockfish groups with a maximum
retained allowance (MRA). The primary rockfish management groups are Pacific ocean perch, northern
rockfish, and pelagic shelf rockfish (changed to dusky rockfish only in 2012), while the secondary species
include rougheye, blackspotted, and shortraker rockfish. Effects of this program to RE/BS rockfish
include: 1) an extended fishing season lasting from May 1 – November 15, 2) changes in spatial
distribution of fishing effort within the Central GOA, 3) improved at-sea and plant observer coverage for
vessels participating in the rockfish fishery, and 4) a higher potential to harvest 100% of the TAC in the
Central GOA region. Recent comparison of catches show that the Rockfish Program has resulted in much
higher observer coverage of catch in the Central GOA; however, there does not seem to be a major shift
in the spatial distribution of RE/BS catch (Shotwell et al. 2014b, Figure 13-1). We will continue to
monitor available fishery data to help understand potential effects the Rockfish Program may have on the
RE/BS rockfish stock in the Central GOA.
A summary of key management measures since the creation of the slope rockfish assemblage in 1988 and
a time series of catch, OFL, ABC, and TAC are shown in Table 13-3.
Bycatch
The only analysis of bycatch for rougheye rockfish is that of Ackley and Heifetz (2001) from 1994-1996
on hauls they identified as targeted on shortraker/rougheye rockfish. The major bycatch species were
arrowtooth flounder (Atheresthes stomias), sablefish, and shortspine thornyhead (Sebastolobus
alascanus), in descending order. The primary fisheries that catch RE/BS rockfish as bycatch are the
targeted rockfish and sablefish fisheries with occasional surges from the flatfish fishery (Table 13-4). For
the combined GOA rockfish trawl fisheries during 2018-2021 (Table 13-5), the largest non-rockfish
bycatch groups are on average arrowtooth flounder (1,251 t/year), walleye pollock (923 t/year), Atka
mackerel (757 t/year), sablefish (705 t/year), and Pacific cod (347 t/year). Non-FMP species catch in the
rockfish target fisheries is generally dominated on average by giant grenadier and miscellaneous fish
(Table 13-6). Prohibited species catch in the GOA rockfish fishery has been generally low for most
species and this has been particularly true since the implementation of the Central GOA Rockfish
Program (Shotwell et al. 2014b). Halibut catch during rockfish targeted hauls has been steady since 2015,
averaging 0.12 t.
Discards
The table below indicates that discards of RE/BS rockfish have ranged from approximately 10% to 41%
with an average of 21.5% in the most recent ten years. These values are relatively high when compared to

other Sebastes species in the Gulf of Alaska. The most recent large increase in 2018 may be due to an
increase in discards in the sablefish longline fishery in the Eastern GOA but is not completely understood
and may simply exist due to enforcement concerns or changes to observer coverage (Echave and Hulson,
2019). Regardless of the cause, the discard rate for RE/BS rockfish has decreased to below average levels
in 2020 and 2021. Rougheye / Blackspotted Complex
Year 2012 2013 2014 2015 2016 2017 2018 2019 2020 2021 %
Discards 14.8 22.2 17.4 22.1 26.6 20.7 41.2 25.2 10.4 14.6
Data
The following table summarizes the data used for this assessment (bold denotes new or updated data for
this assessment):
Source Data Years
Fisheries Catch 1977-2019, 2020, 2021
Age 1990, 2004, 2006, 2008, 2009, 2010, 2012, 2014, 2016,
2018, 2020
Length 1991-1992, 2002-2003, 2005, 2007, 2011, 2013, 2015,
2017, 2019
AFSC bottom trawl
survey
Biomass index 1984, 1987, 1990, 1993, 1996, 1999, 2003, 2005, 2007,
2009, 2011, 2013, 2015, 2017, 2019, 2021
Age 1984, 1987, 1990, 1993, 1996, 1999, 2003, 2005, 2007,
2009, 2011, 2013, 2015, 2017
AFSC longline survey Relative Population
Number (RPN)
1993-2019, 2020, 2021
Length 1993-2019, 2020, 2021
Fishery:
Catch
Catches of RE/BS rockfish have ranged between 130 t to 2,418 t since 1977. The catches from 1977-1992
were from Soh (1998), which reconstructs the catch history using an information weighting factor (λ) to
combine catch histories from both survey and fishery information. Catches from 1993-2004 were
available as the shortraker/rougheye subgroup from the NMFS Alaska Regional Office. Originally, we
used information from a document presented to the NPFMC in 2003 to determine the proportion of
rougheye rockfish in this catch (Ianelli 2003). This proportion was based on the NMFS Regional Office
catch accounting system (“blend estimates”). The SSC recommended using the average of the values
provided in the document, 0.43. In 2004 another method was developed for determining the proportion of
rougheye/blackspotted in the catch based on data from the FMA Observer Program (Clausen et al. 2004,
Appendix A). Observed catches were available from the FMA database by area, gear, and species for
hauls sampled by observers. This information was used to calculate proportions of RE/BS catch by gear
type. These proportions were then applied to the combined shortraker/rougheye catch from the NMFS
Alaska Regional Office to yield estimates of total catch for RE/BS rockfish (Figure 13-1, Table 13-2).
One caveat of the observer catch data prior to 2014 is that these data are based only on trips that had
observers on board. Consequently, they may be biased toward larger vessels, which had more complete observer coverage. This bias may be a particular problem for RE/BS rockfish that were caught by
longliners. Much of the longline catch is taken by small vessels that have no observer coverage. Hence,

the observer catch data probably reflects more what the trawl fishery catches. However, these data may
provide a more accurate estimate of the true proportion of RE/BS catch than the proportion based on the
blend estimates. The blend estimates are derived from a combination of data turned in by fishermen,
processors, and observers. In the case of fishermen and processors, prior to 2004 there was no
requirement to report catches of shortraker/rougheye rockfish by species, and fishermen and processors
were free to report their catch as either shortraker, rougheye, or shortraker/rougheye combined. Shortraker
and rougheye rockfish are often difficult for an untrained person to separate taxonomically, and fishermen
and processors had no particular incentive to accurately identify the fish to species. In contrast, all
observers in the FMA Observer Program are trained in identification of Alaska groundfish, and they are
instructed as to the importance of accurate identifications. Consequently, the catch data based on
information from the FMA Observer Program may be more reliable than those based on the blend
estimate. We use the observer estimates of catch from 1993-2004. Catches are reported separately for
RE/BS and shortraker since 2005.
Age composition
RE/BS rockfish appear to be among the longest-lived of all Sebastes species (Chilton and Beamish 1982,
Munk 2001). Interpretation of annuli on otoliths is extremely difficult; however, NMFS age readers
determined that aging of RE/BS rockfish could be moved into a production mode. Ages were determined
from the break-and-burn method (Chilton and Beamish 1982). We use ages from both the bottom trawl
and longline fishery but only the at-sea processed samples. RE/BS rockfish otolith samples from onshore
processing facilities have been aged; however, the sample sizes from onshore processing facilities are
generally low and the distribution of ages is quite different from the at-sea samples. Fishery age
compositions are treated as a random and representative sample for that year and the overall GOA fishery.
Therefore, we do not use these samples in calculating the fishery age compositions. The FMA Domestic
Observer Program began in 1990 and although this first year was considered preliminary, the 1990 ages
are the only age compositions we have from the fishery prior to 2004. We, therefore, utilize this data in
the model since it is considered important for estimating catch at age in the early 1990s. Table 13-8
summarizes the available fishery age compositions from 1990, 2004, 2006, 2008, 2009, 2010, 2012,
2014, and 2016.
We generally request fishery ages only for years that do not overlap with an AFSC bottom trawl survey
since analyzing otoliths for long-lived rockfish such as RE/BS rockfish is time-consuming. However, we
do have two overlapping years with the bottom trawl survey samples in 1990 and 2009 for comparison.
Sample sizes from the fishery are typically between 300 and 400 otoliths (Table 13-8). On average,
approximately 34% of the age samples are taken from the bottom trawl fishery and 66% taken from the
longline fishery for at-sea samples. This percentage is similar for the data used in the model with 33% of
lengths from the trawl fishery and 67% from the longline fishery. The mean ages for a given year range
between 29-40 years and are relatively old when compared to other aged rockfish species.
Size composition
Observers aboard fishing vessels and at onshore processing facilities have provided data on size
composition of the commercial catch of RE/BS rockfish. Table 13-9 summarizes the available size
compositions from 1991-2019. Sample sizes from 1993-2001 were limited for RE/BS rockfish and in
other years range from 300 to 2500 (Table 13-9). In general, we do not use size compositions in the
model when age compositions are available because we consider age data to be a more reliable measure
of population structure for these long-lived species. Since we anticipate fishery ages for non-trawl survey
years, we do not include the size compositions for off-cycle years in the model. Additionally, in long-
lived rockfish species the fish are selected late to the fishery and size compositions tend to be relatively
uninformative as year classes will blend together. Therefore, fishery size compositions from 1991-1992,
2002-2003, 2005, 2007, 2011, 2013, 2015, 2017, and 2019 are included in this full assessment.

Length samples from onshore processing facilities also exist for RE/BS rockfish; however, the
distribution between onshore and at-sea lengths differ dramatically and the samples sizes are quite low.
Therefore, as with age samples, we do not use these onshore length samples in calculating the fishery size
compositions. Lengths were binned into 2 cm categories to obtain better sample sizes per bin from 20-60+
with the (+) group containing all the fish 60 cm and larger. Fishery length compositions are treated as a
random and representative sample from the overall catch-at-length. On average, approximately 42% of
the lengths are taken from the bottom trawl fishery and 58% from the longline fishery for at-sea samples.
This percentage is different for the data used in the model with 37% of lengths from the trawl fishery and
63% from the longline fishery. The mean of lengths for the 1991-1992 samples is approximately 45 cm
and from 2002-2017 has remained relatively steady between 45 to 48 cm. Moderate presence of fish
smaller than 40 cm is present in most years, particularly 1991 and 1992.
Survey:
AFSC Bottom Trawl Biomass Estimates
Bottom trawl surveys were conducted on a triennial basis in the Gulf of Alaska in 1984, 1987, 1990,
1993, 1996, and 1999. These surveys became biennial starting in 2001. The surveys provide much
information on RE/BS rockfish, including an abundance index, age composition, and growth
characteristics. The surveys are theoretically an estimate of absolute biomass, but we treat them as an
index in the stock assessment model. The triennial surveys covered all areas of the Gulf of Alaska out to a
depth of 500 m (in some surveys to 700 m or 1,000 m), but the 2001 biennial survey did not sample the
eastern Gulf of Alaska. Because the 2001 survey did not cover the entire Gulf of Alaska, we omitted this
survey from our assessment model for RE/BS rockfish.
Summaries of biomass estimates from the 1984-2021 surveys are provided in Table 13-10. Trawl survey
biomass estimates are shown in Figure 13-2. The 2021 biomass estimate was an all-time low for this time
series. The decrease was 56% below the 2019 estimate and 43% below the mean biomass estimate for the
time series. The trends by area were not consistent, as there were decreases in the central and eastern
GOA and an increase in the western GOA.
The 1984 and 1987 survey results should be treated with some caution. A different survey design was
used in the eastern GOA in 1984; furthermore, much of the survey effort in the western and central GOA
in 1984 and 1987 was by Japanese vessels that used a very different net design than what has been the
standard used by U.S. vessels throughout the surveys. To deal with this latter problem, fishing power
comparisons of rockfish catches have been done for the various vessels used in the surveys (Heifetz et al.
1994). Results of these comparisons have been incorporated into the biomass estimates discussed here,
and the estimates are believed to be the best available. Even so, the reader should be aware that an
element of uncertainty exists as to the standardization of the 1984 and 1987 surveys.
The biomass estimates for at-sea identified RE/BS rockfish have been somewhat inversely correlated
among the surveys, but when combined there is a somewhat decadal oscillation to the survey trajectory
over time. However, inter-survey changes in biomass are not statistically significant from each other
(Table 13-10; Figure 13-2). Compared with other species of Sebastes, the trawl survey biomass estimates
for RE/BS rockfish show relatively tight confidence intervals and low coefficients of variations (CV),
ranging between 11% and 23%. The exception to this was the 2019 survey where the CV was
approximately 69% in the central GOA, which is the largest on record for this stock. This was due to on
particularly large tow near Kodiak. The otherwise low CVs are an indication of the rather uniform
distribution for this species compared with other slope rockfish (discussed previously in Life History and
Distribution section). Despite this precision, however, trawl surveys are believed to do a relatively poor
job of assessing abundance of adult RE/BS rockfish on the upper continental slope. Nearly all the RE/BS
catch from this survey is found at depths of 300-500 m. Much of this area is not trawlable by the survey’s

gear because of its steep and rocky bottom, except for gully entrances where the bottom is not as steep. If
RE/BS rockfish are located disproportionately on rough, untrawlable bottom, then the trawl survey may
underestimate their abundance. Conversely, if the bulk of their biomass is on smoother, trawlable bottom,
then we could be overestimating their abundance with the trawl survey estimates. Consequently, trawl
survey biomass estimates for RE/BS rockfish are mostly based on the relatively few hauls in gully
entrances, and they may not indicate a true picture of the abundance trends. However, utilization of both
the trawl survey and longline survey (which can sample where trawl surveys cannot) abundance indices
should alleviate some of this concern.
In 2007, the trawl survey began separating rougheye rockfish from blackspotted rockfish using a species
identification key (Orr and Hawkins, 2008). Biomass estimates of the two species by region somewhat
support distributional differences; blackspotted estimates were higher in the western GOA and rougheye
estimates were higher in the eastern GOA (discussed previously in Evidence of Stock Structure section).
However, both species were identified in all regions, implying some overlap throughout the GOA. Over
all areas, more blackspotted rockfish were identified than rougheye in 2007 (56% versus 44%), while in
subsequent surveys the reverse occurred, with 63% to 73% rougheye and 37% to 27% blackspotted. The
initial shift may have been due to decreases in misidentification rates at-sea between the two species as
new identification keys and more training have been incorporated. Despite this apparent improvement,
misidentification rates are still shifting from year to year and given the lack of species-specific catch we
continue to combine all survey data for both species until a complete evaluation of the genetically
corrected species’ specific life history characteristics are made available.
AFSC Bottom Trawl Age Compositions
No new ages were added in 2019 due to a delay in processing. As of 2017 there are a total of fourteen
years of survey age compositions with a total sample size of 7,744 ages. Survey age sample sizes are
generally higher than fishery age sample sizes, ranging from 200 to 1,000. Although RE/BS rockfish have
been reported to be greater than 200 years old (Munk 2001), the highest age collected over these survey
years was 135 (AFSC 2010). The average age ranged from 15 to 23 over all survey years available (Table
13-11). Compositions from 1984, 1987, 1990, 1996, 1999 showed especially prominent modes in the
younger to mid ages (6 to 12 year olds for this species), suggesting periods of large year classes from the
late 1970s, early 1980s and then again in the late 1980s early 1990s. Since 2003, compositions were
spread more evenly across age groups 3-15 corresponding to the strong year classes of the early 1990s
and another period of increased recruitment in the early 2000s that is tracked through each survey year. In
2011, a higher proportion of five year old fish suggests another period of increased recruitment in the
mid-2000s. This is tracked through to 2013, 2015, and 2017 along with a high proportion of three, five,
and now seven year-old fish, suggesting a period of increased recruitment from the mid and late 2000s.
Since 2007, when the survey began identifying by individual species of RE/BS rockfish, rougheye
compositions tend to be spread evenly across ages, while blackspotted tend to be much older, although
this has changed since the 2013 survey as the fish in general are younger overall. Mean age of rougheye
range from 13 - 16, while mean age for blackspotted range from 16 - 24. Given, the misidentification
rates, we combine these two age compositions for 2007, 2009, 2011, 2013, 2105, and 2017 in the stock
assessment model. Ages 42 and greater are pooled into a plus (+) group following the author
recommended model (Table 13-11).
AFSC Bottom Trawl Size Compositions
Gulf-wide population size compositions for RE/BS rockfish are in Table 13-12 and sample sizes range
from 1,700 to 5,600. The size composition of RE/BS rockfish in the 1984 survey indicated that a sizeable
portion of the population was >40 cm in length. This is consistent with the large proportion of ages in the
25-32 year range. In the 1996 through 2019 surveys there is a substantial increase in compositions of fish

<30 cm in length suggesting that at least a moderate level of recruitment has been occurring throughout
these years or there are fewer larger fish in the population. Compositions from all surveys (with the
possible exception of 1990) were all skewed to the right, with a mode of about 43-45 cm. The average
length steadily decreased from 1984-1999, ranging from 41 to 34 cm. Since 2007, survey RE/BS rockfish
lengths were split. Rougheye have an average length of 33 cm while blackspotted have an average of 38
cm. Rougheye have a much broader range of lengths from 10-60 cm, while blackspotted tend to be more
confined to the 35-50 cm range. Again, this may be indicative of misidentification or a true difference in
size distribution between species. Future analysis of the 2009, 2013, and 2015 trawl survey genetics
experiment will aid in understanding some of these differences. Trawl survey size data are used in
constructing the size-age conversion matrix, but are not used as data to be fit in the stock assessment
model since survey ages for most years were available. Investigations into including the most recent
survey’s length composition as a proxy for unavailable age composition were presented in Appendix 9B
of the GOA POP November 2014 assessment. The results of that analysis suggest that the utility of using
only the most recent survey’s length composition is case specific and may be a subject for future research.
AFSC Longline Abundance Index
Catch, effort, and length data were collected for RE/BS rockfish during longline surveys. Data were
collected separately for RE/BS rockfish and shortraker since 1990. These longline surveys likely provide
an accurate index of sablefish abundance (Sigler 2000) and may also provide a reasonable index for
RE/BS rockfish in addition to the AFSC bottom trawl survey (Rodgveller et al. 2011). Relative
population abundance indices are computed annually using survey catch per unit of effort (CPUE) rates
that are multiplied by the area size of the stratum within each geographic area. These relative population
indices are available by numbers (RPN) and weights (RPW) for a given species (Rodgveller et al. 2011).
Like the trawl survey biomass, the RPN estimates for RE/BS rockfish have been variable throughout the
time series (Figure 13-3). The 2021 RPN was 36% lower than 2019, and 2020 was the lowest in the time
series. This trend was driven by declines in the central and western GOA, whereas the eastern GOA is
around the time series mean.
There have been several changes to the longline survey indices since the 2011 assessment. These include
updated growth parameters for all species except sablefish, updated species coding for shortraker and
rougheye rockfish, and new area estimates for all strata including the shallow stratum from 150-200 m
(Echave et. al. 2013). These updates resulted in a full revision of longline survey estimates for RE/BS
rockfish. Due to the updated data checks on the length codes for shortraker and rougheye rockfish, it was
determined that the time series for RE/BS should start in 1993. The new area estimates for the shallow
stratum now allow the catch data from 150 to 200 m to be included in the survey index. Since RE/BS
rockfish are often caught in this stratum (Shotwell et al. 2014a), we include this information in the RE/BS
longline survey index. Compared to the trawl survey, the longline survey may do a better job sampling
RE/BS at shallower depths.
During the 2009 CIE for sablefish the use of both relative population number (RPN) and weight (RPW)
survey indices in the model was discussed. The CIE recommendation was to use only the RPN index to
avoid the added uncertainty that results from converting lengths to weight, estimating numbers-at-age and
then converting back to weight for the ultimate ABC recommendation. We follow this recommendation
for RE/BS and now use the RPN index since the weight conversion data is already incorporated into the
assessment model. The final longline survey RPN index for RE/BS rockfish runs from 1993-2021 with all
available strata updated with new area estimates (Table 13-13).
In addition to recalculating RPN values, variance estimates were computed for RE/BS rockfish (Figure
13-3). These estimates were derived by assuming that the mean CPUE of a station in a depth stratum were
a representative sample, but recognizing that there is covariance between hachis (also termed a skate,

which is equal to 45 hooks spaced 2 meters apart) and between depth strata since hachis and stratum
means are not independent among stations. Previously, the variance of the RPW index was assumed to
have a CV of 20% across all years based on the interannual variance. New estimates of CVs for the RPN
index range from 13-20% (Table 13-13).
As mentioned in the previous section, the trawl survey does not typically sample the high relief habitat of
RE/BS rockfish. This is not the case with the longline survey which can sample a large variety of habitats.
One drawback, however, is that juvenile fish are not susceptible to longline gear. Subsequently, the
longline survey does not provide much information on recruitment because most fish are similar in size
once they have reached full selection of the longline gear and there is no RE/BS age data for the longline
survey. The trawl survey may be limited in sampling particular habitats, but does capture juveniles.
Another potential concern is the unknown effect due to competition between larger predators for hooks
(Rodgveller et al. 2008). However, Shotwell et al. (2014a) investigated the potential for hook competition
on the longline survey and found that it was very unlikely to be large, and if it occurs it happens only in
occasional specific year and station combinations. In the future, if competition is deemed more important,
it will be straightforward to include a competition parameter into the RPN index. Incorporating both
longline and trawl survey estimates in the model should remedy some of these issues and offset the
variable pattern in both surveys that may be an artifact of sampling issues.
AFSC Longline Size Compositions
Although no rockfish otoliths are collected on the longline survey, large samples of RE/BS lengths have
been collected gulfwide since 1993. Lengths are now collected for nearly all RE/BS rockfish caught
ranging from 3,500 to 7,000 (Table 13-14). The influence of such large sample sizes in the stock
assessment model are somewhat remedied by taking the square root of sample size relative to the max of
the series and scaling to 100 to determine the weight for each year. The implications of these assumptions
toward weighting of samples sizes should be addressed and is an area for future research.
Since the longline survey does not sample in proportion to area, we weight longline survey size
compositions by area abundance (RPNs) instead of raw sample size. Updated longline survey size
compositions are available from 1993-2021 using all strata information and are calculated using the same
length bins as the fishery and AFSC bottom trawl data. The longline survey size compositions show that
small fish were rarely caught in the longline survey and that the length distribution was fairly stable
through time (Table 13-14). Compositions for all years were normally distributed with a mode between
45 and 47 cm in length.
Comparison of AFSC Bottom Trawl and Longline Surveys
We have asserted that the use of both the AFSC bottom trawl and longline surveys allows us to pick up
more signals about the changes in the RE/BS stock. However, as described in the previous sections, both
surveys exhibit considerable noise and inter-annual variability and frequently exhibit divergent trends.
The 2019 assessment prompted a recommendation from the Plan Team to investigate depth strata in
which there is an overlap between the trawl and longline surveys to evaluate consistency in catch between
the two surveys. To address this recommendation, we compared Pearson correlation coefficients of the
standardized time series of trawl survey biomass and longline survey RPNs by regulatory area and depth
strata. Because the two surveys use different depth strata definitions between 300 and 700 m, we
examined alternatives for overlapping strata and present the alternative with the highest number of
positive correlation coefficients (see table below).
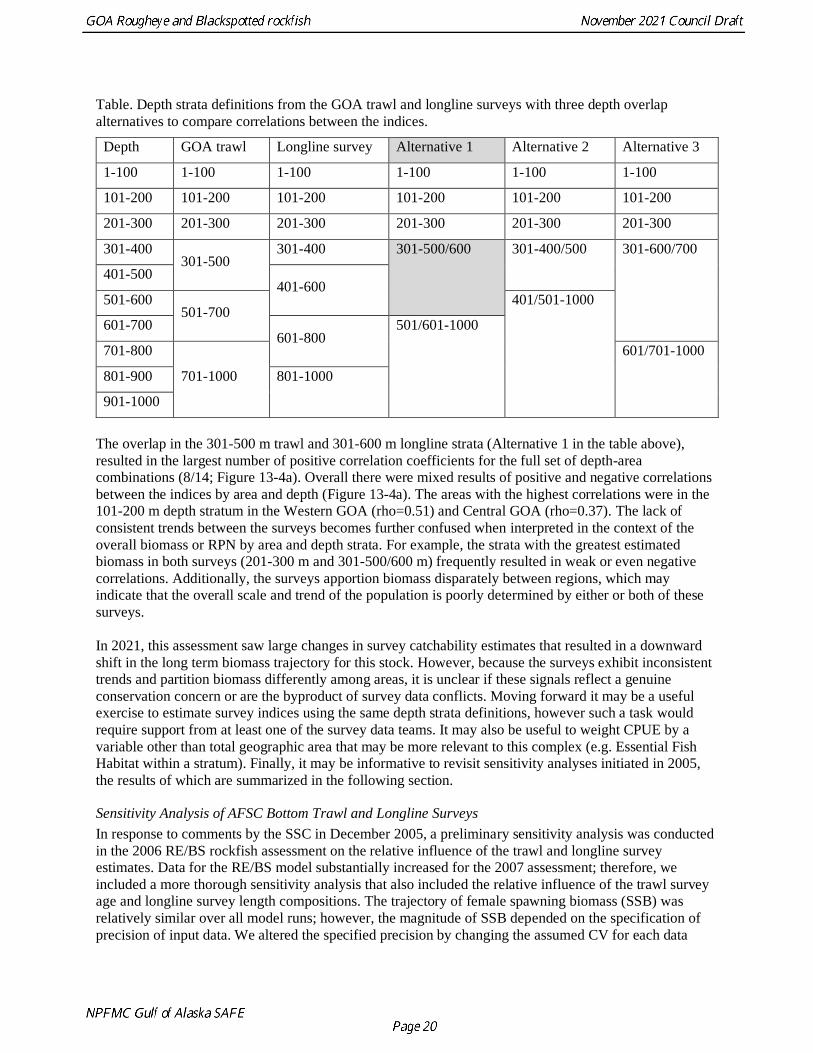
Table. Depth strata definitions from the GOA trawl and longline surveys with three depth overlap
alternatives to compare correlations between the indices.
Depth GOA trawl Longline survey Alternative 1 Alternative 2 Alternative 3
1-100 1-100 1-100 1-100 1-100 1-100
101-200 101-200 101-200 101-200 101-200 101-200
201-300 201-300 201-300 201-300 201-300 201-300
301-400 301-500
301-400 301-500/600 301-400/500 301-600/700
401-500 401-600
501-600 501-700
401/501-1000
601-700 601-800
501/601-1000
701-800
701-1000
601/701-1000
801-900 801-1000
901-1000
The overlap in the 301-500 m trawl and 301-600 m longline strata (Alternative 1 in the table above),
resulted in the largest number of positive correlation coefficients for the full set of depth-area
combinations (8/14; Figure 13-4a). Overall there were mixed results of positive and negative correlations
between the indices by area and depth (Figure 13-4a). The areas with the highest correlations were in the
101-200 m depth stratum in the Western GOA (rho=0.51) and Central GOA (rho=0.37). The lack of
consistent trends between the surveys becomes further confused when interpreted in the context of the
overall biomass or RPN by area and depth strata. For example, the strata with the greatest estimated
biomass in both surveys (201-300 m and 301-500/600 m) frequently resulted in weak or even negative
correlations. Additionally, the surveys apportion biomass disparately between regions, which may
indicate that the overall scale and trend of the population is poorly determined by either or both of these
surveys.
In 2021, this assessment saw large changes in survey catchability estimates that resulted in a downward
shift in the long term biomass trajectory for this stock. However, because the surveys exhibit inconsistent
trends and partition biomass differently among areas, it is unclear if these signals reflect a genuine
conservation concern or are the byproduct of survey data conflicts. Moving forward it may be a useful
exercise to estimate survey indices using the same depth strata definitions, however such a task would
require support from at least one of the survey data teams. It may also be useful to weight CPUE by a
variable other than total geographic area that may be more relevant to this complex (e.g. Essential Fish
Habitat within a stratum). Finally, it may be informative to revisit sensitivity analyses initiated in 2005,
the results of which are summarized in the following section.
Sensitivity Analysis of AFSC Bottom Trawl and Longline Surveys
In response to comments by the SSC in December 2005, a preliminary sensitivity analysis was conducted
in the 2006 RE/BS rockfish assessment on the relative influence of the trawl and longline survey
estimates. Data for the RE/BS model substantially increased for the 2007 assessment; therefore, we
included a more thorough sensitivity analysis that also included the relative influence of the trawl survey
age and longline survey length compositions. The trajectory of female spawning biomass (SSB) was
relatively similar over all model runs; however, the magnitude of SSB depended on the specification of
precision of input data. We altered the specified precision by changing the assumed CV for each data
source. In general, model estimates were robust to only altering the precision on the trawl survey biomass
estimates or the longline survey length compositions. Estimates of SSB increased with a moderately high
precision on the trawl survey biomass coupled with decreased precision on the longline survey biomass or
a decrease in weight on the trawl survey age compositions. Model estimates decreased with high precision
on only the longline survey or high precision on the trawl survey age compositions.
In two scenarios, B2008 fell below B40%. The first scenario was very high precision on only the longline
survey. In this case, the relatively low weight of the catch index allowed the model to predict highly
anomalous values resulting in fairly low fit to the catch data. The second scenario was very high precision
on the trawl survey biomass combined with very high weight on the trawl survey age compositions. In
this second case, trawl survey selectivity shifts to the right and catchability increased dramatically,
resulting in reduced overall biomass trajectory. Results of this sensitivity analysis suggest increasing the
weight on the catch index to increase robustness of the model to the assumed specification of precision.
We may also explore the effects of increasing the age bins as we update the size-at-age matrix and
weight-at-age vector when considering model assumptions. At this time, we do not feel that any particular
increase or decrease of the current precision or weighting scheme on the trawl or longline biomass
estimates or compositions is warranted, given that they all provide information on different aspects of the
RE/BS rockfish population.
International Pacific Halibut Commission (IPHC) Longline Estimates
The IPHC conducts a longline survey each year to assess Pacific halibut. This survey differs from the
AFSC longline survey in gear configuration and sampling design, but also catches RE/BS rockfish. More
information on this survey can be found in Soderlund et al. (2009). A major difference between the two
surveys is that the IPHC survey samples the shelf consistently from 1-500 meters, whereas the AFSC
longline survey samples the slope and select gullies from 200 to 1000 meters. Because the majority of
effort occurs on the shelf in shallower depths, the IPHC survey may catch smaller and younger RE/BS
rockfish than the AFSC longline survey; however, lengths of RE/BS rockfish are not taken on the IPHC
survey.
We conducted a preliminary comparison between the three surveys from 1998-2008 in Shotwell et al.
(2011). IPHC relative population numbers (RPN) were calculated similar to the AFSC survey, the only
difference being the depth stratum increments. Area sizes used to calculate biomass in the AFSC bottom
trawl surveys were utilized for IPHC RPN calculations. A Student’s t normalized residuals was used to
compare between the IPHC longline, AFSC longline, and AFSC bottom trawl surveys. The IPHC and
AFSC longline surveys track well until about 2004 and then have somewhat diverging trends. The
consistently shallower IPHC survey may better capture variability of younger RE/BS rockfish. Since the
abundance of younger RE/BS rockfish will be more variable as year classes pass through, the IPHC
survey should more closely resemble the AFSC bottom trawl survey. Potential use of the IPHC survey in
this assessment is an area for future research.

Analytic Approach
Model Structure
We present model results for the RE/BS rockfish complex based on an age-structured model using AD
Model Builder software (Fournier et al. 2012). This consists of an assessment model, which uses survey
and fishery data to generate a historical time series of population estimates, and a projection model which
uses results from the assessment model to predict future population estimates and recommended harvest
levels. The GOA RE/BS model closely follows the GOA Pacific ocean perch model which was built from
the northern rockfish model (Courtney et al. 1999; Hanselman et al. 2003, Courtney et al. 2007). As with
other rockfish age-structured models, this model does not attempt to fit a stock-recruitment relationship
but estimates a mean recruitment with estimated annual recruitment deviations. We do this because there
does not appear to be an obvious stock-recruitment relationship in the model estimates, and there is little
contrast in the spawner-recruit data (Figure 13-5). The main difference between the RE/BS model and the
Pacific ocean perch model is the addition of data from the AFSC longline survey. Unlike the Pacific
ocean perch model, the starting point for the RE/BS model is 1977, so the population at the starting point
has already sustained fishing pressure. The parameters, population dynamics and equations of the model
are described in Box 1 (below). The model was originally configured in 2005, when catch accounting was
established separately for RE/BS rockfish and shortraker rockfish. In 2009, further modifications were
made to accommodate MCMC projections that use a pre-specified proportion of ABC for annual catch. In
2014, a modification was made to allow for a numbers index rather than a weight index for the longline
survey in the model following the configuration used in the sablefish assessment model (Hanselman et al.
2013). Several changes to the assessment methodology were made in 2015 that included (1) updating
growth information to account for length-stratified sampling, (2) updating and extending the ageing error
matrix, (3) using the gamma function for trawl survey selectivity, and (4) setting the plus age group to a
higher age of 42.
There are no model alternatives to consider for the 2021 assessment. We continue to use the
recommended model from the 2015 assessment which was the fourth model evaluated (Model M4.a). We
updated the model name to Model 15.4 to use the correct naming convention, and this change is detailed
in the following table for clarity:
Parameters Estimated Outside the Assessment Model
Size at 50% maturity has been determined for 430 specimens of rougheye rockfish (McDermott 1994).
This was converted to 50% maturity-at-age using the size-age matrix from this stock assessment. These
data are summarized below (size is in cm fork length and age is in years).
Sample size Size at 50% maturity (cm) Age at 50% maturity
430 43.9 19
A study by Conrath (2017) provided species-specific estimates for length and age maturity for RE/BS
rockfish using samples collected on research surveys in 2010-2014 that relied on field-based species
Model Number Model Description
Model 15.4 (2017) Model M4.a from Shotwell et al. (2015)
Model 15.4 (2019) Same Model 15.4 but incorporates all new and updated data
from 2019
Model 15.4 (2021) Same Model 15.4 but incorporates all new and updated data
from 2021

identification. Parameter estimates from this study showed comparable estimates of length at 50%
maturity (𝑙50), but blackspotted rockfish had a slower maturation rate (𝛿𝑙). In order for these species to
exhibit comparable 𝑙50s but different maturation rates, it means blackspotted rockfish start maturing at
smaller sizes and don’t reach 100% maturity until they are larger than rougheye. Estimates of age-based
maturity were very different between the species, with rougheye reaching 50% maturity eight years
younger than blackspotted rockfish, and rougheye exhibiting a higher maturation rate (𝛿𝑎).
Length and age-based maturity estimates from Conrath (2017)
Parameter
Rougheye
rockfish
Blackspotted
rockfish
Length-based
maturity
𝑙50 45.0 cm 45.3 cm
𝛿𝑙 0.48 0.31
Age-based
maturity
𝑎50 19.5 y 27.4 y
𝛿𝑎 0.33 0.25
Size at age data and resulting growth estimates were the same as used in the last full assessment where
data was updated through the 2013 survey and appropriate length-stratified methods (Quinn and Deriso
1999, Bettoli and Miranda 2001) were incorporated. A von Bertalanffy growth curve was fit to size and
age data from 1990 to 2013. Sexes were combined and the size-at-age conversion matrix was constructed
by adding normal error with a standard deviation equal to the survey data for the probability of different
size classes for each age. The estimated parameters for the growth curve are:
2015 size at age parameters: L∞= 49.6 cm κ=0.09 t0=-0.69 n=6,738
The mean weight-at-age was constructed from the same data set as the size-at-age matrix and a correction
of (W∞-W25)/2 was used for the weight of the pooled ages (Schnute et al. 2001). The estimated growth
parameters (including the length-weight parameters) from the length-stratified methods are:
2015 weight at age parameters: W∞= 1,639 g κ=0.12 t0=-0.38 β=3.086 n=5,806
Aging error matrices were constructed by assuming that the break-and-burn ages were unbiased but had a
given amount of normal error around each age. Originally, we used the error structure of the Pacific ocean
perch model because we used approximately the same age bins for the RE/BS assessment. Additional
available age samples allowed for an update of the age-error matrix in 2011. Age agreement tests have
now been run on samples from 1984, 1987, 1990, 1993, 1996, 1999, 2003-2007, and 2009 for RE/BS
rockfish for a total of 1,589 specimens. We use the same age error structure as presented in the 2015
assessment that was based on the percent agreement for each age from these tests. In the 2015 assessment
the plus age group was extended in the model compared to the plus age group in the data to alleviate the
consistent over-estimation of the proportion at age in the age bins adjacent to the plus group age.
Parameters Estimated Inside the Assessment Model
The estimates of natural mortality (M), catchability (q), and recruitment deviations (σr) are estimated with
the use of prior distributions as penalties. The prior for RE/BS rockfish natural mortality estimate is 0.03
which is based on McDermott (1994). She used the gonadosomatic index (GSI) following the

methodology described by Gunderson and Dygert (1988) to estimate a range of natural mortalities
specifically for RE/BS (0.03 – 0.04). In general, natural mortality is a notoriously difficult parameter to
estimate within the model so we assign a precise prior CV of 10% (Figure 13-6).
Several other alternatives to estimating natural mortality for rockfish are available such as catch-curve
analysis, empirical life history relationships, and simplified maximum age equations (Malecha et al.
2007). Each of these methodologies was detailed in the draft response of the Rockfish Working Group to
the Center for Independent Expert’s review of Alaskan Rockfish Harvest Strategies and Stock
Assessment Methods (https://media.fisheries.noaa.gov/dam-
migration/center_for_independent_experts_summary_report_for_the_2006_alaska_rockfish_review-
508.pdf). We applied the various methods to data from RE/BS rockfish and used a maximum age of 132
(AFSC 2006). Values are shown below.
Method M
Current stock assessment prior 0.030
Catch Curve Analysis 0.072
Empirical Life-History: Growth 0.004
Empirical Life-History: Longevity 0.035
Rule of Thumb: Maximum Age 0.035
The Hoenig (1983) methods based on longevity and the “rule-of-thumb” approach both produce natural
mortality estimates similar to McDermott (1994). Catch-curve analysis produced an estimate of Z=0.094
and average fishing mortality (0.022) is subtracted to yield a natural mortality 0.072 which is the highest
estimate. The Alverson and Carney (1975) estimate based on growth was much lower. Several
assumptions of catch-curve analysis must be met before this method can be considered viable, and there is
a likely time trend in recruitment for GOA rockfish. The method described by Alverson and Carney
(1975) for developing an estimate of critical age is based on a regression of 63 other population estimates
and may not be representative of extremely long-lived fish such as RE/BS rockfish (Malecha et al. 2007).
McDermott (1994) collected 430 samples of rougheye/blackspotted rockfish from across the Pacific
Northwest to the Bering Sea, providing a representative sample of RE/BS rockfish distribution. Since the
value of 0.03 estimated by McDermott (1994) is within the range of most other estimates of natural
mortality and designed specifically for RE/BS rockfish, we feel that this is the most suitable estimate for a
prior mean.
Since these analyses were completed, Hamel (2014) and Then et al. (2015) have updated many of the
natural mortality estimators. When new methods were applied to the Bering Sea and Aleutian Islands
blackspotted and rougheye rockfish stock assessment, Spencer et al. (2020) found a natural mortality near
0.045. Additionally, natural mortality is known to be correlated with catchability in population models.
Given the difficulties estimating survey catchability parameters, it may be advantageous to fix rather than
estimate natural mortality. We intend to revisit natural mortality assumptions in future iterations of this
assessment.
Catchability parameters are highly uncertain for rockfish. We assign a prior mean of 1 for both the trawl
and longline survey. For the trawl survey, a value of 1 assumes all fish in the area swept are captured,
there is no herding of fish from outside the area swept, and there is no effect of untrawlable grounds. This
area-swept concept does not apply to the longline survey; however, since the RPNs for RE/BS rockfish
are of the same magnitude as the trawl survey estimates we deemed this a logical starting point. We also
assume a lognormal distribution to bind the minimum at zero. For both the trawl and longline survey, we
assign a fairly broad CV (100% for both surveys) which essentially mimics a uniform prior with a lower
bound of zero (Figure 13-7). These prior distributions allow the catchability parameters more freedom
than that allowed to natural mortality.
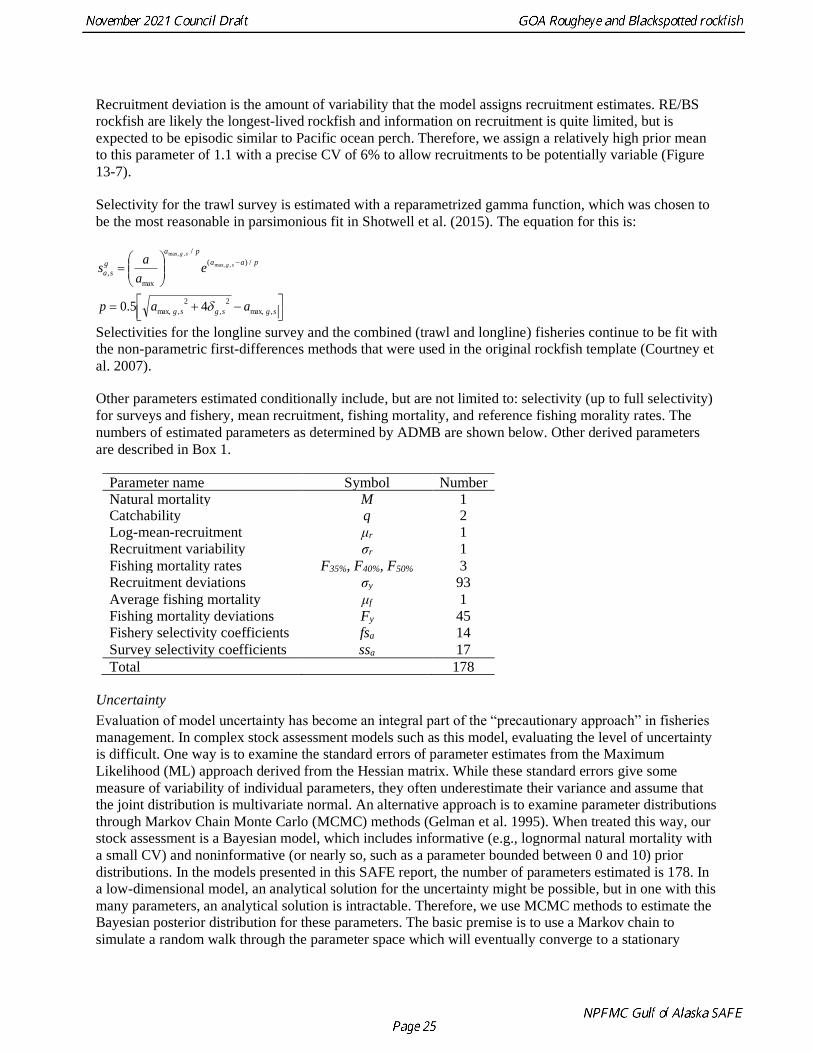
Recruitment deviation is the amount of variability that the model assigns recruitment estimates. RE/BS
rockfish are likely the longest-lived rockfish and information on recruitment is quite limited, but is
expected to be episodic similar to Pacific ocean perch. Therefore, we assign a relatively high prior mean
to this parameter of 1.1 with a precise CV of 6% to allow recruitments to be potentially variable (Figure
13-7).
Selectivity for the trawl survey is estimated with a reparametrized gamma function, which was chosen to
be the most reasonable in parsimonious fit in Shotwell et al. (2015). The equation for this is:
−+=
=
−
sgsgsg
paa
pa
g
sa
aap
ea
as sg
sg
,max,
2
,
2
,max,
/)(
/
max
,
45.0
,max,
,max,
Selectivities for the longline survey and the combined (trawl and longline) fisheries continue to be fit with
the non-parametric first-differences methods that were used in the original rockfish template (Courtney et
al. 2007).
Other parameters estimated conditionally include, but are not limited to: selectivity (up to full selectivity)
for surveys and fishery, mean recruitment, fishing mortality, and reference fishing morality rates. The
numbers of estimated parameters as determined by ADMB are shown below. Other derived parameters
are described in Box 1.
Parameter name Symbol Number
Natural mortality M 1 Catchability q 2
Log-mean-recruitment μr 1
Recruitment variability σr 1
Fishing mortality rates F35%, F40%, F50% 3
Recruitment deviations σy 93
Average fishing mortality μf 1
Fishing mortality deviations Fy 45
Fishery selectivity coefficients fsa 14
Survey selectivity coefficients ssa 17
Total 178
Uncertainty
Evaluation of model uncertainty has become an integral part of the “precautionary approach” in fisheries
management. In complex stock assessment models such as this model, evaluating the level of uncertainty
is difficult. One way is to examine the standard errors of parameter estimates from the Maximum
Likelihood (ML) approach derived from the Hessian matrix. While these standard errors give some
measure of variability of individual parameters, they often underestimate their variance and assume that
the joint distribution is multivariate normal. An alternative approach is to examine parameter distributions
through Markov Chain Monte Carlo (MCMC) methods (Gelman et al. 1995). When treated this way, our
stock assessment is a Bayesian model, which includes informative (e.g., lognormal natural mortality with
a small CV) and noninformative (or nearly so, such as a parameter bounded between 0 and 10) prior
distributions. In the models presented in this SAFE report, the number of parameters estimated is 178. In
a low-dimensional model, an analytical solution for the uncertainty might be possible, but in one with this
many parameters, an analytical solution is intractable. Therefore, we use MCMC methods to estimate the Bayesian posterior distribution for these parameters. The basic premise is to use a Markov chain to
simulate a random walk through the parameter space which will eventually converge to a stationary

distribution which approximates the posterior distribution. Determining whether a particular chain has
converged to this stationary distribution can be complicated, but generally if allowed to run long enough,
the chain will converge (Jones and Hobert 2001). The “burn-in” is a set of iterations removed at the
beginning of the chain. This method is not strictly necessary but we use it as a precautionary measure. In
our simulations we removed the first 4,000,000 iterations out of 20,000,000 and “thinned” the chain to
one value out of every 4,000, leaving a sample distribution of 4,000. Further assurance that the chain had
converged was to compare the mean of the first half of the chain with the second half after removing the
“burn-in” and “thinning”. Because these two values were similar we concluded that convergence had
been attained. We use these MCMC methods to provide further evaluation of uncertainty in the results
below including 95% credible intervals for some parameters. Values from MCMC simulations are not
used to derive any quantities for management advice for this stock assessment, but are helpful in more
fully illustrating the uncertainty of these results.
Parameter
definitions
BOX 1. AD Model Builder Rougheye Model Description
y Year
a Age classes
l Length classes
wa Vector of estimated weight at age, a0 a+
ma Vector of estimated maturity at age, a0 a+
a0 Age it first recruitment
a+ Age when age classes are pooled
μr Average annual recruitment, log-scale estimation
μf Average fishing mortality
Fy Annual fishing mortality deviation
σy Annual recruitment deviation
σr Recruitment standard deviation
fsa Vector of selectivities at age for fishery, a0 a+
ssa Vector of selectivities at age for survey, a0 a+
M Natural mortality, log-scale estimation
Fy,a Fishing mortality for year y and age class a (fsa μf eε)
Zy,a Total mortality for year y and age class a (=Fy,a+M)
εy,a Residuals from year to year mortality fluctuations
Ta,a’ Aging error matrix
Ta,l Age to length conversion matrix
q1 Trawl survey catchability coefficient
q2 Longline survey catchability coefficient
SBy Spawning biomass in year y, (=ma wa Ny,a)
Mprior Prior mean for natural mortality
qprior Prior mean for catchability coefficient
( )r prior Prior mean for recruitment variance
2
M Prior CV for natural mortality
2
q Prior CV for catchability coefficient
2
r Prior CV for recruitment deviations

Equations describing the observed data
BOX 1 (Continued)
( ),
, ,
,
* * 1ˆ *
y aZ
y a y a
y aay a
N F eC w
Z
−−
=
Catch equation
( )1 1 ,ˆ * *
max
ay y a a
a a
sI q N w
s=
Trawl survey biomass index (t)
( )=a a
a
ayys
sNqI
max*ˆ
,22
Longline survey abundance index (RPN)
,
, ' , '
,
*ˆ *
*
y a a
y a a a
ay a a
a
N sP T
N s
=
Survey age distribution
Proportion at age
,
, ,
,
*ˆ *
*
y a a
y l a l
ay a a
a
N sP T
N s
=
Survey length distribution
Proportion at length
,
, ' , '
,
ˆˆ *
ˆ
y a
y a a a
ay a
a
CP T
C
=
Fishery age composition
Proportion at age
,
, ,
,
ˆˆ *
ˆ
y a
y l a l
ay a
a
CP T
C
=
Fishery length composition
Proportion at length
Equations describing population dynamics
Start year
( )
( ) ( )
( ) ( )
( )
1
1 0
0
0
0
,
,
, 1
r styr a ao
r styr a ao
r
a a M
a
a a M
M
e a a
N e e a a a
e ea a
e
− − −
− − −
+
+ − −
+
− −
+−
=
= = −
Number at age of recruitment
Number at ages between recruitment and pooled
age class
Number in pooled age class
Subsequent years ( )
1, 1
1, 1 1,
0
, 1, 1 0
1, 1 1,
,
,
,
r y
y a
y a y a
Z
y a y a
Z Z
y a y a
e a a
N N e a a a
N e N e a a
− −
− − −
+
−
− − +
− −
− − − +
=
=
+ =
Number at age of recruitment
Number at ages between recruitment and pooled
age class
Number in pooled age class

Formulae for likelihood components 2
1 1
0.01ln
ˆ 0.01
y
y y
CL
C
+=
+
BOX 1 (Continued)
Catch likelihood
( ) ( ) −=y
Iyy IIL 22
1122 12/ˆlnln
( ) ( ) −=y
Iyy IIL 22
2233 22/ˆlnln
Trawl survey biomass index likelihood
Longline survey abundance index (RPN) likelihood
( ) ( )
( ) ( )
( ) ( )
( ) ( )
*
4 4 , ,
*
5 5 , ,
*
6 6 , ,
*
7 7 , ,
0.001 0.001
0.001 0.001
0.001 0.001
0.001 0.001
ˆln
ˆ*ln
ˆln
ˆln
endyr l
y y l y l
styr l
endyr a
y y a y a
styr a
endyr l
y y l y l
styr l
endyr l
y y l y l
styr l
L n P P
L n P P
L n P P
L n P P
+
+
+
+
= − + +
= − + +
= − + +
= − + +
Fishery length composition likelihood
Trawl survey age composition likelihood
Trawl survey size composition likelihood
Longline survey size composition likelihood
1
2
2
8 2
2
19 2
1
2
210 2
2
2
11 2( )
1ln
2
1ln
2
1ln
2
1ln
2r
priorM
priorq
priorq
r
r prior
MLM
qL
q
qL
q
L
=
=
=
=
Penalty on deviation from prior distribution of natural
mortality
Penalty on deviation from prior distribution of
catchability coefficient for trawl survey
Penalty on deviation from prior distribution of
catchability coefficient for longline survey
Penalty on deviation from prior distribution of
recruitment deviations
( )2
12 12 2
1*ln
2*y y r
yr
L n
= +
Penalty on recruitment deviations
2
13 13 y
y
L = Fishing mortality regularity penalty
( )
( )
0
0
2
14 14
2
15 15 1
2
16 16 1
16
1
( ( )
a
i i
a
a
i i
a
total i
i
L s
L s s
L FD FD s s
L L
+
+
+
+
=
=
= −
= −
=
Average selectivity penalty (attempts to keep average
selectivity near 1)
Selectivity dome-shapedness penalty – only penalizes
when the next age’s selectivity is lower than the
previous (penalizes a downward selectivity curve at
older ages)
Selectivity regularity penalty (penalizes large deviations
from adjacent selectivities by adding the square of
second differences)
Total objective function value

Results
Model Evaluation
There were no recommended changes to this year’s assessment model compared to the model used in
2015, 2017, and 2019. Negative log-likelihood and estimates of key parameters for last year’s full
assessment (2019 Model 15.4) and this year’s updated model (2021 Model 15.4) are provided in Table
13-15 for comparison. Observed and model predictions for the age and size composition data are provided
in Figures 13-8, 13-9, 13-10 and 13-12. AFSC bottom trawl survey size compositions are provided for
reference but are not fit within the model (Figure 13-11).
Declines in trawl survey biomass and longline survey RPNs since 2019 had significant impacts on the
parameters that govern the scale of the population. In particular, estimates of trawl survey catchability
increased from 1.7 to 2.2, longline survey catchability increased from 1.2 to nearly 1.7, and mean
recruitment decreased from approximately 1.6 to 1.2 million fish (Table 13-5). These changes resulted in
a significant downgrade in biomass trajectories, recruitment, and estimates of unfished spawning biomass.
Model 15.4 continues to rely heavily on size composition data, with lengths from the fishery and longline
survey contributing over 50% to the overall likelihood (Table 13-5). Fits to the age and size composition
are very similar to the 2019 assessment. There is some lack of fit for the fishery age compositions
between ages 15 and 20 and for some years in the plus age group (Figure 13-8). Fits to the fishery size
compositions are slightly flattened (Figure 13-9), particularly in 1991. Fits to the bottom trawl survey age
compositions are generally good, with some underestimation of abundant cohorts such as the 1990 and
2010 year-classes (Figure 13-10). Fits to the longline survey size compositions are similar to the fishery
size compositions, with slightly flattened peaks in most years (Figure 13-12). The model does not fit the
relatively large proportion of size 30 cm fish in 2014. The consistent patterns of positive residuals in the
fishery and longline survey size compositions could be due to a variety of confounding issues between
selectivity, growth, and ageing. In the future we may consider applying different functional forms for
selectivity or explore separate selectivity curves for trawl and longline fisheries.
We continue to recommend model 15.4 to update management quantities for 2022. We discuss results of
this model in the following section. Estimated numbers in 2021, fishery selectivity, trawl and longline
survey selectivity and schedules of age-specific weight and female maturity are provided in Table 13-16
for reference based on the author preferred model.
Time Series Results
Table 13-15 provides parameter estimates for the last full assessment model and the current updated
model for comparison purposes. Tables 13-16 through 13-19 summarize other results for the 2021 author
preferred model (Model 15.4).
Definitions
Spawning biomass is the biomass estimate of mature females. Total biomass is the biomass estimate of all
RE/BS rockfish age three and greater. Recruitment is measured as number of age-3 RE/BS rockfish.
Fishing mortality is fully-selected F, meaning the mortality at the age the fishery has fully selected the
fish.
Total and spawning biomass for the author preferred model compared to the last full assessment was
substantially lower for the entire time series (Figure 13-13, Figure 13-14). The 2019 assessment estimated
a stable total biomass between 1995 and 2019; the updated 2021 assessment now shows a steady decline
in biomass between 2010 and 2021. Recruitment trends were generally similar between the preferred
model and the estimates from the last full assessment, however the scale of recruitment is lower due to the
reduced estimate of log mean recruitment in the 2021 assessment (Tables 13-15 and 13-18).
Biomass and Exploitation Trends
Up until 2010, predicted values for the bottom trawl and longline surveys were similar in the 2019 and
2021 assessments, after which time predicted values in the 2021 assessment began decreasing in order to
fit the below-average survey observations in 2020 and 2021 (Figures 13-2 and 13-3). The addition of new
survey data and subsequent change in the predicted trajectories for the survey indices translated into a
change in the scale of total and spawning biomass for RE/BS (Figures 13-13 and 13-14). Mean total
biomass from 1993-2019 was 39,800 t and 29,726 t in the 2019 and 2021 assessments, respectively,
reflecting a 48% reduction in the average scale of the total population. Estimated mean spawning biomass
over the same time period was 13,358 t and 10,179 t in the 2019 and 2021 assessments, respectively,
reflecting a 24% reduction in the scale of the spawning population. In addition to the downward shifts in
population scale, the 2021 assessment model also shows declines in biomass trajectories since 2010
(Figures 13-13 and 13-14) and continuing beyond 2022 in model projections (Figure 13-21). The
associated estimated MCMC credible intervals for total and spawning biomass are wide (Figures 13-13
and 13-14), suggesting high uncertainty in these derived values.
Fishery, trawl survey, and longline survey selectivity estimates were similar between the 2019 and 2021
assessment models and were consistent with expected fishery and survey dynamics for the most part
(Figure 13-15; Shotwell and Hanselman 2019). The commercial fishery captures larger and subsequently
older fish compared to the trawl survey, which samples a larger range of ages. The longline survey
samples deeper depths than the trawl survey, making younger less susceptible to the gear. The fishery
selectivity curve is similar to the longline selectivity curve with a steeper knife-edge at about 15 years.
This is expected as the fish caught in the fishery are slightly larger on average than the fish caught on the
longline survey. The trawl survey selectivity is dome-shaped because adult habitat is typically in rocky
areas along the shelf break where the trawl survey gear may have difficulty sampling. However, estimates
suggest that selectivity is changing considerably for older aged fish in the survey, which we would not
expect given occupied habitat should not change above a certain age. Future research could consider
alternative parameterizations that would allow for more constrained estimates of selectivity at older ages.
Along with other population-scaling parameters like catchability and recruitment, estimates of fishing
mortality (F) also changed in the 2021 assessment (Figure 13-16). For comparison, the mean F from
1993-2019 was estimated to be 0.0161 and 0.0214 in the 2019 and 2021 assessment, respectively.
Although mean estimates of F have increased, the overall trend and estimated deviations in fishing
mortality remained stable.
Fully-selected fishing mortality increased in the late 1980s and early 1990s due to the high levels of
estimated catch and returned to relatively low levels from 1993 to present (Figure 13-16). The spike may
be due to the management of RE/BS rockfish in the slope rockfish complex prior to 1991 and the
disproportionate harvest on shortraker due to their high value. Rougheye would also be caught as they
often co-occur with shortraker. In general, fishing mortality is relatively low because historically most of
the available TAC has not been caught. There was an increasing trend in fishing mortality from 2010-
2019, but this trend reversed in 2020 and 2021 due to decreased catch of RE/BS.
Goodman et al. (2002) suggested that stock assessment authors use a “management path” graph as a way
to evaluate management and assessment performance over time. We present a similar graph termed a
phase plane which plots the ratio of fishing mortality to FOFL (F35%) and the estimated spawning biomass
relative to B35%. Harvest control rules based on F35% and F40% and the tier 3b adjustment are provided for
reference. The phase for RE/BS rockfish has been above the FOFL adjusted limit for only three years in
1988, 1989, and 1990 (Figure 13-17). Overfishing did not occur during those years based on the FOFL

estimate at the time. Since 1990, spawning biomass of RE/BS rockfish has been above B40% and fishing
mortality has been below F40%.
Recruitment
In general, recruitment is highly variable, particularly in the most recent years when very little
information exists on this part of the population. There also does not seem to be a clear spawner-recruit
relationship for RE/BS rockfish as recruitment is apparently unrelated to spawning stock biomass and
there is little contrast in spawning stock biomass (Figures 13-5 and 13-18). As previously described, there
was a downward shift in the estimates of log mean recruitment, which resulted in a 33% decrease in mean
recruitment between 1977 and 2017 from 1.84 to 1.24 million fish. Annual recruitment patterns were
relatively consistent between the two models, with 2006, 2009, and 2010 year classes estimated to be the
largest cohorts in recent years.
Uncertainty
From the MCMC chains described previously, we summarize the posterior densities of key parameters for
the author recommended model using histograms (Figure 13-19) and credible intervals (Table 13-17). We
also use these posterior distributions to show uncertainty around time series estimates such as total
biomass, spawning biomass and recruitment (Figures 13-13, 13-14, 13-18, Table 13-19).
Table 13-17 shows the maximum likelihood estimate (MLE) of key parameters with their corresponding
standard deviation derived from the Hessian matrix. Also shown are the MCMC standard deviation and
the corresponding Bayesian 95% credible intervals (BCI). The MLE and MCMC standard deviations are
similar for q1 (trawl survey catchability), q2 (longline survey catchability), and M, but the MCMC
standard deviations are larger for the estimates of projected female spawning biomass, and ABC, and σr
(recruitment deviation). The larger standard deviations indicate that these parameters are more uncertain
than indicated by the standard modeling, especially in the case of σr in which the MLE estimate is slightly
out of the Bayesian credible intervals. This highlights a concern that σr requires a fairly informative prior
distribution since it is confounded with available data on recruitment variability. To illustrate this
problem, imagine a stock that truly has variable recruitment. If this stock lacks age data (or the data are
very noisy), then the modal estimate of σr is near zero. As an alternative, we could run sensitivity analyses
to determine an optimum value for σr and fix it at that value instead of estimating it within the model. In
contrast the Hessian standard deviation was larger for the estimate of q1 (trawl survey catchability) and q2
(longline survey catchability), which may imply that these parameters are well estimated in the model.
This is possibly due to the increased age bins. The MCMC distribution of ABC, current total biomass,
and current spawning biomass are skewed (Figure 13-19) indicating potential for higher biomass
estimates (see also Figure 13-13 and Figure 13-14).
Retrospective Analysis
Retrospective analysis is the examination of the consistency among successive estimates of the same
parameters obtained as new data are added to a model. Retrospective analysis has been applied most
commonly to age-structured assessments and can arise for many reasons, ranging from bias in the data
(e.g., catch misreporting, non-random sampling) to different types of model misspecification (e.g.,
incorrect values of natural mortality, temporal trends in values set to be invariant). For this assessment, a
within-model retrospective analysis of the preferred model was conducted for the last 10 years of the
time-series by dropping data one year at a time from the current preferred model.
The retrospective female spawning biomass and the relative difference in female spawning biomass from
the 2021 model are shown in Figure 13-20. One common measure of the retrospective bias is Mohn’s
revised ρ (“rho”) which indicates the size and direction of the bias (Hanselman et al. 2013). The revised
Mohn’s ρ statistic is 0.611, indicating that the model estimates of spawning biomass increase relative to

the terminal year estimates as data is removed from the assessment. Alternatively, a positive statistic
means that as data are added the model decreases the estimates of spawning biomass.
Compared to the previous two assessments, the current RE/BS model exhibits a strong retrospective
pattern in the current assessments. A comparison of the revised Mohn’s “rho” statistic presented in the
2017 through 2021 assessments is presented in the table below.
Statistic 2017 (M15.4) 2019 (M15.4) 2021 (M15.4)
Mohn's revised ρ 0.009 0.167 0.611
Examining retrospective trends can show potential biases in the model, but may not identify what their
source is. Other times a retrospective trend is merely a matter of the model having too much inertia in the
age-structure and other historic data to respond to the most recent data. This retrospective pattern is likely
to be considered strong, and it could be a cause for concern that there is a “one-way” pattern in the
retrospective time series. We hypothesize that the reason for this strong retrospective pattern is due to the
recent sudden declines in both population indices that are used in the assessment. It appears that the
“loose” estimation of catchabilities within this model results in some shifts in scale that become
accentuated with sudden changes in these indices. We intend to investigate the prior uncertainty on
catchability in future assessments and how that relates to this retrospective pattern.
Harvest Recommendations
Amendment 56 to the GOA Groundfish Fishery Management Plan defines the “overfishing level”
(OFL), the fishing mortality rate used to set OFL (FOFL), the maximum permissible ABC, and the fishing
mortality rate used to set the maximum permissible ABC. The fishing mortality rate used to set ABC
(FABC) may be less than this maximum permissible level, but not greater. Because reliable estimates of
reference points related to maximum sustainable yield (MSY) are currently not available but reliable
estimates of reference points related to spawning per recruit are available, RE/BS rockfish in the GOA are
managed under Tier 3 of Amendment 56. Tier 3 uses the following reference points: B40%, equal to 40%
of the equilibrium spawning biomass that would be obtained in the absence of fishing; F35%,equal to the
fishing mortality rate that reduces the equilibrium level of spawning per recruit to 35% of the level that
would be obtained in the absence of fishing; and F40%, equal to the fishing mortality rate that reduces the
equilibrium level of spawning per recruit to 40% of the level that would be obtained in the absence of
fishing.
Estimation of the B40% reference point requires an assumption regarding the equilibrium level of
recruitment. In this assessment, it is assumed that the equilibrium level of recruitment is equal to the
average of age-3 recruits from 1980-2019 (i.e. the 1977-2016 year classes). Other useful biomass
reference points which can be calculated using this assumption are B100% and B35%, defined analogously to
B40%. The 2022 estimates of these reference points are in the following table. Biomass estimates are for
female spawning biomass.
B100% B40% B35% F40% F35%
14,776 (t) 5,911 (t) 5,172 (t) 0.038 0.046
Specification of OFL and Maximum Permissible ABC
Estimated female spawning biomass for 2022 is 8,648 t. This is above the B40% value of 5,911 t. Under
Amendment 56, Tier 3, the maximum permissible fishing mortality for ABC is F40% and fishing mortality
for OFL is F35%. Applying these fishing mortality rates for 2022 yields the following ABC and OFL:

F40% 0.038
ABC (t) 788
F35% 0.046
OFL (t) 947
Population Projections
A standard set of projections is required for each stock managed under Tiers 1, 2, or 3 of Amendment 56.
This set of projections encompasses seven harvest scenarios designed to satisfy the requirements of
Amendment 56, the National Environmental Policy Act, and the Magnuson-Stevens Fishery Conservation
and Management Act (MSFCMA).
For each scenario, the projections begin with the vector of 2021 numbers-at-age as estimated in the
assessment. This vector is then projected forward to the beginning of 2022 using the schedules of natural
mortality and selectivity described in the assessment and the best available estimate of total (year-end)
catch for 2021. In each subsequent year, the fishing mortality rate is prescribed on the basis of the
spawning biomass in that year and the respective harvest scenario. In each year, recruitment is drawn
from an inverse Gaussian distribution whose parameters consist of maximum likelihood estimates
determined from recruitments estimated in the assessment. Spawning biomass is computed in each year
based on the time of peak spawning and the maturity and weight schedules described in the assessment.
Total catch after 2021 is assumed to equal the catch associated with the respective harvest scenario in all
years. This projection scheme is run 1,000 times to obtain distributions of possible future stock sizes,
fishing mortality rates, and catches.
Five of the seven standard scenarios will be used in an Environmental Assessment prepared in
conjunction with the final SAFE. These five scenarios, which are designed to provide a range of harvest
alternatives that are likely to bracket the final TAC for 2022, are as follow (“max FABC” refers to the
maximum permissible value of FABC under Amendment 56):
Scenario 1: In all future years, F is set equal to max FABC. (Rationale: Historically, TAC has been
constrained by ABC, so this scenario provides a likely upper limit on future TACs.)
Scenario 2: In 2022 and 2023, F is set equal to a constant fraction of max FABC, where this fraction is
equal to the ratio of the realized catches in 2018-2020 to the ABC recommended in the assessment for
each of those years. For the remainder of the future years, maximum permissible ABC is used. (Rationale:
In many fisheries the ABC is routinely not fully utilized, so assuming an average ratio of F will yield
more realistic projections.)
Scenario 3: In all future years, F is set equal to 50% of max FABC. (Rationale: This scenario provides a
likely lower bound on FABC that still allows future harvest rates to be adjusted downward when stocks fall
below reference levels.)
Scenario 4: In all future years, F is set equal to the 2016-2020 average F. (Rationale: For some stocks,
TAC can be well below ABC, and recent average F may provide a better indicator of FTAC than FABC.)
Scenario 5: In all future years, F is set equal to zero. (Rationale: In extreme cases, TAC may be set at a
level close to zero.)
Two other scenarios are needed to satisfy the MSFCMA’s requirement to determine whether a stock is
currently in an overfished condition or is approaching an overfished condition. These two scenarios are
as follow (for Tier 3 stocks, the MSY level is defined as B35%):

Scenario 6: In all future years, F is set equal to FOFL. (Rationale: This scenario determines whether a
stock is overfished. If the stock is expected to be 1) above its MSY level in 2021 or 2) above ½ of its
MSY level in 2021 and above its MSY level in 2031 under this scenario, then the stock is not overfished.)
Scenario 7: In 2022 and 2023, F is set equal to max FABC, and in all subsequent years F is set equal to
FOFL. (Rationale: This scenario determines whether a stock is approaching an overfished condition. If the
stock is 1) above its MSY level in 2023 or 2) above ½ of its MSY level in 2023 and expected to be above
its MSY level in 2033 under this scenario, then the stock is not approaching an overfished condition.)
Spawning biomass, fishing mortality, and yield are tabulated for the seven standard projection scenarios
based on maximum likelihood estimates from the main assessment (Table 13-20). The difference for this
assessment for projections is in Scenario 2 (Author’s F); we use pre-specified catches to increase
accuracy of short-term projections in fisheries such as RE/BS where the catch is usually less than the
ABC. This was suggested to help management with setting preliminary ABCs and OFLs for two year
ahead specifications. The methodology for determining these pre-specified catches is described below in
Specified Catch Estimation.
Status Determination
In addition to the seven standard harvest scenarios, Amendments 48/48 to the BSAI and GOA Groundfish
Fishery Management Plans require projections of the likely OFL two years into the future. While
Scenario 6 gives the best estimate of OFL for 2022, it does not provide the best estimate of OFL for 2023,
because the mean 2022 catch under Scenario 6 is predicated on the 2022 catch being equal to the 2022
OFL, whereas the actual 2022 catch will likely be less than the 2022 OFL. The executive summary
contains the appropriate one- and two-year ahead projections for both ABC and OFL.
Under the MSFCMA, the Secretary of Commerce is required to report on the status of each U.S. fishery
with respect to overfishing. This report involves the answers to three questions: 1) Is the stock being
subjected to overfishing? 2) Is the stock currently overfished? 3) Is the stock approaching an overfished
condition?
Is the stock being subjected to overfishing? The official catch estimate for the most recent complete year
(2020) is 383 t. This is less than the 2020 OFL of 1,452 t. Therefore, the stock is not being subjected to
overfishing.
Harvest Scenarios #6 and #7 are intended to permit determination of the status of a stock with respect to
its minimum stock size threshold (MSST). Any stock that is below its MSST is defined to be overfished.
Any stock that is expected to fall below its MSST in the next two years is defined to be approaching an
overfished condition. Harvest Scenarios #6 and #7 are used in these determinations as follows:
Is the stock currently overfished? This depends on the stock’s estimated spawning biomass in 2021:
a) If spawning biomass for 2021 is estimated to be below ½ B35%, the stock is below its MSST.
b) If spawning biomass for 2021 is estimated to be above B35% the stock is above its MSST.
c) If spawning biomass for 2021 is estimated to be above ½ B35% but below B35%, the stock’s status
relative to MSST is determined by referring to harvest Scenario #6 (Table 13-20). If the mean
spawning biomass for 2031 is below B35%, the stock is below its MSST. Otherwise, the stock is
above its MSST.
Is the stock approaching an overfished condition? This is determined by referring to harvest Scenario #7:
a) If the mean spawning biomass for 2023 is below ½ B35%, the stock is approaching an overfished
condition.

b) If the mean spawning biomass for 2023 is above B35%, the stock is not approaching an overfished
condition.
c) If the mean spawning biomass for 2023 is above ½ B35% but below B35%, the determination
depends on the mean spawning biomass for 2033. If the mean spawning biomass for 2033 is
below B35%, the stock is approaching an overfished condition. Otherwise, the stock is not
approaching an overfished condition.
Based on the above criteria and Table 13-20, the stock is not currently overfished and is not approaching
an overfished condition. The F that would have produced a catch for 2020 equal to the OFL of 2020 was
0.07.
Specified Catch Estimation
In response to Gulf of Alaska Plan Team minutes in 2010, we have established a consistent methodology
for estimating current-year and future year catches in order to provide more accurate two-year projections
of ABC and OFL to management. In the past, two standard approaches in GOA rockfish models have
been employed; assume the full TAC will be taken, or use a certain date prior to publication of
assessments as a final estimate of catch for that year. Both methods have disadvantages. If the author
assumes the full TAC is taken every year, but it rarely is, the ABC will consistently be underestimated.
Conversely, if the author assumes that the catch taken by around October is the final catch, and
substantial catch is taken thereafter, ABC will consistently be overestimated. Therefore, going forward in
the Gulf of Alaska rockfish assessments, for current year catch, we are using an expansion factor to the
catch in early October by the 3-year average of catch taken between October 1 and December 31 in the
last three complete catch years (e.g. 2018-2020 for this year, see example figures below).
New data added to the projection model included updated catch data from 2020 (383 t) and new estimated
catches for 2021-2023. The 2021 catch was estimated by increasing the official catch as of 2021-10-25 by
an expansion factor of 1.03, which accounts for the average fraction of catch taken after October 25 in the
last three complete years (2018-2020). This expansion factor resulted in an estimated catch for 2021 of
384 t. To estimate future catches, we updated the yield ratio to 0.45, which was the average ratio of catch
to ABC for the last three complete catch years (2018-2020). This yield ratio was multiplied by the
projected ABCs from the updated projection model to generate catches of 356 t in 2022 and 345 t in 2023.
Alternative Projection
During the 2006 CIE review, it was suggested that projections should account for uncertainty in the entire
assessment, not just recruitment from the endpoint of the assessment. We continue to present an
alternative projection scenario using the uncertainty of the full assessment model, harvesting at the
estimated yield ratio (0.45) as in Scenario 2, except for all years instead of only the next two. This is
conservative relative to assuming max ABC or the Scenario 1 projection. This projection propagates
uncertainty throughout the entire assessment procedure and is based on an MCMC chain of 10,000,000.
The projection shows wide credibility intervals on future spawning biomass (Figure 13-21). The B35% and
B40% reference points are based on the 1980-2018 age-3 recruitments (i.e. 1977-2015 year classes). This
projection predicts that the median spawning biomass is above these reference points for the entire time
series but will steadily decrease over time. The credible intervals on this projection scenario suggests
there is a small (<5%) probability that spawning biomass is currently below the B40% reference point or
will be in the near future.
Area Allocation of Harvests
Historically, the RE/BS assessment has used an exponential (4:6:9) weighting of the last three trawl
surveys as a way to capture recent changes in biomass, but also provide stability and a buffer to
measurement error. The Plan Team and SSC requested that the random effects model recommended by

the Survey Averaging Working Group and Plan Teams be used as the default method for apportionment.
We use a two survey version of the random effects model developed for GOA shortraker (Echave and
Hulson 2019). This approach has been recommended for RE/BS apportionment by the SSC and Plan
Team.
The random effects model was fit to the trawl survey biomass estimates and relative population weights
(RPW) from the longline survey (with associated variance) for the western, central, and eastern GOA.
The random effects model estimates a process error parameter (constraining the variability of the modeled
estimates among years) and random effects parameters in each year modeled. Unlike the shortraker
assessment (Tier 5) that is attempting to produce a smoothed absolute biomass estimate, the purpose of
this model is to produce best estimates of relative proportions across areas. In this version, catchability is
not estimated and fixed at 1 for the longline survey Thus, the fits to the total abundance for each index is
relatively good, but the area estimates show a clear compromise between each index as the two surveys
are sampling a different part of the population.
Figure. Combined random effects model fits (grey lines) to survey biomass (black points) for longline
survey relative population weights (RPWs) and trawl survey biomass in the Gulf of Alaska. Shaded
regions and error bars show 95% confidence intervals for the model fits and survey biomass data,
respectively.

Figure. Random effects model fits (grey lines) to survey biomass (black points) for longline survey
relative population weights (RPWs) and trawl survey biomass by regulatory area in the Gulf of Alaska.
Shaded regions and error bars show 95% confidence intervals for the model fits and survey biomass data,
respectively.
Figure. The combined longline and trawl survey biomass as estimated by the combined random effects
model in each Gulf of Alaska regulatory area.

Figure. The time series of apportionments as estimated by the combined random effects model.
Using the random effects model estimates of biomass to determine apportionment results in 23.3% for the
western GOA, 29.9% for the central GOA, and 46.8% for the eastern GOA. This apportionment utilizes
both trawl and longline survey data to overcome sampling issues of each survey for the RE/BS rockfish
population. In general, the trawl survey samples more of the continental shelf than the longline survey due
to differences in survey design. The trawl survey also tends to catch more RE/BS rockfish in the central
GOA, while the longline survey catches more RE/BS rockfish in the eastern and western GOA. Sampling
error also differs by region and survey (Tables 13-10 and 13-13). On average there is higher sampling
error in the central GOA for the longline survey versus the trawl survey and lower sampling error in the
eastern GOA for the longline survey versus the trawl survey. The average sampling error is relatively
similar in the western GOA; however, the variability in the mean estimates is much higher in the trawl
survey versus the longline survey.
The following table shows the apportionment of ABC for the 2022 and 2023 RE/BS fishery:
Area Allocation Western GOA Central GOA Eastern GOA Total
23.3% 29.9% 46.8% 100.0%
2022 Area ABC (t) 184 235 369 788
OFL (t) 947
2023 Area ABC (t) 182 234 365 781
OFL (t) 937

Overfishing Definition
Based on the definitions for overfishing in Amendment 44 in Tier 3a (i.e., FOFL = F35%=0.046), the
overfishing level is set equal to 947 t in 2022 and 937 t in 2023 for RE/BS rockfish. The recommended
2022 OFL is 509 t less than the 2021 OFL of 1,456 t, which reflects a 35% decrease in OFL.
Should the ABC be reduced below the maximum permissible ABC?
The SSC in its December 2018 minutes recommended that all assessment authors use the risk table when
determining whether to recommend an ABC lower than the maximum permissible. The SSC also
requested the addition of a fourth column on fishery performance, which has been included in the table
below.
Assessment-
related
considerations
Population
dynamics
considerations
Environmental/ecosystem
considerations
Fishery
Performance
Level 1:
Normal
Typical to
moderately
increased
uncertainty/minor
unresolved issues
in assessment.
Stock trends are
typical for the
stock; recent
recruitment is
within normal
range.
No apparent
environmental/ecosystem
concerns
No apparent
fishery/resource-
use performance
and/or behavior
concerns
Level 2:
Substantially
increased
concerns
Substantially
increased
assessment
uncertainty/
unresolved issues.
Stock trends are
unusual; abundance
increasing or
decreasing faster
than has been seen
recently, or
recruitment pattern
is atypical.
Some indicators showing
an adverse signals
relevant to the stock but
the pattern is not
consistent across all
indicators.
Some indicators
showing adverse
signals but the
pattern is not
consistent across
all indicators
Level 3:
Major
Concern
Major problems
with the stock
assessment; very
poor fits to data;
high level of
uncertainty; strong
retrospective bias.
Stock trends are
highly unusual;
very rapid changes
in stock abundance,
or highly atypical
recruitment
patterns.
Multiple indicators
showing consistent
adverse signals a) across
the same trophic level as
the stock, and/or b) up or
down trophic levels (i.e.,
predators and prey of the
stock)
Multiple
indicators
showing
consistent
adverse signals a)
across different
sectors, and/or b)
different gear
types
Level 4:
Extreme
concern
Severe problems
with the stock
assessment; severe
retrospective bias.
Assessment
considered
unreliable.
Stock trends are
unprecedented;
More rapid changes
in stock abundance
than have ever been
seen previously, or
a very long stretch
of poor recruitment
compared to
previous patterns.
Extreme anomalies in
multiple ecosystem
indicators that are highly
likely to impact the stock;
Potential for cascading
effects on other
ecosystem components
Extreme
anomalies in
multiple
performance
indicators that are
highly likely to
impact the stock

The table is applied by evaluating the severity of four types of considerations that could be used to
support a scientific recommendation to reduce the ABC from the maximum permissible. These
considerations are stock assessment considerations, population dynamics considerations,
environmental/ecosystem considerations, and fishery performance. Examples of the types of concerns that
might be relevant include the following:
1. Assessment considerations—data-inputs: biased ages, skipped surveys, lack of fishery-
independent trend data; model fits: poor fits to fits to fishery or survey data, inability to
simultaneously fit multiple data inputs; model performance: poor model convergence, multiple
minima in the likelihood surface, parameters hitting bounds; estimation uncertainty: poorly-
estimated but influential year classes; retrospective bias in biomass estimates.
2. Population dynamics considerations—decreasing biomass trend, poor recent recruitment, inability
of the stock to rebuild, abrupt increase or decrease in stock abundance.
3. Environmental/ecosystem considerations—adverse trends in environmental/ecosystem indicators,
ecosystem model results, decreases in ecosystem productivity, decreases in prey abundance or
availability, increases or increases in predator abundance or productivity.
4. Fishery performance—fishery CPUE is showing a contrasting pattern from the stock biomass
trend, unusual spatial pattern of fishing, changes in the percent of TAC taken, changes in the
duration of fishery openings.
Assessment considerations
The current RE/BS rockfish assessment has a high retrospective bias (Mohn’s rho = 0.611), which
increased considerably since the 2019 assessment (Mohn’s rho = 0.167). This increase in retrospective
bias is explained by abrupt and synchronous declines in the trawl and longline survey indices of
abundance, which caused a subsequent shift in parameter estimates that govern population scale. Trawl
survey catchability increased from 1.7 to 2.2, longline survey catchability increased from 1.2 to nearly
1.7, and mean recruitment decreased from approximately 1.6 to 1.2 million fish (Table 13-5). As a result,
we saw a significant downgrade in biomass trajectories, recruitment, and estimates of unfished spawning
biomass for this stock.
Survey catchabilities greater than 1.0 are generally an indicator of herding, shoaling behavior, or an
unobserved expansion into unsampled areas. Herdinlg or shoaling behaviors are inconsistent with the
biology of RE/BS, though most rockfish species are known to be patchily distributed. The trawl and
longline survey indices of abundance for RE/BS have exhibited high inter-annual variability, are
frequently negatively correlated, and do not partition abundance consistently among regulatory areas. In
past assessments, this high inter-annual variability and inconsistency in the surveys has resulted in a flat,
trendless biomass trajectory, and high standard errors for catchability parameters. In 2021, synchronous
declines in both surveys provided information to the model that had substantial impacts on parameter
estimates, suggesting high uncertainty in the overall scale of the RE/BS population.
We rated the assessment-related concern as Level 2, substantially increased concerns, due to the large
changes in catchability estimates and the strong retrospective bias. This assessment is currently
transitioning authors, and consequently no model updates were recommended in this cycle. Plans to
address model and data concerns for this assessment are outlined in the Data Gaps and Research Priorities
section.
Population dynamics considerations

In 2021, there was an unprecedented drop in both the trawl and longline survey indices of abundance. As
previously described, these survey observations had impacts on the population model’s scaling
parameters, resulting in a substantial downgrade in total and spawning biomass trajectories, recruitment,
and biological reference points. However, because the survey indices are highly variable, rarely track one
another, and lack consistency among areas or by depth (Figures 13-2, 13-3, 13-4a, and 13-4b), it is
difficult to evaluate whether the recent decline in these indices are the result of sampling error or reflect a
genuine conservation concern. We determined the influence of these surveys on biomass trajectories was
best characterized as an assessment-related concern rather than a population dynamics concern. We rate
this category as Level 1, normal or unknown, and will continue to monitor catch, survey indices, and
make improvements to stabilize the assessment model. Ongoing issues related to differences in growth
and maturity between rougheye and blackspotted rockfish will be revisited in future assessments.
Environmental/Ecosystem considerations
We scored this category as level 1 (normal concern) given moderate environmental conditions, limited
and mixed information on the abundance of prey, predators, and competitors, and a lack of a mechanistic
understanding for the direct and indirect effects of environmental change on the survival and productivity
of RE/BS rockfish.
Adult RE/BS rockfish are demersal and are known from longline and trawl surveys (Zenger and Sigler
1992, Krieger and Ito 1999) and the commercial trawl fishery (Ito 1999) to inhabit particularly steep,
rocky areas of the continental slope primarily from 300 to 500 m. The post-larval rockfish period is
documented in epipelagic offshore waters of the Gulf of Alaska (GOA) (Kondzela et al. 2007). While
optimal spawning and larval survival temperature ranges are not known for RE/BS rockfish, it is
reasonable to expect that the 2021 and predicted 2022 average deeper ocean temperatures will provide
good spawning habitat and average to cooler surface temperatures contributing to good pelagic conditions
for age-0 rockfish during a time when they are growing to a size that promotes over winter survival. Sea
temperatures at the surface and at depth on the shelf were around the long-term average in 2021 (not a
marine heatwave year, Watson 2021; AFSC Bottom Trawl Survey, Laman 2021; AFSC EcoFOCI survey,
Rogers 2021; Seward Line Survey, Danielson 2021), although western GOA started the year with warmer
surface waters (satellite data; Watson 2021) and there was slightly above average warmth (5.2°C) at
200m depth along the outer edge of the shelf during the summer (AFSC Longline Survey; Siwicke 2021).
Numerous temperature time series showed signs of cooling from previous surveys (returning to average
from recent marine heatwave years 2014-2016, 2019) at the surface and at depth and 2022 surface
temperatures are predicted to continue cooling, in alignment with La Nina conditions and a negative
Pacific Decadal Oscillation. Additional epifauna habitat and rockfish distribution data show a continued
decline in sponges since 2015, particularly the Shumagin and Kodiak areas (AFSC Bottom Trawl Survey;
Palsson 2021) and no change in relative abundance of soft corals (AFSC Bottom Trawl Survey; Palsson
2021). In general, no changes have been observed over the AFSC Bottom Trawl catch time series (1989-
2021) in the distribution of rougheye rockfish catch relative to depth, temperature, or east/west position in
the GOA (AFSC Bottom Trawl Survey; Palsson 2021).
Little is known about the adult prey base but there are indications of positive foraging conditions. Primary
prey items of adult RE/BS rockfish include shrimp (especially pandalids), euphausiids, tanner crab
(Chionoecetes bairdi) and other various fish species such as myctophids (Yang and Nelson 2000, Yang
2003, Yang et al., 2006). Juvenile RE/BS rockfish in the GOA also consume a substantial amount of
smaller invertebrates such as amphipods, mysids, and isopods (Yang and Nelson 2000). Tanner crab
around Kodiak (EGOA crab status is not known) have been increasing (ADF&G trawl survey, Worton
2021). Shrimp have been increasing around Chirikof, Yakutat, and southeastern GOA regions, but
declining around Kodiak over the past 5 years (Bottom Trawl Survey; Palsson 2021). Euphausiids are
below the long-term average around Kodiak (although larger sizes are undersampled) and above the long-
term average in inside waters of Icy Strait (SEAK). Evidence of competition with sablefish is seen

through hook competition in the AFSC longline survey and increasing biomass of juvenile sablefish is
being found at deeper depths on the GOA slope (> 400 m), potentially increasing spatial overlap and
competition with RE/BS rockfish (Goethel et al. 2021). RE/BS rockfish also overlap in distribution with
shortraker rockfish, although there is no reason to suspect negative competitive impacts.
Little is known about the impacts of predators, such as fish and marine mammals, on RE/BS rockfish. In
aggregate, biomass of apex groundfish predators (largely driven by halibut, cod, arrowtooth flounder, and
sablefish) remain relatively low in the GOA, with all but sablefish below their long-term average (Bottom
Trawl Survey: Whitehouse 2021). There is no cause to suspect increased predation pressure on larval or
adult demersal shelf rockfish.
Fishery performance:
There is no directed fishing of RE/BS rockfish, and they can only be retained as “incidentally-caught.”
Catch of RE/BS rockfish fluctuates moderately by gear type and year, but trends are relatively stable by
area and catch has always remained well below the TAC. Overall, we rated the fishery performance
concern as Level 1, normal, due to the low stable catch of this non-directed fishery species that
historically has remained below the TAC.
Assessment-related
considerations
Population dynamics
considerations
Environmental/ ecosystem
considerations
Fishery Performance
considerations
Level 2: Substantially
increased concerns Level 1: Normal Level 1: Normal Level 1: Normal
Although we scored the assessment-related concerns a Level 2, we do not recommend a reduction from
maximum permissible ABC at this time.
Ecosystem Considerations
In general, a determination of ecosystem considerations for the rougheye/blackspotted rockfish complex
is hampered by the lack of biological and habitat information. A summary of the ecosystem
considerations presented in this section is listed in Table 13-22.
Ecosystem Effects on the Stock
Prey availability/abundance trends: similar to many other rockfish species, stock condition of
rougheye/blackspotted rockfish appears to be influenced by periodic abundant year classes. Availability
of suitable zooplankton prey items in sufficient quantity for larval or post-larval rockfish may be an
important determining factor of year class strength. Unfortunately, there is no information on the food
habits of larval or post-larval rockfish to help determine possible relationships between prey availability
and year class strength; moreover, identification to the species level for field collected larval RE/BS
rockfish is difficult. Visual identification is not possible though genetic techniques allow identification to
species level for larval RE/BS rockfish (Gharrett et. al 2001). Food habit studies in Alaska indicate that
the diet of RE/BS rockfish is primarily shrimp (especially pandalids) and that various fish species such as
myctophids are also consumed (Yang and Nelson 2000, Yang 2003). Juvenile RE/BS rockfish in the
GOA also consume a substantial amount of smaller invertebrates such as amphipods, mysids, and isopods
(Yang and Nelson 2000). Recent food studies show the most common prey of RE/BS as pandalid shrimp,
euphausiids, and tanner crab (Chionoecetes bairdi). Other prey include octopi and copepods (Yang et al.
2006). Little if anything is known about abundance trends of likely rockfish prey items.

Predator population trends: Rockfish are preyed on by a variety of other fish at all life stages and to
some extent marine mammals during late juvenile and adult stages. Likely predators of RE/BS rockfish
likely include halibut, Pacific cod, and sablefish. Whether the impact of any particular predator is
significant or dominant is unknown. Predator effects would likely be more important on larval, post-
larval, and small juvenile rockfish, but information on these life stages and their predators is unknown.
Changes in physical environment: Strong year classes corresponding to the period around 1976-77 have
been reported for many species of groundfish in the Gulf of Alaska, including Pacific ocean perch,
northern rockfish, sablefish, and Pacific cod. Therefore, it appears that environmental conditions may
have changed during this period in such a way that survival of young-of-the-year fish increased for many
groundfish species, including RE/BS rockfish. The environmental mechanism for this increased survival
remains unknown. Changes in water temperature and currents could have effect on prey item abundance
and success of transition of rockfish from pelagic to demersal stage. Rockfish in early juvenile stage have
been found in floating kelp patches which would be subject to ocean currents.
Anthropogenic causes of changes in physical environment: Bottom habitat changes from effect of various
fisheries could alter survival rates by altering available shelter, prey, or other functions. The Essential
Fish Habitat Environmental Impact Statement (EFH EIS) (NMFS 2005) concluded that the effects of
commercial fishing on the habitat of groundfish are minimal or temporary. The steady trend in abundance
of RE/BS rockfish suggests that at current abundance and exploitation levels, habitat effects from fishing
are not limiting this stock.
There is little information on when juvenile fish become demersal. Juvenile RE/BS rockfish 6 to 16
inches (15 to 40 cm) fork length have been frequently taken in Gulf of Alaska bottom trawl surveys,
implying the use of low relief, trawlable bottom substrates (Clausen et al. 2003). They are generally found
at shallower, more inshore areas than adults and have been taken in a variety of locations, ranging from
inshore fiords to offshore waters of the continental shelf. Studies using manned submersibles have found
that large numbers of small, juvenile rockfish are frequently associated with rocky habitat on both the
shallow and deep shelf of the GOA (Carlson and Straty 1981, Straty 1987). Another submersible study on
the GOA shelf observed juvenile red rockfish closely associated with sponges that were growing on
boulders (Freese and Wing 2004). Although these studies did not specifically identify rougheye or
blackspotted rockfish, it is reasonable to suspect that juvenile RE/BS rockfish may be among the species
that utilize this habitat as refuge during their juvenile stage.
Fishery Effects on the Ecosystem
Fishery-specific contribution to bycatch of HAPC biota: In the Gulf of Alaska, bottom trawl fisheries for
RE/BS rockfish account for very little bycatch of HAPC biota. This low bycatch may be explained by the
fact that these fish are taken as bycatch or topping off in fisheries classified as targeting other species,
thus any bycatch is attributed to other target species.
Fishery-specific concentration of target catch in space and time relative to predator needs in space and
time (if known) and relative to spawning components: Unknown
Fishery-specific effects on amount of large size target fish: Unknown
Fishery contribution to discards and offal production: Fishery discard rates during 2005-2017 have been
15-36% for the RE/BS rockfish stock complex.
Fishery-specific effects on age-at-maturity and fecundity of the target fishery: Unknown.

Fishery-specific effects on EFH living and non-living substrate: unknown, but the heavy-duty
“rockhopper” trawl gear commonly used in the fishery can move around rocks and boulders on the
bottom. Table 13-6 shows the estimated bycatch of living structure such as benthic urochordates, corals,
sponges, sea pens, and sea anemones by the GOA rockfish fisheries.
Data Gaps and Research Priorities
Future assessment priorities include updates to or analysis of (1) biological assumptions and fixed
parameters in the model (e.g., size-age transition matrix, natural mortality, growth, reproductive biology,
ageing error, etc.), (2) data weighting approaches and the model’s reliance on length composition data, (3)
assumptions related to catchability (i.e. priors, consideration of time-varying parameters), (4) refinements
to survey index data and the use of one versus two survey indices, (5) survey and fishery selectivity
assumptions, and (6) and the treatment of fishery catch and composition data, which currently combines
longline and trawl fishery data.
Literature Cited
Alaska Fisheries Science Center. 2010. Age and Growth Program maximum age encountered statistics page.
http://www.afsc.noaa.gov/REFM/Age/Stats/max_age.htm
Ackley, D. R. and J. Heifetz. 2001. Fishing practices under maximum retainable bycatch rates in Alaska’s
groundfish fisheries. Alaska Fish. Res. Bull. 8:22-44.
Arnold, L. M., W. D. Smith, P. D. Spencer., A. N. Evans, S. A. Heppell, S. S. Heppell. 2018. The role of maternal
age and context-dependent maternal effects in the offspring provisioning of a long-lived marine teleost. R.
Soc. open sci.5: 170966. http://dx.doi.org/10.1098/rsos.170966
Batten, S. 2019. Continuous Plankton Recorder in the GOA. In Zador, S., and Yasumiishi, E., 2019. Ecosystem
Status Report 2019: Gulf of Alaska, Stock Assessment and Fishery Evaluation Report, North Pacific
Fishery Management Council, 605 W 4th Ave, Suite 306, Anchorage, AK 99501.
Berkeley, S. A., C. Chapman, and S. M. Sogard. 2004. Maternal age as a determinant of larval growth and survival
in a marine fish, Sebastes melanops. Ecology 85(5):1258-1264.
Bettoli, P.W., and L.E. Miranda. 2001. Cautionary note about estimating mean length at age with subsampled data.
N. Amer. J. Fish. Man. 21:425-428.
Bobko, S.J. and S.A. Berkeley. 2004. Maturity, ovarian cycle, fecundity, and age-specific parturition of black
rockfish (Sebastes melanops). Fisheries Bulletin 102:418-429.
Byerly, Michael M. 2001. The ecology of age 1 copper rockfish (Sebastes caurinus) in vegetated habitats of Sitka
sound, Alaska. M.S. Thesis University of Alaska, Fairbanks.
Carlson, H.R. and R.R. Straty. 1981. Habitat and nursery grounds of Pacific rockfish, Sebastes spp., in rocky coastal
areas of southeastern Alaska. Marine Fisheries Review 43(7):13-19.
Chilton, D.E. and R.J. Beamish. 1982. Age determination methods for fishes studied by the groundfish program at
the Pacific Biological Station. Can. Spec. Pub. Fish. Aquat. Sci. 60.
Clausen, D.M., J.T. Fujioka, and J. Heifetz. 2003. Shortraker/rougheye and other slope rockfish. In Stock
assessment and fishery evaluation report for the groundfish resources of the GOA, p. 531-572. Council,
605 W 4th Ave, Suite 306 Anchorage, AK 99501.
Clausen, D. M., D.H. Hanselman, J.T. Fujioka, and J. Heifetz. 2004. Gulf of Alaska shortraker/rougheye and other
slope rockfish. In Stock assessment and fishery evaluation report for the groundfish resources of the Gulf of
Alaska, p. 413 – 463. North Pacific Fishery Management Council, 605 W 4th Ave, Suite 306, Anchorage
AK 99501.
Clausen, D. M., and J. T. Fujioka. 2007. Variability in trawl survey catches of Pacific ocean perch, shortraker
rockfish, and rougheye rockfish in the Gulf of Alaska. In J. Heifetz, J. Dicosimo, A. J. Gharrett, M. S.

Love, V. M. O’Connell, and R. D. Stanley (editors), Biology, assessment, and management of North
Pacific rockfishes, p. 411-428. Alaska Sea Grant, Univ. of Alaska Fairbanks.
Conrath, C. L. 2017. Maturity, spawning omission, and reproductive complexity of deepwater rockfish, Trans.
Amer. Fish. Soc., 46:3, 495-507, DOI: 10.1080/00028487.2017.1285352
Conrath, C. L. and Hulson, P. J. F. 2021. Temporal variability in the reproductive parameters of deepwater
rockfishes in the Gulf of Alaska. Fisheries Research, 237.105876.
Courtney, D.L., J. Heifetz, M. F. Sigler, and D. M. Clausen. 1999. An age structured model of northern rockfish,
Sebastes polyspinis, recruitment and biomass in the Gulf of Alaska. In Stock assessment and fishery
evaluation report for the groundfish resources of the Gulf of Alaska as projected for 2000. Pg. 361-404.
North Pacific Fishery Management Council, 605 W 4th Ave, Suite 306 Anchorage, AK 99501.
Courtney, D.L., J. N. Ianelli, D. Hanselman, and J. Heifetz. 2007. Extending statistical age-structured assessment
approaches to Gulf of Alaska rockfish (Sebastes spp.). In: Heifetz, J., DiCosimo J., Gharrett, A.J., Love,
M.S, O'Connell, V.M, and Stanley, R.D. (eds.). Biology, Assessment, and Management of North Pacific
Rockfishes. Alaska Sea Grant, University of Alaska Fairbanks. pp 429–449.
Danielson, S., and R. Hopcroft. 2021. Ocean temperature synthesis: Seward line may survey. In Ferriss, B., and
Zador, S., 2021. Ecosystem Status Report 2021: Gulf of Alaska, Stock Assessment and Fishery Evaluation
Report, North Pacific Fishery Management Council, 1007 West Third, Suite 400, Anchorage, Alaska
99501.
De Bruin, J., R. Gosden, C. Finch, and B. Leaman. 2004. Ovarian aging in two species of long-lived rockfish,
Sebastes aleutianus and S. alutus. Biol. Reprod. 71:1036-1042.
Echave, K.C., and P.J. Hulson. 2019. Assessment of the shortraker rockfish stock in the Gulf of Alaska. In Stock
assessment and fishery evaluation report for the groundfish resources of the Gulf of Alaska. North Pacific
Fishery Management Council, 605 W. 4th. Avenue, Suite 306, Anchorage, AK 99501-2252.
Echave, K., C. Rodgveller, and S.K. Shotwell. 2013. Calculation of the geographic area sizes used to create
population indices for the Alaska Fisheries Science Center longline survey. NOAA Technical
Memorandum NMFS-AFSC-253. Pp. 107
Freese, J.F., B.L. Wing. 2004. Juvenile red rockfish, Sebastes spp., associations with sponges in the Gulf of Alaska.
Mar. Fish. Rev. 65(3):38-42.
Fournier, D.A., H.J. Skaug, J. Ancheta, J. Ianelli, A. Magnusson, M.N. Maunder, A. Nielsen, and J. Sibert. 2012.
AD Model Builder: using automatic differentiation for statistical inference of highly parameterized
complex nonlinear models. Optim. Methods Software 27 (2), 233-249.
Garvin, M.R., R.W. Marcotte, K.J. Palof, R.J. Riley, L.M. Kamin, and A.J. Gharrett. 2011. Diagnostic Single-
Nucleotide Polymorphisms Identify Pacific Ocean Perch and Delineate Blackspotted and Rougheye
Rockfish. Transactions of the American Fisheries Society, 140:4, 984-988.
Gelman, A., J.B. Carlin, H.S. Stern and D.B. Rubin. 1995. Bayesian data analysis. Chapman and Hall, London. 526
pp.
Gharrett, A. J., A. K. Gray, and J. Heifetz. 2001. Identification of rockfish (Sebastes spp.) from restriction site
analysis of the mitochondrial NM-3/ND-4 and 12S/16S rRNA gene regions. Fish. Bull. Fish. Bull. 99:49-
62.
Gharrett, A.J., Z. Li, C.M. Kondzela, and A.W. Kendall. 2002. Final report: species of rockfish (Sebastes spp.)
collected during ABL-OCC cruises in the GOA in 1998-2002. (Unpubl. manuscr. available from the NMFS
Auke Bay Laboratory, 11305 Glacier Hwy., Juneau AK 99801).
Gharrett, A.J., A.P. Matala, E.L. Peterson, A.K. Gray, Z. Li, and J. Heifetz. 2005. Two genetically distinct forms of
rougheye rockfish are different species. Trans. Am. Fish. Soc. 132:242-260.
Gharrett, A.J., C.W. Mecklenburg, L.W. Seeb, L. Li, A.P. Matala, A.K. Gray, and J. Heifetz. 2006. Do genetically
distinct rougheye rockfish sibling species differ phenotypically? Trans. Am. Fish. Soc. 135:792-800.
Gharrett, A.J., A.P. Matala, E.L. Peterson, A.K. Gray, Z. Li, and J. Heifetz. 2007. Distribution and population
genetic structure of sibling rougheye rockfish species. Pages 121-140 In J. Heifetz, J. DiCosimo, A.J.
Gharrett, M.S. Love, V.M. O’Connell, and R.D. Stanley (eds.) 2007. Biology, assessment, and

management of North Pacific rockfishes. Alaska Sea Grant College Publication AK-SG-07-01, University
of Alaska Fairbanks.
Goethel, D., Hanselman, D., Shotwell, K., and Fenske, K. 2021. Assessment of the sablefish stock in Alaska. In
Stock assessment and fishery evaluation report for the groundfish resources of the Gulf of Alaska, North
Pacific Fishery Management Council, 1007 West Third, Suite 400, Anchorage, Alaska 99501.
Goodman, D., M. Mangel, G. Parkes, T.J. Quinn II, V. Restrepo, T. Smith, and K. Stokes. 2002. Scientific Review
of the Harvest Strategy Currently Used in the BSAI and GOA Groundfish Fishery Management Plans.
Draft report. North Pacific Fishery Management Council, 605 W 4th Ave, Suite 306 Anchorage, AK
99501.
Hamel, O.S., 2014. A method for calculating a meta-analytical prior for the natural mortality rate using multiple life
history correlates. ICES Journal of Marine Science, 72(1), pp.62-69.
Hanselman, D., J. Heifetz, J. Fujioka, and J. Ianelli. 2003. Pacific ocean perch. In Stock assessment and fishery
evaluation report for the groundfish resources of the Gulf of Alaska, p. 289-308. North Pacific Fishery
Management Council, 605 W. 4th. Avenue, Suite 306, Anchorage, AK 99501-2252.
Hanselman, D.H., C.R. Lunsford, and C.J. Rodgveller. 2013. Assessment of the sablefish stock in Alaska. In Stock
assessment and fishery evaluation report for the groundfish resources of the Bering Sea, Aleutian Islands
and Gulf of Alaska, p. 267-376. North Pacific Fishery Management Council, 605 W. 4th. Avenue, Suite
306, Anchorage, AK 99501-2252.
Hanselman, D.H., B. Clark, and M. Sigler. 2013. Report of the groundfish plan team retrospective investigations
group, part II: the compilation. Presented at September 2013 Plan Team, 12 pp.
http://www.afsc.noaa.gov/REFM/stocks/Plan_Team/2013/Sept/Retrospectives_2013_final3.pdf
Harris, J. P., Hutchinson, C., & Wildes, S. 2019. Using otolith morphometric analysis to improve species
discrimination of blackspotted rockfish (Sebastes melanostictus) and rougheye rockfish (S. aleutianus).
Fish. Bull. 117:234–244. DOI: 10.7755/FB.117.3.10.
Hawkins, S., J. Heifetz, J. Pohl, and R. Wilmot. 1997. Genetic population structure of rougheye rockfish (Sebastes
aleutianus) inferred from allozyme variation. In Quarterly Report, July - August - September 1997, p. 1-10.
Alaska Fisheries Science Center, 7600 Sandpoint Way, Seattle WA 98115.
Hawkins, S.L, J.H. Heifetz, C.M. Kondzela, J.E. Pohl, R.L. Wilmot, O.N. Katugin, V.N. Tuponogov. 2005. Genetic
variation of rougheye rockfish (Sebastes aleutianus) and shortraker rockfish (S. borealis) inferred from
allozymes. Fishery Bulletin. 103:524-535.
Heifetz, J., D. M. Clausen, and J. N. Ianelli. 1994. Slope rockfish. In Stock assessment and fishery evaluation
report for the 1995 Gulf of Alaska groundfish fishery, p. 5-1 - 5-24. North Pacific Fishery Management
Council, 605 W 4th Ave, Suite 306 Anchorage, AK 99501.
Hixon, M. A., Johnson, D. W. , Sogard, S. M. 2014. BOFFFFs: on the importance of conserving old-growth age
structure in fishery populations, ICES Journal of Marine Science, Volume 71, Issue 8, Pages 2171–
2185, https://doi.org/10.1093/icesjms/fst200
Hollowed, A.B., K. Aydin, K. Blackhart, M. Dorn, D. Hanselman, J. Heifetz, S. Kasperski, S. Lowe, and K.
Shotwell. 2016. Discussion paper stock assessment prioritization for the North Pacific Fishery Management
Council: Methods and Scenarios. Report to NPFMC Groundfish Plan Teams. September 2016.
https://www.npfmc.org/wp-content/PDFdocuments/meetings/AFSC-HQ_Discussion_Paper.pdf.
Hulson, P.J.F., J. Heifetz, D.H. Hanselman, S. K. Shotwell, and J. Ianelli. 2011. Assessment of the northern rockfish
stock in the Gulf of Alaska. In Stock assessment and fishery evaluation report for the groundfish fisheries
of the Gulf of Alaska. Chapter 10. North Pacific Fishery Management Council, 605 W. 4th. Avenue, Suite
306, Anchorage, AK 9950-2252.
Ianelli, J. 2003. An examination of GOA SR/RE species composition available from the NMFS catch-accounting
database. Presented at North Pacific Fishery Management Council, 605 W 4th Ave, Suite 306 Anchorage,
AK 99501.
Ito, D. H. 1999. Assessing shortraker and rougheye rockfishes in the GOA: addressing a problem of habitat
specificity and sampling capability. Ph.D. Dissertation, Univ. Washington, Seattle. 205 pp.
Jones, G.J. and J.P. Hobert. 2001. Honest exploration of intractable probability distributions via Markov Chain
Monte Carlo. Stat. Sci. 16(4): 312-334.
Jordan, D.S., and B.W. Evermann. 1898. The fishes of North and Middle America: a descriptive catalogue of the
species of fish-like vertebrates found in the waters of North America, north of the Isthmus of Panama, Part
III. Bull. U.S. Natl. Mus. 47:2183-3136.
Kondzela, C. M., A. W. Kendall, Z. Li, D. M. Clausen, and A. J. Gharrett. 2007. Preliminary identification of
pelagic juvenile rockfishes collected in the Gulf of Alaska. In J. Heifetz, J. DiCosimo, A.J. Gharrett, M.S.
Love, V.M. O’Connell, and R.D. Stanley (editors), Biology, assessment, and management of North Pacific
rockfishes, p. 153-166. Alaska Sea Grant, Univ. of Alaska Fairbanks.
Kramer, D.E., and V.M. O'Connell. 1988. A Guide to Northeast Pacific Rockfishes: Genera Sebastes and
Sebastolobus. In: Alaska Sea Grant Advisory Bulletin, 25. In National Marine Fisheries Service 2001(a).
Krieger, K. 1993. Distribution and abundance of rockfish determined from a submersible and by bottom trawling.
Fishery Bulletin 91(1):87-96.
Krieger, K.J. and D.H. Ito. 1999. Distribution and abundance of shortraker rockfish, Sebastes borealis, and rougheye
rockfish, S. aleutianus, determined from a manned submersible. Fish. Bull. 97:264-272.
Krieger, K.J. and B.L. Wing. 2002. Megafauna associations with deepwater corals (Primnoa spp.) in the GOA.
Hydrobiologia 471: 83-90.
Laman, N. 2021. Ocean temperature synthesis: Bottom trawl survey. In Ferriss, B. and Zador, S., 2021. Ecosystem
Status Report 2021: Gulf of Alaska, Stock Assessment and Fishery Evaluation Report, North Pacific
Fishery Management Council, 1007 West Third, Suite 400, Anchorage, Alaska 99501.
Leaman, B. M. 1991. Reproductive styles and life history variables relative to exploitation and management of
Sebastes stocks. Environmental Biology of Fishes 30: 253-271.
Leaman, B.M. and R.J. Beamish. 1984. Ecological and management implications of longevity in some Northeast
Pacific groundfishes. Int. North Pac. Fish. Comm. Bull. 42:85-97.
Longhurst, A., 2002. Murphy's law revisited: longevity as a factor in recruitment to fish populations. Fish. Res.
56:125-131.
Lunsford, C.R., S. K. Shotwell, P.J.F. Hulson, and D.H. Hanselman. 2011. Assessment of the northern rockfish
stock in the Gulf of Alaska. In Stock assessment and fishery evaluation report for the groundfish fisheries
of the Gulf of Alaska. Chapter 12. North Pacific Fishery Management Council, 605 W. 4th. Avenue, Suite
306, Anchorage, AK 9950-2252.
Malecha, P.W., D.H. Hanselman, and J. Heifetz. 2007. Growth and mortality of rockfishes (Scorpaenidae) from
Alaska Waters. NOAA Tech. Memo. NMFS-AFSC-172. 61 p.
Matarese, A.C., A.W. Kendall, Jr., D.M. Blood, and B.M. Vinter. 1989. Laboratory guide to early life history stages
of northeast Pacific fishes. NOAA Tech. Rep. NMFS 80, 652 p.
Matsubara, K. 1934. Studies on the scorpaenoid fishes of Japan, I. Descriptions of one new genus and five new
species. Journal of the Imperial Fisheries Institute of Tokoyo 30: 199-210. (In Japanese).
McDermott, S.F. 1994. Reproductive biology of rougheye and shortraker rockfish, Sebastes aleutianus and Sebastes
borealis. Master’s thesis. University of Washington, Seattle 76 pp.
McGilliard, C.R., Punt, A.E., Hilborn, R., and Essington, T. 2017. Modeling the impacts of two age-related portfolio
effects on recruitment variability with and without a marine reserve. Ecological Applications. Vol: 27,
Pages: 1985–2000, doi: 10.1002/eap.1593.
Methot Jr., Richard D. (editor). 2015. Prioritizing fish stock assessments. U.S. Dep. Commer., NOAA Tech. Memo.
NMFS-F/SPO-152, 31 p.
Moles. A., J. Heifetz, and D.C. Love. 1998. Metazoan parasites as potential markers for selected Gulf of Alaska
rockfishes. Fish. Bull 96: 912-916.
Munk, K.M. 2001. Maximum ages of groundfishes in waters off Alaska and British Columbia and considerations of
age determination. Alaska Fish. Res. Bull. 8(1): 12-21.
National Marine Fisheries Service. 2005. Final Environmental Impact Statement for Essential Fish Habitat
Identification and Conservation in Alaska. http://www.fakr.noaa.gov/habitat/seis/efheis.htm.

Orr, J.W. and S. Hawkins. 2008. Species of the rougheye rockfish complex: resurrection of Sebastes melanostictus
(Matsubara, 1934) and a redescription of Sebastes aleutianus (Jordan and Evermann, 1898) (Teleostei:
Scorpaeniformes). Fisheries Bulletin. 106: 111-134.
Palsson, W. 2021. Distribution of rockfish species along environmental gradients in the Gulf of Alaska bottom trawl
survey. In Ferriss, B. and Zador, S., 2021. Ecosystem Status Report 2021: Gulf of Alaska, Stock
Assessment and Fishery Evaluation Report, North Pacific Fishery Management Council, 1007 West Third,
Suite 400, Anchorage, Alaska 99501.
Palsson, W. 2021. Structural Epifauna – Gulf of Alaska. In Ferriss, B. and Zador, S., 2021. Ecosystem Status Report
2021: Gulf of Alaska, Stock Assessment and Fishery Evaluation Report, North Pacific Fishery
Management Council, 1007 West Third, Suite 400, Anchorage, Alaska 99501.
Quinn, T. J., and R. B. Deriso. 1999. Quantitative fish dynamics. Oxford University Press, New York, 542
p.Rodgveller, C. J., C. R. Lunsford, and J. T. Fujioka. 2008. Evidence of hook competition in longline
surveys. Fish. Bull. 106: 364-374.
Ressler, P.H. 2019. Gulf of Alaska Euphausiids. In: S. Zador and E. Yasumiishi (Ed.), Ecosystem
Considerations for 2019, Stock Assessment and Fishery Evaluation Report. Technical report, North Pacific
Fishery Management Council, 605 W 4th Ave, Suite 306, Anchorage, AK 99501.
Rodgveller, C.J., M.F. Sigler, D.H. Hanselman, and D.H. Ito. 2011. Sampling Efficiency of Longlines for Shortraker
and Rougheye Rockfish Using Observations from a Manned Submersible, Marine and Coastal Fisheries,
3:1, 1-9.
Rodgveller, C.J., C. Lunsford, P. Malecha, and D. Hanselman. 2011. Calculations of indices of abundance from the
Alaska Fishery Science Center’s Longline Survey. Unpublished report. 7 pp. Available online:
https://akfinbi.psmfc.org/analyticsRes/Documentation/RPN_HowTo_2011.pdf
Rogers, L., M. Wilson, and S. Porter. 2021. Ocean temperature synthesis: EcoFOCI spring survey. In Ferriss, B. and
Zador, S., 2021. Ecosystem Status Report 2021: Gulf of Alaska, Stock Assessment and Fishery Evaluation
Report, North Pacific Fishery Management Council, 1007 West Third, Suite 400, Anchorage, Alaska
99501.
Rooper, C.N. and M.H. Martin. 2012. Comparison of habitat-based indices of abundance with fishery-independent
biomass estimates from bottom trawl surveys. Fishery Bulletin 110(1): 21-35.
Schnute, J.T., R. Haigh, B.A. Krishka, and P. Starr. 2001. Pacific ocean perch assessment for the west coast of
Canada in 2001. Canadian research document 2001/138. 90 pp.
Seeb, L. W. 1986. Biochemical systematics and evolution of the Scorpaenid genus Sebastes. Ph.D. Thesis, Univ.
Washington, Seattle, WA. 177 p.
Shotwell, S.K., D. Hanselman, and D. Clausen. 2008. Assessment of rougheye and blackspotted rockfish in the Gulf
of Alaska. In Stock assessment and fishery evaluation report for the groundfish fisheries of the Gulf of
Alaska. p. 453-462. North Pacific Fishery Management Council, 605 W. 4th. Avenue, Suite 306,
Anchorage, AK 9950-2252.
Shotwell, S.K., D. Hanselman, and D. Clausen. 2009. Assessment of rougheye and blackspotted rockfish in the Gulf
of Alaska. In Stock assessment and fishery evaluation report for the groundfish fisheries of the Gulf of
Alaska. p. 993-1066. North Pacific Fishery Management Council, 605 W. 4th. Avenue, Suite 306,
Anchorage, AK 9950-2252.
Shotwell, S.K., D. Hanselman, and D. Clausen. 2010. Assessment of rougheye and blackspotted rockfish stock in
the Gulf of Alaska (Executive Summary). In Stock assessment and fishery evaluation report for the
groundfish fisheries of the Gulf of Alaska. p. 563-588. North Pacific Fishery Management Council, 605 W.
4th. Avenue, Suite 306, Anchorage, AK 9950-2252.
Shotwell, S.K., D.H. Hanselman, P.F. Hulson, and J. Heifetz. 2014a. Summary of assessment inputs for the
rougheye and blackspotted rockfish stock complex in the Gulf of Alaska. Report to the Plan Team,
September 2014. 7 pp.
Shotwell, S.K., D.H Hanselman, P.J.F. Hulson, and J. Heifetz. 2014b. Assessment of rougheye and blackspotted
rockfish stock in the Gulf of Alaska. In Stock assessment and fishery evaluation report for the groundfish
fisheries of the Gulf of Alaska. p.655-750. North Pacific Fishery Management Council, 605 W. 4th.
Avenue, Suite 306, Anchorage, AK 9950-2252.
Shotwell, S.K. and D.H Hanselman. 2019. Assessment of rougheye and blackspotted rockfish stock in the Gulf of
Alaska. In Stock assessment and fishery evaluation report for the groundfish fisheries of the Gulf of
Alaska. North Pacific Fishery Management Council, 605 W. 4th. Avenue, Suite 306, Anchorage, AK 9950-
2252.
Siwicke, K. 2021. Ocean temperature synthesis: Longline survey. In Ferriss, B. and Zador, S., 2021. Ecosystem
Status Report 2021: Gulf of Alaska, Stock Assessment and Fishery Evaluation Report, North Pacific
Fishery Management Council, 1007 West Third, Suite 400, Anchorage, Alaska 99501.
Sigler, M. F. 2000. Abundance estimation and capture of sablefish, Anoplopoma fimbria, by longline gear. Can. J.
Fish. Aquat. Sci. 57: 1270-1283.
Soderlund, E., E. Anderson, C. L. Dykstra, T. Geernaert, and A. M. Ranta. 2009. 2008 standardized stock
assessment survey. Int. Pac. Comm. Report of Assessment and Research Activities 2008 469-496.
Soh, Sung Kwon. 1998. The use of harvest refugia in the management of shortraker and rougheye rockfish
(Sebastes borealis/Sebastes aleutianus) in the Gulf of Alaska. Ph.D. Thesis – U. Wash. 194 pp.
Spencer, P., Hanselman, D. and Dorn, M. 2007. The effect of maternal age of spawning on estimation of Fmsy for
Alaska Pacific ocean perch. In: Heifetz, J., DiCosimo J., Gharrett, A.J., Love, M.S, O'Connell, V.M, and
Stanley, R.D. (eds.). Biology, Assessment, and Management of North Pacific Rockfishes. Alaska Sea
Grant, University of Alaska Fairbanks. pp 513 – 533.
Spencer, P., M. Canino, J. DiCosimo, M. Dorn, A.J. Gharrett, D. Hanselman, K. Palof, and M. Sigler. 2010.
Guidelines for determination of spatial management units for exploited populations in Alaskan groundfish
fishery management plans. 40pp.
Spencer, P., Ianelli, J. N., Palsson, W. A. 2020. Assessment of Blackspotted and Rougheye Rockfish stock complex
in the Bering Sea/Aleutian Islands. In Stock assessment and fishery evaluation report for the groundfish
fisheries of the Bering Sea/Aleutian Islands. North Pacific Fishery Management Council, 605 W. 4th.
Avenue, Suite 306, Anchorage, AK 9950-2252.
Straty, R.R. 1987. Habitat and behavior of juvenile Pacific rockfish (Sebastes spp. and Sebastolobus alascanus) off
southeastern Alaska. NOAA Symp. Ser. Undersea Res. 2(2):109-123.
Then, A.Y., Hoenig, J.M., Hall, N.G., Hewitt, D.A. and Handling editor: Ernesto Jardim, 2015. Evaluating the
predictive performance of empirical estimators of natural mortality rate using information on over 200 fish
species. ICES Journal of Marine Science, 72(1), pp.82-92.
Thorson, J. T., A. O. Shelton, E. J. Ward, and H. Skaug. 2015. Geostatistical delta-generalized linear mixed models
improve precision for estimated abundance indices for West Coast groundfishes. ICES Journal of Marine
Science. Doi: 10.1093/icesjms/fsu243.
Tsuyuki, H., and S.J. Westrheim. 1970. Analyses of the Sebastes aleutianus – S. melanostomus complex, and
description of a new scorpaenid species, Sebastes caenaematicus, in the northeast Pacific Ocean. J. Fish.
Res. Board Can. 27: 2233-2254.
Watson, J.T. and M.W. Callahan. 2021. Ocean temperature synthesis: Satellite Data and Marine Heat Waves. In
Ferriss, B. and Zador, S., 2021. Ecosystem Status Report 2021: Gulf of Alaska, Stock Assessment and
Fishery Evaluation Report, North Pacific Fishery Management Council, 1007 West Third, Suite 400,
Anchorage, Alaska 99501.
Whitehouse, A. and Aydin, K. 2021. Foraging guild biomass-Gulf of Alaska. In Ferriss, B. and Zador, S., 2021.
Ecosystem Status Report 2021: Gulf of Alaska, Stock Assessment and Fishery Evaluation Report, North
Pacific Fishery Management Council, 1007 West Third, Suite 400, Anchorage, Alaska 99501.
Yang, M.S. 2003. Food habits of the important groundfishes in the AI in 1994 and 1997. AFSC Proc.Rep 2003-07.
233 p. (Available from NMFS, AFSC, 7600 Sand Point Way NE, Seattle WA 98115).
Yang, M.S. and M.W. Nelson. 2000. Food habits of the commercially important groundfishes in the GOA in 1990,
1993, and 1996. NOAA Tech. Memo. NMFS-AFSC-112. 174 p.
Yang, M-S., K. Dodd, R. Hibpshman, and A. Whitehouse. 2006. Food habits of groundfishes in the Gulf of Alaska
in 1999 and 2001. U.S. Dep. Commer., NOAA Tech. Memo. NMFS-AFSC-164, 199 p.
Zenger, H.H., Jr. and M.F. Sigler. 1992. Relative abundance of GOA sablefish and other groundfish based on
National Marine Fisheries Service longline surveys, 1988-90. U.S. Dep. Commer., NOAA Tech. Memo.
NMFS F/NWC-216, 103 pp.

Tables
Table 13-1: Summary of available data on stock structure for GOA RE/BS rockfish.
Factor and criterion Available information
Harvest and trends
Fishing mortality
(5-year average percent of FABC)
Recent catch in the Western GOA are near FABC, and far below FABC in the
Central and Eastern GOA
Spatial concentration of fishery relative to
abundance (Fishing is focused in areas <<
management areas)
Catches are distributed similarly to survey abundance, except for a potential
nursery area in Amatuli Gully region
Population trends (Different areas show
different trend directions)
Population trend is stable for overall Gulf of Alaska, declining toward the
Western GOA, and increasing toward the Eastern GOA
Barriers and phenotypic characters
Generation time
(e.g., >10 years) The generation time is > 19 years
Physical limitations (Clear physical
inhibitors to movement)
No known physical barriers; predominant current patterns move from east to
west, potential restriction in gullies and canyons
Growth differences
(Significantly different LAA, WAA, or LW
parameters)
Significantly different growth curves and length-at-age relationships between
the Western GOA, Central GOA, and Eastern GOA.
Age/size-structure
(Significantly different size/age
compositions)
Mean length is significantly higher in WGOA, mean age is significantly
higher in WGOA
Spawning time differences (Significantly
different mean time of spawning) Unknown
Maturity-at-age/length differences
(Significantly different mean maturity-at-
age/ length)
Age at 50% maturity younger for rougheye rockfish (19.6 years) than
blackspotted rockfish (27.4 years), no genetic ID confirmation on samples
(Conrath 2017)
Time-varying maturity, fecundity, and skip-
spawning rates
No changes in maturity or fecundity rates were observed for rougheye
rockfish between 2008 and 2015, though estimated skip spawning rates were
significantly less in 2016 (22%) than 2010 (37%) (Conrath and Hulson 2021)
Morphometrics (Field identifiable
characters)
Unknown within species, hypothesized pigmentation differences between
species (Gharrett et al. 2006, Orr and Hawkins 2008)
Meristics (Minimally overlapping
differences in counts)
Unknown within species, significantly different means of dorsal spines and
gill rakers (Gharrett et al. 2006)
Otolith morpohometrics New study uses otolith morphometrics, weight, and age to accurately identify
RE/BS rockfish 86.2% and 97.3% of the time, respectively (Harris et al. 2019)
Behavior & movement
Spawning site fidelity (Spawning
individuals occur in same location
consistently)
Unknown
Mark-recapture data (Tagging data may
show limited movement)
Mark-recapture data not available, but potential to reduce barotrauma with
new pressure tanks
Natural tags (Acquired tags may show
movement smaller than management areas)
Parasite analysis shows structure by INPFC management area and between
species (Moles et al. 1998, Hawkins et al. 2005)
Genetics
Isolation by distance
(Significant regression)
No significant isolation by distance for Type I or Type II rougheye (likely
blackspotted and rougheye, respectively) (Gharrett et al. 2007)
Dispersal distance (<<Management areas) Low, but significant Fst for both types indicates some limits to dispersal
(Gharrett et al. 2007)
Pairwise genetic differences (Significant
differences between geographically distinct
collections)
Adjacency analysis suggests genetic structure on scale of INPFC management
areas for Type I (blackspotted) and potentially finer scale structure for Type II
(rougheye) (Gharrett et al. 2007)

Table 13-2. Estimated commercial catch (t) for GOA RE/BS rockfish (1977-2020), with Gulf-wide values
of acceptable biological catch (ABC) and fishing quotas (t), 1991-2020. Catch is provided through the
most recent full year estimate.
Year Catch (t) OFL ABC TAC
Total
Western
GOA
Central
GOA
Eastern
GOA
1977 1443
Catch defined as follows: 1977-
1992 from Soh (1998), 1993-2004
from observer program, 2005-
present from NMFS AKRO Catch
Accounting System via Alaska
Fisheries Information Network
(AKFIN, www.akfin.org).
ABC and TAC were
available for the
shortraker/rougheye
rockfish complex from
1991-2004 (gray
shade). Separate catch
accounting were
established for GOA
RE/BS rockfish since
2005.
1978 568
1979 645
1980 1353
1981 719
1982 569
1983 628
1984 760
1985 130
1986 438
1987 525
1988 1621
1989 2185
1990 2418
1991 350 2,000 2,000
1992 1127 1,960 1,960
1993 583 1,960 1,764
1994 579 1,960 1,960
1995 704 1,910 1,910
1996 558 1,910 1,910
1997 545 1,590 1,590
1998 665 1,590 1,590
1999 320 1,590 1,590
2000 530 1,730 1,730
2001 591 1,730 1,730
2002 273 1,620 1,620
2003 394 1,620 1,620
2004 301 1,318 1,318
2005 294 53 126 115 1,531 1,007 1,007
2006 371 58 141 172 1,180 983 983
2007 440 71 195 174 1,148 988 988
2008 382 75 190 117 1,548 1,286 1,286
2009 274 76 98 100 1,545 1,284 1,284
2010 426 89 211 126 1,568 1,302 1,302
2011 534 25 366 143 1,579 1,312 1,312
2012 564 28 369 167 1,472 1,223 1,223
2013 571 15 382 174 1,482 1,232 1,232
2014 739 25 539 175 1,497 1,244 1,244
2015 533 32 345 156 1,345 1,122 1,122
2016 642 40 488 114 1,596 1,328 1,328
2017 522 34 326 162 1,594 1,327 1,327
2018 744 80 437 227 1,735 1,444 1,444
2019 744 77 439 228 1,715 1,428 1,428
2020 383 4 185 194 1,452 1,209 1,209

Table 13-3. History of management measures with associated time series of catch, ABC, and TAC for
GOA RE/BS rockfish. Catch since 2005 is provided through the most recent full year estimate. Source:
NMFS Alaska Region (AKRO) Catch Accounting System via Alaska Fisheries Information Network
(AKFIN) database (http://www.akfin.org/).
Year Catch (t) ABC TAC Management Measures
1988 1,621 16,800 16,800
The slope rockfish assemblage, including rougheye, is one of three
management groups for Sebastes implemented by the North Pacific
Management Council. Previously, Sebastes in Alaska were managed
as “Pacific ocean perch complex” (rougheye included) or “other
rockfish”
1989 2,185 20,000 20,000
1990 2,418 17,700 17,700
1991 350 2,000 2,000 Slope assemblage split into three management subgroups with
separate ABCs and TACs: Pacific ocean perch, shortraker/rougheye
rockfish, and all other slope species
1992 1,127 1,960 1,960
1993 583 1,960 1,764
1994 579 1,960 1,960
1995 704 1,910 1,910
1996 558 1,910 1,910
1997 545 1,590 1,590
1998 665 1,590 1,590
1999 320 1,590 1,590 Eastern Gulf divided into West Yakutat and East Yakutat/Southeast
Outside and separate ABCs and TACs assigned
2000 530 1,730 1,730 Amendment 41 became effective which prohibited trawling in the
Eastern Gulf east of 140 degrees W.
2001 591 1,730 1,730
2002 273 1,620 1,620
2003 394 1,620 1,620
2004 301 1,318 1,318 Shortraker and rougheye rockfish divided into separate subgroups
and assigned individual ABCs and TACs
2005 294 1,007 1,007 Rougheye managed separately from shortraker as age structured
model accepted to determine ABC and moved to Tier 3 status
2006 371 983 983
2007 440 988 988 Amendment 68 created the Central Gulf Rockfish Pilot Project
2008 382 1,286 1,286 RE/BS formally verified as separate species so assessment called the
rougheye/blackspotted rockfish complex
2009 274 1,284 1,284
2010 426 1,302 1,302
2011 534 1,312 1,312 Rockfish Program continues from pilot initiative
2012 564 1,223 1,223
2013 571 1,232 1,232
2014 739 1,244 1,244
2015 533 1,122 1,122
2016 642 1,328 1,328
2017 522 1,327 1,327
2018 744 1,444 1,444
2019 744 1,428 1,428
2020 383 1,209 1,209

Table 13-4. Catch (t) of RE/BS rockfish as bycatch in other fisheries from 2005 - present. Other fisheries
category not included due to confidentiality (# vessels or # processors is fewer than or equal to 2). Source:
NMFS AKRO Blend/Catch Accounting System via AKFIN with catch through 10/23/2021.
Year Flatfish Halibut P. Cod Walleye
Pollock Rockfish Sablefish
2005 15 36 1 16 106 119
2006 40 46 2 23 83 179
2007 90 64 1 28 114 144
2008 57 55 9 41 104 115
2009 34 40 6 11 97 86
2010 65 43 4 30 183 101
2011 64 32 2 35 287 114
2012 122 26 4 21 219 173
2013 49 33 1 6 274 206
2014 154 31 4 22 359 170
2015 77 39 2 13 225 177
2016 91 21 3 49 351 126
2017 81 30 11 3 269 128
2018 132 39 8 9 317 239
2019 107 34 2 41 320 241
2020 87 21 0 31 89 156
2021 22 21 3 38 161 128
Average 76 36 4 25 209 153

Table 13-5. Incidental catch of FMP groundfish species caught in rockfish targeted fisheries in the Gulf of
Alaska for the previous 5 years. Conf. = Confidential data since # vessels or # processors is fewer than or
equal to 2. Source: NMFS AKRO Blend/Catch Accounting System via AKFIN with catch through
10/23/2021.
Group Name 2018 2018 2019 2020 2021 Average
Pacific Ocean Perch 19,045 22,172 22,258 22,881 24,522 22,176
Dusky Rockfish 2,192 2,691 2,151 2,061 2,662 2,351
Northern Rockfish 1,601 2,152 2,313 2,317 2,303 2,137
Arrowtooth Flounder 1,416 761 733 890 2,457 1,251
Walleye Pollock 1,061 917 686 647 1,304 923
Other Rockfish 749 992 669 522 972 781
Atka Mackerel 543 1,140 824 602 674 757
Sablefish 590 708 801 646 780 705
Pacific Cod 253 401 322 170 591 347
Shortraker Rockfish 257 269 269 225 237 251
Rougheye Rockfish 269 317 320 89 161 231
Thornyhead Rockfish 363 362 177 138 106 229
Rex Sole 112 136 117 189 96 130
Flathead Sole 80 48 40 95 131 79
Sculpin 42 65 53 30 -- 48
Deep Water Flatfish 64 66 39 19 19 41
Longnose Skate 42 46 28 24 30 34
Demersal Shelf Rockfish 40 57 56 11 5 34
Shark 38 48 62 26 22 39
Shallow Water Flatfish 12 57 34 22 26 30
Squid 22 29 -- -- -- 25
Skate, Other 22 28 26 9 18 21
Big Skate 6 6 5 5 4 5
Octopus 1 3 9 1 1 3

Table 13-6. Non-FMP species bycatch estimates in tons for Gulf of Alaska rockfish targeted fisheries
2015 - 2021. Conf. = Confidential data since # vessels or # processors is fewer than or equal to 2. Source:
NMFS AKRO Blend/Catch Accounting System via AKFIN with catch through 9/25/2021.
Species Group Name 2015 2016 2017 2018 2019 2020 2021
Benthic urochordata 0.28 0.50 0.20 0.07 0.40 0.12 0.01
Birds - Northern Fulmar 0.00 0.00 Conf. Conf. Conf. 0.00 Conf.
Birds - Shearwaters 0.00 0.00 0.00 0.00 Conf. 0.00 0.00
Bivalves Conf. Conf. 0.01 Conf. Conf. 0.00 Conf.
Bristlemouths 0.00 0.00 0.00 0.00 0.00 Conf. 0.00
Brittle star unidentified 0.05 0.03 0.60 0.01 0.02 0.01 0.05
Capelin Conf. Conf. 0.00 0.00 0.16 0.04 Conf.
Corals Bryozoans - Corals Bryozoans
Unidentified 0.70 0.90 0.47 1.36 0.88 0.17 1.72
Corals Bryozoans - Red Tree Coral Conf. 0.00 0.00 0.00 0.00 0.00 0.00
Eelpouts 0.01 0.02 0.13 0.22 0.00 0.01 Conf.
Eulachon 0.03 0.04 0.13 0.13 0.27 0.10 0.22
Giant Grenadier 903.72 451.09 5274.15 1690.57 780.80 301.74 226.73
Greenlings 8.14 5.81 3.90 4.51 9.57 3.50 3.16
Grenadier - Rattail Grenadier Unidentified 47.40 5.45 12.34 5.33 4.01 1.73 Conf.
Gunnels Conf. 0.00 0.00 0.00 0.00 0.00 0.00
Hermit crab unidentified 0.03 0.01 0.03 0.01 Conf. 0.00 0.01
Invertebrate unidentified 0.19 0.09 0.09 0.11 0.07 Conf. 0.02
Lanternfishes (myctophidae) 0.04 Conf. 0.00 Conf. 0.06 0.02 0.05
Misc crabs 0.16 0.35 1.10 0.38 0.14 0.09 0.10
Misc crustaceans Conf. 0.03 0.01 Conf. 0.20 0.07 0.06
Misc deep fish 0.00 Conf. Conf. 0.00 Conf. 0.00 0.00
Misc fish 142.01 103.11 114.15 137.36 519.93 87.03 136.82
Misc inverts (worms etc) 0.00 Conf. 0.00 0.00 0.00 Conf. 0.00
Other osmerids Conf. Conf. Conf. 0.00 Conf. 0.98 0.11
Pacific Hake Conf. Conf. Conf. 0.07 Conf. 0.03 0.00
Pacific Sand lance 0.00 0.00 0.00 0.00 0.00 0.00 Conf.
Pandalid shrimp 0.05 0.22 0.14 0.07 0.11 0.17 0.29
Polychaete unidentified 0.00 0.00 0.02 0.00 Conf. 0.00 0.00
Sculpin 0.00 0.00 0.00 0.00 0.00 0.00 20.08
Scypho jellies 1.65 8.13 0.54 0.92 8.43 3.52 2.83
Sea anemone unidentified 1.14 1.27 0.72 0.46 1.57 1.24 0.78
Sea pens whips Conf. 0.02 0.03 0.00 0.03 0.00 Conf.
Sea star 3.42 1.55 3.68 4.33 1.36 1.12 1.44
Snails 0.26 0.18 0.18 5.67 1.79 0.08 1.18
Sponge unidentified 5.45 2.88 3.21 13.66 5.88 0.52 1.22
Squid 0.00 0.00 0.00 0.00 10.87 31.80 25.60
State-managed Rockfish 47.30 13.34 24.48 52.88 46.43 53.11 10.69

Table 13-7. Prohibited Species Catch (PSC) estimates reported in tons for halibut and herring, and counts
in thousands of animals for crab and salmon, by year, for the GOA rockfish fishery. Source: NMFS
AKRO Blend/Catch Accounting System via AKFIN with catch through 9/25/2021.
Species Group
Name 2015 2016 2017 2018 2019 2020 2021 Average
Chinook Salmon 1.91 0.38 0.52 0.34 0.41 0.66 0.57 0.68
Other Salmon 0.34 0.22 0.64 0.33 0.38 0.72 1.61 0.60
Bairdi Crab 0.05 0.00 0.76 0.32 0.06 1.15 0.30 0.38
Golden K. Crab 0.02 0.02 0.21 0.32 0.22 0.06 0.11 0.14
Halibut 0.16 0.12 0.13 0.10 0.12 0.11 0.14 0.12
Blue King Crab 0 0 0 0 0 0 0 0
Herring 0 0 0 0 0 0 0 0
Opilio Crab 0 0 0 0 0 0 0 0
Red King Crab 0 0 0 0 0 0 0 0

Table 13-8. Fishery age compositions for GOA RE/BS rockfish and sample sizes by year. Pooled age 42+
includes all fish 42 and older.
Age (years) 1990 2004 2006 2008 2009 2010 2012 2014 2016
3 0.0000 0.0000 0.0000 0.0000 0.0000 0.0000 0.0000 0.0000 0.0000
4 0.0000 0.0000 0.0000 0.0000 0.0000 0.0000 0.0000 0.0000 0.0000
5 0.0000 0.0000 0.0000 0.0000 0.0000 0.0041 0.0000 0.0000 0.0000
6 0.0000 0.0000 0.0000 0.0000 0.0000 0.0000 0.0000 0.0000 0.0081
7 0.0033 0.0000 0.0000 0.0000 0.0000 0.0000 0.0000 0.0000 0.0000
8 0.0033 0.0000 0.0000 0.0034 0.0000 0.0041 0.0000 0.0000 0.0027
9 0.0266 0.0000 0.0028 0.0103 0.0000 0.0083 0.0000 0.0045 0.0000
10 0.0498 0.0049 0.0000 0.0103 0.0097 0.0041 0.0000 0.0023 0.0054
11 0.0332 0.0000 0.0000 0.0069 0.0032 0.0165 0.0000 0.0068 0.0081
12 0.0266 0.0000 0.0083 0.0069 0.0000 0.0207 0.0061 0.0045 0.0161
13 0.0166 0.0049 0.0055 0.0172 0.0162 0.0165 0.0030 0.0091 0.0054
14 0.0365 0.0049 0.0083 0.0172 0.0032 0.0289 0.0182 0.0045 0.0134
15 0.0100 0.0171 0.0193 0.0137 0.0097 0.0165 0.0030 0.0091 0.0081
16 0.0066 0.0098 0.0193 0.0241 0.0325 0.0083 0.0121 0.0363 0.0081
17 0.0166 0.0122 0.0138 0.0412 0.0195 0.0124 0.0121 0.0204 0.0242
18 0.0033 0.0073 0.0055 0.0344 0.0162 0.0248 0.0182 0.0204 0.0215
19 0.0166 0.0196 0.0110 0.0515 0.0325 0.0372 0.0030 0.0249 0.0242
20 0.0133 0.0416 0.0110 0.0928 0.0552 0.0207 0.0152 0.0363 0.0323
21 0.0133 0.0391 0.0138 0.0275 0.0260 0.0413 0.0212 0.0295 0.0242
22 0.0133 0.0440 0.0303 0.0412 0.0325 0.0248 0.0091 0.0227 0.0430
23 0.0100 0.0465 0.0331 0.0206 0.0260 0.0165 0.0364 0.0522 0.0134
24 0.0199 0.0367 0.0441 0.0206 0.0162 0.0165 0.0242 0.0204 0.0376
25 0.0199 0.0318 0.0468 0.0447 0.0519 0.0620 0.0152 0.0340 0.0403
26 0.0266 0.0171 0.0358 0.0447 0.0519 0.0165 0.0152 0.0272 0.0323
27 0.0365 0.0244 0.0331 0.0172 0.0519 0.0289 0.0212 0.0317 0.0349
28 0.0133 0.0196 0.0331 0.0412 0.0422 0.0413 0.0273 0.0317 0.0349
29 0.0498 0.0269 0.0413 0.0206 0.0357 0.0455 0.0212 0.0476 0.0296
30 0.0365 0.0196 0.0165 0.0103 0.0519 0.0207 0.0545 0.0476 0.0376
31 0.0399 0.0367 0.0275 0.0241 0.0195 0.0413 0.0545 0.0227 0.0134
32 0.0266 0.0318 0.0275 0.0275 0.0357 0.0413 0.0273 0.0431 0.0242
33 0.0399 0.0244 0.0165 0.0447 0.0195 0.0124 0.0182 0.0385 0.0349
34 0.0498 0.0244 0.0165 0.0137 0.0097 0.0124 0.0273 0.0340 0.0376
35 0.0365 0.0244 0.0138 0.0000 0.0325 0.0207 0.0152 0.0385 0.0296
36 0.0432 0.0293 0.0358 0.0103 0.0162 0.0165 0.0333 0.0227 0.0296
37 0.0299 0.0098 0.0193 0.0206 0.0130 0.0248 0.0182 0.0204 0.0081
38 0.0100 0.0342 0.0193 0.0069 0.0292 0.0165 0.0182 0.0136 0.0134
39 0.0233 0.0269 0.0083 0.0241 0.0130 0.0207 0.0212 0.0091 0.0108
40 0.0266 0.0318 0.0275 0.0137 0.0162 0.0124 0.0212 0.0136 0.0215
41 0.0166 0.0147 0.0386 0.0034 0.0195 0.0041 0.0182 0.0181 0.0134
42+ 0.1561 0.2836 0.3168 0.1924 0.1916 0.2397 0.3909 0.2018 0.2581
Sample size 301 409 363 291 308 242 330 441 372
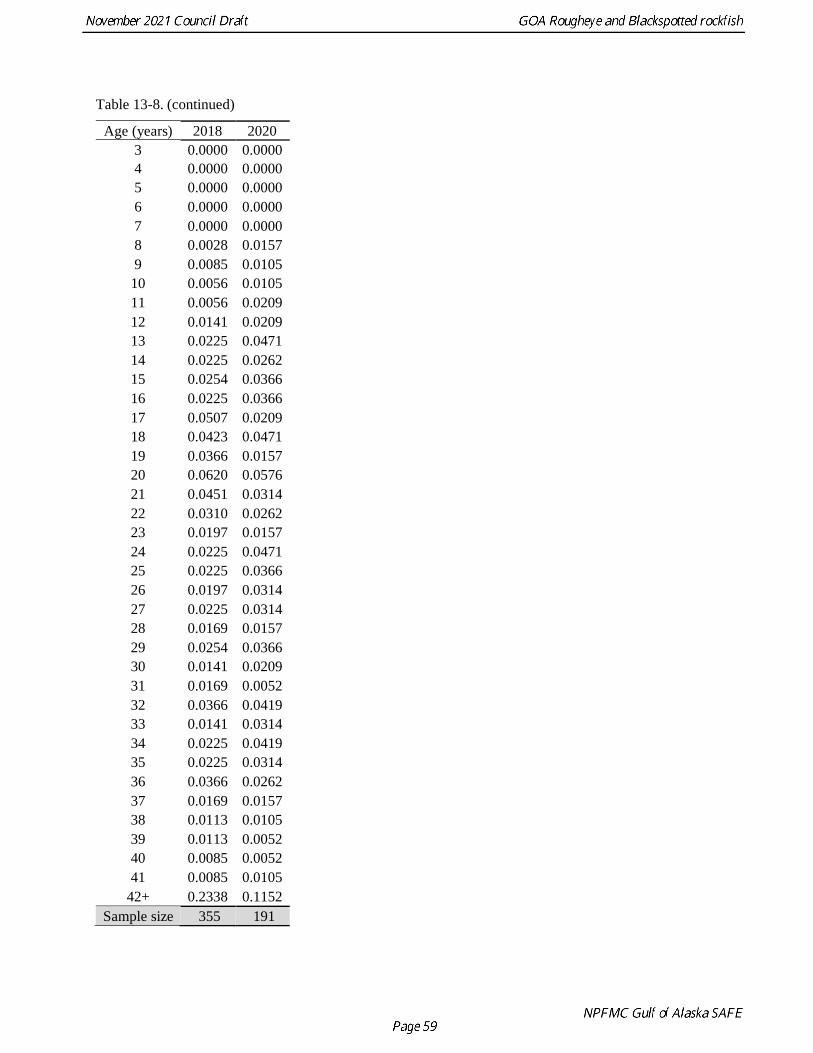
Table 13-8. (continued)
Age (years) 2018 2020
3 0.0000 0.0000
4 0.0000 0.0000
5 0.0000 0.0000
6 0.0000 0.0000
7 0.0000 0.0000
8 0.0028 0.0157
9 0.0085 0.0105
10 0.0056 0.0105
11 0.0056 0.0209
12 0.0141 0.0209
13 0.0225 0.0471
14 0.0225 0.0262
15 0.0254 0.0366
16 0.0225 0.0366
17 0.0507 0.0209
18 0.0423 0.0471
19 0.0366 0.0157
20 0.0620 0.0576
21 0.0451 0.0314
22 0.0310 0.0262
23 0.0197 0.0157
24 0.0225 0.0471
25 0.0225 0.0366
26 0.0197 0.0314
27 0.0225 0.0314
28 0.0169 0.0157
29 0.0254 0.0366
30 0.0141 0.0209
31 0.0169 0.0052
32 0.0366 0.0419
33 0.0141 0.0314
34 0.0225 0.0419
35 0.0225 0.0314
36 0.0366 0.0262
37 0.0169 0.0157
38 0.0113 0.0105
39 0.0113 0.0052
40 0.0085 0.0052
41 0.0085 0.0105
42+ 0.2338 0.1152
Sample size 355 191

Table 13-9. Fishery size compositions for GOA RE/BS rockfish and sample size by year and pooled pairs
of adjacent lengths.
Length
(cm) 1991 1992 2002 2003 2005 2007 2011 2013 2015 2017 2019
20 0.000
0
0.000
0
0.000
0
0.000
4
0.000
0
0.000
0
0.000
0
0.000
0
0.000
0
0.003
5
0.004
0 22 0.000
0
0.005
6
0.008
7
0.000
0
0.000
7
0.000
7
0.001
0
0.003
0
0.000
6
0.004
1
0.002
5 24 0.001
0
0.006
5
0.005
8
0.001
2
0.001
3
0.000
7
0.001
0
0.004
0
0.003
4
0.007
6
0.009
4 26 0.002
1
0.008
4
0.008
7
0.002
0
0.001
3
0.004
8
0.002
0
0.006
9
0.002
8
0.008
2
0.010
9 28 0.006
3
0.013
0
0.002
9
0.004
0
0.004
7
0.005
4
0.006
1
0.004
0
0.006
7
0.016
4
0.009
4 30 0.004
2
0.029
7
0.005
8
0.003
2
0.007
4
0.012
2
0.008
1
0.005
0
0.007
3
0.019
3
0.017
9 32 0.009
4
0.027
0
0.005
8
0.006
4
0.006
7
0.011
5
0.030
4
0.009
9
0.010
1
0.025
7
0.020
4 34 0.012
5
0.036
2
0.014
5
0.009
5
0.013
4
0.025
8
0.031
4
0.009
9
0.020
1
0.031
0
0.023
9 36 0.010
4
0.045
5
0.017
4
0.013
9
0.031
5
0.032
6
0.035
4
0.018
8
0.019
5
0.041
5
0.034
3 38 0.026
1
0.066
0
0.037
8
0.038
2
0.030
8
0.060
5
0.035
4
0.038
6
0.036
3
0.063
2
0.040
8 40 0.039
6
0.100
4
0.049
4
0.054
5
0.045
5
0.071
3
0.084
0
0.096
0
0.058
1
0.080
7
0.054
7 42 0.158
5
0.108
7
0.145
3
0.101
0
0.071
7
0.096
5
0.108
3
0.132
7
0.102
7
0.122
8
0.104
9 44 0.285
7
0.164
5
0.165
7
0.142
7
0.116
5
0.120
9
0.123
5
0.145
5
0.121
2
0.124
0
0.132
8 46 0.222
1
0.129
2
0.194
8
0.192
4
0.151
4
0.146
1
0.130
6
0.129
7
0.161
9
0.107
6
0.136
7 48 0.151
2
0.079
0
0.139
5
0.171
7
0.154
1
0.135
2
0.140
7
0.111
9
0.151
9
0.086
5
0.128
3 50 0.044
8
0.046
5
0.113
4
0.112
5
0.130
6
0.117
5
0.111
3
0.063
4
0.122
3
0.099
4
0.102
4 52 0.013
6
0.034
4
0.046
5
0.071
9
0.088
4
0.082
2
0.057
7
0.041
6
0.069
8
0.062
6
0.057
7 54 0.004
2
0.036
2
0.014
5
0.032
2
0.058
3
0.029
9
0.042
5
0.038
6
0.040
2
0.035
1
0.032
3 56 0.006
3
0.025
1
0.011
6
0.019
9
0.027
5
0.019
0
0.020
2
0.043
6
0.017
9
0.025
7
0.026
9 58 0.001
0
0.016
7
0.005
8
0.007
9
0.022
1
0.012
9
0.016
2
0.022
8
0.016
2
0.012
9
0.017
4 60+ 0.001
0
0.021
4
0.005
8
0.014
7
0.036
2
0.014
3
0.014
2
0.074
3
0.031
3
0.022
2
0.032
3 Sample
size
959 1077 344 2516 1493 1472 988 1010 1793 1711 2013
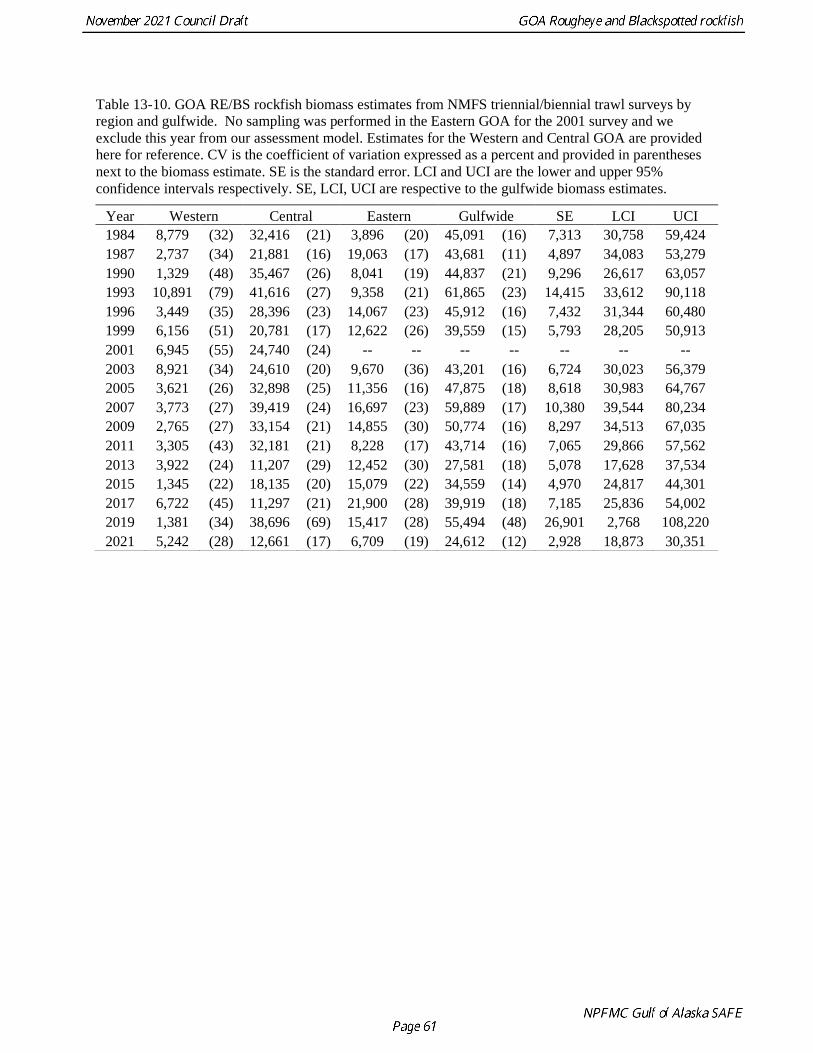
Table 13-10. GOA RE/BS rockfish biomass estimates from NMFS triennial/biennial trawl surveys by
region and gulfwide. No sampling was performed in the Eastern GOA for the 2001 survey and we
exclude this year from our assessment model. Estimates for the Western and Central GOA are provided
here for reference. CV is the coefficient of variation expressed as a percent and provided in parentheses
next to the biomass estimate. SE is the standard error. LCI and UCI are the lower and upper 95%
confidence intervals respectively. SE, LCI, UCI are respective to the gulfwide biomass estimates.
Year Western Central Eastern Gulfwide SE LCI UCI
1984 8,779 (32) 32,416 (21) 3,896 (20) 45,091 (16) 7,313 30,758 59,424
1987 2,737 (34) 21,881 (16) 19,063 (17) 43,681 (11) 4,897 34,083 53,279
1990 1,329 (48) 35,467 (26) 8,041 (19) 44,837 (21) 9,296 26,617 63,057
1993 10,891 (79) 41,616 (27) 9,358 (21) 61,865 (23) 14,415 33,612 90,118
1996 3,449 (35) 28,396 (23) 14,067 (23) 45,912 (16) 7,432 31,344 60,480
1999 6,156 (51) 20,781 (17) 12,622 (26) 39,559 (15) 5,793 28,205 50,913
2001 6,945 (55) 24,740 (24) -- -- -- -- -- -- --
2003 8,921 (34) 24,610 (20) 9,670 (36) 43,201 (16) 6,724 30,023 56,379
2005 3,621 (26) 32,898 (25) 11,356 (16) 47,875 (18) 8,618 30,983 64,767
2007 3,773 (27) 39,419 (24) 16,697 (23) 59,889 (17) 10,380 39,544 80,234
2009 2,765 (27) 33,154 (21) 14,855 (30) 50,774 (16) 8,297 34,513 67,035
2011 3,305 (43) 32,181 (21) 8,228 (17) 43,714 (16) 7,065 29,866 57,562
2013 3,922 (24) 11,207 (29) 12,452 (30) 27,581 (18) 5,078 17,628 37,534
2015 1,345 (22) 18,135 (20) 15,079 (22) 34,559 (14) 4,970 24,817 44,301
2017 6,722 (45) 11,297 (21) 21,900 (28) 39,919 (18) 7,185 25,836 54,002
2019 1,381 (34) 38,696 (69) 15,417 (28) 55,494 (48) 26,901 2,768 108,220
2021 5,242 (28) 12,661 (17) 6,709 (19) 24,612 (12) 2,928 18,873 30,351

Table 13-11. AFSC bottom trawl survey relative age compositions for GOA RE/BS rockfish since 1984.
Pooled age 42+ includes all fish 42 and older.
Age (yr) 1984 1987 1990 1993 1996 1999 2003 2005 2007
3 0.0000 0.0000 0.0011 0.0342 0.0023 0.0000 0.0285 0.0375 0.0065
4 0.0005 0.0006 0.0025 0.0122 0.0003 0.0247 0.0184 0.0468 0.0093
5 0.0000 0.0061 0.0058 0.0108 0.0204 0.0518 0.0669 0.0844 0.0331
6 0.0000 0.0652 0.0105 0.0237 0.1446 0.0251 0.0466 0.0385 0.0794
7 0.0035 0.0460 0.0395 0.0155 0.0173 0.0327 0.0275 0.0652 0.0430
8 0.0892 0.0249 0.0503 0.0211 0.0201 0.0587 0.0554 0.0510 0.0130
9 0.0338 0.0401 0.1100 0.0492 0.0321 0.1376 0.0509 0.0532 0.0465
10 0.0215 0.0533 0.1684 0.0727 0.0232 0.0505 0.0233 0.0791 0.0331
11 0.0075 0.1381 0.0918 0.0665 0.0246 0.0434 0.0203 0.0339 0.0220
12 0.0255 0.0959 0.0231 0.0898 0.0458 0.0186 0.0376 0.0504 0.0318
13 0.0100 0.0474 0.0548 0.0755 0.0410 0.0433 0.0387 0.0178 0.0481
14 0.0310 0.0445 0.0876 0.0571 0.0710 0.0442 0.0427 0.0403 0.0150
15 0.0747 0.0445 0.0285 0.0486 0.0698 0.0451 0.0136 0.0513 0.0273
16 0.0938 0.0156 0.0132 0.0633 0.0682 0.0546 0.0309 0.0327 0.0362
17 0.0400 0.0171 0.0075 0.0457 0.0517 0.0463 0.0254 0.0339 0.0411
18 0.0280 0.0149 0.0036 0.0229 0.0277 0.0565 0.0169 0.0226 0.0349
19 0.0120 0.0078 0.0206 0.0244 0.0353 0.0298 0.0195 0.0205 0.0315
20 0.0036 0.0038 0.0073 0.0242 0.0387 0.0362 0.0466 0.0315 0.0282
21 0.0094 0.0257 0.0088 0.0235 0.0212 0.0188 0.0312 0.0108 0.0308
22 0.0083 0.0070 0.0074 0.0114 0.0200 0.0192 0.0396 0.0179 0.0572
23 0.0113 0.0246 0.0098 0.0221 0.0187 0.0175 0.0396 0.0117 0.0344
24 0.0160 0.0117 0.0211 0.0098 0.0116 0.0130 0.0246 0.0116 0.0108
25 0.0272 0.0068 0.0044 0.0153 0.0094 0.0097 0.0297 0.0121 0.0197
26 0.0259 0.0070 0.0101 0.0054 0.0114 0.0055 0.0297 0.0147 0.0279
27 0.0403 0.0045 0.0000 0.0045 0.0073 0.0071 0.0173 0.0166 0.0297
28 0.0462 0.0064 0.0104 0.0113 0.0100 0.0122 0.0112 0.0068 0.0243
29 0.0369 0.0311 0.0196 0.0037 0.0058 0.0074 0.0113 0.0082 0.0103
30 0.0540 0.0253 0.0051 0.0138 0.0106 0.0070 0.0198 0.0055 0.0037
31 0.0637 0.0229 0.0174 0.0107 0.0095 0.0092 0.0122 0.0031 0.0243
32 0.0295 0.0287 0.0110 0.0105 0.0100 0.0048 0.0098 0.0083 0.0129
33 0.0198 0.0262 0.0162 0.0101 0.0141 0.0051 0.0113 0.0096 0.0025
34 0.0128 0.0103 0.0181 0.0108 0.0154 0.0080 0.0048 0.0035 0.0022
35 0.0125 0.0076 0.0204 0.0076 0.0171 0.0033 0.0076 0.0105 0.0226
36 0.0093 0.0151 0.0280 0.0174 0.0133 0.0134 0.0080 0.0089 0.0139
37 0.0067 0.0124 0.0106 0.0043 0.0052 0.0066 0.0054 0.0000 0.0155
38 0.0085 0.0070 0.0075 0.0072 0.0082 0.0034 0.0030 0.0038 0.0148
39 0.0086 0.0073 0.0067 0.0028 0.0058 0.0033 0.0008 0.0029 0.0010
40 0.0213 0.0000 0.0094 0.0128 0.0062 0.0053 0.0059 0.0000 0.0025
41 0.0148 0.0057 0.0077 0.0038 0.0059 0.0059 0.0057 0.0059 0.0112
42+ 0.0424 0.0408 0.0241 0.0237 0.0293 0.0153 0.0620 0.0369 0.0479
Sample size 369 348 194 775 701 617 488 424 435
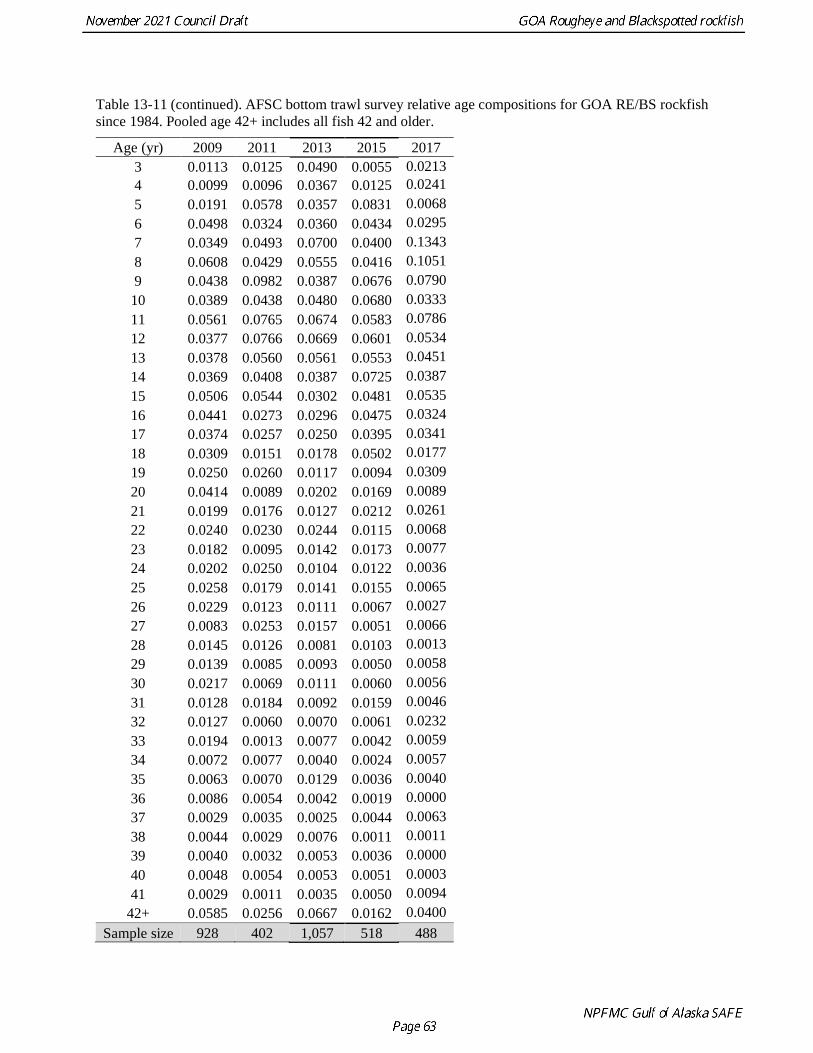
Table 13-11 (continued). AFSC bottom trawl survey relative age compositions for GOA RE/BS rockfish
since 1984. Pooled age 42+ includes all fish 42 and older.
Age (yr) 2009 2011 2013 2015 2017
3 0.0113 0.0125 0.0490 0.0055 0.0213
4 0.0099 0.0096 0.0367 0.0125 0.0241
5 0.0191 0.0578 0.0357 0.0831 0.0068
6 0.0498 0.0324 0.0360 0.0434 0.0295
7 0.0349 0.0493 0.0700 0.0400 0.1343
8 0.0608 0.0429 0.0555 0.0416 0.1051
9 0.0438 0.0982 0.0387 0.0676 0.0790
10 0.0389 0.0438 0.0480 0.0680 0.0333
11 0.0561 0.0765 0.0674 0.0583 0.0786
12 0.0377 0.0766 0.0669 0.0601 0.0534
13 0.0378 0.0560 0.0561 0.0553 0.0451
14 0.0369 0.0408 0.0387 0.0725 0.0387
15 0.0506 0.0544 0.0302 0.0481 0.0535
16 0.0441 0.0273 0.0296 0.0475 0.0324
17 0.0374 0.0257 0.0250 0.0395 0.0341
18 0.0309 0.0151 0.0178 0.0502 0.0177
19 0.0250 0.0260 0.0117 0.0094 0.0309
20 0.0414 0.0089 0.0202 0.0169 0.0089
21 0.0199 0.0176 0.0127 0.0212 0.0261
22 0.0240 0.0230 0.0244 0.0115 0.0068
23 0.0182 0.0095 0.0142 0.0173 0.0077
24 0.0202 0.0250 0.0104 0.0122 0.0036
25 0.0258 0.0179 0.0141 0.0155 0.0065
26 0.0229 0.0123 0.0111 0.0067 0.0027
27 0.0083 0.0253 0.0157 0.0051 0.0066
28 0.0145 0.0126 0.0081 0.0103 0.0013
29 0.0139 0.0085 0.0093 0.0050 0.0058
30 0.0217 0.0069 0.0111 0.0060 0.0056
31 0.0128 0.0184 0.0092 0.0159 0.0046
32 0.0127 0.0060 0.0070 0.0061 0.0232
33 0.0194 0.0013 0.0077 0.0042 0.0059
34 0.0072 0.0077 0.0040 0.0024 0.0057
35 0.0063 0.0070 0.0129 0.0036 0.0040
36 0.0086 0.0054 0.0042 0.0019 0.0000
37 0.0029 0.0035 0.0025 0.0044 0.0063
38 0.0044 0.0029 0.0076 0.0011 0.0011
39 0.0040 0.0032 0.0053 0.0036 0.0000
40 0.0048 0.0054 0.0053 0.0051 0.0003
41 0.0029 0.0011 0.0035 0.0050 0.0094
42+ 0.0585 0.0256 0.0667 0.0162 0.0400
Sample size 928 402 1,057 518 488

Table 13-12. AFSC bottom trawl survey length compositions for GOA RE/BS rockfish. Data are not
explicitly used in the model because trawl survey ages were available for most years.
Length (cm) 1984 1987 1990 1993 1996 1999 2001 2003 2005 2007
20 0.007 0.014 0.013 0.016 0.037 0.073 0.022 0.059 0.046 0.039
22 0.016 0.032 0.017 0.018 0.050 0.061 0.035 0.057 0.050 0.039
24 0.026 0.031 0.024 0.023 0.053 0.049 0.042 0.043 0.053 0.048
26 0.023 0.029 0.027 0.029 0.048 0.040 0.049 0.042 0.061 0.044
28 0.019 0.028 0.043 0.034 0.038 0.054 0.059 0.048 0.064 0.041
30 0.033 0.040 0.062 0.047 0.050 0.068 0.051 0.056 0.063 0.046
32 0.037 0.051 0.085 0.052 0.050 0.063 0.044 0.057 0.057 0.046
34 0.045 0.057 0.102 0.069 0.046 0.067 0.061 0.047 0.064 0.046
36 0.056 0.072 0.119 0.077 0.062 0.061 0.070 0.041 0.058 0.055
38 0.058 0.071 0.086 0.106 0.063 0.070 0.087 0.052 0.068 0.079
40 0.084 0.081 0.069 0.123 0.085 0.077 0.096 0.067 0.075 0.086
42 0.144 0.085 0.062 0.133 0.114 0.080 0.132 0.099 0.081 0.105
44 0.165 0.113 0.093 0.125 0.110 0.078 0.095 0.113 0.076 0.114
46 0.119 0.111 0.081 0.076 0.081 0.060 0.066 0.095 0.046 0.078
48 0.077 0.086 0.046 0.032 0.046 0.036 0.040 0.059 0.031 0.051
50 0.040 0.041 0.022 0.012 0.023 0.021 0.016 0.026 0.026 0.033
52 0.019 0.022 0.010 0.007 0.015 0.007 0.008 0.010 0.014 0.016
54 0.009 0.008 0.009 0.004 0.005 0.003 0.003 0.007 0.008 0.009
56 0.006 0.005 0.007 0.003 0.006 0.002 0.005 0.003 0.007 0.004
58 0.004 0.003 0.005 0.003 0.002 0.002 0.002 0.002 0.004 0.002
60+ 0.009 0.007 0.010 0.007 0.002 0.003 0.003 0.004 0.012 0.003
Sample size 4,701 3,994 3,522 5,639 3,943 3,758 1,959 2,924 4,089 4,253

Table 13-12 (continued). AFSC bottom trawl survey length compositions for GOA RE/BS rockfish. Data
are not explicitly used in model because trawl survey ages were available for most years.
Length (cm) 2009 2011 2013 2015 2017 2019 2021
20 0.040 0.036 0.062 0.059 0.035 0.029 0.049
22 0.054 0.050 0.050 0.062 0.031 0.034 0.065
24 0.059 0.051 0.051 0.061 0.055 0.040 0.071
26 0.068 0.059 0.050 0.050 0.082 0.053 0.069
28 0.055 0.056 0.058 0.058 0.088 0.063 0.106
30 0.059 0.069 0.044 0.052 0.061 0.045 0.094
32 0.043 0.053 0.048 0.060 0.066 0.053 0.071
34 0.042 0.062 0.055 0.071 0.073 0.054 0.071
36 0.046 0.059 0.070 0.074 0.062 0.054 0.057
38 0.052 0.063 0.083 0.083 0.074 0.067 0.068
40 0.068 0.081 0.085 0.090 0.062 0.110 0.064
42 0.079 0.097 0.082 0.076 0.069 0.163 0.067
44 0.089 0.084 0.058 0.053 0.055 0.116 0.040
46 0.087 0.059 0.061 0.046 0.058 0.055 0.027
48 0.065 0.047 0.044 0.030 0.042 0.022 0.024
50 0.040 0.025 0.037 0.018 0.027 0.013 0.013
52 0.024 0.011 0.018 0.012 0.018 0.005 0.010
54 0.009 0.010 0.008 0.009 0.005 0.004 0.005
56 0.004 0.003 0.005 0.004 0.003 0.002 0.001
58 0.003 0.002 0.002 0.004 0.003 0.003 0.002
60+ 0.002 0.005 0.002 0.006 0.012 0.004 0.004
Sample size 4,155 2,475 1,692 2,588 2,173 2,078 1,790
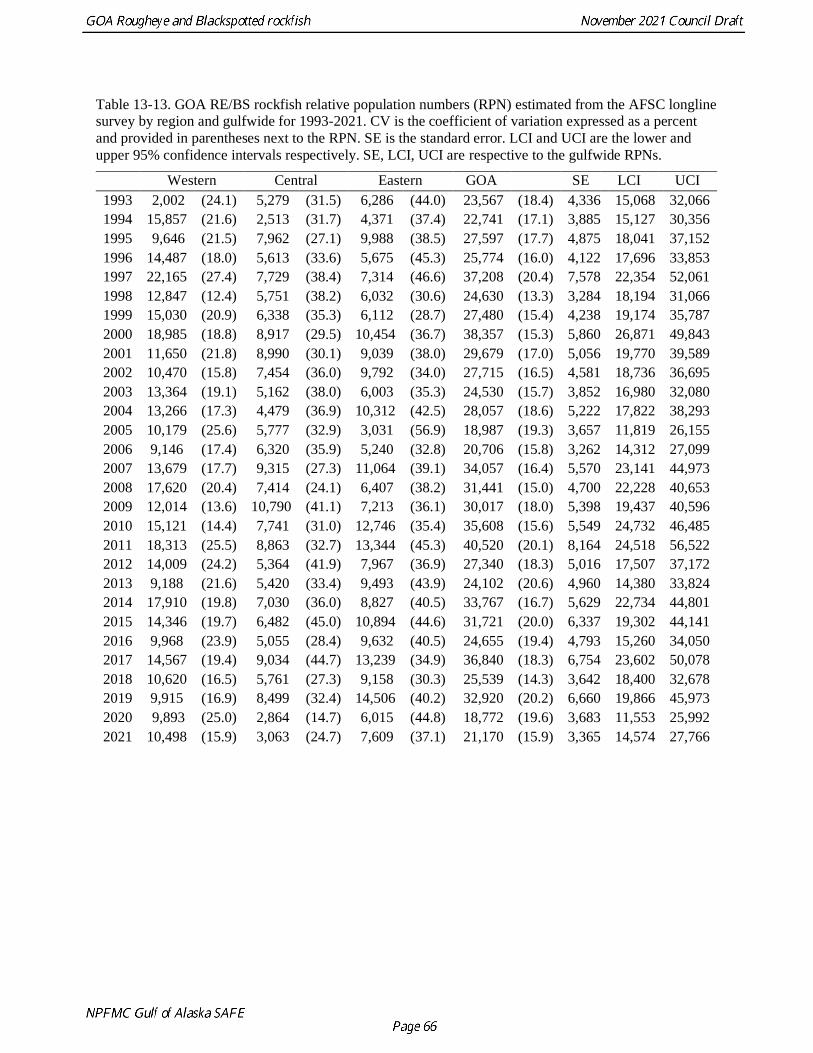
Table 13-13. GOA RE/BS rockfish relative population numbers (RPN) estimated from the AFSC longline
survey by region and gulfwide for 1993-2021. CV is the coefficient of variation expressed as a percent
and provided in parentheses next to the RPN. SE is the standard error. LCI and UCI are the lower and
upper 95% confidence intervals respectively. SE, LCI, UCI are respective to the gulfwide RPNs.
Western Central Eastern GOA SE LCI UCI
1993 2,002 (24.1) 5,279 (31.5) 6,286 (44.0) 23,567 (18.4) 4,336 15,068 32,066
1994 15,857 (21.6) 2,513 (31.7) 4,371 (37.4) 22,741 (17.1) 3,885 15,127 30,356
1995 9,646 (21.5) 7,962 (27.1) 9,988 (38.5) 27,597 (17.7) 4,875 18,041 37,152
1996 14,487 (18.0) 5,613 (33.6) 5,675 (45.3) 25,774 (16.0) 4,122 17,696 33,853
1997 22,165 (27.4) 7,729 (38.4) 7,314 (46.6) 37,208 (20.4) 7,578 22,354 52,061
1998 12,847 (12.4) 5,751 (38.2) 6,032 (30.6) 24,630 (13.3) 3,284 18,194 31,066
1999 15,030 (20.9) 6,338 (35.3) 6,112 (28.7) 27,480 (15.4) 4,238 19,174 35,787
2000 18,985 (18.8) 8,917 (29.5) 10,454 (36.7) 38,357 (15.3) 5,860 26,871 49,843
2001 11,650 (21.8) 8,990 (30.1) 9,039 (38.0) 29,679 (17.0) 5,056 19,770 39,589
2002 10,470 (15.8) 7,454 (36.0) 9,792 (34.0) 27,715 (16.5) 4,581 18,736 36,695
2003 13,364 (19.1) 5,162 (38.0) 6,003 (35.3) 24,530 (15.7) 3,852 16,980 32,080
2004 13,266 (17.3) 4,479 (36.9) 10,312 (42.5) 28,057 (18.6) 5,222 17,822 38,293
2005 10,179 (25.6) 5,777 (32.9) 3,031 (56.9) 18,987 (19.3) 3,657 11,819 26,155
2006 9,146 (17.4) 6,320 (35.9) 5,240 (32.8) 20,706 (15.8) 3,262 14,312 27,099
2007 13,679 (17.7) 9,315 (27.3) 11,064 (39.1) 34,057 (16.4) 5,570 23,141 44,973
2008 17,620 (20.4) 7,414 (24.1) 6,407 (38.2) 31,441 (15.0) 4,700 22,228 40,653
2009 12,014 (13.6) 10,790 (41.1) 7,213 (36.1) 30,017 (18.0) 5,398 19,437 40,596
2010 15,121 (14.4) 7,741 (31.0) 12,746 (35.4) 35,608 (15.6) 5,549 24,732 46,485
2011 18,313 (25.5) 8,863 (32.7) 13,344 (45.3) 40,520 (20.1) 8,164 24,518 56,522
2012 14,009 (24.2) 5,364 (41.9) 7,967 (36.9) 27,340 (18.3) 5,016 17,507 37,172
2013 9,188 (21.6) 5,420 (33.4) 9,493 (43.9) 24,102 (20.6) 4,960 14,380 33,824
2014 17,910 (19.8) 7,030 (36.0) 8,827 (40.5) 33,767 (16.7) 5,629 22,734 44,801
2015 14,346 (19.7) 6,482 (45.0) 10,894 (44.6) 31,721 (20.0) 6,337 19,302 44,141
2016 9,968 (23.9) 5,055 (28.4) 9,632 (40.5) 24,655 (19.4) 4,793 15,260 34,050
2017 14,567 (19.4) 9,034 (44.7) 13,239 (34.9) 36,840 (18.3) 6,754 23,602 50,078
2018 10,620 (16.5) 5,761 (27.3) 9,158 (30.3) 25,539 (14.3) 3,642 18,400 32,678
2019 9,915 (16.9) 8,499 (32.4) 14,506 (40.2) 32,920 (20.2) 6,660 19,866 45,973
2020 9,893 (25.0) 2,864 (14.7) 6,015 (44.8) 18,772 (19.6) 3,683 11,553 25,992
2021 10,498 (15.9) 3,063 (24.7) 7,609 (37.1) 21,170 (15.9) 3,365 14,574 27,766
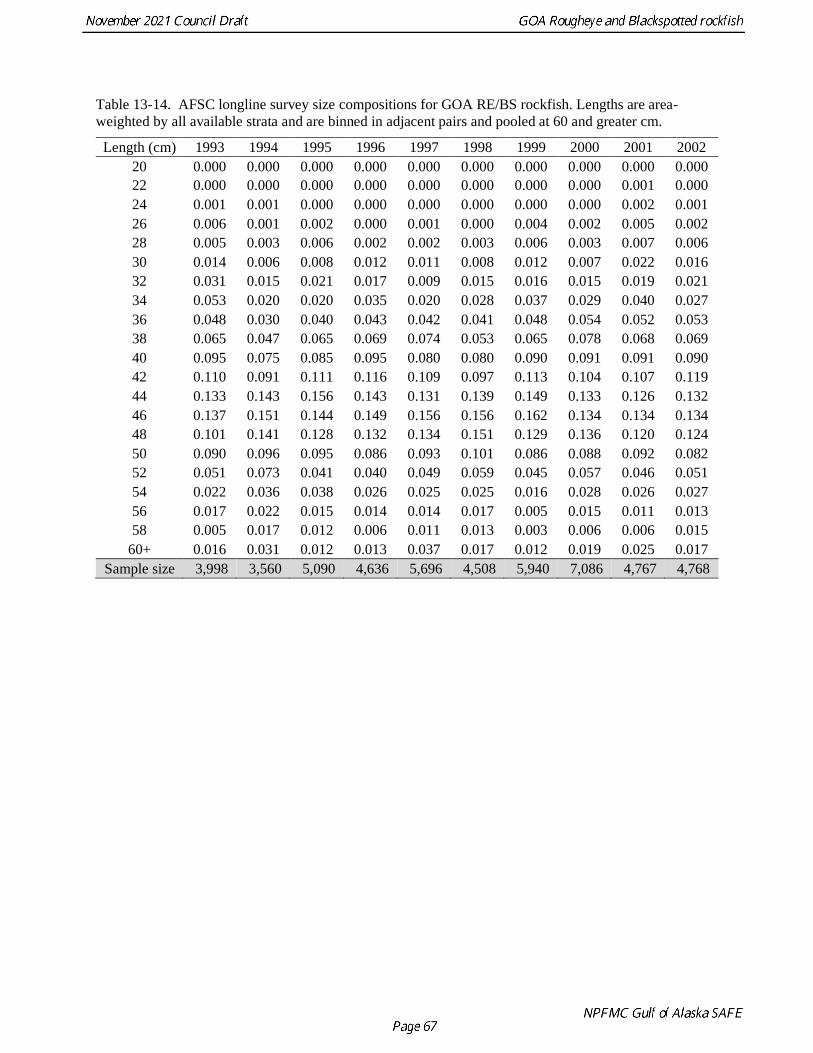
Table 13-14. AFSC longline survey size compositions for GOA RE/BS rockfish. Lengths are area-
weighted by all available strata and are binned in adjacent pairs and pooled at 60 and greater cm.
Length (cm) 1993 1994 1995 1996 1997 1998 1999 2000 2001 2002
20 0.000 0.000 0.000 0.000 0.000 0.000 0.000 0.000 0.000 0.000
22 0.000 0.000 0.000 0.000 0.000 0.000 0.000 0.000 0.001 0.000
24 0.001 0.001 0.000 0.000 0.000 0.000 0.000 0.000 0.002 0.001
26 0.006 0.001 0.002 0.000 0.001 0.000 0.004 0.002 0.005 0.002
28 0.005 0.003 0.006 0.002 0.002 0.003 0.006 0.003 0.007 0.006
30 0.014 0.006 0.008 0.012 0.011 0.008 0.012 0.007 0.022 0.016
32 0.031 0.015 0.021 0.017 0.009 0.015 0.016 0.015 0.019 0.021
34 0.053 0.020 0.020 0.035 0.020 0.028 0.037 0.029 0.040 0.027
36 0.048 0.030 0.040 0.043 0.042 0.041 0.048 0.054 0.052 0.053
38 0.065 0.047 0.065 0.069 0.074 0.053 0.065 0.078 0.068 0.069
40 0.095 0.075 0.085 0.095 0.080 0.080 0.090 0.091 0.091 0.090
42 0.110 0.091 0.111 0.116 0.109 0.097 0.113 0.104 0.107 0.119
44 0.133 0.143 0.156 0.143 0.131 0.139 0.149 0.133 0.126 0.132
46 0.137 0.151 0.144 0.149 0.156 0.156 0.162 0.134 0.134 0.134
48 0.101 0.141 0.128 0.132 0.134 0.151 0.129 0.136 0.120 0.124
50 0.090 0.096 0.095 0.086 0.093 0.101 0.086 0.088 0.092 0.082
52 0.051 0.073 0.041 0.040 0.049 0.059 0.045 0.057 0.046 0.051
54 0.022 0.036 0.038 0.026 0.025 0.025 0.016 0.028 0.026 0.027
56 0.017 0.022 0.015 0.014 0.014 0.017 0.005 0.015 0.011 0.013
58 0.005 0.017 0.012 0.006 0.011 0.013 0.003 0.006 0.006 0.015
60+ 0.016 0.031 0.012 0.013 0.037 0.017 0.012 0.019 0.025 0.017
Sample size 3,998 3,560 5,090 4,636 5,696 4,508 5,940 7,086 4,767 4,768

Table 13-14 (continued). AFSC longline survey size compositions for GOA RE/BS rockfish.
Length (cm) 2003 2004 2005 2006 2007 2008 2009 2010 2011 2012
20 0.000 0.000 0.000 0.000 0.000 0.000 0.000 0.000 0.000 0.000
22 0.000 0.000 0.000 0.000 0.000 0.001 0.000 0.001 0.001 0.000
24 0.001 0.000 0.002 0.001 0.001 0.001 0.001 0.001 0.002 0.000
26 0.001 0.004 0.006 0.003 0.003 0.003 0.002 0.006 0.004 0.002
28 0.004 0.014 0.016 0.018 0.001 0.006 0.006 0.012 0.013 0.010
30 0.014 0.024 0.032 0.017 0.014 0.021 0.020 0.025 0.028 0.019
32 0.015 0.022 0.036 0.018 0.040 0.035 0.023 0.042 0.043 0.028
34 0.016 0.037 0.041 0.023 0.044 0.054 0.039 0.055 0.057 0.039
36 0.026 0.051 0.055 0.036 0.084 0.071 0.052 0.075 0.076 0.059
38 0.059 0.094 0.066 0.051 0.069 0.074 0.084 0.078 0.093 0.082
40 0.081 0.088 0.079 0.075 0.092 0.075 0.100 0.091 0.096 0.098
42 0.110 0.106 0.105 0.113 0.111 0.102 0.120 0.112 0.116 0.111
44 0.141 0.131 0.129 0.144 0.144 0.120 0.125 0.130 0.116 0.134
46 0.165 0.143 0.134 0.152 0.133 0.125 0.116 0.121 0.099 0.127
48 0.152 0.118 0.128 0.139 0.109 0.114 0.115 0.088 0.090 0.108
50 0.087 0.079 0.068 0.084 0.063 0.087 0.078 0.060 0.061 0.074
52 0.046 0.039 0.034 0.048 0.041 0.050 0.053 0.031 0.033 0.048
54 0.018 0.020 0.022 0.027 0.016 0.026 0.026 0.017 0.019 0.025
56 0.015 0.013 0.011 0.014 0.015 0.012 0.016 0.013 0.013 0.011
58 0.011 0.006 0.009 0.016 0.005 0.011 0.007 0.009 0.008 0.006
60+ 0.038 0.010 0.027 0.022 0.015 0.013 0.015 0.034 0.030 0.020
Sample size 4,596 4,840 4,095 4,306 6,575 5,684 4,642 5,949 5,778 5,095

Table 13-14 (continued). AFSC longline survey size compositions for GOA RE/BS rockfish.
Length (cm) 2013 2014 2015 2016 2017 2018 2019 2020 2021
20 0.000 0.000 0.000 0.000 0.000 0.000 0.000 0.000 0.000
22 0.000 0.000 0.000 0.001 0.000 0.000 0.000 0.000 0.000
24 0.000 0.000 0.001 0.000 0.001 0.004 0.002 0.000 0.000
26 0.002 0.001 0.001 0.002 0.003 0.004 0.002 0.001 0.002
28 0.006 0.004 0.005 0.006 0.005 0.005 0.009 0.004 0.005
30 0.025 0.014 0.009 0.014 0.016 0.015 0.017 0.010 0.009
32 0.038 0.024 0.022 0.028 0.032 0.029 0.036 0.023 0.017
34 0.056 0.042 0.023 0.045 0.055 0.046 0.057 0.027 0.032
36 0.088 0.064 0.048 0.058 0.059 0.060 0.079 0.054 0.057
38 0.074 0.082 0.062 0.070 0.064 0.080 0.100 0.062 0.060
40 0.094 0.114 0.081 0.090 0.095 0.104 0.110 0.080 0.074
42 0.108 0.110 0.128 0.093 0.116 0.120 0.105 0.097 0.096
44 0.131 0.121 0.148 0.116 0.140 0.148 0.113 0.103 0.131
46 0.125 0.114 0.134 0.122 0.136 0.133 0.114 0.127 0.140
48 0.110 0.110 0.121 0.124 0.118 0.110 0.088 0.137 0.141
50 0.064 0.082 0.088 0.096 0.069 0.066 0.066 0.105 0.096
52 0.030 0.046 0.061 0.062 0.040 0.037 0.042 0.062 0.058
54 0.018 0.022 0.029 0.033 0.023 0.016 0.025 0.042 0.029
56 0.009 0.018 0.012 0.018 0.010 0.014 0.012 0.014 0.019
58 0.013 0.011 0.015 0.007 0.009 0.003 0.009 0.020 0.010
60+ 0.009 0.020 0.011 0.015 0.007 0.006 0.018 0.031 0.024
Sample size 3,744 6,820 5,382 4,478 6,011 5,753 5,963 4,409 4,741
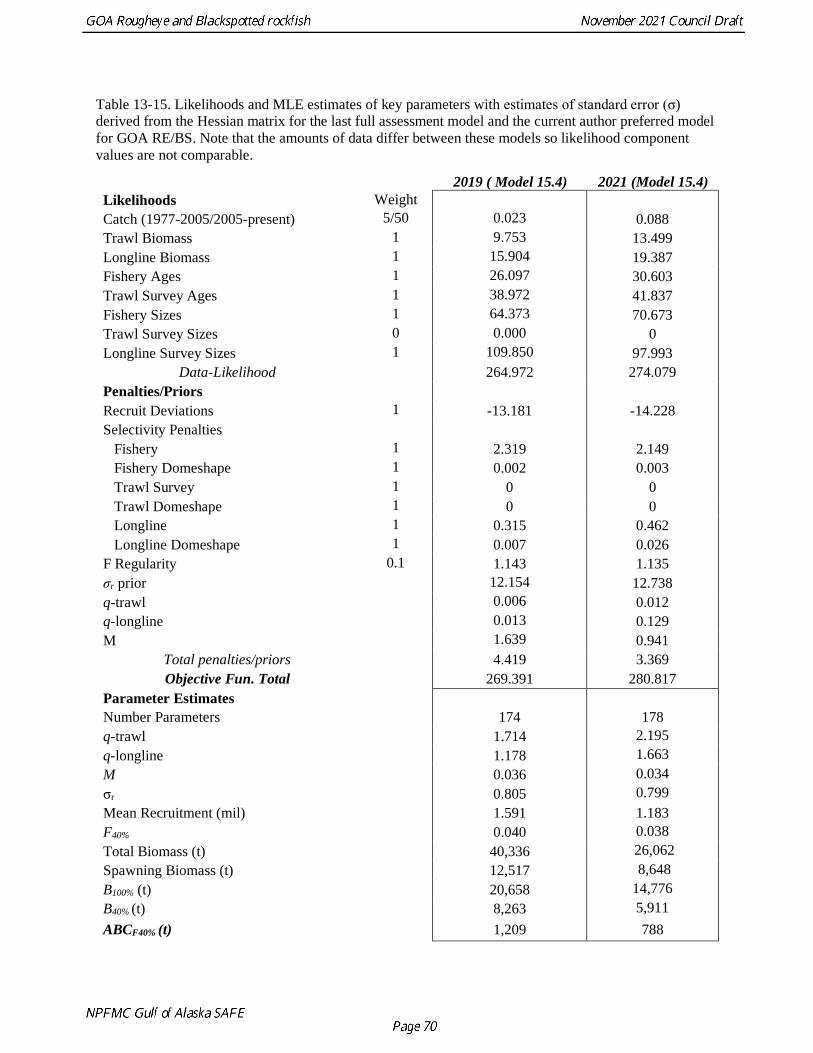
Table 13-15. Likelihoods and MLE estimates of key parameters with estimates of standard error (σ)
derived from the Hessian matrix for the last full assessment model and the current author preferred model
for GOA RE/BS. Note that the amounts of data differ between these models so likelihood component
values are not comparable.
2019 ( Model 15.4) 2021 (Model 15.4)
Likelihoods Weight
Catch (1977-2005/2005-present) 5/50 0.023 0.088
Trawl Biomass 1 9.753 13.499
Longline Biomass 1 15.904 19.387
Fishery Ages 1 26.097 30.603
Trawl Survey Ages 1 38.972 41.837
Fishery Sizes 1 64.373 70.673
Trawl Survey Sizes 0 0.000 0
Longline Survey Sizes 1 109.850 97.993
Data-Likelihood 264.972 274.079
Penalties/Priors
Recruit Deviations 1 -13.181 -14.228
Selectivity Penalties
Fishery 1 2.319 2.149
Fishery Domeshape 1 0.002 0.003
Trawl Survey 1 0 0
Trawl Domeshape 1 0 0
Longline 1 0.315 0.462
Longline Domeshape 1 0.007 0.026
F Regularity 0.1 1.143 1.135
σr prior 12.154 12.738
q-trawl 0.006 0.012
q-longline 0.013 0.129
M 1.639 0.941
Total penalties/priors 4.419 3.369
Objective Fun. Total 269.391 280.817
Parameter Estimates
Number Parameters 174 178
q-trawl 1.714 2.195
q-longline 1.178 1.663
M 0.036 0.034
σr 0.805 0.799
Mean Recruitment (mil) 1.591 1.183
F40% 0.040 0.038
Total Biomass (t) 40,336 26,062
Spawning Biomass (t) 12,517 8,648
B100% (t) 20,658 14,776
B40% (t) 8,263 5,911
ABCF40% (t) 1,209 788
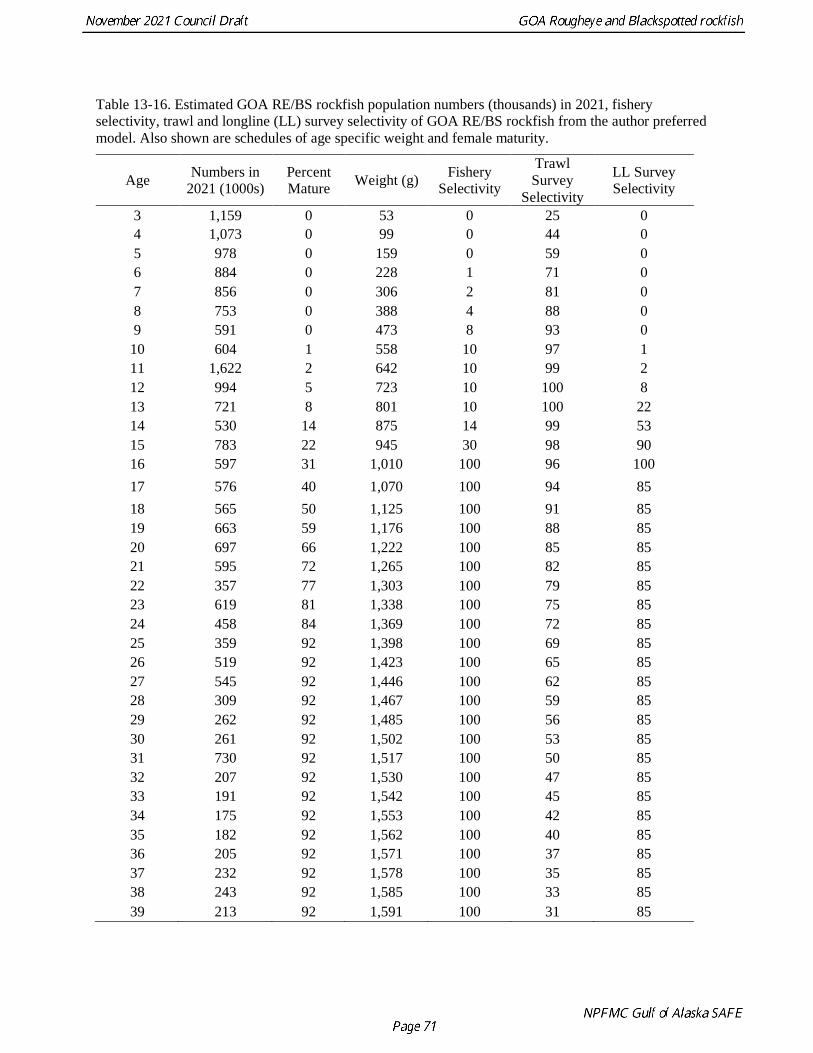
Table 13-16. Estimated GOA RE/BS rockfish population numbers (thousands) in 2021, fishery
selectivity, trawl and longline (LL) survey selectivity of GOA RE/BS rockfish from the author preferred
model. Also shown are schedules of age specific weight and female maturity.
Age Numbers in
2021 (1000s)
Percent
Mature Weight (g)
Fishery
Selectivity
Trawl
Survey
Selectivity
LL Survey
Selectivity
3 1,159 0 53 0 25 0
4 1,073 0 99 0 44 0
5 978 0 159 0 59 0
6 884 0 228 1 71 0
7 856 0 306 2 81 0
8 753 0 388 4 88 0
9 591 0 473 8 93 0
10 604 1 558 10 97 1
11 1,622 2 642 10 99 2
12 994 5 723 10 100 8
13 721 8 801 10 100 22
14 530 14 875 14 99 53
15 783 22 945 30 98 90
16 597 31 1,010 100 96 100
17 576 40 1,070 100 94 85
18 565 50 1,125 100 91 85
19 663 59 1,176 100 88 85
20 697 66 1,222 100 85 85
21 595 72 1,265 100 82 85
22 357 77 1,303 100 79 85
23 619 81 1,338 100 75 85
24 458 84 1,369 100 72 85
25 359 92 1,398 100 69 85
26 519 92 1,423 100 65 85
27 545 92 1,446 100 62 85
28 309 92 1,467 100 59 85
29 262 92 1,485 100 56 85
30 261 92 1,502 100 53 85
31 730 92 1,517 100 50 85
32 207 92 1,530 100 47 85
33 191 92 1,542 100 45 85
34 175 92 1,553 100 42 85
35 182 92 1,562 100 40 85
36 205 92 1,571 100 37 85
37 232 92 1,578 100 35 85
38 243 92 1,585 100 33 85
39 213 92 1,591 100 31 85

Table 13-16 (continued). Estimated GOA RE/BS rockfish population numbers (thousands) in 2021,
fishery selectivity, trawl and longline (LL) survey selectivity of GOA RE/BS rockfish from the author
preferred model. Also shown are schedules of age specific weight and female maturity.
Age Numbers in
2021 (1000s)
Percent
Mature Weight (g)
Fishery
Selectivity
Trawl
Survey
Selectivity
LL Survey
Selectivity
40 356 92 1,596 100 29 85
41 297 92 1,601 100 27 85
42+ 153 92 1,605 100 25 85

Table 13-17. Estimates of key parameters from the author preferred model (μ) with Hessian estimates of
standard deviation (σ), MCMC standard deviations (σ (MCMC)) and 95% Bayesian credible intervals
(BCI) derived from MCMC simulations for GOA RE/BS. q is catchability, M is natural mortality, F40% is
a fishing mortality rate (see Harvest Recommendations for complete definition), SSB is spawning stock
biomass for the current year (2021), ABC is acceptable biological catch, and σr is the recruitment
standard deviation parameter.
MCMC
Parameter Hessian MCMC Hessian MCMC Median BCI-Lower BCI-Upper
q1, trawl survey 2.1955 2.0309 0.5406 0.5298 2.0330 0.9963 3.0604
q2, longline survey 1.6630 1.7205 0.6088 0.5212 1.6788 0.7940 2.9143
M 0.0344 0.0350 0.0030 0.0033 0.0349 0.0291 0.0418
F40% 0.0381 0.0440 0.0103 0.0138 0.0416 0.0238 0.0778
SSB (2021) 8,645 10,213 2,584 4,500 9,176 5,517 21,103
ABC 788 1,088 334 677 933 411 2,628
σr 0.7994 1.0457 0.0504 0.0632 1.0433 0.9281 1.1740

Table 13-18. Estimated time series of female spawning biomass, 3+ biomass (ages 3 and greater), catch
divided by 3+ biomass, and number of age-3 recruits for GOA RE/BS rockfish. Estimates are shown for
the author preferred model (MLE approach) and from the previous full assessment.
Spawning Biomass (t) 3+ Biomass (t) Catch/3+ Biomass Age-3 Recruits (1000’s) Year Previous Current Previous Current Previous Current Previous Current
1977 18,656 15,523 52,070 43,701 0.028 0.033 1,357 1,069 1978 18,218 15,097 50,743 42,421 0.011 0.013 1,598 1,241
1979 18,124 15,010 50,264 42,108 0.013 0.015 4,313 3,379
1980 17,980 14,876 49,676 41,674 0.027 0.033 1,385 1,080
1981 17,521 14,436 48,412 40,544 0.015 0.018 1,212 918
1982 17,316 14,243 48,345 40,042 0.012 0.014 1,454 1,051
1983 17,167 14,106 47,990 39,723 0.013 0.016 2,609 1,924
1984 16,991 13,942 47,528 39,380 0.016 0.020 2,720 2,169
1985 16,756 13,722 46,953 38,894 0.003 0.003 1,627 1,225
1986 16,786 13,762 47,235 39,046 0.009 0.011 1,744 1,311
1987 16,683 13,670 47,276 38,879 0.011 0.014 1,483 1,191
1988 16,543 13,540 47,067 38,612 0.034 0.042 1,180 994
1989 15,954 12,976 45,806 37,286 0.048 0.059 997 832
1990 15,147 12,205 43,966 35,439 0.055 0.069 944 761
1991 14,283 11,376 41,888 33,412 0.008 0.011 1,005 790
1992 14,285 11,362 41,762 33,282 0.027 0.034 1,023 816
1993 14,000 11,065 40,821 32,482 0.014 0.018 3,493 2,747
1994 13,945 10,986 40,387 32,167 0.014 0.018 1,204 934
1995 13,890 10,902 39,914 31,836 0.018 0.022 1,098 889
1996 13,792 10,773 39,789 31,379 0.014 0.018 1,287 999
1997 13,759 10,708 39,460 31,096 0.014 0.018 2,366 1,679
1998 13,727 10,647 39,104 30,839 0.017 0.022 2,088 1,518
1999 13,633 10,529 38,646 30,455 0.008 0.011 1,352 994
2000 13,663 10,541 38,742 30,426 0.014 0.018 1,693 1,200
2001 13,618 10,477 38,621 30,207 0.015 0.020 2,191 1,528
2002 13,470 10,332 38,327 29,909 0.007 0.009 1,186 828
2003 13,442 10,310 38,413 29,945 0.010 0.013 2,076 1,299
2004 13,363 10,238 38,488 29,868 0.008 0.010 2,342 1,433
2005 13,345 10,223 38,488 29,888 0.008 0.010 2,100 1,286
2006 13,335 10,217 38,653 29,906 0.010 0.013 1,733 1,027
2007 13,286 10,172 38,821 29,837 0.011 0.015 1,584 978
2008 13,224 10,108 38,913 29,688 0.010 0.013 1,847 958
2009 13,192 10,072 39,015 29,597 0.007 0.009 2,542 1,205
2010 13,215 10,082 39,195 29,586 0.011 0.015 1,419 785
2011 13,187 10,034 39,266 29,414 0.014 0.018 1,922 1,030
2012 13,127 9,945 39,376 29,138 0.014 0.020 2,561 1,368
2013 13,067 9,846 39,273 28,880 0.015 0.020 4,654 2,150
2014 13,015 9,747 39,245 28,590 0.019 0.026 1,332 772
2015 12,940 9,603 39,189 28,123 0.014 0.019 1,270 729
2016 12,909 9,509 39,803 27,865 0.016 0.023 1,668 896
2017 12,854 9,370 39,814 27,493 0.013 0.019 1,781 982
2018 12,863 9,283 39,899 27,236 0.019 0.028 1,594 980
2019 12,800 9,108 39,791 26,752 0.015 0.028 1,592 1,048
2020 8,922 26,269 0.015 1,111
2021 8,685 26,161 0.015 1,159
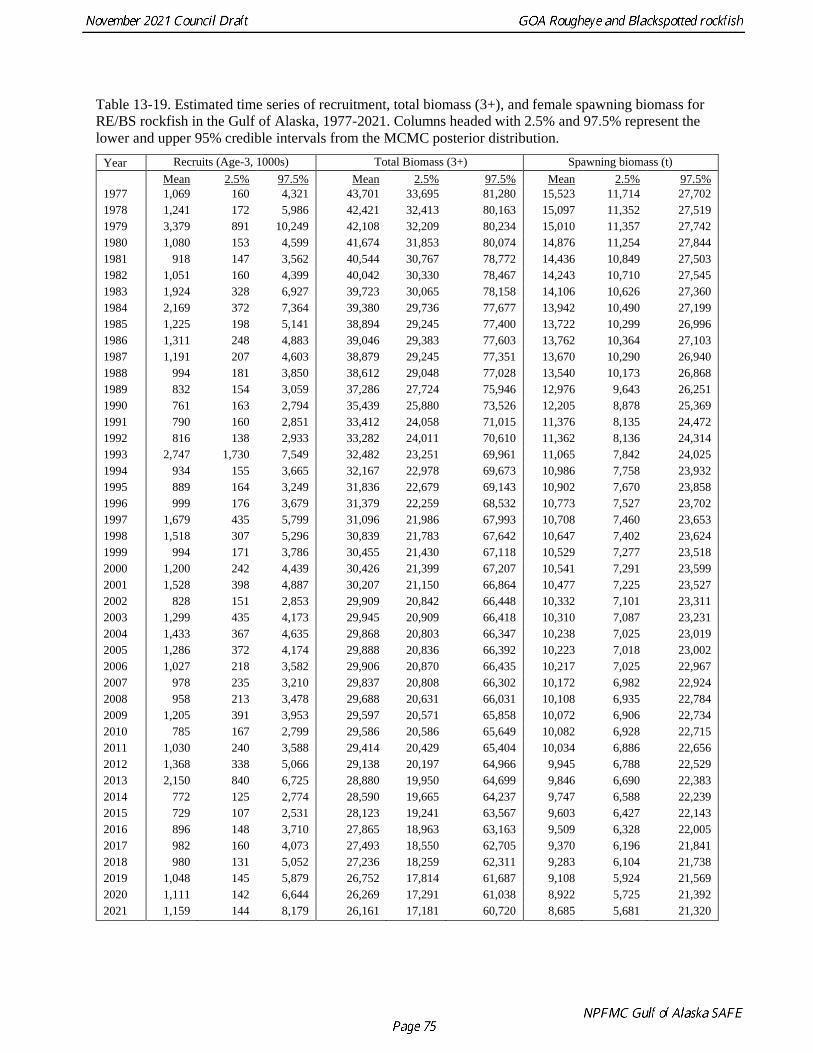
Table 13-19. Estimated time series of recruitment, total biomass (3+), and female spawning biomass for
RE/BS rockfish in the Gulf of Alaska, 1977-2021. Columns headed with 2.5% and 97.5% represent the
lower and upper 95% credible intervals from the MCMC posterior distribution.
Year Recruits (Age-3, 1000s)
Total Biomass (3+)
Spawning biomass (t)
Spawning Biomass
Mean 2.5% 97.5% Mean 2.5% 97.5% Mean 2.5% 97.5%
1977 1,069 160 4,321 43,701 33,695 81,280 15,523 11,714 27,702
1978 1,241 172 5,986 42,421 32,413 80,163 15,097 11,352 27,519
1979 3,379 891 10,249 42,108 32,209 80,234 15,010 11,357 27,742
1980 1,080 153 4,599 41,674 31,853 80,074 14,876 11,254 27,844
1981 918 147 3,562 40,544 30,767 78,772 14,436 10,849 27,503
1982 1,051 160 4,399 40,042 30,330 78,467 14,243 10,710 27,545
1983 1,924 328 6,927 39,723 30,065 78,158 14,106 10,626 27,360
1984 2,169 372 7,364 39,380 29,736 77,677 13,942 10,490 27,199
1985 1,225 198 5,141 38,894 29,245 77,400 13,722 10,299 26,996
1986 1,311 248 4,883 39,046 29,383 77,603 13,762 10,364 27,103
1987 1,191 207 4,603 38,879 29,245 77,351 13,670 10,290 26,940
1988 994 181 3,850 38,612 29,048 77,028 13,540 10,173 26,868
1989 832 154 3,059 37,286 27,724 75,946 12,976 9,643 26,251
1990 761 163 2,794 35,439 25,880 73,526 12,205 8,878 25,369
1991 790 160 2,851 33,412 24,058 71,015 11,376 8,135 24,472
1992 816 138 2,933 33,282 24,011 70,610 11,362 8,136 24,314
1993 2,747 1,730 7,549 32,482 23,251 69,961 11,065 7,842 24,025
1994 934 155 3,665 32,167 22,978 69,673 10,986 7,758 23,932
1995 889 164 3,249 31,836 22,679 69,143 10,902 7,670 23,858
1996 999 176 3,679 31,379 22,259 68,532 10,773 7,527 23,702
1997 1,679 435 5,799 31,096 21,986 67,993 10,708 7,460 23,653
1998 1,518 307 5,296 30,839 21,783 67,642 10,647 7,402 23,624
1999 994 171 3,786 30,455 21,430 67,118 10,529 7,277 23,518
2000 1,200 242 4,439 30,426 21,399 67,207 10,541 7,291 23,599
2001 1,528 398 4,887 30,207 21,150 66,864 10,477 7,225 23,527
2002 828 151 2,853 29,909 20,842 66,448 10,332 7,101 23,311
2003 1,299 435 4,173 29,945 20,909 66,418 10,310 7,087 23,231
2004 1,433 367 4,635 29,868 20,803 66,347 10,238 7,025 23,019
2005 1,286 372 4,174 29,888 20,836 66,392 10,223 7,018 23,002
2006 1,027 218 3,582 29,906 20,870 66,435 10,217 7,025 22,967
2007 978 235 3,210 29,837 20,808 66,302 10,172 6,982 22,924
2008 958 213 3,478 29,688 20,631 66,031 10,108 6,935 22,784
2009 1,205 391 3,953 29,597 20,571 65,858 10,072 6,906 22,734
2010 785 167 2,799 29,586 20,586 65,649 10,082 6,928 22,715
2011 1,030 240 3,588 29,414 20,429 65,404 10,034 6,886 22,656
2012 1,368 338 5,066 29,138 20,197 64,966 9,945 6,788 22,529
2013 2,150 840 6,725 28,880 19,950 64,699 9,846 6,690 22,383
2014 772 125 2,774 28,590 19,665 64,237 9,747 6,588 22,239
2015 729 107 2,531 28,123 19,241 63,567 9,603 6,427 22,143
2016 896 148 3,710 27,865 18,963 63,163 9,509 6,328 22,005
2017 982 160 4,073 27,493 18,550 62,705 9,370 6,196 21,841
2018 980 131 5,052 27,236 18,259 62,311 9,283 6,104 21,738
2019 1,048 145 5,879 26,752 17,814 61,687 9,108 5,924 21,569
2020 1,111 142 6,644 26,269 17,291 61,038 8,922 5,725 21,392
2021 1,159 144 8,179 26,161 17,181 60,720 8,685 5,681 21,320

Table 13-20. Set of projections of spawning biomass (SB) and yield for GOA RE/BS rockfish. Seven
harvest scenarios designed to satisfy the requirements of Amendment 56, NEPA, and MSFCMA. For a
description of scenarios see Harvest Recommendations section. Spawning biomass and yield are in t.
B40% = 5,911 t, B35% = 5,172 t, F40% = 0.038 and F35% = 0.046.
* Projections are based on an estimated catch of 383 t for 2021, and estimates of 336 t and 326 t used in place of maximum permissible ABC for
2022 and 2023 in response to a Plan Team request to obtain more accurate two-year projections. Please see section on Specified Catch Estimation subsection in the Harvest Recommendations section for more details regarding these calculations.
Year
Maximum
permissible F Author’s F*
Half maximum
F
5-year
average F No fishing Overfished
Approaching
overfished
Spawning Biomass (t)
2021 8,685 8,685 8,685 8,685 8,685 8,685 8,685
2022 8,574 8,648 8,641 8,617 8,709 8,546 8,574
2023 8,378 8,627 8,602 8,520 8,832 8,287 8,378
2024 8,185 8,527 8,558 8,421 8,948 8,036 8,159
2025 8,012 8,341 8,528 8,338 9,077 7,810 7,926
2026 7,849 8,164 8,501 8,260 9,209 7,597 7,708
2027 7,688 7,988 8,470 8,179 9,335 7,389 7,493
2028 7,527 7,812 8,432 8,094 9,451 7,185 7,284
2029 7,369 7,639 8,389 8,006 9,559 6,989 7,081
2030 7,217 7,472 8,344 7,918 9,660 6,801 6,888
2031 7,074 7,315 8,303 7,836 9,762 6,627 6,708
2032 6,938 7,164 8,258 7,754 9,854 6,462 6,538
2033 6,817 7,030 8,223 7,685 9,953 6,317 6,388
2034 6,715 6,913 8,199 7,629 10,060 6,191 6,257
Fishing Mortality
2021 0.018 0.018 0.018 0.018 0.018 0.018 0.018
2022 0.038 0.017 0.019 0.026 - 0.046 0.046
2023 0.038 0.017 0.019 0.026 - 0.046 0.046
2024 0.038 0.038 0.019 0.026 - 0.046 0.046
2025 0.038 0.038 0.019 0.026 - 0.046 0.046
2026 0.038 0.038 0.019 0.026 - 0.046 0.046
2027 0.038 0.038 0.019 0.026 - 0.046 0.046
2028 0.038 0.038 0.019 0.026 - 0.046 0.046
2029 0.038 0.038 0.019 0.026 - 0.046 0.046
2030 0.038 0.038 0.019 0.026 - 0.046 0.046
2031 0.038 0.038 0.019 0.026 - 0.046 0.046
2032 0.038 0.038 0.019 0.026 - 0.046 0.046
2033 0.038 0.038 0.019 0.026 - 0.046 0.046
2034 0.038 0.038 0.019 0.026 - 0.046 0.046
Yield (t)
2021 385 385 385 385 385 385 385
2022 788 788 398 539 - 947 788
2023 765 781 393 530 - 912 765
2024 749 779 392 524 - 886 899
2025 741 770 394 524 - 871 883
2026 741 768 400 529 - 866 877
2027 720 746 395 520 - 835 846
2028 700 724 390 510 - 806 817
2029 683 706 387 503 - 783 792
2030 669 691 384 497 - 762 771
2031 656 676 382 492 - 744 752
2032 645 664 380 487 - 728 736
2033 637 654 380 484 - 715 722
2034 630 646 379 482 - 704 711

Table 13-21. Allocation of ABC for 2022 and 2023 GOA RE/BS rockfish based on the two survey
random effects model (trawl and longline surveys). Recommended ABC and OFL in bold.
Area Allocation Western GOA Central GOA Eastern GOA Total
23.3% 29.9% 46.8% 100.0%
2022 Area ABC (t) 184 235 369 788
OFL (t) 947
2023 Area ABC (t) 182 234 365 781
OFL (t) 937

Table 13-22: Analysis of ecosystem considerations for GOA RE/BS rockfish.
Ecosystem effects on GOA rougheye rockfish
Indicator Observation Interpretation Evaluation
Prey availability or abundance trends
Phytoplankton and
Zooplankton
Important for larval and post-
larval survival but no
information known
May help determine year class
strength, no time series
Possible concern if some
information available
Predator population trends
Marine mammals
Not commonly eaten by marine
mammals No effect No concern
Birds
Stable, some increasing some
decreasing Affects young-of-year mortality Probably no concern
Fish (Halibut, arrowtooth,
lingcod)
Arrowtooth have increased,
others stable
More predation on juvenile
rockfish Possible concern
Changes in habitat quality
Temperature regime
Higher recruitment after 1977
regime shift
Contributed to rapid stock
recovery No concern
Winter-spring
environmental conditions Affects pre-recruit survival
Different phytoplankton bloom
timing
Causes natural variability,
rockfish have varying larval
release to compensate
Production
Relaxed downwelling in
summer brings in nutrients to
Gulf shelf
Some years are highly variable
like El Nino 1998
Probably no concern,
contributes to high variability
of rockfish recruitment
GOA rougheye rockfish fishery effects on ecosystem
Indicator Observation Interpretation Evaluation
Fishery contribution to bycatch
Prohibited species Stable, heavily monitored Minor contribution to mortality No concern
Forage (including herring,
Atka mackerel, cod, and
pollock)
Stable, heavily monitored (P.
cod most common)
Bycatch levels small relative to
forage biomass No concern
HAPC biota
Medium bycatch levels of
sponge and corals
Bycatch levels small relative to
total HAPC biota, but can be
large in specific areas Probably no concern
Marine mammals and birds
Very minor take of marine
mammals, trawlers overall
cause some bird mortality
Rockfish fishery is short
compared to other fisheries No concern
Sensitive non-target
species
Likely minor impact on non-
target rockfish
Data limited, likely to be
harvested in proportion to their
abundance Probably no concern
Fishery concentration in space
and time
Duration is short and in patchy
areas
Not a major prey species for
marine mammals
No concern, fishery is being
extended for several month
starting 2006
Fishery effects on amount of
large size target fish
Depends on highly variable
year-class strength Natural fluctuation Probably no concern
Fishery contribution to discards
and offal production Decreasing Improving, but data limited
Possible concern with non-
target rockfish
Fishery effects on age-at-
maturity and fecundity
Black rockfish show older fish
have more viable larvae
Inshore rockfish results may not
apply to longer-lived slope
rockfish
Definite concern, studies
being initiated in 2005

Figures
Figure 13-1. Estimated long-term (a) and short-term (b) commercial catches for Gulf of Alaska RE/BS
rockfish. Solid line is observed catch and red dashed line (in a only) is predicted catch from the author
preferred model.
(a)
(b)

Figure 13-2. AFSC bottom trawl survey observed biomass estimates (blue triangles) with 95% sampling
error confidence intervals for GOA RE/BS rockfish. Predicted estimates from the author preferred model
(dashed black line) are compared with the last full assessment model fit (dotted blue line).
Figure 13-3. AFSC longline survey relative population numbers (RPN in thousands, red circles) with 95%
sampling error confidence intervals for GOA RE/BS rockfish. Predicted estimates from the author
preferred model (dashed black line) are compared with the last full assessment model fit (dotted blue
line).
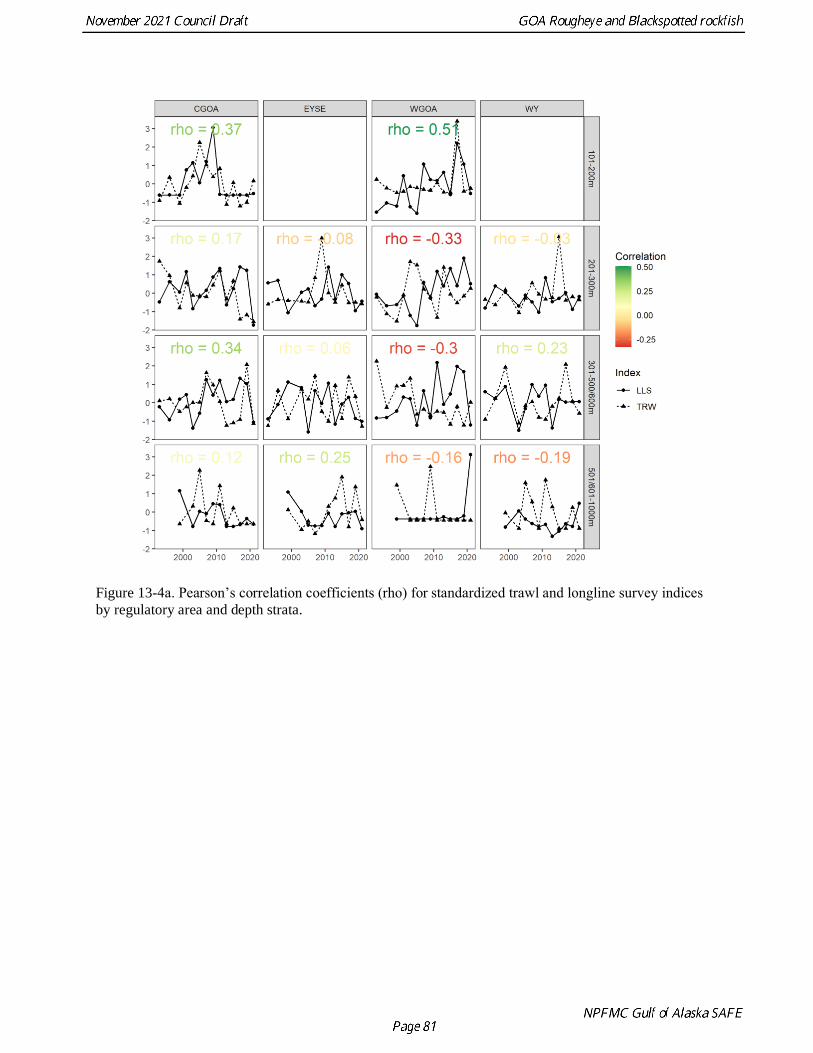
Figure 13-4a. Pearson’s correlation coefficients (rho) for standardized trawl and longline survey indices
by regulatory area and depth strata.
1022

Figure 13-4b. Relative population numbers from the AFSC longline survey (LLS) and trawl survey
biomass estimates (TRW) by regulatory area and depth strata.
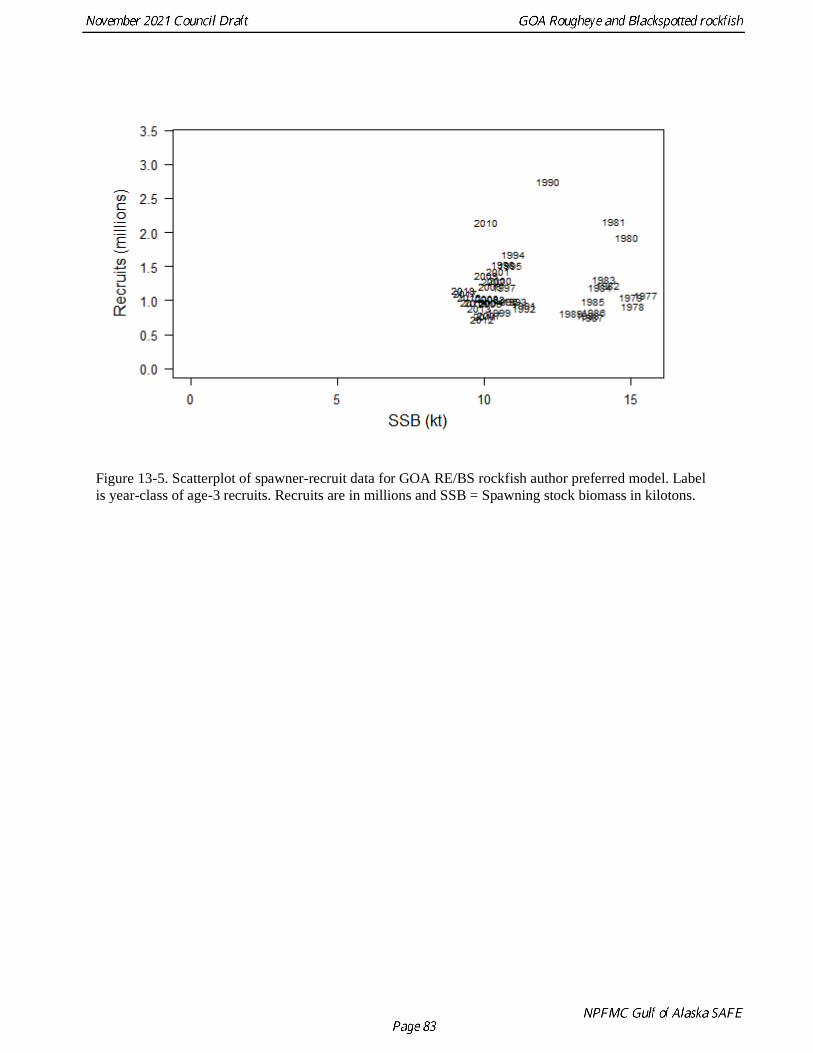
Figure 13-5. Scatterplot of spawner-recruit data for GOA RE/BS rockfish author preferred model. Label
is year-class of age-3 recruits. Recruits are in millions and SSB = Spawning stock biomass in kilotons.

Figure 13-6. Prior distribution for natural mortality (M, μ=0.03, CV=10%) of GOA RE/BS rockfish.
Figure 13-7. Prior distributions for NMFS trawl survey catchability (q1, μ=1, CV=100%), AFSC longline
survey catchability (q2, μ=1, CV=100%), and recruitment variability (σr, μ=1.1, CV=6%) of GOA RE/BS
rockfish.
0 0.01 0.02 0.03 0.04 0.05 0.06
Natural mortality (M)

Figure 13-8. Fishery age compositions for GOA RE/BS rockfish. Observed = bars, predicted from author
preferred model = lines with circles. Colors follow cohorts.
0.00
0.10
0.192001
0.0
0.12002
0.0
0.12003
0.0
0.12004
0.0
0.12005
0.0
0.12006
0.0
0.12007
0.0
0.12008
0.0
0.12009
0.0
0.12010
21 25 29 33 37 41 45 49 53 57 600.0
0.12011
Size
Pro
port
ion

Figure 13-9. Fishery length (cm) compositions for GOA RE/BS rockfish. Observed = bars, predicted from
author preferred model = lines with circles.
0.00
0.10
0.192001
0.0
0.12002
0.0
0.12003
0.0
0.12004
0.0
0.12005
0.0
0.12006
0.0
0.12007
0.0
0.12008
0.0
0.12009
0.0
0.12010
21 25 29 33 37 41 45 49 53 57 600.0
0.12011
Size
Pro
port
ion
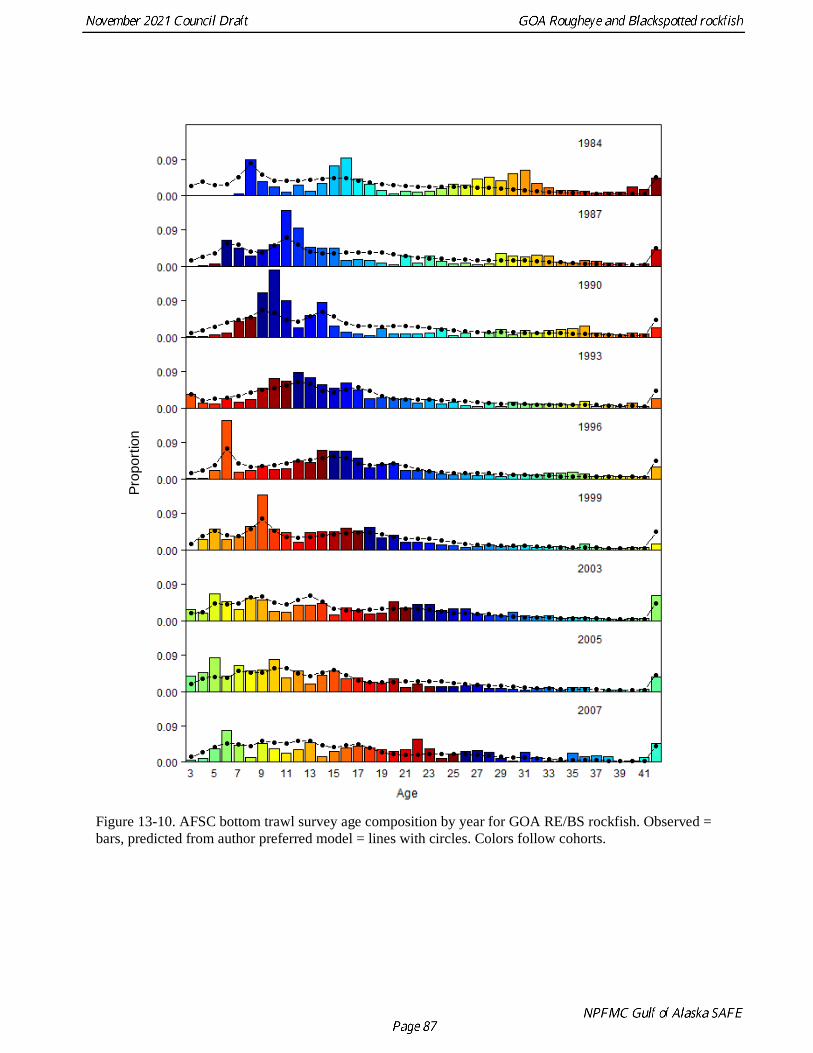
Figure 13-10. AFSC bottom trawl survey age composition by year for GOA RE/BS rockfish. Observed =
bars, predicted from author preferred model = lines with circles. Colors follow cohorts.
0.00
0.10
0.192001
0.0
0.12002
0.0
0.12003
0.0
0.12004
0.0
0.12005
0.0
0.12006
0.0
0.12007
0.0
0.12008
0.0
0.12009
0.0
0.12010
21 25 29 33 37 41 45 49 53 57 600.0
0.12011
Size
Pro
port
ion

Figure 13-10 (continued). AFSC bottom trawl survey age composition by year for GOA RE/BS rockfish.
Observed = bars, predicted from author preferred model = lines with circles. Colors follow cohorts.
0.00
0.10
0.192001
0.0
0.12002
0.0
0.12003
0.0
0.12004
0.0
0.12005
0.0
0.12006
0.0
0.12007
0.0
0.12008
0.0
0.12009
0.0
0.12010
21 25 29 33 37 41 45 49 53 57 600.0
0.12011
Size
Pro
port
ion

Figure 13-11. AFSC bottom trawl survey length (cm) composition by year for GOA RE/BS rockfish.
Observed = bars, data is used to determine size-age matrix, but not fit in the model.
0.00
0.10
0.192001
0.0
0.12002
0.0
0.12003
0.0
0.12004
0.0
0.12005
0.0
0.12006
0.0
0.12007
0.0
0.12008
0.0
0.12009
0.0
0.12010
21 25 29 33 37 41 45 49 53 57 600.0
0.12011
Size
Pro
port
ion
0.00
0.10
0.192001
0.0
0.12002
0.0
0.12003
0.0
0.12004
0.0
0.12005
0.0
0.12006
0.0
0.12007
0.0
0.12008
0.0
0.12009
0.0
0.12010
21 25 29 33 37 41 45 49 53 57 600.0
0.12011
Size
Pro
port
ion

Figure 13-11 (Continued). AFSC bottom trawl survey length (cm) composition by year for GOA RE/BS
rockfish. Observed = bars, data is used to determine size-age matrix, but not fit in the model.
0.00
0.10
0.192001
0.0
0.12002
0.0
0.12003
0.0
0.12004
0.0
0.12005
0.0
0.12006
0.0
0.12007
0.0
0.12008
0.0
0.12009
0.0
0.12010
21 25 29 33 37 41 45 49 53 57 600.0
0.12011
Size
Pro
port
ion

Figure 13-12. AFSC longline survey length (cm) composition by year for GOA RE/BS rockfish.
Observed = bars, predicted from author preferred model = lines with circles.
0.00
0.10
0.192001
0.0
0.12002
0.0
0.12003
0.0
0.12004
0.0
0.12005
0.0
0.12006
0.0
0.12007
0.0
0.12008
0.0
0.12009
0.0
0.12010
21 25 29 33 37 41 45 49 53 57 600.0
0.12011
Size
Pro
port
ion
0.00
0.10
0.192001
0.0
0.12002
0.0
0.12003
0.0
0.12004
0.0
0.12005
0.0
0.12006
0.0
0.12007
0.0
0.12008
0.0
0.12009
0.0
0.12010
21 25 29 33 37 41 45 49 53 57 600.0
0.12011
Size
Pro
port
ion
Pro
port
ion
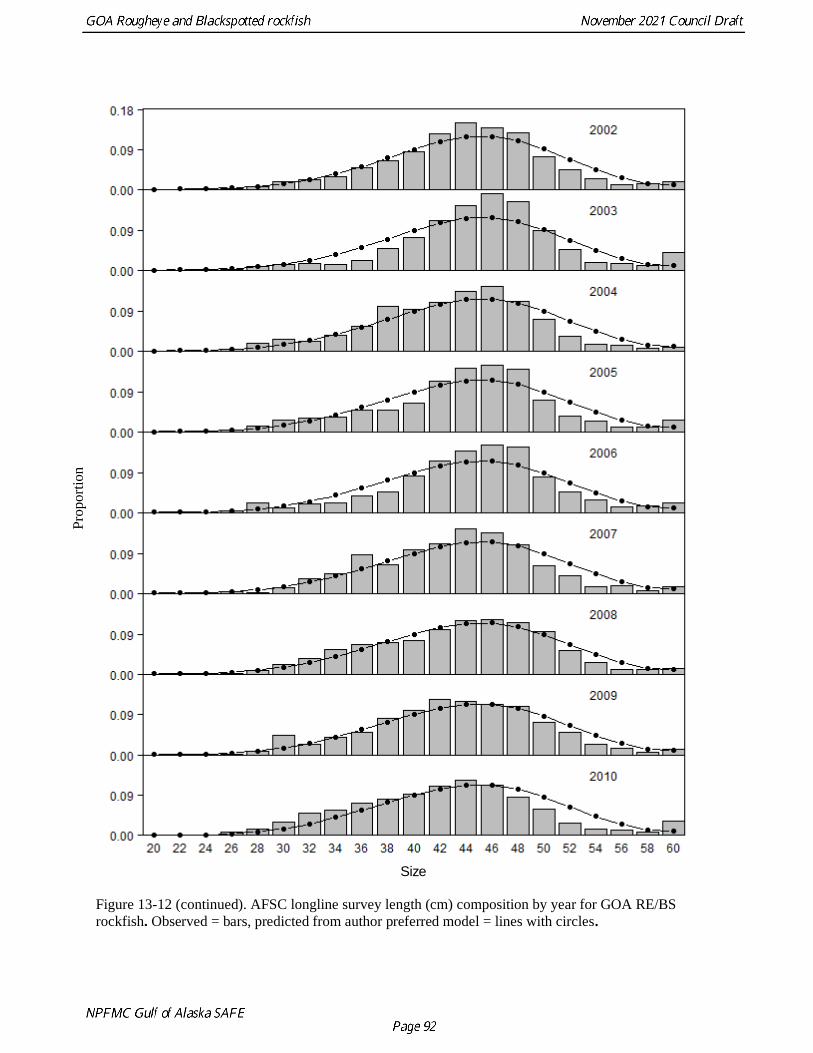
Figure 13-12 (continued). AFSC longline survey length (cm) composition by year for GOA RE/BS
rockfish. Observed = bars, predicted from author preferred model = lines with circles.
Pro
port
ion
0.00
0.10
0.192001
0.0
0.12002
0.0
0.12003
0.0
0.12004
0.0
0.12005
0.0
0.12006
0.0
0.12007
0.0
0.12008
0.0
0.12009
0.0
0.12010
21 25 29 33 37 41 45 49 53 57 600.0
0.12011
Size
Pro
port
ion

0.00
0.10
0.192001
0.0
0.12002
0.0
0.12003
0.0
0.12004
0.0
0.12005
0.0
0.12006
0.0
0.12007
0.0
0.12008
0.0
0.12009
0.0
0.12010
21 25 29 33 37 41 45 49 53 57 600.0
0.12011
Size
Pro
port
ion
Pro
port
ion
0.00
0.10
0.192001
0.0
0.12002
0.0
0.12003
0.0
0.12004
0.0
0.12005
0.0
0.12006
0.0
0.12007
0.0
0.12008
0.0
0.12009
0.0
0.12010
21 25 29 33 37 41 45 49 53 57 600.0
0.12011
Size
Pro
port
ion

Figure 13-12 (continued) AFSC longline survey length (cm) composition by year for GOA RE/BS
rockfish. Observed = bars, predicted from author preferred model = lines with circles.
Figure 13-12 (continued) AFSC longline survey length (cm) composition by year for GOA RE/BS
rockfish. Observed = bars, predicted from author preferred model = lines with circles.
Figure 13-13. Time series of predicted total biomass from author preferred model (solid black line) with
95% credible intervals determined by MCMC (dashed black lines) for GOA RE/BS rockfish. Last full
assessment model estimates included for comparison (dotted blue line).
Pro
port
ion
0.00
0.10
0.192001
0.0
0.12002
0.0
0.12003
0.0
0.12004
0.0
0.12005
0.0
0.12006
0.0
0.12007
0.0
0.12008
0.0
0.12009
0.0
0.12010
21 25 29 33 37 41 45 49 53 57 600.0
0.12011
Size
Pro
port
ion

Figure 13-14. Time series of predicted spawning biomass from author preferred model (solid black line)
with 95% credible intervals determined by MCMC (dashed black lines) for GOA RE/BS rockfish. Last
full assessment model estimates included for comparison (dotted blue line).

Figure 13-15. Estimated selectivity curves for GOA RE/BS rockfish from the author preferred model
(M15.4_2021) and the most recent full assessment in 2019 (M15.4_2019).

Figure 13-16. Time series of estimated fully-selected fishing mortality for GOA RE/BS rockfish from the
author preferred model (M15.4_2021) and the most recent full assessment in 2019 (M15.4_2019).
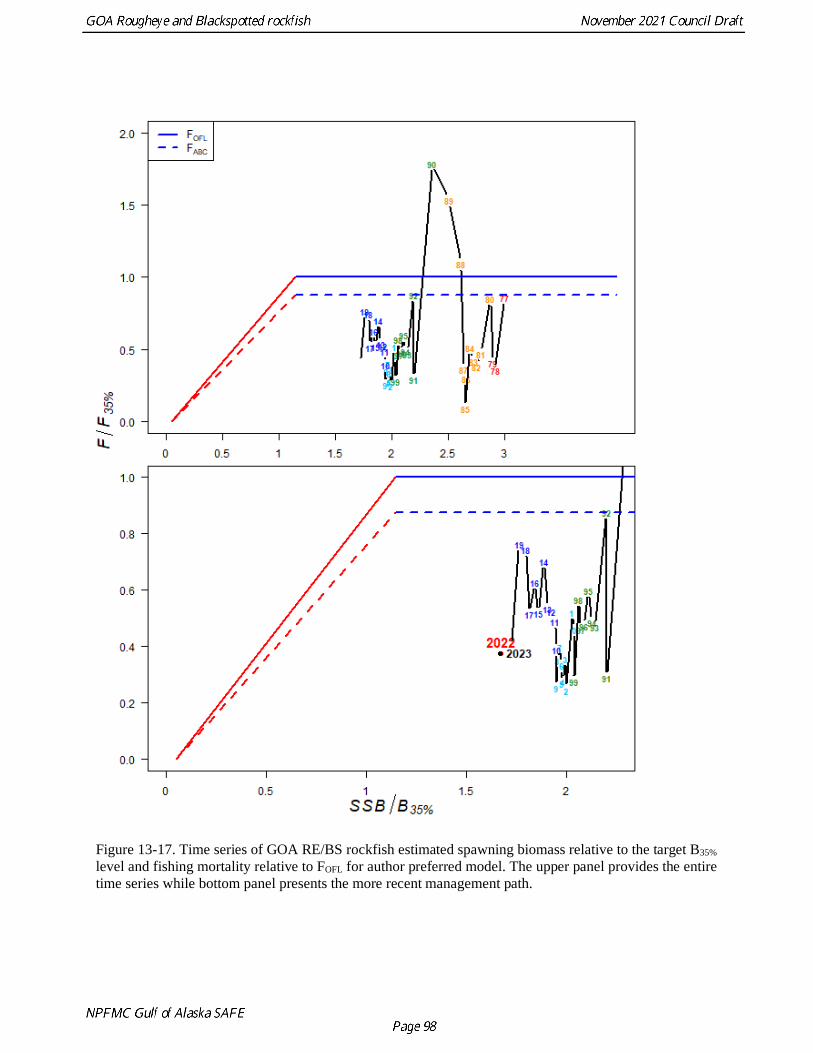
Figure 13-17. Time series of GOA RE/BS rockfish estimated spawning biomass relative to the target B35%
level and fishing mortality relative to FOFL for author preferred model. The upper panel provides the entire
time series while bottom panel presents the more recent management path.

Figure 13-18. Estimated recruitments (age 3) of GOA RE/BS rockfish from author preferred model by
year class with 95% credible intervals derived from MCMC. Last full assessment model estimates
included for comparison (red squares).

Figure 13-19: Histograms of estimated posterior distributions for key parameters derived from MCMC for
GOA RE/BS rockfish.

Figure 13-20: Retrospective peels of estimated female spawning biomass for the past 10 years from the
author preferred model (top), and the percent difference in female spawning biomass from the preferred
model in the terminal year (bottom).
Mohn’s rho = 0.611
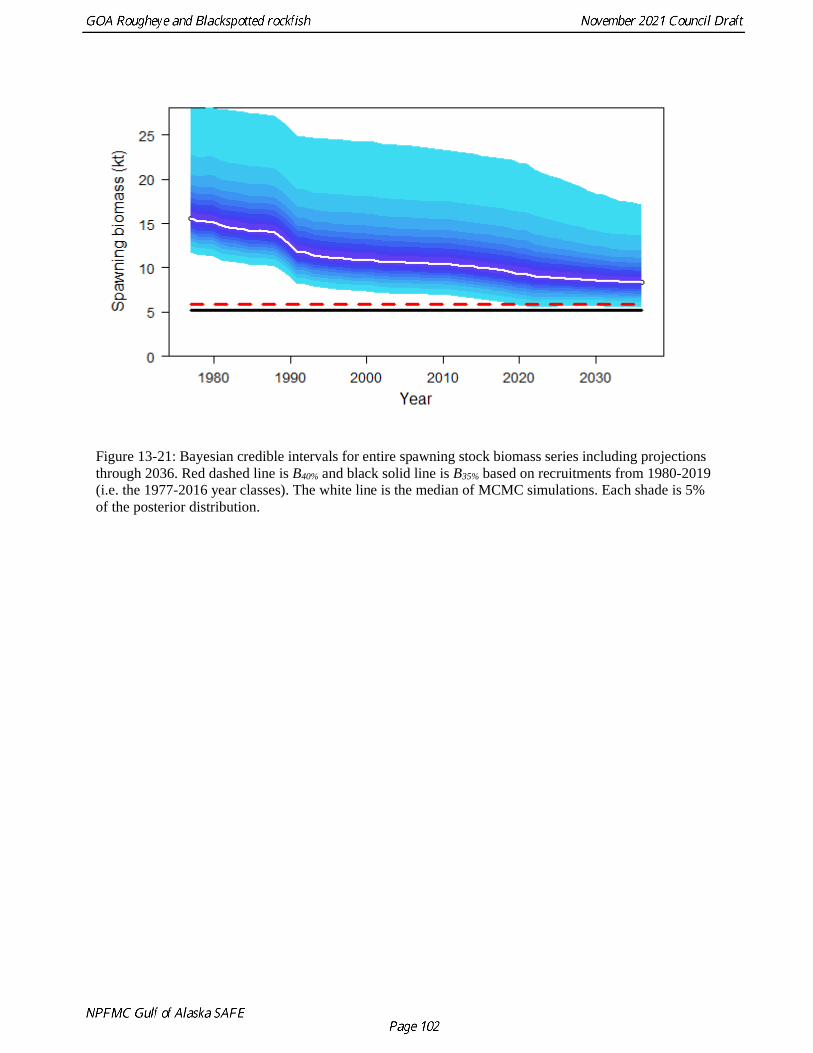
Figure 13-21: Bayesian credible intervals for entire spawning stock biomass series including projections
through 2036. Red dashed line is B40% and black solid line is B35% based on recruitments from 1980-2019
(i.e. the 1977-2016 year classes). The white line is the median of MCMC simulations. Each shade is 5%
of the posterior distribution.
Appendix 13A. Supplemental catch data
In order to comply with the Annual Catch Limit (ACL) requirements, two datasets have been generated to
help estimate total catch and removals from NMFS stocks in Alaska.
The first dataset, non-commercial removals, estimates total removals that do not occur during directed
groundfish fishing activities (Appendix Table 13A-1). This includes removals incurred during research,
subsistence, personal use, recreational, and exempted fishing permit activities, but does not include
removals taken in fisheries other than those managed under the groundfish FMP. These estimates
represent additional sources of removals to the existing Catch Accounting System estimates. For Gulf of
Alaska (GOA) rougheye and blackspotted (RE/BS) rockfish stock, these estimates can be compared to the
research removals reported in previous assessments (Shotwell et al. 2009, 2011, 2014). Trawl surveys
include NMFS echo-integration, large-mesh, and GOA bottom trawl surveys. Longline surveys include
IPHC and AFSC surveys. Other includes personal use, recreational, scallop dredge, and subsistence
harvest. The majority of research removals are taken by the Alaska Fisheries Science Center’s (AFSC)
biennial bottom trawl survey and by the AFSC’s longline survey and International Pacific Halibut
Commission’s (IPHC) longline survey. Other research activities that harvest RE/BS rockfish are minor
but include other trawl research activities, scallop dredge, and recreational harvests.
Although data are not available for a complete accounting of all research catches, the values in Appendix
Table 13A-1 indicate that generally RE/BS stock research removals have been modest relative to the
fishery catch and compared to the research removals for many other species. The exceptions are in 1998
and 1999 where a total of 52 and 36 t, respectively were taken, mostly by research trawling. However,
because commercial catches for the shortraker/rougheye rockfish complex during these years were below
ABC (please refer to Table 13-3 in the main document) this relatively large catch was not a conservation
concern. Total removals from activities other than a directed fishery since 2010 have been less than 8 t
overall, and between 1 and 3 t since 2014. These catches represent <1% of the recommended ABC in
these years and represents a low risk to the RE/BS stock.
The second dataset, Halibut Fishery Incidental Catch Estimation (HFICE), is an estimate of the incidental
catch of groundfish in the halibut IFQ fishery in Alaska, which is currently unobserved. To estimate
removals in the halibut fishery, methods were developed by the HFICE working group and approved by
the Gulf of Alaska and Bering Sea/Aleutian Islands Plan Teams and the Scientific and Statistical
Committee of the North Pacific Fishery Management Council. A detailed description of the methods is
available in Tribuzio et al. (2011).
These estimates are for total catch of groundfish species in the halibut IFQ fishery and do not distinguish
between “retained” or “discarded” catch. These estimates should be considered a separate time series
from the current CAS estimates of total catch. Because of potential overlaps HFICE removals should not
be added to the CAS produced catch estimates. The overlap will apply when groundfish are retained or
discarded during an IFQ halibut trip. IFQ halibut landings that also include landed groundfish are
recorded as retained in eLandings and a discard amount for all groundfish is estimated for such landings
in CAS. Discard amounts for groundfish are not currently estimated for IFQ halibut landings that do not
also include landed groundfish. For example, catch information for a trip that includes both landed IFQ
halibut and sablefish would contain the total amount of sablefish landed (reported in eLandings) and an
estimate of discard based on at-sea observer information. Further, because a groundfish species was
landed during the trip, catch accounting would also estimate discard for all groundfish species based on
available observer information and following methods described in Cahalan et al. (2010). The HFICE
method estimates all groundfish caught during a halibut IFQ trip and thus is an estimate of groundfish
caught whether landed or discarded. This prevents simply adding the CAS total with the HFICE estimate
because it would be analogous to counting both retained and discarded groundfish species twice. Further,

there are situations where the HFICE estimate includes groundfish caught in State waters and this would
need to be considered with respect to ACLs (e.g. Chatham Strait sablefish fisheries). Therefore, the
HFICE estimates should be considered preliminary estimates for what is caught in the IFQ halibut
fishery. Improved estimates of groundfish catch in the halibut fishery will become available following
restructuring of the FMA Program in 2013. At this time all vessels greater than 25 ft will be monitored for
groundfish catch.
The HFICE estimates of GOA RE/BS stock catch are highly variable but also significant ranging from 28
– 78 t per year (Appendix Table 13A-2). The majority of catch occurs in the Southeast and Southeast
Inside waters. It should be noted that Southeast Inside waters are managed by the State of Alaska and
catches from these areas are generally not included in groundfish assessments in the Gulf of Alaska
Federal Management Plan. It is unknown what level of RE/BS catch is double-counted in these estimates
and the Catch Accounting System. Regardless, the estimated catch from the unobserved halibut fishery is
substantial and improved catch estimates from this fishery are warranted.
Literature Cited
Cahalan J., J. Mondragon., and J. Gasper. 2010. Catch Sampling and Estimation in the Federal
Groundfish Fisheries off Alaska. NOAA Technical Memorandum NMFS-AFSC-205. 42 p.
Shotwell, S.K., D. Hanselman, and D. Clausen. 2009. Gulf of Alaska rougheye rockfish. In Stock
assessment and fishery evaluation report for the groundfish resources of the Gulf of Alaska as
projected for 2010. North Pacific Fishery Management Council, 605 W 4th Ave, Suite 306
Anchorage, AK 99501. pp. 993-1066.
Tribuzio, CA, S Gaichas, J Gasper, H Gilroy, T Kong, O Ormseth, J Cahalan, J DiCosimo, M Furuness,
H Shen, K Green. 2011. Methods for the estimation of non-target species catch in the unobserved
halibut IFQ fleet. August Plan Team document. Presented to the Joint Plan Teams of the North
Pacific Fishery Management Council.

Appendix Table 13A-1. Total removals of Gulf of Alaska rougheye/blackspotted rockfish (t) from
activities not related to directed fishing, since 1977.
Year Source Trawl Longline Other Total
1977
Assessment of RE/BS
stock complex in the
Gulf of Alaska (Shotwell
et al. 2009)
1 1
1978 2 2
1979 1 1
1980 1 1
1981 6 6
1982 3 3
1983 3 3
1984 17 17
1985 7 7
1986 2 2
1987 13 13
1988 0 0
1989 1 1
1990 5 5
1991 0 0
1992 0 0
1993 10 10
1994 0 0
1995 0 0
1996 5 8 13
1997 0 16 16
1998 45 7 52
1999 28 8 36
2000 0 10 10
2001 2 7 9
2002 0 6 6
2003 3 6 9
2004 0 6 6
2005 5 4 9
2006 0 5 5
2007 8 7 15
2008 0 11 11
2009 6 9 15
2010
AKRO
<1 7 <1 7
2011 <1 6 <1 8
2012 2 5 <1 6
2013 2 4 <1 6
2014 <1 <1 <1 1
2015 2 <1 <1 3
2016 na 1 <1 1
2017 2 <1 <1 3
2018 1 2 <1 3
2019 1 2 <1 3
2020 <1 1 <1 2
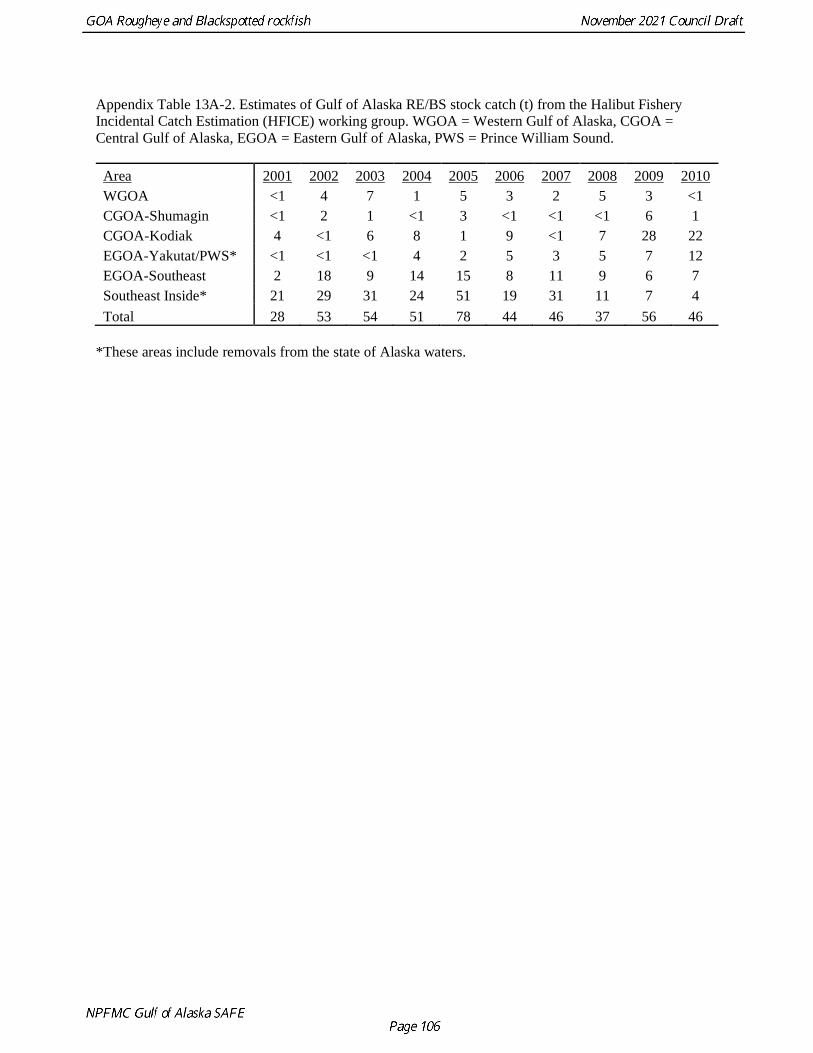
Appendix Table 13A-2. Estimates of Gulf of Alaska RE/BS stock catch (t) from the Halibut Fishery
Incidental Catch Estimation (HFICE) working group. WGOA = Western Gulf of Alaska, CGOA =
Central Gulf of Alaska, EGOA = Eastern Gulf of Alaska, PWS = Prince William Sound.
Area 2001 2002 2003 2004 2005 2006 2007 2008 2009 2010
WGOA <1 4 7 1 5 3 2 5 3 <1
CGOA-Shumagin <1 2 1 <1 3 <1 <1 <1 6 1
CGOA-Kodiak 4 <1 6 8 1 9 <1 7 28 22
EGOA-Yakutat/PWS* <1 <1 <1 4 2 5 3 5 7 12
EGOA-Southeast 2 18 9 14 15 8 11 9 6 7
Southeast Inside* 21 29 31 24 51 19 31 11 7 4
Total 28 53 54 51 78 44 46 37 56 46
*These areas include removals from the state of Alaska waters.