assessment of the risk of consuming milk/ milk - CGSpace Home
170
i ASSESSMENT OF THE RISK OF CONSUMING MILK/ MILK PRODUCTS CONTAMINATED WITH LISTERIA MONOCYTOGENES FROM THE INFORMAL MARKETS BY JOY APPIAH (10023038) THIS THESIS/ DISSERTATION IS SUBMITTED TO THE UNIVERSITY OF GHANA, LEGON, IN PARTIAL FULFILLMENT OF THE REQUIREMENT FOR THE AWARD OF MASTER OF PHILOSOPHY DEGREE IN FOOD SCIENCE JUNE/ 2012
Transcript of assessment of the risk of consuming milk/ milk - CGSpace Home

i
ASSESSMENT OF THE RISK OF CONSUMING MILK/ MILK
PRODUCTS CONTAMINATED WITH LISTERIA MONOCYTOGENES
FROM THE INFORMAL MARKETS
BY
JOY APPIAH
(10023038)
THIS THESIS/ DISSERTATION IS SUBMITTED TO THE UNIVERSITY OF
GHANA, LEGON, IN PARTIAL FULFILLMENT OF THE REQUIREMENT FOR
THE AWARD OF MASTER OF PHILOSOPHY DEGREE IN FOOD SCIENCE
JUNE/ 2012

ii
DECLARATION
The work described in this report was done by me at the Nutrition and Food Science
Department of the University of Ghana (U.G), Legon, Accra, Ghana, under the supervision
of Prof Kwaku Tano- Debrah, Dr. Betty Bediako- Amoah and Dr. Mohammed .M. Alfa.
…………………………………
JOY APPIAH
STUDENT
…………………………………………
PROF. K. TANO- DEBRAH
PRINCIPAL SUPERVISOR
…………………………….. ………………………….
DR. BETTY BEDIAKO-AMOAH DR. M. M. ALFA
SUPERVISOR SUPERVISOR

iii
DEDICATION
I dedicate this thesis to the Lord God, who it is, that has enabled me to accomplish this feat
and others. I dedicate it also to my loved ones of blessed memory: my mother (Mrs. Rose
Appiah), brother (Frederick .P. Appiah (Jnr.)) and sister (Georgette Afia Sarpong Appiah).

iv
ACKNOWLEDGEMENTS
This work was facilitated by financial support from the German Federal Ministry for
Economic Cooperation and Development (BMZ) through GIZ. It was done in
collaboration with the International Livestock Research Institute (ILRI). My profound
thanks to these organizations.
For their invaluable help which contributed immensely to the successful completion of this
work I am also grateful to my supervisors Prof. Kwaku Tano- Debrah and Dr. Betty
Amoah of Nutrition and Food Science, University of .Ghana (N.F.S- U.G) and Dr.
Mohammed Musheibu Alfa: Head – Animal Products and Biosafety, Ghana Food and
Drugs Board (FDB).
Also to Drs. Delia Grace and Kohei Makita of ILRI, Dr. F. K. Saalia (N.F.S- U.G), Mrs.
Bernice Kaulton- Senaye of the Food Research Institute (FRI), Dr. George Nipah of the
Veterinary Services Directorate (VSD), Mr. Paapa Blankson of the Epidemiology
Division, (MoH), Mr. S. Doe of the Tema General Hospital and all others who in one way
or the other contributed to this work, know you also are greatly appreciated.
Finally, many thanks go also to my family including Col Frederick Appiah (Rtd), Freda
Appiah, Judith Dickson, Anita Appiah, Philip Appiah and Joycelyn Appiah. Your support
and prayers I could not have done without. Thank you once again.

v
ABSTRACT
Listeria monocytogenes is the causative organism of listeriosis, a debilitating and often
fatal infection, which occurs mostly via food consumption. However, some foods such as
dairy, probably due to their nutritious nature and handling characteristics, are more prone
to contamination and thus are relatively more culpable. To prevent L. monocytogenes
contamination of such products, it is critical to be insightful of listerial contamination
routes in food processing environments. This study investigated L. monocytogenes
contamination routes along the informal milk value chain from production to consumption.
Microbiological methods according to the US/ FDA protocol (Hitchins, 1998) including
chromogenic Listeria agar (ISO) OCLA use and biochemical methods including the Gram,
Catalase and the Beta- haemolysis were employed to isolate L. monocytogenes from 304
samples of milk/ milk products. Results indicated that prevalence generally increased with
repeated handling though it decreased with boiling (p<0.05). Prevalence in samples at
production, retail (i.e. raw milk on the market), after boiling and fermentation were 42.1,
78.9, 18.4 and 59.2 percent respectively. Also 14.8, 57.9, 6.6 and 46.1 percent of samples
had mean counts ≥100 CFU/ mL at production, at retail, after boiling and fermentation
respectively (p<0.05). A Quantitative Risk Assessment indicated a higher exposure and
probability of illness when raw milk at retail was consumed and the least when boiled milk
was consumed. Crude Sensitivity Analysis also predicted the most effective mitigation
strategy for exposure to be boiling. Hence boiling of raw milk was crucial to its safe
consumption. However, with contamination at all stages of the value chain, it was
important to emphasize on the hygiene regimen along the whole continuum as safety at
one stage could very easily be undone by the lack of proper procedures at another.

vi
TABLE OF CONTENTS
DECLARATION ................................................................................................................... i
DEDICATION ..................................................................................................................... iii
ACKNOWLEDGEMENTS ................................................................................................. iv
ABSTRACT .......................................................................................................................... v
TABLE OF CONTENTS ..................................................................................................... vi
LIST OF TABLES ............................................................................................................... xi
LIST OF FIGURES ............................................................................................................ xiii
LIST OF EQUATIONS ...................................................................................................... xv
LIST OF ABREVIATIONS ............................................................................................... xvi
CHAPTER ONE ................................................................................................................... 1
INTRODUCTION ................................................................................................................. 1
1.1 General Background .................................................................................................... 1
1.2 Risk Profile of L. monocytogenes ................................................................................ 7
1.3 Statement of Problem ................................................................................................ 10
1.4 Scope ...................................................................................................................... 13
1.4.1 Specific Objectives ............................................................................................. 13
CHAPTER TWO ................................................................................................................. 14
LITERATURE REVIEW .................................................................................................... 14
2.1 Agriculture Sector in Ghana ...................................................................................... 14
2.1.1 Livestock sub-Sector in Ghana ........................................................................... 15
2.1.2 Production and Consumption of ASFs in Ghana ................................................ 15
2.1.3 Meat and Meat Product Consumption in Ghana ................................................. 15
2.1.4 Milk and Milk Product Consumption in Ghana .................................................. 16
vii
2.2 Informal Milk Marketing in Ghana ........................................................................ 17
2.2.1 Handling of Milk/ Milk Products in Ghana ........................................................ 19
2.3 Microbial Ecology of Raw Cow‘s Milk .................................................................... 19
2.3.1 Milk Pasteurization (Low-Heat Treatment) ........................................................ 20
2.4 Foodborne Zoonoses in Ghana .................................................................................. 20
2.4.1 Anthrax ............................................................................................................... 20
2.4.2 Tuberculosis (TB) ............................................................................................... 21
2.4.3 Brucellosis ........................................................................................................... 21
2.4.4 Other Emerging Foodborne Zoonoses in Ghana ................................................ 22
2.5 Rapid Rural Appraisal (RRA)/ Participatory Rural Appraisal (PRA) ....................... 23
2.5.1 Participatory Approach ....................................................................................... 23
2.6 Microbial Risk Assessment ....................................................................................... 24
2.6.1 Risk Assessment of L. monocytogenes-- a Foodborne Pathogen ....................... 26
2.6.1.1 Hazard Identification (H.I) ............................................................................... 26
2.6.1.1.1 Characteristics of Listeriae ........................................................................... 26
2.6.1.1.2 Isolation and Detection of Listeriae .............................................................. 27
2.6.1.1.3 Morphology of Listeriae ............................................................................... 29
2.6.1.1.4 Prevalence of L. monocytogenes in Cow‘s Milk .......................................... 29
2.6.1.2 Hazard Characterization ................................................................................... 30
2.6.1.2.1 Pathogenicity of L. monocytogenes .............................................................. 30
2.6.1.2.2 Infectious Dose and Incubation Period ......................................................... 32
2.6.1.2.3 Virulence of L. monocytogenes and Environmental Stresses ....................... 33
2.6.1.2.4 Acid Tolerance of L. monocytogenes ............................................................ 34
2.6.1.2.5 Temperature Tolerance ................................................................................. 35

viii
CHAPTER THREE ............................................................................................................. 36
MATERIALS AND METHODS ........................................................................................ 36
3.1 Study Site and Population ...................................................................................... 36
3.2 Study Design .............................................................................................................. 37
3.2.1 Risk Assessment ................................................................................................. 37
3.3 Sampling .................................................................................................................... 38
3.4 PRA Survey ............................................................................................................ 39
3.4.1 Mapping .............................................................................................................. 40
3.4.2 Seasonal Calendars ............................................................................................. 40
3.4.3 Disease Ranking (Proportional Piling) ............................................................... 40
3.4.4 Matrix Scoring .................................................................................................... 41
3.5 Questionnaire Survey ............................................................................................. 41
3.5.1 Criteria for Inclusion of Respondents ................................................................. 41
3.6 Chemical Analysis of Milk Samples ...................................................................... 41
3.6.1 PH Determination ............................................................................................... 41
3.7 Microbial Analysis ................................................................................................. 42
3.7.1 Detection, Isolation and Enumeration of Listeriae ............................................. 42
3.8 Statistical Analyses of Data ................................................................................... 43
CHAPTER FOUR ............................................................................................................... 44
RESULTS AND DISCUSSION ......................................................................................... 44
4.2 PRA Survey ................................................................................................................ 45
4.2.1 Farmers PRA ....................................................................................................... 45
4.2.1.1 Demographic Information on Farmers at PRA ................................................ 45
4.2.1.2 Mapping ........................................................................................................... 46
4.2.1.3 Analysis of Seasonal Calendar ......................................................................... 47

ix
4.2.1.3.1 Seasonal Occurrence of Rainfall ................................................................... 48
4.2.1.3.2 Milk Production ............................................................................................ 49
4.2.1.3.3 Seasonal Occurrence of Diseases .................................................................. 49
4.2.1.4 Preference Ranking on Livelihood Indices of Farmers ................................... 50
4.2.1.5 Proportional Piling of Disease Symptoms of Animals .................................... 51
4.2.2 Assembler‘s PRA ................................................................................................ 55
4.2.2.1 Mapping ........................................................................................................... 55
4.2.2.2 Milk Handling by Assemblers ......................................................................... 55
4.2.3 PRA with Milk/ Milk Product Retailers .............................................................. 56
4.2.3.1 Mapping ........................................................................................................... 56
4.2.3.2 Quality Control at Retail .................................................................................. 57
4.2.3.2 Marketing of Milk/ Milk Products at Old Tulaku, Ashaiman .......................... 58
4.2.3.3 Matrix Scoring for Retailers ............................................................................ 60
.. .4.2.3.4 Milk Distribution from Production to Consumption and Evolution of Hazards 62
4.3 Questionnaire Survey ............................................................................................. 66
4.3.1Retailers Questionnaire Survey ............................................................................ 66
4.3.1.1 Demographic Characteristics of Retailers ....................................................... 66
4.3.2.1 Demographic Characteristics of Consumers .................................................... 74
4.3.2.2 Knowledge on Milk/ Milk Product Consumption Trends ............................... 75
4.4 Results- Laboratory Analyses ....................................................................................... 85
4.4.1 Detection and Isolation of Listeria spp. and L. monocytogenes ......................... 85
4.5 Risk Assessment ............................................................................................................ 97
4.5.1 Exposure Assessment .......................................................................................... 97
4.5.1.1Need for Simulation in Assessing Risk ............................................................ 97
4.5.1.2 Simulated L. monocytogenes Contaminated Dairy Products at Consumption .... 98

x
4.5.2 Dose- Response Relationship ............................................................................... 113
4.5.3. Risk Characterization Results ................................................................................. 116
4.5.4 Determining Critical Points for Intervention ........................................................... 119
CHAPTER FIVE ............................................................................................................... 120
CONCLUSIONS AND RECOMMENDATIONS ............................................................ 120
5.1 Conclusions ............................................................................................................. 120
5.2 Recommendations ................................................................................................... 121
REFERENCES .................................................................................................................. 123
APPENDICES ................................................................................................................... 138
APPENDIX A ................................................................................................................... 138
APPENDIX B (I) .............................................................................................................. 138
APPENDIX B (II) ............................................................................................................. 139
APPENDIX C (I) .............................................................................................................. 139
APPENDIX C (II) ............................................................................................................. 144
APPENDIX C (III) ............................................................................................................ 144
APPENDIX D (I) .............................................................................................................. 145
APPENDIX D (II) ............................................................................................................. 145
APPENDIX E .................................................................................................................... 146
APPENDIX F (I): CASE STUDY QUESTIONNAIRE- RETAILERS ........................... 147
APPENDIX F (II): CASE STUDY QUESTIONNAIRES- CONSUMERS ..................... 151
APPENDIX G (I) .............................................................................................................. 154
APPENDIX G (II) ............................................................................................................. 155
APPENDIX G (III) ............................................................................................................ 155
APPENDIX H (I) .............................................................................................................. 156
APPENDIX H (II) ............................................................................................................. 157

xi
APPENDIX H (III) ............................................................................................................ 157
LIST OF TABLES
Table 1.1: Livestock populations in Ghana (‗000) ................................................................ 2
Table 1.2: Annual domestic meat production (1000 Metric) 2001-2006 .............................. 3
Table 1.3: Top 5 causes of morbidity in Ghana 1995-2007 .................................................. 4
Table 1.4: Top 5 causes of morbidity in Ghana 1995-2007 .................................................. 5
Table 1.5: Bacterial diseases transmissible to man through milk consumption .................... 6
Table 2.6: A comparison of domestic production and imports (000) MT (2000/07) .......... 16
Table 2.7: Informal milk market agents in Ghana .............................................................. 18
Table 2.8: Human Tuberculosis reported in Ghana, 1995-2007 ......................................... 21
Table 2. 9: Characteristics of the Genus Listeria ................................................................ 27
Table 2. 10: Illness caused by L. monocytogenes ............................................................... 33
Table 4.11: Background Information on milk producing farmers ...................................... 46
Table 4.12: Lexicon of local terms for diseases and symptoms farmer‘s language ............ 51
Table 4.13: Demographic characteristics of consumer respondents ................................... 66
Table 4.14: Traditions of the milk retail trade .................................................................... 67
Table 4.15: Supply of raw milk to retailers ........................................................................ 69
Table 4.16: Quantities of milk supplied by Assembler ....................................................... 70
Table 4.17: Milk/ milk product handling during sale ......................................................... 70
Table 4.18 Association of milk with probable diseases ...................................................... 71
Table 4.19: Suspected symptoms associated with listeriosis in Retailers .......................... 72
Table 4.20: Handling practices of milk after receipt from Assembler ................................ 73
Table 4.21: Demographic characteristics of consumer respondents ................................... 74
Table 4.22 Milk consumption habit of consumers ............................................................. 76

xii
Table 4.23 Consumer attitudes to food hygiene on the informal market ............................ 77
Table 4.24 Fresh milk handling practices of consumers ..................................................... 78
Table 4.25: Qualitative Exposure Assessment for the risk of exposure to L. monocytogenes
from the consumption of dairy product from the informal market ..................................... 81
Table 4.26: Occurrence of probable initial symptoms of human listeriosis ........................ 82
Table 4.27 Occurrence of pregnancy related abnormalities in female consumers .............. 83
Table 4. 28: Summary of the biochemical characteristics of Listeriae/ L. monocytogenes 88
Table 4.29: Morphological characteristics of Listeriae/ L. monocytogenes* ..................... 88
Table 4.30 Descriptive statistics on pH changes from production to fermentation ............ 89
Table 4.31: Detection and isolation of Listeriae/ L. monocytogenes in samples ................ 91
Table 4.32: Descriptive statistics on L. monocytogenes counts from production to
fermentation ........................................................................................................................ 94
Table 4.33: Amounts of milk/ milk products consumed per day at Ashaiman ................... 97
Table 4.34: Summary of main indicator parameters per ml of milk/ milk products ......... 102
Table 4.35 Summary of main indicator parameters per serving of milk/ milk products .. 106
Table 4.36: Summary of main indicator parameters for total daily consumption of milk/
milk products ..................................................................................................................... 110
Table 4.37: Selected Quantiles from Simulated Distributions of log10 Number of L.
monocytogenes Organisms in Contaminated Milk/ Milk Product Servings at Point of
Consumption ..................................................................................................................... 112
Table 4.38: Probability of illness for consumers at Ashaiman estimated for different levels
of L. monocytogenes at the time of consumption with milk/ milk products contaminated at
those levels. ....................................................................................................................... 114
Table 4.39: Probability of illness for consumers at Ashaiman estimated for different levels
of L. monocytogenes at the time of consumption with milk/ milk products contaminated at
those levels. ....................................................................................................................... 117

xiii
LIST OF FIGURES
Figure 2.1: Comparism of various sectorial GDP‘s with the national economic growth ... 14
Figure 2.2: Protocol for microbial risk assessment (CAC, 1999) ....................................... 24
Figure 4.3: Participatory map of resources important to farmers‘ livelihood ..................... 47
Figure 4.4: Seasonal calendar session at farmers‘ PRA ...................................................... 48
Figure 4.5: Seasonality of events on the calendar .............................................................. 48
Figure 4.6: Farmer milking Figure 4.7: Filtering of milk on retail market .. 49
Figure 4.8: Constraints to the livelihood indices of farmers ............................................... 50
Figure 4.9: Piling of stone at session followed by their distribution by symptom .............. 52
Figure 4.10: Comparison of the impact of disease on various livelihood indices .............. 52
Figure 4.11: Comparison of the impact of disease on various livelihood indices ............. 53
Figure 4.12: Map of Electoral Areass (EA) with informal retailing of dairy products at
Ashaiman. (EAs and dairy marketing were represented with the red and yellow cola nuts
respectively) ........................................................................................................................ 56
Figure 4.13: Clot-on-boil Quality Test (a) Water used in washing bowls (b) ................. 57
Figure 4.14: Pathway for milk transformation and sale at Ashaiman ................................. 59
Figure 4.15: Plot of livelihood constraints against retailers‘ livelihoods indices ............... 60
Figure 4.16: Quantitative milk distribution model; production to retail, for Ashaiman ..... 63
Figure 4.17: Quantitative milk distribution model; production to retail, for Ashaiman ..... 64
Figure 4.18: Schematic presentation of food exposure pathway modeled using the MPRM
............................................................................................................................................. 65
Figure 4.19: Percent average quantities of type(s) of dairy product sold at retail .............. 68
Figure 4.20: Disease symptoms associated identified by retailers ...................................... 71
Figure 4.21: Color changes after enrichment in UVM, LEB and Fraser broths respectively
............................................................................................................................................. 85
Figure 4.22: Color changes after enrichment in Fraser broth for retailed, production and
boiled samples consecutively from left to right .................................................................. 86
xiv
Figure 4.23: Colonies of Listeriae on OCLA. (a) Green without halo (b) Green with halo
............................................................................................................................................. 86
Figure 4.24: Colonies of Listeria species on (a) PALCAM Agar (b) Oxford (OXA) Agar 87
Figure 4.25: Blood hemolysis results: (a) S. aureus; (b) Isolate; (c) Reference strain ....... 87
Figure 4.26: Pot of milk on coal fire (a) Vessel for dishing out milk (b) ................. 93
Figure 4.27: Quantitative milk distribution model: production to retail ............................. 96
Figure 4.28: A graph of probability density against Log10CFU of L. monocytogenes in a ml
of milk at production ........................................................................................................... 99
Figure 4.29: A graph of probability density against Log10CFU of L. monocytogenes in a ml
of milk at retail .................................................................................................................. 100
Figure 4.30: A graph of probability density against Log10CFU of L. monocytogenes in a ml
of boiled milk .................................................................................................................... 101
Figure 4.31: A graph of probability density against Log10CFU of L. monocytogenes in a ml
of fermented milk .............................................................................................................. 102
Figure 4.32: A graph of probability density against Log10CFU of L. monocytogenes in a
serving of milk at production ............................................................................................ 103
Figure 4. 33: A graph of probability density against Log10CFU of L. monocytogenes in a
serving of milk at retail ..................................................................................................... 104
Figure 4.34: A graph of probability density against Log10CFU of L. monocytogenes in a
serving of boiled milk ....................................................................................................... 105
Figure 4.35: A graph of probability density against Log10CFU of L. monocytogenes in a
serving of fermented milk ................................................................................................. 106
Figure 4.36: A graph of probability density against Log10CFU of L. monocytogenes in total
daily servings of milk at production .................................................................................. 107
Figure 4.37: A graph of probability density against Log10CFU of L. monocytogenes in total
daily servings of milk at retail ........................................................................................... 108
Figure 4.38: A graph of probability density against Log10CFU of L. monocytogenes in total
daily servings of boiled milk ............................................................................................. 109
Figure 4.39: A graph of probability density against Log10CFU of L. monocytogenes in total
daily servings of fermented milk ....................................................................................... 110
xv
Figure 4.40: Exponential dose- response model for ingested dose of L. monocytogenes
associated with milk at production .................................................................................... 114
Figure 4.41: Exponential dose- response model for ingested dose of L. monocytogenes
associated with milk at retail ............................................................................................. 115
Figure 4.42: Exponential dose- response model for ingested dose of L. monocytogenes
associated with boiled milk ............................................................................................... 115
Figure 4.43: Exponential dose- response model for ingested dose of L. monocytogenes
associated with fermented milk ......................................................................................... 116
Figure 4.44: Fault tree of the events that could have led to the exposure of L.
monocytogenes to consumers of informally marketed milk/ milk product at Ashaiman .. 118
Figure 4.45: Spearman rank correlation between the estimated probabilities of L.
monocytogenes contamination for the various processes involve in milk/ milk products
production according to the PRM. .................................................................................... 119
LIST OF EQUATIONS
Equation 1: Sample Size Determination ............................................................................. 38
Equation 2: Cochran (1963) Formula for Adjusting Sample Size ...................................... 38
Equation 3: Expression of Counts in CFU/ mL .................................................................. 42
Equation 4: Process of Decrease in pH of milk with Heating ............................................. 90
Equation 5: Exponential Model for Dose-Response ......................................................... 113

xvi
LIST OF ABREVIATIONS
AFNOR Assoçiation Francaise de Normalisation
ASF Animal Sourced Foods
AZC Ashaiman Zonal Council
BoG Bank of Ghana
CAADP Comprehensive Accelerated Agriculture Dev. Program
CAC Codex Alimentarius Commission
CAMP Christy Atkins Munch-Petersen
CDC Centre for Diseases Control
CFARE Council for Food Agriculture and Resource Economics
CFSAN Center for Food Safety and Applied Nutrition
CFSPH Center for Food Security and Public Health
CFU Colony-forming unit
CNS Central Nervous System
FAO Food and Agriculture Organization
FDA Food and Drug Administration
GDP Gross Domestic Product
GH¢ Ghana cedi
GHS Ghana Health Service
GSS Ghana Statistical Services
ILRI International Livestock Research Institute
ILSI International Life Sciences Institute
ISO International Organization for Standards
LME Liquid Milk Equivalent

xvii
MoFA Ministry of Food and Agriculture
MoH Ministry of Health
NePAD New Partnership for African Development
OIE World Organization for Animal Health
PRA Participatory Rural Appraisal
RCP Recommended International Code of Practice
SRID Statistical Research and Information Directorate
STEC Shiga-Toxin producing E. coli
TMA Tema Municipal Assembly
US United States
US$ United States Dollar
USDA United States Department of Agriculture
VSD Veterinary Services Directorate
WASH West African Short Horn
WB World Bank
WHO World Health Organization
1
CHAPTER ONE
INTRODUCTION
1.1 General Background
The WHO has described foodborne diseases (FBD‘s) as illnesses of an infectious or toxic
nature caused by, or thought to have been caused by the consumption of food and water
(Adams and Motarjemi, 1999), which conceivably represents the most common health
problem of recent times, thus reducing significantly economic productivity (Mukhola,
2000). It estimates that up to a third of people in developed countries are affected by
FBD‘s (WHO, 2009). According to the Ghana Health Service (GHS) the total number of
sick persons related to foodborne illnesses during 2003 in Ghana was 2.3 million whiles
the associated losses for 2002, based on the premise that foodborne illnesses were diarrheal
diseases, was GH¢15.2 million [approximately US$10.9 million at a rate of $1 to GH¢1.4
(Antweiler, 2009)]. This figure accrues from healthcare costs to the Government,
individuals and the loss of about 3.4 million working days (Ghana: FAO/WB CP, 2005).
FBD‘s are caused by the consumption of foods exposed to hazards that may be biological
or pathogenic (e.g. viruses, bacteria, parasites), chemical (e.g. heavy metals and toxins),
and others physical (e.g. glass fragments, bone chips) (Schmidt et al., 2003). Etiological
information suggests that the frequency of occurrence from microbial or pathogenic origin
is by far higher (Hall, 1971). According to the WHO 62% of all human pathogens are
zoonotic (Taylor et al., 2001). This agrees with the OIE that 75% of all emerging human
diseases originate from animal reservoirs (Vallat, 2007). Consequently, animal sourced
foods (ASF) have been found guilty for the majority of FBD‘s (De Buyser et al, 2001) and

2
incidences increase with increasing access to such foods especially without adequate
hygiene, inspection for safety or satisfactory heating to kill pathogens (McCrindle, 2008).
Nevertheless, there is a steady shift to ASF across developing countries (DC‘s) (Popkin,
2001). In this vein, Ghana has seen a gradual increase in animal populations (Table 1.1),
and therefore their products (Table 1.2) in response to an almost exclusive domestic
demand (Ghana: FAO/WB CP, 2005). Unfortunately, as low-income groups dominate
(GPN, 2004), akin to what pertains in most DC‘s, the larger share of the growing demand
for ASF‘s is expected to be satisfied through informal marketing channels where Rehber
and Ulusoy, (1998) have reported of premium being placed on affordability even to the
detriment of safety.
Table 1.1: Livestock populations in Ghana (‘000)
Types of
Livestock
1998 1999 2000 2001 2002 2003 2004 2005 2006 2007
Poultry 17,302 18,810 20,472 22,032 24,251 26,395 28,727 28,386 34,030 37,038
Sheep 2,576 2,658 2,743 2,771 2,922 3,015 3,112 3,211 3,314 3,420
Goats 2,792 2,931 3,077 3,199 3,230 3,560 3,925 3,923 3,997 4,196
Cattle 1,288 1,288 1,302 1,315 1,330 1,344 1,359 1,373 1,392 1407
Pigs 339 332 324 312 310 303 297 290 477 491
Source Veterinary Services Directorate, (2007) MoFA, Accra
3
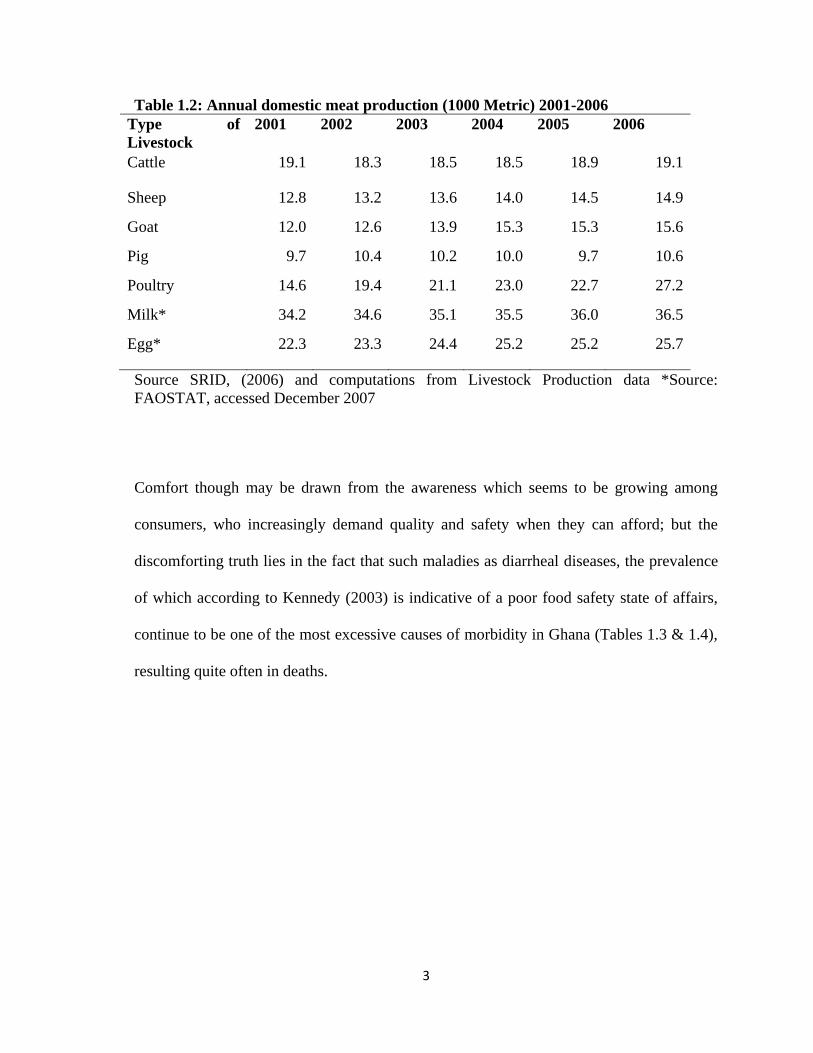
Table 1.2: Annual domestic meat production (1000 Metric) 2001-2006
Type of
Livestock
2001 2002 2003 2004 2005 2006
Cattle 19.1 18.3 18.5 18.5 18.9 19.1
Sheep 12.8 13.2 13.6 14.0 14.5 14.9
Goat 12.0 12.6 13.9 15.3 15.3 15.6
Pig 9.7 10.4 10.2 10.0 9.7 10.6
Poultry 14.6 19.4 21.1 23.0 22.7 27.2
Milk* 34.2 34.6 35.1 35.5 36.0 36.5
Egg* 22.3 23.3 24.4 25.2 25.2 25.7
Source SRID, (2006) and computations from Livestock Production data *Source:
FAOSTAT, accessed December 2007
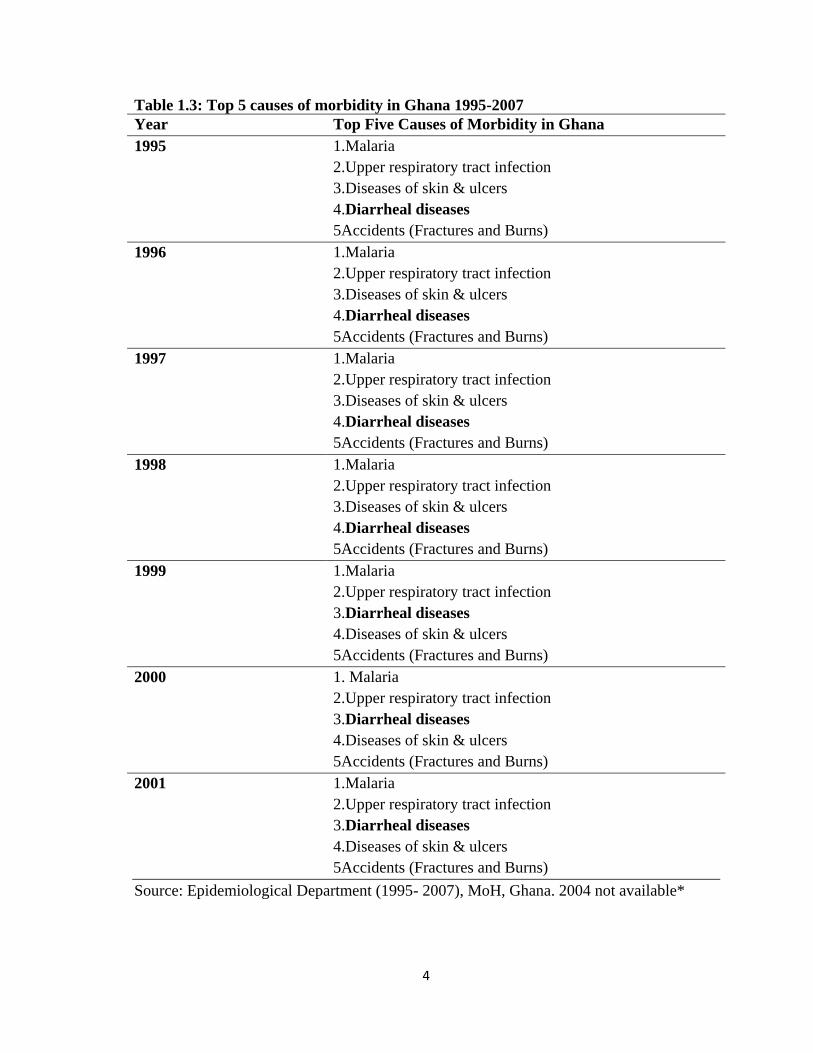
Comfort though may be drawn from the awareness which seems to be growing among
consumers, who increasingly demand quality and safety when they can afford; but the
discomforting truth lies in the fact that such maladies as diarrheal diseases, the prevalence
of which according to Kennedy (2003) is indicative of a poor food safety state of affairs,
continue to be one of the most excessive causes of morbidity in Ghana (Tables 1.3 & 1.4),
resulting quite often in deaths.
4
Table 1.3: Top 5 causes of morbidity in Ghana 1995-2007
Year Top Five Causes of Morbidity in Ghana
1995 1.Malaria
2.Upper respiratory tract infection
3.Diseases of skin & ulcers
4.Diarrheal diseases
5Accidents (Fractures and Burns)
1996 1.Malaria
2.Upper respiratory tract infection
3.Diseases of skin & ulcers
4.Diarrheal diseases
5Accidents (Fractures and Burns)
1997 1.Malaria
2.Upper respiratory tract infection
3.Diseases of skin & ulcers
4.Diarrheal diseases
5Accidents (Fractures and Burns)
1998 1.Malaria
2.Upper respiratory tract infection
3.Diseases of skin & ulcers
4.Diarrheal diseases
5Accidents (Fractures and Burns)
1999 1.Malaria
2.Upper respiratory tract infection
3.Diarrheal diseases
4.Diseases of skin & ulcers
5Accidents (Fractures and Burns)
2000 1. Malaria
2.Upper respiratory tract infection
3.Diarrheal diseases
4.Diseases of skin & ulcers
5Accidents (Fractures and Burns)
2001 1.Malaria
2.Upper respiratory tract infection
3.Diarrheal diseases
4.Diseases of skin & ulcers
5Accidents (Fractures and Burns)
Source: Epidemiological Department (1995- 2007), MoH, Ghana. 2004 not available*

5
Table 1.4: Top 5 causes of morbidity in Ghana 1995-2007
Year Top Five Causes of Morbidity in Ghana
2002 1. Malaria
2. Acute Respiratory Infection
3. Skin Diseases and Ulcers
4. Diarrheal Diseases
5. Hypertension
2003 1.Malaria
2.Acute respiratory
3.Skin Diseases & Ulcers
4.Diarrheal diseases
5.Hypertension
2005 1.Malaria
2. Acute Respiratory Tract Infection
3. Diarrheal Diseases
4. Skin Diseases and Ulcers
5. Hypertension
2006 1.Malaria
2.Acute Respiratory infection
3.Diarrheal diseases
4.Skin Diseases and Ulcers
5.Hypertension
2007 1.Malaria
2.Acute respiratory infection
3.Skin Diseases and Ulcers
4.Hypertyension
5.Diarrheal disease
Source: Epidemiological Department (1995- 2007), MoH, Ghana. 2004 not available*
One ASF of concern is raw cow‘s milk. Its functions though are several including growth,
supply of energy, reproduction, maintenance and repairs, and appetite satisfaction
(O‘Connor, 1994). It has also been referred to as the most nearly faultless food elaborated
by nature because of its exceptional nutritional qualities (Forster et al, 1958). However,
apart from having the potential to cause FBD‘s just like all other foods (CAC/RCP 57-
2004), it has been found to be solely responsible for a lot more sicknesses than all other

6
foods taken together, a fact hardly surprising as it is just about the sole ASF consumed raw
(Hattie, 1927). It presents an excellent medium for bacterial growth and thus is an
important source of several significant zoonotic/ bacterial infections when consumed
without pasteurization (Donkor et al., 2007). Among the numerous bacterial diseases
frequently associated with its consumption is Listeriosis (WHO, 1962) caused by Listeria
monocytogenes. Other bacterial diseases also catalogued by the WHO can be found on
Table 1.5.
Table 1.5: Bacterial diseases transmissible to man through milk consumption
Diseases Principal sources of infection
Man Animal Environment
Cholera X
Diphtheria X
Shigellosis X
Typhoid fever X
Patho. E. coli Infection X X
Paratyphoid fever X X
Salmonellosis X X
Staph. Entero. Gastroenteritis X X
Streptococcal Infections X X
Tuberculosis X X
Anthrax X
Brucellosis X
Leptospirosis X
Listeriosis X
Botulism (toxin) X
Clostridium perfringens
Infection
X
Enteritis (non-specific) X
Rat-bite fever X
Source WHO, 1962
7
1.2 Risk Profile of L. monocytogenes
Listeriosis, in humans, is a group of disorders caused by a small, short Gram-positive, non-
spore-forming, non-acid fast, rod-shaped bacterium, Listeria monocytogenes (Winter et al.,
2004) with an annual incidence of 1.6 - 6 cases per million people (Rocourt et al., 2000). It
has been found in at least 37 mammalian species, 17 bird species, and both fish and
shellfish; and is also believed to be present in up to 10 percent of humans (CFSAN, 1992)
of which 3-10% present no signs of illness (Santiago et al., 1999).
Being recalcitrant to several environmental stresses, it is widely distributed in nature and
has been isolated from as many sources including mud (Weis and Seeligeri, 1975), water
(Dijkstra, 1982), decaying vegetation (Welshimeri, 1968) and silage (Gronstol, 1979). It
resists the deleterious effects of freezing, drying and heat to remarkable extents (CFSPH,
2005). It has a temperature growth range of -0.5 to 45 °C (Petron and Zottola, 1989), with
an optimum at 30°C- 37°C (Juntilla et al., 1988). It therefore defies decades old
conventional wisdom which held that food stored under refrigerated temperatures (< 7°C)
would remain safe as pathogenic bacteria could not grow under such conditions (Marth,
1998). Likewise, to the other temperature extreme, a study by Fleming et al., (1985) also
suggests that the efficiency of pasteurization could be directly correlated with the level of
contamination. L. monocytogenes is also capable of growth in 10% NaCl solution (aw =
0.94) and survive in 20% NaCl solution (aw = 0.88). It could grow in acidic media, with pH
as low as 4.3 (George et al., 1996) and can tolerate a pH as low as 3.6 (CFSPH, 2005).
8
Thus, the ingestion of improperly fermented or moldy silage has become recognized as a
primary source of listerial infection in sheep, goats and cattle (Felon, 1986) where it
presents such symptoms as abortions, septicemia, and with central nervous system (CNS)
involvement facial paralysis with profuse salivation, circling, in-coordination, and head
pressing or turning of the head to one side (CFSPH, 2005). Consequently, the relation
between ingestion of listeriae-contaminated silage, mastitis in dairy cattle and subsequent
asymptomatic shedding of listeriae in milk destined for human consumption has been
noted (Arimi et al., 1997). This organism can also establish itself in food processing
environments by forming biofilm making sanitation difficult (Blackman and Frank, 1996)
and thus contamination could occur where hygienic regimen is inadequate.
L. monocytogenes is an emerging food-borne pathogen (WHO, 2002). However, it was not
until the 1980‘s that its significance as a foodborne pathogen was recognized when
evidence of outbreaks were traced to food though it had long been known as an animal
pathogen (Schlech et al., 1983). Ironically, its contamination of food soon became a major
cause of food recalls. According to Wong et al., (2000) between 1994- 1998 contamination
with L. monocytogenes was the leading cause of food recalls by the FDA.
Listeriosis, the group of disorders caused by this organism, may be non-invasive and take
the form of gastroenteritis characterized with such symptoms as chills, headaches,
diarrhea, abdominal pain and cramps, nausea, vomiting, fatigue, and myalgia. However, it
prefers to occur in the invasive form with severe, potentially fatal symptoms (Doyle,
2005). Predominant clinical manifestations of human listeriosis are meningoencephalitis,
9
septicaemia and abortions. The mortality rates for healthy humans could be 20-30% but
could reach as high as 80-99% in immunocompromised individuals (Gray and Killinger,
1966). Fetal infection can also result in premature births, spontaneous births, still births, or
early-onset neonatal listeriosis with a mortality rate of 20-30% (Lober, 1997). The baby
may also be born asymptomatic but may develop fatal form of meningitis after several
weeks due to infection at delivery (Gellin et al., 1991). Other conditions reported include
septic arthritis, osteomyelitis and pneumonia (CFSPH, 2005).
L. monocytogenes accounts for just about 2,500 illnesses (<1%) of an estimated 76 million
annual cases of FBD‘s in the United States of America, yet it is responsible for about 500
(27.6%) of related deaths per year (Mead et al., 1999). Also, with an increase from 90.5%
in 2000 (USDA, 2005) to 97.0% (CDC, 2006), it easily still continues to be culpable for
the highest rates of hospitalizations among the foodborne diseases tracked by the FoodNet,
only followed remotely by Shiga-toxin producing Escherichia coli (STEC 0157) at 42%.
Almost all cases (i.e. about 99%) of listeriosis are associated with food consumption
(Mead, et al., 1999) and as reason would have it the organism has been isolated from
various foods of both plant and animal origin (Farber and Peterkin, 1991) with high-risk
foods having the potential for contamination, supporting its growth in high numbers, being
stored under refrigeration for extended periods and do not require further preparation
before consumption (ILSI, 2004). Thus, L. monocytogenes has been associated with raw
vegetables, fermented raw-meat sausages, raw and cooked poultry, raw meats, raw smoked
fish and dairy products (Farber and Peterkin, 1991). Flemming et al., (1985) further

10
emphasized the rather special link between dairy products and Listeriosis. Probably its
worst outbreaks in the US, resulting in 28.3% and 33.8% mortality rates, were linked to the
consumption of dairy. In the first, Mexican self-styled cheese was responsible for nearly
300 cases, including 85 deaths (Ryser, 1999). Also in the second, out of 142 cases, 48 died
(Linnan et al, 1988). Illegally manufactured cheese from a mixture of raw and pasteurized
milk in an environment contaminated with listeriae was the culprit.
1.3 Statement of Problem
Whilst a rapidly growing population (2.7%), increasing urbanization (43.8% in 2000)
(Asante, 2004) and rising income levels suggests a high demand for livestock products
(WHO, 2003), indications are that the per capita consumption of these products continue to
be stagnated in Ghana (FAO STATS, 2009). This could suggest an unsatisfied demand as
estimates are that Ghana is not self-sufficient in animal products (NMTIP, 2005), having to
rely on imports to partially make up for shortfalls (Ghana FAO/ WB CP, 2005). To the
country, this could imply an ever increasing cost of food importation bill dependent on the
foreign exchange earnings (Asante, 2004) and to the consumer, could be contingent on the
availability of disposable income (Omore et al, 2003). As per the exposé, consumption of
dairy in Ghana has been low; it was 6kg LME (Liquid Milk Equivalent) which is far below
the 120kg for sub-Saharan Africa (Omore, et al., 2003).
Ironically, local production does not meet demand (Ghana: FAO/ WB CP, 2005).
Nevertheless, as part of the Agriculture sector, it contributes immensely to food security in
the country (Asuming- Brempong, 2003) and its production in Ghana is mostly pastoral
11
and agro-pastoral (Tonah, 2003) requiring no complementary feed (Ghana: FAO/ WB CP,
2005). Though this could imply that associated costs are quite low as it is down to the
availability of grass on open pasture, such free-range feeding makes it difficult to apply
conservative measures to ensure production of wholesome milk devoid of zoonotic and
other contaminating microorganisms to guarantee consumer safety (Grimaud et al., 2005).
Ensuing milk handling practices also greatly influence the proliferation of these pathogens.
Abraham and Laryea (1968) reported an approximate mean count of 1.97 x 10⁴ per ml for
milk produced by the University of Ghana Agricultural Research Station in comparison to
3.0 x 10⁶
per ml to that produced by the Fulani Kraals, also on the Accra plains. The latter
however is anticipated to produce the bulk of milk in the country (Omore et al., 2002) of
which over 80% ends up on the informal markets (Omore et al. 1999) where Omore et al.,
(2003) have described how hygienic practices could be both poor and expensive. Besides,
one can neither refute the likelihood of post-pasteurization contamination (Omore et al.,
2003) nor the lack of pasteurization (Donkor et al., 2007) in such market channels. On the
other hand, as or when heating of the milk was done, it may not be adequate since this
practice has not been standardized and heat-injured L. monocytogenes have been shown to
be able to grow during latter storage as reported by Garayzabel et al, (1987).
Furthermore, consumers do not receive instructions on safe handling of dairy products sold
on such markets as required by the Code of Hygienic Practice for Milk and Milk Products
(CAC/RCP 57-2004). This does not disparage the difficulty such an endeavor would have
as Omore et al., (2003) observed the lack of formal education among agents on such
12
markets. Yet generally, except for psychrotrophs, proliferation of bacteria could be
suppressed if milk is kept properly chilled (LeJeune and Raja, 2009); but alas it is not
(Ghana: FAO/ WB CP, 2005).
Therefore, rising concerns on issues of safety and quality of such dairy products has
adversely affected patronage (Donkor et al., 2007). In the two major cities in Ghana (Accra
and Kumasi), Donkor et al (2007) found that these dairy products could carry pathogenic
bacteria after isolating Yersinia sp. (19.8%), Klebsiella sp. (16.7%), Proteus sp. (7.3%),
Enterobacter sp. (6.3%), Escherichia coli (2.1%), Staphylococcus sp. (14.6%) Bacillus sp.
(11.5%) and Mycobacterium sp. (1%) among others from 96 samples analyzed.
Notwithstanding this, consumption has increased, and consumers, while expecting better
safety relative to other food channels, have shown good faith by paying more for fresh
local products as compared to that from imported processed milk powder (Ghana: FAO/
WB CP, 2005). Hence, it is submitted that efforts should be made to enhance the safety
and quality of domestic milk production. Ultimately, this could contribute to achieving the
broader objectives of poverty reduction, development of sustainable use of natural
resources, and food security, which are key to NePAD of which Ghana is a signatory.
This work is all the more vital not only because of the anticipated lack of pasteurization
(Sampane-Donkor, 2002) and the potential for post-pasteurization contamination (Donkor
et al., 2007) but also the lack of adequate refrigeration along informal milk marketing
channels which could promote the growth of psychrotrophs. Hence the essence of
13
establishing the significance of this pathogen as part of efforts to ensure food safety and
safeguard public health, especially in a country where any impact could easily assume
other dimensions, and resources it seems do not nearly abound as do their dearth.
1.4 Scope
This study quantitatively assessed the risk of consuming dairy products contaminated with
L. monocytogenes from the informal markets at Ashaiman using a stochastic model and
determined the best control option to reduce the risk by simulation with the risk model.
1.4.1 Specific Objectives
i. Estimation of the prevalence and level of L. monocytogenes in informally marketed
milk/ milk product
ii. Estimation of the level of the risk of consuming informally marketed milk
contaminated with L. monocytogenes
iii. Identification of the potential sources of contamination of informally marketed
milk
iv. Determination of possible recommendations for intervention/ mitigation strategies

14
CHAPTER TWO
LITERATURE REVIEW
2.1 Agriculture Sector in Ghana
Annual GDP comparison of the various sectors of the economy rendering the WB
Development Data, Ghana Data Profile and Details of the Agriculture sector from the BoG
Annual Report (2006) reveals that this sector directs the country‘s economy (Fig 2.1).
Furthermore, over 90% of food needs of the country are provided for by it (Oppong-
Anane, 2001) either directly (by making food available by supplying food commodities in
full or in part, and contributing to foreign exchange incomes used for importing shortfalls)
or indirectly (by creating avenues for earning income, and contributing considerably to
food prices critical to household food security) (Asuming- Brempong, 2003).
Unfortunately, it is still rudimentary and dominated by smallholder food crop/ livestock
farmers (SRID, 2001) who represent the group with the highest poverty incidence at 59%.
Figure 2.1: Comparism of various sectorial GDP’s with the national economic growth

15
2.1.1 Livestock sub-Sector in Ghana
Livestock is an important part of the livelihoods of most Africans. Its socio-economic and
cultural significance in the lives and livelihoods of smallholder farmers, processors and
traders cannot be derided. In farming communities ruminant livestock is a partial display
of wealth, used for payment of dowry, and acts as a bank and insurance in times of
difficulty. Sheep and goats are often killed for various ceremonies such as births, funeral
and marriages (MoFA, 1990). In Ghana, estimates are that about 1.5 million households in
1999 had livestock (Asante, 2004).
2.1.2 Production and Consumption of ASFs in Ghana
The increased ASFs production in Ghana is an indication of a commensurate increase in
demand as she barely exports such products. However, production has not caught onto
consumption and hence the need for importation (Ghana: FAO/ WB CP, 2005), a trend
seemingly limited only by access to foreign exchange. Some indications are that demand is
so high that not even the hide of animals is spared as food material (Hogarh, et al., 2008).
2.1.3 Meat and Meat Product Consumption in Ghana
According to SRID (2001) Ghana produced an estimated 66,283 MT of meat and meat
products in the year 2000 of which beef contributed about 27%, mutton about 18%, goat
and pig meat about 17% each, and poultry meat about 21%. With milk production
however, they represented only about 30% of the national animal protein requirement.
Further rendering the VSD Annual Report (2007) domestic production of meat of
18,875MT in 2005 was more than double the quantity imported to make up for short falls

16
(at 8,588.8MT). The following year though imports due to shortfalls almost doubled to
15,302.8MT whiles domestic production managed only a marginal increment of less than
2% to 19,140 MT. Subsequently, the year 2007 imports now stood at 24,359.4MT in
comparison to 19,346 MT for local production (Table 2.6). This was an indication of the
nation‘s ever-growing demand for ASFs and also its dependency on foreign imports.
Table 2.6: A comparison of domestic production and imports (000) MT (2000/07) 2000 2001 2002 2003 2004 2005 2006 2007
Domestic
production
18,570
19,053
18,288
18,486
18,686
18,874
19,140
19,346
Imports 869.5 154.2 1,063.5 1,362.1 3,756.0 8,588.8 15,302.8 24,359.4
Total 19,439.5 19,207.2 19,351.5 19,848.1 22,442.0 27,462.8 34,442.8 43,705.4
Source VSD Annual Report, 2007
2.1.4 Milk and Milk Product Consumption in Ghana
In Africa, the development of dairy has been hindered by marketing constraints
(International Development Research Center (IDRC), 1984). Efforts aimed at addressing
these obstacles have historically focused on the establishment of large scale centralized
processing plants to meet the liquid milk demand of urban dwellers (von Marsow, 1985).
Yet, the failure of collection systems and unattractive prices offered for locally produced
fresh milk have made them dependent on imported butter oil and skim milk powder.
Ghana‘s case was no exception (Ghana: FAO/WB-CP, 2005). This has been coupled with
milk surplus and deficit areas that according to Omore et al., (2003) presented a difficult
situation for its marketing. This was attributed to an inefficient transportation of milk
which led to deterioration. Flow of milk and milk products to consumers along the formal

17
food sector was based on the importation of milk powder, butter and cream (Ghana: FAO/
WB CP, 2005). The other conduit depended on local production based mainly on
indigenous breed cows with low yield (1-2L/day) during 100- 150 days per annum.
However, substantial quantities of milk were able to be collected by adding milk from
several thousands of low-yielding cows (Okantah, 1992). Most of this milk was consumed
by the family locally or processed for sale on the informal markets.
These local markets traditionally have targeted the Fulani communities, but increasingly
too other unconventional consumers who have developed the taste for the dairy products.
Hitherto, populations in the coastal and southern parts of the country had not been known
for dairy consumption as Trypanosomiasis and other diseases made cattle keeping costly.
But as northerners migrated down south and Western-style dairy products were introduced
dairy product consumption also grew countrywide (Omore et al., 2004).
2.2 Informal Milk Marketing in Ghana
According to Omore et al., (2004), traditional dairy product markets characteristically
differed in several key ways. This depended on the types of product(s) handled, number of
intermediaries involved, and the role each plays. In Ghana, such markets are characterized
by an enormous array of market intermediaries, playing somewhat different but often
overlapping functions distinguished by scale of operation and clientele (Omore et al.,
2004). Some main types of milk marketing agents in Ghana are found on Table 2.7.

18
Table 2.7: Informal milk market agents in Ghana
Types of sellers Description
Producer-seller Producers who also sell their milk. In Ghana,
herdsmen or their wives who sell their own milk at
the Kraal or in the village, rural town or road-side.
Private Wholesalers/ Assemblers These buy milk in bulk from producers or from rural
Assemblers and sell it to Retailers. No chilling is
used. They are bulkers in the marketing chain
Retailers Retailers present milk to consumers in the smallest
desirable quantity, and in a convenient form and
location. These are largely open-air road-side sellers
Fura sellers These food-drink sellers are mainly in urban centers
of Ghana. They buy milk from the kraal, Assemblers
or from wholesalers and retail it combined with balls
of cooked cereal, Fura, as a snack or meal.
Source Omore et al., 2003 (Abridged version)
Significantly, most milk collected was sold directly to individual consumers at the farm
gate/ Kraal and any excess was often taken to other sale points to sell. House delivery is
mainly to local processors (referred to as makers of traditional cheese ―wagashi”, who
operated from their residences), milk Assemblers and Consumers who had a supply
contract with the milk seller. Stockmen deliver fresh milk daily to these buyers. Stockmen
who do not have established buyers or who could not hawk their milk often assembled at a
place in the center of town to sell their produce. An example is at Tulaku, Ashaiman
(Omore et al., 2003) where Omore et al., (2004) have noted the sale of raw fresh milk,
boiled milk, naturally fermented milk products (i.e. Nunu and Nyarmie), wagashi and ghee.
19
2.2.1 Handling of Milk/ Milk Products in Ghana
Producer-herdsmen mostly used plastic buckets to receive milk during milking though
calabashes or aluminum bowls were also used. Milk procuring agents also used various
vessels yet plastic gallons and jerry cans were the most preferred. These are prone to
bacterial contamination. Less than one per cent used the recommended aluminum milk
cans/ churns (Omore et al., 2003). Reports by Abraham and Laryea, (1968) and Donkor et
al., (2007) among others indicated poor hygienic handling of raw milk in the country.
2.3 Microbial Ecology of Raw Cow’s Milk
Milk is virtually sterile when secreted into the alveoli of the udder from specialized cells of
the mammary gland where it is synthesized (Tolle, 1980). Hereafter, milk produced is
vulnerable to microbial contamination from three main sources (Bramley and McKinnon,
1990); from within the udder, from the exterior of the udder and from the surface of milk
handling and storage equipment. Also, during storage, microbial contaminants could
multiply and increase in numbers (Murphy and Boor, 2008). These and other factors such
as seasonality (Psoni et al., 2003) and geographic locality (Poznanski et al., 2004) affect
the microbial composition of raw milk and consequently of raw milk products.
Bacteria are the most encountered group of microorganisms in milk where they play
various functions, some of which are beneficial and others harmful. These include
spoilage, processing (e.g. fermentation) and causing of FBD‘s (O‘Conner, 1994).
However, it is rather their infamous role of the latter that has gained them much popularity
and notoriety as far as public health safety is concerned. About 90% of all dairy-related

20
illnesses reported are of bacterial origin (Headrick et al., 1998). Fortunately, most of these
disease causing bacteria can be eliminated from milk by pasteurization (USDA, 1981).
2.3.1 Milk Pasteurization (Low-Heat Treatment)
Pasteurization is the application of heat to food at temperatures that would destroy non-
spore forming pathogenic micro-organisms (Jay et al., 2005). All portions of the food is
heated to at least the minimum required temperature and held there for at least the
minimum required time. In Ghana a large part of milk processed is correctly pasteurized as
directed by the Ghana Standards Board (GSB) (i.e. 85ºC for 30minutes) (Ghana FAO/ WB
CP, 2005). Unfortunately, this excludes local dairy products sold on the informal markets
from whom the risk of zoonoses exists as Donkor et al., (2007) concluded.
2.4 Foodborne Zoonoses in Ghana
2.4.1 Anthrax
Anthrax is a zoonotic disease both of mammals and humans caused by Bacillus anthracis.
In Africa, outbreaks involving both domestic and feral animals are quite common
(Turnbull et al., 1991). Frequent outbreaks have occurred in livestock in Ghana especially
in the northern regions (Opare et al., 2000) despite the long history of local anthrax spores
vaccine production by the VSD (VSD Annual Report, 2003). These outbreaks are often
strongly associated with outbreaks in humans claiming more than thousand lives (Opare et
al., 2000). The WHO (2009) has indicated a possible link with animal tissue consumption.

21
2.4.2 Tuberculosis (TB)
Though infection with other members of the Mycobacterium tuberculosis complex and
several variants could cause Tuberculosis (TB), Mycobacterium tuberculosis accounts for
most human TB cases (de la Rua- Domenech, 2006). In Africa bovine tuberculosis has
been a major cause for concern (Benkirane, 1998). Limited data available suggests that at
least 10% and in some villages up to 50%, of Human TB was caused by M. bovis
infection, yet rarely has the disease been associated with infection in cattle (Wastling et al.,
1999). In 2002, the OIE declared 692 human cases of bovine TB in Ghana (Ghana: FAO/
WB CP, 2005). Compared to the annual incidences of human TB that year, its worth is
startling considering a potential contribution of >10% to the human cases (Table 2.8).
Table 2.8: Human Tuberculosis reported in Ghana, 1995-2007
Year Number of human disease of TB
1995 8388
1996 7254
1997 7930
1998 7890
1999 7191
2000 6905
2001 8412
2002 7564
2003 7487
2004 6458
2005 7592
2006 6067
2007 8391
Source: Morbidity Data, Epidemiological Department, MoH, 1995- 2007, Ghana.
2.4.3 Brucellosis
Brucellosis is a disease caused by organisms of the genus Brucella, and frequently enough
the species abortus has been implicate in bovine brucellosis (Berman, 1981). Infection was
22
usually occupational in humans, and for those that did not frequently come into contact
with animals, tissues and bacteria, another recognized route of infection was by ingestion
of unpasteurized dairy products (CFSPH, 2005). According to Omore et al., (2002) as
long as the practice of consuming fresh unpasteurized milk or unboiled milk continues to
be widespread in Ghana, the risk of acquiring zoonotic diseases such as brucellosis through
milk consumption was still considerable. This was concluded finding that overall 30.5%
and 25.0% of milk samples tested by the Milk Ring Test (MRT) and ELISA, respectively
had brucella antibodies.
2.4.4 Other Emerging Foodborne Zoonoses in Ghana
There are however other zoonoses that increasingly also demand attention. These include
the threats of Toxoplasmosis caused by Toxoplasma gondii, and Listeriosis caused by L.
monocytogenes. Wastling et al., (1999) has documented that quite a number of recent
studies indicated a high seroprevalance of T. gondii in pigs and goats in Ghana (up to 40%)
whiles Osei-Somuah et al., (2000) have also isolated Listeria sp. from sheep (which were
food animals), on the Accra plains. The ill-fated anticipation was for the significance of the
latter to increase even more as refrigeration becomes ever more the major means of food
storage.

23
2.5 Rapid Rural Appraisal (RRA)/ Participatory Rural Appraisal (PRA)
2.5.1 Participatory Approach
There has been a lot of scientific effort aimed at improving animal health and ultimately
safeguarding public health. These researches in the recent past have been quantitative in
nature and often time consuming and expensive requiring extensive physical or social
sampling at high costs. Moreover, these are seldom flexible: once designed and initiated,
leaves little room for adjustments, and inappropriate or ineffective enquiries cannot be
deleted. The research team was thus stuck with the process until its completion (Chambers,
1983). Thus the importance of its result was not guaranteed. To address this situation
alternative systems of inquiry have since been developed which include Rapid Rural
Appraisal (RRA) and Participatory Rural Appraisal (PRA) which, to varying extents, enable
local people to assume more active roles in defining, analyzing and solving their own
problems. From RRA to PRA, the researcher‘s role modifies from being predominantly an
‗extractor‘ of information to a facilitator of community development. Key among the
principles of PRA were that of rapid cumulative learning, direct contact, reversals, optimal
ignorance and appropriate imprecision, and triangulation. These have led to the
development and use of methods that are uniquely user friendly. Examples include
analytical games, workshops (e.g. with key informant), diagrams (e.g. mapping), semi-
structured questionnaires (e.g. checklist) and direct and participants observations (or do-it-
yourself activities). Analysis of collected data depended on its nature. Qualitative data
could be categorized into mutually exclusive groups and analyzed whiles simple statistical
analysis may be done for quantitative data (Bhandari, 2003). Donkor et al., (2007), which
assessed the bacterial contamination of informally marketed raw milk in Ghana, was
facilitated by application of PRA methods.

24
2.6 Microbial Risk Assessment
Microbiological Risk Analysis (MRA) is a process consisting of three components: Risk
Assessment, Risk Management, and Risk Communication, with the overall objective to
guaranteeing public health protection. The Codex Alimentarius Commission document
CAC/GL-30 (CAC, 1999) defined risk assessment for microbiological hazards in foods as
a scientifically based process with four components: hazard identification, exposure
assessment, hazard characterization, and risk characterization (Figure 2.2) (CAC, 1999).
Figure 2.2: Protocol for microbial risk assessment (CAC, 1999)
However, a very important first step relevant to risk assessment is the risk profile, the
purpose of which is to inform the decision on what further scrutiny is needed and whether
Risk profile
Hazard Identification
Hazard
characterization
Exposure assessment
Risk characterization

25
resources should be allocated to a more detailed scientific assessment (FAO/WHO, 2002).
Information included here are facts on the microbiological hazards of concern, their source
or pathway of entry to the food chain, and the difficulties faced in controlling them; an
indication of the available data on prevalence and numbers of the microbial hazard of
concern in the food chain; disease incidence data and the type and severity of adverse
effects; at-risk populations; and possible control options available (CAC, 2007).
The hazard Identification (H.I) qualitatively evaluates microbial hazards of concern in
food. These include infectious agents and toxins produced. For emerging microbial hazards
H.I must be fully developed. Yet, as the food-pathogen combination for most are
established this could be direct and simple if a comprehensive risk profile has been
developed as part of the management process (WHO/ FAO, 2008) as done in section 1.2.
Hazard characterization (H.C) quantitatively and qualitatively evaluates the severity and
consequences of the adverse effects that may result from ingestion of a microorganism and
a dose-response relationship. It also gives information on the pathogenicity of the organism
and the food matrix and its predisposition to contamination. Exposure Assessment (E.A)
provides an estimate of the probability that an individual or a population would be exposed
to a microbial hazard and the numbers of organisms that are likely to be ingested
(Lammerding and Fazil, 2000). Risk Characterization (R.C) is the assimilation of the
Hazard Identification, Hazard Characterization and Exposure Assessment to estimate risk
(i.e. an estimate of the likelihood and severity of the adverse effects that occur in a given
population, with associated uncertainties).

26
2.6.1 Risk Assessment of L. monocytogenes-- a Foodborne Pathogen
2.6.1.1 Hazard Identification (H.I)
In March 1910, Gustaf Hülphers, a veterinarian, described a bacterium that caused necrosis
of the liver after performing autopsies on two rabbits. He named the bacterium bacillus
hepatis because of its affinity to the liver, from where he had isolated it (Hülphers, 1911).
It was non-spore- forming, non-acid-fast short rod with optimum growth temperature of
37°C- 38°C and was a facultative anaerobic. It was provided with a cilium and had a
distinguishing motility pattern. Murray et al., (1926) isolated the same organism from
laboratory rabbits after autopsies. They named it Bacterium monocytogenes. Pirie (1927)
isolated the same organism from gerbilles. The disease caused was termed ‗Tiger River
Disease‘ as it was discovered near the Tiger River in South Africa. The causative Gram-
positive organism was named Listerella hepatolytic. The two species were identical. Pirie
(1940) named it Listeria monocytogenes. Its first isolation in humans was in 1929 (Nyfeldt,
1929). Other species of the Listeriae (Table 2.9) were discovered after 1961.
2.6.1.1.1 Characteristics of Listeriae
All species of Listeria produce catalase though some catalase-negative strains of L.
monocytogenes have been isolated (Hogan et al., 1998). L. monocytogenes, L. seeligeri and
L. ivanovii hemolyse red blood cells on blood agar; L. monocytogenes and L. seeligeri
produce a narrow zone of hemolysis while a wider zone surround colonies of L. ivanovii.
Sugar fermentation tests are also important in differentiating between them (Table 2.9). L.
monocytogenes is the main human pathogen (Jones et al., 2008) even though L .ivanovii
and L. seeligeri has at least once been associated with listeriosis (Cummins et al., 1994).

27
Table 2. 9: Characteristics of the Genus Listeria
L.
monocyt
ogenes
L.
innocua
L.
seelige
ri
L.
welshi
-meri
L.
grayi
L.
ivanovii
subsp.
ivanovi
L.
ivanovii
subsp.
londoniensis
Tumbling
Motility
+ + + + + + +
Catalase
production
+ + + + + + +
Haemolysis + - + - - + +
CAMP-test
(Staph.
Aureus)
+ - + - - - -
CAMP-test
(Rhodococcus
equi)
- - - - - + +
L-rhamnose + D - d - - -
D-xylose - - + + - + +
Hippurate + + - + +
Ribose - + -
Source: Seeliger and Jones (1986).
2.6.1.1.2 Isolation and Detection of Listeriae
A definitive diagnosis of listeriosis is when the organism is isolated from a normally sterile
site (usually blood, placenta or cerebrospinal fluid) from a patient with a compatible illness
(Anon, 1997). However, the identification of L. monocytogenes as having caused it via
food is made complex due to the high carrier rate in humans. Thus, the organism must be
isolated from food for confirmation (FDA/CFSAN, 2003). This is very difficult as food
could be heavily contaminated with other bacteria as well. Therefore standard
identification relies on selective enrichments and biochemical identification (Almeida and
Almeida, 2000). Selective enrichment restrains numbers of contaminating organisms
whiles encouraging the multiplication of Listeriae to allow for detection (OIE, 2008).

28
To this end, selective enrichment agents which allow for growth of the organism at normal
incubation temperatures (OIE, 2008) are employed. Examples are cycloheximide, lithium
chloride, nalidixic acid and acriflavine (AFNOR, AOAC, 2000; Hitchins, 1998). This has
led to the development of a variety of conventional methods whose major differences
appear to be how which type(s) of selective enrichment agent(s) are applied (Donnelly,
1999). Selective enrichment, either one- or two-step, is performed at 30–37°C. Enrichment
media used include Listeria Enrichment Broth (LEB) [Lovett et al. (1987); McClain and
Lee (1988)] and Fraser Broth (Fraser and Sperber, 1988). They contain the inhibitory
agents nalidixate and acriflavine but the latter contain also lithium chloride for selectivity
and ammonium citrate for detecting hydrolysis of Esculein leading to blackening of the
broth.
Subsequently, broth is spread on solid media plates also containing Esculein. Commonly
used are Oxford (Curtis et al. 1989) and PALCAM (van Netten et al. 1989) though there
are others such as the Listeria selective agar (LA) (Curtis et al., 1989). On PALCAM
Listeriae colonies are approximately 2 mm grey-green with a black sunken center and a
black halo on a cherry-red background. Depending on the numbers, the entire media may
turn black. On the OXA L. monocytogenes forms 1 mm diameter black colonies
surrounded by black haloes after 24 hrs. At 48 hrs colonies are 2-3 mm in diameter, black
with a black halo and are also sunken at the center (Pagotto et al., 2002)
Further tests have been developed that can even differentiate between Listeriae. These do
not only include L. monocytogenes blood agar, LMBA, (Johansson 1998) which employs

29
the hemolytic activity of listeria to distinguish between Listeriae and other organisms and
also between the Listeria sp. but also chromogenic media such as BCM, and ALOA/
OCLA. Under this category are two groups: the first utilizes the cleavage by PI-PLC of L-
α-phosphatidyl-inositol, forming a white precipitation zone around the colony, combined
with the chromogenic substrate 5-bromo-4-chloro-3-indoxyl-β-glucopyranoside for
detection of β-glucosidase, which occurs in all Listeria sp. All Listeriae produce turquoise
colonies on these media which include ALOA™, CHROMagar™ Listeria, BBL™
CHROMagar™ Listeria, and OCLA (Reissbrodt, 2004)
2.6.1.1.3 Morphology of Listeriae
Listeriae could appear coccoidal or filamentous (Rocourt, 1999). Cells may be found
singly or in short chains. Rods range between 0.4-0.5 μm in diameter and 0.5-2.0 μm in
length. On nutrient agar (after 24 hrs incubation) colonies appear round, 0.5-1.5 mm in
diameter, translucent and with a smooth shiny surface. It appears rough and increases to 3-
5 mm in diameter after 3-7 days. On dextrose, it is grey-white with a sour milk odor (Gray,
1956). On blood agar, it is enclosed by a hemolysis zone (Parihar, 2008).
2.6.1.1.4 Prevalence of L. monocytogenes in Cow’s Milk
Generally prevalence of Listeriae show wide variations in several foods. van Kessel et al.,
(2004), ascribed this as possibly reflecting differences among regions or because of
among-studies sample type or analytical methods. In a more recent study, Rodriguez-Otero
et al., (2007) detected Listeria spp. in 16.3% of bulk-tank milk samples, a much higher
prevalence than that previously reported in other related studies including 12.4% in Canada

30
(Farber et al., 1988), 4.1% in Finland (Husu, 1990), 8.3% in Ireland (Rea et al., 1992) and
10.4% in the United States (van Kessel et al., 2004). They found L. monocytogenes in
6.1% of tanks, which had exceeded the previously reported 3.6% (Gaya et al., 1998) in
Spain, 1.3% in Canada (Farber et al., 1988), 2.2% in Finland (Husu, 1990),
4.1% in the
United States (Rohrbach et al., 1992), 4.6% in the United States (Jarayao and Henning,
2001), 1.5% (Deutz et al., 1999) in Australia, and 1.7% (Adesinyun et al., 1996) in India,
albeit analogous to 6.5% in a recent study in the United States (van Kessel et al., 2004).
2.6.1.2 Hazard Characterization
Illness due to an exposure to a foodborne pathogen is dependent on the integration of
pathogen, host and food matrix effects (i.e. the infectious disease triangle). These factors
also affect the nature and consequence of the disease (i.e. invasive/ non- invasive illness).
2.6.1.2.1 Pathogenicity of L. monocytogenes
Usually, a typical infection begins with ingestion of L. monocytogenes via contaminated
foods which is able to endure the exposure to the host's proteolytic enzymes in the
stomach, a highly acidic environment (pH 2.0), bile salts and non-specific inflammatory
attacks. Its ability to survive and go pass this stage relies on a protein subunit of RNA
polymerase (RNAP) — alternative sigma factor σB (encoded by sigB) — that controls
stress-response genes (opuCA, lmo1421 and bsh) and linked proteins (Sleator et al., 2003).
Subsequent to the ingestion, L. monocytogenes adheres to and enters host cells both
passively through phagocytosis and actively through actions of listerial surface proteins
31
called internalins (Lecuit, 2005). Found on the listerial surface, Inl A binds itself onto the
surface protein E-cadherin on the surface of the host‘s epithelial cells. This interaction
apparently stimulates the phagocytosis of the organism (Kuhn and Goebel, 1999). As
listeriae are engulfed, they are enclosed within a single membrane layered vacuole.
Professional phagocytic cells begin almost immediately to kill the listeriae within the
vacuoles. Their survival depends on escaping from the vacuole. This is where another
protein Listeriolysin O (LLO) aids in its pathogenesis. It is a bacterial pore-forming toxin,
essential for lysing the vacuolar membrane and allowing L. monocytogenes to escape into
the cytoplasm (Beauregard et al., 1997) aided by both phosphatidylinositol- anchored
proteins phosphatidylinositol (PI-PLC) and Phosphatidylcholine (PC-PLC) (Vazquez-
Boland et al., 2001). Once escaped into the cytoplasm, replication where L. monocytogenes
replicates and spreads to new host cells for fresh nourishment (Auerbuch et al., 2001). A
surface protein, ActA induces polymerization of globular actin molecules to form polarized
actin filaments along which cells move to the cell membrane and cause portions of the
membrane to bulge outwards, forming listeriopods (Lopez et al., 1999) which are engulfed
by adjacent cells allowing dissemination of L. monocytogenes whiles evading the host‘s
immune system. Bacteria are then carried from the intestine to the liver and spleen where
most are killed by neutrophils acting with Küpffer cells (Doyle, 2005). If the host‘s T cell–
mediated immune response is inadequate, Listeriae soon multiply in hepatocytes and
macrophages and are carried via the blood to various organs, particularly the brain and/or
uterus where they penetrate the blood–brain barrier and the placental barrier (Doyle, 2005).
Individuals with inadequate immune response include the elderly, pregnant, unborn and
newly delivered infants, dialysis and diabetes mellitus patients and HIV infected persons.

32
2.6.1.2.2 Infectious Dose and Incubation Period
The development of listeriosis after ingestion of contaminated food depends on other
factors such as the size of the inoculum, virulence of the strain, and the susceptibility of the
individual (Peris, 2005). In documented outbreaks, contamination levels as low as 102-10
4
CFU/g have caused severe clinical disease (Linnan et al., 1988). In a cancer patient, >1100
L. monocytogenes CFU/g were found in implicated food (Wenger et al., 1990). Also, out
of 12 reported listeriosis outbreak linked with the G.I symptoms, the lowest level found in
food was 1.9 x 10⁵CFU/g (Miettinen et al., 1999).
However, dose-response data from human volunteer studies with L. monocytogenes or
from volunteer studies with a surrogate pathogen was non- existent. Instead, dose-response
relations have been generated and appraised based on expert elicitations, epidemiological
or animal data, or combinations of these (Martins et al, 1995). For example Buchanan et
al., (1997) used data on the incidence and level of L.momocytogenes contamination in a
single food product in Germany, and compared it with the incidence of listeriosis in
Germany. Two approaches widely applied to dose- response models were the beta-Poisson
and the Exponential models (Haas, 1983). According to the Exponential model bacterial
cells acted independently and each could potentially cause disease. Hence some regulatory
bodies such as the US/ FDA have a zero-tolerance policy to even its presence in RTE food;
1CFU in 25mL or 25g of food is not satisfactory legally. Incubation periods for outbreaks
run from days into months (Table 2.10).
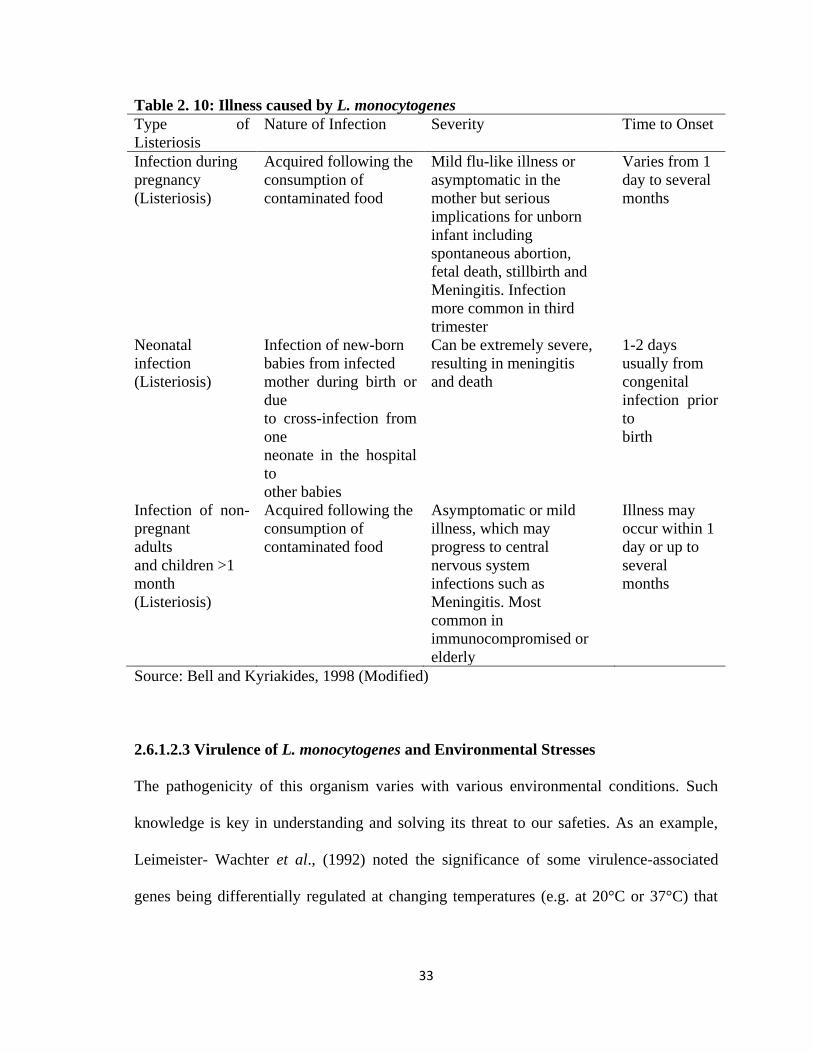
33
Table 2. 10: Illness caused by L. monocytogenes
Type of
Listeriosis
Nature of Infection Severity Time to Onset
Infection during
pregnancy
(Listeriosis)
Acquired following the
consumption of
contaminated food
Mild flu-like illness or
asymptomatic in the
mother but serious
implications for unborn
infant including
spontaneous abortion,
fetal death, stillbirth and
Meningitis. Infection
more common in third
trimester
Varies from 1
day to several
months
Neonatal
infection
(Listeriosis)
Infection of new-born
babies from infected
mother during birth or
due
to cross-infection from
one
neonate in the hospital
to
other babies
Can be extremely severe,
resulting in meningitis
and death
1-2 days
usually from
congenital
infection prior
to
birth
Infection of non-
pregnant
adults
and children >1
month
(Listeriosis)
Acquired following the
consumption of
contaminated food
Asymptomatic or mild
illness, which may
progress to central
nervous system
infections such as
Meningitis. Most
common in
immunocompromised or
elderly
Illness may
occur within 1
day or up to
several
months
Source: Bell and Kyriakides, 1998 (Modified)
2.6.1.2.3 Virulence of L. monocytogenes and Environmental Stresses
The pathogenicity of this organism varies with various environmental conditions. Such
knowledge is key in understanding and solving its threat to our safeties. As an example,
Leimeister- Wachter et al., (1992) noted the significance of some virulence-associated
genes being differentially regulated at changing temperatures (e.g. at 20°C or 37°C) that

34
accompany with L. monocytogenes' switch ―from environment to host, or vice versa‖
though it is remarkably stress tolerant (Sleator et al., 2003).
2.6.1.2.4 Acid Tolerance of L. monocytogenes
L. monocytogenes exposed to mildly acidic conditions develops acid tolerance and become
better able to invade and proliferate in cultured cells than non-acid-tolerant bacteria (Conte
et al., 2000). However, studies generally show a decline of levels of organisms with acidity
and lowered pH (Ryser et al., 1985). Indications are that exposure to low pH (4.5–4.9)
reduces production of LLO (Datta and Kothary, 1993) and diminishes invasion of Caco-2
cells in culture (Galdiero et al., 1997). Skim milk and yogurt mix containing S. lactis, S.
cremoris, S. thermophilus, L. bulgaricus, or a combination of S. thermophilus and L.
bulgaricus (at initial inoculum of 0.1 to 5.0%) and L. monocytogenes were stored at 4°C
after a 15-hr. fermentation at 21, 30, 37, or 42°C. Survival of the pathogen in skim milk
ranged from 12 hrs. (fermented with 1% L. bulgaricus and S. thermophilus at 42°C) to 37
weeks (fermented with 1% S. thermophilus at 37°C). Overall, higher fermentation
temperatures for both mesophilic (30°C) and thermophilic (42°C) starter cultures resulted
in shorter survival times for the pathogen. Yet, when the yogurt mix fermented at 45°C
contained 103- 10
4 L. monocytogenes strain V7, Scott A, OH, or CAJ ml, the pathogen was
detected even after storage up to 12 days at 4°C. Hence fermented dairy products could not
automatically be considered Listeria-free (Schaack and Marth, 1988).

35
2.6.1.2.5 Temperature Tolerance
L. monocytogenes is generally considered to be mesophilic; yet, it also is a psychotroph.
According to numerous reports, Listeriae can survive and grow at low temperatures (4–
25°C), but under such conditions LLO production is greatly diminished or even abolished.
However, it takes only 2 hrs at 37°C for levels to return back to normal (Buncic et al.,
1996). Thus, temperature and lag relate inversely; at 4°C the lag phase lasts 5 to 10 d
(Anon, 1988). Hence foods must be kept at accurate temperatures.
L. monocytogenes was isolated by Garayzabel et al., (1987) from pasteurized milk samples
with cold enrichment. This though never occurred with plating immediately following
thermal treatment. As a facultative intracellular parasite, L. monocytogenes could exist
within polymorphonucleocyte leukocytes (PMNL) and be shed in milk (Doyle et al.,
1987). Doyle et al., (1987) isolated intracellular L. monocytogenes that had survived HTST
pasteurization at 72.2°C for 16.4 s. However, Bradshaw et al. (1987) established that
pasteurization guidelines for whole and skim milk, heavy cream, and ice cream mix were
enough to ensure its inactivation (D71.7°C values ranged from 0.9 to 2.7 s).
36
CHAPTER THREE
MATERIALS AND METHODS
3.1 Study Site and Population
The study was conducted at Ashaiman, the capital of the Ashaiman Municipality, in the
Greater Accra Region. It is about 4km from Tema and 30km from Accra (GNA, 2008), the
industrial capital and the capital city respectively, of Ghana. Relief of Ashaiman area is
generally flat and forms part of the Accra-Togo. Rainfall in this area ranges from 730mm-
790mm. The rainy season starts from April to July (the major season) and September to
November (the minor season).
At a growth rate of 4.6%, which is the highest in the country over, it is the fastest growing
urban area in Ghana. The 2000 population census report estimated the population of
Ashaiman to be 150,312 with females forming close to 60%, which is far higher than the
national average of 52%.
The main occupations in the area are farming, manufacturing and processing, quarrying
and construction, commerce, and financial and tourism services (IBIS, 2003). The formal
sector, which is made up of salaried workers including teachers, security personnel, nurses,
doctors, civil servants and bank workers accounted for less than 10% of the workforce at
Ashaiman. The other 90% are found in the informal sector. Ashaiman has 14 private
clinics, one private maternity home and one health centre. However, the Doctor-Patient
ratio for the then AZC under the TMA was estimated at 1:96,479 in comparison to the
Municipal average of 1:17, 255. Epidemiologic data of the top 10 diseases for the AZC and
37
the TMA suggests that more than two out of every three cases of diarrhoea reported for the
entire TMA come from the AZC (Appendix A), an indication of poor environmental and
food safety situation in the AZC.
3.2 Study Design
3.2.1 Risk Assessment
This study was designed to quantitatively access the risk of consuming dairy products from
the informal market contaminated with L. monocytogenes in the Ashaiman municipality
using the Modular Process Risk Model (MPRM), and to determine the best options to
reduce such risks. The risk assessment was according to the Microbial Risk Assessment
protocol of Codex Alimentarius Commission, 1999.
Three risk inputs were required for the exposure assessment: a quantitative dairy market
chain model, information on handling of milk and contamination rates and concentrations
of milk/ milk products with L. monocytogenes on each risk pathways. For data collection,
the study was done in three parts: A PRA was done followed by surveys using
questionnaires and the milk sampling and laboratory analysis. Identification of dairy farms,
markets and retail milk shops was achieved by a participatory rural appraisal (PRA) in the
communities and interviews in the informal market centers. Quantitative dairy market
chains were modeled using data obtained by interviews with informal milk market agents.
The contamination rates and concentrations were obtained by laboratory tests. Handling of
milk was understood by the combination of the PRA and milk market agent interviews.
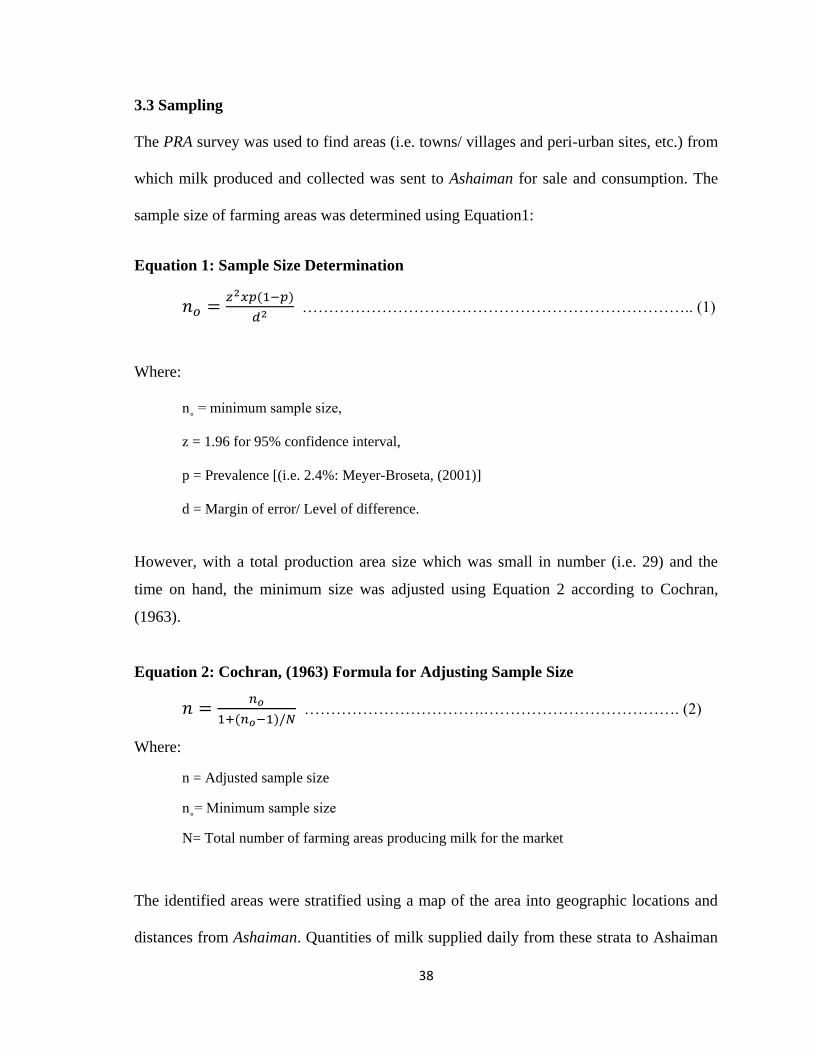
38
3.3 Sampling
The PRA survey was used to find areas (i.e. towns/ villages and peri-urban sites, etc.) from
which milk produced and collected was sent to Ashaiman for sale and consumption. The
sample size of farming areas was determined using Equation1:
Equation 1: Sample Size Determination
……………………………………………………………….. (1)
Where:
n˳ = minimum sample size,
z = 1.96 for 95% confidence interval,
p = Prevalence [(i.e. 2.4%: Meyer-Broseta, (2001)]
d = Margin of error/ Level of difference.
However, with a total production area size which was small in number (i.e. 29) and the
time on hand, the minimum size was adjusted using Equation 2 according to Cochran,
(1963).
Equation 2: Cochran, (1963) Formula for Adjusting Sample Size
…………………………….………………………………. (2)
Where:
n = Adjusted sample size
n˳= Minimum sample size
N= Total number of farming areas producing milk for the market
The identified areas were stratified using a map of the area into geographic locations and
distances from Ashaiman. Quantities of milk supplied daily from these strata to Ashaiman

39
were compared and used as the basis for proportional sampling to select the farm locations
for the study. Nineteen (19) farming areas were used for the study. From each of these a
farm was selected randomly. Raw milk samples were then purchased into sterile stomacher
bags. An assembler from each farm was followed to the point where milk was delivered to
the retailer and samples were taken before and after boiling. Retailers were however nine 9
in number as some collected milk from more than one Assembler.
All samples were kept under cold storage in an ice chest packed with ice and while
awaiting the boiling process at the retail shops, in refrigerators at nearby shops. The
samples were quickly conveyed to the NFS department for analysis. The next day,
fermented milk samples were purchased from same retailers for analysis. Samples were
collected in duplicates in two batches (i.e. 1& 2) totaling 304. Sampling and laboratory
work were done for January- March, 2010, which was in the dry season. Appendix B is a
list of the areas which supplied the informal market at Ashaiman with raw milk.
3.4 PRA Survey
The PRA was conducted for various agent groups along the milk market chains within the
Ashaiman municipality by a multidisciplinary PRA team consisting of a student researcher,
an expert food microbiologist and also, a specialist veterinary professional. The build-up
included several prior trips by the PRA team with the aim of recruiting participants, getting
acquainted with the prospective participants, their general way of life and their
environment. Contacts were also maintained with the participants by means of phone calls.
40
3.4.1 Mapping
This was done as described by Hussain et al., (2005) by aiding the participants to draw an
outlay of their village/ town, indicating landmarks, and starting from a common reference
point. Maps were drawn on the ground or on white cloth. These were scrutinized and
confirmed with them and then translated onto plain white cardboard papers. A copy was
kept by both parties at each mapping session.
3.4.2 Seasonal Calendars
Seasonal calendars were used to describe the seasonal incidence of cattle movement,
milking practices and cattle diseases similar to Hussain et al., (2005). As was found
familiar to participants, the months according to the Christian calendar were used and each
season was represented using an object placed along the lower x-axis of the diagram.
3.4.3 Disease Ranking (Proportional Piling)
With necessary modifications, this was done similar to the method used by Hussain et al.,
(2005). Informants were asked to mention all symptoms associated with cattle diseases in
their area. A list was developed from the responses and validated through discussions with
informants. Informants were asked to rank the list of the diseases symptoms according to
their prevalence using 100 stones for the proportional piling. The exercise was repeated to
rank the disease symptom according to importance or impact on livelihoods.

41
3.4.4 Matrix Scoring
This was done for farmers and retailers according to Cramb, and Purcell, (2001).
Constraints to livelihood were ranked against livelihood indices. Informants were asked to
rank these constraints, and also determine the extent to which these influenced their lives.
3.5 Questionnaire Survey
Questionnaires surveys were done for retailers and consumers. Samples of questionnaires
administered are presented in Appendices. They were pre-testing during the PRA phase
and modified to meet the objectives.
3.5.1 Criteria for Inclusion of Respondents
The inclusion criteria were that respondents should be consumers or retailers and should be
capable of giving legal consents on their own.
3.6 Chemical Analysis of Milk Samples
3.6.1 PH Determination
The pH was determined using a pH meter (530 pH meter, Corning Pinnacle pH meter,
Woburn, MA US) calibrated to take readings of samples at 25°C. A small conical flask of
50mL was filled with agitated sample. The electrode was immediately dipped into it to
take measurements. Measurements were taken in triplicates and averaged.
42
3.7 Microbial Analysis
3.7.1 Detection, Isolation and Enumeration of Listeriae
Detection and enumeration were done using the US/ FDA protocol (Hitchins, 1998) with
some modifications (i.e. the omission of the pre- enrichment step). Approximately 3 ml of
milk samples were directly inoculated into 27 ml of Fraser and Listeria Enrichment broths
(LEB) and homogenized for 1min 30secs using a Seward Stomacher 400 Creator machine
with a breaking capacity of 35A. Aliquots of 0.1mL were plated onto chromogenic Listeria
agar (ISO) OCLA supplemented plates and incubated at 37°C for up to 48hrs. For the
chromogenic Listeria agar (ISO) OCLA supplemented plates counting was direct but for
PALCAM/ OXA three (3) typical Listeriae colonies per plate were confirmed for L.
monocytogenes. Counts were expressed as CFU/ mL by using the Equation (3) with 95%
confidence limits:
Equation 3: Expression of Counts in CFU/ mL
CFU/ mL = Number of colonies confirmed x Number of colonies counted ………… (3)
Number of colonies tested Volume tested x dilution
The remaining sample was incubated for 24-48hrs at 30-37°C and spread plated unto
chromogenic Listeria (ISO) OCLA supplemented agar plates (both selective and
differentiates for Listeria spp.) and PALCAM/ OXA plates (selective for Listeria spp.) at
dilutions of 10-1
and 10-2
for isolation.
For pure colonies, nutrient agar was streaked as a mandatory step in accordance with the
protocol in application. Presumed colonies morphologically typical to Listeriae were
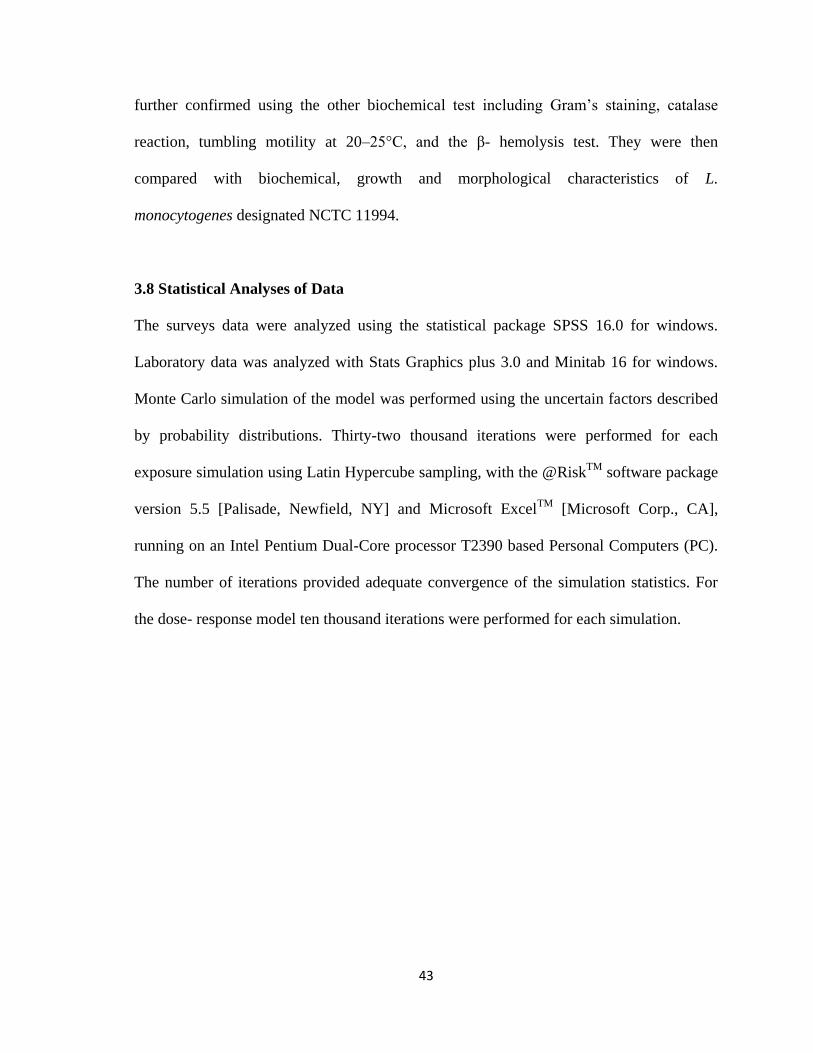
43
further confirmed using the other biochemical test including Gram‘s staining, catalase
reaction, tumbling motility at 20–25°C, and the β- hemolysis test. They were then
compared with biochemical, growth and morphological characteristics of L.
monocytogenes designated NCTC 11994.
3.8 Statistical Analyses of Data
The surveys data were analyzed using the statistical package SPSS 16.0 for windows.
Laboratory data was analyzed with Stats Graphics plus 3.0 and Minitab 16 for windows.
Monte Carlo simulation of the model was performed using the uncertain factors described
by probability distributions. Thirty-two thousand iterations were performed for each
exposure simulation using Latin Hypercube sampling, with the @RiskTM
software package
version 5.5 [Palisade, Newfield, NY] and Microsoft ExcelTM
[Microsoft Corp., CA],
running on an Intel Pentium Dual-Core processor T2390 based Personal Computers (PC).
The number of iterations provided adequate convergence of the simulation statistics. For
the dose- response model ten thousand iterations were performed for each simulation.

44
CHAPTER FOUR
RESULTS AND DISCUSSION
4.1 General Overview
A PRA was done with key informants and milk/ milk product marketing agents to identify
prevalent disease symptoms in cows that produced raw milk destined for human
consumption at Ashaiman, the supply routes and handling characteristics, and the
quantities of the various milk/ milk product along the value chain consumed. PRA
activities with farmers included key informants interviews, mapping, seasonal calendar,
matrix scoring and disease proportional piling which yielded information on the herding
practices, milking and milk handling practices, and disease prevalence in herds and its
significance on farmers‘ livelihoods. Key informants interviews with Assemblers furnished
information on how they handled and transported milk after production onto the retail
markets. Key informant interviews, mapping and matrix scoring with Retailers ceded
information on the availability, distribution and handling of milk sold on the informal
market at Ashaiman to consumers. It also yielded estimates of the quantities of milk/ milk
product purchased by consumers. Such information was important in identifying the
quantitative milk distribution model, structuring of questionnaires for describing handling
of milk/ milk product along the milk value chain, and collecting milk samples for
laboratory analysis. Ultimately, these helped in determining the public health significance
of milk/ milk products and therefore possible intervention.

45
4.2 PRA Survey
4.2.1 Farmers PRA
4.2.1.1 Demographic Information on Farmers at PRA
Presented in Table 4.11 are the demographic data of the farmer-respondents in the PRA
survey. Similar to Hussain et al., (2005) cattle farmers were all adult-Muslim males
(n=15). Also, except for one, all were Fulanis, which was consistent with cattle rearing in
the south of the country according to Oppong- Anane, (2001). Ages of farmers were wide
spread: 6 (40.0%) were between 23-29years, 6 (40.0%) from 30-40years and 3 (20.0%)
above 40years. Young adults thus formed about half of the farmers. Majority 8 (53.3%) of
them had no formal education. The majority of the farmers (8 or 53.3%) had other jobs
apart from the cattle rearing. Most were food crop farmers which were consistent with the
agropastoralist practice (Tonah, 2003) whiles others did jobs other than crop planting.
These farmers unanimously or generally sought for medical care from the Tema General
Hospital (TGM).
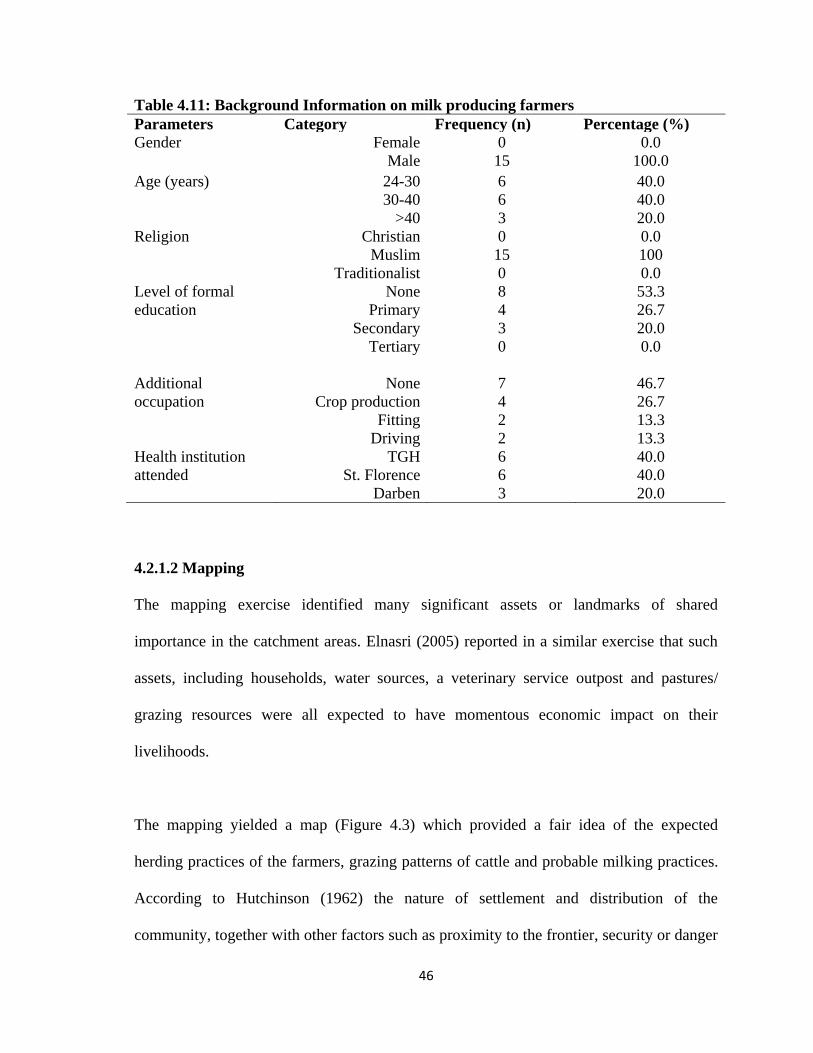
46
Table 4.11: Background Information on milk producing farmers
Parameters Category Frequency (n) Percentage (%)
Gender Female
Male
0
15
0.0
100.0
Age (years) 24-30
30-40
>40
6
6
3
40.0
40.0
20.0
Religion Christian
Muslim
Traditionalist
0
15
0
0.0
100
0.0
Level of formal
education
None
Primary
Secondary
Tertiary
8
4
3
0
53.3
26.7
20.0
0.0
Additional
occupation
None
Crop production
Fitting
Driving
7
4
2
2
46.7
26.7
13.3
13.3
Health institution
attended
TGH
St. Florence
Darben
6
6
3
40.0
40.0
20.0
4.2.1.2 Mapping
The mapping exercise identified many significant assets or landmarks of shared
importance in the catchment areas. Elnasri (2005) reported in a similar exercise that such
assets, including households, water sources, a veterinary service outpost and pastures/
grazing resources were all expected to have momentous economic impact on their
livelihoods.
The mapping yielded a map (Figure 4.3) which provided a fair idea of the expected
herding practices of the farmers, grazing patterns of cattle and probable milking practices.
According to Hutchinson (1962) the nature of settlement and distribution of the
community, together with other factors such as proximity to the frontier, security or danger

47
from predators and cattle thieves, and the ease of access to abundant pastures, were all key
in determining herding practices. The map revealed that the households of the farmers
were nucleated; and grazing distances were found at quite some distance away from
households. It also offered an insight into the likelihood of herded animals coming into
contact with other animals: both wild and domestic Cattle herding was done by hired
Fulani herdsmen. The mapping also revealed that the veterinary outpost in the area was not
functioning, resulting in poor accessibility to veterinary care.
Figure 4.3: Participatory map of resources important to farmers’ livelihood
4.2.1.3 Analysis of Seasonal Calendar
Figure 4.4 is a picture taken during a seasonal calendar session and 4.5 is a translation
from the ground onto a white platform. The farmers seemed to be very familiar with the
seasons and the events that occurred during the different seasons.

48
Figure 4.4: Seasonal calendar session at farmers’ PRA
Figure 4.5: Seasonality of events on the calendar
4.2.1.3.1 Seasonal Occurrence of Rainfall
Two rainy seasons were acknowledged: the major and the minor seasons. The major
rainfall period is from April- July and the minor September to November. According to
farmers, the rainy seasons were famous for ushering in abundance of grass needed for
grazing the cattle and since milk production depended on grass basically, it peaked and so
did incomes and associated tradeoffs such as expenditure on food and non-food items.
Disease periods
HseConsumptn
Income
Labor
Milking
Dry season
Rainy season
Apr May Jun Jul Aug Sep Oct Nov Dec Jan Feb Mar Apr May Jun Jul

49
Pasture for animals was reportedly difficult to find in the dry seasons and farmers needed
to search wide and far.
4.2.1.3.2 Milk Production
As the farmers revealed, milking occurs all year round. This was consistent with Fulani
practices documented by Okantah, (1990). Milking is done manually, and under
unhygienic conditions (Figure 4.6 & 4.7), which could cause some bacteriological
problems due to contaminations. Several documentaries have pointed to fecal material as a
major means of introducing bacteria into milk (Sanaa et al. 1993).
Figure 4.6: Farmer milking Figure 4.7: Filtering of milk on retail market
4.2.1.3.3 Seasonal Occurrence of Diseases
The farmers reported observing rapid surges in diseases with the rains. They attributed this
to the springing up of fresh grass. They however described bovine tuberculosis to occur all
year round. Such seasonal variations of the prevalence of diseases and disease-causing
agents in animals and animal products, respectively are consistent with literature (Eddie
and Scott, 1980; Murray et al., 1996; and Laven & Lawrence 2006) Farber et al. (1988)
& Husu (1990) documented high prevalence of Listeriosis, in colder winter seasons. They

50
associated this with indoor housing and silage feeding. Lund et al., (1991) however
characterized more incidences of Listeriae isolations in the warmer seasons than in the
colder months suggesting that factors other than silage feeding were also implicit in the
occurrence of Listeriae in raw milk. An example is poor quality pasture (Kumar et al.,
2007).
4.2.1.4 Preference Ranking on Livelihood Indices of Farmers
Figure 4.8 and Appendix C (I) show the result of the matrix scoring on livelihood of the
respondents. Incidence of animal diseases was most crucial to farmers. Access to market
and farm management (including water availability) was also found to have significant
influence on farmers‘ welfare. According to (Cornish and Lawrence, 2001) the most
acutely perceived problems for farmers were access to credit, markets and in peri-urban
areas water supply.
Figure 4.8: Constraints to the livelihood indices of farmers

51
4.2.1.5 Proportional Piling of Disease Symptoms of Animals
The farmers had astounding knowledge of the diseases of the cattle. They were made to
describe the symptoms too. Presented in Table 4.12 is a Lexicon of local terms for diseases
and symptoms (in farmer‘s language) they identified and perceived to be important to
them. These diseases were confirmed at a near-by veterinary office. The impact of these
diseases on livelihood was then determined in a proportional piling (Figure 4.9 and
Appendix C (II)) which was illustrated on Figures 4.10 & 4.11. The exercise was done
both in the dry and rainy seasons.
Table 4.12: Lexicon of local terms for diseases and symptoms farmer’s language
Probable veterinary diagnosis Local terms Case definition
Tuberculosis Butse Fever, lack of rumination and deep long
coughs which suggested lung infection.
Mastitis Lawre Udder inflames, reddens and hardens Milk
produced sometimes changes color. Also
milk produced does not homogenize well
once settled.
Foot and Mouth disease (FMD) Safa Excessive salivation of the mouth, with
blisters on tongue, and foot. Mouth smelled
bad also.
Diarrhea Chartol Excessive discharge of watery stool
Diarrhea (bloody) Chartol nyinyan Diarrhea with blood in feces
Stillbirths/ premature births Woperre Calves dead on arrival/ calves born before
their due. When such calves survive, they
usually had slow development and their hair
also was rough.
Extreme coldness Pewri Hairs stand straight on-end due to the cold
Dermatophilosis Gborle Subcutaneous rashes on animals. Treatment
was by applying hot metal to parts of animal
with infection.
Circular movements
(uncoordinated movements)
Lade Animal turns in circles as though it had
become mad. Usually it did not survive.
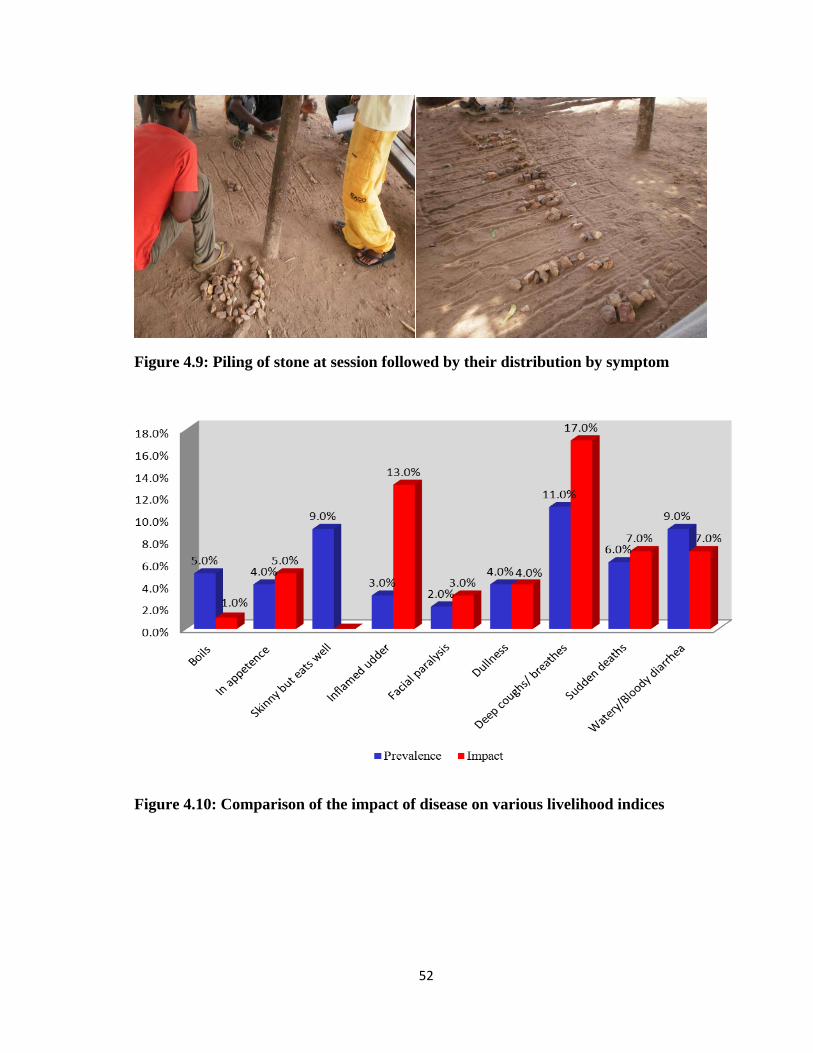
52
Figure 4.9: Piling of stone at session followed by their distribution by symptom
Figure 4.10: Comparison of the impact of disease on various livelihood indices

53
Figure 4.11: Comparison of the impact of disease on various livelihood indices
The Kendall‘s W co-efficient of concordance of prevalence was 0.796 at a significance of
0.01. This showed a strong correlation between the results from the two sessions
(Appendix C (III)). Also for the impact, a W of 0.904 at the significance of 0.01 was
computed (Appendix C (III)). These combined probably indicated two things. The first
was the immediate and thorough comprehension of the concepts of PRA by farmers. The
second was the unambiguous and almost universal opinion of informants concerning the
nature of pertinent issues affecting their livelihoods. Thus, the PRA concept exhibited both
friendliness and amenability whiles being robust, logical and effective still.
Highest among the symptoms were deep coughs/ breathes and rashes both at a rate of
11.0% by followed by a tetrad of symptoms (all at 9.0% prevalence) including bloody/
watery diarrhea, skinny but eats well (progressive emaciation), swollen/ sore feet and
spontaneous abortion/ stillbirths. Least common were facial paralysis and circling

54
movements. Also, symptoms whose impacts were very crucial to farmers‘ livelihoods and
thus had higher importance were deep coughs/ breathes (17.0%), swollen/ sore feet
(14.0%), skinny but eats well (13.0%), spontaneous abortions/ stillbirths (10.0%) and
rashes (10.0%). These were followed by sudden deaths, watery/ bloody diarrhea and
premature births (all at 7%). At the bottom were facial paralysis, circling movement/
uncoordinated movements and sudden inability to walk (at 3, 1 and 0 percent respectively).
As concerning the preferred options of solutions farmers ranked the symptoms in a
descending order as deep cough/ breathe rashes (25.0%), swollen soured feet (15.0%),
watery/ bloody diarrhea (8.0%), and boils (6.0%), in appetence (5.0%) and spontaneous
abortions/ stillbirths (4.0%). Premature births and sudden deaths were 3.0% and 2.0%
respectively whiles skinny but eats well (progressive emaciation), sudden inability to walk
and drooling tongue were lowest (0.0% each).
Participants demonstrated a clear distinction between prevalence and importance. By way
of a typical illustration, it was observed that though all disease symptoms prevalence were
quite high (which indicated a similar trend for the occurrence of cattle disease in these
areas), such symptoms as emaciation, drooling tongue and sudden inability to walk had
little impact on farmers livelihoods and therefore importance were almost nil. .
55
4.2.2 Assembler’s PRA
4.2.2.1 Mapping
Mapping with Assemblers identified many milk production areas around Ashaiman, which
were within the distant range of 12-40 km. These are cluster of farms, which varied in
number and sizes, at different locations. Hill (1964) gave a wide range of between 50- 200
cows kept by Fulani herdsmen on behalf of absentee owners.
It was revealed that assemblers to not inform milk retailers of where they obtain their milk
from. With-holding of such information from retailers was seen by Assemblers as a job
security. It was noted that assemblers handled relatively varied volumes of milk, ranging
from about 3 to 135 L. Milk handled were usually the bulked amount of milk from several
low yielding cows. Sometimes one Assembler collects milk from more than one farm in a
given location.
4.2.2.2 Milk Handling by Assemblers
Handling of milk was just as Omore et al., (2004) described. After milking and bulking,
milk was transferred into plastic jerry cans and covered tightly. Though these made
handling convenient for Assemblers, Omore et al., (2003) found them more likely to
contaminate milk with bacteria since they could not be cleaned easily. Assemblers then
transported these from the sites of production to the Retailer. Times taken from the first
collection to delivery varied. However, what did not vary much was the mode of
transportation which was mainly by public vehicles. It was revealed that some Assemblers

56
kept milk from various farms with them (unrefrigerated) until the quantities they had were
enough to justify the transportation costs to the retail point.
4.2.3 PRA with Milk/ Milk Product Retailers
The retailers expressed their expectations as, generally: (1) to receive enough milk at
cheaper prices all year round to sell and (2) to see faster increases in the numbers of non-
traditional consumers (i.e. non- Fulani and/ or non-Muslim consumers). These, according
to them, would help their business to grow.
4.2.3.1 Mapping
The map developed showed that informal milk/ milk product marketing was concentrated
mainly in two sites in the same electoral area, Tulaku. Some retailers were however dotted
around both Tulaku and other electoral areas (Figure. 4.12).
Figure 4.12: Map of Electoral Areass (EA) with informal retailing of dairy products
at Ashaiman. (EAs and dairy marketing were represented with the red and yellow cola
nuts respectively)
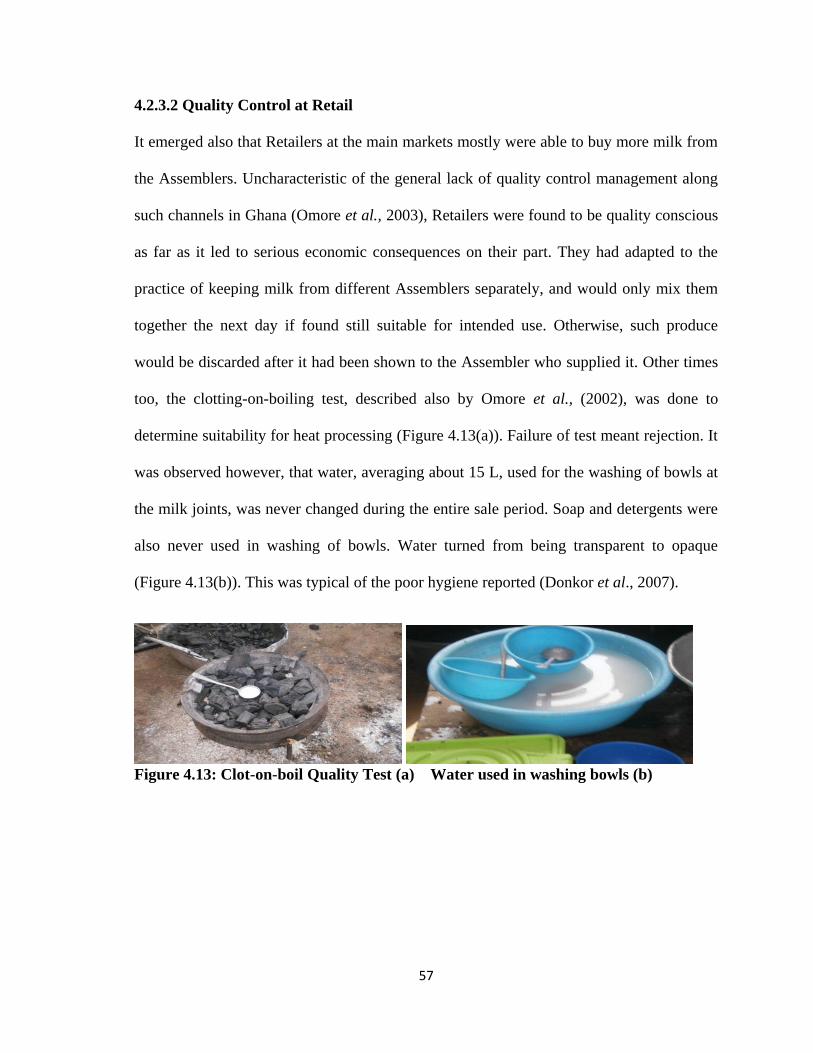
57
4.2.3.2 Quality Control at Retail
It emerged also that Retailers at the main markets mostly were able to buy more milk from
the Assemblers. Uncharacteristic of the general lack of quality control management along
such channels in Ghana (Omore et al., 2003), Retailers were found to be quality conscious
as far as it led to serious economic consequences on their part. They had adapted to the
practice of keeping milk from different Assemblers separately, and would only mix them
together the next day if found still suitable for intended use. Otherwise, such produce
would be discarded after it had been shown to the Assembler who supplied it. Other times
too, the clotting-on-boiling test, described also by Omore et al., (2002), was done to
determine suitability for heat processing (Figure 4.13(a)). Failure of test meant rejection. It
was observed however, that water, averaging about 15 L, used for the washing of bowls at
the milk joints, was never changed during the entire sale period. Soap and detergents were
also never used in washing of bowls. Water turned from being transparent to opaque
(Figure 4.13(b)). This was typical of the poor hygiene reported (Donkor et al., 2007).
Figure 4.13: Clot-on-boil Quality Test (a) Water used in washing bowls (b)
58
4.2.3.2 Marketing of Milk/ Milk Products at Old Tulaku, Ashaiman
The small retailers dotted about acquired their supply of milk/ milk products from agents at
the main markets, usually the Old Tulaku market, rather than from the Assemblers. They
did not usually buy large quantities of milk/ milk product. A reason was that their locations
did not offer them space to boil and ferment milk collected from Assemblers, which was
the typical practice. Products sold on the informal milk markets were of various types.
These included raw fresh milk (not boiled), fresh milk (boiled) and naturally fermented
milk (nyarmie, nunu and combination of both). These were consumed with other
traditional food products such as Fura, Lekri and Couscous (Omore et al., 2003, Smith,
1998)). Figure 4.14 is a summary of activities that took place at milk/ milk product retail.
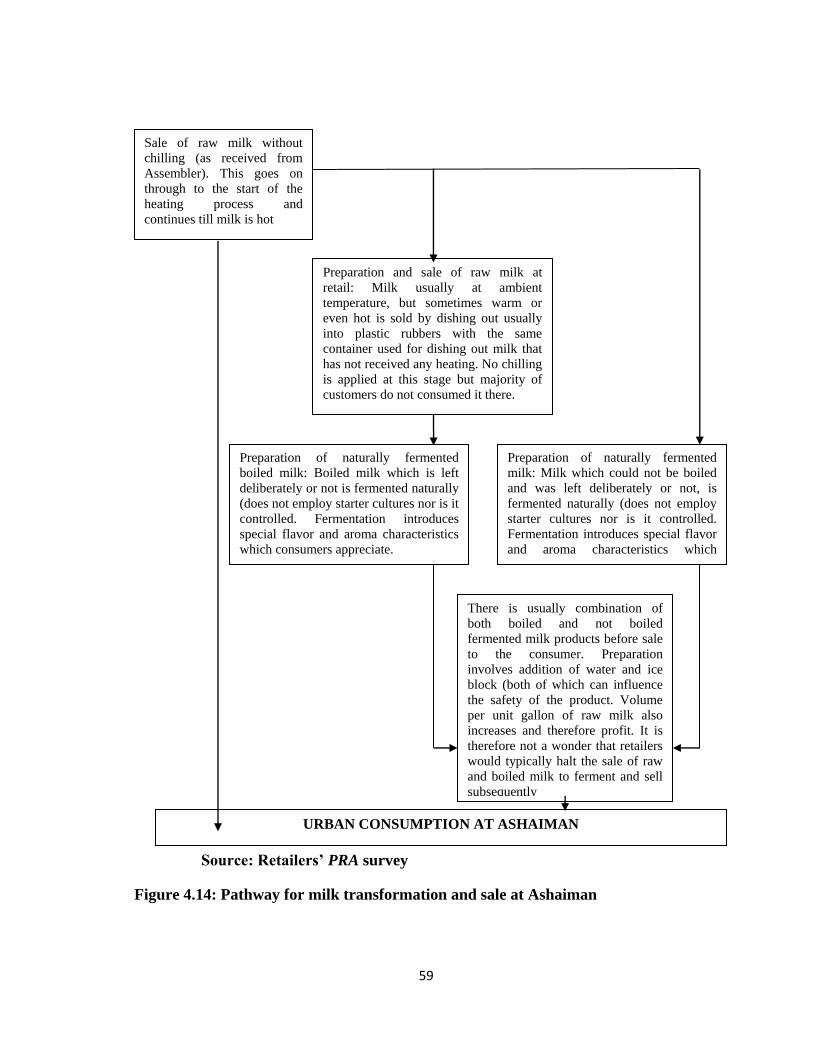
59
Source: Retailers’ PRA survey
Figure 4.14: Pathway for milk transformation and sale at Ashaiman
Sale of raw milk without
chilling (as received from
Assembler). This goes on
through to the start of the
heating process and
continues till milk is hot
Preparation and sale of raw milk at
retail: Milk usually at ambient
temperature, but sometimes warm or
even hot is sold by dishing out usually
into plastic rubbers with the same
container used for dishing out milk that
has not received any heating. No chilling
is applied at this stage but majority of
customers do not consumed it there.
Preparation of naturally fermented
boiled milk: Boiled milk which is left
deliberately or not is fermented naturally
(does not employ starter cultures nor is it
controlled. Fermentation introduces
special flavor and aroma characteristics
which consumers appreciate.
Preparation of naturally fermented
milk: Milk which could not be boiled
and was left deliberately or not, is
fermented naturally (does not employ
starter cultures nor is it controlled.
Fermentation introduces special flavor
and aroma characteristics which
consumers appreciate
There is usually combination of
both boiled and not boiled
fermented milk products before sale
to the consumer. Preparation
involves addition of water and ice
block (both of which can influence
the safety of the product. Volume
per unit gallon of raw milk also
increases and therefore profit. It is
therefore not a wonder that retailers
would typically halt the sale of raw
and boiled milk to ferment and sell
subsequently
URBAN CONSUMPTION AT ASHAIMAN

60
4.2.3.3 Matrix Scoring for Retailers
At the sessions with Retailers, it was noted that the main constrains to the milk retail trade
were inaccessibility to markets, unavailability of the raw produce, inaccessibility to credit,
transportation and unhygienic conditions in that order. Figure 4.15 is representation of the
results of the matrix scoring exercise captured in Appendix D (I).
Figure 4.15: Plot of livelihood constraints against retailers’ livelihoods indices
Access to market first, and then availability of milk were found to be the two most
important parameters that affected income and therefore security. Also, the two most
important parameters that affected food consumption and other utilities were still access to
markets and availability of milk. Hence, access to markets was identified to influence
livelihood indices the most.
The Pearson‘s correlation coefficient between income and the other livelihood indices
were strong. It was 0.995, 0.991 and 0.984 respectively for security, food consumption and
other utilities consumption. The correlation between security as per food consumption and
61
other utilities were also 0.987 and 0.975, respectively. The correlation between other
utilities and food consumption was similarly high. It was 0.993 (P <0.01) significant level
for two-tailed test) (Appendix D (II)).
It emerged that the trade was relatively more profitable per unit volume during the periods
of scarcity (i.e. the dry seasons). Motivated by a surge in demand and an expectant
increase in income, some Retailers adulterate their milk/ milk products with water. Others
also adulterate milk with imported milk powder when preparing the naturally fermented
products (i.e. nyarmie, nunu and the combined meal). The almost perfect negative
correlation between market access and availability of raw produce on one side, and
hygiene on the other was consistent with a report by (Omore et al., 2003) that chronicled
unhygienic conditions on such markets. The Retailers revealed that patronage of milk and
milk products was affected by several factors, including the coldness or hotness of the
season. The chilled milk was less consumed during the rainy seasons when the weather
was generally cold. Milk spoilage during the bumper period was considered a problem.
This was primarily because of inadequate refrigeration in these marketing channels.
The PRA revealed that hygiene is not very important to milk retailers since it did not
influence their livelihoods directly. It was however perceived that Retailers would improve
hygiene and safety standards if it would make their merchandise more acceptable to
customers and thus increase patronage.
62
4.2.3.4 Milk Distribution from Production to Consumption and Evolution of Hazards
Figure 4.16 & 4.17 show the summary of the milk pathway as collated in the PRA. From
the PRA, the distances of the milk production areas from Ashaiman and the quantities of
milk produced that ends up on the informal milk markets at Ashaiman was determined.
Modeling unique events that affect the evolution of the hazard from production to
consumption yielded Figure 4.18 based on the MPRM.

63
52.0km 46.0km
39.0km
43.0km
35.0 km 42.5km
32.0km
30.0km 25.0km
. 23.5km
23.5km ..L 24.0km
.
.
17.9km 18.8km 20.3km
45.0L
15.0km
12.0 km 13.0km
Raw milk Boiled milk Fermented milk (width is amount in liters)
Figure 4.16: Quantitative milk distribution model; production to retail, for Ashaiman
Manya
Mampoh, Shai hills
Okyibleku
Dodowa
Suta
Tachukope
Odumase
URBAN CONSUMERS AT ASHAIMAN
Katamanso
Ablekuma
Afienya
Apolonia
Dawhenya
Mataheko
Kpone barrier
Prampram
Gbetseli
Mobole
Doryum Asebi
RETAILERS AT ASHAIMAN

64
39.0 L 54.0 L
67.5 L
63.0 L
36.0 L 63.0 L
45.0L 81.0 L
63.0 L 33.8L
.
41.5L 27.0 L 49.5 L
.
27.0L 54.0 L
31.5L 45.0L
36.0 L 81.0 L
Raw milk Boiled milk Fermented milk (width is amount in liters)
Figure 4.17: Quantitative milk distribution model; production to retail, for Ashaiman
Manya
Mampoh, Shai hills
Okyibleku
Dodowa
Suta
Tachukope
Odumase
URBAN CONSUMERS AT ASHAIMAN
Katamanso
Ablekuma
Afienya
Apolonia
Dawhenya
Mataheko
Kpone barrier
Prampram
Gbetseli
Mobole
Doryum Asebi
RETAILERS AT ASHAIMAN

65
Infected animals
Cross-contamination &
Mixing
Growth & Inactivation
Inactivation
Inactivation/ Cross-contamination
Cross-contamination &
Removal
Cross-contamination
Figure 4.18: Schematic presentation of food exposure pathway modeled using the
MPRM
Animals at farm
Milking
Feces in milk
Pooling/ bulking
Milk at wholesale
Transport/ storage
Milk at retail/ shop
Boiling of milk
Serving/dishing
out
Serving/ dishing
out
Natural fermentation
Serving/ dishing
out
At consumption At consumption At consumption
Milk consumed with other products
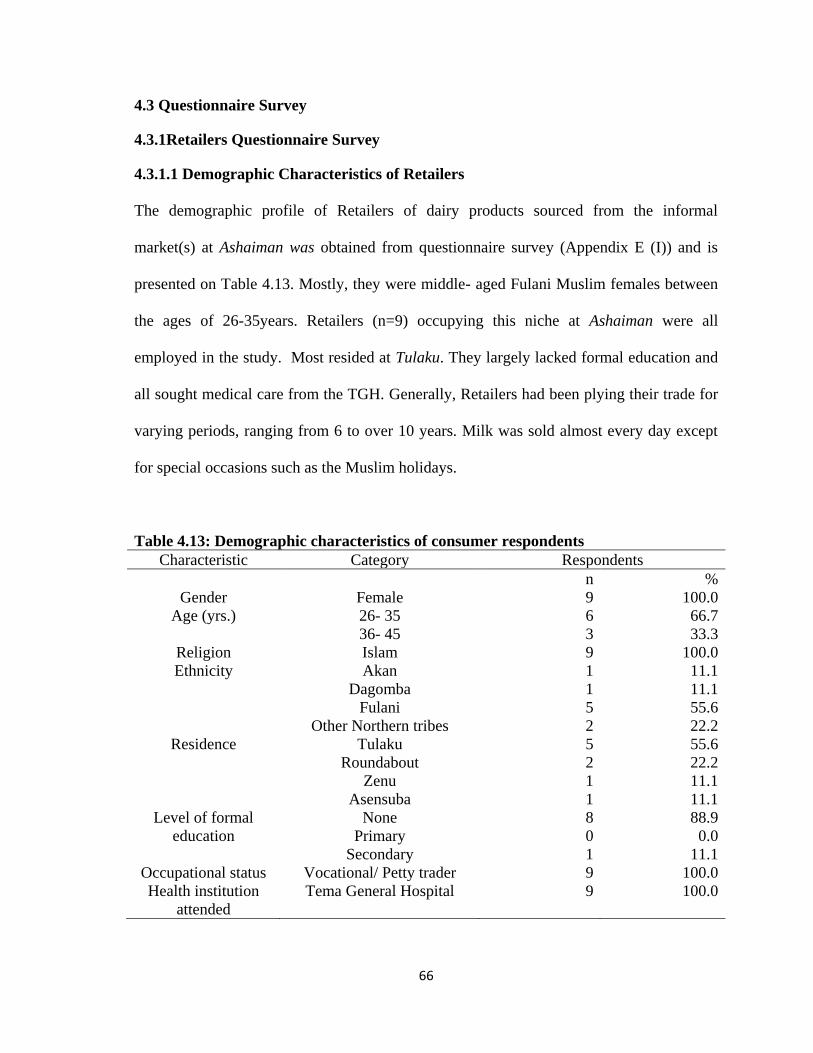
66
4.3 Questionnaire Survey
4.3.1Retailers Questionnaire Survey
4.3.1.1 Demographic Characteristics of Retailers
The demographic profile of Retailers of dairy products sourced from the informal
market(s) at Ashaiman was obtained from questionnaire survey (Appendix E (I)) and is
presented on Table 4.13. Mostly, they were middle- aged Fulani Muslim females between
the ages of 26-35years. Retailers (n=9) occupying this niche at Ashaiman were all
employed in the study. Most resided at Tulaku. They largely lacked formal education and
all sought medical care from the TGH. Generally, Retailers had been plying their trade for
varying periods, ranging from 6 to over 10 years. Milk was sold almost every day except
for special occasions such as the Muslim holidays.
Table 4.13: Demographic characteristics of consumer respondents
Characteristic Category Respondents
n %
Gender Female 9 100.0
Age (yrs.) 26- 35
36- 45
6
3
66.7
33.3
Religion Islam 9 100.0
Ethnicity Akan
Dagomba
Fulani
Other Northern tribes
1
1
5
2
11.1
11.1
55.6
22.2
Residence Tulaku
Roundabout
Zenu
Asensuba
5
2
1
1
55.6
22.2
11.1
11.1
Level of formal
education
None
Primary
Secondary
8
0
1
88.9
0.0
11.1
Occupational status Vocational/ Petty trader 9 100.0
Health institution
attended
Tema General Hospital 9 100.0
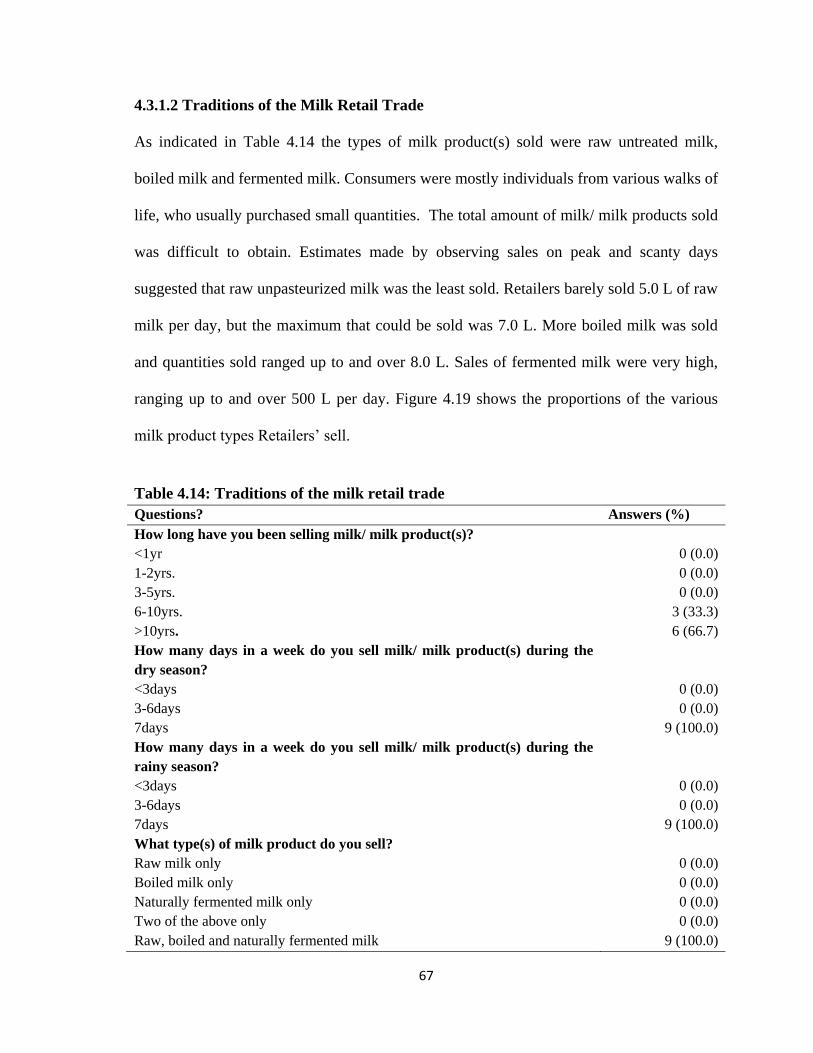
67
4.3.1.2 Traditions of the Milk Retail Trade
As indicated in Table 4.14 the types of milk product(s) sold were raw untreated milk,
boiled milk and fermented milk. Consumers were mostly individuals from various walks of
life, who usually purchased small quantities. The total amount of milk/ milk products sold
was difficult to obtain. Estimates made by observing sales on peak and scanty days
suggested that raw unpasteurized milk was the least sold. Retailers barely sold 5.0 L of raw
milk per day, but the maximum that could be sold was 7.0 L. More boiled milk was sold
and quantities sold ranged up to and over 8.0 L. Sales of fermented milk were very high,
ranging up to and over 500 L per day. Figure 4.19 shows the proportions of the various
milk product types Retailers‘ sell.
Table 4.14: Traditions of the milk retail trade
Questions? Answers (%)
How long have you been selling milk/ milk product(s)?
<1yr
1-2yrs.
3-5yrs.
6-10yrs.
>10yrs.
0 (0.0)
0 (0.0)
0 (0.0)
3 (33.3)
6 (66.7)
How many days in a week do you sell milk/ milk product(s) during the
dry season?
<3days
3-6days
7days
0 (0.0)
0 (0.0)
9 (100.0)
How many days in a week do you sell milk/ milk product(s) during the
rainy season?
<3days
3-6days
7days
0 (0.0)
0 (0.0)
9 (100.0)
What type(s) of milk product do you sell?
Raw milk only
Boiled milk only
Naturally fermented milk only
Two of the above only
Raw, boiled and naturally fermented milk
0 (0.0)
0 (0.0)
0 (0.0)
0 (0.0)
9 (100.0)
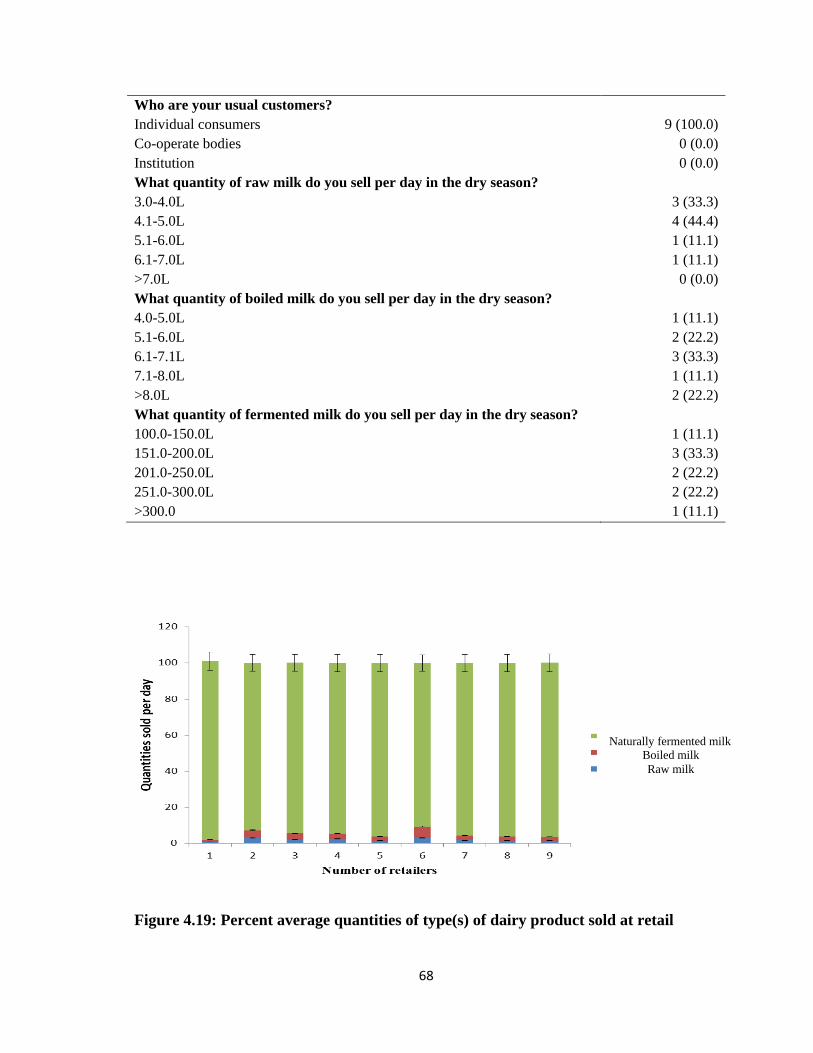
68
Who are your usual customers?
Individual consumers
Co-operate bodies
Institution
9 (100.0)
0 (0.0)
0 (0.0)
What quantity of raw milk do you sell per day in the dry season?
3.0-4.0L
4.1-5.0L
5.1-6.0L
6.1-7.0L
>7.0L
What quantity of boiled milk do you sell per day in the dry season?
4.0-5.0L
5.1-6.0L
6.1-7.1L
7.1-8.0L
>8.0L
What quantity of fermented milk do you sell per day in the dry season?
100.0-150.0L
151.0-200.0L
201.0-250.0L
251.0-300.0L
>300.0
3 (33.3)
4 (44.4)
1 (11.1)
1 (11.1)
0 (0.0)
1 (11.1)
2 (22.2)
3 (33.3)
1 (11.1)
2 (22.2)
1 (11.1)
3 (33.3)
2 (22.2)
2 (22.2)
1 (11.1)
Figure 4.19: Percent average quantities of type(s) of dairy product sold at retail
Naturally fermented milk
Boiled milk
Raw milk

69
4.3.1.3 Supply of Raw Milk to Retailers
Milk supply was from the Assemblers. During the dry season, milk was more often
received early in the morning, however in the rainy season they were received more at late
mornings or early afternoons as indicated on Table 4.15.
Table 4.15: Supply of raw milk to retailers What is your source of raw milk supply?
Farm/ Kraal
Assembler
Hawkers
Others
0 (0.0)
9 (100.0)
0 (0.0)
0 (0.0)
What period(s) do you receive raw milk supply in the dry season?
Early mornings (7:00am-8:30am)
Late mornings (8;30am-11:30am)
Mid-afternoons (11:30am-2:00pm)
Late afternoons (2:00pm-4:30pm)
Other
6 (66.7)
0 (0.0)
0 (0.0)
0 (0.0)
3 (33.3)
What period(s) do you receive raw milk supply in the rainy season?
Early mornings (7:00am-8:30am)
Late mornings (8;30am-11:30am)
Afternoons (11:30am-2:00pm)
Late afternoons (2:00pm-4:30pm)
Other
3 (33.3)
0 (0.0)
0 (0.0)
0 (0.0)
6 (66.7)
4.3.1.4 Quantities of Milk Supplied by Assembler
The quantities of milk received varied with the seasons as was production volumes at the
farms (Table 4.16). In the dry season majority of them receive 50-90 L of milk, even
though some could receive over 200.0 L. In comparison, during the rainy season, majority
of retailers receive 91.0-135.0 L of milk and some receive in excess of 270.0 L.

70
Table 4.16: Quantities of milk supplied by Assembler What quantities of raw milk do you receive in the dry season?
50.0-90.0L
91.0-135.0L
136.0-200.0L
>200.0L
4 (44.4)
1 (11.1)
3 (33.3)
1 (11.1)
What quantities of raw milk do you receive in the rainy season?
95.0-135.0L
136.0-200.0L
201.0-270.0L
>270.0L
4 (44.4)
2 (22.2)
2 (22.2)
1 (11.1)
4.3.1.5 Milk/ Milk Product Handling During Sale
Retailers found it convenient to keep raw milk at ambient temperature during sale. Boiled
milk could however be kept hot or warm also. Naturally fermented milk on the other hand
was always kept chilled. This was done by adding iced cubes to the milk periodically. This
information is contained on Table 4.17.
Table 4.17: Milk/ milk product handling during sale Questions Answer (%)
How do you keep raw milk during sale?
Ambient
Chilled
Other
9 (100.0)
0 (0.0)
0 (0.0)
How do you usually keep boiled milk during sale?
Ambient only
Hot only
Both
0 (0.0)
0 (0.0)
9 (100.0)
How do you keep naturally fermented milk product during sale?
Ambient
Chilled
0 (0.0)
9 (100.0)
If chilled, is temperature checked?
No
Yes
0 (0.0)
9 (100.0)
If Yes, how do you respond to a warming product?
Refrigerating it
Breaking iced block into milk
0 (0.0)
9 (100.0)
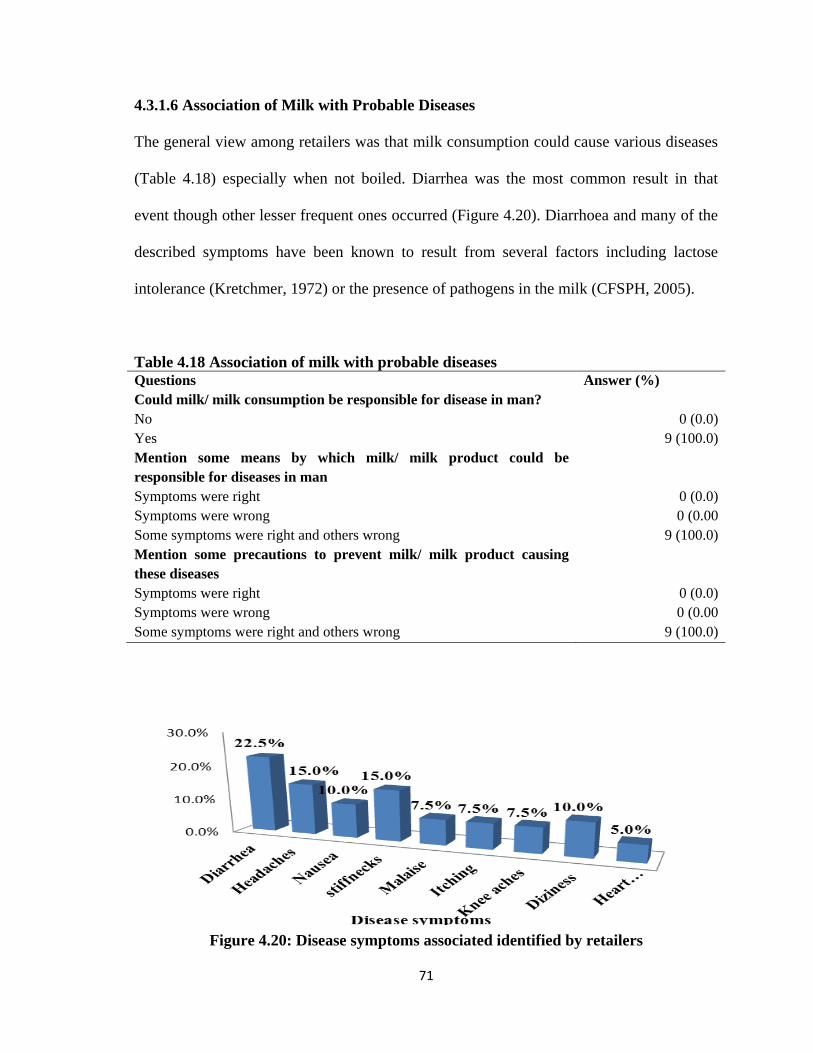
71
4.3.1.6 Association of Milk with Probable Diseases
The general view among retailers was that milk consumption could cause various diseases
(Table 4.18) especially when not boiled. Diarrhea was the most common result in that
event though other lesser frequent ones occurred (Figure 4.20). Diarrhoea and many of the
described symptoms have been known to result from several factors including lactose
intolerance (Kretchmer, 1972) or the presence of pathogens in the milk (CFSPH, 2005).
Table 4.18 Association of milk with probable diseases Questions Answer (%)
Could milk/ milk consumption be responsible for disease in man?
No
Yes
0 (0.0)
9 (100.0)
Mention some means by which milk/ milk product could be
responsible for diseases in man
Symptoms were right
Symptoms were wrong
Some symptoms were right and others wrong
0 (0.0)
0 (0.00
9 (100.0)
Mention some precautions to prevent milk/ milk product causing
these diseases
Symptoms were right
Symptoms were wrong
Some symptoms were right and others wrong
0 (0.0)
0 (0.00
9 (100.0)
Figure 4.20: Disease symptoms associated identified by retailers
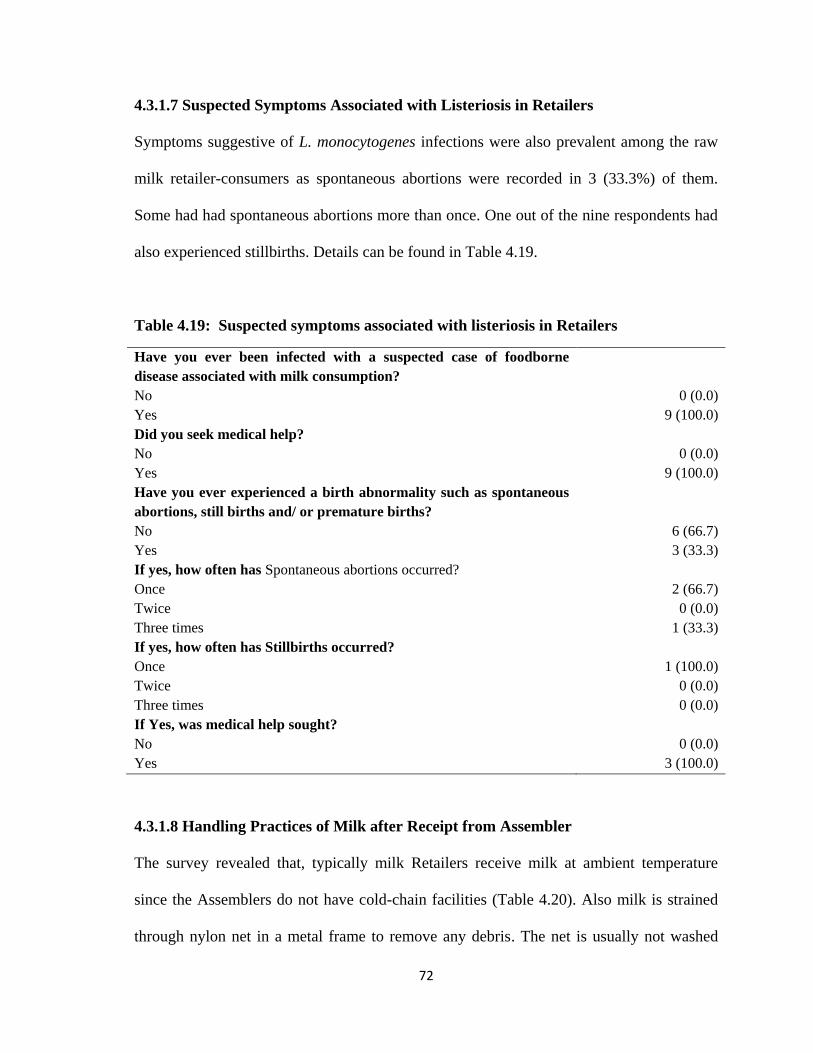
72
4.3.1.7 Suspected Symptoms Associated with Listeriosis in Retailers
Symptoms suggestive of L. monocytogenes infections were also prevalent among the raw
milk retailer-consumers as spontaneous abortions were recorded in 3 (33.3%) of them.
Some had had spontaneous abortions more than once. One out of the nine respondents had
also experienced stillbirths. Details can be found in Table 4.19.
Table 4.19: Suspected symptoms associated with listeriosis in Retailers
Have you ever been infected with a suspected case of foodborne
disease associated with milk consumption?
No
Yes
0 (0.0)
9 (100.0)
Did you seek medical help?
No
Yes
0 (0.0)
9 (100.0)
Have you ever experienced a birth abnormality such as spontaneous
abortions, still births and/ or premature births?
No
Yes
6 (66.7)
3 (33.3)
If yes, how often has Spontaneous abortions occurred?
Once
Twice
Three times
If yes, how often has Stillbirths occurred?
Once
Twice
Three times
2 (66.7)
0 (0.0)
1 (33.3)
1 (100.0)
0 (0.0)
0 (0.0)
If Yes, was medical help sought?
No
Yes
0 (0.0)
3 (100.0)
4.3.1.8 Handling Practices of Milk after Receipt from Assembler
The survey revealed that, typically milk Retailers receive milk at ambient temperature
since the Assemblers do not have cold-chain facilities (Table 4.20). Also milk is strained
through nylon net in a metal frame to remove any debris. The net is usually not washed

73
prior to its reuse. The strained milk could be sold as-is, or boiled or fermented overnight
before it is sold. Sales of boiled milk begins when the heating process begins, thus the milk
might not be adequately heated before dispensing to consumers.
Table 4.20: Handling practices of milk after receipt from Assembler In what state do you usually receive milk from Assemblers?
Ambient
Boiled
Chilled
9 (100.0)
0 (0.0)
0 (0.0)
Is milk sieved when being poured into receptive containers?
No
Yes
0 (0.0)
9 (100.0)
If Yes, with what is it sieved?
A piece of cloth
A sieve made with net
0 (0.0)
9 (100.0)
Are sieve/ cloth washed before use?
No
Yes
0 (0.0)
9 (100.0)
If Yes, with what are they washed?
Water only
Water and sponge
Water, sponge and soap
Other
9 (100.0)
0 (0.0)
0 (0.0)
0 (0.0)
Are sieve/ cloth washed before use on every physically separated
milk consignment?
No
Yes
0 (0.0)
9 (100.0)

74
4.3.2.1 Demographic Characteristics of Consumers
The demographic profile of consumers as was obtained from administering a questionnaire
(Appendix E (II)) is presented in Table 4.21. Consumers of milk from informal markets are
predominantly young multi- ethnic adult Muslim females between the ages of 26-35years.
Nearly half of the sampled population lacked any formal education and were self-
employed. Some public service workers with higher formal education were also
interviewed. Most of these consumers sought medical care from the T.G.H.
Table 4.21: Demographic characteristics of consumer respondents
Characteristic Category Respondents
N %
Sex Female
Male
83
67
55.3
44.7
Age (yrs.) 15-25
26-35
36-45
>45
61
55
28
6
40.7
36.7
18.7
4.0
Religion Christianity
Islam
66
84
44.0
56.0
Location Agyei Kojo
Tema
Lebanon
Mantseman
Asensuba
Niiman
Taboo
Market Square
Night Market
Tsinagbe
Tulaku
Maamomo
Obakatse
Zongo Laka
4
3
14
3
13
5
6
11
11
14
48
5
8
5
2.7
2.0
9.3
2.0
8.7
3.3
4.0
7.3
7.3
9.3
32.0
3.3
5.3
3.3
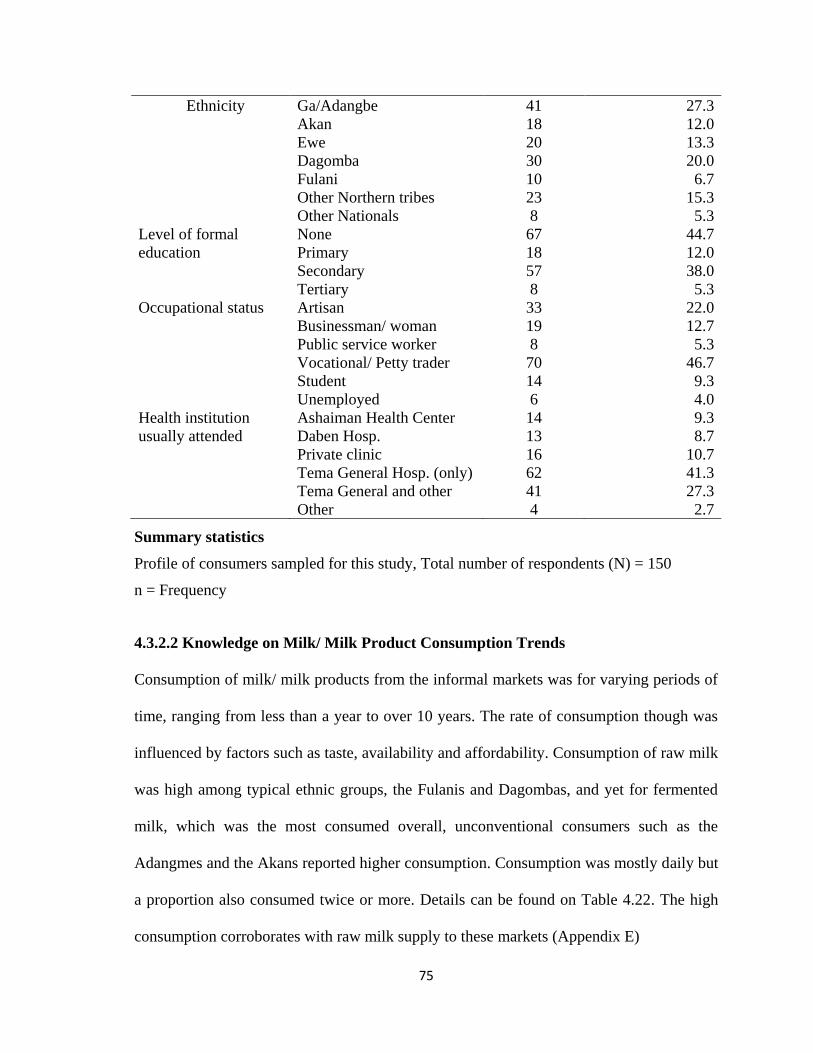
75
Ethnicity Ga/Adangbe
Akan
Ewe
Dagomba
Fulani
Other Northern tribes
Other Nationals
41
18
20
30
10
23
8
27.3
12.0
13.3
20.0
6.7
15.3
5.3
Level of formal
education
None
Primary
Secondary
Tertiary
67
18
57
8
44.7
12.0
38.0
5.3
Occupational status Artisan
Businessman/ woman
Public service worker
Vocational/ Petty trader
Student
Unemployed
33
19
8
70
14
6
22.0
12.7
5.3
46.7
9.3
4.0
Health institution
usually attended
Ashaiman Health Center
Daben Hosp.
Private clinic
Tema General Hosp. (only)
Tema General and other
Other
14
13
16
62
41
4
9.3
8.7
10.7
41.3
27.3
2.7
Summary statistics
Profile of consumers sampled for this study, Total number of respondents (N) = 150
n = Frequency
4.3.2.2 Knowledge on Milk/ Milk Product Consumption Trends
Consumption of milk/ milk products from the informal markets was for varying periods of
time, ranging from less than a year to over 10 years. The rate of consumption though was
influenced by factors such as taste, availability and affordability. Consumption of raw milk
was high among typical ethnic groups, the Fulanis and Dagombas, and yet for fermented
milk, which was the most consumed overall, unconventional consumers such as the
Adangmes and the Akans reported higher consumption. Consumption was mostly daily but
a proportion also consumed twice or more. Details can be found on Table 4.22. The high
consumption corroborates with raw milk supply to these markets (Appendix E)
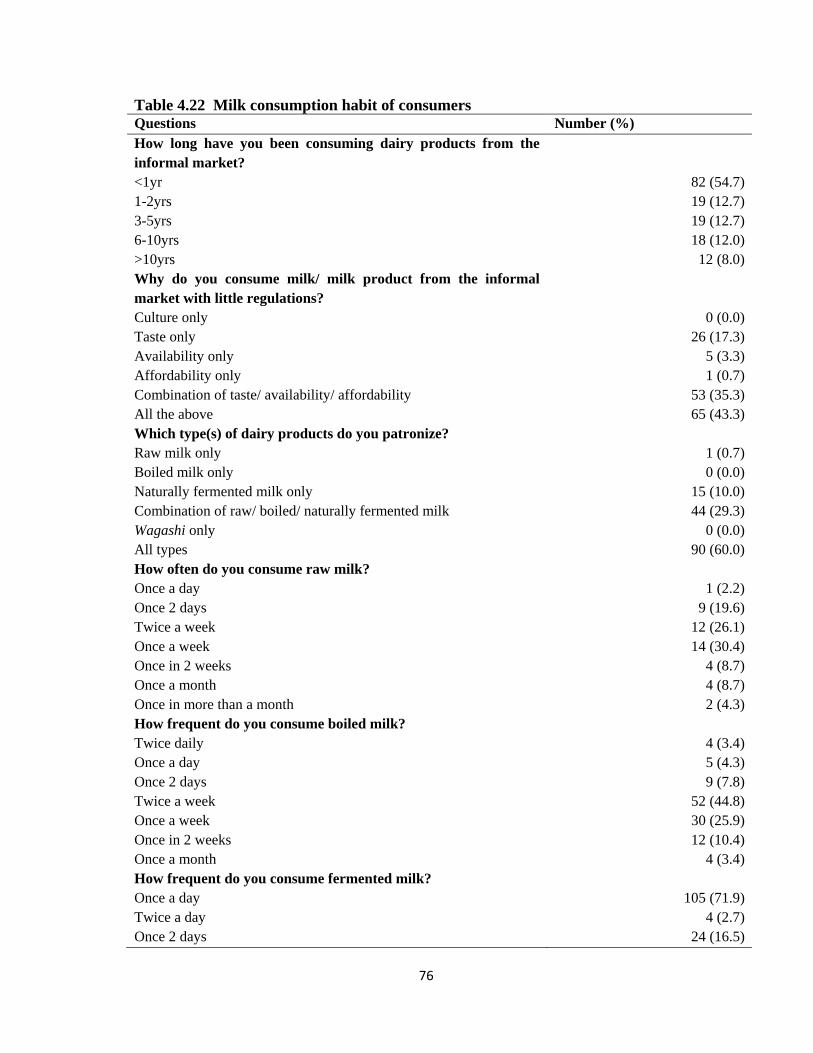
76
Table 4.22 Milk consumption habit of consumers Questions Number (%)
How long have you been consuming dairy products from the
informal market?
<1yr
1-2yrs
3-5yrs
6-10yrs
>10yrs
82 (54.7)
19 (12.7)
19 (12.7)
18 (12.0)
12 (8.0)
Why do you consume milk/ milk product from the informal
market with little regulations?
Culture only
Taste only
Availability only
Affordability only
Combination of taste/ availability/ affordability
All the above
0 (0.0)
26 (17.3)
5 (3.3)
1 (0.7)
53 (35.3)
65 (43.3)
Which type(s) of dairy products do you patronize?
Raw milk only
Boiled milk only
Naturally fermented milk only
Combination of raw/ boiled/ naturally fermented milk
Wagashi only
All types
1 (0.7)
0 (0.0)
15 (10.0)
44 (29.3)
0 (0.0)
90 (60.0)
How often do you consume raw milk?
Once a day
Once 2 days
Twice a week
Once a week
Once in 2 weeks
Once a month
Once in more than a month
How frequent do you consume boiled milk?
Twice daily
Once a day
Once 2 days
Twice a week
Once a week
Once in 2 weeks
Once a month
How frequent do you consume fermented milk?
Once a day
Twice a day
Once 2 days
1 (2.2)
9 (19.6)
12 (26.1)
14 (30.4)
4 (8.7)
4 (8.7)
2 (4.3)
4 (3.4)
5 (4.3)
9 (7.8)
52 (44.8)
30 (25.9)
12 (10.4)
4 (3.4)
105 (71.9)
4 (2.7)
24 (16.5)

77
Twice a week
Once a week
Once in 2 weeks
Once a month
0 (0.0)
8 (5.5)
0 (0.0)
0 (0.0)
4.3.2.3 Attitude of Consumers to Food Hygiene on the Informal Market
The results on consumer attitudes to food hygiene are summarized in Table 4.23. Some of
the consumers interviewed expressed concern about the hygiene on the fresh milk retail
market. The issues raised included retailers not wearing aprons, stray animals wandering
around, retailers serving into improperly washed bowls after they have been used, non-use
of sponge and soap in washing of bowls and wash water not being regularly changed.
Majority of them, about 83%, expressed the fact that improperly handled food can cause
illness, especially gastro-intestinal diseases.
Table 4.23 Consumer attitudes to food hygiene on the informal market Questions? Answers (%)
Have you ever received any formal training in food hygiene?
No
Yes
147 (98.0)
3 (2.0)
If Yes, where did you receive it from?
Workshop
Seminar
Health institution
School
0 (0.0)
0 (0.0)
0 (0.0)
3 (100.0)
Are you satisfied with conditions under which milk/ milk product were
sold?
No
Yes
87 (58.0)
63 (42.0)
If No, what can be done to improve upon it?
Retailers wear aprons
Not to allow animals to be wondering around
Bowls be washed with sponge and soap
Water used for washing bowls be changed regularly
34 (22.7)
56 (37.3)
62 (41.3)
49 (32.7)
Could food be responsible for disease in man?
No
Yes
26 (17.3)
124 (82.7)
If Yes, which of the following is a symptom associated with foodborne
infections?

78
Diarrhea
Vomiting
Weight loss
Miscarriages/ stillbirths/ premature births
124 (82.7)
60 (40.0)
18 (12.0)
0 (0.0)
4.3.2.4 Fresh Milk Handling Practices of Consumers
Some consumers keep milk and milk products for some time after transportation before
consumption. About 9% of consumers of the raw unpasteurized milk, 21% of consumers of
boiled milk and 19% of consumers of fermented milk store the products. The condition of
storage is either by refrigeration or at ambient temperature. About three percent of
consumers keep raw untreated milk at ambient temperature and two percent also keep
boiled milk at ambient temperature. Presented in Table 4.24 are some of the handling
conditions.
Table 4.24 Fresh milk handling practices of consumers Questions Numbers (%)
Where do you purchase your milk/ milk product from?
Farm gate
Assembler
Retailer
0 (0.0)
0(0.0)
150 (100.0)
Do you consume Raw milk at point of sale?
No
Yes
Do you consume Boiled milk at the point of sale?
No
Yes
Do you consume Fermented milk at the point of sale?
No
Yes
89 (59.3)
6 (4.0)
76 (50.7)
40 (26.7)
73 (48.7)
73 (48.7)
If No, how do you transport milk/ milk product?
On foot
By bicycle
By private vehicle
By public vehicle
74 (49.3)
8 (5.3)
1 (0.7%)
33 (22.0)
How long does it take to transportation to the point of
consumption?
<30mins
101 (67.3)

79
30mins- 1hr
>1hr
13 (8.7)
2 (1.3)
Does raw milk receive any heat treatment after transportation?
No
Yes
Does boiled milk receive any treatment after transportation?
No
Yes
Does fermented milk receive any treatment after transportation?
No
Yes
40 (26.7)
49 (32.7)
76 (50.7)
0 (0.0)
73 (18.7)
0 (0.0)
If No, is raw milk consumed immediately after transportation?
No
Yes
If No, is boiled milk consumed immediately after transportation?
No
Yes
If No, is fermented milk consumed immediately after
transportation?
No
Yes
27 (18.0)
13 (8.7)
31 (17.3)
45 (33.3)
28 (18.7)
45 (30.0)

80
4.3.2.5 Qualitative Exposure Assessment for the Risk of Exposure to L.
monocytogenes from the Consumption of Dairy Product from the Informal Market
This indicated probabilities of exposure from the consumption of milk/ milk products from
the informal market. This was primarily based on handling and processing characteristics
associated with its consumption.
Milk was produced under conditions that could easily lead to its contamination. Hands
were not cleaned neither were the teat of the cows. In addition, milk-handling gears were
not adequately washed and milk was bulked. Hence, the risk associated with raw milk
consumption was high. Indications also were that the high pregnancy and child birth rate
was a concern that could not be disregarded for raw milk consumption.
However, because raw milk was usually boiled before consumption, any threat would be
significantly reduced. Similarly, most milk consumed from the informal market was
fermented reducing any risk by anticipation.
Yet fermentation was by way of backslopping where boiled samples could again be
contaminated. This raises considerable concerns among consumers. Also, how milk
storage was done was such that the risk increases again.
In general, handling of milk was such that any action taken during a processing step before
could very easily be undermined by incorrect practices at a later stage. A detail exposure
assessment can be found in Table 4.25.

81
Table 4.25: Qualitative Exposure Assessment for the risk of exposure to L.
monocytogenes from the consumption of dairy product from the informal market
Step Handling of milk/ milk
product
Basic
process
Level of
concern
Reasons for assigning
effect
Consumpti
on
Milk consumed Endpoint High High pregnancy rate and
child birth rate.
Processing Milk boiled before
consumption
Inactivation Very low More than half of
respondents who
patronize raw milk
consumed it after it has
been boiled (32.6%). The
vast majority also
preferred fermented milk
(at 97.3).
Storage Milk refrigerated/ kept
at ambient temperature.
Storage compartment
open often
Growth High Temperature abuse.
Majority who store dairy
products (at 20.7%) had
their refrigerators being
opened quite often
Transport Milk sent away after
purchase for
consumption
Growth Low Time for transportation
usually below 30mins
(67.3%).
Production Milking from several
animals combined.
Also milk kept on farms
until collected by
assemblers
Mixing and
Growth
High On farm hygiene was
low ( PRA-survey)
Processing Milk boiled before sale
Milk fermented before
sale
Milk sold raw using the
same containers as
boiled and fermented
milk
Inactivation
Inactivation
Cross
contaminati
on
Low
Low
Moderate
Most milk boiled before
sale.
Most milk is sold as
naturally fermented milk
Retailers mostly sold all
three kinds of milk
products using the same
utensils
Transport Milk collected from the
farm to the retail market
Cross
contaminati
on,
partition,
mixing and
Growth
Moderate Milk collection done at
early morning when
temperature was cool for
the dry seasons.
Distances to points of
retail were not so far. But
hygienic conditions
associated with these
practices were poor

82
4.3.2.6 Occurrence of Probable Initial Symptoms of Human Listeriosis
Most consumers had experience disease episodes characterized by chills, colds, nausea,
vomiting, diarrhea, malaise and/ or muscle aches at least once. Also, over a third of
consumers had experienced pneumonia, headaches, convulsions and/ or mental status
changes consequent to the initial symptoms, or separately. Details can be found on Table
4.26.
Table 4.26: Occurrence of probable initial symptoms of human listeriosis Question Number (%)
Have you experienced disease episodes characterized by symptoms
such as chills colds, nausea, vomiting, diarrhea, malaise and muscle
ache in respondent?
No
Yes
31 (20.7)
119 (79.3)
Have you experience symptoms to include headaches, stiff necks,
mental status changes, convulsions, pneumonia separately or
consequent to previous symptoms?
No
Yes
94 (62.7)
56 (37.3)
4.3.2.7 Occurrence of Pregnancy Related Abnormalities in Female Consumers
More than half the female consumers‘ population had suffered at least a pregnacy related
abnormality associated with spontanoues abortions, stillbirths and premature births. In
quite some proportion too, these conditions had occurred more than once. Spontanoues
abortions were the most common outcomes of these series of events including initial
symptoms and/ or progressive symptoms in most of the females. Premature births had also
ocurred in some individuals but at a much lower rate. Though stillbirths also occurred at a
rate quite faster and across a wider number of the female population, it was still smaller
compared to the occurrence of spontaneous abortions. The overwhelming observation was

83
that most experienced these abnormal pregnancy defects on the third trimester. In more
than half of the pregnant females who experienced these conditions, it occurred within a
week of the initial symptoms. In a few though, it occurred within two weeks and with less
than a fifth, took place much later (Table 4.27).
The high occurrence of these conditions within a few days to a week adds more urgency to
the situation. This was because of the casual relationship which seemed not to emphasize
so much the importance of the organism to the occurrence of these events but rather the
―pregnancy‖ or physiological state of the individual since by far most occurrences in the
victims did not take place more often beyond two weeks or even a month after initial
symptom. Furthermore, most of these females had these events in the third trimester where
it was expected that their immune response would have been significantly downregulated.
Table 4.27 Occurrence of pregnancy related abnormalities in female consumers Have you experienced spontaneous abortion, stillbirth and/ or
premature births before?
No
Yes
N/A
28 (33.7)
55 (66.3)
67 (44.7)
How often have you experienced spontaneous abortion(s) before?
Once
Twice
Three times
Four times
Five times
>Five times
20 (42.6)
14 (29.8)
8 (17.0)
2 (4.3)
2 (4.3)
1 (2.1)
How often have you experienced stillbirth(s) before?
Once
Twice
Three times
6 (85.7)
1 (14.3)
0 (0.0)
How often have you had premature birth(s)?
Once
2 (100.0)
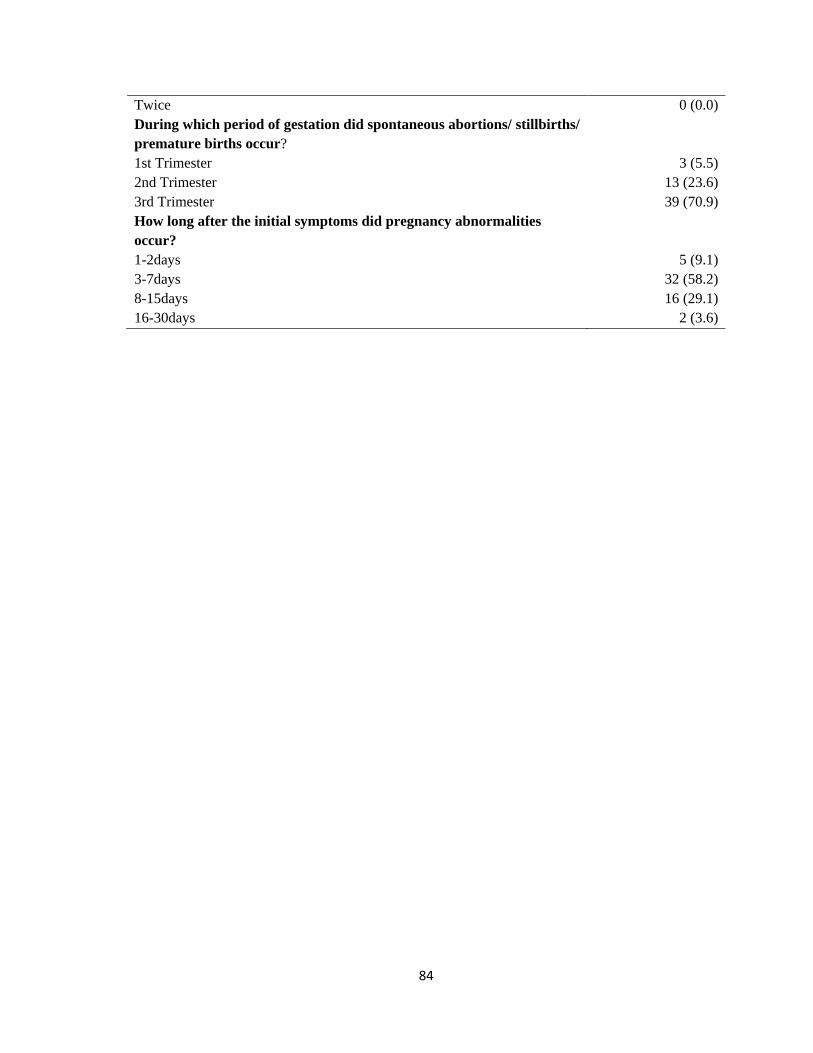
84
Twice 0 (0.0)
During which period of gestation did spontaneous abortions/ stillbirths/
premature births occur?
1st Trimester
2nd Trimester
3rd Trimester
3 (5.5)
13 (23.6)
39 (70.9)
How long after the initial symptoms did pregnancy abnormalities
occur?
1-2days
3-7days
8-15days
16-30days
5 (9.1)
32 (58.2)
16 (29.1)
2 (3.6)
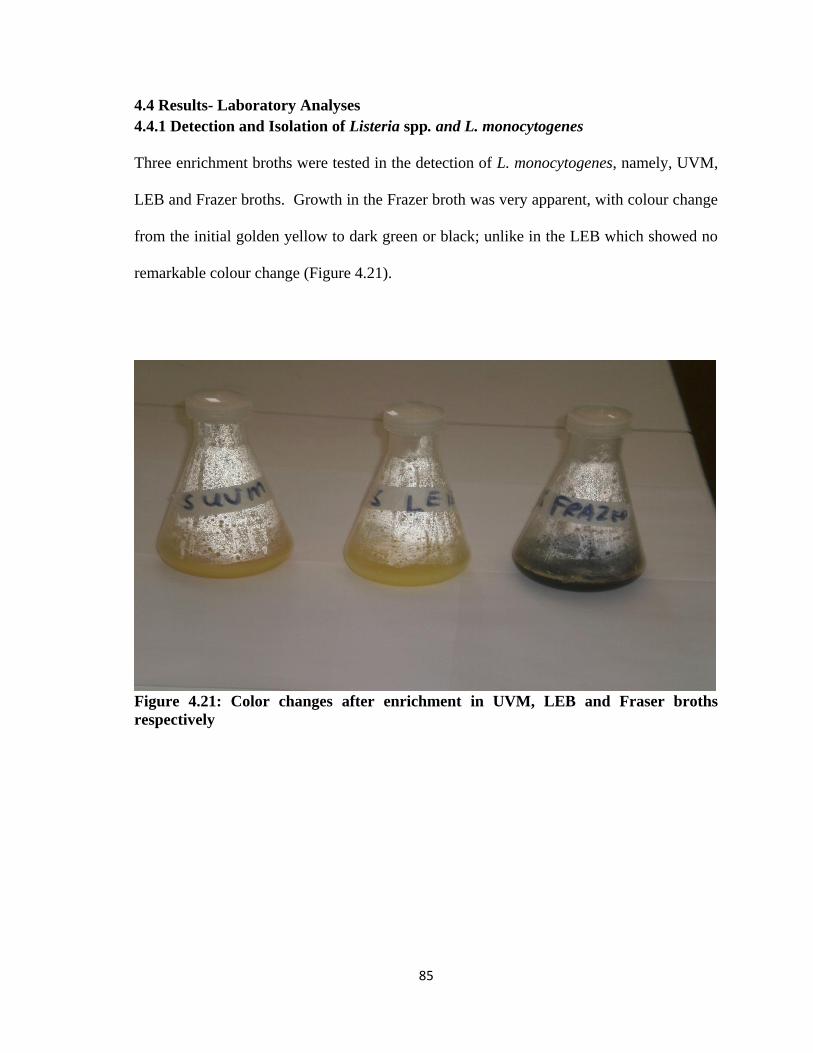
85
4.4 Results- Laboratory Analyses
4.4.1 Detection and Isolation of Listeria spp. and L. monocytogenes
Three enrichment broths were tested in the detection of L. monocytogenes, namely, UVM,
LEB and Frazer broths. Growth in the Frazer broth was very apparent, with colour change
from the initial golden yellow to dark green or black; unlike in the LEB which showed no
remarkable colour change (Figure 4.21).
Figure 4.21: Color changes after enrichment in UVM, LEB and Fraser broths
respectively
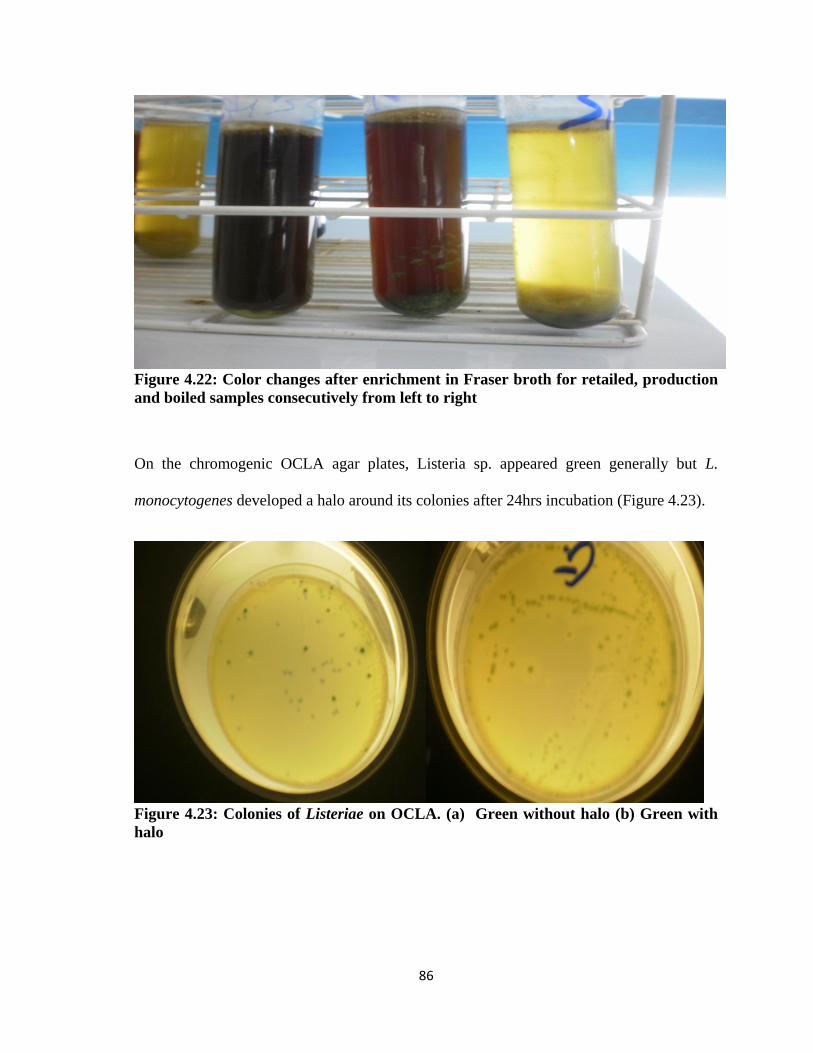
86
Figure 4.22: Color changes after enrichment in Fraser broth for retailed, production
and boiled samples consecutively from left to right
On the chromogenic OCLA agar plates, Listeria sp. appeared green generally but L.
monocytogenes developed a halo around its colonies after 24hrs incubation (Figure 4.23).
Figure 4.23: Colonies of Listeriae on OCLA. (a) Green without halo (b) Green with
halo

87
Colonies on PALCAM or Oxford agar plates were dark-green with dark haloes (Figure
4.24)
Figure 4.24: Colonies of Listeria species on (a) PALCAM Agar (b) Oxford (OXA)
Agar
Typical presumptive isolates from the different media were Gram- positive and catalase
positive. They did not take up the red color of Congo red dye, thus testing negative test for
encapsulation. At room temperature they showed motility in Citrate Indole Motility
medium (CIM) but motility was not observed above 30°C, which was characteristic of
Listeriae. The isolates suspected to be L. monocytogenes tested positive in the Beta-
hemolytic activity test. (Figures 4.25) are illustrations of hemolysis caused by S. aureus
isolate and a reference L. monocytogenes NCTC 11994 strain on sheep blood.
Figure 4.25: Blood hemolysis results: (a) S. aureus; (b) Isolate; (c) Reference strain
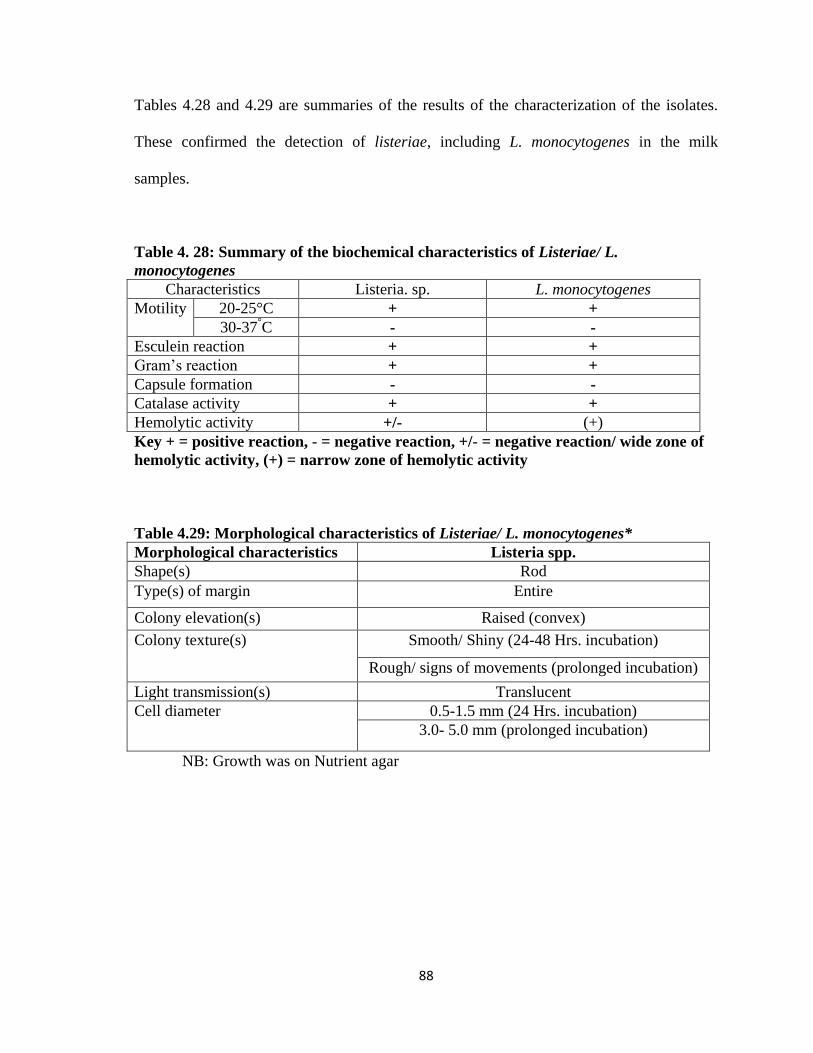
88
Tables 4.28 and 4.29 are summaries of the results of the characterization of the isolates.
These confirmed the detection of listeriae, including L. monocytogenes in the milk
samples.
Table 4. 28: Summary of the biochemical characteristics of Listeriae/ L.
monocytogenes
Characteristics Listeria. sp. L. monocytogenes
Motility 20-25°C + +
30-37°C - -
Esculein reaction + +
Gram‘s reaction + +
Capsule formation - -
Catalase activity + +
Hemolytic activity +/- (+)
Key + = positive reaction, - = negative reaction, +/- = negative reaction/ wide zone of
hemolytic activity, (+) = narrow zone of hemolytic activity
Table 4.29: Morphological characteristics of Listeriae/ L. monocytogenes*
Morphological characteristics Listeria spp.
Shape(s) Rod
Type(s) of margin Entire
Colony elevation(s) Raised (convex)
Colony texture(s) Smooth/ Shiny (24-48 Hrs. incubation)
Rough/ signs of movements (prolonged incubation)
Light transmission(s) Translucent
Cell diameter 0.5-1.5 mm (24 Hrs. incubation)
3.0- 5.0 mm (prolonged incubation)
NB: Growth was on Nutrient agar

89
4.4.2 PH Changes along the Milk Value Chain
Generally, pH of samples decreased from production to fermentation where it was the least
(p< 0.05). This has been captured on Table 4.30 and Appendices G (I) (III) and (II).
Average pH at production was 6.74 though the highest was 6.85. At retail, the average pH
was 6.66 prior to boiling. After boiling, the average pH was 6.44 and the range was 6.24-
6.71. As expected, there was a much steeper decrease in pH after fermentation where the
average was 4.05 and the least was 3.80.
Table 4.30 Descriptive statistics on pH changes from production to fermentation
Sample
Mean Minimum Maximum Standard
deviation
Raw 6.738 6.650 6.850 0.040
Retailed 6.658 6.420 6.760 0.090
Boiled 6.438 6.240 6.710 0.167
Fermented 4.051 3.800 4.460 0.158
Documentaries by several authors including Murphy and Boor, (2008) Cousins, (1982) &
Frank et al., (1993) have emphasized the crucial roles time and temperature of keeping raw
milk affected its pH as this could lead to the growth of organisms that could alter it.
Considering that milk is a buffer, such significant changes in pH has been attributed to
microbial activity (O'Mahony, 1988). Mastitis causing organisms are clearly of probable
concern. Organisms of most interest as far as mastitis is concerned are S. aureus, S.
Agalactiae, streptococci and coliforms (Oliver et al., 2002), Listeriae sp. (Sanaa et al.,
1993). Considering its shear endurance and obstinacy (Blackman and Frank, 1996), the
favorable daily average temperature of 27-32ºC in the environment of its trade (IBIS,
2003), the non- existence of chilling during transports (Kivaria, 2006), the distance from
production to retail, and the general lack of hygienic standards along such trades (Ghana:

90
FAO/ WB CP, 2005), the isolation of L. monocytogenes from the milk/milk product, was
thus understandably relevant.
After boiling, the average pH was 6.44 and the range was 6.24- 6.71. Often times,
reduction in pH was due to fermentation and/ or the deliberate addition of organic acids.
However, drop in pH also occurred when milk was let to stand for some time or had
received some heat treatment. The process of the latter has been illustrated in Equation 4.
Equation 4: Process of Decrease in pH of milk with Heating
…………………………………………….. (4)
Upon heating, the buffer capacity of milk salts changed, carbon dioxide is released,
organic acids are produced, and Tricalcium phosphate and casein phosphate are
precipitated with the release H+ (ion) (Magee and Harvey, 1926). Hence, the variances in
pH could be suggestive of the inconsistencies in inadequacy of the heating process.
The pH values of samples after fermentation decreased to less than 4.0 in a good
proportion (i.e. in 24 samples which represented (31.6%)). However, with most (52
samples or 68.4%) pH was observed above 4.0. The range was between 3.80- 4.46. This
showed gross inconsistencies in levels of fermentation achieved, a problem, to which
Obodai and Dodd, (2005) have advocated for the use of starter cultures for the production
of uniform product.

91
4.4.3 Prevalence of Listeriae in Milk Samples
Listeriae were detected in 203 of 304 samples, giving a prevalence of about 67% (Table
4.31). L. monocytogenes was detected in 142 (47%) of samples. Of the 76 milk samples
collected at production sites (farms), Listeria spp. were detected in 72.4%, but L.
monocytogenes in 42.1%. Screening of pre-boiled and pre-fermented samples on the retail
market showed detection rates of 96% and 79%, respectively, for Listeria spp. and L.
monocytogenes out of 76 samples. In the boiled samples however, detection was 23.7%
and 18.4% respectively, out of 76 samples. Listeria spp. and L. monocytogenes were
detected in 75% and 59% respectively out of 76 fermented milk samples.
Table 4.31: Detection and isolation of Listeriae/ L. monocytogenes in samples
State of Dairy Product
Production Retail Boiled Fermented
L. spp. L. m L. spp. L. m L. spp. L. m L. spp. L. m
Locations
Dorymu-1 2 - 4 4 - - 2 2
Kpone-2 4 - 4 4 1 1 2 2
Mampoh-3 3 3 4 4 - - 3 2
Mataheko-4 2 2 4 4 - - 4 3
Prampram-5 2 2 4 2 - - 4 3
Gbetseli-6 2 4 4 4 4 4 3 4
Mobole-7 4 - 2 2 - - 3 1
Suta-8 2 3 4 4 - - 3 2
Manya-9 4 4 4 4 - - 3 3
Odumase-10 3 2 4 3 2 2 3 4
Afienya-11 4 2 4 3 2 - 4 3
Tachukope-12 1 - 4 4 1 1 4 2
Dodowa-13 4 4 4 4 - - 2 2
Okyibleku-14 4 2 3 2 2 2 2 2
Apolonia-15 2 2 4 2 - - 3 2
Asebi-16 2 - 4 2 2 2 2 2
Katamanso-17 4 2 4 2 - - 4 4
Ablekuma-18 2 - 4 2 - - 2 -
Dawhenya-19 4 - 4 4 2 2 4 2
Total prevalence 55
(72.4)
32
(42.1)
73
(96.1)
60
(78.9)
18
(23.7)
14
(18.4)
57
(75.0)
45
(59.2)
NB: L. spp. - Listeria species; L. m- L. monocytogenes
92
The mean prevalence values of Listeria spp. and L. monocytogenes varied among the
samples taken at various times and at various points. Generally, values were higher for the
raw unprocessed samples collected at retail point. Listeria spp. was detected in almost all
samples, and L. monocytogenes was detected in 80% of samples. These values were
significantly higher than the prevalence in the samples collected at the milk production
points (sources). The milk pathways established, suggested the possibility of growth of the
pathogens from the production sites to the markets. Practices like bulking of milk, use of
plastic containers that are difficult to effectively clean, transport through distances by
Assemblers without cold-chain, are all factors that may influence the growth of the
pathogen in the milk. Within farm samples, only in one case was the pathogen detected in
the two batches of samples collected, which means that contamination is more sporadic, as
reported by Waak et al., (2002). The results generally showed high prevalence of the
pathogen at the farm level. Kells and Gilmour, (2003), also reported prevalence of up to
44% for Listeriae and 22.2% for L. monocytogenes) in raw milk samples on farm.
The prevalence of Listeriae in boiled samples suggests inadequate heating. Although
Listeriae is said to be recalcitrant, and are the most heat resistant non-spore forming
bacteria, effective pasteurization is expected to completely inactivate them. The practice of
boiling, as observed, involve holding the raw milk in big aluminum pots on stoves fueled
with charcoal or firewood (Figure 4. 26 (a)). Generally it takes time for the milk to heat up,
and there are no thermocouples to check cooking temperatures. Milk vending begins as
soon as the milk is placed on fire and the milk is fetched/ dispensed with the same
container used to transfer milk into pots (Figure 4.2(b)). The possibility of recontamination
is thus highly eminent.

93
Figure 4.26: Pot of milk on coal fire (a) Vessel for dishing out milk (b)
The higher prevalence for the fermented milk may be explained by the inadequate
acidification of the milk. Starter cultures are not added, fermentation is spontaneous and
the fermentation temperatures are not controlled. There is also a possibility of cross
contamination from utensils.
4.4.3 Mean Counts of L. monocytogenes in Milk Samples
Levels of L. monocytogenes concentration varied significantly along the milk value chain.
Generally, mean counts increased from samples at production to its highest at retail (i.e. on
the market prior to boiling) then decreased to their lowest after boiling only to
subsequently increase at fermentation to near farm level counts (P= 0.00) (Table 4.32 and
Appendix H (I), (II) & (III). This was a strong indicator that handling, and therefore
hygiene, played a very important role in the contamination of milk/ milk product with the
organism. L. monocytogenes was detected at levels of 100CFU/ ml in 36.4% of samples;
with the highest being 1467CFU/ ml. At retail, 57.9% of samples had levels of
≥100CFU/ml (i.e. an increase of about 21.48%) and highest mean count was 1733CFU/
mL. For boiled milk samples 6.9% of samples were positive for L. monocytogenes at ≥

94
100CFU/ mL (i.e. a decrease of 14.9%). Yet after fermentation, 46.1% had mean counts of
≥ 100CFU/ mL (which represented an increase again of about 31.2%) with the highest at
1533CFU/ ml.
Table 4.32: Descriptive statistics on L. monocytogenes counts from production to
fermentation
Sample
Mean
(x10CFU/m
L)
Minimum
(x10CFU/m
L)
Maximum
(x10CFU/mL)
Standard
deviation (x
10CFU/mL)
Raw 12.97 0.0 146.7 25.83
Retailed 28.64 0.0 173.3 40.41
Boiled 2.75 0.0 66.7 7.60
Fermented 14.71 0.0 153.3 16.64
The highest mean count of 1733CFU/mL was observed with raw milk at retail with 57.9%
(44) of 76 samples having mean counts ≥ 100CFU/ mL. Factors acknowledged to play
significant roles in such observed increases in the micro flora of milk included
temperature, mode of transportation, distance to destination (Luck, 1986; Murphy and
Boor, 2008) improper handling equipment and adulteration (Omore et al., 2003); and the
lack of refrigeration along such channels (Kivaria et al., 2006)
As reported earlier, the boiling effectively reduced the rate of detections of L.
monocytogenes. It likewise reduced levels of contaminations. Only 6.6% (5) of boiled
samples had mean counts ≥100CFU/mL for L. monocytogenes, which was in violation of
the <100CFU/mL set by the EC and were most likely the result of inadequate heating and/
or post processing contamination. There was 79% non-detection in 76 samples and the
remaining 12 samples had counts of ≥10CFU/mL but at less than 100CFU/ mL. These

95
observations attest to the documented effectiveness of heat treatment in eliminating L.
monocytogenes from foods (USDA, 1981; Bradshaw et al., 1987 & Donnelly and Briggs,
1986).
The mean counts in 46.1% (35) of fermented samples were ≥100CFU/mL whereas there
were no counts in 40.9% (31) of the samples. The practice of backslopping in the
fermentation process could possibly have re-introduced the microorganism into boiled
samples. This probably was the reason why there was high rate and levels of contamination
in fermented samples even after boiling had been done. Also, slow development of acid
has been recognized to also allow initial proliferation and acid adaptation of L.
monocytogenes strains prior to the acid build up. A study in Ethiopia on the souring of raw
milk into Ergo found that some L. monocytogenes strains (i.e. WS 2300 and WS 2303)
grew rapidly within the first 12 hrs. Levels though declined subsequently and at 48 h
counts became undetectable for both strains WS2300 and WS 2302. Another strain WS
2301 though was still detected until at 60 h when pH had decreased further (Ashenafi et
al., 1994). In response to this problem, authors such as Obodai and Dodd, (2005) have
advocated for the development and use of starter culture to get more consistent product.
Other authors who reached conclusions which also favored the rapid development of acid
as a means of improving the safety of fermented foods include Gran et al., (2003); Dalu
and Feresu, (1996) & Feresu and Nyati (1990); & Schaak and Marth, (1988).
Figure 4.27 is a milk distribution model indicating average levels of risk of L.
monocytogenes contamination in milk destined for consumption on the informal market.

96
Contamination Level
None
Low
39.0 L 54.0 L Moderate
67.5 L High
Highest
63.0 L
36.0 L 63.0 L
45.0L 81.0 L
63.0 L 33.8L
.
41.5L 27.0 L 49.5 L
.
27.0L 54.0 L
31.5L 45.0L
36.0 L 81.0 L
Raw milk Boiled milk Fermented milk (width is amount in liters)
Figure 4.27: Quantitative milk distribution model: production to retail
Manya
Mampoh, Shai hills
Okyibleku
Dodowa
Suta
Tachukope
Odumase
URBAN CONSUMERS AT ASHAIMAN
Katamanso
Ablekuma
Afienya
Apolonia
Dawhenya
Mataheko
Kpone barrier
Prampram
Gbetseli
Mobole
Doryum Asebi
RETAILERS AT ASHAIMAN

97
4.5 Risk Assessment
4.5.1 Exposure Assessment
This involved the determination of the quantities and frequencies at which milk/ milk
products were consumed by a section of the population at Ashaiman. By this, the volumes
and hence doses of L. monocytogenes consumed in milk/ milk products were determined.
Table 4.33 is the average daily/ annual consumptions of milk/ milk products for the
consuming population at Ashaiman.
Table 4.33: Amounts of milk/ milk products consumed per day at Ashaiman
Food type Respondents no
who consumed
product
Average consumption
(ml) per day
Average
consumption (ml)
per annum
Milk at production 1.0 *75.16±70.2 901.92
Milk at retail 46.0 **436.89±95.6 5242.68
Boiled milk 116.0 **654.56±125.84 7854.72
Fermented milk 141.0 **23661±113.38 283932
*Data received from farmers. **Data received from retailers’ questionnaire. All
other data was collected from consumers’ questionnaires.
NB: It was assumed that the daily consumption probability was the same on every
day of the year for individuals
4.5.1.1Need for Simulation in Assessing Risk
Analysis and therefore conclusions from studies were previously based on point estimates.
With this however, only certain markers (such as the mean, mode and median) were used
to interpret results. This did not give the accurate picture of the whole system being
studied. Increasingly, this has been replaced by the probability distribution method (that
takes into account variability and uncertainty) which represented all possible outcomes
through simulation (i.e. doing several what-ifs). Imaginably, the answer (i.e. the explicit
answer) was complex and usually losses its meaning. However, the growing use of
98
computers and the promise that these techniques can be commonly available to all
decision-makers seems to have solved this problem. Typically simulation modelling
software available for use on computers include @Risk, Crystal Ball and Analytica. The
outcomes take the form of distributions which can be explain based on the distribution
type.
4.5.1.2 Simulated L. monocytogenes Contaminated Dairy Products at Consumption
The simulated distribution for the number of L. monocytogenes in contaminated milk at
production and retail, and also for boiled and fermented milk servings was constructed
from the serving sizes and from the distribution of concentrations at point of consumption.
Quantities varied among 16 simulations, each comprising 32 000 iterations (Figures 4.28-
4.39 with their summaries in Tables 4.34-4.36).
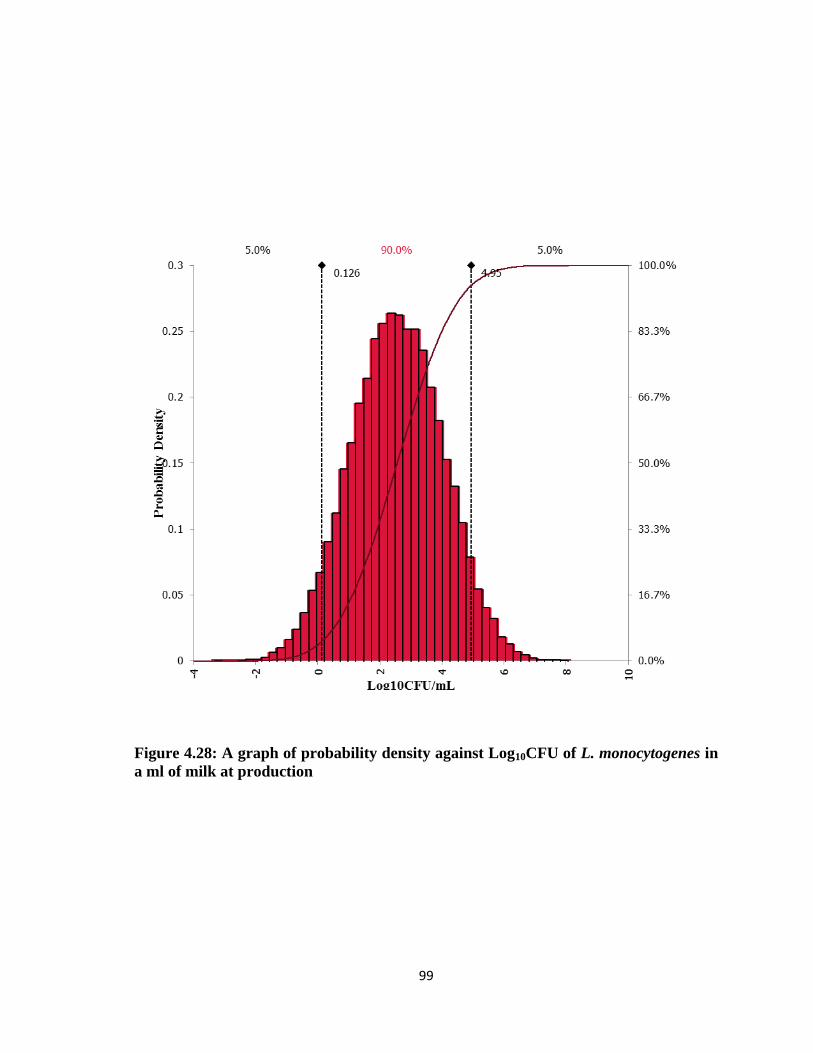
99
Figure 4.28: A graph of probability density against Log10CFU of L. monocytogenes in
a ml of milk at production

100
Figure 4.29: A graph of probability density against Log10CFU of L. monocytogenes in
a ml of milk at retail

101
Figure 4.30: A graph of probability density against Log10CFU of L. monocytogenes in
a ml of boiled milk
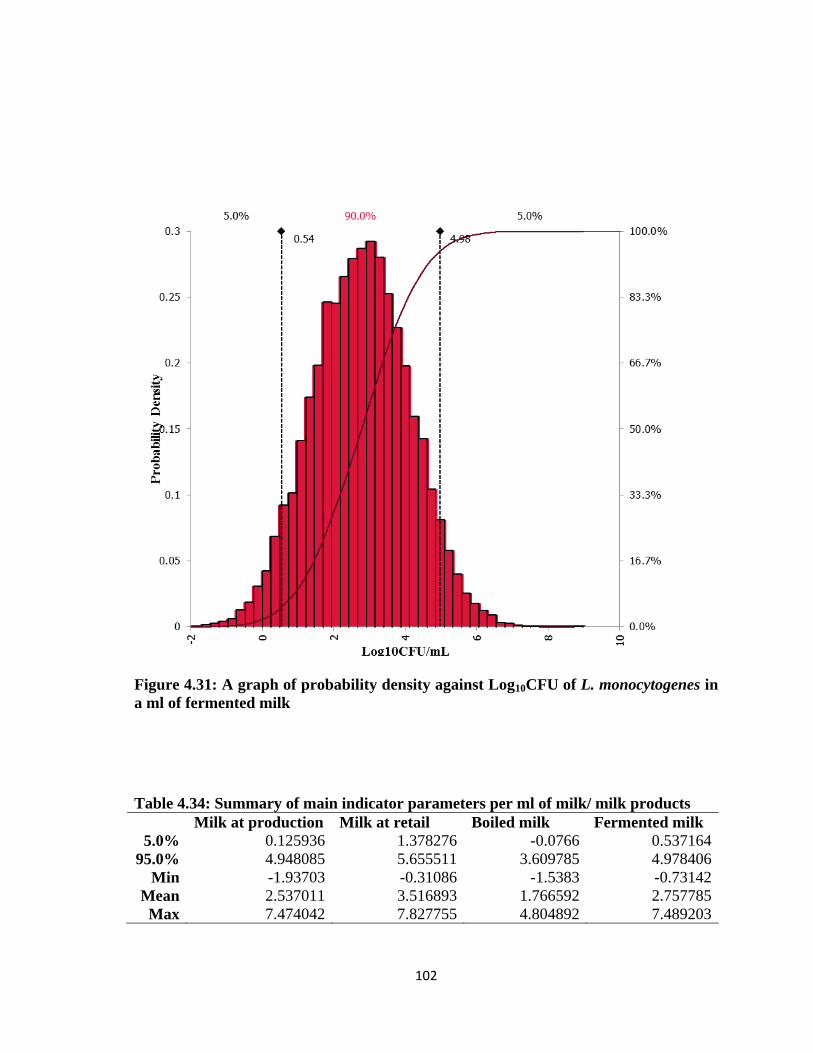
102
Figure 4.31: A graph of probability density against Log10CFU of L. monocytogenes in
a ml of fermented milk
Table 4.34: Summary of main indicator parameters per ml of milk/ milk products
Milk at production Milk at retail Boiled milk Fermented milk
5.0% 0.125936 1.378276 -0.0766 0.537164
95.0% 4.948085 5.655511 3.609785 4.978406
Min -1.93703 -0.31086 -1.5383 -0.73142
Mean 2.537011 3.516893 1.766592 2.757785
Max 7.474042 7.827755 4.804892 7.489203
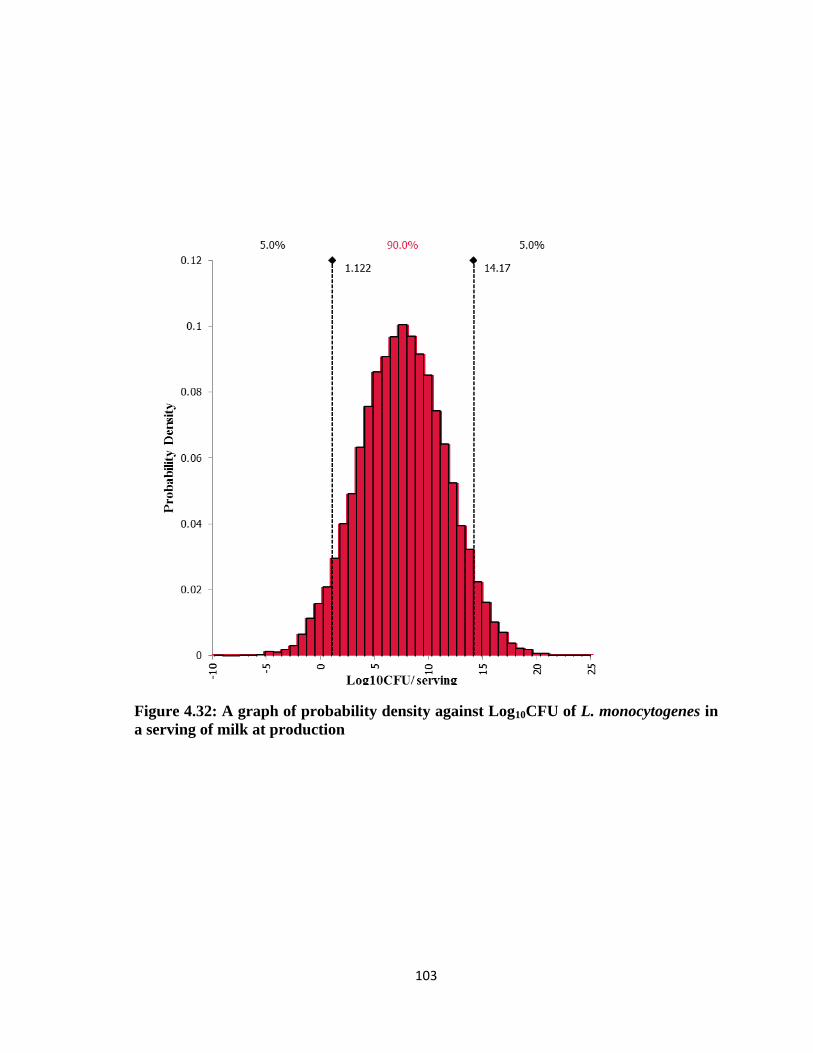
103
Figure 4.32: A graph of probability density against Log10CFU of L. monocytogenes in
a serving of milk at production
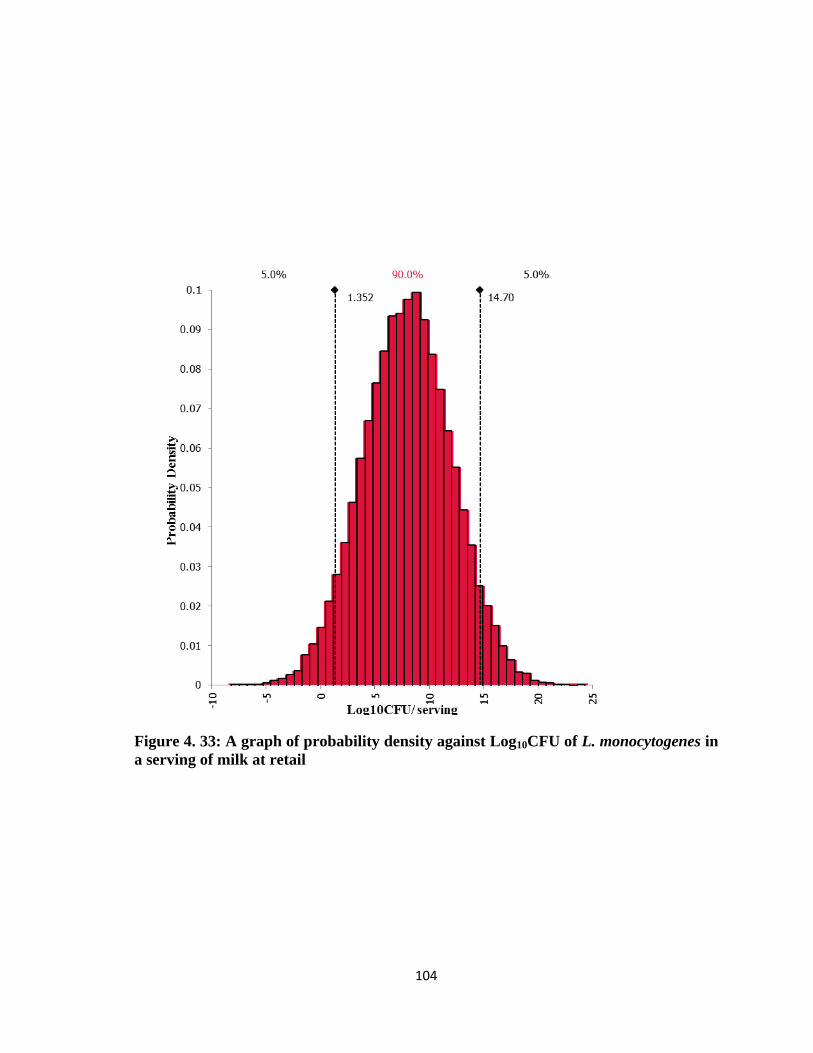
104
Figure 4. 33: A graph of probability density against Log10CFU of L. monocytogenes in
a serving of milk at retail

105
Figure 4.34: A graph of probability density against Log10CFU of L. monocytogenes in
a serving of boiled milk

106
Figure 4.35: A graph of probability density against Log10CFU of L. monocytogenes in
a serving of fermented milk
Table 4.35 Summary of main indicator parameters per serving of milk/ milk products
Milk at production Milk at retail Boiled milk Fermented milk
5.0% 1.121518 1.351997 1.191799 1.55023
95.0% 14.17448 14.6977 12.27205 13.56536
Min -4.43924 -4.324 -4.4041 -4.22489
Mean 7.648 8.024849 6.731927 7.557797
Max 19.58724 19.84885 18.63603 19.28268

107
Figure 4.36: A graph of probability density against Log10CFU of L. monocytogenes in
total daily servings of milk at production

108
Figure 4.37: A graph of probability density against Log10CFU of L. monocytogenes in
total daily servings of milk at retail

109
Figure 4.38: A graph of probability density against Log10CFU of L. monocytogenes in
total daily servings of boiled milk
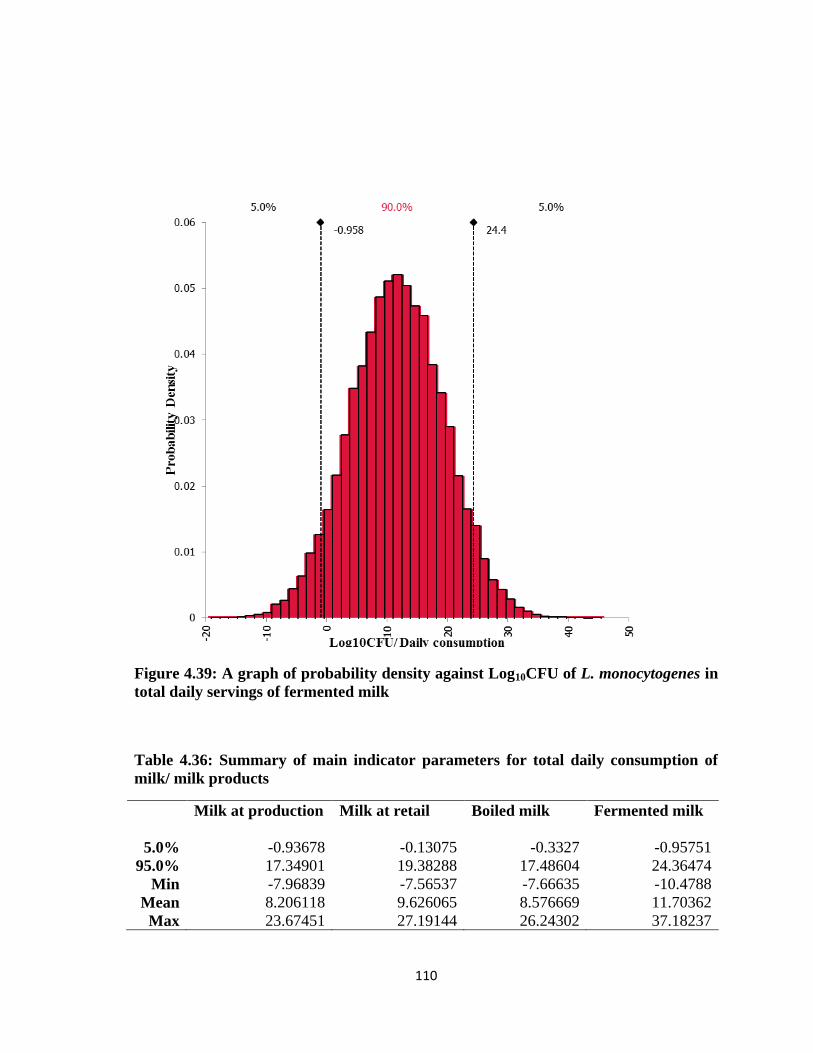
110
Figure 4.39: A graph of probability density against Log10CFU of L. monocytogenes in
total daily servings of fermented milk
Table 4.36: Summary of main indicator parameters for total daily consumption of
milk/ milk products
Milk at production Milk at retail Boiled milk Fermented milk
5.0% -0.93678 -0.13075 -0.3327 -0.95751
95.0% 17.34901 19.38288 17.48604 24.36474
Min -7.96839 -7.56537 -7.66635 -10.4788
Mean 8.206118 9.626065 8.576669 11.70362
Max 23.67451 27.19144 26.24302 37.18237

111
4.5.1.3 Exposure Outcome
For quantities of 1 ml of the various milk products, 5% severest exposure was lowest for
boiled milk (i.e. 95% chance of that not happening was highest for boiled milk
consumption and then fermented milk). It was highest for raw milk at retail. However, the
trend would change after the volumes of consumption were considered; the 5% chance of
severest exposure and therefore infection was highest for naturally fermented milk
followed by raw milk at retail per serving; and when overall consumption was considered
it was still highest for naturally fermented milk followed by boiled milk since these two
were the most consumed (Figure 4.28- 4.39)
Mean exposure was highest, significantly, for raw milk at retail when a ml and serving
were considered. However, when the total amount of milk/ milk product consumed was
considered, fermented milk, and later boiled milk, had the highest mean exposures (Table
4.34- 4.36).
Considering the widths of Figures 4.28- 4.39 it also become evident that overall fermented
milk followed by boiled milk were more likely to cause exposure because of the high
levels of consumption of these products.
The following are some selected quantiles from simulated distributions of log10 number of
L. monocytogenes organisms in contaminated milk/ milk product servings at point of
consumption (Table 4.37).
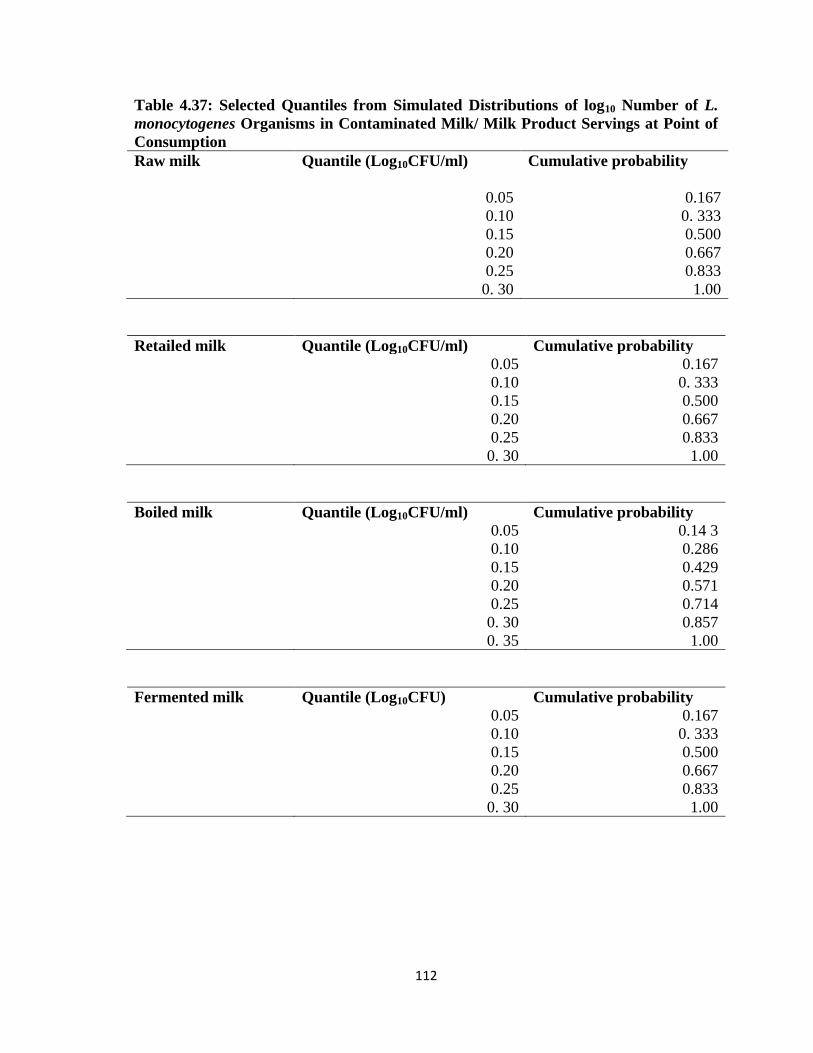
112
Table 4.37: Selected Quantiles from Simulated Distributions of log10 Number of L.
monocytogenes Organisms in Contaminated Milk/ Milk Product Servings at Point of
Consumption
Raw milk Quantile (Log10CFU/ml) Cumulative probability
0.05 0.167
0.10 0. 333
0.15 0.500
0.20 0.667
0.25 0.833
0. 30 1.00
Retailed milk Quantile (Log10CFU/ml) Cumulative probability
0.05 0.167
0.10 0. 333
0.15 0.500
0.20 0.667
0.25 0.833
0. 30 1.00
Boiled milk Quantile (Log10CFU/ml) Cumulative probability
0.05 0.14 3
0.10 0.286
0.15 0.429
0.20 0.571
0.25 0.714
0. 30 0.857
0. 35 1.00
Fermented milk Quantile (Log10CFU) Cumulative probability
0.05 0.167
0.10 0. 333
0.15 0.500
0.20 0.667
0.25 0.833
0. 30 1.00

113
4.5.2 Dose- Response Relationship
Exponential Model assumes that each organism has the potential to cause disease. This
was represented by the r- value. This r- value is the probability that a single bacteria cell
could cause disease. The Exponential Model was used for the modeling of the probability
of illnesses from consumption of food because of its fitting for modeling severe listeriosis,
simplicity as a single parameter model and its linear nature when extrapolated to low dose
ranges.
Equation 5: Exponential Model for Dose-Response
P = 1 -e-r*N
…………………………………………………………………..…………. (5)
Where N= x*Y
Where x= Concentration per grams
Where Y= Grams per serving
This was based on Buchanan et al., (1997) who conservatively predicted morbidity for
fifty per cent of immune compromise individuals. Estimation of highest numbers assumed
in food was 104 CFU since numbers in food were not very large as compare with others
like the FDA (2001) exponential models where numbers ranged from 108-10
10 CFU.
An assumption that provided support to the application of this model was that of similar
numbers of susceptible individuals and healthy people in the population with consumption
of foods being similar in the two populations. Another applicable assumption was the
apparent lack of evidence to suggest that the risk from consuming a specific number of
Listeria varies for the equivalent populations from country to country (WHO/ FAO, 2004).
Table 4.38 is the simulated means of the probabilities of illness from the consumption of a
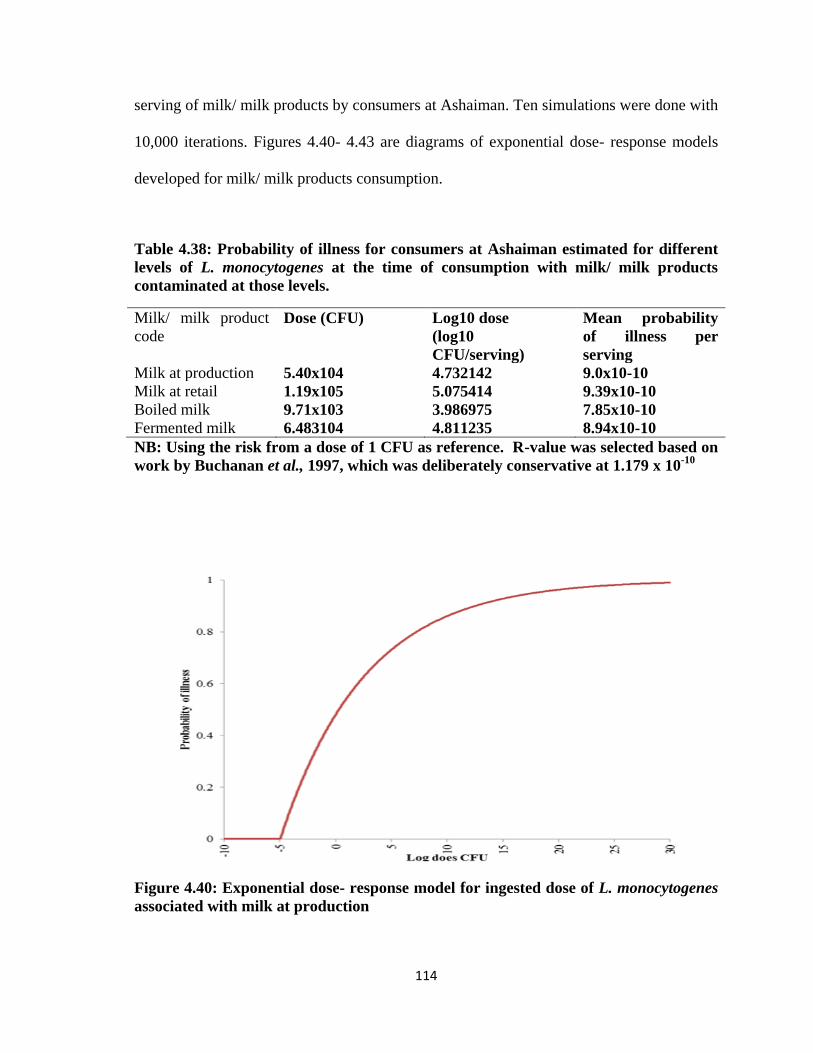
114
serving of milk/ milk products by consumers at Ashaiman. Ten simulations were done with
10,000 iterations. Figures 4.40- 4.43 are diagrams of exponential dose- response models
developed for milk/ milk products consumption.
Table 4.38: Probability of illness for consumers at Ashaiman estimated for different
levels of L. monocytogenes at the time of consumption with milk/ milk products
contaminated at those levels.
Milk/ milk product
code
Dose (CFU) Log10 dose
(log10
CFU/serving)
Mean probability
of illness per
serving
Milk at production 5.40x10⁴ 4.732142 9.0x10⁻¹⁰
Milk at retail 1.19x10⁵ 5.075414 9.39x10⁻¹⁰
Boiled milk 9.71x10³ 3.986975 7.85x10⁻¹⁰
Fermented milk 6.483104 4.811235 8.94x10⁻¹⁰
NB: Using the risk from a dose of 1 CFU as reference. R-value was selected based on
work by Buchanan et al., 1997, which was deliberately conservative at 1.179 x 10⁻¹⁰
Figure 4.40: Exponential dose- response model for ingested dose of L. monocytogenes
associated with milk at production

115
Figure 4.41: Exponential dose- response model for ingested dose of L. monocytogenes
associated with milk at retail
Figure 4.42: Exponential dose- response model for ingested dose of L. monocytogenes
associated with boiled milk

116
Figure 4.43: Exponential dose- response model for ingested dose of L. monocytogenes
associated with fermented milk
4.5.3. Risk Characterization Results
This involved the integration of the dose- response model per serving of milk/ milk
product and the number of servings. This gave a result that predicted the average
probability of serious illness (invasive listeriosis). The results therefore were more credible
across the milk/ milk products consuming populace at Ashaiman than for individual
consumers. Ten simulations were done with 10,000 iterations. The results, summarized,
have been presented on Table 4.39.

117
Table 4.39: Probability of illness for consumers at Ashaiman estimated for different
levels of L. monocytogenes at the time of consumption with milk/ milk products
contaminated at those levels.
Milk/ milk product code Mean probability of illness for consumers
Milk at production 1.64x10⁻⁹
Milk at retail 1.02x10⁻⁸
Boiled milk 1.30x10⁻⁸
Fermented milk 5.45x10⁻⁷
Source: From simulated values of the number of servings of milk/milk product
FIgure 4.44 represents probable routes for occurrence of listreiosis from informally sold
milk/ milk product consumption.
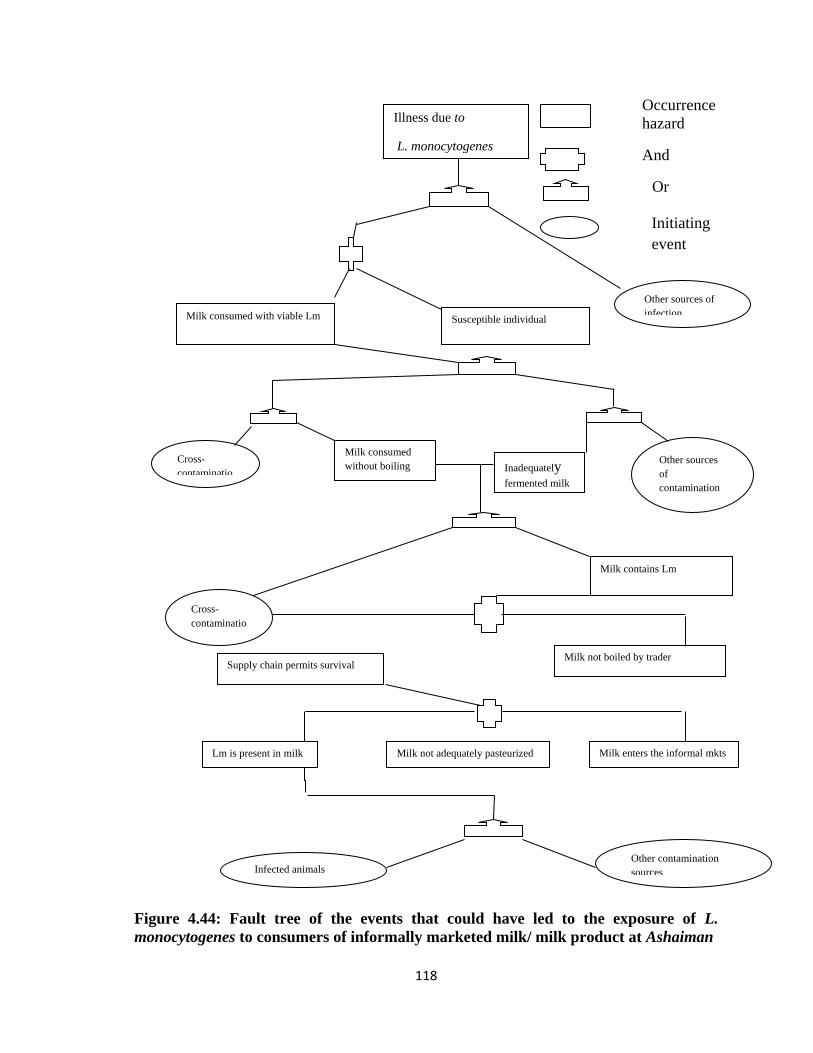
118
Occurrence
hazard
And
Or
Initiating
Figure 4.44: Fault tree of the events that could have led to the exposure of L.
monocytogenes to consumers of informally marketed milk/ milk product at Ashaiman
Infected animals Other contamination
sources
Lm is present in milk Milk not adequately pasteurized Milk enters the informal mkts
Supply chain permits survival Milk not boiled by trader
Milk contains Lm
Cross-
contaminatio
n
Milk consumed
without boiling Cross-
contaminatio
Other sources
of
contamination
Inadequately fermented milk
Milk consumed with viable Lm Susceptible individual
Other sources of
infection
Initiating
event
Illness due to
L. monocytogenes
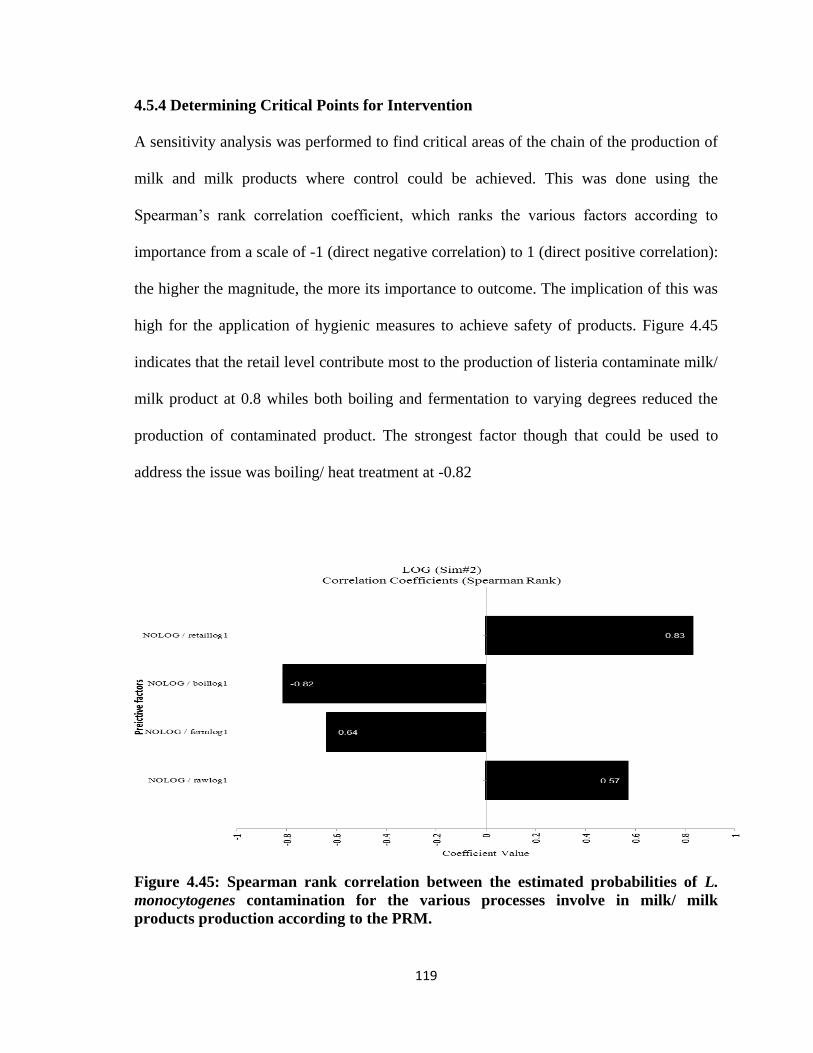
119
4.5.4 Determining Critical Points for Intervention
A sensitivity analysis was performed to find critical areas of the chain of the production of
milk and milk products where control could be achieved. This was done using the
Spearman‘s rank correlation coefficient, which ranks the various factors according to
importance from a scale of -1 (direct negative correlation) to 1 (direct positive correlation):
the higher the magnitude, the more its importance to outcome. The implication of this was
high for the application of hygienic measures to achieve safety of products. Figure 4.45
indicates that the retail level contribute most to the production of listeria contaminate milk/
milk product at 0.8 whiles both boiling and fermentation to varying degrees reduced the
production of contaminated product. The strongest factor though that could be used to
address the issue was boiling/ heat treatment at -0.82
Figure 4.45: Spearman rank correlation between the estimated probabilities of L.
monocytogenes contamination for the various processes involve in milk/ milk
products production according to the PRM.
120
CHAPTER FIVE
CONCLUSIONS AND RECOMMENDATIONS
5.1 Conclusions
A high proportion (47%) of milk and milk products on the informal markets were
contaminated with L. monocytogenes. This suggests a commensurate risk of exposure and
hence infection as a result of consumption.
Prevalence/ levels of contamination did not vary significantly between the sites (P<0.05).
This indicated that milk production practices were similar on the various farms sites.
However, prevalence/ levels of contamination differed significantly between states
(p<0.05). This also underscored how crucial handling of milk along the value chain was.
Prevalence/ level of contamination increased from farm (at 42%) to their highest when
they had been transported unto the milk market (at 79%) prior to boiling.
Boiling was found as the most effective means of controlling the organism in the milk.
The boiling process largely eliminated all the organisms in the milk samples though there
were detections in 18% of boiled samples. This could be attributed to post- process
contamination.
The natural souring of milk as practiced on the milk markets at Ashaiman seemed to play
an inadequate role in reducing exposure to potential L. monocytogenes due to its
consumption. Prevalence was at 45%. However, the risk of exposure and hence infection
from this category of milk products per mL was lower than that due to the consumption of

121
raw milk purchased on the market. Nevertheless, this was the most patronized milk
product. Hence, overall, its risk implications were highest.
5.2 Recommendations
It is recommended that farmers wash teat of cows, hands and other milking equipment
adequately with a suitable antiseptic to prevent contamination of raw milk. Subsequently,
milk must be stored in the aluminum cans recommended by the FAO (which are easier to
clean), and in the absence of refrigeration, must be transported during the cool of the day.
.
On the markets, raw milk must be subjected to effective heat treatment (boiling or
pasteurization) before souring and/ or retailing to consumers as this was observed to
eliminate the organism. Also, with the probability of post-process contamination, it is
recommended that different vessels are used for dishing out different products during sale.
L. monocytogenes was detected in some boiled samples after only fermentation. Hence,
after boiling it is vitally important that hygiene be maintained to prevent recontamination
of product. Also, the efficacy of the backslopping process cannot be without dispute. Most
fermented samples in which there was non- detection of L. monocytogenes had pH≤ 4.0.
However, milk product with pH<4.0 were not appealing to consumers as they were too
sour. Hence, care must be taken to prevent contamination after boiling.
Finally, agents along the milk value chain must be educated on the hygienic handling of
milk/ milk products as contamination of milk was found at all levels of the milk value

122
chain. Consumers should also be made aware of the danger they could inadvertently cause
themselves by not handling milk/ milk products in a safe manner.

123
REFERENCES
Ababouch, L (2000). Potential of Listeria hazard in African fishery products and possible
control measures. Int. J Food Microbiol. 62: 211 –215.
Abraham, C.A., Laryea, A. M. (1968). Preliminary investigation of the bacteriology of
raw milk produced on the Accra plains. Ghana Medical Journal 261:100
http://www.cfsph.iastate.edu. Date retrieved: 02/02/09.
Adams, M., Motarjemi, Y. (1999). Basic food safety for health workers.
WHO/SDE/PHE/FOS/991.pp?
Web: http://whqlibdoc.who.int/hq/1999/WHO_SDE_PHE_FOS_99.1.pdf
Adesiyun A.A., Webb L.A., Romain H., Kaminjolo J.S. (1996): Prevalence of Salmonella,
Listeria monocytogenes, Campylobacter spp., Yersinia enterocolitica and
Cryptosporidium spp. in bulk milk, cows‘ faeces and effluents of dairy farms in
Trinidad. Revue Élev. Méd. Vét. Pays Trop., 49, 303–309.
Association Française de Normalisation (AFNOR) (2000). Normalisation Française XP V
08-062. Microbiologie des aliments. Méthode de dénombrement de Listeria
monocytogenes. Méthode de Routine. Paris, France.
AOAC Official Method 993.12. (2000). Listeria monocytogenes in milk and dairy
products. Selective enrichment and isolation method. Official methods of analysis
of AOAC international. In: Official methods of analysis of AOAC international,
Volume I, agricultural chemicals; contaminants; drugs, Horwitz W., ed. AOAC
international, Gaithersburg, MD, USA, 138–141.
Almeida, P. F., Almeida, R.C.C. (2000). A PCR protocol using inl gene as a target for
specific detection of Listeria monocytogenes. Food Control II: 97-101.
Anonymous. (1997). Listeriosis in England and Wales: 1983 to 1996, Communicable
Disease Report, 7 (11) 95.
Anonymous. (1988). FDA regional workshops to discuss microbial concerns in Seafood.
Food Chem. News. 30(43):27.
Annual report, (2006). Veterinary Services Directorate- Ministry of Food and
Agriculture. Ghana. Pp. 18
Antweiler, A. (2009). Today‘s exchange rates. Pacific exchange rate services, Canada.
Retrieved 13/03/09.
Arimi, S.M., Ryser, E.T., Donnelly, C.W. (1997). Dairy cattle and silage as potential
sources of Listeria ribotypres common to dairy processing facilities. J. Food. Prot.
60: 811.

124
Asante, A (2004). Assessment of food import and food aid against support for
agricultural development: The case of Ghana. FAO- Regional office.
Ashenafi, M (1994) Fate of Listeria monocytogenes during the souring of ergo, a
traditional Ethiopian fermented milk. J. Dairy Sci. 77:69&702
Asuming-Brempong, S. (2003). National Report Ghana. Roles of Agriculture Project
International Conference 20-22 October, Rome, Italy. Agricultural and
Development Economics Division (ESA) Food and Agriculture Organization of the
United Nations.
Autio, T., Korkeala, H., Bjorkroh, J. (2003). Tracing the sources of Listeria
monocytogenes and listeriosis using molecular tools. Academic Dissertation.
Department of Food and Environmental Hygiene. Faculty of Veterinary Medicine,
University of Helsinki, Finland. ISBN 952-91-6362-2.
Berman, D. T (1981). Diseases of cattle in the tropics. Current topics in Veterinary
Medicine and Animal Science. 6: 271-286.
Benkirane, A., (1998). Bovine tuberculosis in Africa. World Anim. Rev. 90, 54–56.
Beauregard, K. E., Lee, K.D., Collier, R.J., Swanson, J. A. (1997). pH-dependent
perforation of macrophage phagosomes by listeriolysin O from Listeria
monocytogenes. J Exp Med 186:1159–1163.
Bubert,A ., Riebe, J., Schnitzler, N., Schönberg, A., Goebel, W ., Schubert , P (1997).
Isolation of catalase-negative Listeria monocytogenes strains from listeriosis
patients and their rapid identification by anti-p60 antibodies and/or PCR. J. Clin.
Microbiol. (35) 1: 179-183.
Bhandari, B.B. (2003). Participatory Rural Appraisal (PRA). Module 4. Institute of
Global Environmental Studies.
Blackman, I. C., Frank, J. F. (1996). Growth of Listeria monocytogenes as a biofilm on
various food-processing surfaces. J. of Food Protection 59: 827-831.
Bojsen-Moller, J. (1972). Human listeriosis: diagnostic, epidemiological and clinical
studies. Acta Pathol Microbiol Scand Suppl 229: 1-157.
Bradshaw, J. G., Peeler, I.T., Corwin, J.J., Hunt, J.M., Twedt, R.M. (1987). Thermal
resistance of Listeria monocytogenes in dairy products. J. Food Rot. 50:543-544.
Bramley, A.J., C.H. McKinnon. (1990). The microbiology of raw milk. Pp. 163-208
In Dairy Microbiol, Vol. 1. Robinson, R.K. (ed.) Elsevier Science Publishers,
London.
Buchanan, R.L., Damert, W.G., Whiting, R.C. & van Schothorst, M. (1997). Use of

125
epidemiologic and food survey data to estimate a purposefully conservative dose-
response relationship for Listeria monocytogenes levels and incidence of listeriosis.
J. of Food Protection, 60: 918–922.
Buncic, S. (1991). The incidence of L. monocytogenes in slaughtered animals, in meat, and
in meat product in Yugoslavia. Int. J Food Microbiol. 12:173-180.
CAC, (1999). Codex principles and guidelines for the conduct of microbiological risk
assessment. Document CAC/GL-30 (1999). Available at
www.codexalimentarius.net/download/standards/357/CXG_030e.pdf.
CAC. (2007). Principles and guidelines for the conduct of microbiological risk
management. Document CAC/GL 63. Available at
www.codexalimentarius.net/download/standards/10741/CXG_063e.pdf.
CAC/ RCP 57 (2004). Code of hygienic practice for milk and milk products.
CDC, (2006). FoodNet Surveillance Report for 2004. (Final Report).
CFSPH. (2005). Listeriosis. College of Veterinary Medicine. Iowa State University
http://www.cfsph.iastate.edu. Date retrieved: 02/02/09.
Chambers R. (1983). Rural development: putting the last first. London: Longman, Harlow.
13 (1997) Whose Reality Counts? Putting the first last, Intermediate Technology
Publications, London.
Cornish, G.A., Aidoo, J.B. (2000). Informal Irrigation in the Peri-urban Zone of Kumasi,
Ghana. Report OD/ TN 97, March 2000, HR Wallingford Ltd, Wallingford, UK.
Pp. 123.
Cornish, G.A., Lawrence, P. (2001) Informal Irrigation in Peri-urban Areas: A Summary
of Findings and Recommendations. Report OD/TN 144, Nov. 2001, HR
Wallingford Ltd, Wallingford, UK
Cramb, R. A., Purcell, T. D. (2001). ―How to monitor and evaluate impacts of
participatory research projects: a case study of the forages for smallholders
Project.‖ CIAT Working Document 185. Centro Internacional de Agricultura
Tropical (CIAT), Cali, Colombia. http://www.ciat.cgiar.org/asia/how-
to/WHOLE.PDF.
Cummins, A. J., Fielding, A. K., and McLauchlin, J. (1994). Listeria ivanovii infection in a
patient with AIDS. J. Infect. 28: 89–91.
Curtis, G. D. W., Mitchell, R. G., King, A. F., and Griffin, E. J. (1989). A selective
differential medium for the isolation of Listeria monocytogenes. Lett. Appl.
Microbiol. 8: 95–98.

126
Dalu, J. B., Feresu, S.B. (1996). Survival of Listeria monocytogenes in three Zimbabwean
fermented milk products. J. Food Protect. 59: 379-383.
Datta, A. R, Wentz, B.A., Hill, W.E. (1988). Identification and enumeration of beta-
emolytic Listeria monocytogenes in naturally contaminated dairy products. J.
Assoc. Off. Anal. Chem. 71:673-675.
De Buyser, M. L., Dufour, B., Maire, M., Lafarge, V. (2001). Implication of milk and
milk products in food-borne diseases in France and in different industrialized
countries. Int. J. Food Microbiol. 67: 1–17.
de La Rua Domenech R. (2006). Human Mycobacterium Bovis Infection in the United
Kingdom: Incidence, risks, control measures and review of the zoonotic aspects of
bovine Tuberculosis. Tuberculosis (Edinb.) 86, 77–109.
Deutz A., Pless P., Koefer J. (1999): Examination of raw cows and ewes milk for human
pathogens. Ernaehrung, 23, 359–362.
Dijkstra, R.G. (1982). The occurrence if Listeria monocytogenes in surrounding water of
canals and lakes, in ditches of one big polder, and in the effluents of canals of a
sewage treatment plant. Zentrabl. Bakteriol. Hyg.I.Abt.Orig.B. 176: 202
Donkor, E.S., Anin, K.G., Quaye, J. (2007). Bacterial contamination of informally
marketed raw milk in Ghana. Ghana Med J. 41(2): 58–61.
Donnelly, C.W. (1999). Conventional methods to detect and isolate Listeria
monocytogenes. In: Listeria, Listeriosis, and Food Safety, Ryser E. & Marth E.,
eds. Marcel Dekker, New York, NY, USA, 225–260.
Doyle, M. P., Schoeni, J.L. (1987). Comparison of procedures for isolating Listeria
monocytogenes in soft. surface-ripened cheese. J. Food Rot. 504.
Doyle, M. P., K. A. Glass, J. T. Beery, G. A. Garcia, D. J. Pollard, and R. D. Schultz.
(1987). Survival of Listeria monocytogenes in milk during high-temperature,
dontime pasteirkation. Appl. Environ. Microbiol. 53:1433.
Eddy, R. G., Scott, C.P. (1980). Some observations on the incidence of lameness in
dairy cattle in Somerset. Vet. Rec. 106:140–144.
El Marrakchi, A., Hamama, A., El Othmani, F (1993). Occurrence of Listeria
monocytogenes in milk and dairy products produced or imported into Morocco. J.
Food Protect. 56, 256–259.
El Nasri, H.O., Elmalik, K.H. (2005). Prevalence and Ranking of Bovine
127
Trypanosomiasis In Unity State, Sudan By Participatory Epidemiological, Clinical
and Laboratory Testing. Department of Preventive Medicine and Veterinary Public
Health, Faculty of Veterinary Medicine University of Khartoum.
Farber, J.M., Peterkin, P.I. (1991). Listeria monocytogenes, a food-borne pathogen.
Microbiol Rev 55: 476-511.
Farber, J. M., Sanders, G.W., Malcolm, S.A. (1988). The presence of Listeria spp. in
raw milk in Ontario. Can. J. Microbiol. 34:95–100.
FAO/WHO. (2002). Principles and Guidelines for incorporating microbiological risk
assessment in the development of food safety standards, guidelines and related
texts. Report of a Joint FAO/WHO Consultation, Kiel Germany. FAO, Rome, Italy.
FAO/WHO. (2004). Risk assessment of Listeria monocytogenes in ready-to-eat foods.
Technical Report. Microbiological Risk Assessment Series. 5: 265.
FDA/CFSAN. (2003). Foodborne Pathogenic Microorganisms and Natural Toxins
Handbook: The ―Bad Bug Book.‖ Center for Food Safety and Applied Nutrition,
Food and Drug Admin., College Park, Md.
Felon, D.R. (1986). Rapid quantitative assessment of the distribution of Listeria in silage
implicated in a suspected outbreak of listeriosis in calves. Vet.Rec. 118: 240.
Feresu, S. B., Nyati, H. (1990). Fate of Pathogenic and Non-pathogenic Escherichia coli
Strains in Two Fermented Milk Products. J. Applied Bacteriol. 69: 814-821.
Flemmings, D.O., Cochi, S.L., MacDonald, K.L., Brondum, J., Hayes, P.S., Plikaytis,
B.D., Holmes, M.B., Audurier, A., Broome, C.V., Reingold, A.L. (1985).
Pasteurized milk as a vehicle of infection in an outbreak of listeriosis. N. Engl. J.
Med. 312:404.
Foster, E. M., Nelson, F. E., Speck, M. L., Doetsch, R. N., Olson, J. C. Jr. (1957). Dairy
Microbiology. Englewood Cliffs, NJ: Prentice-Hall.
Fraser, J.A., Sperber, W.H. (1988). Rapid detection of Listeria spp. in food and
environmental samples by esculin hydrolysis. J. Food Prot. 51, 762-765.
Galdiero, E., D‘Isanto, M., Aliberti, F. (1997). Effect of saline concentration, pH and
growth temperature on the invasive capacity of Listeria monocytogenes. Res
Microbiol 148:305–313.
Garayzabel, J. F., Dominguez., R. L, Vazquez-Boland., J. A, Rodriguez., F. E. F, Briones., D. V,
Blanco C. J. L, Suarez., J. G. (1987). Survival of Listeria in raw milk treated in a
pilot plant pasteurizer. Journal of Bacteriology 63, 533-7.

128
Gaya P., Sanchez J., Medina M., Nunez M. (1998): Incidence of Listeria monocytogenes
and other Listeria species in raw milk produced in Spain. Food Microbiol., 15,
551–555.
Gellin, B.G., Broome, C.V., Bibb, W.F., Weaver, R.E., Gaventa, S., Mascola, L., The
Listeriosis Study Group. (1991). The epidemiology of listeriosis in the United
States-1986. Am. J. Epidemiol. 133: 392.
George, S.M., Richardson, L.C.C., Peck, M.W. (1996). Predictive models for the effect
of temperature, pH and acetic and lactic acids on the growth of Listeria
monocytogenes. Int. J. Food Microbiol. 32: 73–90.
Ghana: FAO/WB CP-Food. (2005). The livestock sector. Food quality and safety
standards- Identification mission. Summary and conclusion-review version. Pp 38-
74.
Global Policy Network (2004). Highlights of current labor market conditions in Lesotho.
Lesotho Clothing and Allied Workers‘ Union. Web: http://www.png.org
Date accessed: 26/08/2010.
Grana, H.M., Gadagab, H.T., Narvhusa, J.A. (2003). Utilization of various starter cultures
in the production of Amasi, a Zimbabwean naturally fermented raw milk product.
Int. J. of Food Microbiol. 88: 19– 28. Elsevier Science B.V.
Gray, M. L., Killinger, H. A. (1966). Listeria monocytogenes and Listeric Infection.
Bacteriol. Rev. 30:309-382.
Grimaud, P, Sserunjogi, M. L., Grillet, N. (2007). An evaluation of milk quality in
Uganda: value chain assessment and recommendation. Pp. 3?
Gronstol, H. (1979). Listeriosis in sheep-isolation of Listeria monocytogenes from grass
silage. Acta Vet. Scand. 20: 492.
Haas, C.N. 1983. Estimation of the risk due to low doses of microorganisms: A
comparison of alternative methodologies. American Journal of Epidemiology, 118:
573–582.
Hall R.L. (1971). The flavor industry. Pp.455.
Hattie, W.H (1927). The importance of pasteurization for the safeguarding of our milk
supply. Can Med Assoc J. 17(8): 951–952.
Headrick, M.L., Korangy, S., Bean, N.H., Angulo, F.J., Altekruse, S.F., Potter, M.E.,
Hogarh, J.N., Obiri-Danso, K., Antwi-Agyei, P. (2008). Assessment of
contamination of singed hides from cattle and goats by heavy metals in Ghana.
African J. of Envl. Sci. & Technol. 2(8): 217-221. ISSN 1234-2008.
129
Hill P. (1964). A socio-economic report on cattle ownership and Fulani herdsmen in the
Ashaiman/Dodowa District of the Accra Plains. Institute of African Studies,
University of Ghana, Ghana. (mimeo).
Hitchins, A.D. (1998). Listeria monocytogenes. In: Bacteriological Analytical Manual,
US Food and Drug Administration, AOAC International, Gaithersburg, MD, USA,
10.01–10.11.
Horgarh, J. N., Obiri-Danso, K., Antwi-Agyei, P (2008). Assessment of Contamination of
Singed Hides From Cattle Snd Goats By Heavy Metals In Ghana. Africa Journal of
Env Sci And Tech. 2(8) Pp. 217-221.
Hülphers, G. (1911). Liver necrosis in rabbits caused by a hitherto undescribed bacterium.
Swedish Veterinary Journal 16: 265-273.
Husu, J. R. (1990). Epidemiological studies on the occurrence of Listeria monocytogenes
in the feces of dairy cattle. J. Vet. Med. B. 37:276–282.
Hutchinson, R. A. (1962). Stock methods of animal husbandry. . In: J. Brian Wills (ed).
Agriculture and land use in Ghana. Oxford University Press, London. pp 425-436.
Hussain, M., Anjum, R., Bin Zahoor, A., Irshad, H., Farooq, u. (2005). Epidemiological
analysis of foot and mouth disease in Pakistan. Int. Journal of Agri. Biol. 8 (5):
648-651
IBIS (2003). Baseline report on local government, civil society and private sector
organizations and activities in Ashaiman. Ghana: Institute for Democratic
Governance and IBIS. http://www.ibisghana.com/nv/ghana/pplg/subprograms-
ashaiman.php
ILSI, (2005). Achieving Continuous Improvements in the Reduction in Food Borne
Listeriosis- A Risk Based Approach. J. Food Prot. 68 (9): 1932-1994.
International Development Research Center (IDRC), 1984) in Tariku, B. A (2006). Studies
on cattle milk and meat production in Fogera Woreda: production systems,
constraints and opportunities for development. A Thesis submitted to the
Department of Animal and Range Sciences, Awassa College of Agriculture, School
of Graduate Studies. Debub University, Awassa, Ethiopia
Jay, J.M., Loessner, M.J., Golden, D.A. (2005). Milk, fermentation, and fermented
and non- fermented dairy products. Modern food microbiology. 7eds. Springer
Science and business media. New York, NY.
Johannsson, T. (1998). Enhanced detection and enumeration of Listeria monocytogenes
from foodstuffs and food-processing environments. Int. J Food Microbiol. 40(1-2):
77-85.

130
Jones, K.E., Patel, N.G., Levy, M.A., Storeygard, A., Balk, D., Gittleman, J.L., Daszak, P.
(2008). Global trends in emerging infectious diseases. Nature. 451, 990–993.
Juntilla, J. R., Niemelä, S. I., Hirn, J. (1988). Minimum growth temperatures of Listeria
monocytogenes and non- haemolytic Listeria. J. Appl. Bacteriol. 65: 321-327.
Jarayao, B. M., and Henning, D.R. (2001). Prevalence of foodborne pathogens in bulk tank
milk. J. Dairy Sci. 84:2157–2162.
Kells, J., Gilmore, A. (2004). Incidence of Listeria monocytogenes in two milk processing
environments, and assessment of Listeria monocytogenes blood agar for isolation.
Int. J. Food Microbiol 91: 167-74.
Kennedy, G (2003). Food Security in the context of urban sub-Saharan Africa. Food
Africa, internet Forum 31 March – 11 April Internet Paper for Food Security
Theme.
Kivaria, F.M., Noordhuizen J.P., Kapaga, A.M. (2006). Evaluation of the hygienic quality
and the associated public health hazards of raw milk marketed by smallholder dairy
producers in Dar es Salaam region. Tanzania. Trop Anim Hlth Prod. 38(3): 185-194
Kretchmer, N. (1972). Lactose and lactose. Sci Am. 227(10):71-78.
Kuhn, M., Goebel, W. (1999). Pathogenesis of Listeria monocytogenes, p. 97–130. In
Ryser ET and Marth EH (eds.), Listeria, Listeriosis, and Food Safety. New York.
Kumar, H., Singh, B.B., Bal, M.S., Kaur, K., Singh, R., Sidhu, P.K., Sandhu, K.S. (2007).
Pathological and epidemiological investigations into Listeria encephalitis in sheep,
Small Rumin. Res. 71: 293–297.
Lammerding A.M., Fazil A. (2000). "Hazard identification and exposure assessment for
microbial food safety risk assessment". Int J Food Microbiol. 58(3):147-57.
Laven, R.A., Lawrence, K.R (2006). An Evaluation of the Seasonality of Veterinary
Treatments for Lameness in UK Dairy Cattle. J. Dairy Sci. 89:3858-3865.
LeJeune, T.J., and Rajala-Schultz, P.J. (2009). Unpasteurized milk: a continued public
health threat. Food Safety • CID 48: 93-100.
Linnan, M.J., Mascola, L., Lou, X.D., Goulet, V., May, S., Salminen, C., Hird, D.W.,
Yonkura, M.L., Hayes, P., Weaver, R., Audurier, A., Plikaytis, B.D., Fannin, S.L.,
Kleks., Broome, C.V. (1988). Epidemic listeriosis associated with Mexican-style
cheese. N. Engl. J. Med. 319:824- 828.
Lober, B. (1997). Listeriosis. Clin. Infect. Dis. 24: 1.

131
Lopez, S., Prats, N., A. J Marco. (1999). Expression of E-selectin, P-selectin, and
intercellular adhesion molecule-1 during experimental murine listeriosis. Am J
Pathol 155:1391–1397.
Lovett. (1992). Listeria, p. 637-663. In C. Vanderzant and D. F. Splitstoesser (ed.),
Compendium of methods for the microbiological examination of foods, 3rd ed.
American Public Health Association, Washington, D.C.
Luckins, A.G. (1988). Trypanosoma evansi in Asia. Parasitol. Today. 4: 137-142.
Lund, A. M., Zottola, E. A., Pusch, D. J. (1991). Comparison of methods for isolation of
Listeria from raw milk. J. Food Prot. 54:602. 1998 August; 88(8): 1219–1221.
Magee, H.E., Harvey, D. (1926). Some physic-chemical changes induced in milk by heat.
Cx. Studies on the effect of heat on milk. From the Rowett Research Institute,
Aberdeen
Marth, E.H. (1998). Extended shelf life refrigerated foods: microbiological quality and
safety. Foodtechnology. 52 (2): 57-61
Martin S A, Wallsten T S And Beaulieu N D, (1995) Assessing The Risk Of Microbial
Pathogens: Application Of Judgement-Encoding Methodology, J. Food Prot, 58 (3)
529.
Mead P.S., Slutsker, L., Dietz., McCraig, V.L.F., Bresee, J.S., Shapiro, C., Griffin, P.M.,
Tauxe, R.V. (1999). Food related illness and death in the United States. Emerg
Infect Dis 5:607–625.
McClain, D., & Lee, W. H. (1988). Development of USDA-FSIS method for isolation of
Listeria monocytogenes from raw meat and poultry. J. Assoc. of Official Anal
Chem, 71, 660–663.
McCrindle, C. (2008). Participatory Risk Analysis: Course notes for HACCP and Pre-
requisites. Veterinary Faculty, University of Pretoria, South Africa.
MoFA. (1990). Ghana Medium Term Agricultural Development program (MTADP). An
agenda for sustained agricultural growth and development (1991-2000) Accra.
Ghana.
MoH, (2006). Outpatient Morbidity Data- Epidemiological Department. Miettinen, M. K.,
A. Siitonen, P. Heiskanen, H. Haajanen, K. J. Björkroth, and H. J.Korkeala. (1999).
Molecular epidemiology of an outbreak of febrile gastroenteritis caused by Listeria
monocytogenes in cold-smoked rainbow trout. Journal of Clinical Microbiolgy 37,
2358-2360.
Mukhola, S.M. (2000). Factors influencing the safety and quality of street food in rural

132
areas. M. Tech Degree Dissertation, Pretoria, Technikon Pretoria.
Murphy, S.C., Boor, K.J. (2008). Sources and causes of high bacteria counts in raw milk:
An abbreviated review. Cornell University Ithaca, NY.
Murray, R. D., D. Y. Downham, M. J. Clarkson, W. B. Faull, J. W. Hughes, F. J.
Manson, J. B. Merritt, W. B. Russell, J. E. Sutherst, and W. R. Ward. (1996).
Epidemiology of lameness in dairy cattle: Description and analysis of foot lesions.
Vet. Rec. 138:586–591.
NMTIP, (2005). Support to NEPAD-CAADP implementation. Government of Ghana
(G.o.G). TCP/GHA/2908 (I). (NEPAD Ref. 05/41 E). Vol I of III. Pp 4.
Nyfeldt, A. (1929). Etiologie de la mononucléose infectieuse. Compt. Rend. Soc. Biol. 101,
590-592.
Obodai ,M., Dodd, C.E.R (2006). Characterization of dominant microbiota of a
Ghanaian fermented milk product, nyarmie, by culture- and non-culture-based
methods. J. of Appl Microbiol 100: 1355–1363.
O‘Connor, C.B (1994). Rural dairy technology. ILRI Training manual 1. ILRI Addia
Ababa, Ethiopia. Pp 1, 87
OIE Terrestrial Manual, (2008). Listeria monocytogenes. Pp 1238-1254
Okantah, S.A. (1992). Partial milking of cattle in smallholder herds on the Accra plains:
some factors affecting daily partial milk yield and milk composition. Animal
Research Institute. Anim. Prod. 54: 15-21.
Opare, C., Nsiire, A., Awumbilla, A., Akanmori, B. D. (2000). Human Behavioural
Factors Implicated In Outbreaks Of Human Anthrax in the Tamale Municipality of
Northern Ghana. Acta Tropica.76: 49-52.
Okantah S.A., Gyawu P., Asante Y., Oddoye E.O.K., Obese F.Y., Abdulai M., Mumuni
A. (1995). Characterization of peri-urban dairy production in Ghana. Paper
presented at IDRC/CARNET peri-urban dairy project post-survey workshop held at
Accra, Ghana, 29 May to 2 June.
O'Mahony, F (1988). Rural dairy technology- Experiences in Ethiopia. International
Livestock Center for Africa Manual No 4. Addis Ababa, Ethiopia .
Omore, A., Arimi, S., Kangethe, E., McDermott, J., Staal, S., Ouma, E., Odhiambo, J.,
Mwangi, A., Aboge, G., Koroti, E., Koech, R. (2002). Assessing and managing
milk-borne health risks for the benefit of consumers in Kenya. Smallholder Dairy
(R&D) Project. MALDM- AKRI-ILRI-DFID sponsored.

133
Omore, A., Aning, K.G., and Sampane-Donkor, E. (2002). Analysis of Milk–Borne Public
Health Risks in Milk Markets in Ghana. Peri-Urban Milk Marketing and Public
Health Research Project, Ghana.
Omore, A., Muriuku, H., Kenyanjui, M., Owango, M., and Staal, S. (1999). Research
Report of the MoA/KARI/ILRI Small holder Dairy (R&D) Project. Nairobi Kenya:
Internationally Livestock Research Institute. The Kenyan Dairy Subsector. A rapid
appraisal.
Omore, A., Staal, S.J., Osafo, E.L.K., Kurwijilla, L., Barton, D., Mdoe, N., Nurah, G.,
and Aning, G. (2003). Market Mechanisms, Efficiency, Processing and Public
Health Risks in Peri- Urban Dairy Product Market: Synthesis of Findings from
Ghana and Tanzania. Technical report. International Livestock Research Institute
(ILRI). Kwame Nkrumah University of Science and Technology (Ghana), Sokoine
Univ. of Agric (Tanzania). Animal Research Institute.
Omore, A., Mulindo, J.C., Fakhrul Islam, S.M., Nurah, G., Khan, M.I, Staal, S.J. and
Dugdill,B.T (2004). Employment generation through small-scale dairy marketing
and processing. Experiences from Kenya, Bangladesh and Ghana. International
Livestock Research Institute (ILRI) Nairobi, Kenya and FAO Animal Production
and Health Division
Opong-Anane. (2001). Country Pasture/ Forage Resource Profile. Animal Production
Directorate Ministry of Food and Agriculture, (MoFA).Ghana.
http://www.fao.org/ag/AGP/agpc/doc/Counprof/Ghana/Ghana.htm. Date Retrieved:
02/02/09
Osei-Somuah, A., Aning, K.G., Nartey, P.W.K., and Abbam, J.K. (2000). Listeria
Abortions in Sheep on the Accra plains: A Case Report. Ghana J. of Agric. Sci.33:
87- 91.
Parihar, V. S., Barbuddhe, S. B., Danielsson- Tham, M. L., Tham, W. (2008). Isolation and
Chateracterization of Listeria Species from Tropical Seafoods. Food Control. 19:
566-569.
Petron, R. L., Zottola, E. A. (1989). A study of factors affecting growth and recovery of
Listeria monocytogenes Scott A. J. Food Sci. 54: 458-460.
Popkin, B.M. (2001). The Nutrition Transition and Obesity in the Developing World.
J. of Nutrition.131: 8732.
Pirie, J. H. H. 1927. A new disease of veldt rodents, ―tiger river disease‖. Pub. South
Africa Inst. Med. Res. 62: 163-186.
Pirie, J. H. 1940. The genus Listerella Pirie. Science: 383.

134
Poutrel, B., Bourry, A., Rocourt, J (1995). Bovine mastitis caused by Listeria
monocytogenes: Characteristics of natural and experimental infections. J Med
Microbiol 43: 125-132.
Poznanski, E., Cavazza, A., Cappa, F., Cocconcelli, .S. (2004) Indigenous raw milk
microbiota influences the bacterial development in traditional cheese from an
alpine natural park. Int. J Food Microbiol. 92: 141–151.
Psoni, L., Tzanetakis, N., Litopoulou-Tzanetak, E. (2003). Microbiological
characteristics of Batzos, a traditional Greek cheese from raw goat's milk. Food
Microbiol 20 (5):575-582.
Rehber E., Ulusoy, S. (1998). HACCP system and its feasibility in developing countries:
a cost-benefit analysis approach. 61st
EAAE Seminar. Warsaw Agric. Univ., Dept
Agrarian Policy and Marketing: Warsaw Agric. Univ. Press, pp. 198-211.
Reissbrodt, R., (2004). New chromogenic plating media for detection of pathogenic
Listeria spp. – An overview. Int. J. Food Microbiol. 95, 1–9.
Rocourt, J., Jacquet, Ch. and Reilly, A., (2000). Epidemiology of human listeriosis and
seafoods. Int. J. Food Microbiol 62:197-209.
Rohrbach, B., Draughon, F.A., Davidson, P.M., Oliver, S.P. (1992). Prevalence of L
monocytogenes, C. jejuni, Y. enterocolitica, and Salmonella in bulk tank milk: Risk
factors and risk of human exposure. J. Food Prot. 55:93–97.
Ryser, E.T., Marth, E.H., Doyle, M. P (1985). Survival of Listeria monocytogenes during
manufacture and storage of cottage cheese. J. Food protect. 48: 746- 750.
Ryser, E, T. (1999). Foodborne listeriosis, p. 299- 358. In Ryser, E.T and Marth, E.H (ed),
Listeria, listeriosis and food safety, 2nd
ed. Marcel Dekker, New York. p. 299- 358
Sanaa, M., Poutrel, B., Menard, J. L., Serieys, F. (1993). Risk factors associated with the
consumption of raw milk by Listeria monocytogenes in dairy farms. J. Dairy. Sci.
76: 2891
Sampane-Donkor, E. (2002). A study of milk quality and public health hazards in the small
holder peri-urban dairy market system in Ghana. Ghana: Department of animal
Science, University of Ghana.
Santiago, N.I, Zipf, A., Bhunia, A. K.. (1999). Influence of temperature and growth phase
on expression of a 104-kilodalton Listeria adhesion protein in Listeria
monocytogenes. Appl Environ Microbiol 65:2765–2769.
Schaack, M. M., Marth, E.H. (1988). Survival of Listeria monocytogenes in refrigerated
milks and yogurt. J. Food Rot. 51:848.
135
Schmidt, R.H., Goodrich, R.M., Douglas, L. Archer, D.L., Schneider, K.R. (2003).
General Overview of the causative agents of foodborne illness. Institute of Food
and Agriculture Science. FSHN033. Web: http://edis.ifas.ufl.edu.
Schlech, W.F. 3rd, Lavigne, P.M., Bortolussi, R.A., Allen, A.C., Haldane, E.V., Wort,
A.J., Hightower, A.W., Johnson, S.E., King, S., Nicholls, E.S. & Broome, C.V.
(1983). Epidemic listeriosis – evidence for transmission by food. N. Engl. J. Med.
318: 203–206.
Seeliger, H. P. R. (1961). Listeriosis. S. Karger, Basel.
Seeliger, H. P. R., D. Jones. (1986). Genus Listeria,. In P. H. A. Sneath, N. S. Mair, M. E.
Sharpe, and J. G. Holt (ed.), Bergey's manual of systematic bacteriology,. Williams
& Wilkins, Baltimore, Md. 2:1235-1245.
Sleator, R. D., Francis, G. A., O'Beirne, D., Gahan, C. G. & Hill, C. (2003). Betaine and
carnitine uptake systems in Listeria monocytogenes affect growth and survival in
foods and during infection. J Appl Microbiol 95, 839–846.
Smith, I. F. (1998). Foods of West Africa: Their Origin. National Library of
Canada. ISBN: 096842550X. Pp. 50.
SRID. (2001). Agriculture in Ghana. Facts and figures. Ministry of Food and Agriculture.
Accra. Ghana.
Taylor L.H, Latham SM., Woolhouse, M.E.J. (2001). Risk factors for disease emergence.
Phil Trans R Soc. London B. 356:983–989.
Tolle, A. (1980). The microflora of the udder. p 4. In factors influencing the
bacteriological quality of raw milk. Int. Dairy Federation Bulletin. 120.
Tonah, S. (1993). The development of agro-pastoral households in northern Ghana. Policy
analysis, project appraisal and future perspectives. Breitenbach, Saarbrücken, Germany;
Fort Lauderdale, USA. .
Tonah, S (2003). Integration or exclusion of Fulbe pastoralists in West Africa: a
comparative analysis of interethnic relations, state and local policies in Ghana and
Cote d‘Ivoire. J. of Modern African Studies. 41(1): 91–114.
Turnbull, P. C. B., Bell, R. H. V., Saigawa, K., Munyenyemb, F. E. C. ., Mulenga, C. K
., Makala, L. H. C. (1991). Anthrax in Wildlife in the Luangwa Valley, Zambia.
The Veterinary Record 128: 399-403.
USDA, (2005). Nutrition and Your Health Dietary Guidelines for Americans (DGAC)
Report 2005. Part D: Science – Based, Section 9: Food Safety.

136
USDA. (1981). USDA fact sheet number 57. Compiled by Brock, C., Extension
Educator, Food Safety Area of Expertise Team, Cheboygan, Montmorency, and
Presque Isle Counties, Michigan State University Extension Reviewed by
Partridge, J., Food Science and Human Nutrition, Michigan State University.
Vallat, B. (2007). The view of the World Organization for Animal Health (OIE) in
support of the biological and toxins weapon convention objectives. Meeting of
States parties to the biological weapons convention, Geneva.
van Kessel, J. S., Karns, J.S., Gorski, L., McCluskey, B.J., Perdue, M.L. (2004).
Prevalence of Salmonella, Listeria monocytogenes, and fecal coliforms in bulk tank
milk on US dairies. J. Dairy Sci. 87:2822–2830.
VanNetten, P., Perales, I., Curtis, G.D.W., Mossel, D.A.A., (1989). Liquid and solid
selective differential media for the detection and enumeration of Listeria
monocytogenes. Int. J. Food Microbiol. 8: 299–316.
Vazquez-Boland JA, Kuhn M, Berche P, Chakraborty T, Dominguez-Bernal G, Goebel W,
Gonzalez-Zorn B, Wehland J, Kreft J. 2001. Listeria pathogenesis and molecular
virulence determinants. Clin. Microbiol. Rev. 14(3), 584-640.
Vilar, M.J., Yus, E., Sanjuán, M.L., Diéguez, F.J., Rodríguez-Otero, J.L. (2007).
Prevalence of and risk factors for Listeria species on dairy farms. J Dairy Sci. 90
(11): 5083-8.
von Marsow (1985) in Tariku, B. A (2006). Studies on cattle milk and meat production
in Fogera Woreda: production systems, constraints and opportunities for
development. A Thesis submitted to the Department of Animal and Range
Sciences, Awassa College of Agriculture, School of Graduate Studies. Debub
University, Awassa, Ethiopia
Wastling, J.M., Akanmori, B.D and Williams, D.J.L. (1999). Zoonoses in West Africa:
impact and control. Legon, Ghana. Parasitology Today. 15:8.
Welshemeri, H.J. (1968). Isolation of Listeria monocytogenes from vegetation. J.
Bacteriol. 95:300.
Weis, J., Seeligeri, H.P.R. (1975). Incidence of Listeria monocytogenes in nature. Appl.
Microbiol. 30:29.
Wenger, J. D., B. Swaminathan, P. S. Hayes, S. S. Green, M. Pratt, R. W. Pinner,
Schuchat, and C. V. Broome. 1990. Listeria monocytogenes contamination of
turkey franks: Evaluation of a production facility. J. Food Prot. 53, 1015-1019.
137
Winter, P., Schilcher, F., Bagò, Z., Schoder, D., Egerbacher, M., Baumgartner, W.,
Wagner, W. (2004). Clinical and histopathological aspects of naturally occurring
mastitis caused by Listeria monocytogenes in cattle and ewes. J. Vet. Med. 51:176–
179.
Wong, S., Street, D., Delgado, S. I., Klontz, k. C (200). Recalls of Foods and Cosmetics
Due to Microbial Contamination Reported to the U.S. Food and Drug
Administration. J. of Food Protection. 63 (8) 1113-1116(4). Int. Assoc. for Food
Protection
WHO. (1962). Bacterial diseases through milk. WHO report. Pp 15.
WHO (2002). Bulletin of the World Health Organisation. Int. J Public Health 80:426–
523.
WHO, (2003). Diet, nutrition and the prevention of chronic diseases: report of a joint
WHO/FAO expert consultation, Geneva, 28 January- 1 February 2002. (WHO
technical report series; 916). ISBN 92 4 120916 X (NLM classification: QU 145)
ISSN 0512-3054
WHO. (2009). Safer food for better health. A Global WHO food strategy. Pp 2.
Web: http://www.who.int/mip2001/files/2297/FoodsafetyStrategy.doc
Date retrieved: 12-03-09.
WHO/FAO (2008). Exposure assessment of microbiological hazards in foods. Guidelines
Wramby, B. 0. (1944). Om Listerella monocytogenes bakteriologioch om forekomst av
listerella infektiones hos djur. Skand. Vet. Tidskr. 34:277-279.
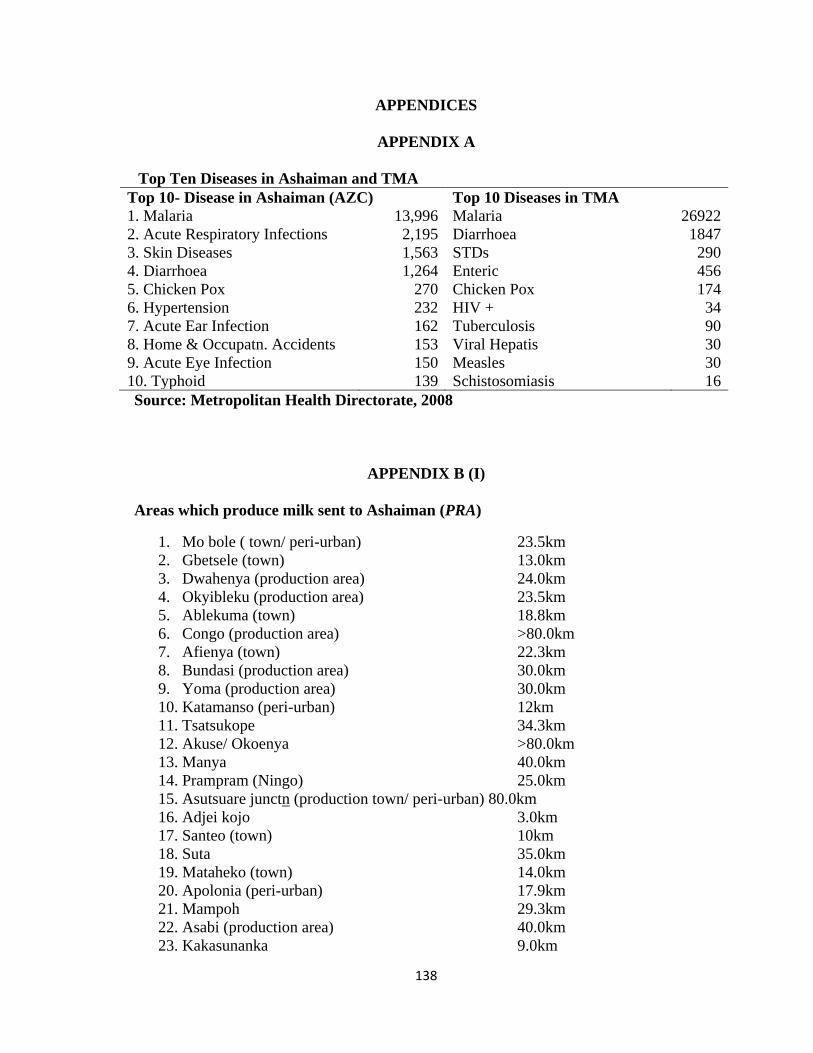
138
APPENDICES
APPENDIX A
Top Ten Diseases in Ashaiman and TMA
Top 10- Disease in Ashaiman (AZC) Top 10 Diseases in TMA
1. Malaria 13,996 Malaria 26922
2. Acute Respiratory Infections 2,195 Diarrhoea 1847
3. Skin Diseases 1,563 STDs 290
4. Diarrhoea 1,264 Enteric 456
5. Chicken Pox 270 Chicken Pox 174
6. Hypertension 232 HIV + 34
7. Acute Ear Infection 162 Tuberculosis 90
8. Home & Occupatn. Accidents 153 Viral Hepatis 30
9. Acute Eye Infection 150 Measles 30
10. Typhoid 139 Schistosomiasis 16
Source: Metropolitan Health Directorate, 2008
APPENDIX B (I)
Areas which produce milk sent to Ashaiman (PRA)
1. Mo bole ( town/ peri-urban) 23.5km
2. Gbetsele (town) 13.0km
3. Dwahenya (production area) 24.0km
4. Okyibleku (production area) 23.5km
5. Ablekuma (town) 18.8km
6. Congo (production area) >80.0km
7. Afienya (town) 22.3km
8. Bundasi (production area) 30.0km
9. Yoma (production area) 30.0km
10. Katamanso (peri-urban) 12km
11. Tsatsukope 34.3km
12. Akuse/ Okoenya >80.0km
13. Manya 40.0km
14. Prampram (Ningo) 25.0km
15. Asutsuare junctn (production town/ peri-urban) 80.0km
16. Adjei kojo 3.0km
17. Santeo (town) 10km
18. Suta 35.0km
19. Mataheko (town) 14.0km
20. Apolonia (peri-urban) 17.9km
21. Mampoh 29.3km
22. Asabi (production area) 40.0km
23. Kakasunanka 9.0km

139
24. Akufo panya (town) 48.0km
25. Kpone barrier 20.3km
26. Kusuberi (town) 16.9km
27. Oyibi 22.5km
28. Odumase 30.0km
29. Dodowa 43.0km
APPENDIX B (II)
Stratification of Milk Producing Areas by Geographic Locations
Group A
Mo bole, Mataheko, Gbetseli, Ablekuma,
Afienya, Akuse/ Okoenya, Kakasunanka
Group B
Kpone barrier, Dawhenya, Prampram,
Adjei kojo, Santeo, Bundasi, Congo
Group C
Tsatukope, Dorymu, Asabi, Manya,
Akufo panya, Asutsuare junctn,
Okusuberi,
Group D
Odumase, Dodowa
Group E
Apolonia, Katamanso
Group F
Okyibleku, Dodowa, Suta, Oyibi
APPENDIX C (I)
Constraints to the Livelihood of Famers
Constraint Importance
Disease
Availability of pasture/ low milk production
70
20
Market access 7
Farm management 3

144
APPENDIX C (II)
Results of the Proportional Piling of the Disease Symptoms
Symptoms Prevalence (%) Economic/
Livelihood impact
(%)
Preferred
options for
solution (%)
Boils 5 1 6
In appetence 4 5 5
Skinny but eats well 9 0 0
Inflamed udder 3 13 14
Facial paralysis 2 3 1
Dullness 4 4 1
Deep coughs/ breathes 11 17 25
Sudden deaths 6 7 2
Watery/Bloody diarrhea 9 7 8
Drooling tongue 7 2 0
Stillbirths/ Abortions 9 10 4
Premature births 7 7 3
Circling movements 1 1 1
Swollen/ soured feet 9 14 15
Sudden inability to walk 3 0 0
Rashes 11 10 20
TOTAL 100 100 100
APPENDIX C (III)
Correlation for proportional piling for disease symptoms
Correlation
Prevalence 0.796
Importance 0.904
Correlation is significant at the 0.01 level (2-tailed).

145
APPENDIX D (I)
Matrix scoring for livelihood constraints for Retailers Percentages in parenthesis
Income Food
consumption
Security Other
utilities
Access to markets 49 (54.4) 45 (50.0) 44 (48.9) 49 (54.4)
Availability of milk 25 (27.8) 20 (22.2) 19 (21.1) 25 (27.8)
Access to credit 10 (11.1) 12 (13.3) 18 (20.0) 7 (7.8)
Transportation 4 (4.4) 7 (7.8) 3 (3.3) 5 (5.6)
Hygiene 2 (2.2) 6 (6.7) 6 (6.7) 4 (4.4)
Total 90 (100.0) 90 (100.0) 90 (100.0) 90 (100.0)
APPENDIX D (II)
Correlations for matrix scoring for retailers
Income Food consumption Other utilities Security
Income 1.000 0.991 0.984 0.995
Food consumption 0.991 1.000 0.993 0.987
Other utilities 0.984 0.993 1.000 0.975
Security 0.995 0.987 0.975 1.000
All correlation significant at the 0.01 level (2-tailed)

146
APPENDIX E
Supply of Milk from Production to Retailer- Quantities in Liters (1gallon= 4.5L)
Production sites Thursday Friday Sunday Mean SD
Dorymu-1 54.0 54.0 54.0 54.0 ±0.00
Kpone-2 54.0 54.0 54.0 54.0 ±0.00
Mampoh-3 63.0 63.0 64.0 63.0 ±0.00
Mataheko-4 45.0 45.0 45.0 45.0 ±0.00
Prampram-5 33.5 33.8 34.0 33.8 ±0.25
Gbetseli-6 81.0 81.0 81.0 81.0 ±0.00
Mobole-7 63.0 63.0 63.0 63.0 ±0.00
Suta-8 36.0 36.0 36.0 36.0 ±0.00
Manya-9 65.5 67.5 69.5 67.5 ±2.00
Odumase-10 45.0 45.0 45.0 45.0 ±0.00
Afienya-11 27.0 27.0 27.0 27.0 ±0.00
Tachukope-12 81.0 81.0 81.0 81.0 ±0.00
Dodowa-13 63.0 63.0 63.0 63.0 ±0.00
Okyibleku-14 35.0 45.0 45.0 41.5 ±5.77
Apolonia-15 31.5 31.5 31.5 31.5 ±0.00
Asebi-16 39.0 39.0 39.0 39.0 ±0.00
Katamanso-17 36.0 36.0 36.0 36.0 ±0.00
Ablekuma-18 27.0 27.0 27.0 27.0 ±0.00
Dawhenya-19 50.0 48.5 50.0 49.5 ±0.87
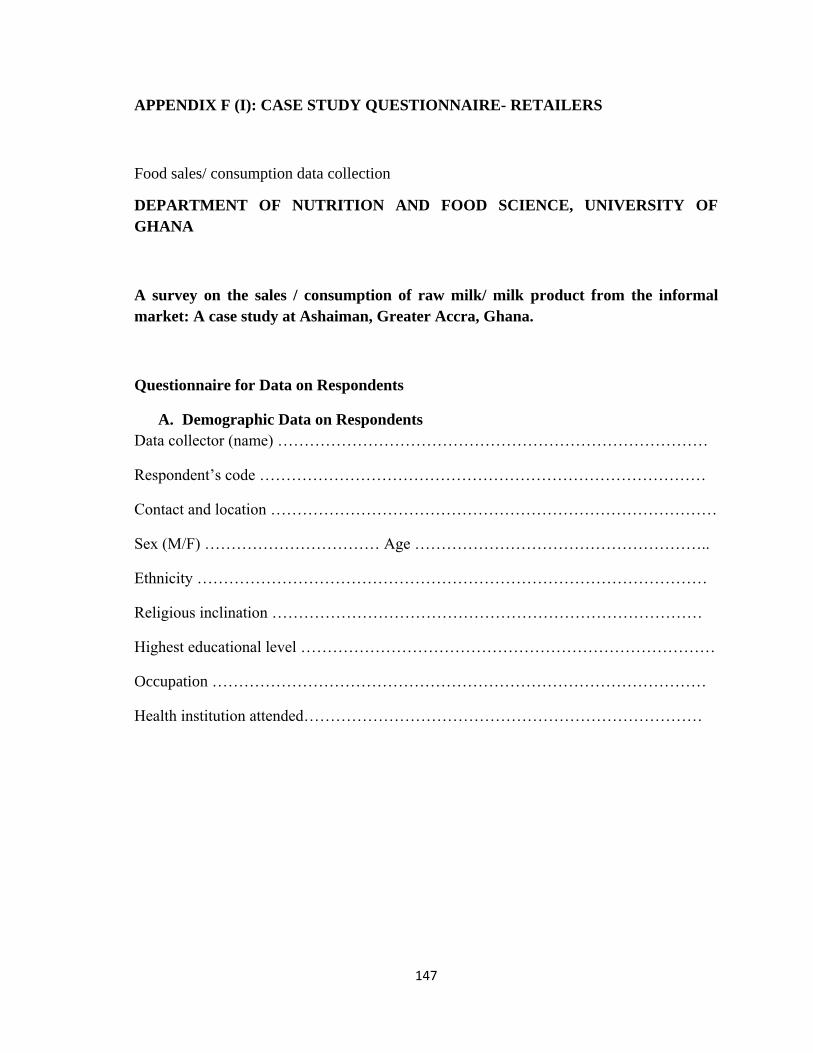
147
APPENDIX F (I): CASE STUDY QUESTIONNAIRE- RETAILERS
Food sales/ consumption data collection
DEPARTMENT OF NUTRITION AND FOOD SCIENCE, UNIVERSITY OF
GHANA
A survey on the sales / consumption of raw milk/ milk product from the informal
market: A case study at Ashaiman, Greater Accra, Ghana.
Questionnaire for Data on Respondents
A. Demographic Data on Respondents
Data collector (name) ………………………………………………………………………
Respondent‘s code …………………………………………………………………………
Contact and location …………………………………………………………………………
Sex (M/F) …………………………… Age ………………………………………………..
Ethnicity ……………………………………………………………………………………
Religious inclination ………………………………………………………………………
Highest educational level ……………………………………………………………………
Occupation …………………………………………………………………………………
Health institution attended…………………………………………………………………

148
Date……………………
1. How long have you been selling
milk/ milk product? […]
a. <1 years
b. 1-2 years
c. 3-5 years
d. 6-10years
e. > 10years specify …………
2. How many days in a week do you
sell milk/ milk product during the
dry season? […]
a. < 2
b. 2-4
c. 5
d. 6
e. 7
3. How many days in a week do you
sell milk/ milk product during the
rainy season? […]
a. < 2
b. 2-4
c. 5
d. 6
e. 7
4. What type(s) of milk product do
you sell? [ ]
a. Raw milk only
b. Boiled milk only
c. Naturally fermented milk only
d. Other specify ………………
5. Who are your usual customers?
a. Individuals
b. Cooperate bodies
c. Institutions
d. Other specify ………………
6. What quantity of milk/ milk
product do you sell in the dry
season? [ ]
Product Qty
Raw milk …
Boiled milk …
Fermented milk …
7. What is your source of raw milk
supply? [ ]
a. Kraal/ farm
b. Assembler
c. Hawkers
d. Other specify …………….
8. What period(s) do you receive
raw milk supply in the dry
season? […]
a. Early mornings(before7-8:30
am)
b. Late mornings (8:31-11:
30am)
c. Afternoons (11:31-2: 00pm)
d. Late afternoons (> 2: 00pm)
e. Other specify ………………
9. What period(s) do you receive
raw milk supply in the dry
season? […]
a. Early mornings(before7-8:30
am)
b. Late mornings(8:31-11:30am)
c. Afternoons (11:31-2:00pm)
d. Late afternoons (> 2: 00pm)
e. Other specify ………………
10. What quantities of milk do you
receive in the dry seasons? [ ]
a. 50-90L
b. 91-135L
c. 136-200L
d. >200L
11. What quantities of milk do you
receive in the rainy season? [ ]
a. 95-135gallons
b. 136-200L
c. 201-270L

149
d. >270L
12. As far as you know do your
suppliers have any formal training
in food hygiene? […]
a. No
b. Yes
13. Have you received any formal
training in food hygiene? […]
a. No
b. Yes
14. If YES, where did you receive it?
[ ]
a. Workshop
b. Seminar
c. Health institution
d. On job
e. Other specify ………………
15. How long was the training? [ ]
a. 1 day
b. 2-3 days
c. 4-6 days
d. 1 week
e. Other specify ………………
16. How much water do you use per
day? [ ]
a. <27L
b. 27- 45L
c. > 45L
d. Other specify ………………
17. What is the source of your water?
[ ]
a. Borehole
b. Rain water
c. Municipal tap water
d. Water vendors
e. Other specify ………………
18. How do you keep raw/ boiled/
fermented milk during sale? [ ]
a. Ambient
b. Chilled
c. Hot
d. Other specify ………………
19. If Chilled is temperature checked
regularly? [ ]
a. No
b. Yes
20. If YES, how do you respond to a
warming product? [ ]
a. By breaking ice block into it
b. Refrigerating it
c. Other specify ………………
21. Could consumption of milk/ milk
product be responsible for disease
in man? [ ]
a. No
b. Yes
22. Mention some means by which
milk/ milk product could be
responsible for disease in man
…………………………………………
…………………………………………
…………………………………
23. Mention some precautions to
prevent milk/ milk product
causing these diseases
…………………………………………
…………………………………………
…………………
24. Have you ever been infected with
a suspected case of foodborne
disease associated with milk
consumption? [ ]
a. No
b. Yes
25. Did you seek medical help? [ ]
a. No
b. Yes
26. Have you ever experienced a birth
abnormality such as spontaneous

150
abortions, still births and/ or
premature births?
a. No
b. Yes
27. If yes, how often have they
occurred? [ ]
Symptoms freq
Spontaneous abortions ………….
Stillbirths …………...
Premature births …………
28. If YES, was medical help sought?
a. No
b. Yes
29. In what state do you usually
receive milk from Assemblers??
[…]
a. Ambient
b. Hot
c. Chilled
30. Is milk sieved when being poured
into receptive containers? [ ]
a. No
b. Yes
31. If YES, with what is it done with?
a. A piece of cloth
b. A sieve made with net
c. Other
specify………………….
32. Do you wash sieve before use?
[…]
a. No
b. Yes
33. If YES, with what is it done? [ ]
a. Water only
b. Water and sponge
c. Water, sponge and soap
d. Other specify ………………
34. Are sieve/ cloth washed before
use on every physically separated
milk consignment? [ ]
a. No
b. Yes
35. At retailer what is the receptacle
for consumption? […]
a. Plastic bowls
b. Plastic rubbers
c. Other specify ………………
36. Are receptacle re-used?
a. No b. Yes
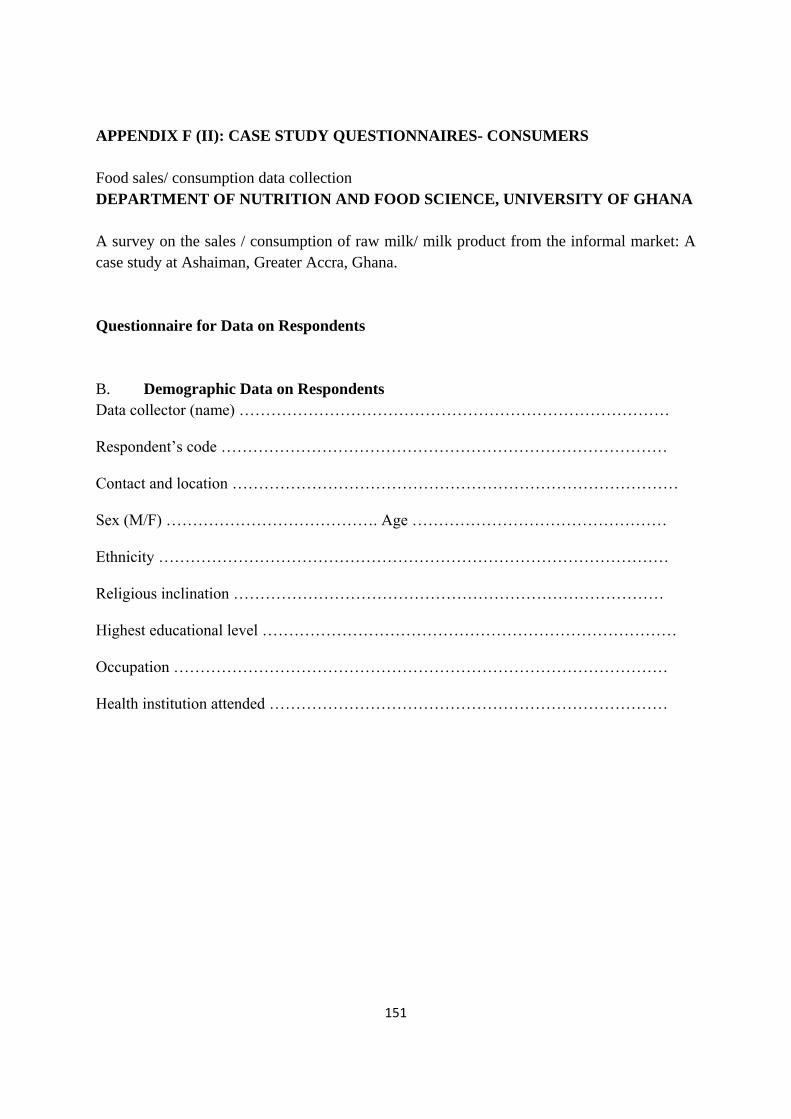
151
APPENDIX F (II): CASE STUDY QUESTIONNAIRES- CONSUMERS
Food sales/ consumption data collection
DEPARTMENT OF NUTRITION AND FOOD SCIENCE, UNIVERSITY OF GHANA
A survey on the sales / consumption of raw milk/ milk product from the informal market: A
case study at Ashaiman, Greater Accra, Ghana.
Questionnaire for Data on Respondents
B. Demographic Data on Respondents
Data collector (name) ………………………………………………………………………
Respondent‘s code …………………………………………………………………………
Contact and location …………………………………………………………………………
Sex (M/F) …………………………………. Age …………………………………………
Ethnicity ……………………………………………………………………………………
Religious inclination ………………………………………………………………………
Highest educational level ……………………………………………………………………
Occupation …………………………………………………………………………………
Health institution attended …………………………………………………………………

152
Date ……………………………
1.
How long have you been consuming milk /
milk products from the informal market at
Ashaiman? [ ]
a. <1 year
b. 1-2years
b. 3-5 years
c. 6-10 year
d. >10 years specify………………
2. Why do you consume milk/ milk
product sold through informal channel
with little regulations? […]
a. Culture
b. Taste appeal/ acquired taste
c. Availability
d. Affordability
e. Other specify …………………
3. Which of the produce below do
you consumed? […]
Product Rank
a. Milk from cow as-is …
b Boiled milk …
c. Naturally fermented milk …
d. Wagashi …
e. Other
specify……………………….
4. How often do you consume raw/
boiled/ fermented milk?
a. Twice daily
b. Once a day
c. Once every two days
d. Once a week
e. Once in two weeks
f. Other specify …………………
5. Have you ever received any formal
training in food hygiene? [ ]
a. No
b. Yes
6. If YES, where did you receive it
from? [ ]
a. Workshop
b. Seminar
c. Health institution
d. On job
e. Other (specify) ……………
7. How long was this training? [ ]
a. 1 day
b. 2-3days
c. 4-6 days
d. 1weeks
e. Other (specify) ……………
8. Are you satisfied with conditions
under which milk/ milk products were
sold? [ ]
a. No
b. Yes
9. If No, what can be done to improve
upon it?
……………………………………………
……………………………………………
……………………………
10. Could food be responsible for
disease in man? [ ]
a. No
b. Yes
11. If Yes, which of the following is a
symptom associated with foodborne
infections?
a. Diarrhea
b. Vomiting
c. Weight loss
d. Miscarriages/stillbirths/pre- mature
births
12. Where do you purchase your milk/
milk product from? […]
a. Farm gate
b. Assembler

153
c. Retailer
d. Other specify
………………………
13. Do you consume product at the
point of sale? […]
Milk from cow as-is (a) Yes (B) No
Boiled milk (a) Yes (B) No
Naturally fermented (a) Yes (B) No
14. If No, how do you transport milk/
milk product? [ ]
a. On foot
b. By bicycle
c. By private vehicle
d. By public vehicle
e. Other
specify……………………….
15. How long does it take to travel to
the point of consumption
a. <30mins
b. 30-1Hr.
c. >1Hr.
16. At destination does raw/ boiled/
fermented milk receive any treatment
before consumption? [ ]
a. No
b. Yes
17. If YES. Please state it [ ]
Raw ……………………………
Boiled ………………………………
Fermented …………………………
18. If NO, are milk/ milk product
usually consumed immediately after
transportation? [ ]
a. No
b. Yes
19. If NO, are milk/ milk product
stored?
a. No
b. Yes
20. If YES, how is it stored? [ ]
a. At ambience
b. Refrigerated
c. Other specify
………………………
21. Does the storage compartment
usually contain other fresh or semi fresh
foods that also require refrigeration for
extending their shelf-life
a. No
b. Yes
22. If YES, are milk/ milk product
physically separated from these foods? [
]
a. No
b. Yes
23. How often is this compartment
opened usually during the storage? [ ]
a. Not freq. (once in ≥ 1 hr.)
b. Quite freq. (once every 30mins-
1hr.)
c. Freq. (≤ 30min)
d. Other specify …………………
24. How long are milk and milk
products often stored before consumption?
[ ]
a. < 1Hr.
b. 1-2Hr.
c. >2Hr.
d. Other specify …………………
25. Are milk/ milk product consumed
immediately upon removal from storage? [
]
a. No
b. Yes
26. If NO, is any treatment given it
before consumption? [ ]
a. No
b. Yes
DISEASES ASSOCIATED WITH
CONSUMPTION
27. Have you experienced disease
episodes characterized by symptoms such
as chills colds, nausea, vomiting, diarrhea,
malaise and muscle ache in respondent?
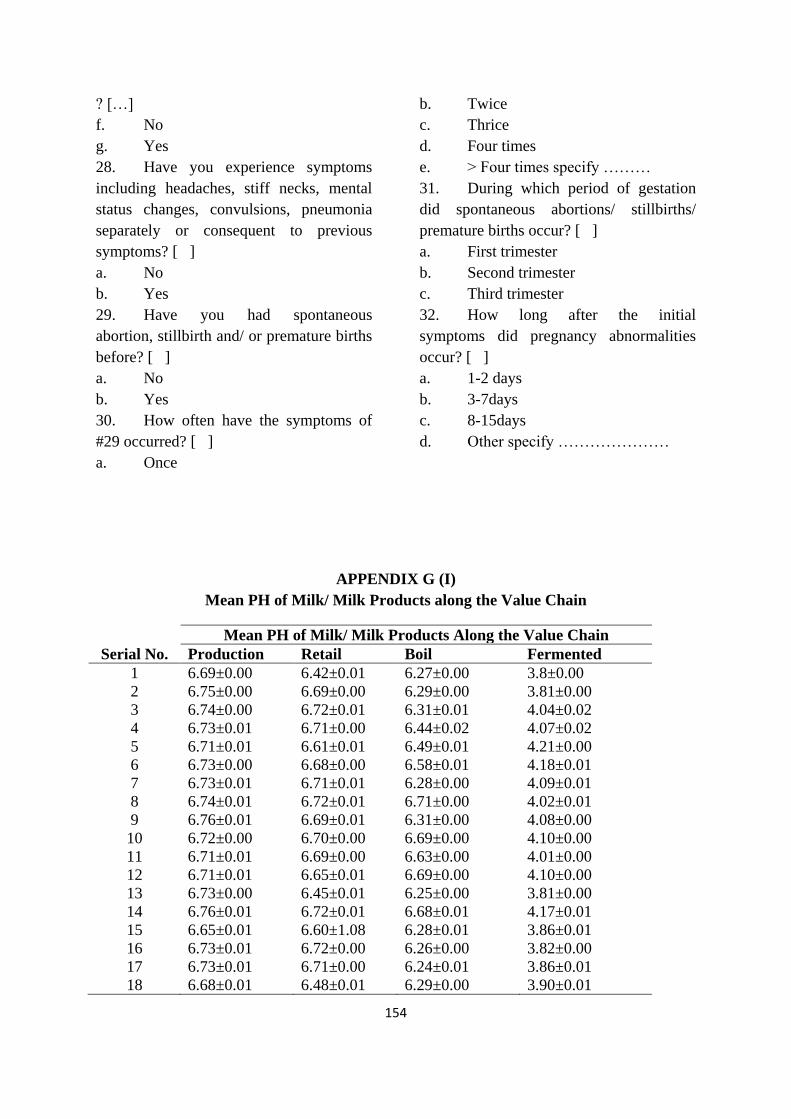
154
? […]
f. No
g. Yes
28. Have you experience symptoms
including headaches, stiff necks, mental
status changes, convulsions, pneumonia
separately or consequent to previous
symptoms? [ ]
a. No
b. Yes
29. Have you had spontaneous
abortion, stillbirth and/ or premature births
before? [ ]
a. No
b. Yes
30. How often have the symptoms of
#29 occurred? [ ]
a. Once
b. Twice
c. Thrice
d. Four times
e. > Four times specify ………
31. During which period of gestation
did spontaneous abortions/ stillbirths/
premature births occur? [ ]
a. First trimester
b. Second trimester
c. Third trimester
32. How long after the initial
symptoms did pregnancy abnormalities
occur? [ ]
a. 1-2 days
b. 3-7days
c. 8-15days
d. Other specify …………………
APPENDIX G (I)
Mean PH of Milk/ Milk Products along the Value Chain
Mean PH of Milk/ Milk Products Along the Value Chain
Serial No. Production Retail Boil Fermented
1 6.69±0.00 6.42±0.01 6.27±0.00 3.8±0.00
2 6.75±0.00 6.69±0.00 6.29±0.00 3.81±0.00
3 6.74±0.00 6.72±0.01 6.31±0.01 4.04±0.02
4 6.73±0.01 6.71±0.00 6.44±0.02 4.07±0.02
5 6.71±0.01 6.61±0.01 6.49±0.01 4.21±0.00
6 6.73±0.00 6.68±0.00 6.58±0.01 4.18±0.01
7 6.73±0.01 6.71±0.01 6.28±0.00 4.09±0.01
8 6.74±0.01 6.72±0.01 6.71±0.00 4.02±0.01
9 6.76±0.01 6.69±0.01 6.31±0.00 4.08±0.00
10 6.72±0.00 6.70±0.00 6.69±0.00 4.10±0.00
11 6.71±0.01 6.69±0.00 6.63±0.00 4.01±0.00
12 6.71±0.01 6.65±0.01 6.69±0.00 4.10±0.00
13 6.73±0.00 6.45±0.01 6.25±0.00 3.81±0.00
14 6.76±0.01 6.72±0.01 6.68±0.01 4.17±0.01
15 6.65±0.01 6.60±1.08 6.28±0.01 3.86±0.01
16 6.73±0.01 6.72±0.00 6.26±0.00 3.82±0.00
17 6.73±0.01 6.71±0.00 6.24±0.01 3.86±0.01
18 6.68±0.01 6.48±0.01 6.29±0.00 3.90±0.01
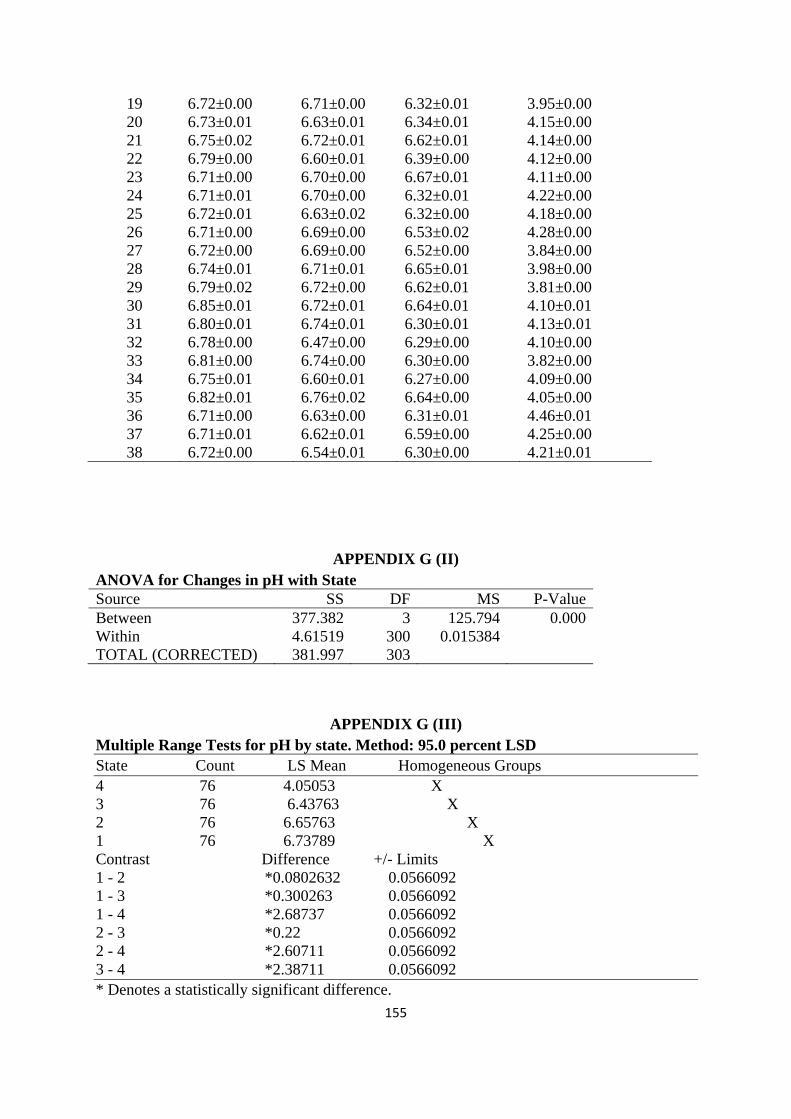
155
19 6.72±0.00 6.71±0.00 6.32±0.01 3.95±0.00
20 6.73±0.01 6.63±0.01 6.34±0.01 4.15±0.00
21 6.75±0.02 6.72±0.01 6.62±0.01 4.14±0.00
22 6.79±0.00 6.60±0.01 6.39±0.00 4.12±0.00
23 6.71±0.00 6.70±0.00 6.67±0.01 4.11±0.00
24 6.71±0.01 6.70±0.00 6.32±0.01 4.22±0.00
25 6.72±0.01 6.63±0.02 6.32±0.00 4.18±0.00
26 6.71±0.00 6.69±0.00 6.53±0.02 4.28±0.00
27 6.72±0.00 6.69±0.00 6.52±0.00 3.84±0.00
28 6.74±0.01 6.71±0.01 6.65±0.01 3.98±0.00
29 6.79±0.02 6.72±0.00 6.62±0.01 3.81±0.00
30 6.85±0.01 6.72±0.01 6.64±0.01 4.10±0.01
31 6.80±0.01 6.74±0.01 6.30±0.01 4.13±0.01
32 6.78±0.00 6.47±0.00 6.29±0.00 4.10±0.00
33 6.81±0.00 6.74±0.00 6.30±0.00 3.82±0.00
34 6.75±0.01 6.60±0.01 6.27±0.00 4.09±0.00
35 6.82±0.01 6.76±0.02 6.64±0.00 4.05±0.00
36 6.71±0.00 6.63±0.00 6.31±0.01 4.46±0.01
37 6.71±0.01 6.62±0.01 6.59±0.00 4.25±0.00
38 6.72±0.00 6.54±0.01 6.30±0.00 4.21±0.01
APPENDIX G (II)
ANOVA for Changes in pH with State
Source SS DF MS P-Value
Between 377.382 3 125.794 0.000
Within 4.61519 300 0.015384
TOTAL (CORRECTED) 381.997 303
APPENDIX G (III)
Multiple Range Tests for pH by state. Method: 95.0 percent LSD
State Count LS Mean Homogeneous Groups
4 76 4.05053 X
3 76 6.43763 X
2 76 6.65763 X
1 76 6.73789 X
Contrast Difference +/- Limits
1 - 2 *0.0802632 0.0566092
1 - 3 *0.300263 0.0566092
1 - 4 *2.68737 0.0566092
2 - 3 *0.22 0.0566092
2 - 4 *2.60711 0.0566092
3 - 4 *2.38711 0.0566092
* Denotes a statistically significant difference.
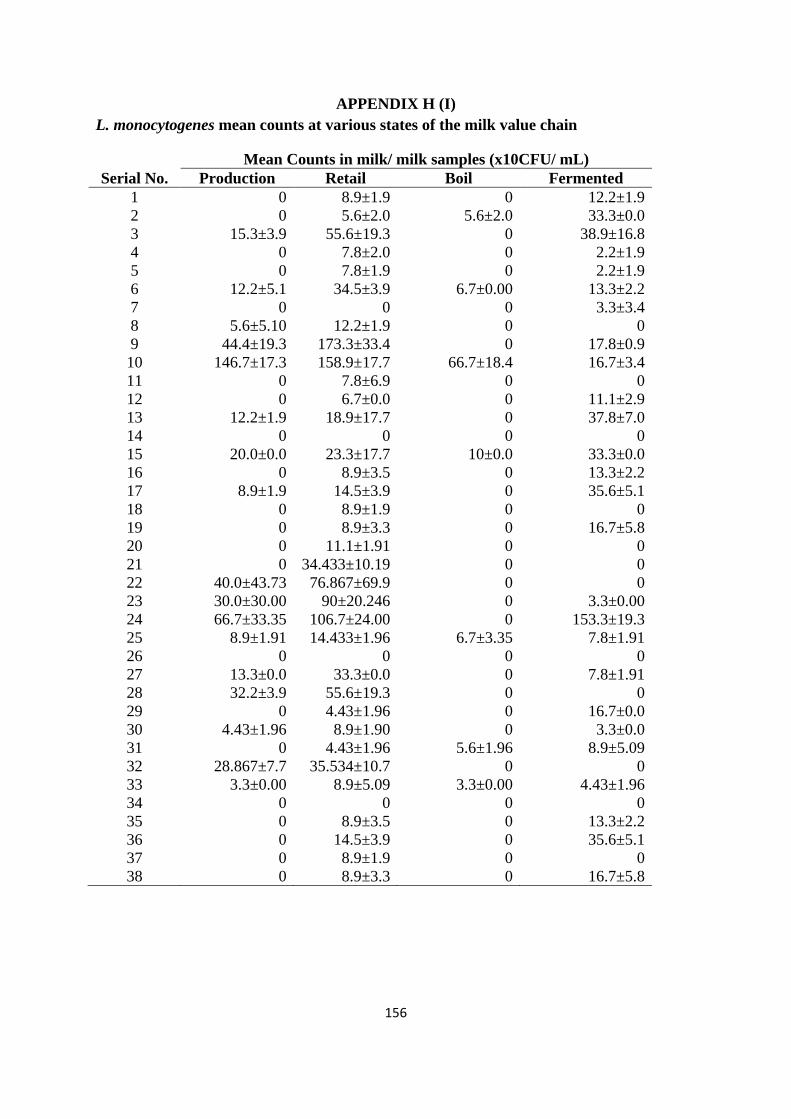
156
APPENDIX H (I)
L. monocytogenes mean counts at various states of the milk value chain
Mean Counts in milk/ milk samples (x10CFU/ mL)
Serial No. Production Retail Boil Fermented
1 0 8.9±1.9 0 12.2±1.9
2 0 5.6±2.0 5.6±2.0 33.3±0.0
3 15.3±3.9 55.6±19.3 0 38.9±16.8
4 0 7.8±2.0 0 2.2±1.9
5 0 7.8±1.9 0 2.2±1.9
6 12.2±5.1 34.5±3.9 6.7±0.00 13.3±2.2
7 0 0 0 3.3±3.4
8 5.6±5.10 12.2±1.9 0 0
9 44.4±19.3 173.3±33.4 0 17.8±0.9
10 146.7±17.3 158.9±17.7 66.7±18.4 16.7±3.4
11 0 7.8±6.9 0 0
12 0 6.7±0.0 0 11.1±2.9
13 12.2±1.9 18.9±17.7 0 37.8±7.0
14 0 0 0 0
15 20.0±0.0 23.3±17.7 10±0.0 33.3±0.0
16 0 8.9±3.5 0 13.3±2.2
17 8.9±1.9 14.5±3.9 0 35.6±5.1
18 0 8.9±1.9 0 0
19 0 8.9±3.3 0 16.7±5.8
20 0 11.1±1.91 0 0
21 0 34.433±10.19 0 0
22 40.0±43.73 76.867±69.9 0 0
23 30.0±30.00 90±20.246 0 3.3±0.00
24 66.7±33.35 106.7±24.00 0 153.3±19.3
25 8.9±1.91 14.433±1.96 6.7±3.35 7.8±1.91
26 0 0 0 0
27 13.3±0.0 33.3±0.0 0 7.8±1.91
28 32.2±3.9 55.6±19.3 0 0
29 0 4.43±1.96 0 16.7±0.0
30 4.43±1.96 8.9±1.90 0 3.3±0.0
31 0 4.43±1.96 5.6±1.96 8.9±5.09
32 28.867±7.7 35.534±10.7 0 0
33 3.3±0.00 8.9±5.09 3.3±0.00 4.43±1.96
34 0 0 0 0
35 0 8.9±3.5 0 13.3±2.2
36 0 14.5±3.9 0 35.6±5.1
37 0 8.9±1.9 0 0
38 0 8.9±3.3 0 16.7±5.8
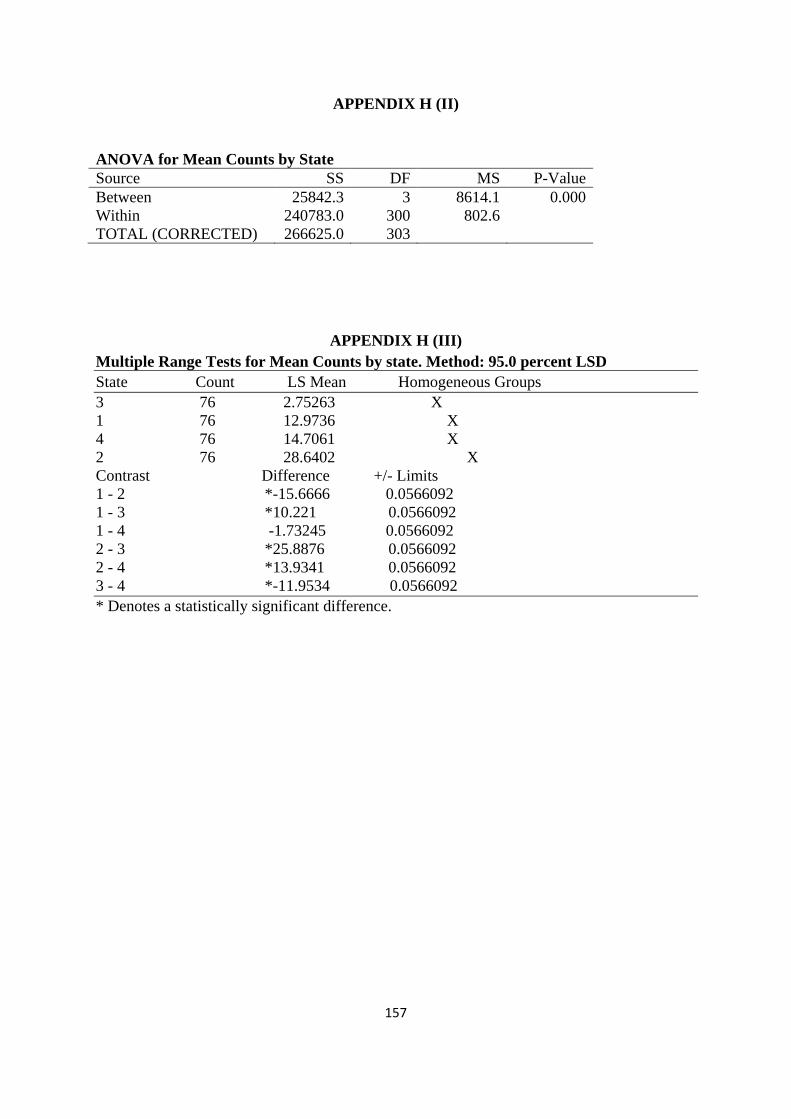
157
APPENDIX H (II)
ANOVA for Mean Counts by State
Source SS DF MS P-Value
Between 25842.3 3 8614.1 0.000
Within 240783.0 300 802.6
TOTAL (CORRECTED) 266625.0 303
APPENDIX H (III)
Multiple Range Tests for Mean Counts by state. Method: 95.0 percent LSD
State Count LS Mean Homogeneous Groups
3 76 2.75263 X
1 76 12.9736 X
4 76 14.7061 X
2 76 28.6402 X
Contrast Difference +/- Limits
1 - 2 *-15.6666 0.0566092
1 - 3 *10.221 0.0566092
1 - 4 -1.73245 0.0566092
2 - 3 *25.8876 0.0566092
2 - 4 *13.9341 0.0566092
3 - 4 *-11.9534 0.0566092
* Denotes a statistically significant difference.