ASSESSMENT OF THE INTEGRITY OF PIPELINES … · probabilistic models for routine reliability...
38
M. Modarres, M. Nuhi PI Team: A. Seibi PI Partners PI Sponsors 1 st Annual PI Partner Schools Research Workshop The Petroleum Institute, Abu Dhabi, U.A.E. January 6-7, 2010 Copyright 2012 by M. Modarres ASSESSMENT OF THE INTEGRITY OF PIPELINES SUBJECT TO CORROSION-FATIGUE, PITTING CORROSION, CREEP AND STRESS CORROSSION CARCKING
-
Upload
hoangquynh -
Category
Documents
-
view
222 -
download
1
Transcript of ASSESSMENT OF THE INTEGRITY OF PIPELINES … · probabilistic models for routine reliability...

M. Modarres, M. Nuhi PI Team: A. Seibi
PI Partners PI Sponsors
1st Annual PI Partner Schools Research Workshop
The Petroleum Institute, Abu Dhabi, U.A.E.
January 6-7, 2010
Copyright 2012 by M. Modarres
ASSESSMENT OF THE INTEGRITY OF PIPELINES SUBJECT TO CORROSION-FATIGUE, PITTING CORROSION, CREEP
AND STRESS CORROSSION CARCKING
Presentation Outline
• Background • Objectives • Failure Mechanism Modeling and Applications
– Corrosion-Fatigue – Pitting Corrosion – Creep – Stress Corrosion Cracking
• Conclusions
2 1st Annual PI Partner Schools Research Workshop, January 6-7, 2010
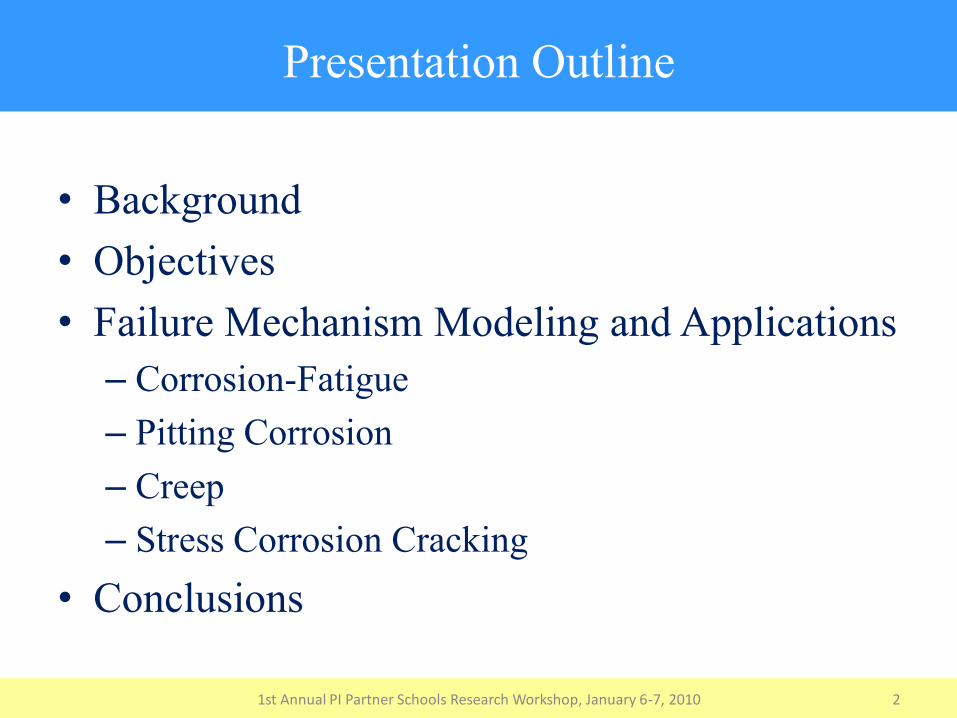
• Develop Physics-based computationally simple probabilistic models for routine reliability assessments and health monitoring in the oil industry – PoF (Physics of Failure) models capture material
degradation and failure mechanism and can be extrapolated to different levels.
– Probabilistic models can adequately represent all of the factors that contribute to variability (e.g. material properties , Inspection devices accuracy, human errors, etc.)
– Use of the probabilistic models to estimate reliability of components (our interest is pipeline reliability)
Objectives

Problem Statement
Pitting and Fatigue leading to Pipe Failure - Ductile Iron
Corrosion Inside the Pipe
Pictures from: (http://your-tech-assistant.eltex-pipe.com)
Degradation of pipeline due to corrosion and
fatigue
Unwanted plant shutdowns
Cost due to inspection &
repair
Cost due to loss of
production
Cost due to impact on
environment
Problem: Cost of corrective maintenance
Solution: Predictive maintenance
Event
Consequences
Leaks & ruptures
5
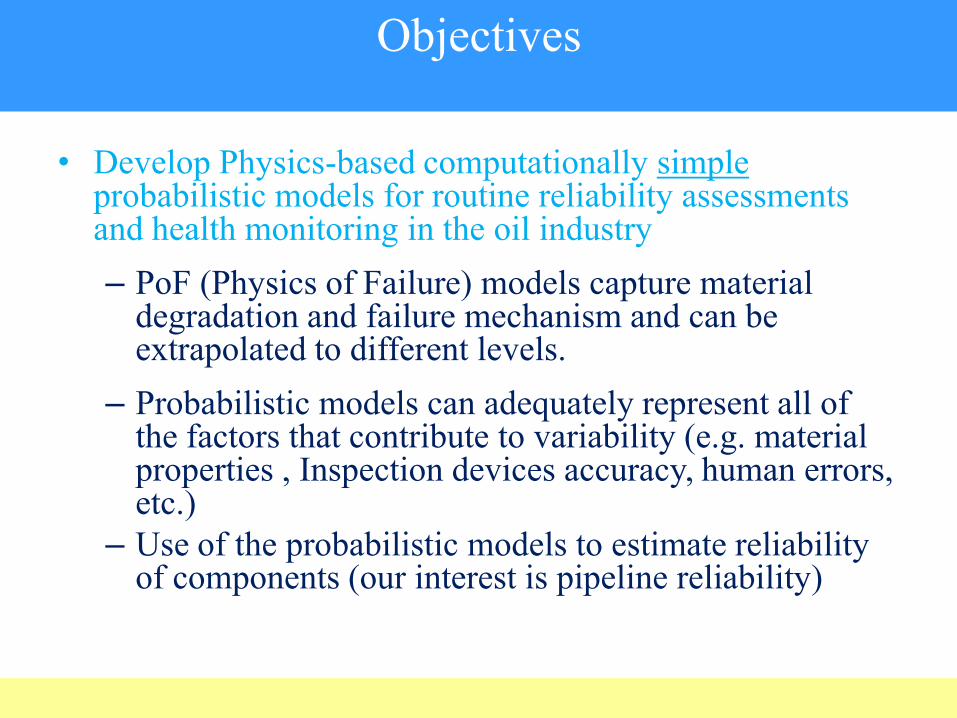
Corrosion-Fatigue in Pipes
P
P
t
Pmean
Pmax
Pmin
s
t
smean
smax
smin
s s t
ticknesstdiameterDD
t
t
PD ;;1;
2s

Corrosion-Fatigue Modeling Approach
1st Annual PI Partner Schools Research Workshop, January 6-7, 2010 6
pitcrack dt
da
dt
da
The criterion for transition :
Corrosion is Dominant Fatigue is Dominant

Damage-Endurance Reliability Models
P(Damage Endurance) g(x)dx0
s
f (s)ds
0
Distribution Of Endurance
g(s)
Distribution Of Damage
f(s)
Aging Aging
Possibility of Failure
s

Probabilistic Fracture Mechanics Approach to Fatigue Reliability
Critical Crack size
Cra
ck S
ize
Life (Cycles)
Initial Crack size
TTF Distribution
N1 N2 NALT
ALT
Damage-Endurance Model

Damage-Endurance Modeling Corrosion-Fatigue
2
12 aFn
MI
dN
da p
Critical Crack size
Cra
ck S
ize
Life (Cycles)
Transition
Pitting
Corrosion fatigue crack growth
CTF Distribution
N
sscr n
c
n
r aFCaFCdN
da )()1()(
Ntr
atr

Physics-Based Simulation Results
These are the (Ntr, atr) Coordinates

Semi-Empirical Simplified Model Development
Find the correlation of A & B with the physical parameters of the pipeline:
• Loading Stress “σ”
• Loading Frequency “ν”
• Temperature “T”
• Flow Characteristic “C” (e.g., Ip, [Cl-], pH, …)
,...),, (e.g. constants model of vector N,...) (e.g. timeofindex
],...)[Cl, , T, (e.g. variablesa size,crack e.g.
),(,
i
-
BA
t
v
D
tvfDDamage
i
i
ii
s

L(ai) = LN(μi,σi) μi= ln[f(si, Ti, νi, Ipi, Ni)]
ai A si0.182
v i0.288
Ipi0.248
N i1/ 3
B si3.24
vi0.377
Ipi0.421
N i2 e(41010si
2.062vi
0.024N i )
where a crack size, load frequency, s stress amplitude ,Ip Current int ensity, N cycle No.
2)024.0062.210104(2421.0377.024.33/1248.0288.0182.0
2 )) ln((ln2
1exp2
1)()( NvseNIpvsBNIpvsAaa
afaLss
N,Cycles
Cra
ck S
ize
"a
",m
Harsh Conditions
Moderate Conditions
Use-Level Conditions
Proposed Simple PoF-Based Corrosion-Fatigue Semi-Empirical Model
crack size vs. stress, cycle, etc.

Data Collection: Experimental Validation
Corrosion-Fatigue Testing Set-Up (Cortest Test Facility)
Recirculating Fluid Tank
Autoclave
Motro Assembly Data
Acquisition Tower
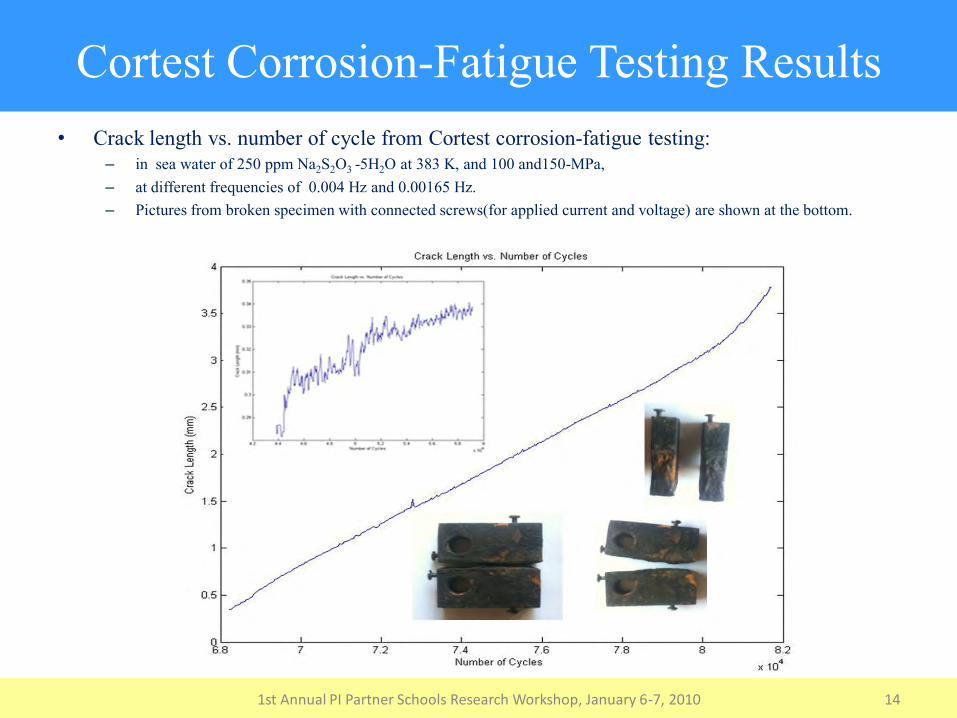
Cortest Corrosion-Fatigue Testing Results • Crack length vs. number of cycle from Cortest corrosion-fatigue testing:
– in sea water of 250 ppm Na2S2O3 -5H2O at 383 K, and 100 and150-MPa, – at different frequencies of 0.004 Hz and 0.00165 Hz. – Pictures from broken specimen with connected screws(for applied current and voltage) are shown at the bottom.
1st Annual PI Partner Schools Research Workshop, January 6-7, 2010 14
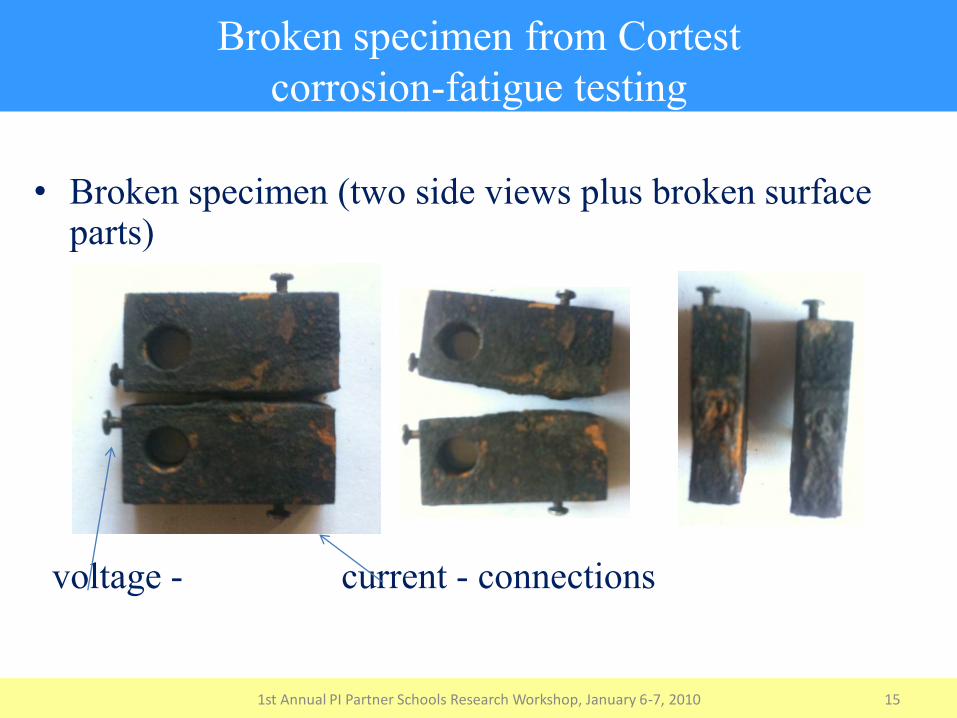
Broken specimen from Cortest corrosion-fatigue testing
• Broken specimen (two side views plus broken surface parts)
voltage - current - connections
1st Annual PI Partner Schools Research Workshop, January 6-7, 2010 15

Model Parameter Estimation
Evidence Ni & ai
From Experiment
Likelihood function
L(ai) = LN (μi,σi)
A , B, σ Prior Dist.
(Unifrom Non Informative)
WinBUGS Program
Posterior Dist. A , B, σ
A sample: 27000
8.20E-5 8.40E-5 8.60E-5 8.80E-5
0.05.00E+51.00E+61.50E+6
B sample: 27000
0.0 2.0E-15 4.0E-15 6.0E-15
0.02.5E+145.0E+147.5E+141.0E+15
s2 sample: 27000
4.0 4.5
0.0 1.0 2.0 3.0 4.0
μA = -9.34
A σA = 7.41х 10-3
μB = -34.524 B σB = 0.4686
Posterior Marginal Lognormal Distributions and s, A & B
μs2 = 4.468 s2 σs2 = 1188
Bayesian Inference Framework using Markov Chain Monte Carlo Simulation Approach

Reliability and Health Monitoring Application
Frequency of Exceedance for Each Observed Number of Pits in the Refinery Pipeline.
The new frequency of exceedance for the bulk pipeline is estimated to be 548 pits/25 yrs life of pipeline!!!! → Drastically Increased
A harsh pipeline environment:
Higher Loading Stress
1 2 3 4 5 6 7 8 9 100
0.2
0.4
0.6
0.8
1
1.2x 10
-3
# of Pits
Fre
quency

Reliability and Health Monitoring Application (Cont.)
Run simulation
Using proposed Empirical Model
“ai” Lognormal distribution:
μ= -5.47 ; σ=0.06
3.5 4 4.5 5 5.5 6 6.5 7 7.5
x 10-3
0
0.01
0.02
0.03
0.04
0.05
0.06
0.07
Crack Size,a (m)
PD
F

Pitting Corrosion (Phase II)
• With Collaboration from PI Summer Interns Abdullah M. Al Tamimi & Mohammed Mousa Mohamed Abu Daqa
1st Annual PI Partner Schools Research Workshop, January 6-7, 2010 19

Background
Pitting Corrosion (X70Carbon Steel) • Pitting Corrosion: An electrochemical oxidation reduction process, which
occurs within localized holes on the surface of metals coated with a passive film.
• It might be accelerated by chloride, sulphate or bromide ions in the electrolyte solution.
• Pitting corrosion has a great impact on the oil and gas industry. • There are three main stages for the pitting corrosion to occur:
1-Pit Initiation 2- Pit Propagation 3-Fracture:
20 1st Annual PI Partner Schools Research Workshop, January 6-7, 2010
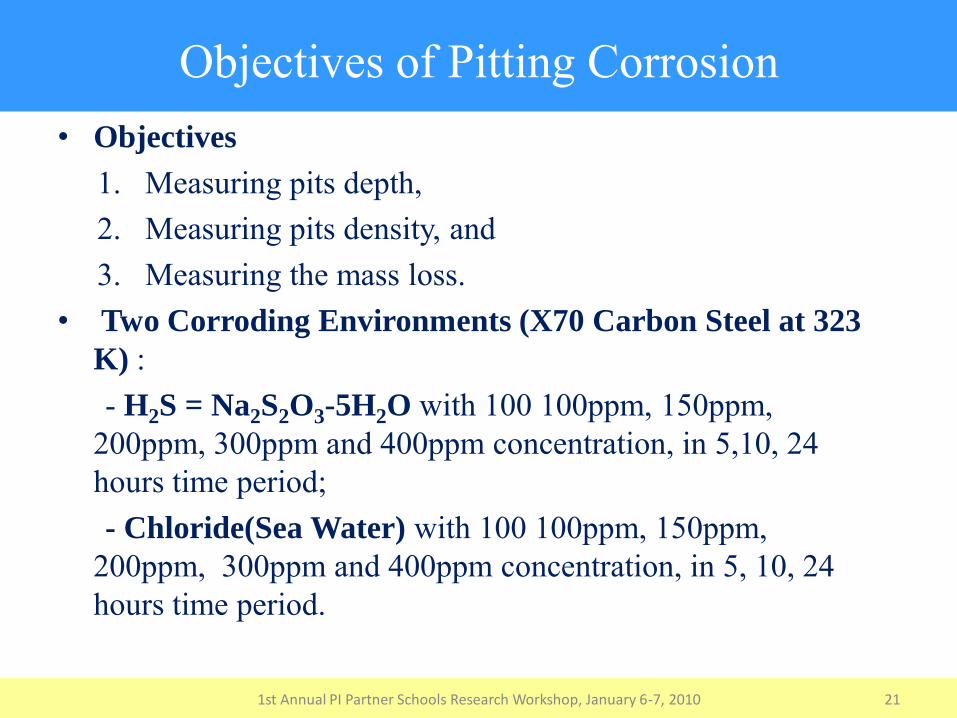
Objectives of Pitting Corrosion • Objectives
1. Measuring pits depth, 2. Measuring pits density, and 3. Measuring the mass loss. • Two Corroding Environments (X70 Carbon Steel at 323
K) : - H2S = Na2S2O3-5H2O with 100 100ppm, 150ppm,
200ppm, 300ppm and 400ppm concentration, in 5,10, 24 hours time period;
- Chloride(Sea Water) with 100 100ppm, 150ppm, 200ppm, 300ppm and 400ppm concentration, in 5, 10, 24 hours time period.
21 1st Annual PI Partner Schools Research Workshop, January 6-7, 2010

Experimental Setup/1 • The scheme of the experimental setup:
22 1st Annual PI Partner Schools Research Workshop, January 6-7, 2010

Experimental Setup/2 • The scheme of the experimental setup:
Static stress corrosion specimen with a strain gage on it to measure the applied stress.
1st Annual PI Partner Schools Research Workshop, January 6-7, 2010 23

Examples of Pitting Corrosion
H2S and Chloride-Results • Morphology of the samples are studied by: 1- Optical Microscope, Nikon Optiphot 66 2- Sensitive Weighing Machine, METTLER TOLEDO AB104 3- Scanning Electron Microscope, HITACHI SU-70 SEM • Morphology of Pits on X70 Carbon Steel surface in corrosive environments
in H2S (Mx200) in Chloride (Mx200)
1st Annual PI Partner Schools Research Workshop, January 6-7, 2010 24
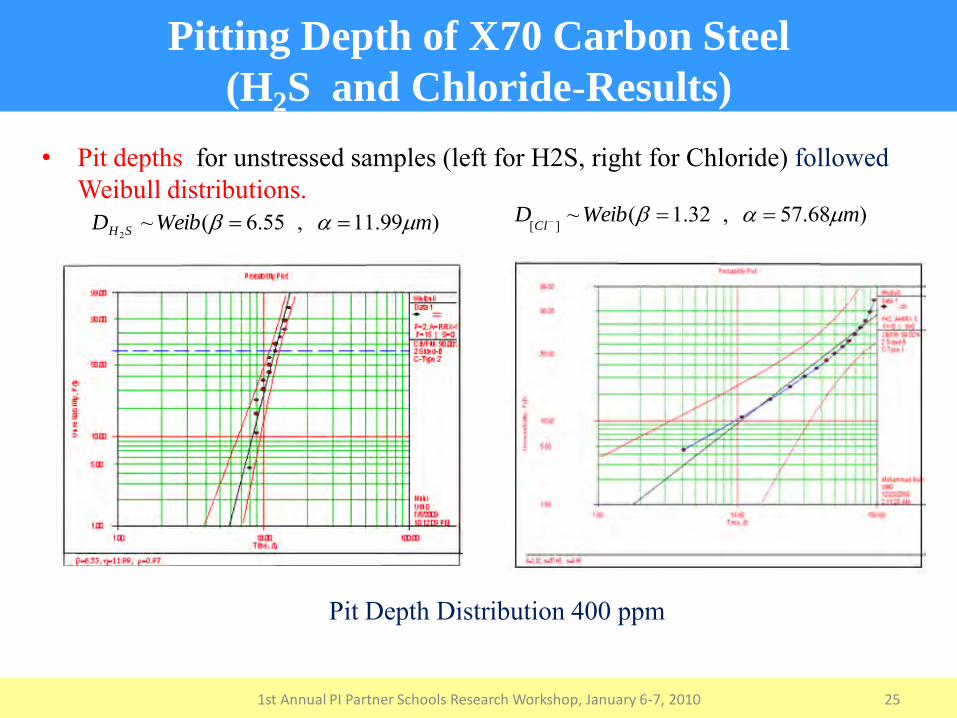
Pitting Depth of X70 Carbon Steel
(H2S and Chloride-Results) • Pit depths for unstressed samples (left for H2S, right for Chloride) followed
Weibull distributions.
Pit Depth Distribution 400 ppm
1st Annual PI Partner Schools Research Workshop, January 6-7, 2010 25
)99.11,55.6(~2
mWeibD SH )68.57,32.1(~][ mWeibDCl

Pitting Density of X70 Carbon Steel
(H2S and Chloride-Results) • Pit densities followed the lognormal distributions.
• Pit Density distribution 400ppm, 5hours are given in [pits/cm2] The actual mean: [8 pits/cm2] (left), [9 pits/cm2] right
1st Annual PI Partner Schools Research Workshop, January 6-7, 2010 26
)30.0,18.2(~][ sLNPDCl
)39.0,06.3(~][ 2 sLNPD Sh

Estimation of Pitting Corrosion Characteristics
(stressed and unstressed) • 250 ppm H2S (Sodium-thio-sulfate) at 80oC (353K).
• Mean Intensity: 14 in 250x250 µm2 (0.0625 mm2). • The lognormal plotting diagrams of the unstressed and stressed
1st Annual PI Partner Schools Research Workshop, January 6-7, 2010 27
Unstressed : ρ = LN (µ=2.67, σ=0.66) Stressed : ρ = LN (µ=3.31, σ=0.39).
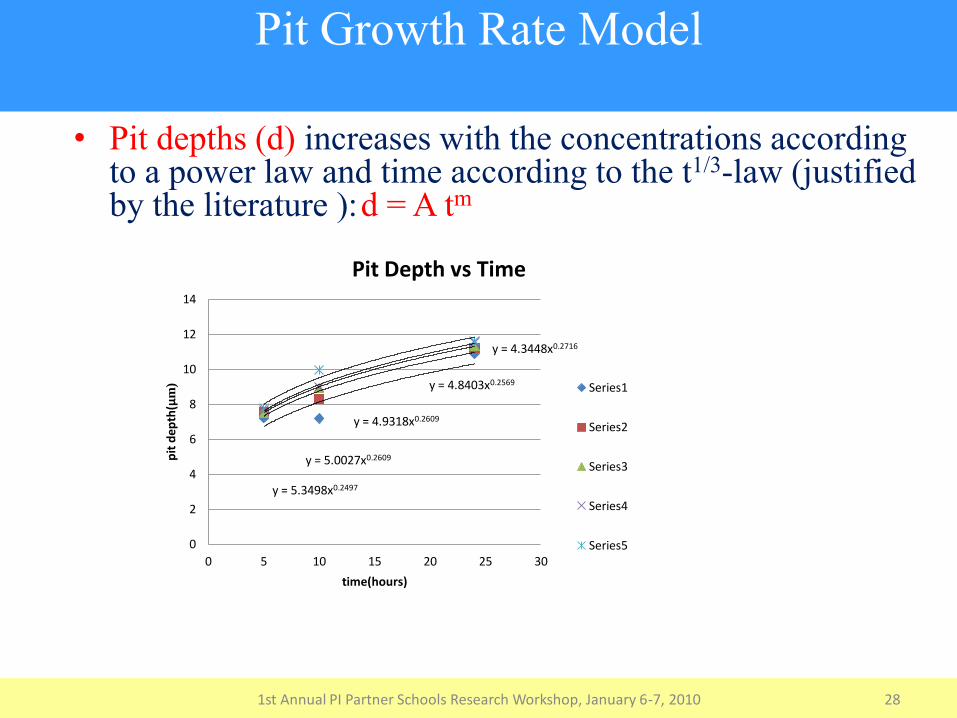
Pit Growth Rate Model
• Pit depths (d) increases with the concentrations according to a power law and time according to the t1/3-law (justified by the literature ): d = A tm
1st Annual PI Partner Schools Research Workshop, January 6-7, 2010 28
y = 4.3448x0.2716
y = 4.8403x0.2569
y = 4.9318x0.2609
y = 5.0027x0.2609
y = 5.3498x0.2497
0
2
4
6
8
10
12
14
0 5 10 15 20 25 30
pit
dep
th(µ
m)
time(hours)
Pit Depth vs Time
Series1
Series2
Series3
Series4
Series5

Creep Modeling Background
1st Annual PI Partner Schools Research Workshop, January 6-7, 2010 29
• Creep is the time-dependent, thermally assisted deformation of materials under constant static load (stress).
• Mathematical description of the process is difficult and is in the form.
• Creep at low temperatures (primary stage) are described by:
– where α, β and γ are material constants;
• There is no general agreement on the form of the equations at high temperatures.
f (s, T, t)
)1log(0 t
3/10 t

Creep Modeling Background (Cont.) • A typical creep curve shows three distinct stages with different creep rates,
determined by several competing mechanisms from: - strain hardening, - softening processes such as recovery and crystallization, - damage processes such as cavitation, necking and cracking. • Creep testing and the creep curve, showing how strain ε increases with time t up to the fracture
time. [http://faculty.mercer.edu/bubacz_m/Links/CH13.pdf]
1st Annual PI Partner Schools Research Workshop, January 6-7, 2010 30

Creep Approach Modeling
• Only literature search completed with some preliminary experimental preparations. The approach includes 1. Using simulation of detailed models propose an
empirical model. 2. Perform accelerated creep tests. 3. Use experimental results to assess parameters and
uncertainties of the proposed empirical model accelerated life testing.
1st Annual PI Partner Schools Research Workshop, January 6-7, 2010 31

Creep Accelerated Test Set up • The creep test is carried out by applying a constant load to a
tensile specimen maintained at a constant temperature, (according to ASTM E139-70).
[http://www.sut.ac.th/engineering/Metal/pdf/MechMet]
1st Annual PI Partner Schools Research Workshop, January 6-7, 2010 32

Creep and SCC Experimental Setup
• Two chambers designed for creep and SCC tests under different environmental conditions and applied stress:
• Left: chamber for Dog-bone • Right: chamber for CT-specimen (The prototypes specimens at work, installed on MTS-
machine).
Dog-bone –specimen CT-specimen
1st Annual PI Partner Schools Research Workshop, January 6-7, 2010 33

Stress Corrosion Cracking (SCC)
• SCC is a combination of static tensile stress below yield and corrosive environment. • Tensile stresses may be external forces, thermal stresses, or residual stresses. • The kinetics of SCC depends on three necessary conditions:
1. The chemical and metallurgical state of the material (chemical composition , thermal conditions, grain size, presence of secondary phases and precipitate, etc.)
2. The environmental conditions (environmental composition, temperature, pressure, pH, electrochemical potential, solution viscosity etc.)
3. Stress state ( uniaxial, triaxial, etc.) and on crack geometry of the material.
1st Annual PI Partner Schools Research Workshop, January 6-7, 2010 34

Stress Corrosion cracking(Factor Affecting) • General relationship for the penetration of SCC following commonly accepted
dependencies (after Staehle). • There are many submodes of SCC and, because of the large number of
variables in Staehle’s equation, there is a great range of possibilities in the study of SCC. This contributes to the complexity of the subject
• Where X is the depth of SCC penetration; • A depends on alloy composition and structure; • is PH; x is the environmental species; • s is stress; • E is electrochemical potential; • Q is the activation energy; • R is gas constant; T is temperature; • t is time; • n, p, m, b, q are empirical constant [Kenneth R. Trethewey; Materials & Design; Volume 29, Issue 2, 2008, Pages 501-507]
1st Annual PI Partner Schools Research Workshop, January 6-7, 2010 35
qRTQbEEmpn teexHAX ....].[].[ /)/( 0 s
][ H

SCC Planned Tests • Tests on statically loaded (stressed) smooth specimens
1st Annual PI Partner Schools Research Workshop, January 6-7, 2010 36

Planned Tests on statically
loaded pre-cracked samples • Fracture mechanics testing for SCC conducted with either :
– a constant load or – with a fixed crack opening displacement,
• the da/dt is measured. • The crack depth is determined as a function of time and the stress intensity. • K1SCC is the min. stress intensity below which SCC does not occur.
CT- specimen for fracture- mechanic-type testing where crack velocity vs. stress Schematic plot of data from fracture- fracture- intensity is obtained type Testing. KISCC is shown to
1st Annual PI Partner Schools Research Workshop, January 6-7, 2010 37

Conclusions
• Reliability models for Corrosion-Fatigue has been developed, verified and demonstrated
• Pitting corrosion is nearly completed with models developed for pitting depth and density
• Literature search for creep models is completed, model developed and validation to follow
• SCC modeling will start in the future-- Preliminary test planning is performed
1st Annual PI Partner Schools Research Workshop, January 6-7, 2010 38