Assessment of the impact of land use on phosphorus status ...
16
78 Assessment of the impact of land use on phosphorus status of water, stream sediments and soils: A case study in Kandapola, Nuwara Eliya A.G. Chandrapala 1 , K.M.A. Kendaragama 1 , C.K. Dissanayake 2 , S.K. Wetthasinghe 1 , A.K Hettiarachchi 1 1 Natural Resources Management Centre, Department of Agriculture Peradeniya, Sri Lanka 2 Sri Lanka Atomic Energy Board, Colombo, Sri Lanka Abstract Excessive use of fertilizer in intensively cultivated agricultural lands and pollution of water bodies from household effluent are of growing concern in Nuwara Eliya district. At present there is an emerging need to investigate the sources and the nature of transport of pollutants to downstream areas from intensively cultivated agricultural lands. Therefore, an attempt was made to determine the status of soil phosphorus in different land uses and its contribution to phosphorus in waterways, using conventional methods and stable 18 O-phosphate isotopes in micro catchment of Park Estate, Kandapola, Nuwara Eliya. Water samples were collected from a main canal originated in a natural forest, tributaries in a tea cultivation, vegetable and residential areas of the estate. Samples were analyzed for 18 O-phosphate (δ 18 Op), PO 4 –P, turbidity, pH, electrical conductivity and total potassium. In addition, soil samples from the same land uses and sediment samples from stream beds were also collected and analized for δ 18 Op using Isotope-Ratio Mass Spectrometer (IRMS). The highest soil δ 18 Op was observed in stream sediments from rural settlements and vegetable cultivating lands. The highest δ 18 Op ‰ value, PO 4 –P, turbidity, salinity and potassium consentration in water were recorded in the stream in vegetable lands. Among the fertilizers used, triple super phosphate recorded the highest δ 18 Op ‰ value and rock phosphate recorded the lowest. Main canal recorded the highest water flow, and streams in rural settlement recorded the lowest. It was concluded that, vegetable cultivating lands and rural settlements contribute to the transport of phosphorus to the downstream areas. Keywords: δ 18 O P ‰, Land uses, Phosphorus, Water quality Assessment of the impact of land use on the phosphorus status of water
Transcript of Assessment of the impact of land use on phosphorus status ...

78
Assessment of the impact of land use on phosphorus status of water, stream sediments and soils: A case study in Kandapola,
Nuwara EliyaA.G. Chandrapala1, K.M.A. Kendaragama1, C.K. Dissanayake2, S.K. Wetthasinghe1,
A.K Hettiarachchi1
1Natural Resources Management Centre, Department of Agriculture Peradeniya, Sri Lanka
2Sri Lanka Atomic Energy Board, Colombo, Sri Lanka
AbstractExcessive use of fertilizer in intensively cultivated agricultural lands and pollution
of water bodies from household effluent are of growing concern in Nuwara Eliya district. At
present there is an emerging need to investigate the sources and the nature of transport of
pollutants to downstream areas from intensively cultivated agricultural lands. Therefore,
an attempt was made to determine the status of soil phosphorus in different land uses
and its contribution to phosphorus in waterways, using conventional methods and stable 18O-phosphate isotopes in micro catchment of Park Estate, Kandapola, Nuwara Eliya.
Water samples were collected from a main canal originated in a natural forest, tributaries
in a tea cultivation, vegetable and residential areas of the estate. Samples were analyzed for 18O-phosphate (δ18Op), PO4–P, turbidity, pH, electrical conductivity and total potassium.
In addition, soil samples from the same land uses and sediment samples from stream beds
were also collected and analized for δ18Op using Isotope-Ratio Mass Spectrometer (IRMS).
The highest soil δ18Op was observed in stream sediments from rural settlements and
vegetable cultivating lands. The highest δ18Op ‰ value, PO4 –P, turbidity, salinity and
potassium consentration in water were recorded in the stream in vegetable lands. Among
the fertilizers used, triple super phosphate recorded the highest δ18Op ‰ value and rock
phosphate recorded the lowest. Main canal recorded the highest water flow, and streams in
rural settlement recorded the lowest. It was concluded that, vegetable cultivating lands and
rural settlements contribute to the transport of phosphorus to the downstream areas.
Keywords: δ18OP ‰, Land uses, Phosphorus, Water quality
Assessment of the impact of land use on the phosphorus status of water

79
IntroductionThe importance of reducing both point and non-point sources of pollutants in
aquatic ecosystems has been widely accepted (Conley et al., 2009). The movement of potential pollutants such as sediment, fecal pathogens and nutrients into surface waters at above ‘natural’ levels has long been known to lead to their degradation. Phosphorus (P) is an essential element in plant, human and animal nutrition, can be derived from weathering of rocks, deposition of aerosols, decomposition of biological debris (e.g. manure and dead body), and chemical fertilizers (Bunemann, 2015). However, in areas with intensively cultivated agricultural lands and/or concentrated large-scale animal production units, the excessive use of external P inputs can lead to P accumulation, thus increasing pollution risks, promoting eutrophication of water bodies (Smith et al., 1999) and direct toxic effects if such accumulated P finds its way to streams and rivers.Therefore, soil, crop, water and P fertilizer management practices, including climatic conditions are important factors to be considered when attempting to formulate sound P-fertilizer recommendations to obtain adequate crop yield responses while protecting the environment.
Long term continuous application of P fertilizers and other P sources such as organic wastes and manure cause P accumulation in the surface horizon (Zhang et al., 2005). The majority of Sri Lankan farmers apply more than the recommended quantity of fertilizers aiming for higher economic benefits. Therefore, in agricultural soils, when high quantities of phosphorus are received, available P content exceeds the critical P for fertilizer response. This P, which is surplus to plant requirements, not only increases the cost of using P fertilizers, but also enhances the depletion of rock phosphate reserves used for manufacturing P fertilizers globally. More importantly, it has become a risk to water quality and the environment (Department of Agriculture, 1993).
The application of environmental isotopes in pollutant migration studies make it possible to trace potential sources, transport media, degradation products, and the final pool of natural and anthropogenic substances in the environment. Therefore, the study was carried out in the Park estate, Kandapola, Nuwara Eliya to assess the effect of different land uses (vegetable, tea, human settlements and forest), on water quality, δ18OP
Tropical Agriculturist, Vol.168 (1), 2020

80
‰ to stream water and sediments, thereby transportation of phosphorus to downstream areas.
Materials and MethodsThe study was conducted in November to December in year 2018/19 (Maha
season) and February to March in year 2019 (Yala season) at Park Estate, Kandapola, Nuwara Eliya, (Figure. 1) where, a stream is connected to the Kothmale reservoir. Farmers in the area are known to use exess amounts of chemical fertilizer and organic manure, especially in vegetable cultivations.
Use of oxygen isotopes in PO43- in phosphorus movement studies
δ18OP ‰ valueThe δ18OP ‰ value is the average value of oxygen isotope concentration of PO4
-3 in individual soil, sediment or water samples, expressed in the “delta” (δ) notation (parts per million or ‰) as the relative deviation, δ, of the heavy isotope content of a sample from that of a standard according to the equation 01:
Where, R is the ratio of the heavy isotope to the light isotope in the sample (RSample) and the standard (RStandard), respectively. As R Standard in stable oxygen isotopes, isotope ratio of oxygen (18O/16O) in Vienna Standard Mean Ocean Water (V-SMOW) was used. The δ value is positive if the sample has more of the heavy isotope than the standard and vice versa.
Selection of sub catchmentThe sub catchment for the study was selected based on the location of isolated
streams running through the land uses of natural forest, tea plantation, intensive vegetable cultivation fields and rural settlements which were interconnected to the main canal. Micro catchment for each stream was delineated based on the elevation map of the area and using the GPS points. The selected sub catchment was a part of a Kothmale reservoir catchment.
Assessment of the impact of land use on the phosphorus status of water

81
Figure 1. Research study site, Kandapola, Nuwara Eliya
Water sample collection schedule was prepared to represent Maha (October – December) and Yala (March-August) seasons to determine the variation of δ18OP ‰ and other chemical properties of stream water in different land uses, main canal and Kothmale reservoir. Soil samples and stream bed sediment samples were also collected to determine the relationship of stream water δ18OP ‰ value with δ18OP ‰ values in stream bed sediments and soils in respective land uses. Water samples were collected in nine locations from main canal, streams connected to main canal and Kothmale reservoir (stream originated from natural forest, stream from tea lands, meeting point of main canal and stream originated in tea lands, stream originated in vegetable lands, meeting point of main canal and stream originated in vegetable lands, stream originated in rural
Tropical Agriculturist, Vol.168 (1), 2020

82
settlement, meeting point of main canal and stream originated in rural settlement and from Kothmale reservoir) to determine the δ18OP ‰, total phosphorus, total potassium, turbidity, electrical conductivity and pH. Water samples of 40 liter in each sampling point were collected to acid washed high density polyethylene bottles in triplicate and filtered through 0.45 µm filter papers to remove particulate matters.
Collected water samples were analyzed for δ18OP ‰ values in International Atomic Energy Agency, Vienna, Austria using a Isotope-Ratio Mass Spectrometry (IRMS) in which mass spectrometric methods were used to measure the relative abundance of isotopes (as parts per million or per mil ‰) in a given sample (International Atomic Energy Agency, 2016).
In addition, nine soil samples up to 10 cm of soil depth in grid pattern from each land use of natural forest, tea lands, intensive vegetable cultivation lands and from the rural settlements were collected in each season. Sediments were collected in the beds of main canal, streams and Kothmale reservoir in both seasons. Collected soil and sediment samples were air dried to a constant weight and analyzed for 18O-phosphate isotopes, pH, electrical conductivity, organic matter percentage of soil, available phosphorus and exchangeble potassium content.
The organic matter percentage of the soil was estimated by the rapid titration procedure given by Walkley and Black (1934). Available phosphorus of the soil samples was extracted with Olsen’s extractant (0.5 M NaHCO3). Phosphorus in the extractant was estimated colorimetrically by ascorbic acid method (Olsen et al., 1954). Exchangeable potassium of soil samples was extracted by neutral ammonium acetate solution and was determined by using flame photometer (Jackson, 1979).
Fertilizer and manure samplesSamples of triple super phosphate applied to vegetable lands, Eppawala rock
phosphate applied to tea lands and, farm yard manure applied to vegetable lands were collected and analyzed for 18O-phosphate isotopes.
Assessment of the impact of land use on the phosphorus status of water

83
Water flow measurementsVolume of water flowed per unit time through streams were measured using a
bucket and main canal using parshall flume in both seasons. The total volume of water flowed in to known volume of a bucket and the time taken to fill the bucket was recorded and expressed as m3s˗1.
Statistical analysisStatistical analysis of data was performed using the OPSTAT statistical package
of Haryana Agricultural University, available online at www.opstat.com.
Results and DiscussionSoil δ18OP ‰
The highest soil δ18OP ‰ value was observed under intensive vegetable cultivation in 2018/19 Maha season (Table 1). In the sediment samples collected from bed of the stream running through the vegetable growing fields had higher δ18OP ‰ (Table 2) than that of soils sample collected from vegetable growing fields nearby, suggesting that most of the phosphate in the sediments came directly from the fertilizer rather than through leaching of phosphate from soils. Phosphate can be deposited in sediments and may eventually be effluxed from sediments at a later stage. Thus, measurements of δ18OP ‰ will reflect a combination of source and signatures, of which may impart an isotopic fractionation.
Residual accumulation of phosphorus in soils is due to the continous application of highly soluble phosphorus fertilizer to vegetable cultivated fields than to tea cultivation where, partially soluble rock phosphate is being applied (Ariyapala and Nissanka, 2006) This might have contributed to the lower δ18OP ‰ value in soils in tea lands. However, it was on par with soils of rural settlements and tea lands in 2019 Yala season. The δ18OP ‰ value was lower in rural settlements in 2018/19 Maha season compared to 2019 Yala season, and it was on par with all the other land uses. Contrastingly higher δ18OP ‰ value in 2019 Yala season under the land use of rural settlements may be due to the addition of organic manure in to the soil that likely to have washed off in 2018/19 Maha season due to heavy rains. O’Neil et al. (2003) stated that the P-O bond in PO4
-3
Tropical Agriculturist, Vol.168 (1), 2020

84
is very strong and in the absence of enzymatic/biological activity, phosphate oxygen does not exchange isotopes with water under normal temperature and pH (Chang and Blake, 2015).
Table 1. δ18OP ‰ values in soils of different land uses, in 2018/19 Maha and 2019 Yala seasons
Land use
δ18OP ‰2018/19 Maha season
2019 Yala season
Natural Forest 17.60b 15.80b
Tea 18.20b 16.96ab
Vegetable 21.16a 20.76a
Rural settlement 12.53c 18.33ab
LSD 2.02 4.00CV% 6 12Means followed by the same letter within a coloum are not significantly different at p = 0.05
Sediment δ18OP ‰ The highest sediment δ18OP ‰ value was recorded in stream bed running through
human settlements in 2018/19 Maha season and sediments in stream beds of vegetable fields and human settlements in 2019 Yala season. The lowest δ18OP ‰ value in sediment deposits in 2018/19 Maha season was observed in the stream running through natural forest. However, in 2019 Yala season, in addition to stream in natural forest, sediment deposits of tea lands and sediments in Kothmale reservoir also recorded the lower δ18OP
‰ values. The particulate organic substances deposition in stream beds that contains high concentration of phosphate is likely to have caused higher δ18OP ‰ in stream sediments in the rural settlement. Direct transport of farm yard manure and triple super phosphate to stream water and its deposition in stream bed sediments likely to have increased the δ18OP
‰ in sediment deposits running through intensive vegetable cultivating fields.
Assessment of the impact of land use on the phosphorus status of water

85
Table 2. δ18OP ‰ values in different sediment sources in Maha and Yala seasons
Sediment sourceδ18OP ‰2018/19 Maha
season2019 Yala season
Stream bed sediment forest 11.2d 16.4b
Stream bed sediment vegetable fields 19.3b 20.7a
Stream bed sediment tea lands 14.8c 14.6b
Stream bed sediment and Human settlements 21.5a 21.0a
Kothmale reservoir sediment 15.3c 15.4b
LSD 1.5 2.7
CV% 5 8
Means followed by the same letter within a coloum are not significantly different at p = 0.05
18O-PO4 (δ18OP) in water samples
Among the water samples tested, both streams in rural settlement and streams in vegetable lands recorded the highest δ18OP value in 2018/19 Maha season. However, in 2019 Yala season, stream water at the end pont of watershed also recorded high δ18OP value, in addition to stream water in rural settlements and vegetable lands. Direct disposal of household effluants, feacle materials from livestock farming in rural settlement likely to have increased the biological activity and fractionation of phosphorus in water eventually leading to δ18OP value. Similerly phosphorus and other plant nutrients added to the stream water through runoff from vegetable lands likely to have increased the proliferation of micro organism leading to fractionation of phosphorus in streams running through the vegetable lands. Water in stream running through natural forest recorded lowest δ18OP values of 10.43 ‰ in 2018/19 Maha season and 11.62 ‰ in 2019 Yala season (Table 3). However, it was on par with δ18OP ‰ value in stream at the end of forest, stream in tea lands, and water in the Kothmale reservoir in both seasons and stream in tea land meeting point of main canal in 2019 Yala season. In addition, tea main canal meeting point also recorded the similar δ18OP value as in the natural forest during 2019 Yala season. Although, the lowest stream water δ18OP value is expected in natural forest as there was no external fertilizer application and runoff water receiving from other land uses, there
Tropical Agriculturist, Vol.168 (1), 2020

86
were statistically similar δ18OP value in stream water from tea lands in 2018/19 Maha season and stream water from tea lands and water from Kothmale reservoir in 2019 Yala season. This kind of similarity was also observed in δ18OP value of stream sediments of streams in forest lands, tea lands and Kothmale reservoir sediments (Table 2) and soils in forest land, tea land and rural settlement (Table 1). Two factors likely to have contributed to this similarity; the unavailability of chemical source of P in natural forest, that likely to have reduced the δ18OP value and on the other hand, higher biological activity in the natural forest might have increased the fractionation of phosphorus leading to high δ18OP value. Goloda et al. (2019) stated that, in natural ecosystems, the phosphorus cycle is “tight”, which means transfer between soil and biota is efficient and little P is lost from the system. However, the increasing P input by human via fertilizers from rock phosphate has increased losses of phosphate from the terrestrial system into freshwater systems, leading to eutrophication issues. In general, higher δ18OP value was observed in 2019 Yala season than the 2018/19 Maha season in all the sampling points tested, possibly due to the concentration of nutrients, stagnation of water in streams (Table 5) and proleliferation of microorganisms leading to P fractionation adding higher δ18OP to streams and Kothmale reservoir. The differences of P in each land use may be due to the quality and quantity of P fertilizer applied to different land uses and the population density of microorganisms in different land uses.
There was a contrasting difference of δ18OP concentration in soil samples and stream water samples in Maha season and Yala season, where soil samples had higher P concentrations than stream water samples in all the land uses except human settlements. However, in the dry season, stream water samples had a higher δ18OP concentration than that of soil sampes in all other land uses. The higher δ18OP value of water in streams in Yala season may be due to the concentration of nutrients due to stagnation of water in the streams. Angert et al. (2011) also reported that the δ18O values of resin-extractable P of a range of 14.5–19.1‰ (SMOW), and evidence of seasonal variability, as well as variability induced by rainfall manipulation experiments. Assessment of flow rate of streams running through different land uses also revealed that extreamly low flow rate in Yala compared to Maha season (Table 4).
Assessment of the impact of land use on the phosphorus status of water

87
Table 3. δ18OP ‰ values in water samples in different points of main canal, tributaries and Kothmale reservoir in Maha and Yala seasons
Sampling pointδ18OP ‰
Maha season Yala seasonStream in natural forest 10.43c 11.62c
Stream at the end of forest 11.26bc 11.83c
Stream in tea lands 12.46bc 13.17c
Tea – main canal meeting point 12.90b 12.97c
Stream in vegetable lands 16.00a 17.68ab
Vegetable lands – main canal meeting point 13.56b 16.25b
Stream in rural settlement 16.43a 20.12a
End of the study watershed 13.46b 19.74a
Kothmale reservoir 11.93c 13.57c
LSD (0.05) 2.27 2.48
CV% 10 13
Means followed by the same letter within a coloum are not significantly different at p = 0.05
Analysis of fertilizerIn natural forest, there was no fertilizer application but only natural recycling
of nutrients. However, there was a chemical fertilzer application in tea lands and both chemical and organic manure application in vegetable cultivated fields. As a P source, estate companies apply Eppawala rock phospate which is a grounded rock phosphate available in tea fertilizer mixtures. In vegetable cultivations, farmers apply triple super phosphate as a phosphorus source. In addition vegetable farmers also apply Farm Yard Manure (FYM) (Cattle) as an organic manure.
Analysis of fertilizer materials revealed that the highest value of δ18OP ‰ was in triple super phosphate (22.9 ‰ in 2018/19 Maha season and 22.7 ‰ in 2019 Yala season), (Table 4). Eppawala rock phosphate and FYM recorded lower δ18OP ‰ values in both seasons (Table 4). Although, higher microbial population is likely to have associated with FYM than triple super phosphate fertilizer, high P concentration in triple super phosphate may surpass the fractunized phosphate molecules than FYM leading to higher value. Amelung et al. (2015) reported that, organic fertilizers had significantly smaller
Tropical Agriculturist, Vol.168 (1), 2020
88
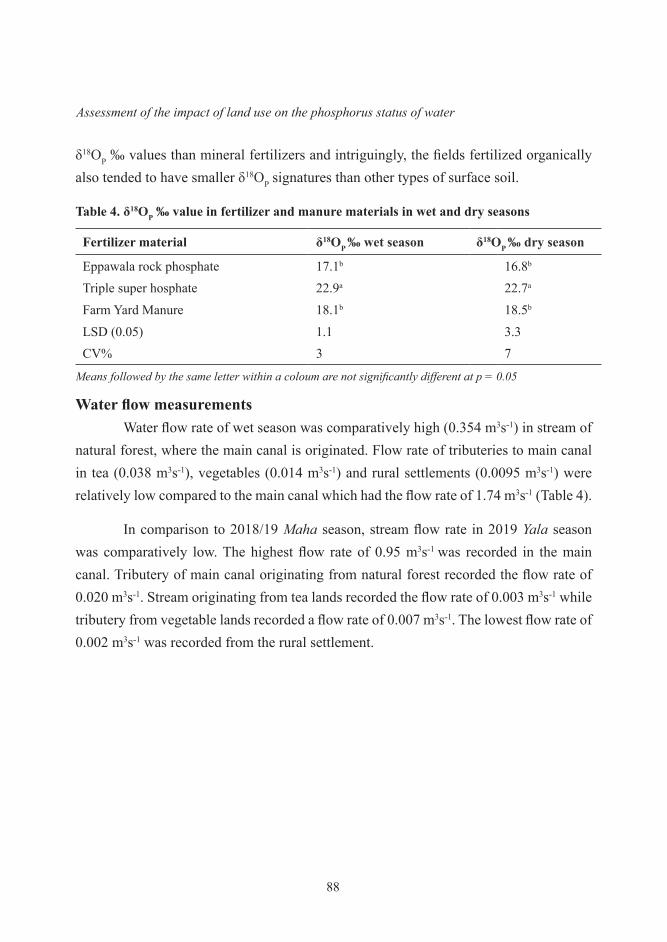
δ18OP ‰ values than mineral fertilizers and intriguingly, the fields fertilized organically also tended to have smaller δ18OP signatures than other types of surface soil.
Table 4. δ18OP ‰ value in fertilizer and manure materials in wet and dry seasons
Fertilizer material δ18OP ‰ wet season δ18OP ‰ dry season
Eppawala rock phosphate 17.1b 16.8b
Triple super hosphate 22.9a 22.7a
Farm Yard Manure 18.1b 18.5b
LSD (0.05) 1.1 3.3CV% 3 7
Means followed by the same letter within a coloum are not significantly different at p = 0.05
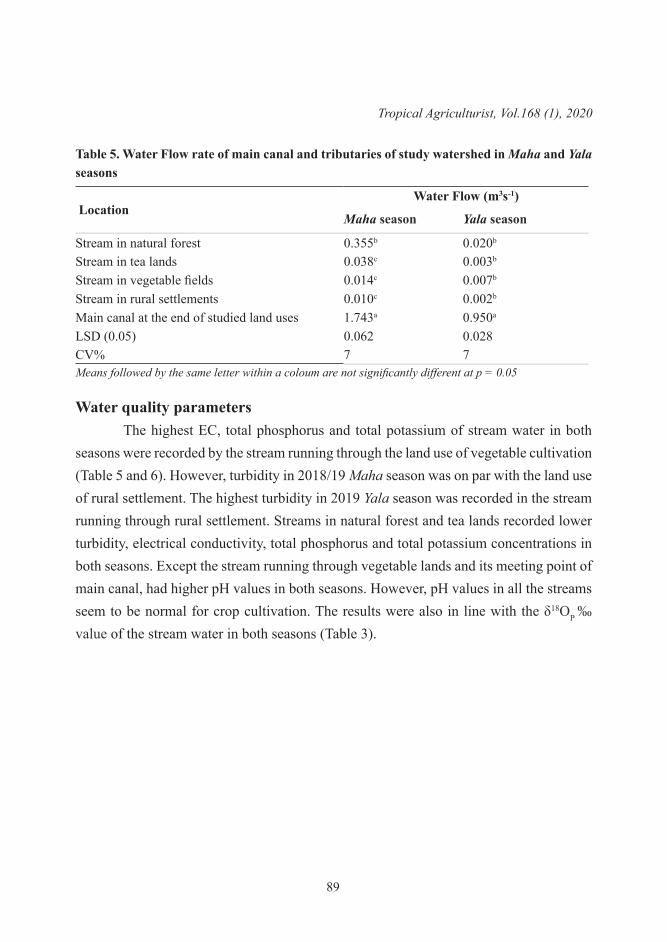
Water flow measurementsWater flow rate of wet season was comparatively high (0.354 m3s˗1) in stream of
natural forest, where the main canal is originated. Flow rate of tributeries to main canal in tea (0.038 m3s˗1), vegetables (0.014 m3s˗1) and rural settlements (0.0095 m3s˗1) were relatively low compared to the main canal which had the flow rate of 1.74 m3s˗1 (Table 4).
In comparison to 2018/19 Maha season, stream flow rate in 2019 Yala season was comparatively low. The highest flow rate of 0.95 m3s˗1 was recorded in the main canal. Tributery of main canal originating from natural forest recorded the flow rate of 0.020 m3s˗1. Stream originating from tea lands recorded the flow rate of 0.003 m3s˗1 while tributery from vegetable lands recorded a flow rate of 0.007 m3s˗1. The lowest flow rate of 0.002 m3s˗1 was recorded from the rural settlement.
Assessment of the impact of land use on the phosphorus status of water
89
Table 5. Water Flow rate of main canal and tributaries of study watershed in Maha and Yala seasons
LocationWater Flow (m3s˗1)
Maha season Yala season
Stream in natural forest 0.355b 0.020b
Stream in tea lands 0.038c 0.003b
Stream in vegetable fields 0.014c 0.007b
Stream in rural settlements 0.010c 0.002b
Main canal at the end of studied land uses 1.743a 0.950a
LSD (0.05) 0.062 0.028CV% 7 7Means followed by the same letter within a coloum are not significantly different at p = 0.05
Water quality parametersThe highest EC, total phosphorus and total potassium of stream water in both
seasons were recorded by the stream running through the land use of vegetable cultivation (Table 5 and 6). However, turbidity in 2018/19 Maha season was on par with the land use of rural settlement. The highest turbidity in 2019 Yala season was recorded in the stream running through rural settlement. Streams in natural forest and tea lands recorded lower turbidity, electrical conductivity, total phosphorus and total potassium concentrations in both seasons. Except the stream running through vegetable lands and its meeting point of main canal, had higher pH values in both seasons. However, pH values in all the streams seem to be normal for crop cultivation. The results were also in line with the δ18OP ‰ value of the stream water in both seasons (Table 3).
Tropical Agriculturist, Vol.168 (1), 2020

90
Table 6. Water quality parameters of main canal and tributaries in study watershed in Wet season (Maha season)
Sampling point
Water quality parameters (2018/19 Maha season)
Turbidity(NTU) pH EC
(µS cm˗1)Total-P(mg L˗1)
Total potassium (mg L˗1)
Stream in natural forest 1.48d 6.96a 240.3c 0.21e 0.80d
Forest main canal meeting point 2.05d 6.71a 397.6c 0.50d 1.76c
Tea 3.13d 6.41a 463.3c 0.77c 2.43c
Tea – main canal meeting point 11.63c 6.48a 1,148.0b 0.57cd 9.46b
Vegetable 29.96a 5.52b 2,714.3a 2.39a 18.63a
Vegetable – main canal meeting point 22.20b 5.51b 1,303.3b 1.89b 9.03b
Rural settlement 25.83ab 6.26a 1,169.6b 2.56a 3.86c
LSD (0.05) 4.89 0.70 306.4 0.24 2.51
CV% 19 6 14 34 21Means followed by the same letter within a coloum are not significantly different at p = 0.05
Assessment of the impact of land use on the phosphorus status of water

91
Table 7. Water quality parameters of main canal and tributaries in study watershed in Dry season (Yala season)
Sampling point
Water quality parameters (2019 Yala season)
Turbidity (NTU)
pH EC (µS cm˗1)PO4
P (mg L˗1)
Total potassium P (mg L˗1)
Stream in natural forest 1.52d 7.06a 274.00d 1.4d 0.80d
Forest main canal meeting point 1.69d 6.57a 496.33d 1.7d 1.80d
Tea 1.89d 7.34a 547.66d 3.7c 1.80d
Tea – main canal meeting point 8.04c 7.41a 1,397.66c 2.6cd 5.46c
Vegetable 16.85b 6.10a 3,452.66a 8.4a 11.56a
Vegetable – main canal meeting point 18.56b 6.17b 1,917.66bc 6.3b 8.3b
Rural settlement 29.43a 7.48a 2,476.00b 7.2a 5.72c
LSD (0.05) 5.19 0.96 712.04 1.43 2.54
CV% 25 7 26 24 25Means followed by the same letter within a coloum are not significantly different at p = 0.05
ConclusionDirect disposal of effluents from households and intensive vegetable cultivation
in hilly areas highly contribute to the δ18OP value in stream water, which is the fraction of phosphorus released due to biological activities. Higher turbidity of stream water in these land uses also confirms the microbial proliferation in stream water of these land uses. In addition to the phosphorus fractionation, the highest phosphate concentration was also recorded in stream water in these land uses leading to the phosphorus pollution of stream water. Contribution of land uses of natural forests and tea for phosphorus incorporation to stream water was minimal compared to the other land uses studied.
Tropical Agriculturist, Vol.168 (1), 2020

92
ReferencesAmelung, W., P. Antar, I. Kleeberg, Y. Oelmann, A. Lücke, F. Alt, H. Lewandowski, S. Pätzold,
and J. Barej, 2015. The δ18O signatures of HCl-extractable soil phosphates: Methodological challenges and evidence of the cycling of biological P in arable soil. European Journal of Soil Science. 66.
Angert, A., T. Wener, S. Mazen and F. Tamburini. 2011. Seasonal variability of soil phosphate stable oxygen isotopes in rainfall manipulation experiments. Geochimica et Cosmochimica Acta. 75(15). 4216-422.
Ariyapala, W.S.B. and S.P. Nissanka. 2006. Reasons for and Impacts of excessive fertilizer usage for potato farming in the Nuwaraeliya District. Tropical Agriculture Research. 18. 66.
Bunemann, E. K. 2015. Assessment of gross and net mineralization rates of soil organic phosphorus – A review, Soil Biology and Biochemistry October 2015. 82 - 98.
Chang, S.J. and R.E. Blake. 2015. Precise calibration of equilibrium oxygen isotope fractionations between dissolved phosphate and water from 3 to 37 °C. Geochimica et Cosmochimica Acta. 314 – 323.
Conley, D.J., H.W. Paerl, R.W. Howarth, D.F. Boesch, S.P. Seitzinger and K.E. Havens. 2009. Ecology: controlling eutrophication: nitrogen and phosphorus. Science. 323. 1014 –1015.
Department of Agriculture. 1993. Soil test based fertilizer recommendation guidelines. Agriculture research station, Department of Agriculture, Nuwara Eliya, Sri Lanka. 18.
Elvira Goloda, E., G. Soja, K. Zwölfer, R. Hood-Nowotny and A. Watzinger. 2019. Oxygen isotope equilibration of phosphate in the soil /plant system – an 18O-PO4 organic fertilizer test. Geophysical Research Abstracts Vol. 21, EGU2019-18769, 2019 EGU General Assembly. 87.
International Atomic Energy Agency. 2016. Use of Phosphorus Isotopes for Improving Phosphorus Management in Agricultural Systems, IAEA-TECDOC-1805, IAEA, Vienna. 24.
Jackson, A. D. 1979. Soil Chemical Analysis – Advanced Course, 2nd edition. Author’s publication. University of Wisconsin, Madison, USA. 92.
Assessment of the impact of land use on the phosphorus status of water

93
O’ Neil, J. R., T. W. Vennemann and W. F. Mckenzie. 2003. Effects of speciation on equilibrium fractionations and rates of oxygen isotope exchange between (PO4)aq and H2O. Geochimica et Cosmochimica Acta. 67. 2003. 3135 – 3144.
Olsen, S. R., C.V. Cole, F.S. Watanabe and L.A. Dean. 1954. Estimation of available phosphorus in soil by extraction with bicarbonate. Circular, U. S. Department of Agriculture. 939.
Smith, V.H., G.D. Tilman, J.C. Nekola. 1999. Eutrophication: impacts of excess nutrient inputs on freshwater, marine, and terrestrial ecosystems. Environment Pollution. 100. 179–196.
Walkley, A. and C.A. Black. 1934. Estimation of soil organic carbon by the cromic acid titration method. Soil Science. 28 – 29.
Zhang, Q., M.R. Alfarra, D.R. Worsnop, J.D. Allan, H. Coe, M.R. Canagaratna, and J.L. Jimenez. 2005. Deconvolution and Quantification of Hydrocarbon like and Oxygenated Organic Aerosols Based on Aerosol Mass Spectrometry. Environmental Science and Technology. 39. 4938 - 4952.
Tropical Agriculturist, Vol.168 (1), 2020