Sprint Communications Co. v. APCC SERVICES, 554 U.S. 269 (2008)
Upload
nguyennguyetCategory
view
216download
1
Assessment of the APCC coupled MME suite in predictingthe distinctive climate impacts of two flavors of ENSOduring boreal winter
Hye-In Jeong • Doo Young Lee • Karumuri Ashok • Joong-Bae Ahn •
June-Yi Lee • Jing-Jia Luo • Jae-Kyung E. Schemm • Harry H. Hendon •
Karl Braganza • Yoo-Geun Ham
Received: 18 March 2011 / Accepted: 26 March 2012
� Springer-Verlag 2012
Abstract Forecast skill of the APEC Climate Center
(APCC) Multi-Model Ensemble (MME) seasonal forecast
system in predicting two main types of El Nino-Southern
Oscillation (ENSO), namely canonical (or cold tongue) and
Modoki ENSO, and their regional climate impacts is assessed
for boreal winter. The APCC MME is constructed by simple
composite of ensemble forecasts from five independent cou-
pled ocean-atmosphere climate models. Based on a hindcast
set targeting boreal winter prediction for the period
1982–2004, we show that the MME can predict and discern
the important differences in the patterns of tropical Pacific sea
surface temperature anomaly between the canonical and
Modoki ENSO one and four month ahead. Importantly, the
four month lead MME beats the persistent forecast. The MME
reasonably predicts the distinct impacts of the canonical
ENSO, including the strong winter monsoon rainfall over East
Asia, the below normal rainfall and above normal temperature
over Australia, the anomalously wet conditions across the
south and cold conditions over the whole area of USA, and the
anomalously dry conditions over South America. However,
there are some limitations in capturing its regional impacts,
especially, over Australasia and tropical South America at a
lead time of one and four months. Nonetheless, forecast skills
for rainfall and temperature over East Asia and North America
during ENSO Modoki are comparable to or slightly higher
than those during canonical ENSO events.
Keywords El Nino-Southern Oscillation (ENSO) �Canonical ENSO � ENSO Modoki � Seasonal prediction
skill � Teleconnection � Multi-model ensemble (MME) �Coupled general circulation model
H.-I. Jeong � D. Y. Lee
APEC Climate Center (APCC), Pusan, Republic of Korea
H.-I. Jeong � D. Y. Lee � J.-B. Ahn
Pusan National University, Pusan, Republic of Korea
K. Ashok (&)
Centre for Climate Change Research, Indian Institute of Tropical
Meteorology, Pune, India
e-mail: [email protected]
J.-Y. Lee
International Pacific Research Center, University of Hawaii,
Honolulu, HI, USA
J.-J. Luo
Research Institute for Global Change/JAMSTEC,
Yokohama, Japan
J.-K. E. Schemm
NCEP/NOAA Climate Prediction Center,
Camp Spring, MD, USA
H. H. Hendon � K. Braganza
Centre for Australian Weather and Climate Research,
Bureau of Meteorology, Melbourne, VIC, Australia
Y.-G. Ham
Global Modeling and Assimilation Office, NASA Goddard
Space Flight Center (NASA/GSFC), Greenbelt, MD, USA
Y.-G. Ham
Goddard Earth Sciences Technology and Research Studies
and Investigations, Universities Space Research Association,
Greenbelt, MD, USA
123
Clim Dyn
DOI 10.1007/s00382-012-1359-3

1 Introduction
There has been considerable amount of research into a new
type of ENSO. It has been equivalently referred to as
dateline (Larkin and Harrison 2005b), El Nino Modoki
(Ashok et al. 2007), Central-Pacific (Yu and Kao 2007;
Kao and Yu 2009), and Warm Pool El Nino (Kug et al.
2009, 2010), in order to differentiate it from the typical El
Nino that develops further east in the cold tongue of the
equatorial Pacific, such as that during 1997 (McPhaden
1999)1. A key distinction of El Nino Modoki is that the
maximum sea surface temperature anomaly (SSTA) occurs
in the central equatorial Pacific rather than in the eastern
Pacific and the SSTA is typically flanked by cold anoma-
lies further east and west and lasts for several seasons. El
Nino Modoki appears to be a recent phenomenon, with
eight El Nino Modoki events having occurred2 since 1980s
including the recent El Nino Modoki event in 2009 (Ashok
et al. 2007; Ratnam et al. 2010). For reference, five3
canonical El Nino events, also known as cold tongue El
Nino (Hendon et al. 2009) or eastern Pacific El Nino (Yu
and Kao 2007) have occurred since 1980. Prior to the
1980’s no El Nino Modokis have been reported, though
Donguy and Dessier (1983) and Fu et al (1986) discuss
distinct characteristics of a few individual events. Anom-
alous warming in the central Pacific in the pre-1980s period
stemmed from transient evolution of canonical El Nino
events (e.g., Trenberth and Stepaniak 2001). Studies hint
that this recent frequent occurrence of El Nino Modoki is
associated with recent climate change in the Pacific,
especially the flattening of the tropical Pacific thermocline
in association with slackened trade easterlies (Ashok et al.
2007; Turner et al. 2007; Yeh et al. 2009). A flatter ther-
mocline favors generation of SST anomalies in the central
Pacific via zonal advection and surface heat flux variations
as opposed to SST anomalies further east in the cold tongue
that result from vertical displacement of the thermocline as
typically occurs in canonical El Ninos (Kug et al. 2009; Yu
and Kim 2010).
The climatic impacts of Modoki and canonical El Ninos,
are also distinctly different, especially over East Asia,
Australia, and United States (e.g. Larkin and Harrison
2005a; Ashok et al. 2007, 2009a, b; Weng et al. 2007,
2009; Wang and Hendon 2007; Lim et al. 2009; Taschetto
and England 2009; Trenberth and Smith 2009; Cai and
Cowan 2009; Mo 2010; Pradhan et al. 2011). For example,
during boreal winter, El Nino Modoki events weaken the
East Asian winter monsoon by shifting the low-level
anticyclone to the South China Sea, whereas during
canonical El Nino the winter monsoon strengthens because
the anticyclones shift to the Philippines Seas (Weng et al.
2009). Australian spring rainfall has greatest sensitivity to
the SST variations on the eastern edge of the Pacific warm
pool area (Wang and Hendon 2007) and it is thus more
sensitive to El Nino Modoki events than a canonical El
Nino (Hendon et al. 2009; Lim et al. 2009). By contrast,
Australian autumn rainfall is sensitive to La Nina Modoki
(Cai and Cowan 2009).
Although distinctive impacts of El Nino Modoki events
have been well established, there has been little effort to
assess the skills of the models in predicting them. Hendon
et al (2009) and Lim et al. (2009) showed some limited
success in predicting differences between Modoki and
canonical El Ninos using the Bureau of Meteorology PO-
AMA coupled seasonal forecast model; the prediction skill
were limited by systematic model error, whereby the PO-
AMA model is unable to maintain the distinction between
Modoki and cold tongue events beyond about 1 season lead
time. The present study aims to assess the ability to predict
distinctions between Modoki and canonical El Ninos using
a multi-model approach, whereby systematic model errors
might be averaged out. We use the coupled climate pre-
diction Multi-Model Ensemble (MME) suite of the APEC
Climate Center (APCC), Korea, and assess its ability to
predict the two El Nino phenomena and their distinctive
regional impacts. Here we focus on four-month lead
(August 1 initial condition) and one-month lead (Novem-
ber 1 initial condition) prediction skill for the boreal winter
season, using hindcast for the period 1982–2004.
The next section gives a brief description of the forecast
data and MME methodology. In Sect. 3, we examine the
ability of the MME to distinguish and predict the two
different types of ENSO events and assess the maximum
lead time of the MME in predicting the distinction between
the ENSO and ENSO Modoki. In Sect. 4, we report pre-
diction skill of regional impacts of two types of ENSO in
the Asia-Pacific. The final section comprises of summary
and discussion.
2 Models and evaluation methods
2.1 The APCC coupled MME system
Seasonal climate hindcasts from 5 coupled models from the
National Centers for Environmental Prediction (NCEP),
the Bureau of Meteorology (BoM), Frontier Research
Center for Global Change (FRCGC), Seoul National Uni-
versity (SNU), and APCC are used in this study. A brief
1 Rasmusson and Carpenter (1982) mostly discussed westward
propagating conventional El Ninos which occurred before the
1980s. McPhaden (1999) has catalogued the post-1980s canonical
El Nino events such as in 1982/1983 and 1997/1998. The distinction
of the post-1980s is that they propagate eastward.2 1986, 1990, 1991, 1992, 1994, 2002, 2004, and 2009.3 1982–1983, 1987–1988, 1997–1998, 2006–2007, and 2010.
H.-I. Jeong et al.
123

description of the models is provided in Table 1. The
NCEP_CFS and the POAMA model data are from the
operational hindcasts of the NCEP in USA and the BoM in
Australia respectively, while the SINTEX-F from FRCGC
in Japan and SNU model data have been obtained through
the CliPAS4 project (Wang et al. 2009; Ham and Kang
2010; Lee et al. 2010). The APCC model is based on the
UCAR CCSM3 (Collins et al. 2006; Kiehl et al. 2006;
Meehl et al. 2006) and has been developed as a seasonal
prediction system at the APCC (Jeong et al. 2008).
In this study, we form the multi-model ensemble using
the simple composite method. In this technique, equal
weights are assigned to the ensemble mean predictions of
each model with the assumption that each model is inde-
pendent. The mean bias from each model is removed by
forming anomalies with respect to the each model’s own
seasonal climatology. In this study, we focus on the boreal
winter (December through February; DJF) for the period
1982–2004. We use the hindcasts of the 5 selected models
for DJF with the initial conditions representing 1 Novem-
ber (one-month lead seasonal prediction), and similar
hindcasts but with initial conditions of 1 August (four-
month lead seasonal prediction).
The observed and reanalyzed datasets used for the
hindcast verification are the Global Precipitation Clima-
tology Project (GPCP) data (Adler et al. 2003), the
National Centers for Environmental Prediction (NCEP)-
Department of Energy (DOE) reanalysis 2 data (Kanamitsu
et al. 2002) for atmospheric variables, and the NOAA
Optimum Interpolation Sea Surface Temperature (OISST)
data (Reynolds et al. 2002), all for the period of
1982–2004.
2.2 Evaluation methods
We first carry out an Empirical Orthogonal Function (EOF)
analysis to identify the observed dominant spatial patterns
of SST anomalies in the tropical Pacific. We then extract
the teleconnection patterns using a linear regression anal-
ysis of the observed circulation, rainfall and temperatures
on the principal components of the top two EOF modes,
which represent the canonical and Modoki ENSO,
respectively (Ashok et al. 2007). In order to examine the
skill in predicting these observed features, we carry out
similar analyses on the hindcasts from the MME. Further,
pattern correlation and composite analysis methods are
employed to investigate the relationship between observa-
tions and coupled MME predictions for SST, rainfall, and
temperature in various regions surrounding the Pacific.
3 Hindcast skills for two types of ENSO
3.1 Prediction of the leading EOF modes of DJF SST
The first two leading EOF modes of the observed DJF
SSTA over the tropical Pacific region (30�S–30�N, 120�E–
60�W) are presented in Fig. 1a, b. The spatial pattern of the
first EOF mode (EOF1) captures the well-known canonical
ENSO pattern with SSTA having the same sign throughout
the equatorial eastern Pacific and with maximum occurring
at about 155�W–115�W (Fig. 1a). The correlation coeffi-
cient between the observed first principal component (PC1)
and Nino3 SST index is 0.985. This EOF1 explains about
55 % of tropical Pacific SST variance for the period of
1982–2004. The second mode (EOF2), which explains
11.5 % of the variance, has maximum near the dateline and
is flanked by opposite signed anomalies in the far eastern
and far western Pacific (Fig. 1b). The EOF2 has been
associated with ENSO Modoki (Ashok et al. 2007; Hendon
et al. 2009). The correlation coefficient between the
Table 1 Description of APCC
one-tier prediction modelsInstitute
(model name)
AGCM
(resolution)
OGCM
(resolution)
Ensemble
member
References
APCC
(APCC-CCSM3)
CAM3
(T85L26)
POP1.3
(gx1v3 L40)
5 Jeong et al. (2008)
BoM
(POAMA)
BAMv3.0d
(T47L17)
ACOM2
(0.5�–1.5�lat 9 2�lon L25)
10 Zhao and Hendon (2009)
FRCGC
(SINTEX-F)
ECHAM4
(T106L19)
OPA8.2
(2�cos(lat) 9 2�lon L31)
9 Luo et al. (2005)
NCEP
(NCEP_CFS)
GFS
(T62L64)
MOM3
(1/3�lat 9 1�lon L40)
15 Saha et al. (2006)
SNU
(SNU)
SNU
(T42L21)
MOM2.2
(1/3�lat 9 1�lon L32)
6 Ham and Kang (2010)
4 http://iprc.soest.hawaii.edu/*jylee/.
5 The area-averaged sea surface temperature anomaly over the region
bounded by (5�S–5�N, 150�W–90�W) is known as Nino3 index,
which is a well-known ENSO index.
Assessment of the APCC coupled MME suite
123

observed second principal component (PC2) and the El
Nino Modoki index is 0.866.
The ability of the MME to capture the distinctive spatial
patterns of these two types of ENSO is assessed by per-
forming a similar EOF analysis on the MME hindcasts at 1-
and 4-month lead time, respectively. At 1-month lead time,
the MME well captures the spatial patterns of the first two
leading EOF modes with high fidelity (Fig. 1c, d). The
spatial pattern correlation between the observed and pre-
dicted eigenvectors is 0.96 for the EOF1 and 0.91 for the
EOF2. However, the variance explained by the EOF1 for
MME is 75.2 %, indicating that the MME prediction
explains a significantly larger amount of the variance than
the observed counterpart. The variance explained by the
EOF2 from the MME is 8.6 %, indicating that the MME
does not adequately capture the observed Modoki ENSO
variance, despite being able to reproduce its spatial pattern
reasonably well.
The time series of the corresponding normalized PC1
and PC2 for 1- and 4-month lead time are presented in
Fig. 2. The PC1 (PC2) from observations is well correlated
at 0.94 (0.86) with that from MME hindcasts at 1-month
lead. These correlations are statistically significant at 99 %
confidence level from two-tailed Student’s t test. It can be
discerned that the MME well predicts both the spatial
structure and temporal behavior of these leading two EOFs
of SST. Because EOF1 is associated with canonical ENSO
(e.g. correlation of observed PC1 with Nino3 SST index is
0.98) and EOF2 is associated with ENSO Modoki (corre-
lation of observed PC2 with the El Nino Modoki index is
Fig. 1 First two modes of spatial patterns of EOFs for (a, b) observed
sea surface temperature anomalies over the tropical Pacific (30�S–
30�N, 120�E–60�W) during the period of 1982–2004. c and d Same
as a and b, except for the MME predicted sea surface temperature
anomalies at 1-month lead time. Pattern correlations between the
observed and MME predicted spatial patterns of each EOF mode are
also given. e and f Same as c and d respectively, but at 4-month lead
time
6 The El Nino Modoki index or EMI is defined as EMI =
[SSTA]C - 0.5[SSTA]E - 0.5[SSTA]W, where the square bracket
with a subscript represents the area-mean SSTA, averaged over one of
the three regions specified as the central (C: 165�E–140�W, 10�S–
10�N), eastern (E: 110�W–70�W, 15�S–5�N), and western (W:
125�E–145�E, 10�S–20�N).
H.-I. Jeong et al.
123

0.86), we can infer that the MME is able to predict the
important differences in SSTA between cold tongue and
ENSO Modoki events, at least at 1-month lead time.
At 4-month lead, the MME is seen to more or less retain
the high fidelity in capturing the spatial pattern of the EOF1
(Fig. 1e). The spatial pattern correlation between the
observed and predicted eigenvectors is 0.94, slightly less
than the corresponding value at 1-month lead. The spatial
pattern of the EOF2 at 4-month lead (Fig. 1f) indicates a
weakened central tropical Pacific loading which shifts by
about 15� to the west as compared to its position at
1-month lead. We also see an intensified eastern Pacific
loading. The variance explained by the EOF2 from the
MME, and the pattern correlation with the corresponding
EOF2 from observations, have further reduced to 7.6 %
and 0.64 respectively, indicating that the ability of the
MME deteriorates further in capturing the Modoki asso-
ciated variance and SSTA pattern at a 4-month lead. The
PC1 (PC2) from observations is correlated at 0.93 (0.7)
with that from MME hindcasts at 4-month lead time
(Fig. 2). Even at 4-month lead time, the correlations are
statistically significant at 99 % confidence level from two-
tailed Student’s t test.
Also, we have examined the performance of individual
models for the dominant spatial patterns and temporal
behavior of the first two leading EOF modes of the SSTAs
at 1- and 4-month lead time in Fig. 3, and compared with
those of MME prediction. Though the prediction skills of
some individual models show a slightly higher than those
of MME, it can be seen that, on the whole, the skills of
MMEs, such as the spatial (temporal) correlations of EOF2
pattern (PC2 time series) of SST anomalies at 1-month
lead, are superior to those of the individual models as well
as the mean skills of individual models.
3.2 Prediction of the two major types of ENSO
Wang et al. (2009) demonstrated that seven coupled
models’ MME is capable of predicting the eastern-Pacific
(EP) type ENSO with a high fidelity for the 21 years of
1981–2001 and its anomaly correlation skill for monthly
Nino 3.4 SST index reaches 0.77 and 0.81 at a 6-month
lead with May 1st and November 1st initial condition,
respectively. In this study, we examine the feasibility for
the APCC Coupled MME in predicting the two types of
ENSO at a four-month lead for DJF mean (four-month for
December mean and six-month lead for February mean).
Figure 4 presents time series of DJF Nino3 and EMI from
observations and one- and four-month lead MME predic-
tion. The coupled MME well predicts both indices even at
four-month lead with a high fidelity but better-captures
Nino3 index than EMI, particularly at long lead. The
temporal correlation coefficient for DJF Nino3 (EMI)
between observation and MME prediction is 0.94 (0.91)
(a)
(b)
Fig. 2 Principal component
(PCs) time series of the first two
EOF modes of sea surface
temperature anomalies over the
tropical Pacific (30�S–30�N,
120�E–60�W) during the period
of 1982–2004 from the
observations (black), from
1-month lead time MME
predictions (red) and from
4-month lead time MME
predictions (blue). Time series
are normalized by their
respective SD
Assessment of the APCC coupled MME suite
123

and 0.91 (0.80) for one- and four-month lead prediction,
respectively. Interestingly, while the 1-month lead skills
fall slightly below the persistence skill of 0.97 (0.94) for
DJF Nino3 (EMI) at 1-month lead, the MME skills are
higher than the corresponding persistence skill of 0.81
(0.79) for 4-month lead. The results are similar to that
reported for a few models in a recent study (Jin et al. 2008).
Since it is important for models to also distinctively
capture the distribution of SST anomalies over the Tropical
Pacific associated with canonical El Nino and Modoki El
Nino (Hendon et al. 2009), composite analysis is applied
using strong events of the two types of El Nino; following
Weng et al. (2009), we choose the three strongest El Ninos
(1982–1983, 1987–1988 and 1997–1998) and the three
strongest El Nino Modoki events (1994–1995, 2002–2003
and 2004–2005) during the study period. Larger amplitude
of the SSTA in the eastern Pacific for the El Nino events
and smaller amplitude in the eastern Pacific for the El Nino
Modoki events are seen (Fig. 5) to be maintained in the
forecasts up to a lead time of 4 months. Pattern correlation
(a) (b)Fig. 3 Distribution of the
performances of the MME,
individual models against the
first two observed EOF modes
of SSTAs over the tropical
Pacific (30�S–30�N, 120�E–
60�W) during the period of
1982–2004. The left panel is for
the pattern correlation
coefficients of the eigenvector,
and the right panel is for the
temporal correlation coefficients
of the corresponding principal
component. The skills for
1-month (4-month) lead are
denoted with red (blue)
(a)
(b)
Fig. 4 Time series of seasonal
mean anomalies of a Nino3 and
b EMI indices from
observations (black) and the
MME predictions at 1 (red) and
4 (blue) month lead time.
Temporal correlations between
the observed and MME
predicted time series are also
given at the upper right.Anomalies are normalized by
the SD of their indices
H.-I. Jeong et al.
123
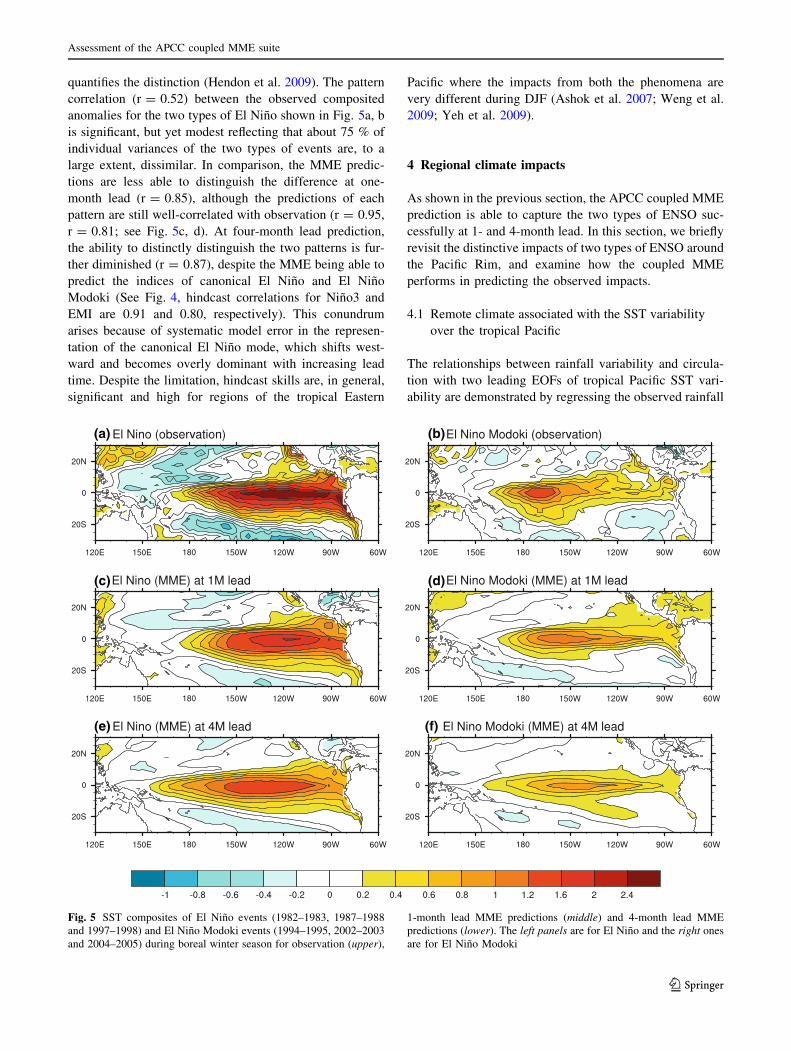
quantifies the distinction (Hendon et al. 2009). The pattern
correlation (r = 0.52) between the observed composited
anomalies for the two types of El Nino shown in Fig. 5a, b
is significant, but yet modest reflecting that about 75 % of
individual variances of the two types of events are, to a
large extent, dissimilar. In comparison, the MME predic-
tions are less able to distinguish the difference at one-
month lead (r = 0.85), although the predictions of each
pattern are still well-correlated with observation (r = 0.95,
r = 0.81; see Fig. 5c, d). At four-month lead prediction,
the ability to distinctly distinguish the two patterns is fur-
ther diminished (r = 0.87), despite the MME being able to
predict the indices of canonical El Nino and El Nino
Modoki (See Fig. 4, hindcast correlations for Nino3 and
EMI are 0.91 and 0.80, respectively). This conundrum
arises because of systematic model error in the represen-
tation of the canonical El Nino mode, which shifts west-
ward and becomes overly dominant with increasing lead
time. Despite the limitation, hindcast skills are, in general,
significant and high for regions of the tropical Eastern
Pacific where the impacts from both the phenomena are
very different during DJF (Ashok et al. 2007; Weng et al.
2009; Yeh et al. 2009).
4 Regional climate impacts
As shown in the previous section, the APCC coupled MME
prediction is able to capture the two types of ENSO suc-
cessfully at 1- and 4-month lead. In this section, we briefly
revisit the distinctive impacts of two types of ENSO around
the Pacific Rim, and examine how the coupled MME
performs in predicting the observed impacts.
4.1 Remote climate associated with the SST variability
over the tropical Pacific
The relationships between rainfall variability and circula-
tion with two leading EOFs of tropical Pacific SST vari-
ability are demonstrated by regressing the observed rainfall
(a) (b)
(d)(c)
(e) (f)
Fig. 5 SST composites of El Nino events (1982–1983, 1987–1988
and 1997–1998) and El Nino Modoki events (1994–1995, 2002–2003
and 2004–2005) during boreal winter season for observation (upper),
1-month lead MME predictions (middle) and 4-month lead MME
predictions (lower). The left panels are for El Nino and the right ones
are for El Nino Modoki
Assessment of the APCC coupled MME suite
123

and 850 hPa circulation anomalies on to each of the two
standardized PCs (Fig. 6a, b). During a canonical El Nino7
(Fig. 6a), there are positive rainfall anomalies over ITCZ in
the eastern and central Pacific, flanked to the west by a
broad horse-shoe shaped negative rainfall anomaly cen-
tered in the western tropical Pacific that extends eastward
into the northern and southern Pacific. Anomalously dry
conditions are seen in the SPCZ, Maritime Continent,
western tropical Pacific and Philippines under the apparent
influence of an anomalous low level anticyclone (in
agreement with Weng et al. 2009). Below normal rainfall
conditions over most of Australia are seen under influence
of anomalous anticyclone. An anomalously strong winter
monsoon rain band extends from the regions of eastern
coastal China to the southern ocean part of Japan. The
eastern North Pacific is under the influence of an anom-
alous cyclonic circulation (150�W, 50�N). Over the trop-
ical South America, there is an anomalously strong high
pressure (Figure not shown), which induces drought con-
ditions. These unique features are already documented in
earlier studies such as Ropelewski and Halpert (1987,
1989); Diaz et al. (2001); Saji and Yamagata (2003), and
Ashok et al. (2007). In contrast, during the Modoki El
Nino (Fig. 6b), anomalously wet conditions occur to the
west of the dateline (e.g., Larkin and Harrison 2005b;
Ashok et al. 2007; Weng et al. 2009). The winter monsoon
in central eastern China is anomalously weak, whereas it is
strong during canonical El Nino. The anomalous rainfalls
associated with the two tropical Pacific phenomena during
this season are also opposite to one another in Japan. It is
also noteworthy that there is an anomalously weak
cyclonic circulation over the eastern parts of Brazil,
apparently causing anomalously wet conditions over the
region of interest. Anomalously positive rainfall is seen
(Fig. 6b) in the southeastern regions of Australia associ-
ated with El Nino Modoki events as opposed to the
anomalously dry conditions during canonical El Nino
events (Fig. 6a). These findings agree with Weng et al.
(2009).
We now assess how well the MME predicts the afore-
mentioned rainfall and circulation features associated with
two types of El Nino by carrying out a regression analysis
similar to that for observations. The regression pattern of
the hindcast rainfall and 850 hPa circulation onto PC1 at
1-month lead time is shown in Fig. 6c. The MME predic-
tion replicates the observed features, in general, well. For
instance, the anomalously strong monsoon rainfall in East
Asia, anomalously wet (dry) conditions over North
(tropical South) America, and less than normal rainfall in
northern Australia are well represented. However, the
unrealistic anomalously wet conditions to the west of the
date line through the equatorial maritime continents in the
predictions, which we attribute to the systematic model
bias in the representation of the canonical El Nino, are
endemic in all of the individual coupled models. At
4-month lead time (Fig. 6e), the regression patterns of the
rainfall and atmospheric circulation are very similar to
those at 1-month lead time. The monsoon band over East
Asia becomes narrower and weaker, and southeastern
portions of Australia now show anomalously dry condition.
The observed dipole of anomalously wet and dry rainfall
anomalies over the equatorial central Pacific associated
with the El Nino Modoki is well predicted retrospectively
by the 1- and 4-month lead predictions (Fig. 6b, d, f).
Moreover, the MME predictions at both lead times predict
the anomalously weakened winter monsoon from Sumatra
to the southern Japan well. However, the observed anom-
alously wet conditions in northern Japan are not correctly
simulated. There are further limitations in predicting the
atmospheric circulation and rainfall anomalies in the
middle latitudes (30�S–60�S) of southern hemisphere,
particularly the anomalously wet conditions associated
with the El Nino Modoki in the eastern region of Australia,
and New Zealand.
The observed patterns of anomalous 850 hPa tempera-
ture and 500 hPa geopotential height associated with an El
Nino comprise of warm temperature anomalies (Fig. 7a) in
the eastern equatorial Pacific, Canada and northern part of
USA, most of East Asia including Korea and Japan, and
west and east edge of Australia; On the other hand, most of
the North and South Pacific Ocean and southern North
America are covered by anomalously cold temperature
signals. The 1- and 4-month lead MME predictions also
reasonably represent the main features such as the dipole
temperature pattern over tropical Pacific, and north-south
temperature and 500 hPa geopotential height anomalies
contrast over North America in El Nino years (Fig. 7c, e).
The El Nino Modoki events are associated with a tri-
pole-like temperature anomaly pattern at the lower level in
the tropical Pacific (Fig. 7b), The corresponding tempera-
ture anomalies outside the tropics are also very different
from those during an El Nino, such as the anomalously
warm region from northern Japan through the west coast of
North America, flanked by the very cold anomalies over
the northeastern North America. The MME captures
(Fig. 7d, f) the west-east temperature anomaly contrast
over North America associated with El Nino Modoki
events at 1-month as well as 4-month lead time. However,
the predicted anomalous temperature signature over the
Gulf of Mexico and central and southeast Australia is
unrealistic.
7 From linear considerations associated with the regression method,
we can expect that the impacts of La Nina (La Nina Modoki) are
opposite to those of El Nino (El Nino Modoki). As it can be seen, the
limitation stems from the fact that the non-linearity in the impacts is
not addressed.
H.-I. Jeong et al.
123

4.2 Forecast skills for regional impacts
Previous studies have demonstrated that ENSO is the major
predictability source for regional climate (Wang et al.
2008, 2009; Lee et al. 2010, 2011b; and many others) Thus,
it is of importance for coupled models to be able to capture
regional impacts of ENSO. In order to quantify the skills of
the MME in predicting the impacts of the canonical and
Modoki ENSO at 1- and 4-month lead times, we present
(Fig. 8a) the pattern correlations between the observed and
predicted rainfall associated with canonical and Modoki
ENSO, for the four different regions surrounding tropical
Pacific, namely, Australasia8 (45�S–10�S, 110�E–180�E),
East Asia (20�N–60�N, 90�E–150�E), North America
(20�N–60�N, 140�W–50�W), and tropical South America
(a) (b)
(d)
(f)(e)
(c)
Fig. 6 Regression patterns of a, b observed anomalous wind
(streamline; unit: m/s) at 850 hPa and rainfall anomalies (shading;
unit: mm d-1) based on PC time series (see Fig. 2) of the first two
EOF modes for observed sea surface temperature anomalies. c and d,
and e and f Same as a and b, except for the MME prediction at 1- and
4-month lead time, respectively. The stippled areas represent
significant regression coefficients at the 95 % confidence level
8 Australasia is defined by a region of Oceania comprising Australia,
New Zealand, and neighboring islands in the southwest Pacific Ocean.
Assessment of the APCC coupled MME suite
123

(15�S–10�N, 80�W–35�W). The corresponding skills in
predicting the temperature at 850 hPa are presented in
Fig. 8b. Figure 8a, b indicate that at 1-month lead time the
predictive skills of the MME are significantly better in
predicting the ENSO-associated impacts as compared to
those for impacts of ENSO Modoki, except for East Asia.
Specifically, the pattern correlation coefficient for rainfall
associated with the canonical ENSO reaches above 0.8
(significant at 90 % confidence level for two-tailed Stu-
dent’s t test; also see Table 2) for these three regions. In
contrast, for East Asia, the ENSO Modoki-associated
impacts are better predicted (see Tables 2, 3) at both 1- and
4-month lead. In general, the 4-month lead MME predic-
tion for rainfall and 850 hPa temperature anomaly exhibits
a poorer performance than 1-month lead MME predictions.
4.3 Performance of MME versus that of the individual
models
In order to compare the performance in prediction of MME
and five individual models for the teleconnection patterns
which are regressed on their corresponding principal
(a) (b)
(d)(c)
(e) (f)
Fig. 7 Same as Fig. 6, except for the regressed patterns of temperature anomalies at 850 hPa (shading; unit: K) and anomalous 500 hPa
geopotential heights (contour; unit: m). Contour interval is 20 m
H.-I. Jeong et al.
123

components, we have investigated the prediction skills of
MME and five individual models for regional impact for
the regressed rainfall and temperature at 850 hPa based on
the first two leading EOF modes of the observed and pre-
dicted SSTA at 1- and 4-month lead time over the above-
mentioned four different regions in Fig. 9. The mean of the
prediction skills of individual models also are calculated.
From the pattern correlations of the regressed rainfall on
PC1 (PC2) of SST anomalies related to ENSO (ENSO
Modoki) over the regions of Australasia, North America
and Tropical South America (East Asia, Tropical South
America) at 1-month lead, and those on PC1 (PC2) over the
North America and Tropical South America (North
America) at 4-month lead, in general, we can find that the
prediction performances of MMEs are better than those of
the individual models.
4.4 Limitations of the MME and possible sources
of forecast error
The velocity potential distribution at 200 hPa in the tropics
contains information concerning the overall intensity of the
circulations and reflects features of low-level convergence
and divergence (Tanaka et al. 2004; Weng et al. 2007; Lee
Fig. 8 a Pattern correlation
coefficients between regressed
patterns of observed and
predicted rainfall based on PC1
(grey bars) and PC2 (whitebars) of two leading EOF
modes for observed and MME
predicted sea surface
temperature anomalies at 1- and
4-month lead time over the four
regions of the Australasia
(45�S–10�S, 110�E–180�E),
East Asia (20�N–60�N, 90�E–
150�E), North America (20�N–
60�N, 140�W–50�W), and
tropical South America (15�S–
10�N, 80�W–35�W). b Same as
a, except for the temperature at
850 hPa
Assessment of the APCC coupled MME suite
123

et al. 2011a). In this context, the observed anomalous
200 hPa velocity potential divergent wind projected on to
the corresponding indices of canonical and Modoki ENSO
is presented in Fig. 10a, b, respectively. Figure 10a indi-
cates that a canonical El Nino is associated with an
anomalous divergence center is over the central and eastern
equatorial tropics, while and a secondary upper level mass
source is found over the southern part of North America
(Fig. 10a). Anomalous convergence is seen over the whole
area of the western Pacific including Philippines and
Indonesia. There is also another anomalous convergence
zone over the northwest Pacific, centered at 40�N and
160�E. The APCC coupled MME prediction suite, while
being able to simulate (Fig. 10c, e) the general features at
1- and 4-month lead times, cannot adequately capture the
secondary convergence zone in the northwest Pacific. That
may the reason for the relatively limited predictive skills
for rainfall in this region (see Figs. 6c, e and 8a).
Associated with an El Nino Modoki, an anomalous upper
level divergence zone, centered over the central tropical
Pacific and covering tropical western Pacific and Australia
(Fig. 10b) is seen, flanked by a zone of convergence over
the eastern tropical Pacific east of 150�W and also covering
significant portions of Americas through midlatitude. The
anomalous divergence from the main mass source at central
tropical Pacific converges into a prominent upper level
convergence center over the East Asia and descends over
the South China Sea, suppressing the local convection as
suggested by Weng et al. (2009) (Figure is not shown). The
1-month lead MME prediction is not so successful in cap-
turing the upper atmospheric circulation in a few regions
such as part of the Maritime continent, the western part of
Australia and adjoining Indian Ocean (Fig. 10d). The pre-
diction at 4-month lead time has a difficulty to capture, in
addition to the above features, upper level circulation over
Central and South Americas. The results are in conforma-
tion with Fig. 8a that shows low skills for precipitation over
Australasia and Tropical South America.
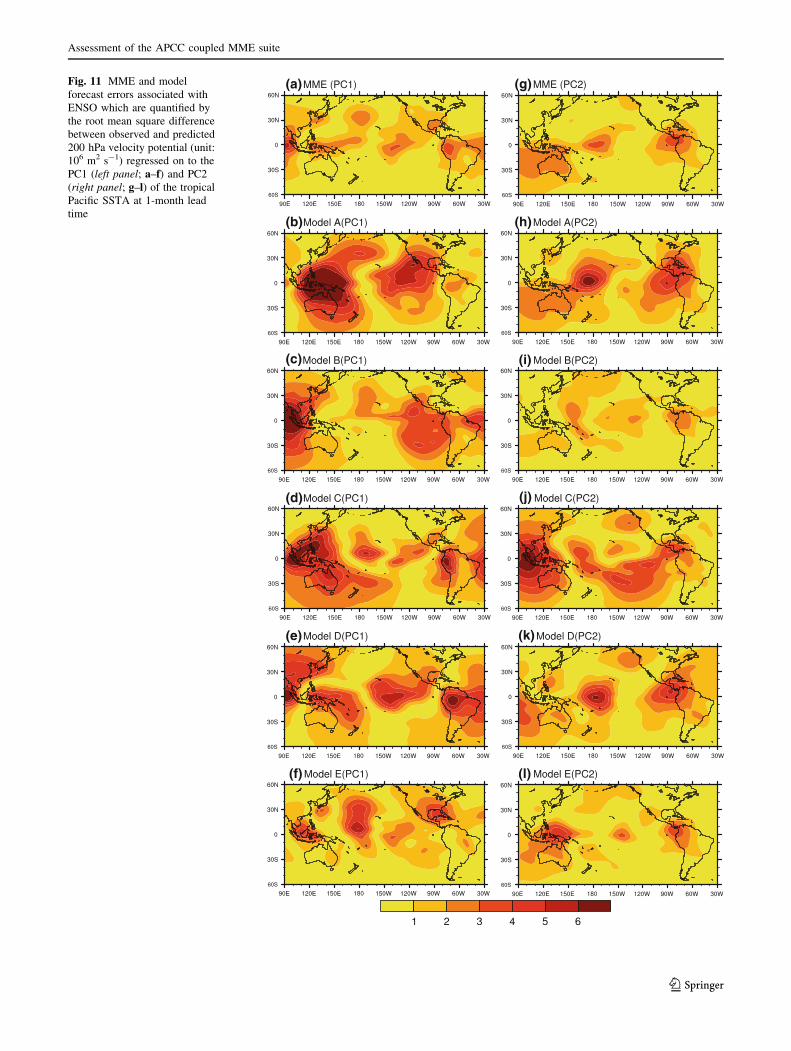
Now, we shall try to briefly examine the inter-model
spread that may have contributed to the above limitations
(see Figs. 11, 12). The spread for any model in relation to
the contributions to the forecast errors associated with
ENSO, for example, is quantified by the root mean square
difference between observed and the predicted 200 hPa
velocity potential that is regressed on to the principal
component of the relevant EOF of the tropical Pacific
SSTA. We find that it is difficult to simulate the secondary
convergence zone over the northwest Pacific in not only the
regressed pattern of MME, but also those of most of indi-
vidual models based on PC1 as compared to those based on
PC2 from model spreads as forecast errors at 1- and
4-month lead time. Further, the both MME and individual
Table 2 Pattern correlation coefficients and confidence level between
observed and predicted regressed rainfall patterns on each time series
of PC1 for observation and MME prediction at 1- and 4-month lead
time from Fig. 2, and those on each time series of PC2 from Fig. 2
over the four regions of Australasia (45�S–10�S, 110�E–180�E), East
Asia (20�N–60�N, 90�E–150�E), North America (20�N–60�N,
140�W–50�W), and tropical South America (15�S–10�N, 80�W–
35�W)
Australasia East Asia North America Tropical South America
PC1 PC2 PC1 PC2 PC1 PC2 PC1 PC2
1M
Pattern correlation 0.93 0.34 0.47 0.76 0.88 0.73 0.8 0.51
Confidence level (%) 98 70 70 90 95 90 90 80
4M
Pattern correlation 0.76 0.16 0.31 0.65 0.83 0.65 0.81 -0.31
Confidence level (%) 90 65 70 85 95 85 90 70
Table 3 Same as Table 2, except for temperature at 850 hPa
Australasia East Asia North America Tropical South America
PC1 PC2 PC1 PC2 PC1 PC2 PC1 PC2
1M
Pattern correlation 0.78 0.55 0.44 0.72 0.84 0.77 0.91 0.9
Confidence level (%) 90 80 75 85 95 90 95 95
4M
Pattern correlation 0.7 0.42 0.45 0.27 0.8 0.8 0.46 0.61
Confidence level (%) 85 75 75 70 90 90 75 85
H.-I. Jeong et al.
123

(a) (b)
(c)
(e) (f)
(g) (h)
(d)
Fig. 9 Distribution of the
pattern correlation coefficients
between regressed patterns of
observation and model
simulations on each time series
of the first two EOF modes for
observed and predicted SSTAs
at 1-month (red) and 4-month
(blue) lead time over the four
regions of the Australasia
(45�S–10�S, 110�E–180�E),
East Asia (20�N–60�N, 90�E–
150�E), North America (20�N–
60�N, 140�W–50�W), and
tropical South America (15�S–
10�N, 80�W–35�W). The leftpanels are for rainfall and the
right panels are for 850 hPa
temperature
Assessment of the APCC coupled MME suite
123

model simulations associated with the ENSO Modoki
indicate large model spread over part of the Maritime
continent, the western part of Australia and adjoining Indian
Ocean at 1-month lead time, and over Central and South
America as well as the abovementioned regions at 4-month
lead time. Also, these figures sufficiently indicate the rela-
tively limitations in prediction of ENSO-associated rainfall
with over the East Asia and that associated with ENSO
Modoki over the Australasia at 1- and 4-month lead time;
similar limitations to capture the ENSO Modoki rainfall
over the tropical South America at 4-month lead is endemic
to all the models (see Figs. 8a, 12).
5 Summary and discussion
The purpose of this work is to evaluate the ability of the
APCC coupled MME suite in predicting the two types of
(a) (b)
(d)
(e) (f)
(c)
Fig. 10 Regression patterns of observed anomalous 200 hPa diver-
gent wind (arrow; unit: ms-1) and velocity potential (shading; unit:
106 m2 s-1) based on a PC1 and b PC2 of two leading EOF modes for
observed sea surface temperature anomalies. c and d, and e and
f Same as a and b, except for the MME prediction at 1- and 4-month
lead time, respectively. The stippled areas represent significant
regression coefficients at the 95 % confidence level
H.-I. Jeong et al.
123
(a)
(b)
(c)
(d)
(e)
(f) (l)
(k)
(j)
(i)
(h)
(g)Fig. 11 MME and model
forecast errors associated with
ENSO which are quantified by
the root mean square difference
between observed and predicted
200 hPa velocity potential (unit:
106 m2 s-1) regressed on to the
PC1 (left panel; a–f) and PC2
(right panel; g–l) of the tropical
Pacific SSTA at 1-month lead
time
Assessment of the APCC coupled MME suite
123

(a)
(b)
(c)
(d)
(e)
(f) (l)
(k)
(j)
(i)
(h)
(g)Fig. 12 Same as Fig. 11,
except for 4-month lead time
H.-I. Jeong et al.
123

ENSO, namely cold tongue ENSO and ENSO Modoki
during the boreal winter, and also to document the skills of
the respective climate impacts of these Pacific climate
drivers at lead time of 1–4 months, or in other words,
ahead of 1 to 2 seasons.
The current work demonstrates that the APCC coupled
MME prediction can simulate the ENSO and ENSO
Modoki events, represented by the EOF1 and EOF2 from
an EOF analysis of tropical Pacific SST anomalies, rea-
sonably well. The spatial pattern correlations between
observation and MME prediction at 1-month lead time are
0.96 for the ENSO and 0.91 for the ENSO Modoki, even
though the total variance of EOF1 is much larger than that
for observation, while that associated with the EOF2 is
slightly under-predicted. At 4-month lead, the variance
explained by the predicted EOF2 is almost less than that
from observations by about 30 %.
When evaluating the local climate predictability over 4
specific regions, the MME prediction captures the dis-
tinguishing features such as the strong winter monsoon
over East Asia, the severe drought condition and above
than normal temperature over Australia, the wet and cold
climate over the whole area of USA, and the anomalously
dry condition over South America associated with the
canonical ENSO reasonably well. However, there are
limitations in predicting the ENSO Modoki-associated
rainfall signatures over Australasia and tropical South
America. Interestingly, the skills of the MME in pre-
dicting the ENSO Modoki-associated impacts over East
Asia and North America are slightly higher or similar as
compared to those related to the canonical ENSO impacts.
To find out the reason, we did regression analysis of the
200 hPa velocity potential and related divergent wind to
see the upper level atmospheric circulation. In El Nino
years, the MME prediction captures the observed upper
level divergence (convergence) over the equatorial Pacific
(East Asia and Australia) well. On the other hand, while
the coupled MME prediction can simulate the El Nino
Modoki-associated upper level convergence over East
Asia and the divergence along the west coast of North
America as well as the convergence over the eastern
North America, it cannot reproduce the teleconnection
paths from equatorial Pacific to Australasia and South
America appropriately.
The APCC coupled MME can also predict the ENSO and
ENSO Modoki indices up to 4-month lead time. Hendon
et al. (2009) have also found similar prediction skills for the
POAMA model for the target season of boreal autumn.
Importantly, the MME skills beat the persistence for the
4-month lead. However, to finely distinguish the anomaly
distribution associated with ENSO Modoki in the central
tropical Pacific from that during the canonical ENSO pat-
tern in the forecasts is an issue, and may be potential reason
in limited replication of the teleconnections in parts of the
Southern Hemisphere. Further development of higher res-
olution coupled models with improved the dynamical and
physical processes, and further improvement in the data
assimilation methods will hopefully improve the skills in
predicting the two phenomena and their teleconnections
properly within a reasonable lead time.
Though we used simple composite method to form the
MME in this study, the application of a variety of the
statistical MME methods (Krishnamurti et al. 2000; Yun
et al. 2005; Kug et al. 2008) may also be useful in better
prediction of the two phenomena. In addition, the climate
filter method (Lee et al. 2011a), to separate better per-
forming models, using the relative dynamical diagnostic
performance within the model itself may contribute to
further improving the seasonal prediction skills of the
teleconnections from the tropical Pacific.
Acknowledgments The authors appreciate the participating insti-
tutes of the APCC coupled MME prediction system for providing the
hindcast experiment data. Discussion with Prof. B. Wang is
acknowledged. J.-B. Ahn was supported by the Korea Meteorological
Administration Research and Development Program under Grant
CATER 2012-3083. K. Ashok acknowledges the support of Prof.
B. N. Goswami, Director, IITM (fully funded by MoES, Government
of India), and the MoES for the SAPRISE support under the MoES-
NERC grant. Views expressed herein wholly are of the authors and do
not reflect the views of the organizations they are affiliated to.
References
Adler RF, Huffman GJ, Chang A, Ferraro R, Xie P, Janowiak J,
Rudolf B, Schneider U, Curtis S, Bolvin D, Gruber A, Susskind
J, Arkin P, Nelkin E (2003) The version-2 global precipitation
climatology project (GPCP) monthly precipitation analysis
(1979–present). J Hydrometeorol 4:1147–1167
Ashok K, Behera S, Rao AS, Weng HY, Yamagata T (2007) El Nino
Modoki and its teleconnection. J Geophys Res 112:C11007. doi:
10.1029/2006JC003798
Ashok K, Tam CY, Lee WJ (2009a) ENSO Modoki impact on the
Southern Hemisphere storm track activity during extended
austral winter. Geophys Res Lett 36:L12705. doi:10.1029/2009
GL038847
Ashok K, Iizuka S, Rao SA, Saji NH, Lee WJ (2009b) Processes and
boreal summer impacts of the 2004 El Nino Modoki: an AGCM
study. Geophys Res Lett 36:L04703. doi:10.1029/2008GL
036313
Cai W, Cowan T (2009) La Nina Modoki impacts Australia autumn
rainfall variability. Geophys Res Lett 36:L12805. doi:10.1029/
2009GL037885
Collins WD, Bitz CM, Blackmon ML, Bonan GB, Bretherton CS,
Carton JA, Chang P, Doney SC, Hack JJ, Henderson TB, Kiehl
JT, Large WG, McKenna DS, Santer BD, Smith RD (2006) The
community climate system model version 3 (CCSM3). J Clim
19(11):2122–2143
Diaz HF, Hoerling MP, Eischeid JK (2001) ENSO variability,
teleconnections and climate change. Int J Climatol 21:1845–
1862
Donguy JR, Dessier A (1983) El Nino-like events observed in the
tropical Pacific. Mon Weather Rev 111:2136–2139
Assessment of the APCC coupled MME suite
123

Fu C, Diaz H, Fletcher J (1986) Characteristics of the response of sea
surface temperature in the central Pacific associated with warm
episodes of the Southern Oscillation. Mon Weather Rev
114:1716–1739
Ham YG, Kang IS (2010) Improvement of seasonal forecasts with
inclusion of tropical instability waves on initial conditions. Clim
Dyn. doi:10.1007/s00382-010-0743-0
Hendon HH, Lim E, Wang G, Alves O, Hudson D (2009) Prospects
for predicting two flavors of El Nino. Geophys Res Lett
36:L19713. doi:10.1029/2009GL040100
Jeong HI, Ashok K, Song BG, Min YM (2008) Experimental 6-month
Hindcast and forecast simulation using CCSM3. APCC 2008
Technical Report, APEC Climate Center
Jin EK, Kinter JL III, Wang B, Park CK, Kang IS, Kirtman BP, Kug
JS, Kumar A, Luo JJ, Schemm J, Shukla J, Yamagata T (2008)
Current status of ENSO prediction skill in coupled O-A models.
Clim Dyn 31:647–664. doi:10.1007/s00382-008-0397-3
Kanamitsu M, Kumar A, Juang HMH, Wang W, Yang F, Schemm J,
Hong SY, Peng P, Chen W, Ji M (2002) NCEP dynamical
seasonal forecast system 2000. Bull Am Meteorol Soc 83:1019–
1037
Kao HY, Yu JY (2009) Contrasting eastern-Pacific and central-Pacific
types of ENSO. J Clim 22:615–632. doi:10.1175/2008JCLI
2309.1
Kiehl JT, Shields CA, Hack JJ, Collins WD (2006) The climate
sensitivity of the community climate system model version 3
(CCSM3). J Clim 19:2584–2596
Krishnamurti TN, Kishtawal CM, Shin DW, Williford CE (2000)
Multi-model superensemble forecasts for weather and seasonal
climate. J Clim 13:4196–4216. doi:10.1175/1520-0442(2000)
013\4196:MEFFWA[2.0.CO;2
Kug JS, Lee JY, Kang IS (2008) Systematic error correction of
dynamical seasonal prediction using a stepwise pattern projec-
tion method. Mon Weather Rev 136:3501–3512. doi:10.1175/
2008MWR2272.1
Kug JS, Jin FF, An SI (2009) Two types of El Nino events: cold
tongue El Nino and warm pool El Nino. J Clim 22:1499–1515
Kug JS, Ahn MS, Sung MK, Yeh SW, Min HS, Kim YH (2010)
Statistical relationship between two types of El Nino events and
climate variation over the Korean Peninsula. Asia Pac J Atmos
Sci 46:467–474. doi:10.1007/s13143-010-0027-y
Larkin NK, Harrison DE (2005a) On the definition of El Nino and
associated seasonal average U.S. weather anomalies. Geophys
Res Lett 32:L13705. doi:10.1029/2005GL022738
Larkin NK, Harrison DE (2005b) Global seasonal temperature and
precipitation anomalies during El Nino autumn and winter.
Geophys Res Lett 32:L16705. doi:10.1029/2005GL022860
Lee JY, Wang B, Kang IS, Shukla J, Kumar A, Kug JS, Schemm J,
Luo JJ, Yamagata T, Fu X (2010) How are seasonal prediction
skills related to models’ performance on mean state and annual
cycle? Clim Dyn 35:267–283. doi:10.1007/s00382-010-0857-4
Lee DY, Ashok K, Ahn JB (2011a) Toward enhancement of
prediction skills of multimodel ensemble seasonal prediction: a
climate filter concept. J Geophys Res 116:D06116. doi:10.1029/
2010JD014610
Lee JY, Wang B, Ding Q, Ha KJ, Ahn JB, Kumar A, Stern B, Alves O
(2011b) How predictable is the northern hemisphere summer
upper-tropospheric circulation? Clim Dyn 37:1189–1203. doi:
10.1007/s00382-010-0909-9
Lim EP, Hendon HH, Hudson D, Wang G, Alves O (2009) Dynamical
forecast of inter–El Nino variations of tropical SST and
Australian spring rainfall. Mon Weather Rev 137:3796–3810.
doi:10.1175/2009MWR2904.1
Luo JJ, Masson S, Behera S, Shingu S, Yamagata T (2005) Seasonal
climate predictability in a coupled OAGCM using a different
approach for ensemble forecasts. J Clim 18:4474–4497
McPhaden MJ (1999) Genesis and evolution of the 1997–1998 El
Nino. Science 283:950–954
Meehl GA, Arblaster JM, Lawrence DM, Seth A, Schneider EK,
Kirtman BP, Min D (2006) Monsoon regimes in the CCSM3.
J Clim 19:2482–2495
Mo KC (2010) Interdecadal modulation of the impact of ENSO on
precipitation and temperature over the United States. J Clim
23:3639–3656. doi:10.1175/2010JCLI3553.1
Pradhan PK, Preethi B, Ashok K, Krishnan R, Sahai AK (2011)
Modoki, Indian Ocean Dipole, and western North Pacific
typhoons: Possible implications for extreme events. J Geophys
Res 116:D18108. doi:10.1029/2011JD015666
Rasmusson EM, Carpenter TH (1982) Variation in tropical sea
surface temperature and surface wind fields associated with
Southern Oscillation/El Nino. Mon Wea Rev 110:354–384
Ratnam JV, Behera SK, Masumoto Y, Takahashi K, Yamagata T(2010) Pacific Ocean origin for the 2009 Indian summer
monsoon failure. Geophys Res Lett 37:L07807. doi:
10.1029/2010GL042798
Reynolds RW, Rayner NA, Smith TM, Stokes DC, Wang W (2002)
An improved in situ and satellite SST analysis for climate.
J Clim 15:1609–1625
Ropelewski CF, Halpert MS (1987) Global and regional scale
precipitation patterns associated with the El Nino/Southern
Oscillation. Mon Weather Rev 115:1606–1626
Ropelewski CF, Halpert MS (1989) Precipitation patterns associated
with the high index phase of the Southern Oscillation. J Clim
2:268–284
Saha S, Nadiga S, Thiaw C, Wang J, Wang W, Zhang Q, Van den
Dool HM, Pan HL, Moorthi S, Behringer D, Stokes D, Pena M,
Lord S, White G, Ebisuzaki W, Peng P, Xie P (2006) The NCEP
climate forecast system. J Clim 19:3483–3517
Saji NH, Yamagata T (2003) Possible impacts of Indian Ocean dipole
mode events on global climate. Clim Res 25:151–169
Tanaka HL, Ishizaki N, Kitoh A (2004) Trend and interannual
variability of walker, monsoon and Hadley circulations defined
by velocity potential in the upper troposphere. Tellus
56A:250–269
Taschetto AS, England MH (2009) El Nino Modoki impacts on
Australian rainfall. J Clim 22:3167–3174. doi:10.1175/2008JC
LI2589.1
Trenberth KE, Smith L (2009) Variations in the three dimensional
structure of the atmospheric circulation with different flavors of
El Nino. J Clim 22:2978–2991. doi:10.1175/2008JCLI2691.1
Trenberth KE, Stepaniak DP (2001) Indices of El Nino evolution.
J Clim 14:1697–1701
Turner, AG, Inness PM, Slingo JM (2007) The effect of doubled CO2
and model basic state biases on the monsoon-ENSO system. II:
changing ENSO regimes Q J Roy Meteor Soc 133(Part A):
1159–1173
Wang G, Hendon HH (2007) Sensitivity of Australian rainfall to
inter-El Nino variations. J Clim 20:4211–4226
Wang B, Lee JY, Kang IS, Shukla J, Kug JS, Kumar A, Schemm J,
Luo JJ, Yamagata T, Park CK (2008) How accurately do coupled
climate models predict the leading modes of Asian-Australian
monsoon interannual variability? Clim Dyn 30:605–619
Wang B, Lee JY, Kang IS, Shukla J, Park CK, Kumar A, Schemm J,
Cocke S, Kug JS, Luo JJ, Zhou T, Wang B, Fu X, Yun WT, Alves O,
Jin EK, Kinter J, Kirtman B, Krishnamurti T, Lau NC, Lau W, Liu
P, Pegion P, Rosati T, Schubert S, Stern W, Suarez M, Yamagata T
(2009) Advance and prospectus of seasonal prediction: assessment
of the APCC/CliPAS 14-model ensemble retrospective seasonal
prediction (1980–2004). Clim Dyn 33:93–117
Weng H, Ashok K, Behera SK, Rao SA, Yamagata T (2007) Impacts
of recent El Nino Modoki on dry/wet conditions in the Pacific
rim during boreal summer. Clim Dyn 29:113–129
H.-I. Jeong et al.
123

Weng H, Behera SK, Yamagata T (2009) Anomalous winter climate
conditions in the Pacific rim during recent El Nino Modoki and
El Nino events. Clim Dyn 32:663–674. doi:10.1007/s00382-
008-0394-6
Yeh SW, Kug JS, Dewitte B, Kwon MH, Kirtman BP, Jin FF (2009)
El Nino in a changing climate. Nature 461:511–514. doi:
10.1038/nature08316
Yu JY, Kao HK (2007) Decadal changes of ENSO persistence barrier
in SST and ocean heat content indices: 1958–2001. J Geophys
Res 112:D13106. doi:10.1029/2006JD007654
Yu JY, Kim ST (2010) Three evolution patterns of Central-Pacific El
Nino. Geophys Res Lett 37:L08706. doi:10.1029/2010GL
042810
Yun WT, Stefanova L, Mitra AK, Kumar T, Dewar W, Krishnamurti
TN (2005) A multi-model superensemble algorithm for seasonal
climate prediction using DEMETER forecasts. Tellus Ser A
57:280–289
Zhao M, Hendon HH (2009) Representation and prediction for the
Indian Ocean dipole in the POAMA seasonal forecast model. Q J
Roy Meteorol Soc 135:337–352
Assessment of the APCC coupled MME suite
123