Assessment of Stability Differences in the Protein G B1 and B2 Domains From Hydrogen-Deuterium...
10
Biochemistry 1995, 34, 15291-15300 15291 Assessment of Stability Differences in the Protein G Bl and B2 Domains From Hydrogen-Deuterium Exchange: Comparison with Calorimetric Datat John Orban,* Patrick Alexander, Philip Bryan, and Devesh Khare Center for Advanced Research in Biotechnology, University of Maryland Biotechnology Institute, 9600 Gudelshy Drive, Rockville, Maryland 20850 Received June 6, 1995; Revised Manuscript Received August 17, 1995@ ABSTRACT: Hydrogen-deuterium (H-D) exchange experiments have been used to measure exchange rates for almost all of the main-chain amide protons (NHs) in the B1 and B2 IgG-binding domains of protein G. For H-bonded NHs, exchange rates were also measured as a function of temperature from 25 to 65 "C for B1 and from 25 to 60 "C for B2. A number of NHs exchange by a mechanism consistent with global unfolding. For these residues, the free energy required for transient opening of a H-bonded NH (AGop) from H-D exchange approximates the extrapolated free energy of thermal unfolding (AG,) from calorimetry in B 1 and B2. The difference in exchange rates between B 1 and B2 for these residues reflects the 1 kcal mol-' difference in stability from calorimetry. The more stable B 1 domain appears to have a slightly larger core of residues which exchange by global unfolding than B2. The AGop values for slow exchange H-bonded NHs and calorimetric AG, provide highly complementary information on the AG versus temperature stability profiles of B 1 and B2. Furthermore, NH exchange rates provide a very sensitive measure of local stability differences between B 1 and B2. In both domains, the P2-strand is the least stable of the @-sheet although it is more stable in B1 than B2. The largest local stability differences occur at residues Y3 and T18 which exchange 40-fold and 100-fold slower in B1, respectively. These residues form a H-bond donor-acceptor pair at one end of the pl-p2 hairpin region. Local stability differences are also evident near the ,81-/32 turn. These stability differences are, at least in part, due to subtle differences in hydrophobic packing effects. They are not obvious from inspection of the B1 and B2 structures but are manifested as readily measurable changes in NH exchange rates for individual residues. Knowledge of these local stability differences in the p l -p2 region provides potential approaches for designing new stability mutants in protein G. Most non-H-bonded NHs have exchange rates that are <15 times slower than their intrinsic rates. In marked contrast, the NHs of K10, T11, and L12 in the ,81-@2 turn and V21 have exchange rates which are five to 2 2 4 times faster than their intrinsic rates, probably due to local electrostatic effects. For some slow exchanging NHs, particularly in the @3-p4 hairpin region, the AGop value is greater than AGu by up to 1 kcal mol-', suggesting that some residual structure may exist in the "unfolded state". Protein G is a multidomain cell wall protein that occurs in streptococcus and contains two to three immunoglobulin G (1gG)-binding domains, designated here as B1 and B2. These small 56 amino acid domains differ by six amino acid substitutions and bind the constant Fc region of IgG tightly with K, zz lo8 M-] (Myhre & Kronvall, 1977; Reis et al., 1984; Fahnestock et al., 1986). The IgG-binding domains of protein G are similar in size to those of staphylococcal protein A (Akerstrom & Bjorck, 1986), and protein G and protein A compete for binding at the CH~-CH~ interface of IgG (Wright et al., 1977; Stone et al., 1989). The two proteins have no sequence or structural homology, however. Protein A is a three-helix bundle (Gouda et al., 1992), whereas the IgG-binding domain of protein G consists of a four-stranded P-sheet packed against a helix (Gronenborn et al., 1991; Achari et al., 1992; Lian et al., 1991, 1992; Orban et al., 1992; Gallagher et al., 1994). From differential scanning calorimetry, the B1 and B2 domains exhibit reversible two-state unfolding behavior over ' Supported by NSF Grant MCB-92-19309. * Author to whom correspondence should be addressed. Abstract published in Advance ACS Abstracts, November 1, 1995. a wide pH range with denaturation temperatures of 87.5 and 79.4 OC, respectively, at pH 5.4 (Alexander et al., 1992). Since the heat capacity difference, AC,,, is known for B 1 and B2, AG, can be calculated for temperatures outside the calorimetrically measurable range using the Gibbs-Helm- holtz equation AG, = AH, - TASo + ACJT- T, - Tln(T/T,)] (1) where AH0 and AS0 are the enthalpy and entropy of unfolding at a reference temperature TO and AG, is the free energy of unfolding at a temperature T (Brandts, 1964; Pace & Tanford, 1968; Privalov & Khechinashvili, 1974; Privalov, 1979; Becktel & Schellman, 1987). Using eq 1, the extrapolated free energy of thermal unfolding, AG", is 6.6 kcal mol-' for B 1 and 5.6 kcal mol-] for B2, at 25 "C. The relatively large change in denaturation temperature occurs because the stability profile (AGuversus temperature) is flat and shallow due to the small AS and ACp for unfolding. In addition to thermodynamic analysis by calorimetric methods (Alexander et a]., 1992), kinetic analysis of the folding and unfolding of both domains has been carried out using stopped-flow mixing techniques (Alexander et al., 1992). 0006-2960/95/0434- 15291 $09.00/0 0 1995 American Chemical Society
Transcript of Assessment of Stability Differences in the Protein G B1 and B2 Domains From Hydrogen-Deuterium...
Biochemistry 1995, 34, 15291-15300 15291
Assessment of Stability Differences in the Protein G B l and B2 Domains From Hydrogen-Deuterium Exchange: Comparison with Calorimetric Datat
John Orban,* Patrick Alexander, Philip Bryan, and Devesh Khare
Center for Advanced Research in Biotechnology, University of Maryland Biotechnology Institute, 9600 Gudelshy Drive, Rockville, Maryland 20850
Received June 6, 1995; Revised Manuscript Received August 17, 1995@
ABSTRACT: Hydrogen-deuterium (H-D) exchange experiments have been used to measure exchange rates for almost all of the main-chain amide protons (NHs) in the B1 and B2 IgG-binding domains of protein G. For H-bonded NHs, exchange rates were also measured as a function of temperature from 25 to 65 "C for B1 and from 25 to 60 "C for B2. A number of NHs exchange by a mechanism consistent with global unfolding. For these residues, the free energy required for transient opening of a H-bonded NH (AGop) from H-D exchange approximates the extrapolated free energy of thermal unfolding (AG,) from calorimetry in B 1 and B2. The difference in exchange rates between B 1 and B2 for these residues reflects the 1 kcal mol-' difference in stability from calorimetry. The more stable B 1 domain appears to have a slightly larger core of residues which exchange by global unfolding than B2. The AGop values for slow exchange H-bonded NHs and calorimetric AG, provide highly complementary information on the AG versus temperature stability profiles of B 1 and B2. Furthermore, NH exchange rates provide a very sensitive measure of local stability differences between B 1 and B2. In both domains, the P2-strand is the least stable of the @-sheet although it is more stable in B1 than B2. The largest local stability differences occur at residues Y3 and T18 which exchange 40-fold and 100-fold slower in B1, respectively. These residues form a H-bond donor-acceptor pair at one end of the p l - p 2 hairpin region. Local stability differences are also evident near the ,81-/32 turn. These stability differences are, at least in part, due to subtle differences in hydrophobic packing effects. They are not obvious from inspection of the B1 and B2 structures but are manifested as readily measurable changes in NH exchange rates for individual residues. Knowledge of these local stability differences in the p l -p2 region provides potential approaches for designing new stability mutants in protein G. Most non-H-bonded NHs have exchange rates that are <15 times slower than their intrinsic rates. In marked contrast, the NHs of K10, T11, and L12 in the ,81-@2 turn and V21 have exchange rates which are five to 2 2 4 times faster than their intrinsic rates, probably due to local electrostatic effects. For some slow exchanging NHs, particularly in the @3-p4 hairpin region, the AGop value is greater than AGu by up to 1 kcal mol-', suggesting that some residual structure may exist in the "unfolded state".
Protein G is a multidomain cell wall protein that occurs in streptococcus and contains two to three immunoglobulin G (1gG)-binding domains, designated here as B1 and B2. These small 56 amino acid domains differ by six amino acid substitutions and bind the constant Fc region of IgG tightly with K, zz lo8 M-] (Myhre & Kronvall, 1977; Reis et al., 1984; Fahnestock et al., 1986). The IgG-binding domains of protein G are similar in size to those of staphylococcal protein A (Akerstrom & Bjorck, 1986), and protein G and protein A compete for binding at the C H ~ - C H ~ interface of IgG (Wright et al., 1977; Stone et al., 1989). The two proteins have no sequence or structural homology, however. Protein A is a three-helix bundle (Gouda et al., 1992), whereas the IgG-binding domain of protein G consists of a four-stranded P-sheet packed against a helix (Gronenborn et al., 1991; Achari et al., 1992; Lian et al., 1991, 1992; Orban et al., 1992; Gallagher et al., 1994).
From differential scanning calorimetry, the B1 and B2 domains exhibit reversible two-state unfolding behavior over
' Supported by NSF Grant MCB-92-19309. * Author to whom correspondence should be addressed.
Abstract published in Advance ACS Abstracts, November 1, 1995.
a wide pH range with denaturation temperatures of 87.5 and 79.4 OC, respectively, at pH 5.4 (Alexander et al., 1992). Since the heat capacity difference, AC,,, is known for B 1 and B2, AG, can be calculated for temperatures outside the calorimetrically measurable range using the Gibbs-Helm- holtz equation
AG, = AH, - TASo + A C J T - T, - Tln(T/T,)] (1)
where A H 0 and AS0 are the enthalpy and entropy of unfolding at a reference temperature TO and AG, is the free energy of unfolding at a temperature T (Brandts, 1964; Pace & Tanford, 1968; Privalov & Khechinashvili, 1974; Privalov, 1979; Becktel & Schellman, 1987). Using eq 1, the extrapolated free energy of thermal unfolding, AG", is 6.6 kcal mol-' for B 1 and 5.6 kcal mol-] for B2, at 25 "C. The relatively large change in denaturation temperature occurs because the stability profile (AGu versus temperature) is flat and shallow due to the small AS and ACp for unfolding. In addition to thermodynamic analysis by calorimetric methods (Alexander et a]., 1992), kinetic analysis of the folding and unfolding of both domains has been carried out using stopped-flow mixing techniques (Alexander et al., 1992).
0006-2960/95/0434- 15291 $09.00/0 0 1995 American Chemical Society
15292 Biochemistry, Vol. 34, No. 46, 1995
Stability parameters can also be obtained from measure- ment of hydrogen-deuterium (H-D) exchange rates of labile main-chain amide (NH) protons (Bai et al., 1994). Amide exchange rates can be analyzed in terms of the structural unfolding model (Hvidt & Nielsen, 1966), in which the exchange mechanism can be described by the reaction path shown in eq 2.
Orban et al.
Bax et al., 1990; Norwood et al., 1990) spectra were acquired in time-proportional phase incrementation (TPPI; Marion & Wuthrich, 1983) mode with no phase cycling (Marion et al., 1989) using 256 tl increments and spectral widths of 5000 and 1670 Hz in the 'H and I5N dimensions, respectively. i5N-decoupling during t2 was achieved using a GARP sequence (Shaka et al., 1985). The 1/(4J~") delay was set to 2.3 ms, and the relaxation delay was 1.0 s. IH-l5N HMQC-COSY and HMQC-NOESY spectra (Gronenborn et al., 1989) were acquired using 800 tl increments of 2 K data points with 32 or 64 transients per increment and spectral widths of 6024 Hz and 1670 Hz in the 'H and 15N dimensions, respectively. The lI(2.h) delay was set to 4 ms. A relaxation delay of 2.0 s was used, and the mixing time was 200 ms in the HMQC-NOESY experiment. The water signal was suppressed using solvent presaturation. Chemical shifts were referenced to the carrier in F l (118.2 ppm) and F2 (4.77 ppm) at 25 "C.
Determination of Amide Proton Exchange Rates. The lyophilized protein was dissolved in 99.99% D20, the pD was adjusted to 5.7 (meter reading), and the HSQC spectra were recorded at a series of time intervals at 25 "C. No solvent suppression was employed in D20 spectra, and the total measurement time per spectrum was -5.7 min using 256 t1 increments and a relaxation delay of 1.0 s. The de- cays in integrated peak volumes of individual NHs were fitted to first-order exponential curves of the form A, = A0 exp- ( -kext) , where A, is the peak volume at time t and kex is the first-order rate constant. Fifteen to twenty time points were obtained for each domain, with time points ranging from 15 min to 500 h for B1 and from 15 min to 140 h for B2. Samples were not removed from the magnet during the time course. Volumes were normalized to the upfield-shifted nonexchangeable y-methyl resonance of V54 obtained from one-dimensional proton spectra. The integral of this signal did not change during the course of the experiments. HSQC spectra were also recorded with a relaxation delay of 2.0 s during the time course. Exchange rate measurements from these spectra were within &lo% of those obtained from the 1.0 s data for most residues and within f 2 0 % for all residues. The latter error limit corresponds to a f 2 0 % error in AAGop values for residues with the same intrinsic rate in B1 and B2 (from eq 4).
Exchange rates obtained at elevated temperatures were either from HSQC spectra recorded with 256 or 80 tl
increments (40 and 50 "C data) or from one-dimensional 'H- 15N heteronuclear multiple-quantum coherence (HMQC) spectra (55 -65 "C data). One-dimensional HMQC spectra (Bax et al., 1983) were recorded with 2 or 4 transients per spectrum and set up in automation mode for rapid recording of spectra in series. The delay was set to 4.5 ms, and the relaxation delay was 1.0 s. Temperatures were regulated by the variable temperature unit on the spectrometer and calibrated against a standard solution of ethylene glycol in DMSO-d6.
Rates for fast exchanging NHs at pD 3.1 (k > 1 h-I) were obtained from HSQC spectra recorded with 80 tl increments and a relaxation delay of 1 .O s, making the total measurement time -1.8 min per spectrum. The use of automation programs permitted the collection of 10 time points in less than 20 min. In this case, the pD was checked after the collection of the time course. The dead time between addition of D20 to the lyophilized protein and the start
In this scheme, k,, kf , and k, are the unfolding, folding, and intrinsic exchange rates, respectively, F is the native or folded state, and U represents open or unfolded states. Under stabilizing conditions, kf >> k,, kf >> k, (EX2 limit), and the measured exchange rate, k,,, is given by
k,, = k,k,Ik, = K,,k, (3)
The free energy required for transient opening is then
AGop = - R T l n Kop = -RTln(k,,/kJ (4)
where Kop is the equilibrium constant for transient opening and AGO, is the free energy difference between folded and locally or globally unfolded states.
Here, we report exchange rates for nearly all of the main- chain NHs in B1 and B2 at 25 "C. A number of NHs exchange by a mechanism consistent with global unfolding. For these residues, the AGO, value approximates the ex- trapolated AG, in B1 and B2. The difference in exchange rates between B 1 and B2 reflects the 1 kcal mol-] difference in stability from calorimetry. For H-bonded NHs, exchange rates were also measured as a function of temperature. The AGop values for slow exchange H-bonded NHs and AG, from calorimetry provide highly complementary information on the stability profiles of B1 and B2. Furthermore, in contrast to the macroscopic stability parameter (AG,) from calorim- etry, NH exchange rates provide a very sensitive measure of local stability differences between B1 and B2. Knowledge of these local stability differences provides potential avenues for engineering new stability mutants for protein G. For non- H-bonded NHs, exchange rates are compared with their calculated intrinsic rates. Finally, some residues have AGO, values up to 1 kcal mol-' greater than the extrapolated AG, at 25 "C, and the implications of these results with regard to the unfolded state are discussed.
MATERIALS AND METHODS
Sample Preparation and NMR Spectroscopy. The protein G B 1 and B2 domains were cloned, expressed, and purified as described in Alexander et al. (1992). Uniformly 15N- labeled samples (295%) were prepared by expression in M9 minimal media with iSNH4C1 as the sole nitrogen source. NMR samples for assignment of resonances were prepared by dissolving lyophilized protein in 0.4 mL of 100 mM NaOAc-d3 buffer, pH 5.4, containing 10% D20. Low-pH experiments were carried out by adjusting samples to pH 3.1 using small aliquots of 2 M HC1 solutions. Sample concentrations for B1 and B2 were 5 mM. NMR spectra were recorded on a Bruker AMX-500 and processed on Silicon Graphics workstations using FTNMR or FELIX (Biosym, San Diego, CA). 'H-15N heteronuclear single- quantum coherence (HSQC; Bodenhausen & Ruben, 1980;
Stability Differences in Protein G B1 and B2 Domains Biochemistry, Vol. 34, No. 46, 1995 15293
B 1
1436
1 F52
0 T49
r5 I OT17 , ' + N e d
N35d
I r ia N37
N37 116'
r44 ' E*7 d 725 1 K28
8 T53 4 N35
E l5
I047 \3 QL7 " I g
I 8 N 8 0 ~ 5 AZO I6
040 1143 OD46
4 T49
T25,E27 "" IN35
E15
0 143
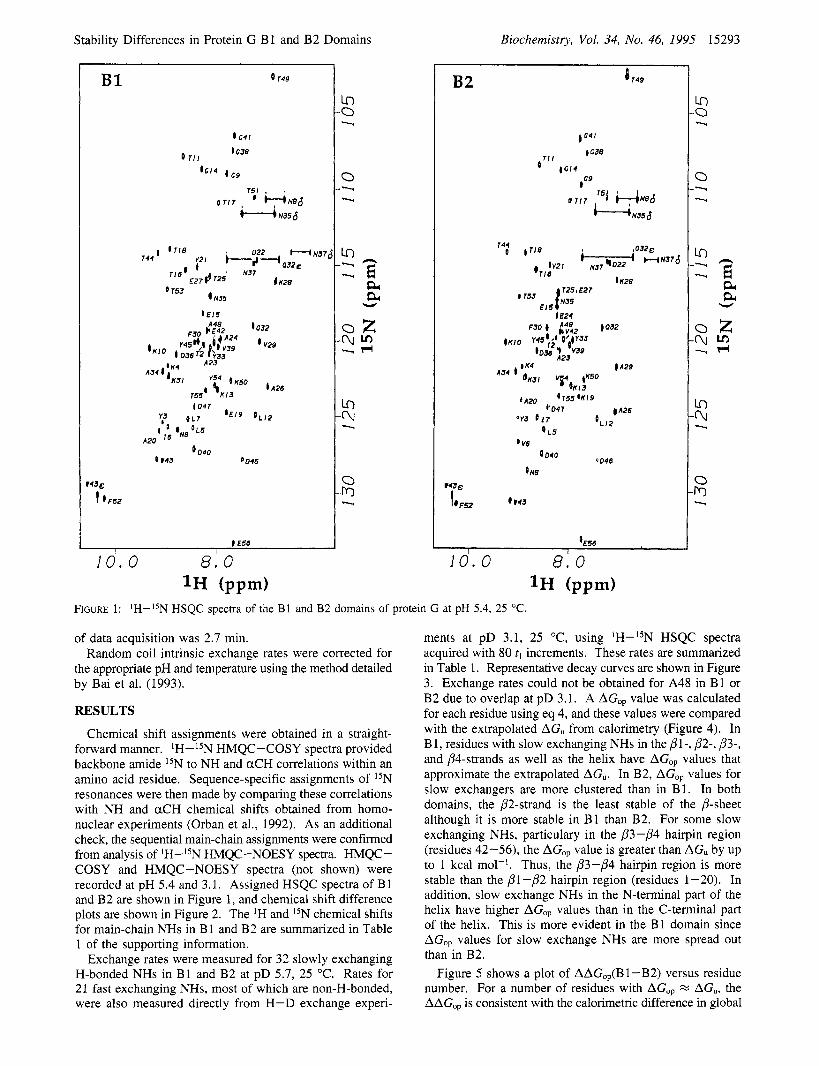
FIGURE 1: 'H-ISN HSQC spectra of the B1 and B2 domains of protein G at pH 5.4, 25 "C.
of data acquisition was 2.7 min. Random coil intrinsic exchange rates were corrected for
the appropriate pH and temperature using the method detailed by Bai et al. (1993).
RESULTS
Chemical shift assignments were obtained in a straight- forward manner. IH-15N HMQC-COSY spectra provided backbone amide I5N to NH and aCH correlations within an amino acid residue. Sequence-specific assignments of 15N resonances were then made by comparing these correlations with NH and aCH chemical shifts obtained from homo- nuclear experiments (Orban et al., 1992). As an additional check, the sequential main-chain assignments were confirmed from analysis of IH-l5N HMQC-NOESY spectra. HMQC- COSY and HMQC-NOESY spectra (not shown) were recorded at pH 5.4 and 3.1. Assigned HSQC spectra of B 1 and B2 are shown in Figure 1, and chemical shift difference plots are shown in Figure 2. The IH and I5N chemical shifts for main-chain NHs in B 1 and B2 are summarized in Table 1 of the supporting information.
Exchange rates were measured for 32 slowly exchanging H-bonded NHs in B1 and B2 at pD 5.7, 25 "C. Rates for 21 fast exchanging NHs, most of which are non-H-bonded, were also measured directly from H-D exchange experi-
ments at pD 3.1, 25 "C, using IH-l5N HSQC spectra acquired with 80 ti increments. These rates are summarized in Table 1. Representative decay curves are shown in Figure 3. Exchange rates could not be obtained for A48 in B1 or B2 due to overlap at pD 3.1. A AGop value was calculated for each residue using eq 4, and these values were compared with the extrapolated AGu from calorimetry (Figure 4). In B1, residues with slow exchanging NHs in the Pl- , P2-, p3-, and P4-strands as well as the helix have AGop values that approximate the extrapolated AG". In B2, AGop values for slow exchangers are more clustered than in B1. In both domains, the P2-strand is the least stable of the P-sheet although it is more stable in B1 than B2. For some slow exchanging NHs, particulary in the p 3 -p4 hairpin region (residues 42-56), the AGop value is greater than AGu by up to 1 kcal mol-'. Thus, the P3-/34 hairpin region is more stable than the Pl-P2 hairpin region (residues 1-20). In addition, slow exchange NHs in the N-terminal part of the helix have higher AGop values than in the C-terminal part of the helix. This is more evident in the B1 domain since AGop values for slow exchange NHs are more spread out than in B2.
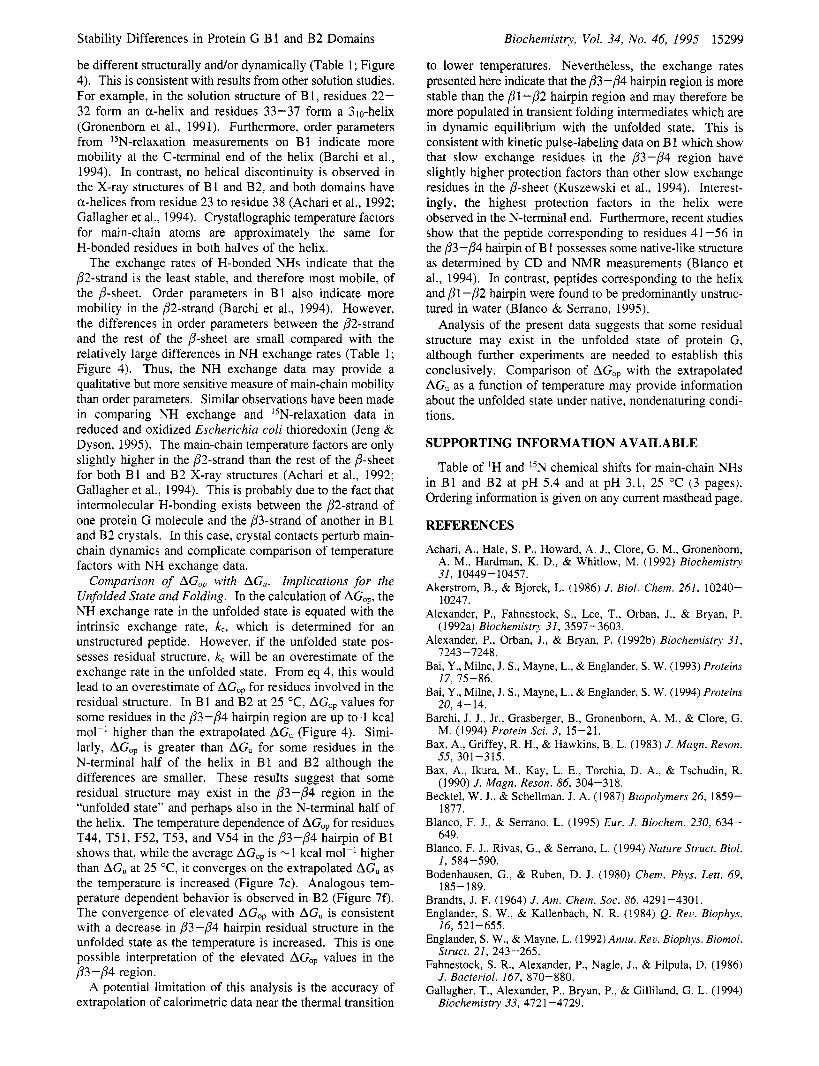
Figure 5 shows a plot of AAGop(B1-B2) versus residue number. For a number of residues with AGop x AGu, the AAGop is consistent with the calorimetric difference in global
15294 Biochemistry, Vol. 34, No. 46, 1995 Orban et al.
0.4 $I J
0.2- a $- 0: s 00- -0.2- a
v
1 5 9 13 17 21 25 29 33 37 41 45 49 53 Residue Number
1 5 9 13 17 21 25 29 33 37 41 45 49 53 Residue Number
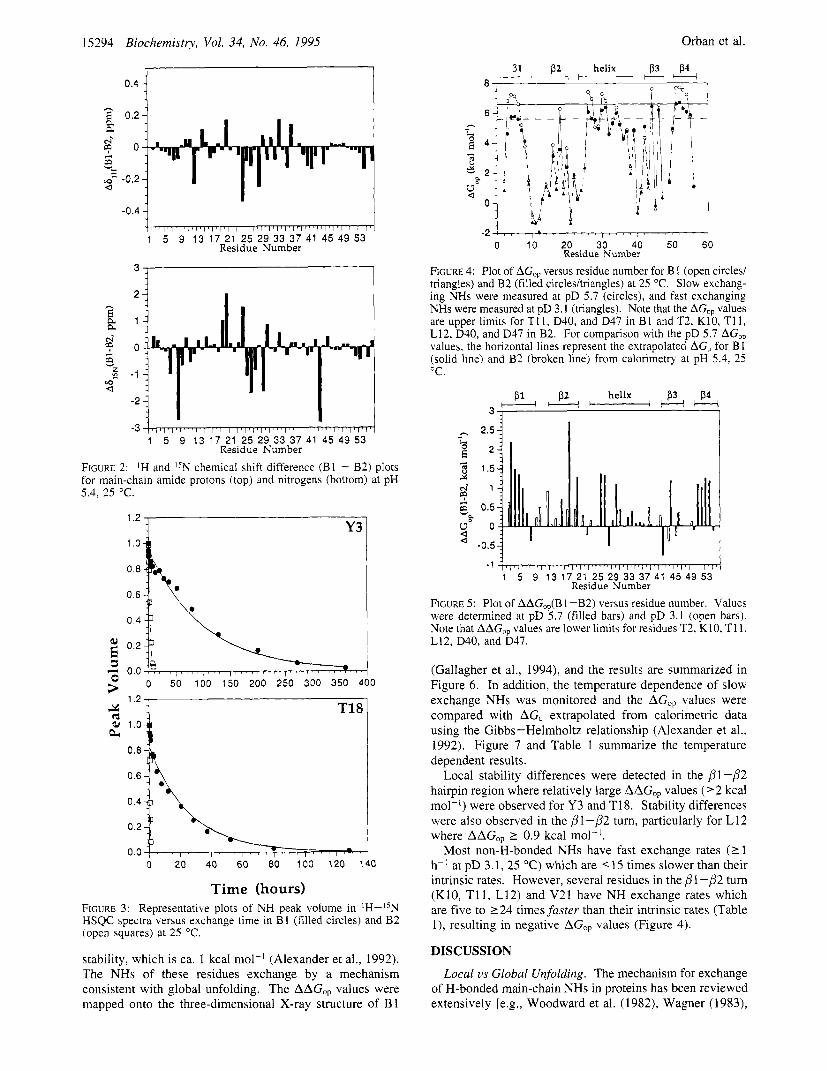
FIGURE 2: IH and I5N chemical shift difference (B1 - B2) plots for main-chain amide protons (top) and nitrogens (bottom) at pH 5.4. 25 "C.
1.2 ~3 t
1 .o
0.8
0.6 0
0 20 40 60 80 100 120 140
Time (hours) FIGURE 3: Representative plots of NH peak volume in lH-I5N HSQC spectra versus exchange time in B 1 (filled circles) and B2 (open squares) at 25 "C.
stability, which is ca. 1 kcal mol-I (Alexander et al., 1992). The NHs of these residues exchange by a mechanism consistent with global unfolding. The AAG,, values were mapped onto the three-dimensional X-ray structure of B 1
P l P2 helix P3 P4 8 " H - t - -
d
-2 0 10 20 30 40 50 60
Residue Number
FIGURE 4: Plot of AGOp versus residue number for B 1 (open circles/ triangles) and B2 (filled circles/triangles) at 25 "C. Slow exchang- ing NHs were measured at pD 5.7 (circles), and fast exchanging NHs were measured at pD 3.1 (triangles). Note that the AG,, values are upper limits for T11, D40, and D47 in B1 and T2, K10, T11, L12, D40, and D47 in B2. For comparison with the pD 5.7 AGO, values, the horizontal lines represent the extrapolated AGu for B 1 (solid line) and B2 (broken line) from calorimetry at pH 5.4, 25 "C.
P l P2 helix P3 P4 k - - - i H w H H
3 , I
-1 l ' l ' l ' l ' l ~ l ' l ' l ~ l ' l ~ l ' l ~
1 5 9 13 17 21 25 29 33 37 41 45 49 53 Residue Number
FIGURE 5: Plot of AAG,,(B 1 -B2) versus residue number. Values were determined at pD 5.7 (filled bars) and pD 3.1 (open bars). Note that AAG,, values are lower limits for residues T2, K10, T11, L12, D40, and D47.
(Gallagher et al., 1994), and the results are summarized in Figure 6. In addition, the temperature dependence of slow exchange NHs was monitored and the AGOp values were compared with AGu extrapolated from calorimetric data using the Gibbs-Helmholtz relationship (Alexander et al., 1992). Figure 7 and Table 1 summarize the temperature dependent results.
Local stability differences were detected in the /?l -/?2 hairpin region where relatively large AAG,, values ('2 kcal mol-') were observed for Y3 and T18. Stability differences were also observed in the /5'l -/?2 turn, particularly for L12 where AAGOp L 0.9 kcal mol-'.
Most non-H-bonded NHs have fast exchange rates (1 1 h-' at pD 3.1, 25 "C) which are < 15 times slower than their intrinsic rates. However, several residues in the /?1-/?2 turn (K10, T11, L12) and V21 have NH exchange rates which are five to 224 times faster than their intrinsic rates (Table l ) , resulting in negative AGO, values (Figure 4).
DISCUSSION
Local us Global Unfolding. The mechanism for exchange of H-bonded main-chain NHs in proteins has been reviewed extensively [e.g., Woodward et al. (1982), Wagner (1983),
Stability Differences in Protein G B1 and B2 Domains Biochemistry, Vol. 34, No. 46, 1995 15295 ~~
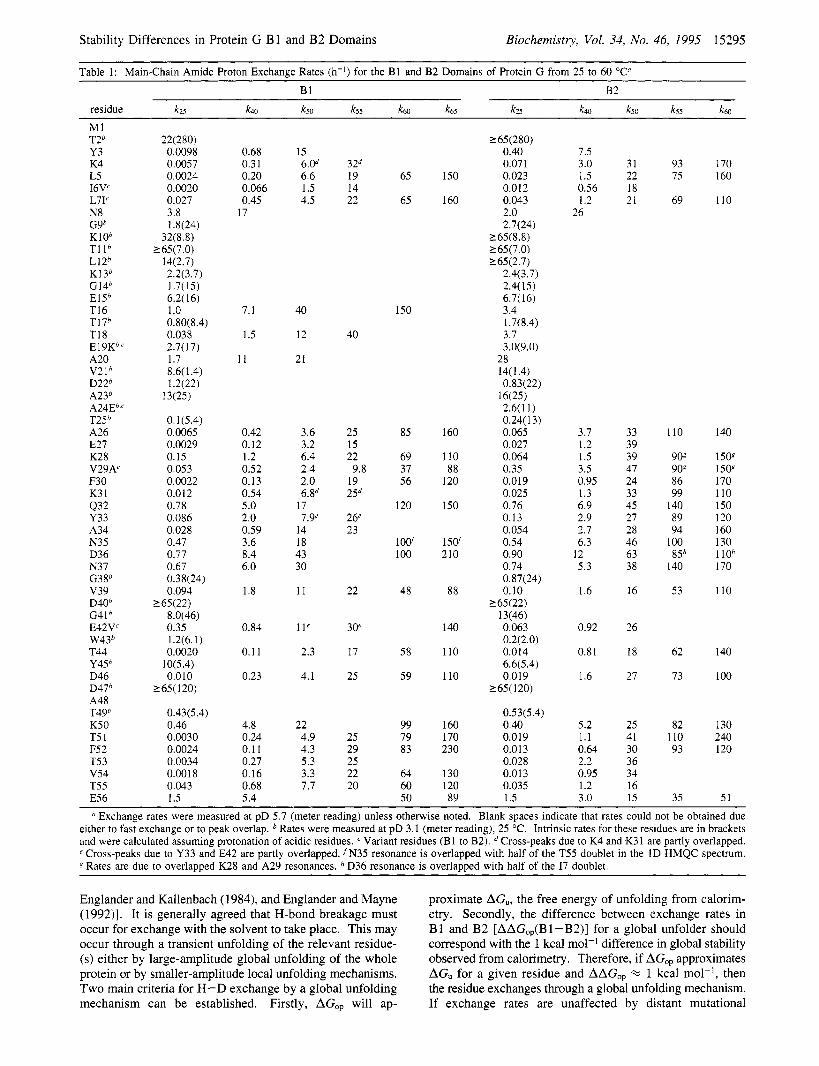
Table 1: Main-Chain Amide Proton Exchange Rates (h-I) for the B1 and B2 Domains of Protein G from 25 to 60 "c" B1 B2
residue k25 k40 k50 k55 k60 k65 k25 k40 kso k55 k60
MI T2b Y3 K4 L5 I6V' L7I' N8 G9b KIOb TI l b L12b K13b G14b E15b T16 T17b T18 E 1 9Kb,' A20 V21b D22h A23b A24Eb.' T25b A26 E27 K28 V29A' F30 K3 1 432 Y33 A34 N35 D36 N37 G3gb v39 D40b G41b E42V' W43b T44 Y45b D46 D47b A48 T49b K50 T5 1 F5 2 T5 3 v54 T55 E56
22(280) 0.0098 0.0057 0.0024 0.0020 0.027 3.8 1.8(24)
32(8.8) 265(7.0)
14(2.7) 2.2(3.7) 1.7(15) 6.2(16) 1 .o 0.80(8.4) 0.038 2.7(17) I .7 8.6( 1.4) 1.2(22)
13(25)
0.1(5.4) 0.0065 0.0029 0.15 0.053 0.0022 0.012 0.78 0.086 0.028 0.47 0.77 0.67 0.38(24) 0.094
265(22) 8.0(46) 0.35 1.2(6.1) 0.0020
lO(5.4) 0.010
?65( 120)
0.43(5.4) 0.46 0.0030 0.0024 0.0034 0.0018 0.043 1.5
0.68 0.3 1 0.20 0.066 0.45
17
7.1
1.5
11
0.42 0.12 1.2 0.52 0.13 0.54 5.0 2.0 0.59 3.6 8.4 6.0
1.8
0.84
0.1 1
0.23
4.8 0.24 0.11 0.27 0.16 0.68 5.4
15 6.0d 6.6 1.5 4.5
40
12
21
3.6 3.2 6.4 2.4 2.0 6.gd
7.9' 17
14 18 43 30
11
11'
2.3
4.1
22 4.9 4.3 5.3 3.3 7.7
32d 19 14 22
40
25 15 22
19 25d
9.8
26' 23
22
30'
17
25
25 29 25 22 20
65 150
65 160
150
85 160
69 110 37 88 56 120
120 150
1001 1501 100 210
48 88
140
58 110
59 110
99 160 79 170 83 230
64 130 60 120 50 89
2 65(280) 0.40 0.07 1 0.023 0.0 12 0.043 2.0 2.7(24)
5 65(8.8) 165(7.0) 265(2.7)
2.4(3.7) 2.4(15) 6.7(16) 3.4 1.7(8.4) 3.7 3.0(9.0)
28 14( 1.4)
16(25) 0.83(22)
2.6(11) 0.24( 13) 0.065 0.027 0.064 0.35 0.019 0.025 0.76 0.13 0.054 0.54 0.90 0.74 0.87(24) 0.10
?65(22) 13(46) 0.063 0.2(2.0) 0.014 6.6(5.4) 0.0 19
2 65( 120)
0.53(5.4) 0.40 0.0 19 0.0 13 0.028 0.013 0.035 1.5
7.5 3.0 31 93 170 1.5 22 75 160 0.56 18 1.2 21 69 110
26
3.7 33 110 140 1.2 39 1.5 39 909 15Og 3.5 47 909 150p 0.95 24 86 170 1.3 33 99 110 6.9 45 140 150 2.9 27 89 120 2.7 28 94 160 6.3 46 100 130
12 63 85h 110" 5.3 38 140 170
1.6 16 53 110
0.92 26
0.81 18 62 140
1.6 27 73 100
5.2 25 82 130 1.1 41 110 240 0.64 30 93 120 2.2 36 0.95 34 1.2 16 3.0 15 35 51
a Exchange rates were measured at pD 5.7 (meter reading) unless otherwise noted. Blank spaces indicate that rates could not be obtained due either to fast exchange or to peak overlap. Rates were measured at pD 3.1 (meter reading), 25 "C. Intrinsic rates for these residues are in brackets and were calculated assuming protonation of acidic residues. Variant residues (B1 to B2). Cross-peaks due to K4 and K31 are partly overlapped. e Cross-peaks due to Y33 and E42 are partly overlapped. fN35 resonance is overlapped with half of the T55 doublet in the 1D HMQC spectrum. g Rates are due to overlapped K28 and A29 resonances. D36 resonance is overlapped with half of the I7 doublet.
Englander and Kallenbach (1984), and Englander and Mayne (1992)l. It is generally agreed that H-bond breakage must occur for exchange with the solvent to take place. This may occur through a transient unfolding of the relevant residue- (s) either by large-amplitude global unfolding of the whole protein or by smaller-amplitude local unfolding mechanisms. Two main criteria for H-D exchange by a global unfolding mechanism can be established. Firstly, AGop will ap-
proximate AG", the free energy of unfolding from calorim- etry. Secondly, the difference between exchange rates in B1 and B2 [AAG0,(B1-B2)] for a global unfolder should correspond with the 1 kcal mol-' difference in global stability observed from calorimetry. Therefore, if AGop approximates AGu for a given residue and AAGop e 1 kcal mol-], then the residue exchanges through a global unfolding mechanism. If exchange rates are unaffected by distant mutational
15296 Biochemistry, Vol. 34, No. 46, 1995 Orban et al.
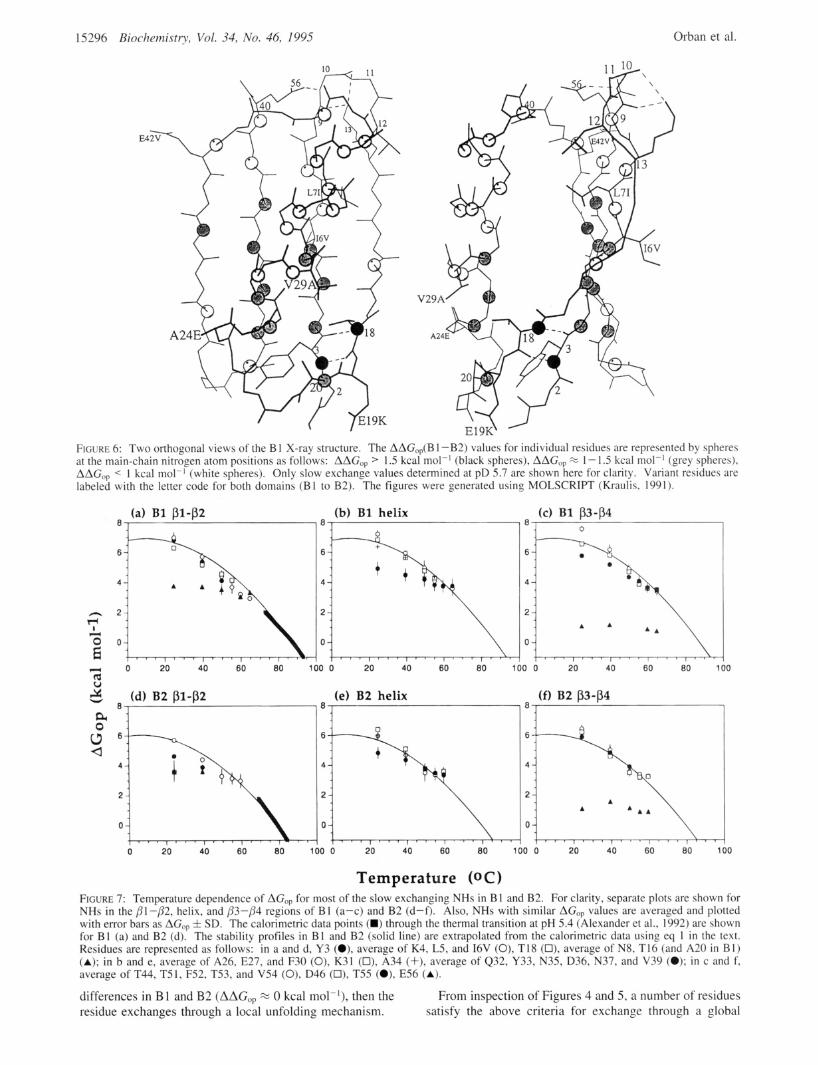
FIGURE 6: Two orthogonal views of the B 1 X-ray structure. The AAG,,(B 1 -B2) values for individual residues are represented by spheres at the main-chain nitrogen atom positions as follows: AAG,, > I .5 kcal molp1 (black spheres), AAG,, % 1 - 1.5 kcal mol-] (grey spheres), AAG,, < 1 kcal mol-] (white spheres). Only slow exchange values determined at pD 5.7 are shown here for clarity. Variant residues are labeled with the letter code for both domains (B1 to B2). The figures were generated using MOLSCRIPT (Kraulis, 1991).
(a) B1 pl-p2 8 ,
0 20 40 60 80 1 td v
(b) B1 helix
D 0 20 40 60 80 1
(c) B1 p3-p4 8
0
20 40 60 80 100 1 0
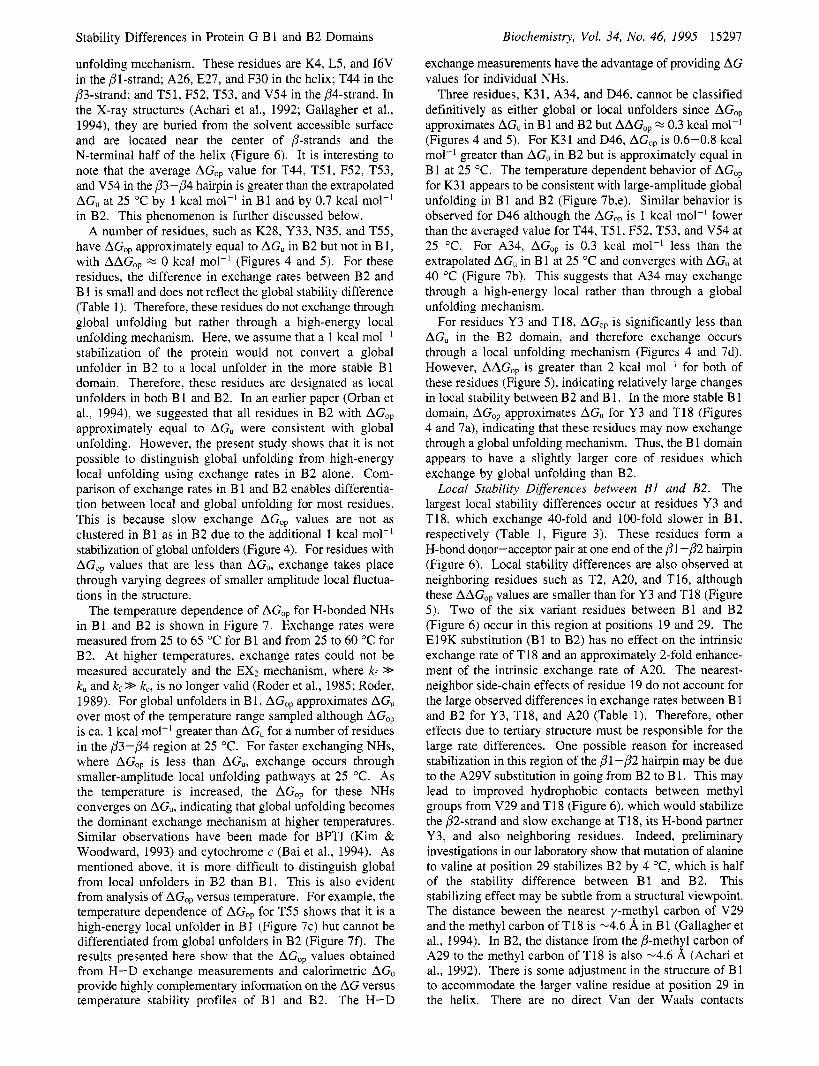
FIGURE 7: Temperature dependence of AGO, for most of the slow exchanging NHs in B 1 and B2. For clarity, separate plots are showr NHs in the pI-p2, helix, and p3-p4 regions of B1 (a-c) and B2 (d-f). Also, NHs with similar AGO, values are averaged and plotted with error bars as AGO, f SD. The calorimetric data points (m) through the thermal transition at pH 5.4 (Alexander et a]., 1992) are shown for B1 (a) and B2 (d). The stability profiles in B1 and B2 (solid line) are extrapolated from the calorimetric data using eq 1 in the text. Residues are represented as follows: in a and d, Y3 (O), average of K4, L5, and 16V (0), TI8 (0), average of N8, T I6 (and A20 in BI) (A); in b and e, average of A26, E27, and F30 (0), K31 (0), A34 (+), average of Q32, Y33, N35, D36, N37, and V39 (0); in c and f, average of T44, T5 1, F52, T53, and V54 (0), D46 (0), T55 (O), E56 (A).
differences in B1 and B2 (AAGop From inspection of Figures 4 and 5 , a number of residues residue exchanges through a local unfolding mechanism. satisfy the above criteria for exchange through a global
0 kcal mol-'), then the
0
for
Stability Differences in Protein G B1 and B2 Domains
unfolding mechanism. These residues are K4, L5, and 16V in the Pl-strand; A26, E27, and F30 in the helix; T44 in the P3-strand; and T5 1, F52, T53, and V54 in the P4-strand. In the X-ray structures (Achari et al., 1992; Gallagher et al., 1994), they are buried from the solvent accessible surface and are located near the center of P-strands and the N-terminal half of the helix (Figure 6). It is interesting to note that the average AGO, value for T44, T51, F52, T53, and V54 in the /33-/34 hairpin is greater than the extrapolated AG,, at 25 "C by 1 kcal mol-' in B1 and by 0.7 kcal mol-] in B2. This phenomenon is further discussed below.
A number of residues, such as K28, Y33, N35, and T55, have AGO, approximately equal to AG,, in B2 but not in B 1, with AAGop % 0 kcal mol-] (Figures 4 and 5). For these residues, the difference in exchange rates between B2 and B 1 is small and does not reflect the global stability difference (Table 1). Therefore, these residues do not exchange through global unfolding but rather through a high-energy local unfolding mechanism. Here, we assume that a 1 kcal mol-' stabilization of the protein would not convert a global unfolder in B2 to a local unfolder in the more stable B1 domain. Therefore, these residues are designated as local unfolders in both B 1 and B2. In an earlier paper (Orban et al., 1994), we suggested that all residues in B2 with AGO, approximately equal to AG,, were consistent with global unfolding. However, the present study shows that it is not possible to distinguish global unfolding from high-energy local unfolding using exchange rates in B2 alone. Com- parison of exchange rates in B 1 and B2 enables differentia- tion between local and global unfolding for most residues. This is because slow exchange AGop values are not as clustered in B1 as in B2 due to the additional 1 kcal mol-' stabilization of global unfolders (Figure 4). For residues with AGO, values that are less than AG,, exchange takes place through varying degrees of smaller amplitude local fluctua- tions in the structure.
The temperature dependence of AGO, for H-bonded NHs in B l and B2 is shown in Figure 7. Exchange rates were measured from 25 to 65 "C for B 1 and from 25 to 60 "C for B2. At higher temperatures, exchange rates could not be measured accurately and the EX2 mechanism, where kf >> k, and kf >> kc, is no longer valid (Roder et al., 1985; Roder, 1989). For global unfolders in B1, AGO, approximates AG,, over most of the temperature range sampled although AGO, is ca. 1 kcal mol-' greater than AG,, for a number of residues in the P3-p4 region at 25 "C. For faster exchanging NHs, where AGop is less than AGu, exchange occurs through smaller-amplitude local unfolding pathways at 25 "C. As the temperature is increased, the AGop for these NHs converges on AG,,, indicating that global unfolding becomes the dominant exchange mechanism at higher temperatures. Similar observations have been made for BPTI (Kim & Woodward, 1993) and cytochrome c (Bai et al., 1994). As mentioned above, it is more difficult to distinguish global from local unfolders in B2 than B1. This is also evident from analysis of AGO, versus temperature. For example, the temperature dependence of AGop for T55 shows that it is a high-energy local unfolder in B1 (Figure 7c) but cannot be differentiated from global unfolders in B2 (Figure 70 . The results presented here show that the AGO, values obtained from H-D exchange measurements and calorimetric AG,, provide highly complementary information on the AG versus temperature stability profiles of B1 and B2. The H-D
Biochemistry, Vol. 34, No. 46, 1995 15297
exchange measurements have the advantage of providing AG values for individual NHs.
Three residues, K31, A34, and D46, cannot be classified definitively as either global or local unfolders since AGO, approximates AG, in B 1 and B2 but AAG, % 0.3 kcal mol-] (Figures 4 and 5). For K3 1 and D46, AGO, is 0.6-0.8 kcal mol-' greater than AG,, in B2 but is approximately equal in B1 at 25 "C. The temperature dependent behavior of AGO, for K31 appears to be consistent with large-amplitude global unfolding in B1 and B2 (Figure 7b,e). Similar behavior is observed for D46 although the AGO, is 1 kcal mol-' lower than the averaged value for T44, T51, F52, T53, and V54 at 25 "C. For A34, AGop is 0.3 kcal mol-' less than the extrapolated AG,, in B 1 at 25 "C and converges with AG,, at 40 "C (Figure 7b). This suggests that A34 may exchange through a high-energy local rather than through a global unfolding mechanism.
For residues Y3 and T18, AGO, is significantly less than AG,, in the B2 domain, and therefore exchange occurs through a local unfolding mechanism (Figures 4 and 7d). However, AAG,, is greater than 2 kcal mol-' for both of these residues (Figure 5 ) , indicating relatively large changes in local stability between B2 and B 1. In the more stable B 1 domain, AGop approximates AGu for Y3 and T18 (Figures 4 and 7a), indicating that these residues may now exchange through a global unfolding mechanism. Thus, the B 1 domain appears to have a slightly larger core of residues which exchange by global unfolding than B2.
Local Stability Differences between Bl and B2. The largest local stability differences occur at residues Y3 and T18, which exchange 40-fold and 100-fold slower in B1, respectively (Table 1, Figure 3). These residues form a H-bond donor-acceptor pair at one end of the Pl-P2 hairpin (Figure 6). Local stability differences are also observed at neighboring residues such as T2, A20, and T16, although these AAGop values are smaller than for Y3 and T18 (Figure 5). Two of the six variant residues between B1 and B2 (Figure 6) occur in this region at positions 19 and 29. The E19K substitution (B1 to B2) has no effect on the intrinsic exchange rate of T18 and an approximately 2-fold enhance- ment of the intrinsic exchange rate of A20. The nearest- neighbor side-chain effects of residue 19 do not account for the large observed differences in exchange rates between B 1 and B2 for Y3, T18, and A20 (Table 1). Therefore, other effects due to tertiary structure must be responsible for the large rate differences. One possible reason for increased stabilization in this region of the P l -P2 hairpin may be due to the A29V substitution in going from B2 to B 1. This may lead to improved hydrophobic contacts between methyl groups from V29 and T18 (Figure 6), which would stabilize the P2-strand and slow exchange at T18, its H-bond partner Y3, and also neighboring residues. Indeed, preliminary investigations in our laboratory show that mutation of alanine to valine at position 29 stabilizes B2 by 4 "C, which is half of the stability difference between B1 and B2. This stabilizing effect may be subtle from a structural viewpoint. The distance beween the nearest y-methyl carbon of V29 and the methyl carbon of T I8 is -4.6 8, in B1 (Gallagher et al., 1994). In B2, the distance from the P-methyl carbon of A29 to the methyl carbon of T18 is also -4.6 8, (Achari et al., 1992). There is some adjustment in the structure of B 1 to accommodate the larger valine residue at position 29 in the helix. There are no direct Van der Waals contacts
15298 Biochemistry, Vol. 34, No. 46, 1995
between V29 and Y3 and only weak V29-A20 and V29- T16 interactions.
Stabilizing effects on non-H-bonded NHs in this region of the pl-P2 hairpin, such as residues 17, 19, and 21, are small with AAG,, 5 0.4 kcal mol-' (Figure 5). The exception is T2, for which AAG,, 2 0.6 kcal mol-'. Exchange is slower in B1 than B2 even though the NH of T2 is not H-bonded. This may be partly due to more local rigidity in B1 than B2 [cf. Kim et al. (1993)]. Additional stabilization in B 1 may come from a favorable electrostatic interaction between the y-carboxylate group of E19 and the N-terminal ammonium group of M1 (Figure 6) although this effect is expected to be attenuated at pD 3.1 where non-H- bonded NH exchange rates were measured.
Local stability differences are also evident at the other end of the ,Bl-p2 hairpin, near the pl-p2 turn. The largest stability difference for a fast exchange NH is observed for L12, where AAG,, 2 0.9 kcal mol-' (Figure 5). In B1, L12 is in close contact with L7 (Figure 6), whereas in B2, position 7 is an isoleucine. The exchange rate measurements suggest that the Van der Waals interactions between L7 and L12 are more favorable than when an isoleucine occupies position 7. Again, the differences in structure in this region appear to be quite small. The closest contacts between residues 7 and 12 are similar (hO.1 A) in B1 and B2, although L12 is disordered and exists in two discrete conformers in B2 (Achari et al., 1992) but not in B1 (Gallagher et al., 1994). Only lower limit values of AAG,,, could be obtained for K10 and T11 due to their faster-than-expected exchange behavior (see below). Thus, while there is no correlation between fast exchange rates and global stability, there appears to be a correlation with local stability in protein G.
The B 1 domain is approximately 1 kcal mol-' more stable than B2. The reasons for this stability difference do not seem to be readily apparent from inspection of the X-ray structures although improved hydrophobic contacts are implicated from an A29V stability mutant of B2. However, differences in local and global stability between the two domains are manifested as readily measurable changes in NH exchange rates for individual residues. Therefore, NH exchange rates provide a very sensitive measure of stability differences which are, at least in part, due to hydrophobic packing effects. Knowledge of these local stability differences in the Pl -p2 region provides potential approaches for design- ing new stability mutants in protein G.
Amide Protons with k,, > k,. Most non-H-bonded NHs have exchange rates which are '15 times slower than their intrinsic rates [Table 1; cf. Tuchsen and Woodward (1985)l. In marked contrast, exchange rates for K10, T11, and L12 in the p 1 -p2 turn are significantly faster than their intrinsic rates (five to 224 times), leading to negative AGO, values for these residues (Table 1; Figure 4). The X-ray structure of B1 shows that the Pl-P2 turn is capped by stabilizing H-bonds from (1) the €-ammonium group of K13 to the carbonyl groups of G9 and K10, and from (2) the y-car- boxylate group of E56 to the NH of K10 (Figure 6; Gallagher et al., 1994). Similar features are observed for the /3l-P2 turn in the B2 X-ray structure (Achari et al., 1992). Residues T11 and L12 are not H-bonded in the X-ray structures. In the solution structure for B1 (Gronenborn et al., 1991), the carbonyl group of G9 is H-bonded to the NH of L12 rather than the e-ammonium group of K13. The exchange rate data
Orban et al.
-1 1 5 9 13 17 21 25 29 33 37 41 45 49 53
Residue Number
'i -0.5-
D40 I B2
?2- -1 i,,,,, 1 5 9 13 17 21 25 29 33 37 41 45 49 53
Residue Number
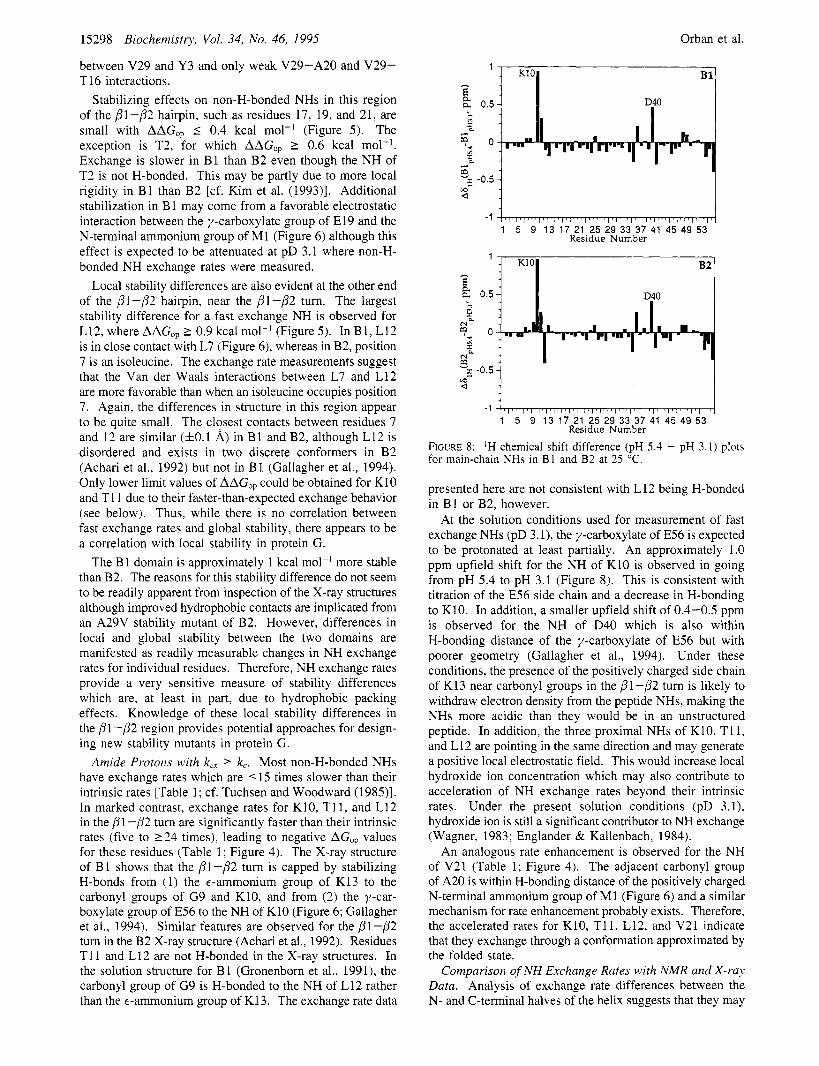
FIGURE 8: 'H chemical shift difference (pH 5.4 - pH 3.1) plots for main-chain NHs in B1 and B2 at 25 "C.
presented here are not consistent with L 12 being H-bonded in B1 or B2, however.
At the solution conditions used for measurement of fast exchange NHs (pD 3.1), the y-carboxylate of E56 is expected to be protonated at least partially. An approximately 1.0 ppm upfield shift for the NH of K10 is observed in going from pH 5.4 to pH 3.1 (Figure 8). This is consistent with titration of the E56 side chain and a decrease in H-bonding to K10. In addition, a smaller upfield shift of 0.4-0.5 ppm is observed for the NH of D40 which is also within H-bonding distance of the y-carboxylate of E56 but with poorer geometry (Gallagher et al., 1994). Under these conditions, the presence of the positively charged side chain of K13 near carbonyl groups in the pl-p2 turn is likely to withdraw electron density from the peptide NHs, making the NHs more acidic than they would be in an unstructured peptide. In addition, the three proximal NHs of K10, T11, and L12 are pointing in the same direction and may generate a positive local electrostatic field. This would increase local hydroxide ion concentration which may also contribute to acceleration of NH exchange rates beyond their intrinsic rates. Under the present solution conditions (pD 3.1), hydroxide ion is still a significant contributor to NH exchange (Wagner, 1983; Englander & Kallenbach, 1984).
An analogous rate enhancement is observed for the NH of V21 (Table 1; Figure 4). The adjacent carbonyl group of A20 is within H-bonding distance of the positively charged N-terminal ammonium group of M1 (Figure 6) and a similar mechanism for rate enhancement probably exists. Therefore, the accelerated rates for K10, T11, L12, and V21 indicate that they exchange through a conformation approximated by the folded state.
Comparison of NH Exchange Rates with NMR and X-ray Data. Analysis of exchange rate differences between the N- and C-terminal halves of the helix suggests that they may
Stability Differences in Protein G B1 and B2 Domains
be different structurally and/or dynamically (Table 1; Figure 4). This is consistent with results from other solution studies. For example, in the solution structure of B1, residues 22- 32 form an a-helix and residues 33-37 form a 3lo-helix (Gronenbom et al., 199 1). Furthermore, order parameters from I5N-relaxation measurements on B 1 indicate more mobility at the C-terminal end of the helix (Barchi et al., 1994). In contrast, no helical discontinuity is observed in the X-ray structures of B1 and B2, and both domains have a-helices from residue 23 to residue 38 (Achari et al., 1992; Gallagher et al., 1994). Crystallographic temperature factors for main-chain atoms are approximately the same for H-bonded residues in both halves of the helix.
The exchange rates of H-bonded NHs indicate that the P2-strand is the least stable, and therefore most mobile, of the P-sheet. Order parameters in B1 also indicate more mobility in the P2-strand (Barchi et al., 1994). However, the differences in order parameters between the P2-strand and the rest of the P-sheet are small compared with the relatively large differences in NH exchange rates (Table 1; Figure 4). Thus, the NH exchange data may provide a qualitative but more sensitive measure of main-chain mobility than order parameters. Similar observations have been made in comparing NH exchange and 15N-relaxation data in reduced and oxidized Escherichia coli thioredoxin (Jeng & Dyson, 1995). The main-chain temperature factors are only slightly higher in the P2-strand than the rest of the P-sheet for both B1 and B2 X-ray structures (Achari et al., 1992; Gallagher et al., 1994). This is probably due to the fact that intermolecular H-bonding exists between the p2-strand of one protein G molecule and the P3-strand of another in B1 and B2 crystals. In this case, crystal contacts perturb main- chain dynamics and complicate comparison of temperature factors with NH exchange data.
Comparison of AG, with AG,. Implications f o r the Unfolded State and Folding. In the calculation of AGop, the NH exchange rate in the unfolded state is equated with the intrinsic exchange rate, k,, which is determined for an unstructured peptide. However, if the unfolded state pos- sesses residual structure, k, will be an overestimate of the exchange rate in the unfolded state. From eq 4, this would lead to an overestimate of AGop for residues involved in the residual structure. In B1 and B2 at 25 "C, AGop values for some residues in the P3-P4 hairpin region are up to -1 kcal mol-] higher than the extrapolated AG, (Figure 4). Simi- larly, AGO, is greater than AG, for some residues in the N-terminal half of the helix in B1 and B2 although the differences are smaller. These results suggest that some residual structure may exist in the /33-/34 region in the "unfolded state" and perhaps also in the N-terminal half of the helix. The temperature dependence of AGop for residues T44, T51, F52, T53, and V54 in the ,83-/34 hairpin of B1 shows that, while the average AGop is - 1 kcal mol-' higher than AG, at 25 "C, it converges on the extrapolated AG, as the temperature is increased (Figure 7c). Analogous tem- perature dependent behavior is observed in B2 (Figure 70. The convergence of elevated AGop with AG, is consistent with a decrease in P3-P4 hairpin residual structure in the unfolded state as the temperature is increased. This is one possible interpretation of the elevated AGop values in the P3 -/34 region.
A potential limitation of this analysis is the accuracy of extrapolation of calorimetric data near the thermal transition
Biochemistry, Vol. 34, No. 46, 1995 15299
to lower temperatures. Nevertheless, the exchange rates presented here indicate that the P3-P4 hairpin region is more stable than the Pl -P2 hairpin region and may therefore be more populated in transient folding intermediates which are in dynamic equilibrium with the unfolded state. This is consistent with kinetic pulse-labeling data on B 1 which show that slow exchange residues in the P3-P4 region have slightly higher protection factors than other slow exchange residues in the P-sheet (Kuszewski et al., 1994). Interest- ingly, the highest protection factors in the helix were observed in the N-terminal end. Furthermore, recent studies show that the peptide corresponding to residues 41 -56 in the /33-/34 hairpin of B1 possesses some native-like structure as determined by CD and NMR measurements (Blanco et al., 1994). In contrast, peptides corresponding to the helix and Pl-P2 hairpin were found to be predominantly unstruc- tured in water (Blanco & Serrano, 1995).
Analysis of the present data suggests that some residual structure may exist in the unfolded state of protein G, although further experiments are needed to establish this conclusively. Comparison of AGop with the extrapolated AG, as a function of temperature may provide information about the unfolded state under native, nondenaturing condi- tions.
SUPPORTING INFORMATION AVAILABLE
Table of 'H and 15N chemical shifts for main-chain NHs in B1 and B2 at pH 5.4 and at pH 3.1, 25 "C (3 pages). Ordering information is given on any current masthead page.
REFERENCES
Achari, A., Hale, S. P., Howard, A. J., Clore, G. M., Gronenborn, A. M., Hardman, K. D., & Whitlow, M. (1992) Biochemistry 31, 10449-10457.
Akerstrom, B., & Bjorck, L. (1986) J . Biol. Chem. 261, 10240- 10247.
Alexander, P., Fahnestock, S., Lee, T., Orban, J., & Bryan, P. (1992a) Biochemistry 31, 3597-3603.
Alexander, P., Orban, J., & Bryan, P. (1992b) Biochemistry 31,
Bai, Y., Milne, J. S., Mayne, L., & Englander, S. W. (1993) Proteins
Bai, Y., Milne, J. S., Mayne, L., & Englander, S. W. (1994) Proteins
Barchi, J. J., Jr., Grasberger, B., Gronenborn, A. M., & Clore, G.
Bax, A., Griffey, R. H., & Hawkins, B. L. (1983) J . Mugn. Reson.
Bax, A., Ikura, M., Kay, L. E., Torchia, D. A,, & Tschudin, R.
Becktel, W. J., & Schellman, J. A. (1987) Biopolymers 26, 1859-
Blanco, F. J., & Serrano, L. (1995) Eur. J . Biochem. 230, 634-
Blanco, F. J., Rivas, G., & Serrano, L. (1994) Nature Struct. Biol.
Bodenhausen, G., & Ruben, D. J. (1980) Chem. Phys. Lett. 69,
Brandts, J. F. (1964) J . Am. Chem. SOC. 86, 4291-4301. Englander, S. W., & Kallenbach, N. R. (1984) Q. Rev. Biophys.
Englander, S. W., & Mayne, L. (1992) Annu. Rev. Biophys. Biomol.
Fahnestock, S. R., Alexander, P., Nagle, J., & Filpula, D. (1986)
Gallagher, T., Alexander, P., Bryan, P., & Gilliland, G. L. (1994)
7243-7248.
17, 75-86.
20, 4-14.
M. (1994) Protein Sci. 3, 15-21.
55, 301-315.
(1990) J . Mugn. Reson. 86, 304-318.
1877.
649.
1, 584-590.
185- 189.
16, 521-655.
Struct. 21, 243-265.
J . Bacteriol. 167, 870-880.
Biochemistry 33, 4721 -4729.
15300 Biochemistry, Vol. 34, No. 46, 1995
Gouda, H., Torigoe, H., Saito, A., Sato, M., Arata, Y., & Shimada, I. (1992) Biochemistry 31, 9665-9672.
Gronenbom, A. M., & Clore, G. M., (1993) J . Mol. Biol. 233,331- 335.
Gronenbom, A. M., Bax, A., Wingfield, P. T., & Clore, G. M. (1989) FEBS Lett. 243, 93-98.
Gronenbom, A. M., Filpula, D. R., Essig, N. Z., Achari, A., Whitlow, M., Wingfield, P. T., & Clore, G. M. (1991) Science 253, 657-661.
Hvidt, A,, & Nielsen, S. 0. (1966) Adv. Protein Chem. 21, 287- 386.
Jeng, M.-F., & Dyson, H. J. (1995) Biochemistry 34, 611-619. Kim, K.-S., & Woodward, C. K. (1993) Biochemistry 32, 9609-
Kim, K.-S., Fuchs, J. A., &Woodward, C. K. (1993) Biochemistry
Kraulis, P. J. (1991) J . Appl. Crystallogr. 24, 946-950. Kuszewski, J., Clore, G. M., & Gronenborn, A. M. (1994) Protein
Sci. 3, 1945-1952. Lian, L.-Y., Yang, J. C., Derrick, J. P., Sutcliffe, M. J., Roberts,
G. C. K., Murphy, J. P., Goward, C. R.. & Atkinson, T. (1991) Biochemistry 30, 5335-5340.
Lian, L.-Y., Derrick, J. P., Sutcliffe, M. J., Yang, J. C., & Roberts, G. C. K. (1992) J . Mol. B id . 228, 1219-1234.
Marion, D., & Wuthrich, K. (1983) Biochem. Biophys. Res. Commun. 113, 967-974.
Marion, D., Ikura, M., Tschudin, R., & Bax, A. (1989) J . Mugn. Reson. 85. 393-399.
9613.
32, 9600-9608.
Orban et al.
Myhre, E. B., & Kronvall, G. (1977) Infect. Immun. 17,475-482. Norwood, T. J., Boyd, J., Heritage, J. E., Soffe, N., & Campbell,
Orban, J., Alexander, P., & Bryan, P. (1992) Biochemistry 31, I. D. (1990) J . Mugn. Reson. 87, 488-501.
3604-361 1. Orban, J.: Alexander, P., & Bryan, P. (1994) Biochemistry 33,
5702-5710. Pace, C. N., & Tanford, C. (1968) Biochemistry 7, 198-208. Privalov, P. L. (1979) Adv. Protein Chem. 33, 167-241. Privalov, P. L., & Khechinashvili, N. N. (1974) J . Mol. Biol. 86,
Reis, K. J., Ayoub, E. M., & Boyle, M. D. P. (1984) J . Immunol.
Roder, H. (1989) Methods Enzymol. 176, 446-473. Roder, H., Wagner, G., & Wuthrich, K. (1985) Biochemistry 24,
Shaka, A. J., Barker, P. B., & Freeman, R. (1985) J . Mugn. Reson.
Stone, G. S., Sjobring, U., Bjorck, L., Sjoquist, J., Barber, C. V. ,
Tuchsen, E., & Woodward, C. (1985) J . Mol. Biol. 185,405-419. Wagner, G. (1983) Q. Rev. Biophys. 16, 1-57. Woodward, C., Simon, I., & Tuchsen, E. (1982) Mol. Cell. Biochem.
Wright, C., Willan, K., Sjodahl, J., Burton, D. R., & Dwek, R.
665 -684.
132, 3098-3102.
7396-7407.
64, 547-552.
& Nardella, F. A. (1989) J. Immunol. 143, 565-573.
48, 135-160.
(1977) J . Biochem. 167, 661-668.
BI95 1273N