Assessment of solid load and siltation potential of dams ...
25
Amal Markhi : Phd Student Supervisor : Pr : N.Laftrouhi Assessment of solid load and siltation potential of dams reservoirs in the High Atlas of Marrakech (Moorcco) using SWAT Model
Transcript of Assessment of solid load and siltation potential of dams ...

Amal Markhi: Phd Student Supervisor: Pr :N.Laftrouhi
Assessment of solid load and siltation potential of dams reservoirs in the High Atlas of Marrakech
(Moorcco) using SWAT Model

Contextualization
Facing the uncontrolled exploitation of natural resources resulting in the deterioration of land in the N'FIS watershed
assessment and mapping of water erosion of soil is performed to allow the spatial parameters
SWAT
make proposals for it development to fight against erosion

Environmental issues are always spatial orientated.
Many computer models have been developed to predict soil erosion. The database of information required by these tools is relatively complex.
GIS can handle those spatial data very easily and efficiently.
Why is GIS useful in soil erosion study?

The erosion factors influence the intensity of theprocess of detachment , transport and deposition ,lead to specific forms of erosion. We can mention
five:
Facteurs d’Erosion
Vegetation
Cultural technics
Soils
Topography
Rainoff

Localisation: The north side of the central high atlasAltitude: -the average elevation: 2074m
- Median : 2080m- The most frequent elevation: between 1600 and 2000 m
Climat: semiarid , high spatiotemporal heterogeneity. . The temperatureat the opposite precipitation is quite regular . The measurements showan average annual temperature of 18.6 ° C
Study Area
The morphology of the N'fis watershed is diverse by the effect ofmultiple tectonic movements and erosion affecting this geologicalstructure , one can observe :-From the peaks and ridges- Trays dissected hills– Depressions Narrow and deep valleys- Alluvial terraces staggered levels or nested- A brutal contrast between the horizontal planes of the high placesand slopes .
Study area

Study Area
The distribution of soil at the N'Fis basin depends mainly on the nature of the source rock ,topography , and vegetation type , The soil units type sandy and clay soils form two different sets oriented NE -SW
both types are developed on primary shale on land eruptive and limestone .To the north of the basin, a great depression of Permo-Triassic land, Jurassic and Cretaceous consist of
sandstones, marl or clay licks and limestone

* It is the seat of a large number of dams and lakes that depend heavily on the ability of watershed erosion.
* This is a recent string with slopes of significant value and producing large quantities of solids.
Problem and Objective
Quatify the soil erosionprocess

RUSLEUniversal Soil Loss
Equation
Wischmeier, W.H. and D.D. Smith. 1978. Predicting rainfall erosion losses. USDA Agriculture Handbook 537, U.S. Department of Agriculture.
Methodology

A = R K L S C P
A is the computed soil loss(tons/acre/year)
R is the rainfall-runoff erosivity factor
K is the soil erodiility factor
L is the slope length factor
S is the slope steepness factor
C is the cover-management factor
P is the supporting practices factor

The loss of soil values vary between 0 and 123 t / ha / year , depending of the watershedarea. The average soil loss is estimated at 60t / ha / year, which is considered high andexceeds the acceptable threshold of soil loss of 3t / ha / year estimated for areas thatpresents similar conditions to those of the watershed of N'FIS
Results

In this study, we had used the ArcSWAT graphicaluser interface to manipulate and execute the majorfunctions of SWAT model from the ArcGIS tool
Methodology

Input data:
Dem, Landuse, Soils
Location of weather station
Weather time series
Gis Processing:
Watershed delineation
Sub-basins delineation
Streams deleneation
HRUs Definition
Configuration input files:
Writing SWAT input
Editing SWAT
Configuration user tables
Reading output
Model Run
Sensitivity analysis
Model calibration
Model validation
Model Run:
Reading report
Parameters optimal value
Methodology

Creation of the Database
The recovery of digital model representing the relief of the studied area
The digitalization of the soil and geological map of the studied area;
The processing of satellite images through the process of supervised classificationfor extracting land use map;
Recovery and structuring in adequate files of data on the climate at themeteorological stations studied;
The processing of these climate files
Collecting and structuring data concerning the soils analysis
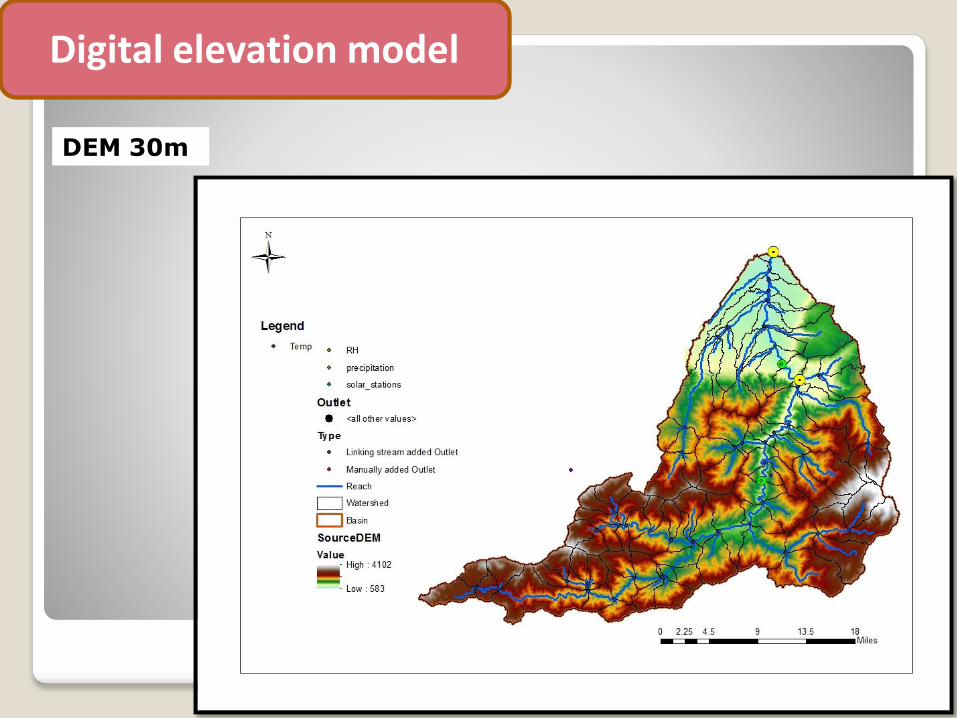
Digital elevation model
DEM 30m

The soil units consist of type sandy and clay soils types are developed on primary shale on landeruptive and limestone . The main soils are listed :• developed soils of ranker types• The soil calcimagnesic rendzinas kind( brown limestone or lime )
Soils map
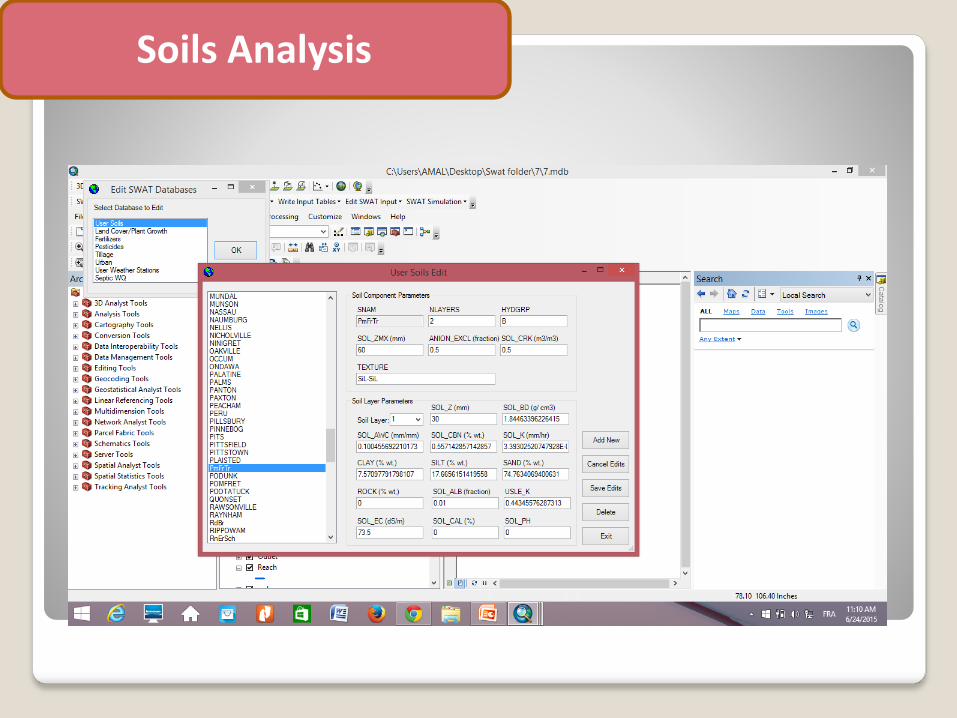
Soils Analysis

Watershed N'fis distinguished by a diverse natural vegetation and includes two forest formations thattake almost all of the basin area and are located mainly upstream it is the drill Goundafa and Aghbar.From the point of view of earth rotation, the cultural practice of the population reveals a predominanceof cereal and a small part for arboriculture but remains insignificant.
Landuse

Precipitation FROM (ABHT)
Temperature
+
Solar radiation
+
Relative humidity FROM (CFSR global weather)
Climat

Warm up 2 years
Daily output 2000 to 2009
Simulation

Hydrologic Balence
ET 40% of precipitation
High permeability
PREC
perc LATE
ET
SURQ
water YIELD

Annuel average Erosion distribution ratio by HRU
1
2
3
4
5
6
7
8
9
10
11
12
13
14
15
16
The ration vary betweek 10 to 70 t/ha/yrAverage Ratio=19 t/ha/an ,and maximum ration is 160 t/ha/an
Results

ResultsAveragevalue32.22t/ha

ResultsS
edim
ents
10
3t
Sed-in
Sil
tati
on
(M
m3)
Siltation (Millions m3)
for the monthly changes in sediment supply to the dam Lallatakerkoust it reacts by runoff processthis figure shows that most of the sediment that reaches the dam is completed in period of floods
Siltation 1.8mm3/yr .

Quatify solid load by sub-basin to identify the most influenced in the process of erosion
The study can be continued in the same method in neighboring watersheds in order tocompare results and also for a regional study that is to say, locate areas at risk in theTensift basin
Collecting more climatic data and MES for calibration and validation of the model
Conclusion and perspective

Amal Markhi: PhdStudent
Supervisor: Pr :N.Laftrouhi
Assessment of solid load and siltation potential of dams reservoirs in the High Atlas of Marrakech
(Moorcco) using SWAT Model