Assessment of Solar Powered Drip Irrigation Project ... · The total value of the each drip...
60
Assessment of Solar Powered Drip Irrigation Project Implemented by Ministry of Agriculture - Phase 1 M.M.M. Aheeyar M.A.C.S. Bandara M.T. Padmajani Research Report No: 148 September 2012 Hector Kobbekaduwa Agrarian Research and Training Institute 114, Wijerama Mawatha Colombo 07 Sri Lanka
Transcript of Assessment of Solar Powered Drip Irrigation Project ... · The total value of the each drip...

Assessment of Solar Powered Drip
Irrigation Project Implemented by
Ministry of Agriculture - Phase 1
M.M.M. Aheeyar
M.A.C.S. Bandara
M.T. Padmajani
Research Report No: 148 September 2012
Hector Kobbekaduwa Agrarian Research and Training Institute
114, Wijerama Mawatha
Colombo 07
Sri Lanka
First Published: 2012
© 2012, Hector Kobbekaduwa Agrarian Research and Training Institute
ISBN: 978-955-612-138-4
Suggested citation: Aheeyar, M.M.M., Bandara, M.A.C.S. and Padmajani, M.T.
(2012). Assessment of Solar Powered Drip Irrigation Project Implemented by
Ministry of Agriculture- Phase 1. HARTI Research Report No: 148, Hector
Kobbekaduwa Agrarian Research and Training Institute, Colombo, Sri Lanka.

i
FOREWORD
The government of Sri Lanka has made various attempts to promote drip irrigation
technology in the past to increase water use efficiency and enhance the income levels
of farmers in the water scarce areas. Provision of Solar Powered Drip Irrigation
(SPDI) Systems is one such effort. As the SPDI system is an environmental friendly
advance water saving technology, it is considered as one of the adaptation strategies
to minimize the climate change impacts on water and food sector.
The present study has endeavored to analyze the performance of the SPDI systems
distributed under the phase-1 of the project implemented by the Ministry of
Agriculture. The approach adopted, strategies used, impacts and lessons learnt from
the project are important for future promotion of the technology. The use of drip
irrigation technology has multiple benefits viz; water and labour saving, efficient use
of fertilizer, less weeds growth, and reduced environmental pollution. The technology
has the ability to produce high quality yields and higher income due to both ability of
off season cultivation and higher production.
Enhancing the water use efficiency in agriculture sector is a vital requirement with the
increasing demand for water for human and environmental needs. Various
technologies and management tools were adopted to reduce the agricultural water
demand, but drip irrigation technology has been proven all over the world as one of
the effective technologies to reduce the agricultural water consumption. I am sure this
study would add new knowledge in this area and guide the policy makers and
implementers for successful future project implementations.
Lalith Kantha Jayasekara
Director
ii
ACKNOWLEDGEMENTS
At the outset it is our duty to thank Sustainable Agriculture Water Management
Project (SAWMP) of the Ministry of Agriculture for its assistance and generous
cooperation extended in conducting this study. Our sincere thanks go to the district
level field coordinators of the project for their valuable assistance provided in field
data collection. The research team is very grateful to all grass root level officers
namely, Divisional Officers (DOs), Agricultural Instructors (AI), Samurdhi Managers,
and Agricultural Research and Production Assistants (ARPAs) of all selected areas
for their kind cooperation extended to conduct the study.
We would like to thank, Mr. Lalith Kantha Jayasekara, Director, Hector
Kobbekaduwa Agrarian Research and Training Institute (HARTI), for providing
support to conduct this study and publishing the report. Dr. L.P. Rupasena,
Additional Director of HARTI also provided his constant support and guidance to
complete this study on time. A special word of thanks to Prof. W.I. Siriweera for the
expert editorial assistance provided.
We are also indebted to Mr. A Ratnasiri, Statistical Assistant of HARTI for his
commitment and dedication shown in field data collection and analysis. The service
rendered by Ms. Niluka Priyadarshani de Silva, Management Assistant of HARTI in
typesetting the report and Ms. Dilanthi Hewavitharana, Secretary, Publication Unit of
HARTI in final page setting of the report are highly appreciated. Our thanks are also
due to the printing staff of HARTI for their excellent handling of the publication.
Finally, we warmly acknowledge the co-operation extended by the solar powered drip
irrigation beneficiaries of the selected study areas.
M. M. M. Aheeyar
M. A. C. S. Bandara
M.T. Padmajani
September 2012

iii
ABSTRACT
Solar powered drip irrigation project (SPDI) was implemented by the “Sustainable
Agriculture Water Management Project (SAWMP)” operated under the Ministry of
Agriculture with the partnership of BP Solar (PVT) Ltd of Australia. The project has
supplied and installed 5000 units of 150W SPDI in selected areas of the dry zone
throughout the country under the phase one of the project. The SPDI systems are
provided to farmers under a loan scheme. The total value of the each drip irrigation
system is Rs.300,000 at the time of delivery. The selected beneficiaries have to pay an
initial down payment of Rs.5000 at the Samurdhi bank or Govijana bank. The
remaining cost has to be settled within 10 years making biannual payments in 20
installments paid after one year grace period. Agreement between beneficiary farmers
and the Ministry of Agriculture was signed to legally ensure cost recovery. Farmers
have to look after the routine maintenance of the system using the training offered and
user manual provided by the company. All the repair works of the systems was the
responsibility of the Bp Solar Company during the warranty period of first three
years. SAWMP has to undertake creating awareness among farmers, select suitable
farmers, identify the suitable locations, identify the feasibility of available water
source, sign the agreement with farmers with initial installment, monitor the
establishment of drip irrigation system, ensure the supply of inputs to implement
agricultural programme among drip irrigation farmers and collect loan installments on
time and credit them to the treasury accounts.
SPDI technology is a new experience for the Sri Lankan farmers. The major objective
of this evaluation is to assess the achievements of the aims of providing SPDI systems
and fulfilling roles and responsibilities of different stakeholders of the project and the
initial impacts to formulate the strategies for the similar future projects.
According to the findings of the study, only 20% of the beneficiaries have paid any
installment after paying the initial down payment, but none of them make regular
payments of installment. Farmers do not value the product for the given amount.
Moreover, only five percent of the farmers use complete set of SPDI, while seven
percent are using the drip system without fertigation unit. The non use of drippers by
88% of the farmers indicates the failure of the project in achieving its objectives such
as water saving, labour saving, enhancing productivity, and environmental
conservation. The proper targeting of beneficiaries is a vital requirement to introduce
advance technologies. The main reasons for the non usage of drippers are, blocking of
drippers, difficulties in cleaning of drippers, lack of knowledge on drip system,
damage caused to drip lateral pipes by rodents, insufficient water supply from the
drippers to crops, small land size and non existence of water scarcity to use drip
irrigation. Only 10% of farmers have utilized the drip irrigation for some kind of
cultivation during yala 2010, while it was limited to 4% of farmers in maha 2009/10
Therefore it is necessary to conduct pilot studies before promotion of new
technologies. Awareness on O&M of the system and the appropriate cultivation using
drip system is lacking among farmers. The project should have adequate component
to enhance the capacities of the beneficiary farmers and ground level officers.
iv
The solar power company had rendered poor after sales services and had violated the
agreement on many occasions which indicates the necessity for suitable terms and
conditions with well established post monitoring mechanism in working with private
sector. The project has failed in recovering the loan and the same trend is continuing
in the second phase. Farmers do not value the product for the amount that has to be
paid though they had signed the agreement with or without knowing the content. This
is an indication of lack of transparency in the project implementation.
As the degree of use of SPDI system for the given purpose is very poor and as
majority of the farmers do not make any payments other than initial down payments,
it is not recommended to continue this project in this form. The selection of
beneficiaries should be undertaken by the line agency officers as the loan recovery
and monitoring of the project are their responsibility. Farmers should be convinced
about the benefits in adopting the technology and there should be appropriate water
sources (quantity and quality). There should also be water scarcity at least during
some periods of the year. The inbuilt nozzles and poor quality drip laterals need to be
changed to make them user friendly and durable. The major lesson of the project is
that, the introduction of new technologies should be undertaken by targeting most
suitable beneficiaries and institutionalizing proper backup and after sales supports.
The technology should be easily operated and maintained by the rural farmers.

v
LIST OF CONTENTS
Foreword ................................................................................................................. i
Acknowledgements ....................................................................................................... ii
Abstract ............................................................................................................... iii
List of Contents ..............................................................................................................v
List of Tables .............................................................................................................. vii
List of Figures ............................................................................................................ viii
List of Abbreviations ................................................................................................. viii
Chapter 1 .................................................................................................................1
Introduction .................................................................................................................1
1.1 Background ...................................................................................................1
1.2 Sustainable Agriculture Water Management Project (SAWMP) .................2
1.2.1 Solar Powered Drip Irrigation System .............................................3
1.3 Method of Implementation ...........................................................................3
1.3.1 Selection Criteria of Beneficiaries ...................................................3
1.3.2 Roles & Responsibilities of Solar Power Company ........................4
1.3.3 Roles & Responsibilities of SAWMP .............................................4
1.4 Relevance of the Study .................................................................................5
1.5 Objectives of the Study ................................................................................5
Chapter 2 .................................................................................................................7
Methodology .................................................................................................................7
2.1 Site Selection and Sample Size .....................................................................7
2.2 Data Collection Methods ..............................................................................8
2.3 Data Analysis ................................................................................................9
Chapter 3 ...............................................................................................................11
Approach of the Intervention and Achievements ........................................................11
3.1 Demographic Characteristics of Beneficiaries ............................................11
3.1.1 Family Size Distribution ................................................................11
3.1.2 Age Distribution.............................................................................11
3.1.3 Education Level of the Beneficiaries .............................................12
3.1.4 Employment ...................................................................................14
3.1.5 Land Availability and Land Use Pattern ........................................14
3.2 Accomplishment of Proposed Criteria in the Selection of Beneficiaries....16
3.3 Accomplishment of Roles and Responsibilities of the Project by
Stakeholders ................................................................................................18
vi
3.3.1 BP Solar Company .........................................................................18
3.3.2 SAWMP or Ministry of Agriculture ..............................................20
3.3.3 Beneficiary Farmers .......................................................................22
3.3.3.1 Repayment of Loan ................................................................ 22
3.3.3.2 Reasons for Nonpayment ....................................................... 24
Chapter 4 ...............................................................................................................27
Performance of Utilizing Drip Irrigation Systems .......................................................27
4.1 Degree of Use of Full Set of Drip Irrigation Systems ................................27
4.2 Use of Different Components of Drip Irrigation Systems ..........................28
4.3 Farmers Awareness on the Use of Drip Irrigation Systems and Training
Needs ..........................................................................................................28
4.4 Operation and Maintenance ........................................................................29
4.5 Reasons for Non Use and Partial Use of Drip Irrigation Systems ..............32
Chapter 5 ...............................................................................................................37
Effects and Impacts of the Solar Powered Drip Irrigation Projects .............................37
5.1 Impacts of SPDI Project ..............................................................................37
5.1.1 Cropping System ............................................................................37
5.1.2 Socio Economic Impacts................................................................38
5.1.3 Environmental Impacts ..................................................................41
5.1.4 Gender Impacts ..............................................................................41
5.2 Benefits of Solar Powered Drip Irrigation Project ......................................41
5.3 Drawbacks of Solar Powered Drip Irrigation Project .................................42
Chapter 6 ...............................................................................................................45
Conclusion and Recommendations ..............................................................................45
6.1 Major Findings ............................................................................................45
6.2 Conclusion ..................................................................................................47
6.3 Recommendations .......................................................................................48
References ...............................................................................................................50

vii
LIST OF TABLES
Table 1.1: Expected Outcome of SAWMP ..............................................................2
Table 2.1: Distribution of Sample ............................................................................8
Table 3.1: Family Size Distribution by District .....................................................11
Table 3.2: Age Distribution of Farmers by District (% of total beneficiaries) .......12
Table 3.3: Level of Education by District (% of Beneficiaries) .............................13
Table 3.4: Employment Pattern in Sample Area ....................................................14
Table 3.5: Distribution of Land Extents According to Size ...................................14
Table 3.6: Distribution of Land by Ownership in Sample Area .............................15
Table 3.7: Farmers Knowhow about the Repayment Conditions and the Payments
Made ......................................................................................................23
Table 3.8: Number of Farmers Who Adhered the Informed Repayment Conditions
and the Total Amount of Installments Paid Until 2010.........................23
Table 3.9: Repayment Pattern of Loan Installments by Districts (Number of
Beneficiaries ..........................................................................................24
Table 4.1: Present Status of Usage of SPDI System ..............................................27
Table 4.2: Types of Usage of SPDI System ...........................................................27
Table 4.3: Ways of Informing Maintenance Requirements of the SPDI System ...30
Table 4.4: Use of SPDI System Without Drip Set .................................................32
Table 4.5: Reasons for Non Use of Fertigation Unit ..............................................34
Table 4.6: Problems and Constrains in the Use of SPDI System ...........................35
Table 5.1: Types of Usage of SPDI Systems (%of Beneficiary Farmers) .............39
Table 5.2: Value of Energy Saving by SPDI System .............................................40
Table 5.3: Value of Labour Saving by SPDI System .............................................40
Table 5.4: How Household Income Increased by Solar Powered Drip Irrigation
Systems? (% of Beneficiary Perception) ...............................................41
Table 5.5: Advantages of Using SPDI Systems (%of Currently Using or Earlier
used Farmers) ........................................................................................42
Table 5.6: Barriers in Using Solar Powered Drip Irrigation Systems (% of Farmer
Perception).............................................................................................43
Table 5.7: Reasons for Not Using Solar Powered Drip Irrigation Systems (% of
Farmer Perception) ................................................................................43
viii
LIST OF FIGURES
Figure 3.1: Age Distribution of Beneficiaries (% of total beneficiaries) .................12
Figure 3.2: Educational Level of Sample Beneficiaries ..........................................13
Figure 3.3: Land Distribution Based on Number of Land Holdings .......................15
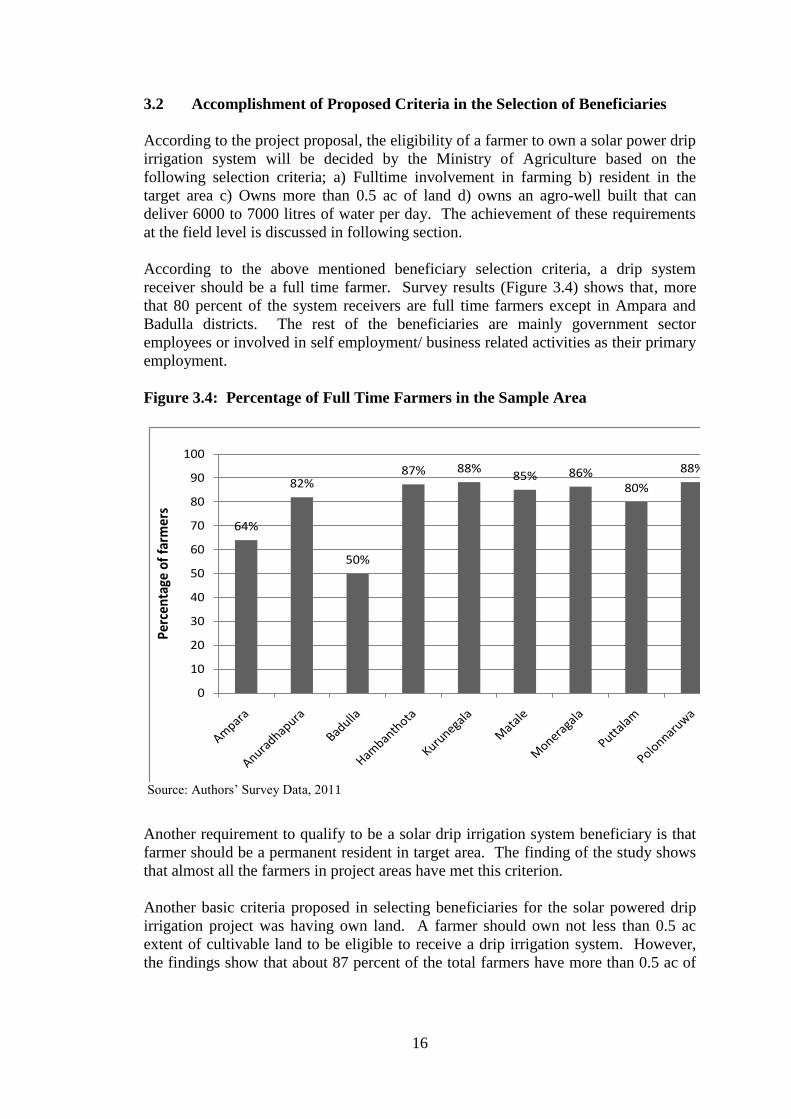
Figure 3.4: Percentage of Full Time Farmers in the Sample Area ..........................16
Figure 3.5: Land Distribution Among Beneficiaries ...............................................17
Figure 3.6: Water Source for Solar Power Drip Irrigation System ..........................17
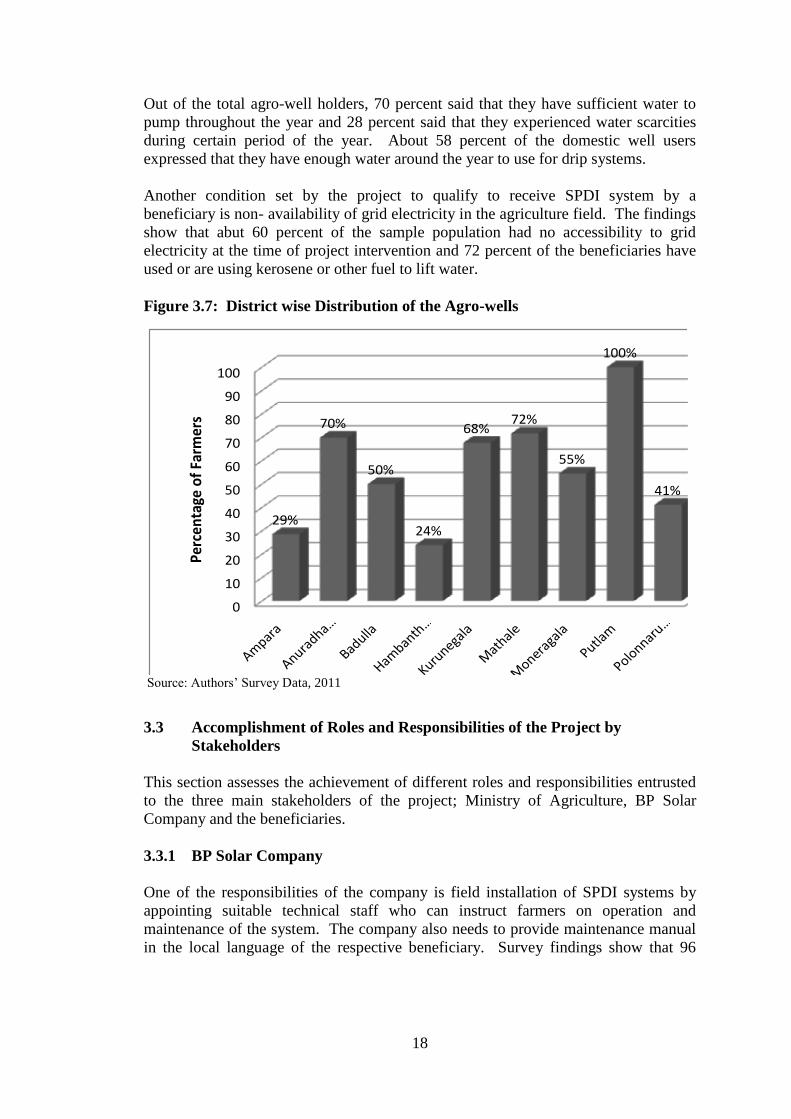
Figure 3.7: District wise Distribution of the Agro-wells .........................................18
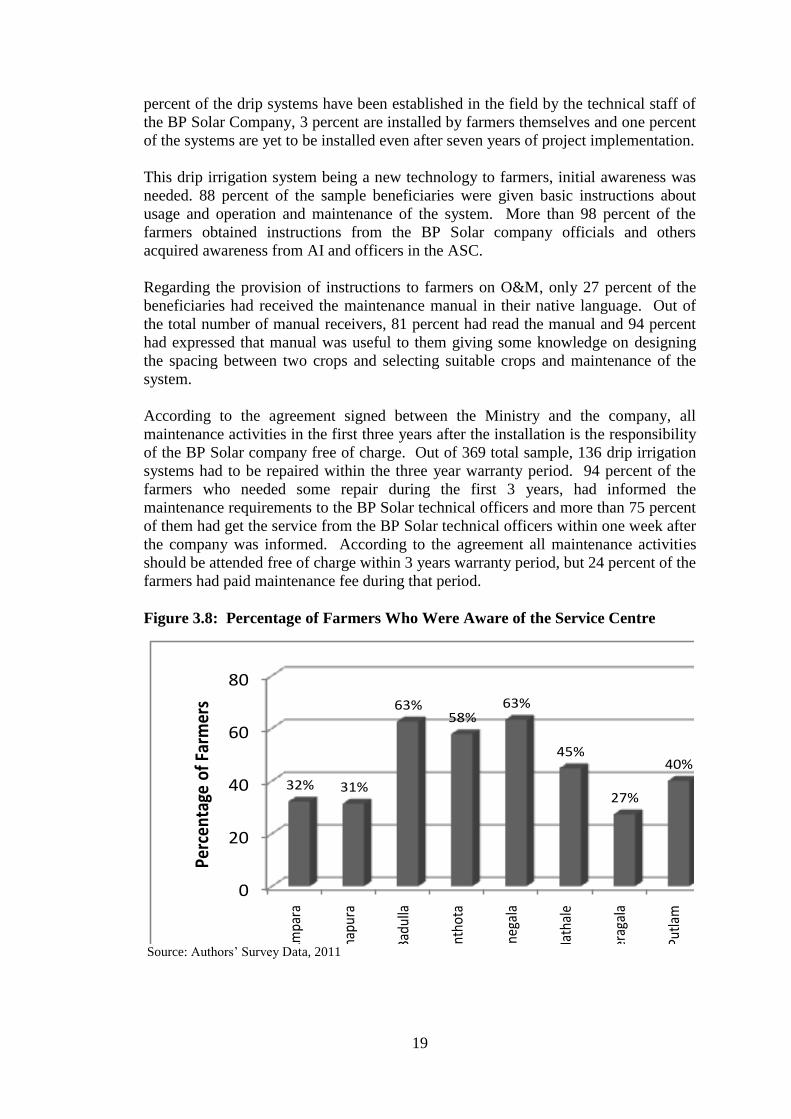
Figure 3.8: Percentage of Farmers Who Were Aware of the Service Centre ..........19
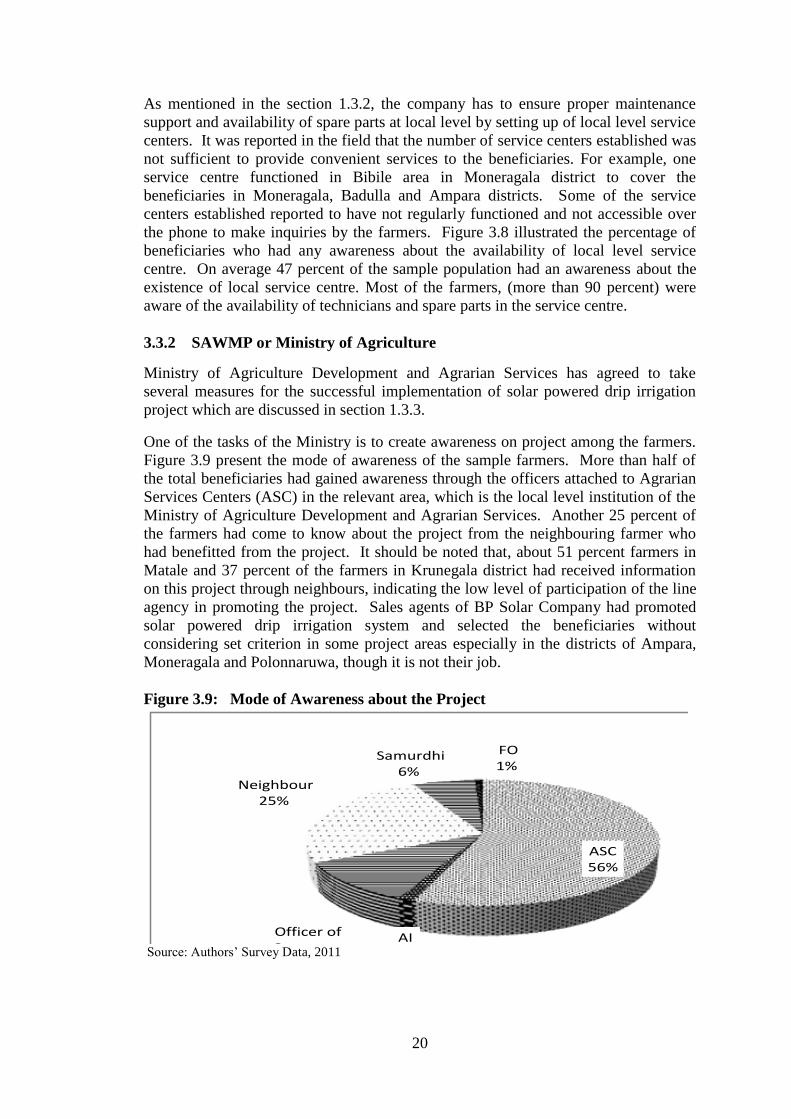
Figure 3.9: Mode of Awareness about the Project ...................................................20
Figure 3.10: Percentage of Sample Farmers Who Paid an Installment .....................22
Figure 4.1: SPDI System Status and Usage (% Percentage of Beneficiaries) .........28
Figure 4.2: Usefulness of Training Manual Given (Percentage of Manual users) ..29
Figure 4.3: Time Taken to Attend the Maintenance Works ....................................30
Figure 4.4: Level of Satisfaction About the Maintenance Offered by the
Company ...............................................................................................31
Figure 4.5: Reasons for Unsatisfactory Services from the BP Solar Company .......32
Figure 4.6: Usage of Fertigation Unit ......................................................................33
Figure 4.7: Status of Usage of SPDI System Vs Reasons for Non Use...................35
Figure 5.1: Number of Farmers Undertook Crop Cultivation Using Drip System–
Yala 2010 ...............................................................................................37
Figure 5.2: Number of Farmers who Undertook Crop Cultivation Using Drip
System–Maha 2009/10 ..........................................................................38
Figure 5.3: Total Extent Cultivated by Sample Farmers Using Drip System (In
acres) .....................................................................................................38
LIST OF ABBREVIAIONS
ADC - Agrarian Development Centers
AI - Agriculture Instructors
ASC - Agrarian Services Centers
DOA - Department of Agriculture
DO - Divisional Officers
O&M - Operation and maintenance
SPDI - Solar Powered Drip Irrigation
SAWMP - Sustainable Agriculture Water Management Project
1
CHAPTER ONE
Introduction
1.1 Background
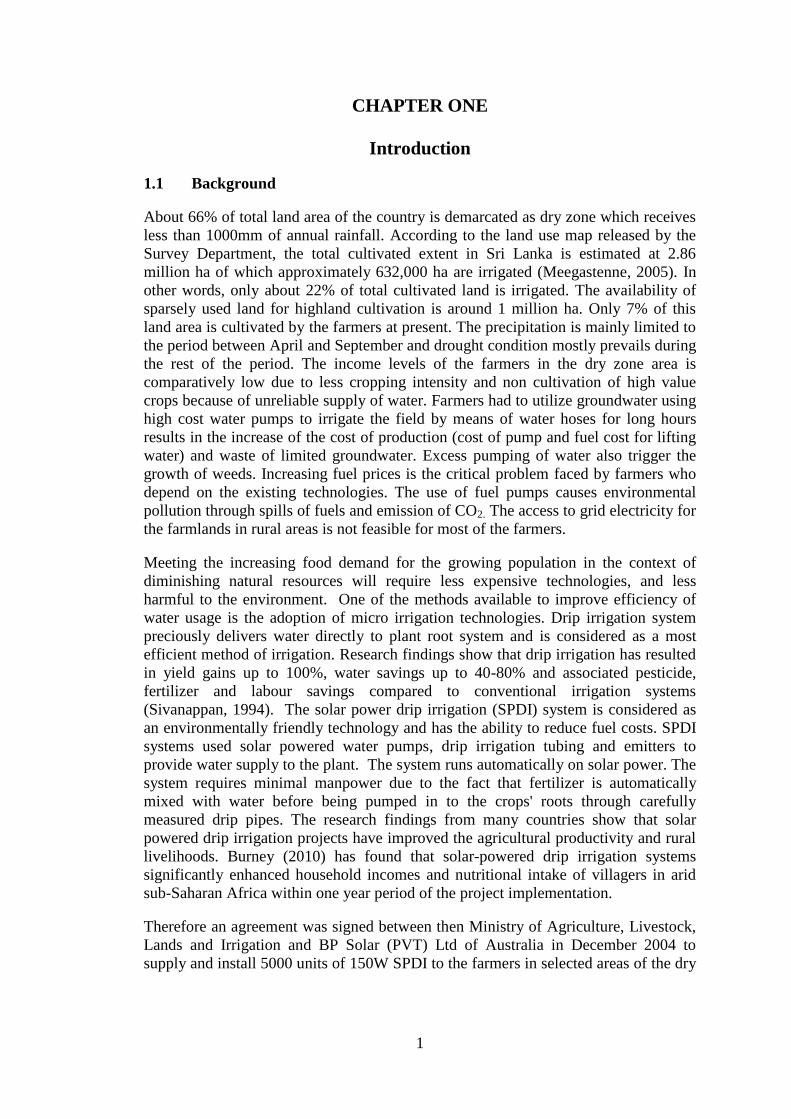
About 66% of total land area of the country is demarcated as dry zone which receives
less than 1000mm of annual rainfall. According to the land use map released by the
Survey Department, the total cultivated extent in Sri Lanka is estimated at 2.86
million ha of which approximately 632,000 ha are irrigated (Meegastenne, 2005). In
other words, only about 22% of total cultivated land is irrigated. The availability of
sparsely used land for highland cultivation is around 1 million ha. Only 7% of this
land area is cultivated by the farmers at present. The precipitation is mainly limited to
the period between April and September and drought condition mostly prevails during
the rest of the period. The income levels of the farmers in the dry zone area is
comparatively low due to less cropping intensity and non cultivation of high value
crops because of unreliable supply of water. Farmers had to utilize groundwater using
high cost water pumps to irrigate the field by means of water hoses for long hours
results in the increase of the cost of production (cost of pump and fuel cost for lifting
water) and waste of limited groundwater. Excess pumping of water also trigger the
growth of weeds. Increasing fuel prices is the critical problem faced by farmers who
depend on the existing technologies. The use of fuel pumps causes environmental
pollution through spills of fuels and emission of CO2. The access to grid electricity for
the farmlands in rural areas is not feasible for most of the farmers.
Meeting the increasing food demand for the growing population in the context of
diminishing natural resources will require less expensive technologies, and less
harmful to the environment. One of the methods available to improve efficiency of
water usage is the adoption of micro irrigation technologies. Drip irrigation system
preciously delivers water directly to plant root system and is considered as a most
efficient method of irrigation. Research findings show that drip irrigation has resulted
in yield gains up to 100%, water savings up to 40-80% and associated pesticide,
fertilizer and labour savings compared to conventional irrigation systems
(Sivanappan, 1994). The solar power drip irrigation (SPDI) system is considered as
an environmentally friendly technology and has the ability to reduce fuel costs. SPDI
systems used solar powered water pumps, drip irrigation tubing and emitters to
provide water supply to the plant. The system runs automatically on solar power. The
system requires minimal manpower due to the fact that fertilizer is automatically
mixed with water before being pumped in to the crops' roots through carefully
measured drip pipes. The research findings from many countries show that solar
powered drip irrigation projects have improved the agricultural productivity and rural
livelihoods. Burney (2010) has found that solar-powered drip irrigation systems
significantly enhanced household incomes and nutritional intake of villagers in arid
sub-Saharan Africa within one year period of the project implementation.
Therefore an agreement was signed between then Ministry of Agriculture, Livestock,
Lands and Irrigation and BP Solar (PVT) Ltd of Australia in December 2004 to
supply and install 5000 units of 150W SPDI to the farmers in selected areas of the dry

2
zone through out the country under the phase one of the project. The novel features of
the BP Solar system are ability to operate without batteries and low light conditions. It
was expected to generate 250KWh electricity per system per year. The approximate
project value of the phase 1 is Aus$ 1.2 million. The SPDI systems are provided to
farmers under a loan scheme repayable within a period up to ten years. As the system
has produced good results in other parts of the world and in pilot test conducted in
local conditions, it was expected that there won’t be a problem in repayment. The
company had to provide service for maintenance of the system through their technical
staff and train the farmers on operation and maintenance (O&M) of the system. The
company had to provide training for the district officers and Agricultural Instructors
on O&M and improved method of agriculture. It was agreed to provide another 5000
units in the second phase of the project after successful completion of first phase.
1.2 Sustainable Agriculture Water Management Project (SAWMP)
The SPDI project was implemented by the “Sustainable Agriculture Water
Management Project (SAWMP)” operated under the Ministry of Agriculture. The
project was initially planned to implement throughout the dry zone and some parts of
wet zone covering Puttalam, Kurunegala, Polonnaruwa, Anuradhapura, Vavuniya,
Hambantota, Badulla, Moneragala, Matalae, Nuwara-eliya, Kandy, Mullaitivu,
Kilinochchi, Mannar, Jaffna, Trincomalee, Batticoloa and Ampara Districts, but, the
project was not implemented in Northern Districts and Batticoloa district in the
eastern province. The aims of the project were to enhance farm productivity, farmers’
income and livelihood of the beneficiary farmers. Another objective of the project
was to demonstrate the viability of using renewable energy with drip irrigation
systems among rural farmers. The use of irrigation system expected saving in water,
fuel and fertilizer and improving crop yield and the quality of harvest. The anticipated
outcomes of the project are summarized in table 1.1.
Table 1.1: Expected Outcome of SAWMP
Outcome Impact
Agriculture Increased cropping intensity
Improved crop yield
Increased farm income due to high value crops
Improved quality of outputs
Increase water use efficiency
Reduce cost of production (Less input, labour and fuel cost)
Socio-Economic Increased family income
Improved family welfare
Increased employment opportunities
Gender Increased leisure time
Reduced difficulties in work
Human Health and
Environmental Improved water management
Reduced soil erosion
Protect groundwater
Effective application of fertilizer
Reduced health risk exposure (Toxic fumes etc) Source: SAWMP, 2006

3
1.2.1 Solar Powered Drip Irrigation System
Solar powered drip irrigation system provided by the project has following
components to service up to half an acre of land.
i) Solar Panel- Solar panel is to generate energy to run the water pump. The
panel has 25years limited warranty. Quarterly manual checkup of solar
module is recommended to remove dust and other such substance to ensure
maximum power from the module.
ii) Water pump- This is a specially designed pump to operate at even very low
light intensity. In a normal day the pump has the capacity to deliver 6500-7000
litre of water /day during eight hour period.
iii) Maximum Power Point Tracker (MPPT) - The Unit adjusts the variation of
voltage on the solar array to maximize power generation.
iv) Filters- A disk filter is installed between the pump and the irrigation pipes to
remove the solids in the water to prevent the drippers getting clogged. The
filter is easy to clean and does not require replacement cartridges.
v) Fertigator Tank- Fertigator tank consists of five litre steel tank to dispense
fertilizers/chemicals through the drip to the crops.
vi) Drip System- Each system was provided with 4000 drip points. Drippers are
placed at 30cm intervals. The drip line also consisted of self cleaning devise to
prevent clogging of drippers.
In addition to the above major components, each system is equipped with mounting
structures for solar array, and water pump, water pump enclosures, 12m long suction
line, 1.25” plastic foot valve, steel support structures for fertigator tank and filter and
concrete base for pole mount structures of solar panel, solar water pump, fertigator
tank and filter.
The provided system is designed to irrigate ¼ to ½ ac block of land typically for 6
hours per day.
1.3 Method of Implementation
1.3.1 Selection Criteria of Beneficiaries
SAWMP should select suitable beneficiaries for the project based on following
criteria;
a) Full time farmer
b) Resident in target area, but no access to grid electricity
c) Owns over 0.5 acres of land
d) Own an agro well able to provide 6000-7000 liters of water per day
The total value of the drip irrigation system is Rs.300,000. The selected beneficiaries
have to pay a down payment of Rs.5.000 at the Samurdhi bank or Govijana bank. The
remaining cost has to be paid after one year grace period within 10 years making
biannual payments in 20 installments. Agreement between farmers and the Ministry

4
of Agriculture was signed for the cost recovery arrangement. Farmers have to do the
routine maintenance of the system using the training offered and user manuals
provided by the company.
1.3.2 Roles and Responsibilities of Solar Power Company
The following responsibilities had to be fulfilled by the BP Solar company.
a) Technical staff of the company installs the system and instructs farmers on
operation and maintenance of the system. The customers have to be provided
maintenance manual in local languages.
b) All maintenance activities are to be done by the company for the first 03 years
after installation.
c) Local service centers for the project need to be setup and trained by the
company to ensure proper maintenance supports and the availability of spare
parts at local level.
d) Train the Divisional Officers (DOs) and Agricultural Instructors (AIs) on
Technical aspects and O&M of the system and improved crop production
techniques.
1.3.3 Roles and Responsibilities of SAWMP
According to the agreement signed between the Ministry of Agriculture Development
and Agrarian Services and the Ministry of Finance and Policy Planning on 06th
August 2007, the Ministry of Agriculture development and Agrarian Services has
agreed to take several measures for the successful implantation of solar powered drip
irrigation project- awareness creation among farmers, selection of suitable farmers,
identifying the suitability of locations, identifying the feasibility of water source,
signing the agreement with farmers with initial installment, monitoring the
establishment of drip irrigation system, ensuring the supply of inputs to implement
agricultural programme among drip irrigation farmers and collecting loan installments
on time and, crediting them to the treasury accounts. In order to ensure the smooth
implementation of the above activities, following conditions have been agreed by the
Ministry of Agriculture;
a) Create awareness among the all relevant officers on the policy framework,
methodology, limitation and conditions set by the Ministry of Agriculture to
implement the project
b) Plan and implement the farmer awareness programme with the support of
partner organizations
c) Identify the feasibility of land and water sources and thereby select the
suitable beneficiaries with the support of partner organizations
d) Approve selected beneficiaries from the heads of district level organization
e) Collection of initial down payment and depositing in the relevant bank and
maintaining the financial records
f) Signing an agreement between the ministry and the selected farmer base on
the policy framework, methodology, limitation and conditions setup by the
Ministry of Agriculture

5
g) Monitoring the installment of solar power drip system in the selected farmers
field by the company
h) Setup an insurance scheme for the provided drip systems
i) Provide crop recommendation for the drip irrigation farmers from the
Department of Agriculture/Provincial Department of Agriculture
j) Establish a programme to ensure the supply of quality seeds and planting
material and other necessary inputs on time for the selected farmers
k) Facilitate the forward purchasing agreement for the marketing of products of
drip irrigation farmers
l) Make a work plan to monitor the progress of the project at divisional, district
and the ministry level
1.4 Relevance of the Study
SPDI system is a new technology for Sri Lankan farmers. The government of Sri
Lanka has invested about US$ 28 million for this project under the loan scheme
provided by Australian EFIC funding. The project is in place since 2005 and phase-1
project was completed by 2008. Therefore it is important to assess the performance of
SPDI systems and the impacts of the project on agricultural productivity, farm income
and other socio and environmental conditions to make recommendations for future
such projects.
1.5 Objectives of the Study
The major objective of this study is to assess the achievements of the aims of
providing solar powered drip irrigation systems and the initial impacts of the project
to formulate strategies for the future similar projects. The specific objectives of the
study are;
i) Study the approach of intervention adopted in selecting the beneficiary and
delivering and monitoring the progress
ii) Examine the socio-economic conditions of the beneficiary farmers
iii) Find out the effectiveness of institutional mechanism adopted and the
capacity building
iv) Assess the performance of fulfilling roles and responsibilities of different
stakeholders of the project
v) Examine the performance of solar powered irrigation systems provided
vi) Estimate the level of usage of solar powered micro irrigation systems
vii) Identify the prospects and problems in using micro irrigation systems
viii) Assess the impacts of micro irrigation systems in improving crop cultivation,
crop yield, quality of harvest, reducing cost of production and enhancing
family income and welfare
ix) Make policy recommendations for the future promotion of solar powered
micro irrigation systems

6

7
CHAPTER TWO
Methodology
2.1 Site Selection and Sample Size
All the districts of phase 1 (Puttalam, Kurunegala, Polonnaruwa, Anuradhapura,
Hambantota, Badulla, Moneragala, and Ampara Districts) except Nuwara eliya,
Kandy and Trincomalee were selected for the study. The districts not selected for the
study consisted few numbers of beneficiaries. The study sites were selected from
divisions which had the higher number of beneficiaries considering the logistics of
data collection from the selected districts. There are 5137 total numbers of
beneficiaries in the selected districts including 4704 beneficiaries under the Govijana
bank and 433 beneficiaries under the Samurdhi bank. The suitable sample size was
selected using following formula at 95% confidence levels. The selected sites and the
sample size are given in table 2.1.
Where:
Z = Z value
p = percentage picking a choice, expressed as decimal
(0.5 used for sample size needed)
c = confidence interval, expressed as decimal
According to the formula the sample size was 368. This was proportionately allocated
among Govijana bank and Samurdhi bank beneficiaries as 342 and 26 respectively.
These numbers were proportionately allocated to selected districts based on total
number of beneficiaries in each district under the two different categories. The sample
size of the selected district was proportionately allocated based on the beneficiary
population of the selected district. The district sample was then proportionately
allotted to the selected Agrarian Development Centers (ADC) in the respective
districts. The distribution of sample size in the selected ADC divisions is given in
table 2.1.

8
Table 2.1: Distribution of Sample
District Agrarian Development
Centre Division
No. of
Beneficiaries
No. of Sample
Farmers
Ampara Irrakkamam 48 11
Uhana 42 14
Weranketagoda 12 3
Anuradhapura Galenbindunu wewa 124 35
Katiyawa 68 16
Kawarankulama 10 3
Padaviya Parakramapura 121 29
Badulla Rideemaliyadda 94 8
Hambanatota Ambalantota 156 37
Hakuruwela 13 4
Meegahajandura 186 30
Kurunegala Ehatuwewa 101 11
Rambe 697 57
Matale Dambulla 334 51
Galewela 109 16
Moneragala Buttala 83 16
Makulla 40 6
Polonnaruwa Gal-Amuna 59 17
Puttalam Puttalam 24 5
Total 2204 369 Source: Authors’ Survey Data, 2011
2.2 Data Collection Methods
The study employed multiple methods to gather necessary information and data for
the evaluation namely, key informant interview, focus group discussion, case studies
and questionnaire survey. Field survey was conducted during the period of January to
April 2011.
Key informants such as officials of SAWMP, BP Solar Company, district and
divisional officers, farmer leaders, pilot farmers, and village level officers were
interviewed to understand the progress, prospects and problems of the drip irrigation
project and also the effectiveness of the approach and the institutional arrangements
made. Focus group discussions were conducted in selected areas where large numbers
of drip irrigation systems had been provided targeting women and men groups to
gather qualitative information on benefits and impacts of the project.
Sample survey was planned using the beneficiary list available in the SAWMP.
Random sample was selected based on the table No. 2 covering both the beneficiaries
under Samurdhi and Govijana bank. Questionnaire was prepared to achieve the
objectives listed in section 5. The indicators were developed to assess the impacts of

9
drip irrigation systems on agriculture production, productivity, quality of products,
cropping pattern, cost of cultivation, marketing of produce, income and welfare
change, usefulness of drip irrigation systems, problems in using drip irrigation
systems provided, repayment of loan, capacity built among farmers, and other
environmental and social impacts. Case studies were conducted in selected locations
to elicit more detail information about the performance.
2.3 Data Analysis
Data collected was analaysed using SPSS software package. Descriptive and tabular
analysis was conducted.

10
11
CHAPTER THREE
Approach of the Intervention and Achievements
3.1 Demographic Characteristics of Beneficiaries
3.1.1 Family Size Distribution
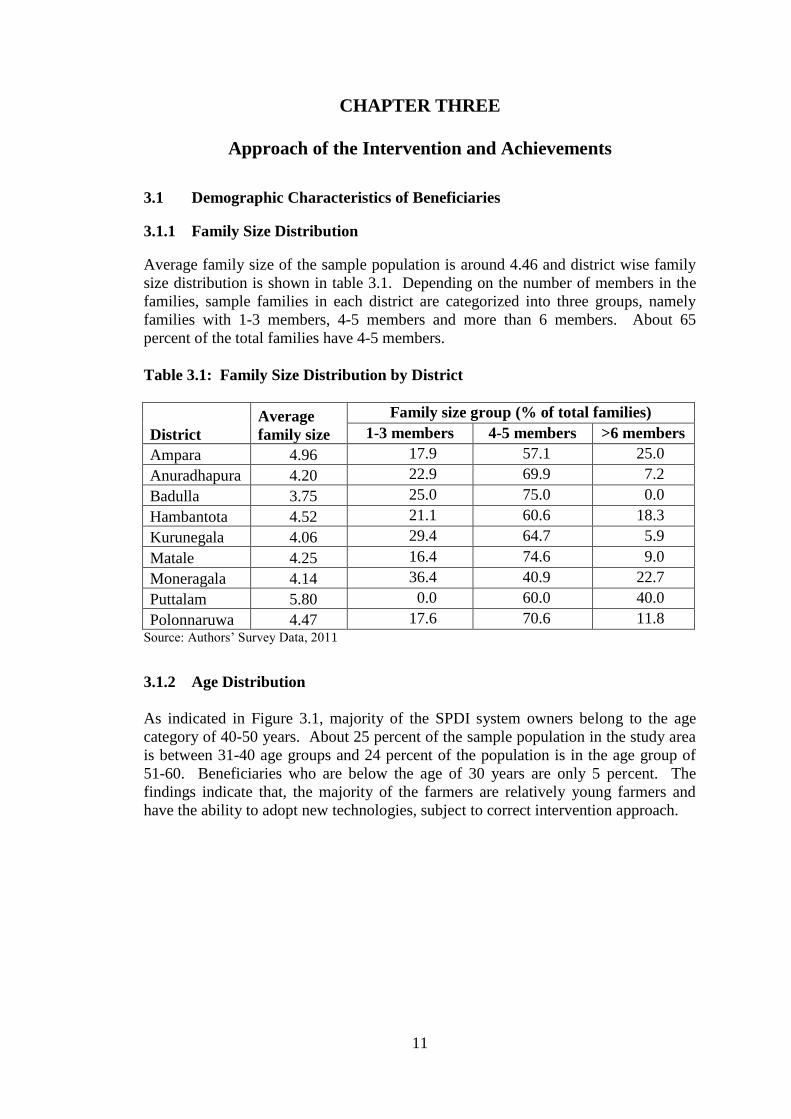
Average family size of the sample population is around 4.46 and district wise family
size distribution is shown in table 3.1. Depending on the number of members in the
families, sample families in each district are categorized into three groups, namely
families with 1-3 members, 4-5 members and more than 6 members. About 65
percent of the total families have 4-5 members.
Table 3.1: Family Size Distribution by District
District
Average
family size
Family size group (% of total families)
1-3 members 4-5 members >6 members
Ampara 4.96 17.9 57.1 25.0
Anuradhapura 4.20 22.9 69.9 7.2
Badulla 3.75 25.0 75.0 0.0
Hambantota 4.52 21.1 60.6 18.3
Kurunegala 4.06 29.4 64.7 5.9
Matale 4.25 16.4 74.6 9.0
Moneragala 4.14 36.4 40.9 22.7
Puttalam 5.80 0.0 60.0 40.0
Polonnaruwa 4.47 17.6 70.6 11.8
Source: Authors’ Survey Data, 2011
3.1.2 Age Distribution
As indicated in Figure 3.1, majority of the SPDI system owners belong to the age
category of 40-50 years. About 25 percent of the sample population in the study area
is between 31-40 age groups and 24 percent of the population is in the age group of
51-60. Beneficiaries who are below the age of 30 years are only 5 percent. The
findings indicate that, the majority of the farmers are relatively young farmers and
have the ability to adopt new technologies, subject to correct intervention approach.

12
Figure 3.1: Age Distribution of Beneficiaries (% of total beneficiaries)
Source: Authors’ Survey Data, 2011
The details analysis of age structure is given in tale 3.2. As shown in the table, 83
percent of the beneficiaries in the total sample population belong to the age group of
30 to 60 (work force) years. Distribution of the beneficiaries among different age
groups is more or less similar in all study districts.
Table 3.2: Age Distribution of Farmers by District (% of total beneficiaries)
District
< 30
years
31-40
years
41-50
years
51-60
years
> 60
years
Ampara 7.14 25.00 25.00 32.14 10.71
Anuradhapura 7.23 26.51 37.35 19.28 9.64
Badulla 12.50 12.50 50.00 12.50 12.50
Hambanthota 1.41 29.58 35.21 25.35 8.45
Kurunegala 7.35 30.88 20.59 25.00 16.18
Matale 4.48 20.90 44.78 17.91 11.94
Moneragala 4.55 22.73 31.82 22.73 18.18
Puttalam 0.00 0.00 40.00 60.00 0.00
Polonnaruwa 0.00 0.00 58.82 35.29 5.88
Total 5.15 24.66 35.23 23.58 11.38 Source: Authors’ Survey Data, 2011
3.1.3 Education Level of the Beneficiaries
As indicated in Figure 3.2, 33 percent of the beneficiaries have achieved education up
to GCE ordinary level. Farmers who had never been to school is less that 1 percent of

13
the study population and on the other hand around 2 percent had received higher
education.
Figure 3.2: Educational Level of Sample Beneficiaries
1
20
17
33
19
2
0
5
10
15
20
25
30
35
No schooling Gr 1-5 Gr 5-10 Upto O/L Upto A/L Higher educ
% o
f Fa
rmer
s
Education Level
Source: Authors’ Survey Data, 2011
Table 3.3 represents the education level of sample beneficiaries as reported by sample
households. Non-schooling beneficiaries were reported only from Kurunegala and
Polonnaruwa, but numbers are very low. The number of farmers who had education
up to GCE (Ordinary Level) and above accounted approximately 53% of total
beneficiaries. Therefore, the sample farmers have some educational background to
understand the SPDI concepts.
Table 3.3: Level of Education by District (% of Beneficiaries)
District
No
schooling
Grade
1-5
Grade
5-10
Up to
O/L
Up to
A/L
Higher
education
Ampara 0.00 32.14 14.29 25.00 25.00 3.57
Anuradhapura 0.00 14.46 32.53 36.14 15.66 1.20
Badulla 0.00 0.00 25.00 37.50 25.00 12.50
Hambanthota 0.00 26.76 30.99 26.76 14.08 1.41
Kurunegala 1.47 30.88 25.00 27.94 14.71 0.00
Matale 0.00 8.96 22.39 43.28 23.88 1.49
Moneragala 0.00 9.09 36.36 27.27 22.73 4.55
Puttalam 0.00 20.00 40.00 20.00 20.00 0.00
Polonnaruwa 5.88 11.76 11.76 41.18 29.41 0.00
Total 0.54 19.51 26.83 32.79 18.70 1.63 Source: Authors’ Survey Data, 2011

14
3.1.4 Employment
Out of the total number of beneficiaries in the sample area, around 83 percent
involved in the agriculture as primary employment and rest are part time farmers.
Only 24 percent of the beneficiaries had involved in secondary employment (Table
3.4). Other prominent employments of the study population are state or private sector
jobs (8%) and self-employment (5%).
Table 3.4: Employment Pattern in Sample Area
Type of employment
Primary
Employment
Secondary
employment
No. % No. %
Agriculture 307 83.20 44 11.92
Government/ private sector
employment 31 8.40 0 0
Non permanent employment 2 0.54 1 0.27
Business/ Self-employment 19 5.15 29 7.86
Agricultural labourer 0 0.00 6 1.63
Off farm labourer 1 0.27 1 0.27
Skilled labourer 9 2.44 4 1.08
Fisheries/ Animal husbandry 0 0.00 5 1.36
Total 369 100 90 24.40 Source: Authors’ Survey Data, 2011
3.1.5 Land Availability and Land Use Pattern
Land is the most important and limited factor in Agriculture. About 47 percent of the
total land area of the beneficiaries are belongs to lowland and 53 percent is highland.
Almost 97 percent of the land parcels are located within the village. Distribution of
land extent according to size class is described in Table 3.5.
Table 3.5: Distribution of Land Extents According to Size
Range of land
extent(ac)
Lowland Highland
Total extent
(ac)
% of total
lowland
Total extent
(ac)
% of total
highland
<0.25 0.45 0.06 3.15 0.42
0.25-0.5 15.00 2.03 17.00 2.28
0.5-1 92.60 12.53 115.50 15.46
1-2 194.75 26.36 247.00 33.07
2-5 330.50 44.73 277.25 37.12
>5 105.50 14.28 87.00 11.65
Total 738.80 100.00 746.90 100.00 Source: Authors’ Survey Data, 2011

15
In study areas, 45 percent of the lowlands of the beneficiaries are 2-5 ac in extent
while 37 percent of the highlands belong to the category of 2-5ac. When considering
the highlands and lowlands together, almost all beneficiaries are holding more than
0.5 ac of land extent. Single owner owns more than 68 percent of the lowland plots
and rest are operating their lowland under some kind of tenurial arrangements
including share tenancy, mortgage and encroachment (Table 3.5). About 78 percent
of the highlands are under single ownership while, 11 percent are operated by
encroachers, Distribution of land according to ownership categories in Table 3.6.
Table 3.6: Distribution of Land by Ownership in Sample Area
Type of ownership
Lowland
Highland
Extent (ac) % Extent (ac) %
Single owner 503.30 68.17 580.65 77.74
Tenancy 119.50 16.19 13.00 1.74
Lease/mortgage in 33.00 4.47 7.75 1.04
Lease/mortgage out 14.00 1.90 3.25 0.44
Encroached land 34.00 4.61 83.25 11.15
Permit holder 20.00 2.71 31.00 4.15
Nindagam land 10.00 1.35 20.00 2.68
By kingship 4.50 0.61 8.00 1.07
Total 738.30 100.00 746.90 100.00 Source: Authors’ Survey Data, 2011
Figure 3.3 illustrates the percentages of land holdings (based on number of holdings)
under different land sizes. Nearly 11 percent of lowland and 13 percent of highland
holdings are in the category of less than 0.5 ac, while 27 percent of lowland and 22
percent of highlands are in the land size class of over 2 ac extent.
Figure 3.3: Land Distribution Based on Number of Land Holdings
<0.25ac4%
>5 ac2%
0.25-0.5ac
9%
0.5-1ac30%1-2ac
35%
2-5ac20%
Highland
<0.25ac2%
>5ac3%
0.25-0.5ac
9%
0.5-1ac29%
1-2ac33%
2-5ac24%
Lowland
Source: Authors’ Survey Data, 2011
16
3.2 Accomplishment of Proposed Criteria in the Selection of Beneficiaries
According to the project proposal, the eligibility of a farmer to own a solar power drip
irrigation system will be decided by the Ministry of Agriculture based on the
following selection criteria; a) Fulltime involvement in farming b) resident in the
target area c) Owns more than 0.5 ac of land d) owns an agro-well built that can
deliver 6000 to 7000 litres of water per day. The achievement of these requirements
at the field level is discussed in following section.
According to the above mentioned beneficiary selection criteria, a drip system
receiver should be a full time farmer. Survey results (Figure 3.4) shows that, more
that 80 percent of the system receivers are full time farmers except in Ampara and
Badulla districts. The rest of the beneficiaries are mainly government sector
employees or involved in self employment/ business related activities as their primary
employment.
Figure 3.4: Percentage of Full Time Farmers in the Sample Area
64%
82%
50%
87% 88%85% 86%
80%
88%
0
10
20
30
40
50
60
70
80
90
100
Perc
enta
ge o
f fa
rmer
s
District Source: Authors’ Survey Data, 2011
Another requirement to qualify to be a solar drip irrigation system beneficiary is that
farmer should be a permanent resident in target area. The finding of the study shows
that almost all the farmers in project areas have met this criterion.
Another basic criteria proposed in selecting beneficiaries for the solar powered drip
irrigation project was having own land. A farmer should own not less than 0.5 ac
extent of cultivable land to be eligible to receive a drip irrigation system. However,
the findings show that about 87 percent of the total farmers have more than 0.5 ac of

17
lowlands and more than 95 percent farmers have more than 0.5 ac highland land
extent. Land distribution among beneficiaries is lustrated in the Figure 3.5.
More than 55 percent of the beneficiaries had 2-5 ac of land (lowland and highland
together). Of the total sample there is only one person, who owned less than 0.5 ac of
land.
Figure 3.5: Land Distribution Among Beneficiaries
0
10
20
30
40
50
60
< 0.5 0.5-1 1-2 2-5 > 5
Perc
enta
ge o
f Far
mer
s
Land size class (ac) Source: Authors’ Survey Data, 2011
The source of water for drip irrigation system used in the study area is presented in
Figure 3.6. Only 57 percent of the drip system holders have agro-well for the use of
drip system. Another 29 percent used their domestic wells to supply water for the
system.
Figure 3.6: Water Source for Solar Power Drip Irrigation System
57%29%
6%
3%
5%
Agro-well
Well
Irrigation channel
Irrigation tanks
Other sources
Source: Authors’ Survey Data, 2011
18
Out of the total agro-well holders, 70 percent said that they have sufficient water to
pump throughout the year and 28 percent said that they experienced water scarcities
during certain period of the year. About 58 percent of the domestic well users
expressed that they have enough water around the year to use for drip systems.
Another condition set by the project to qualify to receive SPDI system by a
beneficiary is non- availability of grid electricity in the agriculture field. The findings
show that abut 60 percent of the sample population had no accessibility to grid
electricity at the time of project intervention and 72 percent of the beneficiaries have
used or are using kerosene or other fuel to lift water.
Figure 3.7: District wise Distribution of the Agro-wells
0
10
20
30
40
50
60
70
80
90
100
29%
70%
50%
24%
68%72%
55%
100%
41%
Per
cen
tage
of
Farm
ers
District
Source: Authors’ Survey Data, 2011
3.3 Accomplishment of Roles and Responsibilities of the Project by
Stakeholders
This section assesses the achievement of different roles and responsibilities entrusted
to the three main stakeholders of the project; Ministry of Agriculture, BP Solar
Company and the beneficiaries.
3.3.1 BP Solar Company
One of the responsibilities of the company is field installation of SPDI systems by
appointing suitable technical staff who can instruct farmers on operation and
maintenance of the system. The company also needs to provide maintenance manual
in the local language of the respective beneficiary. Survey findings show that 96
19
percent of the drip systems have been established in the field by the technical staff of
the BP Solar Company, 3 percent are installed by farmers themselves and one percent
of the systems are yet to be installed even after seven years of project implementation.
This drip irrigation system being a new technology to farmers, initial awareness was
needed. 88 percent of the sample beneficiaries were given basic instructions about
usage and operation and maintenance of the system. More than 98 percent of the
farmers obtained instructions from the BP Solar company officials and others
acquired awareness from AI and officers in the ASC.
Regarding the provision of instructions to farmers on O&M, only 27 percent of the
beneficiaries had received the maintenance manual in their native language. Out of
the total number of manual receivers, 81 percent had read the manual and 94 percent
had expressed that manual was useful to them giving some knowledge on designing
the spacing between two crops and selecting suitable crops and maintenance of the
system.
According to the agreement signed between the Ministry and the company, all
maintenance activities in the first three years after the installation is the responsibility
of the BP Solar company free of charge. Out of 369 total sample, 136 drip irrigation
systems had to be repaired within the three year warranty period. 94 percent of the
farmers who needed some repair during the first 3 years, had informed the
maintenance requirements to the BP Solar technical officers and more than 75 percent
of them had get the service from the BP Solar technical officers within one week after
the company was informed. According to the agreement all maintenance activities
should be attended free of charge within 3 years warranty period, but 24 percent of the
farmers had paid maintenance fee during that period.
Figure 3.8: Percentage of Farmers Who Were Aware of the Service Centre
0
20
40
60
80
Am
para
Anu
radh
apur
a
Badu
lla
Ham
bant
hota
Kuru
nega
la
Mat
hale
Mon
erag
ala
Putla
m
Polo
nnar
uwa
32% 31%
63%58%
63%
45%
27%
40%
71%
Perc
enta
ge o
f Far
mer
s
District
Source: Authors’ Survey Data, 2011
20
As mentioned in the section 1.3.2, the company has to ensure proper maintenance
support and availability of spare parts at local level by setting up of local level service
centers. It was reported in the field that the number of service centers established was
not sufficient to provide convenient services to the beneficiaries. For example, one
service centre functioned in Bibile area in Moneragala district to cover the
beneficiaries in Moneragala, Badulla and Ampara districts. Some of the service
centers established reported to have not regularly functioned and not accessible over
the phone to make inquiries by the farmers. Figure 3.8 illustrated the percentage of
beneficiaries who had any awareness about the availability of local level service
centre. On average 47 percent of the sample population had an awareness about the
existence of local service centre. Most of the farmers, (more than 90 percent) were
aware of the availability of technicians and spare parts in the service centre.
3.3.2 SAWMP or Ministry of Agriculture
Ministry of Agriculture Development and Agrarian Services has agreed to take
several measures for the successful implementation of solar powered drip irrigation
project which are discussed in section 1.3.3.
One of the tasks of the Ministry is to create awareness on project among the farmers.
Figure 3.9 present the mode of awareness of the sample farmers. More than half of
the total beneficiaries had gained awareness through the officers attached to Agrarian
Services Centers (ASC) in the relevant area, which is the local level institution of the
Ministry of Agriculture Development and Agrarian Services. Another 25 percent of
the farmers had come to know about the project from the neighbouring farmer who
had benefitted from the project. It should be noted that, about 51 percent farmers in
Matale and 37 percent of the farmers in Krunegala district had received information
on this project through neighbours, indicating the low level of participation of the line
agency in promoting the project. Sales agents of BP Solar Company had promoted
solar powered drip irrigation system and selected the beneficiaries without
considering set criterion in some project areas especially in the districts of Ampara,
Moneragala and Polonnaruwa, though it is not their job.
Figure 3.9: Mode of Awareness about the Project
ASC56%
AI1%
Officer of Company
11%
Neighbour25%
Samurdhi6%
FO1%
Source: Authors’ Survey Data, 2011

21
At the initial stage, Ministry or other authorized line agency officers have the
responsibility of providing knowledge on cost of the system, mode of payment, size
of the initial down payment and the installment and other conditions of the project to
the farmers. About 40 percent of the beneficiaries were aware that down payment
was Rs.5000 and remaining cost had to be repaid through biannual payments in 20
installments after six months grace period. However, about 24 percent of the farmers
were informed by BP Solar Company that, the size of initial down payment was
Rs.1000 and remaining amount had to be paid on installments. About 9 percent of the
sample population had informed that the condition of buying drip system was that
they had to pay only Rs.5000. About 7 percent beneficiaries perceived that they were
informed that the payment was only Rs.1000 for the system and nothing was
mentioned about installments. The results indicate the dilemma of external
interventions by some other parties (politicians and BP Solar Company) in promoting
SPDI systems other than relevant government officials. The impact of these kinds of
attitudes is continuously reflecting in phase 2 of the project as well and seriously
hampering the recovery of the installments.
Selection of suitable beneficiaries is the most important component of the project as it
determines the success level of the project. Apart from the criterion to be followed in
selecting beneficiaries as describe in previous selection, there are other requirements
to be fulfilled by the officials of the line agency in beneficiary selection. The officers
have to make a field inspection of the beneficiary farmers to identify the feasibility of
the location to adopt drip irrigation technology and the feasibility of the water source
available for the lift irrigation.
According to the study findings, land and water source feasibility was not strictly
followed by the ministry or line agency. About 51 percent of the farmers responded
that the suitability of water source was not assessed prior to selecting the beneficiary
farmer. In Hambanthota district, only 10 percent of the field sites had been inspected
to find out the feasibility of the available water source.
The Ministry of Agriculture has agreed to provide crop recommendations for the drip
irrigation farmers through the DOA, introduce a programme to ensure the provision of
timely and quality supply of seeds and planting materials and other necessary inputs
to selected farmers. Only 15 percent of the farmers had received training or guidance
and recommendations from the related government officers regarding cultivation of
crop under drip irrigation. Seeds and planting materials from the DOA have been
received only by 8 percent of the beneficiaries. These results indicate that the
particular roles and responsibilities entrusted to the Ministry of Agriculture have not
been fulfilled.
The task of preparing a work plan to monitor the progress of the project at divisional,
district and the ministry level by the Ministry of agriculture has not been realized.
Another agreed responsibility by the Ministry to facilitate the forward purchasing
agreement for the marketing of products of drip irrigation farmers and setup an
insurance scheme for the provided drip systems also have not been executed.

22
3.3.3 Beneficiary Farmers
Beneficiary farmers are the other key stakeholders of the project. Agreement between
farmers and the Ministry of Agriculture was signed for the cost recovery
arrangements.
3.3.3.1 Repayment of Loan
Research findings provide evidence that 78 percent of the sample population had been
aware of the conditions stipulated in the agreement before signing it. In the
interviews with the farmers, they said that they did not read the agreement before
signing as it was a bulky document and no enough time was given to read it.
Even though farmers were aware of the repayment conditions at the time of receiving
it, cost recovery percentage of the project was very poor. Only 80 out of 369
beneficiaries (21 percent) paid any installment or part of the installment after the
down payment. Figure 3.10 illustrated the percentage of sample farmers who had
paid an installment other than the down payment. Except in Badulla and Puttalam
districts, payment of installments in other districts was very poor.
Figure 3.10: Percentage of Sample Farmers Who Paid an Installment
010203040506070
Am
pa
ra
An
ura
dh
ap
ura
Ba
du
lla
Ha
mb
an
tho
ta
Ku
run
ega
la
Ma
tha
le
Mo
ne
raga
la
Pu
tlam
Po
lon
na
ruw
a
Pe
rce
nta
ge o
f fa
rme
rs
District
Source: Authors’ Survey Data, 2011
Relationships between the farmers’ knowhow about the repayment conditions and the
actual payment made by the beneficiary are shown in Table 3.7.
23
Table 3.7: Farmers Knowhow about the Repayment Conditions and the
Payments Made
Repayment condition informed to the
beneficiary
Total
Stay behind the informed
condition (Number of
Beneficiaries)
Yes No
Initial payment Rs.5000 and the balance in twenty
equal installments 126 32 94
Payment of Rs.5000 only as initial down payment 34 2 32
Payment of Rs 5000 with initial payment of
Rs.1000 and remaining Rs.4000 by installments
convenient to beneficiaries 47 11 36
Initial down payment Rs1000 and remaining total
amount in installments convenient to beneficiaries 127 23 104
Payment of Rs.1000 only as the initial down
payment 26 2 24
Other 9 4 5
Total 369 74 295 Source: Authors’ Survey Data, 2011
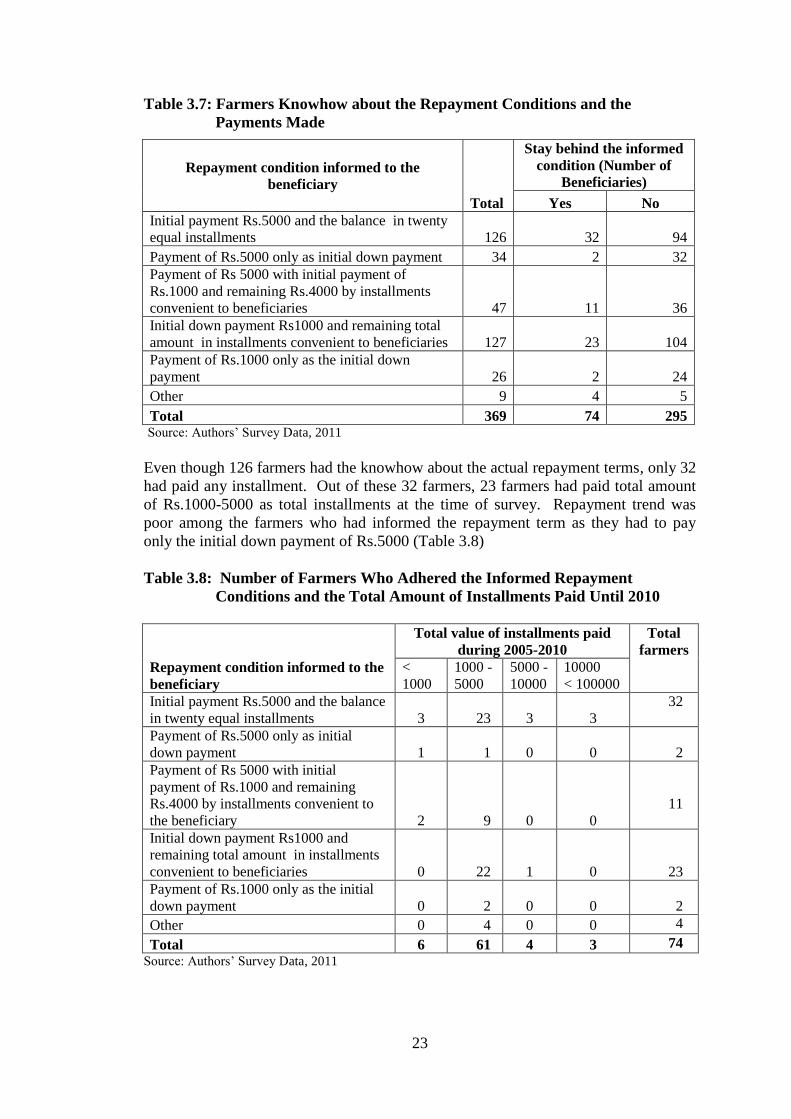
Even though 126 farmers had the knowhow about the actual repayment terms, only 32
had paid any installment. Out of these 32 farmers, 23 farmers had paid total amount
of Rs.1000-5000 as total installments at the time of survey. Repayment trend was
poor among the farmers who had informed the repayment term as they had to pay
only the initial down payment of Rs.5000 (Table 3.8)
Table 3.8: Number of Farmers Who Adhered the Informed Repayment
Conditions and the Total Amount of Installments Paid Until 2010
Repayment condition informed to the
beneficiary
Total value of installments paid
during 2005-2010
Total
farmers
<
1000
1000 -
5000
5000 -
10000
10000
< 100000
Initial payment Rs.5000 and the balance
in twenty equal installments 3 23 3 3
32
Payment of Rs.5000 only as initial
down payment 1 1 0 0
2
Payment of Rs 5000 with initial
payment of Rs.1000 and remaining
Rs.4000 by installments convenient to
the beneficiary 2 9 0 0
11
Initial down payment Rs1000 and
remaining total amount in installments
convenient to beneficiaries 0 22 1 0
23
Payment of Rs.1000 only as the initial
down payment 0 2 0 0
2
Other 0 4 0 0 4
Total 6 61 4 3 74
Source: Authors’ Survey Data, 2011

24
Table 3.9: Repayment Pattern of Loan Installments by Districts (Number of
Beneficiaries
District
Total value of installments paid during
2005-2010
Total
Number of
paid
beneficiaries
Total
number of
beneficiaries
Rs
<1000
Rs.1000
- 5000
Rs.5000-
10000
Rs.
10,000
<100000
Ampara 1 1 28
Anuradhapura 1 15 16 83
Badulla 5 5 8
Hambanthota 5 1 6 71
Kurunegala 1 17 2 20 68
Matale 4 17 0 21 67
Moneragala 1 0 1 22
Puttalam 1 1 1 2 5
Polonnaruwa 1 1 2 17
Total 6 67 4 3 74 369
Source: Authors’ Survey Data, 2011
3.3.3.2 Reasons for Nonpayment
Table 3.9 shows the repayment pattern in study districts. Pattern of repayment shows
that, over 95 percent of the beneficiaries who had paid an installment have paid
between Rs.1000-5000. The number of beneficiaries who paid any installment did
not exceed 20% of the total beneficiaries. Continuous repayment was not reported in
any locations.
During the last 4 to 5 years of the project implementation, not a single farmer in the
sample population had continued the payment of installments. Farmers have many
explanations to justify their strand of non payment of installments.
i. Full drip irrigation system is used up to date by only 5 percent of the sample
farmers, hence expected level of success cannot be achieved without using the
full system.
ii. Although the famers had experienced increase in farm income due to adoption
SPDI system, the additional income generated from the drip irrigation system
was not sufficient to pay the huge capital cost.
iii. About 26 percent of the farmers declare that they do not want to pay the
installment because others are not paying. It was observed in the field that the
beneficiaries have some kind of understanding and harmony for nonpayment
of the installments.
iv. Paying over Rs. 350,000 for SPDI system is not worth at all compared to other
farm machinery cost such as two wheel tractors, farm thresher, water pump
etc.

25
Most of the farmers think or assume that there is no real need of repaying the total
cost due to various reasons. About 17 percent of the beneficiaries believe this is a
project implemented by the government as they did in the past to uplift the livelihoods
of the rural people. Therefore, this is welfare investment and there is no need of
repayment. Another 12.5 percent of the farmers were misguided by some local level
politicians that this project is a grant from the Australian government for the poor Sri
Lankan farmers and therefore repayment is not necessary. Some other farmers expect
that although this project is given on repayment basis, after a certain period of time
government will write off this loan as the past governments did for agricultural loan.
Further, some local politicians also instruct the people not to pay the installments to
gain cheap popularity and people think that they are not committed to repay the cost.
The other explanation for the non-payment is that, only around 8 percent of the
farmers had decided to obtain systems understanding of the actual use of SPDI
systems. About 40 percent obtained the systems because of the small initial down
payment and possibility of paying reset on installment basis. Other 24 percent
decided to get solar power drip systems because the government and BP Solar
company officer convinced them that the SPDI system is a very effective and useful
technology. Most of the reason described in this section indicates that there was no
real need of system among farmers and therefore they were not willing to repay the
cost.
According to the agreement signed between the Ministry and the farmer, if a farmer
failed to pay the installments regularly, the line agency officers have the authority to
withdraw the system provided. Most of the farmers were not keen in observing
conditions in this clause as the system have failed to give expected benefited to them.
The officers were also not interested on removing the system from farmers’ field as
they did not have the facilities to transport the system and there was no space in the
office to store the system. The second hand value of the removed system was also
low. Therefore non-payment of installment is not an issue for the farmers.

26

27
CHAPTER FOUR
Performance of Utilizing Drip Irrigation Systems
4.1 Degree of Use of Full Set of Drip Irrigation Systems
The Solar Powered Drip Irrigation (SPDI) system comprised of several parts; solar
panel, solar powered water pump, maximum power point tracker (MPPT), fertigation
unit, main pipe line and laterals with in-line drippers. The research findings show that,
the SPDI systems are being used by the beneficiaries in several ways from full
utilization to zero level of utilization. The important function of this system is
generation of power by solar panel and supplied to water pump to lift water from
groundwater source and distribute the water to a low-pressure drip irrigation system.
As there is no rechargeable battery included in the system provided, the water pump
runs only during the sunshine hours of the day. Table 4.1 indicates the current status
of usage of the SPDI system distributed under phase I of the project. According to the
table 4.1 more than 71 percent of farmers have used the SPDI system up to date.
However, the usage of complete system for agricultural activities under drip irrigation
is marginal (Table 4.2).
Table 4.1: Present Status of Usage of SPDI System
Status
No of farmers
(N=369) % of farmers
Use until to date 263 71.27
Used only during first few seasons 73 19.78
Used until recent past, but not used now 25 6.78
Never used 8 2.17 Source: Authors’ Survey Data, 2011
Although, more than 71 percent of farmers used the SPDI system up to date, only 5
percent had used the complete system for agriculture activities. The rest of the users
have been utilizing SPDI systems without one or more component.
Table 4.2: Types of Usage of SPDI System
Types of use No of farmers
(N=369)*
% of
respondents
Full system is being used 19 5
Full system without fertigation kit is being used 26 7
System is used without drip irrigation components 208 56
Water pump and the pipe system is used to pump
water for domestic water needs 72 20
Solar panel is used to generate household electricity 2 1
Not used now for any activities 98 27
Never used 8 2
* Multiple answers make the total percentage more than 100 Source: Authors’ Survey Data, 2011

28
The findings given in the table 4.2 indicates that 80 percent of the SPDI system has
been used without drippers until to date, which is beyond the scope of the project. The
findings indicate that about 30 percent of the beneficiaries had not used the systems
for any agriculture related activities or not used the system at all.
4.2 Use of Different Components of Drip Irrigation Systems
The levels of usage of different components of SPDI system are illustrated in figure
4.1. The findings show that more than 60 percent of the fertigation units supplied
with SPDI systems have never been used. Only about 5 percent of the beneficiaries
are using the fertigation units provided at the time of survey.
Drip systems with lateral pipes were used only by 12 percent. About 38 percent of the
drips with lateral pipes had not been used on any day. The findings indicate the
ineffectiveness of the project in achieving its primary objectives by minimizing the
water use while increasing cultivable land extent and agricultural productivity. To
increases the cultivable land extent and productivity with the available water and
other inputs, drippers and fertigation kits should essentially be used.
Figure 4.1: SPDI System Status and Usage (% Percentage of Beneficiaries)
0
10
20
30
40
50
60
70
80
90
100
Used unit to date
Used until recent past, but not nowUsed only during initial few seasonsUsed only in one season
Never used
Source: Authors’ Survey Data, 2011
4.3 Farmers Awareness on the Use of Drip Irrigation Systems and Training
Needs
The SPDI package and the components provided to beneficiaries are mostly novel to
Sri Lankan farmers. According to the information given by the beneficiaries, the
components that are included in the package were delivered, but, the awareness on
operation and maintenance (O&M) was lacking.

29
Nearly 22 and 11 percent of the beneficiaries were unaware of the operation and
maintenance of the fertigation unit and drippers respectively. The purpose of given
water application technologies is worthless if the beneficiaries do not understand the
mechanism and operations. However, during the survey 88 percent of the
beneficiaries stated that they had obtained some guidance and knowledge for the
usage, operations and maintenance of SPDI systems from the BP Solar company field
officials.
Beneficiary perceptions were obtained on their training needs during the survey.
About 43 percent of farmers expressed their training needs. Among the required
training, 62 percent requested training on O&M activities of the SPDI system and the
rest was interested on crop cultivation using SPDI system.
During the installation period, the company was responsible to provide an O&M
manual with the SPDI system to give some awareness on the usage of SPDI system.
According to the farmer responses, only 26 percent had received the manual in their
own language and 80 percent of them had read it. Usefulness of the manual as
perceived by the manual users is shown in figure 4.2.
Figure 4.2: Usefulness of Training Manual Given (Percentage of Manual users)
Very useful7%
Useful88%
Less useful5%
Source: Authors’ Survey Data, 2011
4.4 Operation and Maintenance
Maintenance requirements had arisen for 54% of the farmers in which 72% were
within the warranty period. Whenever maintenance requirements encountered, it was
farmer’s duty to inform the problem directly to BP Solar service centre or relevant
officer attached to the ADC or coordinating officer appointed by the Ministry. Table
4.3 shows the mode of complaint and the person informed on maintenance
requirement.

30
Table 4.3: Ways of Informing Maintenance Requirements of the SPDI System
Responses
No of farmers required
maintenance or repair
(N=195)
% of
respondents
Verbally to ACS officials 10 5
To the company field officers or centers
verbally or using telephone 173 89
Written complain made to the company 2 1
Not informed to anybody but repaired by
farmer himself or neighbour farmer 7 3.5
Not made complain 3 1.5 Source: Authors’ Survey Data, 2011
According to the table 4.3, about 95 percent of the relevant beneficiaries had made
formal complaints to the company regarding the maintenance/repair requirement, but
only 74 percent had received some kind of service from the company though it was an
entrusted responsibility of the company under the agreement signed between BP
Solar and Ministry of Agriculture. According to the agreement, BP Solar was
responsible for any maintenance requirement of SPDI system even after the warranty
as well. This is one of the issues highlighted during the survey which discourage the
farmers to accept this kind of new technologies. Therefore, new technologies should
be introduced with proper plan, suitable awareness campaign and appropriate backup
services.
Figure 4.3 illustrates the time taken to rectify the reported problems of SPDI systems
requested by the farmers. Almost one fifth of the farmers stated that time taken to
attend the maintenance was quite long which was nearly one month or more. About
22 percent of the farmers declared that they paid for maintenance service even within
the warranty period though it was the responsibility of the company. Nearly 50
percent of beneficiaries were not aware of the location and/or contact details of BP
Solar service center. The knowledge on the location of service centre, contact person
and contact telephone number are important to ensuring proper backup service.
Figure 4.3: Time Taken to Attend the Maintenance Works
Within a week79%
Within a month17%
After a long period of time
4%
Source: Authors’ Survey Data, 2011

31
It is the duty of the BP Solar company to provide after sales services and supply
necessary spare parts. It has been recorded that the poor after sales services and
unavailability of spare parts was one of the reasons for the failure of past interventions
made in promoting micro irrigation systems. (Aheeyar et al, 2005).
Figure 4.4 illustrates the level of maintenance done by the company. About 40% of
the beneficiaries had not received satisfactory service or any service during the
warranty period from the company though several requests had been made.
Figure 4.4: Level of Satisfaction About the Maintenance Offered by the
Company
Satisfactory61%
Not received any service
18%
unsatisfactory15%
No idea6%
Source: Authors’ Survey Data, 2011
The reasons for unsatisfactory services of the company as perceived by the
beneficiaries are illustrated in Figure 4.5. The experience related to rectification of
problems repeatedly by 28 percent farmers raised the question of technical capability
of the technician or quality of spare parts.

32
Figure 4.5: Reasons for Unsatisfactory Services from the BP Solar Company
0
5
10
15
20
25
30
35
40
Late response Repair was not
successful
Took longer time for repair
Had to purchase
spareparts
during the warranty
period
instructions given over the phone
Source: Authors’ Survey Data, 2011
4.5 Reasons for Non Use and Partial Use of Drip Irrigation Systems
Although, SPDI systems contained solar panel, pump, filters, fertigation unit, main
line and laterals with inline drippers most of the farmers used the SPDI system
without laterals with inline drippers and fertigation unit. This has been discussed
previously in sections 4.1 and 4.2.
Table 4.4: Use of SPDI System Without Drip Set
Responses
No of farmers
(N=208)**
% of
respondents
Land size is smaller than half acre 37 18
Blocking of drippers 100 48
Difficulties of cleaning the drippers 56 27
Damage of drippers and pipes by animals 29 14
Water supply through drippers is not sufficient for
crop 43 21
Drip system in the field is a barrier to perform other
agronomic activities 6 3
No water scarcity to use drip system 29 14
Lack of availability of spare parts for the drip system 8 4
Lack of knowledge to use drip system 67 32 *N=208 Farmer's who used SPDI system without drip set
*Multiple answers make the total percentage more than 100 Source: Authors’ Survey Data, 2011

33
The beneficiary, who had obtained the SPDI system under subsidy package, and did
not use drippers containing laterals, indicates the non achievement of main objective
of the project. Drippers are the element that control the discharger rate in the
irrigation and help to save water and enhance the water use efficiency. The table 4.4
shows the reasons for not using drippers and the related accessories.
The major reason for the non use of drippers by 48 percent of beneficiaries was the
blocking of drippers. The non use of fertigation unit was other aspect in utilizing SPDI
system. About 31 percent (Figure 4.6) of the beneficiaries said they used the
fertigation unit only in the first few seasons. More than 62 percent had never used the
fertigation unit.
Figure 4.6: Usage of Fertigation Unit
% of farmers, Use
until to date, 5% of
farmers, Used only first few seasons, 31
% of farmers, Used
until resent past, but not used now, 2
% of farmers, Never
used, 62
Source: Authors’ Survey Data, 2011
Reasons for non use of fertigation unit are given in Table 4.5. About 24 percent of the
farmers believed that fertilizer application through fertigation unit was accelerating
the blocking or clogging of drippers. It is perceived that the fertigation units are
appropriate for liquid type of fertilizer application, but Sri Lankan farmers mostly use
solid fertilizers.

34
Table 4.5: Reasons for Non Use of Fertigation Unit
Status
No. of farmers
(N=369)
% of
farmers
Clogging of drippers 87 24
Low effectiveness fertilizers applied through
fertigation units 30 8
Not convinced about the application mechanism 64 17
Lack of awareness on methodology of using
fertigation unit 30 8
No any special benefit of using the unit 6 2
As drippers are not used, fertigation units not
applicable 127 35
Technical difficulties (Some of essential parts are
missing) 28 8
Some parts are physically damaged or stolen 3 1
Not received fertigation unit 6 2 * Multiple answers make the total percentage more than 100 Source: Authors’ Survey Data, 2011
Most of the fertilizers used by the farmers are granular in form. If it is injected to the
irrigation lines, it should be dissolved in the water. Even though the urea and KCl
(MOP) are water-soluble compounds, the concentration of those will limit the
solubility. According to the literature, only 1g of urea can be dissolved in 1ml of
water (Pickering, 1987).
Therefore, the urea solubility decreases when it reaches to the maximum permissible
limit of the solubility. In addition, the granular form fertilizer compounds contain
considerable amount of inert materials. Some of the inert materials are deposited as
insoluble within the irrigation lines and keep blocking the holes of in line drippers.
This problem has to be solved through continuous washing by opening the end caps of
the all laterals.
Figure 4.7 illustrates the current status of usage and the reasons for none use of SPDI
systems. Over 60% of the farmers who used the SPDI systems in the initial few
seasons only, have stop usage mainly due to damage or broken condition of SPDI
units or parts. Among the never used category, 32 percent of them had not installed
the system yet.

35
Figure 4.7: Status of Usage of SPDI System Vs Reasons for Non Use
0
10
20
30
40
50
60
70
80
90
100
Used only first few seasons (N=73)
Used until resent past, but not used
now (N=25)
Never used (N=8)
SPDI kit not installed in the field yet
No time
Parts of the SPDI kit had been damage by wild animals
Parts of the SPDI kits are malfunctioning or broken
unawareness of use
Parts of the SPDI kit were stolen
Advantages are not considerable
Difficulties of use
Excess water
Handed over to neighbour
*N= Status of use of SPDI system Source: Authors’ Survey Data, 2011
According to the findings given in table 4.1 and 4.2, more than 28 percent of the SPDI
systems are not being used now. Further, 56 percent of SPDI systems are being used
without drippers due to various reasons. The problems and constrains of using SPDI
systems are listed in table 4.6.
Table 4.6: Problems and Constrains in the Use of SPDI System
Problems experienced
No. of
farmers
(N=361)**
% of
respondents
Water discharge rate is not enough during crop growth period 36 10
Water pump pressure is not enough 57 16
Pump is not working during cloudy days/periods 248 69
Clogging of drippers 192 53
Difficulties in field operations 16 4
Need to change the distance between drippers for different
crops 12 3
Damage caused by the rodents and other animals 101 28
SPDI system is stolen 12 3
Drippers are unable to wet crop leaves 3 1
Need more time and labour to clean the clogged drippers 35 10
Possibility of crop damage during bright sunshine hours due to
high discharge of water 11 3
No any constrains 8 2
*N=Number of farmers used SPDI system without drip set
*Multiple answers make the total percentage more than 100 Source: Authors’ Survey Data, 2011
36
69 percent of beneficiaries had perceived that inability of water pump operations
during cloudy days is a constraint in supplying sufficient irrigation for the crops
cultivated. Some of the farmers believed that the discharge amount from drippers is
not enough during harvesting period for the crops like Papaya, Guava and crop
growth period of most of the crops.
Other important problem experienced by the farmers was clogging or blocking of
drippers in almost all the locations. Farmers and experts have tried several techniques
and chemicals in the past to rectify the problem but without much success. In the dry
zone conditions, especially during dry periods, water for animals become as a serious
issue. Therefore, the rodents and other domestic animals try to damage the lateral
pipe system to access water. Some of the farmers use their traditional knowledge to
overcome these types of problem such as keeping water in coconut shells in several
places in the cultivation land as a source of water for rodents and other animals.
As the drippers are inline and cannot change the position, there are difficulties
experienced by farmers in using drip system of changing the distance between two
drippers for different crops. Farmers prefer to have drip system with removable
drippers, which are easy to manipulate for spacing and cleaning.

37
CHAPTER FIVE
Effects and Impacts of the Solar Powered Drip Irrigation Projects
5.1 Impacts of SPDI Project
Theoretically the SPDI project is supposed to increase the crop productivity through
providing proper irrigation to crops, increase cropping intensity and improve the
cropping system. Farmer income is expected to increase through reduced cost of
production via saving of labour time, reduced energy cost, fertilizer cost and herbicide
cost and utilization of saved labour time for income generating activities.
5.1.1 Cropping System
Out of 369 farmers only 46 (12%) are using drip component for cultivation with or
without fertigator. During yala 2010 only 39 farmers had utilized the drip irrigation
for some kind of cultivation while it was limited to 13 farmers in maha 2009/10.
Therefore most of the anticipated positive impacts such as water saving, energy
saving, labour saving, increased extent of cultivation and productivity of SPDI project
are very low. Except Rambe ADC division in Kurunegala District and Dambulla
ADC division in Matale district, the number of farmers involved in drip irrigated crop
cultivation was very minimal (Figure 5.1 and 5.2). In the divisions of Irakkamam,
Weranketagoda, Kawarankulama, Rideemaliyadda, Ambalantota, Meegahajandura,
Hakuruwela, Buttala, Makulla and Gal-Amuna not a single farmer had practiced drip
irrigation.
Majority of the drip users had cultivated vegetables followed by Other Field Crops
(OFC) and Papaya. One farmer in Galewela was using drip irrigation for coconut and
banana cultivation for about 0.25ac extent each.
Figure 5.1: Number of Farmers Undertook Crop Cultivation Using Drip
System–Yala 2010
7
4
1
20
21 1
211
2
4
12
0
2
4
6
8
10
12
14
16
18
20
No.
of F
arm
ers
Vegetable
Papaw
OFC
Source: Authors’ Survey Data, 2011

38
Figure 5.2: Number of Farmers who Undertook Crop Cultivation Using Drip
System–Maha 2009/10
0
1
2
3
4
5
No. o
f far
mer
s
Vegetable
Papaw
Source: Authors’ Survey Data, 2011
The total extent cultivated using drip irrigation in yala 2010 and maha 2009/10 were
7.75 ac and 4.5 ac respectively, but theoretically farmers should have cultivated 184ac
in a season if all the sample farmers had cultivated half acre each. Therefore actual
cultivated extent was merely 4% of the target area.
Figure 5.3: Total Extent Cultivated by Sample Farmers Using Drip System (In
acres)
13
1.75
2.25
0.25
0.25
4.5
3.25
0 1 2 3 4 5 6 7 8 9 10 11 12 13 14
Vegetable
Papaw
OFC
Coconut
Banana
Extent (ac)
Maha
yala
Source: Authors’ Survey Data, 2011
5.1.2 Socio Economic Impacts
Majority of the beneficiaries are not utilizing drip irrigation component of the
provided system, but, about 58% of the beneficiaries take advantage of the system for
lift irrigation without drips utilizing the water pump and water hose provided (Table

39
5.1). About 20% of the beneficiaries are making use of the water pump provided to
meet the domestic water needs. There are a couple of sample farmers using the SPDI
system to generate electricity for the household use. However about 25% of the
beneficiaries were not using the system for any purpose at the time of survey.
Table 5.1: Types of Usage of SPDI Systems (%of Beneficiary Farmers)
Types of Use No. of Farmers
(N= 369)
% of
Respondents
Full system is being used 20 5
Full system without fertigation kit is being used 26 7
System is used without drip irrigation component 216 58.5
Water pump and the pipe system is used to meet
domestic water needs
73 20
Solar panel is used to generate household
electricity
2 0.5
Not used for any activities at the moment 86 23
Never used 08 2
*Multiple answers make the total percentage more than 100 Source: Authors’ Survey Data, 2011
Although the current pattern of utilization of SPDI systems is not within the scope of
the project, it has an impact on increasing household income and family welfare by
numerous ways as reported by 60% of sample users. Table 5.2 describes the method
of income increase by using SPDI system. Reduced cost of production due to less
labour time, fuel saving and reduced chemical cost are the most prominent reasons for
increased household income. The average amount of money saved due to reduced fuel
/electricity use is from Rs. 3300 to 4000 for different type of uses and the average
value of labour saving is of Rs. 580 to 618, but for a small percentage of users (Table
5.2 and 5.3). However, about 50% system users with or without the use of drippers
have not realized any fuel saving except domestic water users. About 14% of the
users have utilized their saved time for income generating activities while another 6%
have used the saved time to devote family welfare activities (Table 5.4)

40
Table 5.2: Value of Energy Saving by SPDI System
Type of User Average
value (Rs)
Minimum Maximum SD No. of
people
received
zero saving
Full system is being used
(N=19)
3322 300 4,800 1505 10
Full system without
fertigation kit is being
used (N=12)
3495 300 5,000 1560 10
System is used without
drip irrigation component
(N= 114)
3960 300 7,000 1025 62
Water pump and the pipe
system is used to meet
domestic water needs
(N= 46)
3585 300 5,000 1404 5
Source: Authors’ Survey Data, 2011
Table 5.3: Value of Labour Saving by SPDI System
Type of User Average
value (Rs)
Minimum Maximum SD No. of users
received
zero saving
Full system is being used
(N=02)
600 600 600 0 16
Full system without
fertigation kit is being
used (N=02)
600 600 600 0 20
System is used without
drip irrigation component
(N= 25)
584 600 700 125.76 150
Water pump and the pipe
system is used to meet
domestic needs (N= 11)
618 600 700 40.45 41
Source: Authors’ Survey Data, 2011

41
Table 5.4: How Household Income Increased by Solar Powered Drip Irrigation
Systems? (% of Beneficiary Perception)
Reasons
No. of farmers
(N=358)
Percentage of
farmers
No income change 147 41
Reduced cost of production 133 37
Increase in yield 77 21
Use of saved time for income earning activities 50 14
Shifting to high income crop 5 1
Increase of extent cultivated 4 1
Increase in quality of the product 2 0.5
* Multiple answers make total percentage of responses more than 100 Source: Authors’ Survey Data, 2011
5.1.3 Environmental Impacts
Use of complete drip system was expected to provide numerous environmental
benefits namely improved water management, reduced soil erosion, protect
groundwater, effective application of fertilizer and reduced health risk exposure
(Toxic fumes etc). However, as only 5% and 12% of the users have adopted
fertigation kits and drip system respectively, the anticipated environmental impacts
are negligible other than reduced use of fossil fuels and hydro electricity for water
lifting (Table 5.2). Another environmental impact of the project is reduced use of
fertilizers and agrochemicals by 17% of the users (Table 5.5).
5.1.4 Gender Impacts
About 75% of beneficiaries are utilizing the SPDI system for one or more purposes
related with water and irrigation. Use of the system for irrigation with or without
drippers has an impact on women’s time spent in the field. The use of the system to
supply domestic water needs by 20% of the beneficiaries has a direct impact on
women and child welfare and leisure time because in most of the families they are the
main water carriers. Use of drip system has made reduced involvement of women in
weeding fertilizer application and other agricultural involvement. Some of the women
have used the saved time for income earning activities, leisure, child welfare and
social activities.
5.2 Benefits of Solar Powered Drip Irrigation Project
The major benefit of the project as expressed by 81% of the beneficiaries is reduced
energy cost of pumping water as a result of the use of solar energy. Availability of
water pump also helped to reduce the labour time requirement for irrigation. Although
only 12% of the beneficiaries are using drip component, 23% of the beneficiaries
accept that use of drip system help to save water. A similar trend of higher beneficiary
perception for various benefits of SPDI was recorded than the number of current

42
actual users. This is mainly due to reduced number of beneficiaries over the time with
difficulties experienced in using SPDI system, breakdowns, and maintenance issues
and various other drawbacks discussed in the following section. A detail description
of the benefits experienced by the beneficiaries is listed in table 5.5.
Table 5.5: Advantages of Using SPDI Systems (%of Currently Using or Earlier
used Farmers)
Advantages No. of Farmers
(N= 361)
% of
Respondents*
Reduced energy cost (fuel/electricity expenditure) 291 81
Reduced labour time 224 62
Water saving 82 23
Increase of crop yield 69 19
Increased household income 63 17
Low requirement of fertilizers/agro chemicals 61 17
Supply of domestic water 62 17
Increase quality of yield 40 11
Use of the Main water hose to irrigate remaining
area after fulfilling the water needs of dripped
area
44 12
Cultivation of cash crops 28 8
Enhanced family welfare 20 6
Brick making 7 2
No impact 7 2
Supply of water to upland paddy field 4 1
Supply of water for livestock 3 1
*Multiple answers make the total percentage more than 100 Source: Authors’ Survey Data, 2011
5.3 Drawbacks of Solar Powered Drip Irrigation Project
Although the major barrier of using SPDI systems as perceived by farmers is under
performance or nonfunctioning of water pump during the cloudy period/days due to
insufficient solar power, the real issue we observed in the field related use of drip
system is poor quality of drip pipes and nozzles provided by the project compared to
the entire system. The nozzles are fixed type and difficult to clean. A chemical to
clean the blockage in nozzles was introduced only in 2010, but it is also reported to be
not effective and difficult to practice. Rubber based drip pipes are easily damaged by
rodent animals and giant ants. This is one of the major reasons discouraging
beneficiaries not to use the drip pipes and use the system to supply irrigation through
the main hose without drippers. About 15% of the beneficiaries believe that water
supplied by drip system is not sufficient at plant growth stage, though it is not
scientific.

43
Table 5.6: Barriers in Using Solar Powered Drip Irrigation Systems (% of
Farmer Perception)
Barriers
No. of farmers
(N=353)
Percentage
of farmers*
Improper functioning of the system on cloudy days 246 70
Blockages occurring in drippers 187 53
Damages caused for the drip system by rodents and other
animals 85 24
Insufficient power of the water pump for irrigation 60 17
Insufficient supply of water during crop growth phase 48 14
Need more labour time to clean the drip nozzles 18 5
Difficulties in land preparation/weed control 13 4
Need to adjust the distance between nozzles for different
crops 8 2
Problem of theft of the system installed in the field 7 2
No wetting of crop leaves 3 1
Possibility of harming crops due to supply of more water
during high intensity sunshine. 5 1
* Multiple answers make total percentage of responses more than 100 Source: Authors’ Survey Data, 2011
Various reasons expressed by farmers for not using the system at the time of survey is
indicated in table 5.7. Around 60% of the non users are having incomplete SPDI
system due to lack or non working condition of some of the components. Another 7%
of non users have lost their system or parts of the system in the field by theft. Non
availability of spare parts and poor post project support services are the main causes
for the situation. The answers like not enough advantages using drip system, no need
to use drips as sufficient water is available, system is given to a neighbor farmer, no
time to use the system and the system is not yet fixed in the field are invariably
highlighting the problems associated with selection of suitable beneficiaries.
Table 5.7: Reasons for Not Using Solar Powered Drip Irrigation Systems (% of
Farmer Perception)
Reasons
No. of farmers
(N=103)
Percentage of
farmers*
Some components of the system are broken/ not in
working order 59 57
No enough advantages using drip system 14 14
Use of drip system is a difficult task 9 9
Some components of the system were stolen 7 7
No need to use drips as sufficient water is available 6 6
Some parts of the system are damaged by wild
animals 5 5
System is given to a neighbor farmer 1 1
Lack of awareness on use of drip system 1 1
No time to use the system 2 2
System is not yet fixed in the field 3 3
* Multiple answers make total percentage of responses more than 100 Source: Authors’ Survey Data, 2011

44
45
CHPATER SIX
Conclusion and Recommendations
6.1 Major Findings
1. Socio economic features: About 70% of the targeted beneficiaries belong to the
age group of over 40 years. Average family size of the 65% of the beneficiaries
was 4-5 members. The educational achievement of 54% of the beneficiaries was
up to GCE (O/L) and above.
2. Fulfillment of criteria in the selection of beneficiaries:- Among the farmers only
83 percent had involved in the agriculture as primary employment and the rest
were involved in agriculture on part time basis and were not eligible to be
beneficiaries. Almost all the farmers were residing in the project area and
therefore had met the project criteria. About 57 percent of the drip system
beneficiaries owned agro-wells to use for drip system. Another 29 percent used
their domestic wells to supply water for the system. Out of the total agro-well
holders 70 percent stated that they had sufficient water to lift througout the year
while only 58 percent of the domstic well users expressed that they had enough
water around the year to use for drip systems.
3. Achievement of roles & responsibilities of solar power company- About 96% of
the systems provided have been installed in the field by the company technical
staff. Although, the supply of user manuals in local language is the responsibility
of the company, only 27% of the farmers had received it in their native languge.
Majority of the manual recievers had read the manual and expressed that the
manual was useful. About 37% of systems had undergone some kind of repairs
within the warranty period, but only 75% of them had received timely service
form technical offciers within one week of reported time. Another 25% had paid a
fee to the company for their maintenance during the warranty period though it was
a violation of the agreement. Service centres established generally had to cover
two to three districts crating diffciulties of access. Further, most of the time the
centres were not accessible to farmers even over the phone. Only 47% of the
beneficiaries had a know how on the avialablity of a service centre. Capacity
builiding of the field level offciers on technical aspects of SPDI system and
improved crop production techniques by the company had also not materialised
satisfactorily in any areas. About 88% of beneficiaries had received guidance from
solar power company officials on how to operate and maintain the SPDI system..
4. Achievement of roles & responsibilities of SAWMP- The message and awareness
of the SPDI project had reached to majority of the farmers from the Ministry of
Agriculture and its line agencies. However, 44% of the beneficiaries had received
had got to know about the project through the neighbour farmers, officials
attached to BP Solar company and other sources. The company has reported to be
actively involved in promoting and giving false information about the programme

46
bypassing the government authorities in many places. About 24% of the
beneficiaries were informed by the company officials that they had to pay only Rs.
1000 as initial down payment and the rest to be paid on installment basis at their
own convenience. Another 7% and 10% of the beneficiaries had been advised to
pay Rs. 1000 and Rs 5000 respectively and nothing had been mentioned about
installments. Although the ministry or the line agency had to assess the feasibility
of land and water resources of the beneficiary farmers, this was not strictly
followed. Little more than half of the beneficiaries expressed that their water
source was not inspected by the officials prior to delivering SPDI systems. The
role of providing quality and timely supply of seeds and other planting materials
and other technical advices for drip irrigation by the ministry had also not reached
to more than 90% of farmers. The non use of drip system was the major barrier in
providing these services.
5. Repayment of Loan - Only about 20% of the beneficiaries had paid any
installments after paying the initial down payment, but none of the beneficiaries
were making regular payment of installment. The main reasons for the non-
payment of the installment are; not using the whole SPDI system by 88% of the
beneficiaries, failure to generate sufficient income, high capital cost of the system,
lack of awareness about the repayment requirements at the time of system
delivery, non-payment of installments by other farmers, expectation of loan write
off from government as the government did for agricultural credits in the past,
local political influences for non-payment and some other misconceptions.
6. Utilization of SPDI system- Only five percent of the farmers were using complete
set of SPDI, while another seven percentage were using the drip system, but
without fertigation kit. However 56% of the users were using the solar system
without drip component, which is not the scope of the project. About 29%of the
beneficiaries were not using the provided system at the time of survey.
7. Nearly 22% and 11% of the beneficiaries lacked awareness of O&M of the system
and maintenance of fertigation unit and drippers respectively. About 62% of the
farmers requested training on O&M of the SPDI system and method of cultivation
using drip irrigation.
8. Operation and maintenance- Maintenance requirements had arisen for 64% of the
users, in which three quarters of the requirements were within the warranty period
of the product. Majority of the farmers had informed the maintenance problem
verbally to either ACS officials or field officers of the company. However only
75% of the beneficiaries had received some kind of service form the company
though it was the responsibility of the company within the warranty period and
afterwards. About 20% of the service receivers had to wait for more than one
month to rectify the problem, while another 21% of the service receivers had paid
money for the service within the warranty period. The quality of service provided
by the company was not satisfactory for the 40% of users who requested service
form the company due to late response, poor quality of the service, longer time
taken for the repair, payment for spare parts during warranty period and providing

47
instructions over the phone without visiting to the site. Nearly half of the
beneficiaries were not aware of the location of the local service centre and their
contact details.
9. Reasons for the non use or partial use of the SPDI System- The main reasons for
the non use of drippers are, blocking of drippers, difficulties in cleaning of
drippers, lack of knowledge to drip system, damaged caused to drip lateral pipes
by rodents, insufficient water supply from the drippers to crops, small land size
and no water scarcity to use drip irrigation.
The reasons for the non use of fertigation unit are ineffectiveness of drippers, lack
of faith on ferigation mechanism, and lack of awareness on the methodlogy.
The major constraints in using SPDI system as a whole are, non working of
pumps during cloudy days/time, clogging of drippers, damages caused by rodents,
lack of water pump pressure, difficulties in adjusting drippers space for different
crops and insufficient water supply to crops during crop growth periods.
10. Impact on cropping system- Out of 369 farmers only 39 farmers had utilized the
drip irrigation for some kind of cultivation during yala 2010, while it was limited
to 13 farmers in maha 2009/10. Therefore most of the anticipated positive impacts
such as water saving, energy saving, labour saving, increased extent of cultivation
and productivity of SPDI project were very low. The actual cultivated extent
under drip irrigation was merely 4% of the total potential area of the all
beneficiaries.
11. Socio-economic impact- The using of solar panel and water pump for lift
irrigation and domestic water supply and using solar panel for electricity
generation are not within the scope of the project. However, these practices have
an impact on increasing household income and family welfare by reduced labour
time, fuel saving and reduced chemical cost as reported by 60% of sample users.
About 14% of the users had utilized their saved labour time for income generating
activities.
12. Gender impacts- Use of the system for irrigation with or without drippers has an
impact on women’s time spent in the field due to less engagement of women in
various cultivation practices such as weeding, fertilizer application and other
cultural practices. The use of the system to supply domestic water needs by 20%
of the beneficiaries had a direct impact on welfare and leisure time of women and
children as in most of the families they are the main water carriers.
6.2 Conclusion
1. The non use of drippers by 88% of the farmers indicates the failure of the project
in achieving its objectives such as water saving, labour saving, enhancing
productivity, and environmental conservation. The proper targeting of
beneficiaries is a vital requirement to introduce advance technologies.
48
2. The blocking of drippers is the most common constraint and difficulties of
cleaning the drippers due to non removable inbuilt nature of the outlet. The quality
of the lateral pipes is also reported to be poor in quality compared to the rest of the
system. Therefore it is necessary to conduct pilot studies before promotion of new
technologies.
3. The solar power company had rendered poor after sales services and had violated
the agreement in many occasions which indicates the requirement of suitable
terms and condition with well established post monitoring mechanism in working
with private sector.
4. Awareness on O&M of the system and the appropriate cultivation using drip
system is lacking among farmers. The project should have adequate component to
enhance the capacities of the beneficiary farmers and ground level officers.
5. The project has failed in recovering the loan and the same trend is continuing in
the second phase. Farmers do not consider the product for the amount that has to
be paid though they had signed the agreement with or without knowing the
content. This is an indication of lack of transparency in the project
implementation.
6.3 Recommendations
1. As the degree of use of SPDI system for the given purpose is very poor and
majority of the farmers are not making any payments other than initial down
payments, it is not recommended to continue this project without fulfilling
following recommendations.
i Selection of beneficiaries should be done by the field level officers of the
DAD with the supervision of DO and AI. The BP Solar company should be
completely withdrawn from the selection or identification of the beneficiaries,
if the field level officers of the SAWMP are responsible for monitoring of the
project and recovery of loan
ii Alternatively BP Solar company could be responsible for both beneficiary
selection and the recovery of loan
iii Capacity building of farmers and field level officers should be undertaken by
the relevant parties as agreed in the agreement.
iv. Farmers should be convinced about the benefits in adopting the technology
and there should be appropriate water sources (quantity and quality) and there
should also be water scarcity at least during some periods of the year.
v. The clause in the agreement signed between the beneficiary famer and the
DAD regarding non-payment of installments is not strong enough to
motivate the famers to honour the agreement. The agreement should be
strengthened to make collateral arrangements necessary for the loan granted
and provisions to take legal actions against violators.
vi As the blocking of nozzles is very common in most of the areas, there should
be some technology for easy cleaning of the nozzles. The inbuilt nozzles and
49
poor quality drip laterals need to be changed to make them user friendly and
durable.
2. The introduction of new technologies should be under taken by targeting most
suitable beneficiaries and institutionalizing proper backup and after sales supports.
The technology should be easily operated and maintained by the rural farmers.
3. A mechanism is needed to monitor the performance of roles and responsibilities of
stakeholders in relation to the project implementation.

50
REFERENCES
Burney, J. et al, 2010. Solar-powered drip irrigation enhances food security in the
Sudano–Sahel, Proceedings of the National Academy of Sciences of the United
States of America (PNAS), Vol. 107(5), pp 1848-1853, Available at
http://www.pnas.org/cgi/doi/ 10.1073/pnas.0909678107 Accessed on 5th
April
2011.
Meegastenne, J. (2005). Irrigation and Water Resources of Sri Lanka, Report
prepared for Sri Lanka National Water Development Report, unpublished.
Pickering, M. 1987. The Entropy of Dissolution of Urea, Journal of Chemistry. ACS
Publications, 1155, Washington, DC 20036,vol. 64, p. 723
Sivanappan, R.K. (1984). Prospects of Micro irrigation in India, Irrigation and
Drainage Systems, 8:49-58.