ASSESSMENT OF RISK RELATED TO HUMAN FACTOR IN SUPPLY …
121
FINAL PROJECT – TI 141501 ASSESSMENT OF RISK RELATED TO HUMAN FACTOR IN SUPPLY CHAIN PROCESS OF PT ICS USING FMEA NISRINA GIANINDYA POER NRP 024 1 14 40000 129 Supervisor Dr. Ir. Sri Gunani Partiwi, M.T. NIP. 196605311990022001 DEPARTMENT OF INDUSTRIAL ENGINEERING Faculty of Industrial Technology Institut Teknologi Sepuluh Nopember Surabaya 2018
Transcript of ASSESSMENT OF RISK RELATED TO HUMAN FACTOR IN SUPPLY …
FINAL PROJECT – TI 141501
ASSESSMENT OF RISK RELATED TO HUMAN FACTOR IN
SUPPLY CHAIN PROCESS OF PT ICS USING FMEA
NISRINA GIANINDYA POER
NRP 024 1 14 40000 129
Supervisor
Dr. Ir. Sri Gunani Partiwi, M.T.
NIP. 196605311990022001
DEPARTMENT OF INDUSTRIAL ENGINEERING
Faculty of Industrial Technology
Institut Teknologi Sepuluh Nopember
Surabaya 2018


APPROVAL SHEET
ASSESSMENT OF RISK RELATED TO HUMAN FACTOR IN
SUPPLY CHAIN PROCESS OF PT ICS USING FMEA
FINAL PROJECT
Prepared and submitted in partial fulfilment of the requirements for the degree of
Bachelor of Engineering in Industrial Engineering
Department of Industrial Engineering
Faculty of Industrial Technology
Institut Teknologi Sepuluh Nopember
Surabaya, Indonesia
Author:
NISRINA GIANINDYA POER
NRP 02411440000129
Acknowledged and approved by:
Supervisor
Dr.Ir. Sri GUnani Partiwi, M.T.
-, ... ·ot.;\ //_··
// .. ,.: .,., ' r ... . ·:J.;,., '"'-o'-.7., 'j, I·:<.( / '
\
( ·<' ' • !" /': '• " '''· .,:, . }I l ::;_· :3' ) /' \<,,, -:.:\ '-;;. \ t:.;. ,J f . ;.J
"" .... <( I I \'J I \ . I I - JJ
.. ,\'-', .. •;· ' h '"../'-t..,_L.J . ......J
,. · \.\ r .1_ .. .., ,. !I \ ....... T

ii
(This page is intentionally left blank)
iii
ASSESSMENT OF RISK RELATED TO HUMAN FACTOR IN SUPPLY CHAIN PROCESS OF PT ICS USING FMEA
Name : Nisrina Gianindya Poer NRP : 02411440000129 Supervisor : Dr. Ir. Sri Gunani Partiwi, M.T.
ABSTRACT
PT ICS is a company that focuses in the production of dried anchovy. The company produces two kinds of dried anchovy products called Prima Chirimen and Prima Excellent. The difference between the two product lies on the sorting process. PT ICS mainly distributes its product at international market by exporting the product to Japan, Europe, and many other countries. In order to support the activities of this company, this research is going to assess the risk of supply chain activities.
Risk assessment is done to help the company in conducting a more efficient and effective supply chain process since it is one of the competitive advantage of a company with international network. By conducting supply chain risk management, PT ICS can increase its competitiveness by maintaining the performance of supply chain activities. The process is started by observing the processes involved in the supply chain of this company. After that, the processes/activities will be mapped using SCOR (Supply Chain Operations Reference) process which consists of Plan, Source, Make, Deliver, Return, and Enable. The risk assessment is done using the method of FMEA (Failure Mode and Effect Analysis).
Based on the result of the research, there are 25 processes in the supply chain activities of this company. From those processes, 49 risks are found in the supply chain activities. These risks are assessed by assigning severity, occurrence, and detection score to each of the risk. The result of the multiplication of the three parameters is RPN which will be ranked from the largest to the smallest. Mitigation strategy is made for 10 of the selected risks.
Keywords: Risk Management, FMEA, SCOR, Supply Chain Risk Management

iv
(This page is intentionally left blank)
v
ACKNOWLEDGEMENT
First and foremost, praise be to Allah SWT the God Almighty who has given
blessings to the author to undertake and to proceed this research successfully.
Without His blessings, this achievement would not have been possible.
This research, entitled “Assessment of Risk Related to Human Factor in
Supply Chain Process of PT ICS using FMEA”, appears in its current form due to
the assistance and guidance of several people. The author would therefore like to
offer the sincerest gratitude toward some people who have given their endless
support, help, and guidance to the author during the research.
1. Dr. Ir. Sri Gunani Partiwi, M.T., as the research supervisor and lecturer.
The author would like to express the deepest sense of gratitude for the
thoughtful guidance, warm encouragement, valuable help, and
insightful advice during the completion of the research.
2. Gunawan Mulyono, as the Director of Operational of PT ICS. The
author highly appreciates the help and the assistance that has been given
during the time of the research.
3. All the staffs and employees of PT ICS who helped the author conduct
the research, the author is beyond grateful for their kind help and
assistance in the period of the research.
4. Arief Rahman, S.T., M.Sc., as the examiners of the research proposal,
Ratna Sari Dewi, S.T., M.T., Ph.D., and Anny Maryani, S.T., M.T., as
the examiners of the thesis defense. The author wishes to express
gratitude for the constructive suggestions, critical comments, and
correction of the thesis.
5. Nurhadi Siswanto, S.T., M.SIE, Ph.D., as the Head of Industrial
Engineering Department, and all the lecturers, faculty members, and
academic staffs of Industrial Engineering Department for the help and
guidance during the author’s study.
vi
6. The parents of the author who always give continued moral support
throughout the time of the author’s study in college. It is with the
unfailing support and continuous encouragement that the author can
complete the college study by conducting this research.
The author recognizes that this proposal research needs further
development. Therefore, a constructive suggestions and criticism will be highly
appreciated. May this research be useful for both academics and practical needs.
Surabaya, June 2018
Author

vii
TABLE OF CONTENTS
ABSTRACT ........................................................................................................... iii
ACKNOWLEDGEMENT ....................................................................................... v
TABLE OF CONTENTS ...................................................................................... vii
LIST OF FIGURES .............................................................................................. xii
LIST OF TABLES .............................................................................................. xiiii
CHAPTER I INTRODUCTION .............................................................................. 1
1.1 Background .............................................................................................. 1
1.2 Problem Formulation ............................................................................... 4
1.3 Objectives of Research ............................................................................ 4
1.4 Benefits of Research ................................................................................ 4
1.5 Scope of Research .................................................................................... 5
1.5.1 Limitations ....................................................................................... 5
1.5.2 Assumptions ..................................................................................... 5
1.6 Outline of Research .................................................................................. 5
CHAPTER II LITERATURE REVIEW ................................................................. 7
2.1 Indonesia Seafood Industry ...................................................................... 7
2.2 Human Factor ........................................................................................... 9
2.3 Supply Chain .......................................................................................... 10
2.4 Supply Chain Operations Reference (SCOR) Model ............................ 11
2.5 Risk Management .................................................................................. 14
2.5.1 Establish the Context ..................................................................... 16
2.5.2 Risk Identification .......................................................................... 16
2.5.3 Risk Analysis ................................................................................. 16
2.5.4 Risk Evaluation .............................................................................. 17

viii
2.5.5 Risk Treatment ............................................................................... 17
2.6 Supply Chain Risk Management ........................................................... 18
2.7 Failure Mode and Effects Analysis (FMEA) ......................................... 19
2.8 Previous Research .................................................................................. 22
CHAPTER III RESEARCH METHODOLOGY .................................................. 25
3.1 Research Methodology Flowchart ......................................................... 25
3.2 Preliminary and Preparation Stage ......................................................... 26
3.3 Supply Chain Process Mapping ............................................................. 27
3.4 Risk Assessment .................................................................................... 27
3.5 Conclusion and Suggestion .................................................................... 28
CHAPTER IV DATA COLLECTION AND DATA PROCESSING ................... 29
4.1 Company Profile .................................................................................... 29
4.2 Business Process Mapping Using SCOR ............................................... 32
4.3 Risk Identification .................................................................................. 33
4.3.1 Identification of Potential Failure Mode ........................................ 33
4.3.2 Identification of Risk Effect, Risk Cause, and Current Control .... 38
4.4 Risk Assessment .................................................................................... 50
4.4.1 Severity, Occurrence, and Detection Scoring ................................ 50
4.4.2 Calculation of Risk Priority Number (RPN) .................................. 57
4.5 Risk Evaluation ...................................................................................... 60
4.6 Risk Mitigation ...................................................................................... 63
CHAPTER V ANALYSIS AND INTERPRETATION ........................................ 67
5.1 Analysis of Supply Chain Activity Mapping Using SCOR ................... 67
5.2 Analysis of Risk Identification Process ................................................. 69
5.3 Analysis of Risk Assessment Process .................................................... 70
5.4 Analysis of Risk Evaluation Process ..................................................... 74

ix
5.5 Analysis of Risk Mitigation Process ...................................................... 75
5.6 Analysis of Human Factor in Supply Chain Process ............................. 77
CHAPTER VI CONCLUSION AND SUGGESTION ......................................... 79
6.1 Conclusion ............................................................................................. 79
6.2 Suggestion .............................................................................................. 80
REFERENCE ......................................................................................................... 81
APPENDIX ............................................................................................................ 87
BIOGRAPHY ...................................................................................................... 105

x
(This page is intentionally left blank)

xi
LIST OF FIGURES
Figure 1. 1 Top 10 fishing nations worldwide in 2015 ............................................ 1
Figure 1. 2 Leading fishery exporting countries 2016 ............................................. 2
Figure 2. 1 Indonesia Seafood Trade on Average .................................................... 7
Figure 2. 2 AS/NZS ISO 31000:2009 Risk Management ...................................... 15
Figure 2. 3 Example of Risk Matrix ...................................................................... 17
Figure 3. 1 Research Methodology Flowchart ....................................................... 25
Figure 4. 1 Business Process of PT ICS ................................................................ 31
Figure 4. 2 Risk Matrix .......................................................................................... 63
Figure 5. 1 Recapitulation of the Severity Score ................................................... 71
Figure 5. 2 Recapitulation of the Occurrence Score .............................................. 72
Figure 5. 3 Recapitulation of the Detection Score ................................................. 73

xii
(This page is intentionally left blank)

xiii
LIST OF TABLES
Table 2. 1 Hierarchy of SCOR Process Model ...................................................... 12
Table 2. 2 Severity Ranking ................................................................................... 20
Table 2. 3 Occurrence Ranking ............................................................................. 21
Table 2. 4 Detection Ranking ................................................................................ 21
Table 2. 5 Previous Research ................................................................................. 22
Table 4. 1 Business Process Mapping Using SCOR.............................................. 32
Table 4. 2 List of Potential Failure Mode .............................................................. 34
Table 4. 3 Effect, Cause, and Current Control of Each of the Risk/Potential Failure
Mode ...................................................................................................................... 38
Table 4. 4 Severity Criteria .................................................................................... 51
Table 4. 5 Occurrence Criteria ............................................................................... 51
Table 4. 6 Detection Criteria .................................................................................. 52
Table 4. 7 The Result of Severity, Occurrence, and Detection Scoring ................ 53
Table 4. 8 The Result of the RPN Calculation ....................................................... 57
Table 4. 9 The Ranking of the Risk ....................................................................... 60
Table 4. 10 Risk Mitigation Strategy ..................................................................... 64
Tabel 1 Kriteria Keparahan dari Efek/Dampak Risiko .......................................... 89
Tabel 2 Kriteria Terjadinya Penyebab Risiko ........................................................ 90
Tabel 3 Kriteria Tingkat Deteksi Risiko ................................................................ 90
Tabel 4 Daftar Risiko ............................................................................................. 92

xiv
(This page is intentionally left blank)

1
CHAPTER I
INTRODUCTION
This chapter consists of the background, problem formulation, objectives of
research, benefits, scope of research, and outline of research.
1.1 Background
As an archipelago country with over 17,000 islands, Indonesia which two-
third of its territory is covered by sea has a great potential regarding its marine
sector. According to the decree of the Ministry of Marine Affairs and Fisheries, the
potential of fish resources in Indonesia is estimated to be 6.8 million tons per year,
making Indonesia one of the major producer of marine fisheries production. In fact,
Indonesia is in the second place of the world’s leading fishing nations by catching
over 6.49 million tons of fish in 2015 with China as the leader (Statista, 2018).
Fishery is non-arguably a very promising sector in this maritime country which
happens to have 5.8 million square kilometers sea area. This sector continues to
grow in recent years with the support from the government in terms of funding and
regulations. The growth also increases the sector’s contribution to the country’s
non-tax revenue as well as to the GDP (EIBN, 2017).
Figure 1. 1 Top 10 fishing nations worldwide in 2015
(Source: Statista, 2018)
2
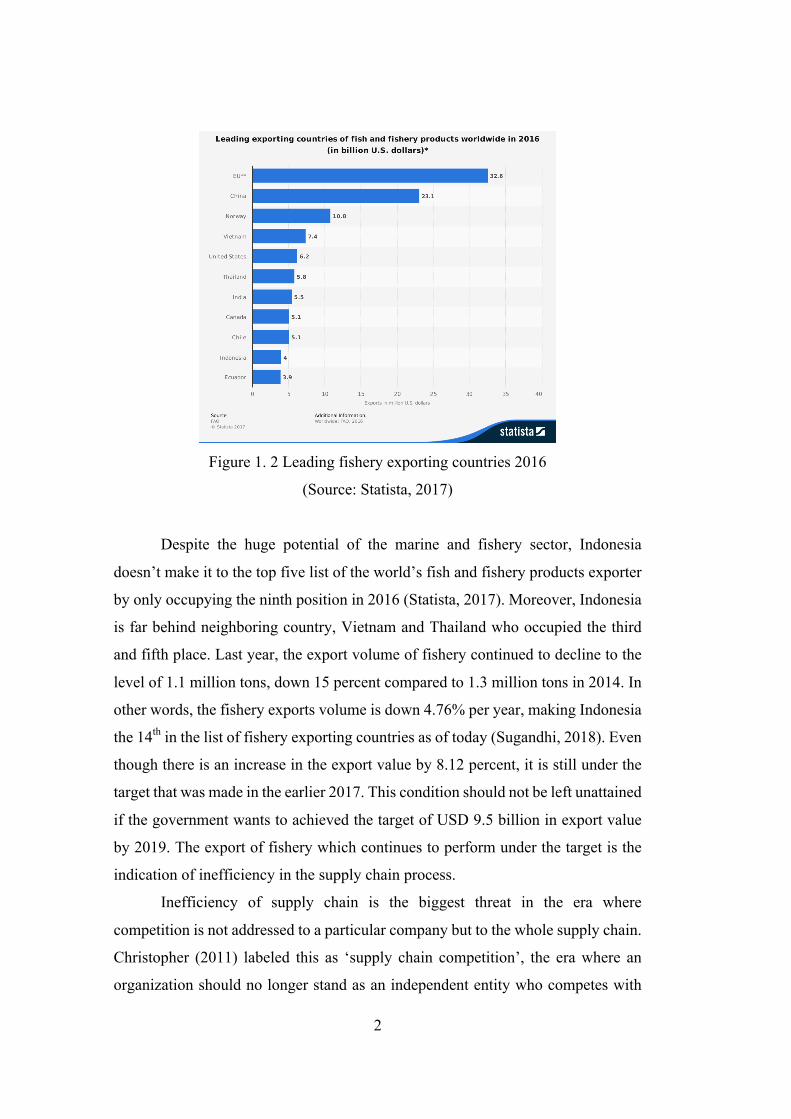
Figure 1. 2 Leading fishery exporting countries 2016
(Source: Statista, 2017)
Despite the huge potential of the marine and fishery sector, Indonesia
doesn’t make it to the top five list of the world’s fish and fishery products exporter
by only occupying the ninth position in 2016 (Statista, 2017). Moreover, Indonesia
is far behind neighboring country, Vietnam and Thailand who occupied the third
and fifth place. Last year, the export volume of fishery continued to decline to the
level of 1.1 million tons, down 15 percent compared to 1.3 million tons in 2014. In
other words, the fishery exports volume is down 4.76% per year, making Indonesia
the 14th in the list of fishery exporting countries as of today (Sugandhi, 2018). Even
though there is an increase in the export value by 8.12 percent, it is still under the
target that was made in the earlier 2017. This condition should not be left unattained
if the government wants to achieved the target of USD 9.5 billion in export value
by 2019. The export of fishery which continues to perform under the target is the
indication of inefficiency in the supply chain process.
Inefficiency of supply chain is the biggest threat in the era where
competition is not addressed to a particular company but to the whole supply chain.
Christopher (2011) labeled this as ‘supply chain competition’, the era where an
organization should no longer stand as an independent entity who competes with
3
other isolated and inclusive organizations. Instead, companies should integrate with
other entities who are involved in the upstream and downstream process of their
products. In all industries, supply chain plays a big role in providing support for
industries in order to conduct their business processes effectively and efficiently.
In seafood industry, there are at least three parties that contributes to the
operation of fishery production; namely the fishers, supplier, and the
manufacturer/exporter. The fishery product exporter and manufacturer, such as PT
ICS, is unable to control the material availability without getting the help from the
supplier and the fishers. This dependency makes PT ICS unable to run its business
process completely separate from the suppliers and fishers. Even though PT ICS
already established trustworthy relationship with some suppliers, the price of the
product might still be unstable due to several conditions which both the exporter
and the suppliers cannot control.
PT ICS is a corporation that focuses its operation in seafood industry by
producing and supplying seafood to both local and international market. PT ICS’
main products are fish and shrimp. Currently, PT ICS has several production site
that are placed near the resources such as in Tuban, Banyuwangi, Madura, etc. in
this company, supply chain holds a big share in transforming the raw materials into
finished goods because of the diverse production site and destinations. This
company, who specializes in export, faces several problems related to the
availability of raw materials as well as the unstable production.
In seafood industry, the availability of raw materials is highly dependent on
the weather and region. The problems arise in the supply chain process of PT ICS
can affect the whole performance of the company which can result in declining
performance. The problems also affect the utility of the production site which
eventually yield in higher cost. Obviously, the problems in supply chain can not be
neglected as it might endanger the company. That’s why risk assessment should be
implemented throughout the supply chain process to anticipate risks before they
happen. As Merna and Al-Thani, (2008) said, risk management allows an
organization to identify risks specific to that particular organization and to respond
to them in an appropriate way.

4
This research proposes to conduct a risk assessment in the supply chain
process of PT ICS in order to identify and evaluate the risks. Risks that are
associated with human factor will be assessed using FMEA process. Human factor
analysis is done because almost all processes in PT ICS are done manually with the
help of human. Since the involvement of human is extremely important, the
assessment of risk related to human factor is expected to provide a comprehensive
list of activities that might turn into risk event. The result of the risk assessment can
be used to prevent risks from happening as well as to increase the contribution of
human in reducing risks by evaluating the performance of human.
1.2 Problem Formulation
The problem that is going to be solved through this research is related to
supply chain risk management. Supply chain holds an important role in the business
process of PT ICS, thus a risk assessment should be employed to prevent unwanted
event to occur that might affect the performance of PT ICS. The risks that are going
to be assessed are those related to human factor since PT ICS done its process
manually.
1.3 Objectives of Research
The following are the objectives that are going to be achieved by conducting
this research:
1. To identify the supply chain risks involved in the seafood industry
business process.
2. To identify the human factor involved in the supply chain of seafood
industry.
3. To provide the appropriate mitigation strategy to handle the risks of
supply chain process.
1.4 Benefits of Research
Benefits which will be able to gained by conducting this research are
mentioned as follows:

5
1. The company will be able to know the supply chain risk of its business
operation as a reference for conducting a more effective and efficient
business process in order to increase the competitiveness.
2. The company can implement the mitigation strategy provided by this
research.
3. The company will have the information regarding the human factor in
its supply chain process.
1.5 Scope of Research
The scope of this research, which consists of the limitations and
assumptions, is explained as follows:
1.5.1 Limitations
Limitations used in this research is that the research is focused on the dried
anchovy product.
1.5.2 Assumptions
Assumptions used in this research is that the company business process,
regulation, and condition are following the existing condition.
1.6 Outline of Research
In this sub-chapter, the outline of the research will be shown in order to give
the big picture of the whole research. The outline is as follows:
CHAPTER I INTRODUCTION
This chapter explains about the background of conducting this research,
problem formulation that will be observed in the research, objectives that are going
to be achieved through the research, benefits of doing this research, scope of
research which consists of the limitations and assumptions used in this research,
and outline of research which highlight the overall structure of the thesis.
CHAPTER II LITERATURE REVIEW
This chapter shows several literature review that will be used to conduct this
research. Among them are the supply chain, supply chain risk management, risk
management, SCOR model, FMEA, and human factor. In this chapter, the literature
6
review functions as a basis for doing this research which contains some of the
experts’ opinions as well as the author’s opinion.
CHAPTER III RESEARCH METHODOLOGY
This chapter reveals the steps that will be taken while conducting this
research. The steps will give a comprehensive understanding of the flow of this
research.
CHAPTER IV DATA COLLECTION & PROCESSING
This chapter tells about the process of collecting the research data which
will be the input of this research. The processing of the data will also be shown
using the appropriate method. In this case, the research will conduct the data
processing process using SCOR model to determine the business process and then
using FMEA to perform risk management.
CHAPTER V ANALYSIS & INTERPRETATION
The result of the data processing that has been done in the previous chapter
will be analyzed in this chapter. This research will also give the explanation of
human factor in the supply chain process in this chapter.
CHAPTER VI CONCLUSION & SUGGESTION
After conducting the whole research, the conclusions that are obtained from
the research will be written in this chapter. There will also be some suggestion for
the object of the research according to the result of this research.

7
CHAPTER II
LITERATURE REVIEW
In this chapter, the literature review that will be used to support this thesis
is going to be explained. The literature review will cover the theories, concepts, and
knowledge about some specific topics that are gathered from several sources.
2.1 Indonesia Seafood Industry
Based on the data obtained from CEA (2016), Indonesia exported more than
USD 3 billion of seafood in 2011. Among the destination countries; US, Japan, and
Europe are the leading importer. This performance is in line with the target of export
value of seafood to reach USD 9.5 billion by 2019. In addition, the seafood trade
has shown positive trends since 2007-2011 in which the export quantity of seafood
is greater than the import quantity in almost all commodities of seafood. The fishing
industry itself accounted for 21 percent of Indonesia’s agricultural economy and 3
percent of national GDP in 2012 (FAO, 2014).
Figure 2. 1 Indonesia Seafood Trade on Average
(Source: CEA, 2016)
8
Seafood; such as fish, shrimp, crab, and many others; can not last long
enough to be distributed to other area without a sufficient cold storage or without
being processed in advance. Thus, the seafood industry holds an important role in
maintaining the seafood quality until it reaches its destination. However, the lack
of technology in the traditional vessels which bring the fish back to the shore results
in higher logistic costs and the fish to be less fresh (Surya, 2016).
Though seafood industry increases the value of the product up to 250%
through primary, secondary, or tertiary process done within the industry
(Sutjiamidjaja & Sutjiamidjaja, 1999), it is still facing some problems ahead. One
of the most crucial has to do with fish as raw materials itself. Fish resources can not
stay constant due to the high dependency with season (Perbowo, 2017).
Furthermore, Poernomo and Heruwati (2011) also explains that the problem facing
this industry is the availability of raw materials which can occur due to various
things, among others:
• In some seasons when the catch of fish is low, fishers tends to export the
fish rather than sell it to domestic buyer
• The stock of fish in the sea is decreasing
• Unstable relationship between the fishers and the buyer (supplier) that
affects the decision of the fishers to export the fish when the price of fresh
fish is higher abroad
One of the major weaknesses of Indonesia’s fishery sector is that 95% of the
2.2 million people engaged in the sector are traditional fishers (GBGI, 2016). These
fishers lack the resources and capital to explore the huge potential of Indonesian
aquatic resources. The majority of fishers still use small boats and traditional
equipment, which prevents them from going in to deep waters which results in
lower catch volumes.
Another big obstacle that is faced by seafood industry is the spoilage of fish.
Spoilage is usually accompanied by change in physical characteristics. Change in
color, odor, texture, color of eyes, color of gills and softness of the muscle are some
of the characteristics observed in spoiled fish (Singh et al., 2018). Fish is an
extremely perishable food which is vulnerable to decay and very quickly to spoil.

9
According to FAO, most fish become inedible within twelve hours at tropical
temperatures. Therefore, processing or preserving on cold storage must be done
quickly to prevent the growth of spoilage bacteria. Fellows and Hampton (1992)
also stated that fish is very susceptible to the growth of food poisoning bacteria due
to its low acid contamination. Here are some methods of preservation that widely
used in fishery products:
• Cooking (such as boiling and frying)
• Lowering the moisture content (by salting, smoking, and dying or
collectively known as curing)
• Lowering the pH (by fermentation)
• Lowering the temperature (using ice or cold storage)
2.2 Human Factor
Human factors (or ergonomics) as the scientific discipline concerned with
the understanding of the interactions among human and other elements of a system
and the profession that applies theory, principles, data, and methods to design in
order to optimize human well-being and overall system performance (IEA, 2003).
The interactions can be with machines, environment, computers, and other
components in the system. Catchpole (2018) perceived human factor as an
enhancement of performance through an understanding of the effects of teamwork,
tasks, equipment, workspace, culture, organization on human behavior and abilities,
and application of that knowledge in clinical settings. Human factors present in
almost all process in a business, whether directly or indirectly in contact. However,
human is always associated with errors and deviation from the intended goals. The
ever-changing environment of human requires effective communication, team
management, and constant lifecycle innovation (Jurcevic et al., n.d.). In supply
chain operations, human is not only involved as an operator but also as a decision
maker. Human holds an important role in either minimizing or contributing to the
errors/mistakes made during the supply chain process. The involvement of human
is an opportunity to use its intelligence in avoiding mistakes such as record-keeping
and other errors.
10
2.3 Supply Chain
Supply chain represents the flow of operation from the upstream to the
downstream of a particular product/industry. A supply chain involves all entities
who directly or indirectly fulfil a customer’s request (Chopra & Meindl, 2004).
Transporters who deliver the products and retailers who sell the products to the end
customers are both included in the supply chain. Beside that, warehouses, retailers,
and customers are also part of supply chain in addition to the manufacturers and
suppliers. Similar to that, Lambert, Stock and Ellram (1998) defined supply chain
as the alignment of firms that bring products or service to market. Supply chain
includes the activity of materials procurement, transformation of the materials into
intermediate and finished products, and the distribution of the finished products to
customers (Ganeshan & Harrison, 1995). There are at least five areas in a company
that are affected by the supply chain, which are (Hugos, 2003):
1. Production (regarding the type and number of product to be produced or the
master production schedule)
2. Inventory (optimal inventory levels and reorder points at each stage of supply
chain)
3. Location (choosing the most cost efficient locations for production and for
storage of inventory)
4. Transportation (deciding when it is better to use which mode of transportation
considering the cost and time constraints)
5. Information (accurate information and data sharing for better coordination in
terms of effective production, inventory, and transportation)
Christopher (2011) defines supply chain management as the management of
both upstream and downstream relationships with suppliers and customers which is
aimed to give excellent customer value at less cost to the supply chain as a whole.
The ultimate goal of supply chain management is to achieve a more profitable
outcome for all parties in the chain.
11
2.4 Supply Chain Operations Reference (SCOR) Model
SCOR or supply chain operations reference model is a tool which enables
the management to address, improve, and communicate supply chain management
decisions within a company and with suppliers and customers of a company
(Poluha, 2007). The supply chain operations reference was first introduced by the
Supply Chain Council as a model that helps to elaborate the processes along the
entire supply chain. This model is able to help an organization to satisfy the
customer’s demand by improving the six primary management processes that
include plan, source, make, deliver, return, and enable. Using these process building
blocks, supply chains that are very simple or very complex can be described using
a common set of definitions. This resulted in the flexibility of the model that can
link disparate industries and provide a basis for supply chain framework.
The Supply Chain Council stated that although the model can describe
processes along the supply chain, it does not attempt to describe every business
process or activity such as sales and marketing (demand generation), product
development, research and development, and some elements of post-delivery
customer support. But it should be noted that with the new introduction of Return,
the model was extended to the area of post-delivery customer support.
SCOR reference model consists of four major sections which are
performance, processes, practices, and people. However, this research applies only
the SCOR process model as a business process framework to define the activities
involved in a company. The Process section in SCOR provides three levels of
processes as presented in the figure below. Level-1 process consists of six activities
that most companies perform to effectively execute their supply chains. Level-2
process mainly determines the operations strategy such as Make-to-Stock, Make-
to-Order, Engineer-to-Order, etc. While level-3 process defines the steps that are
performed in a certain sequence in order to plan supply chain activities.
12
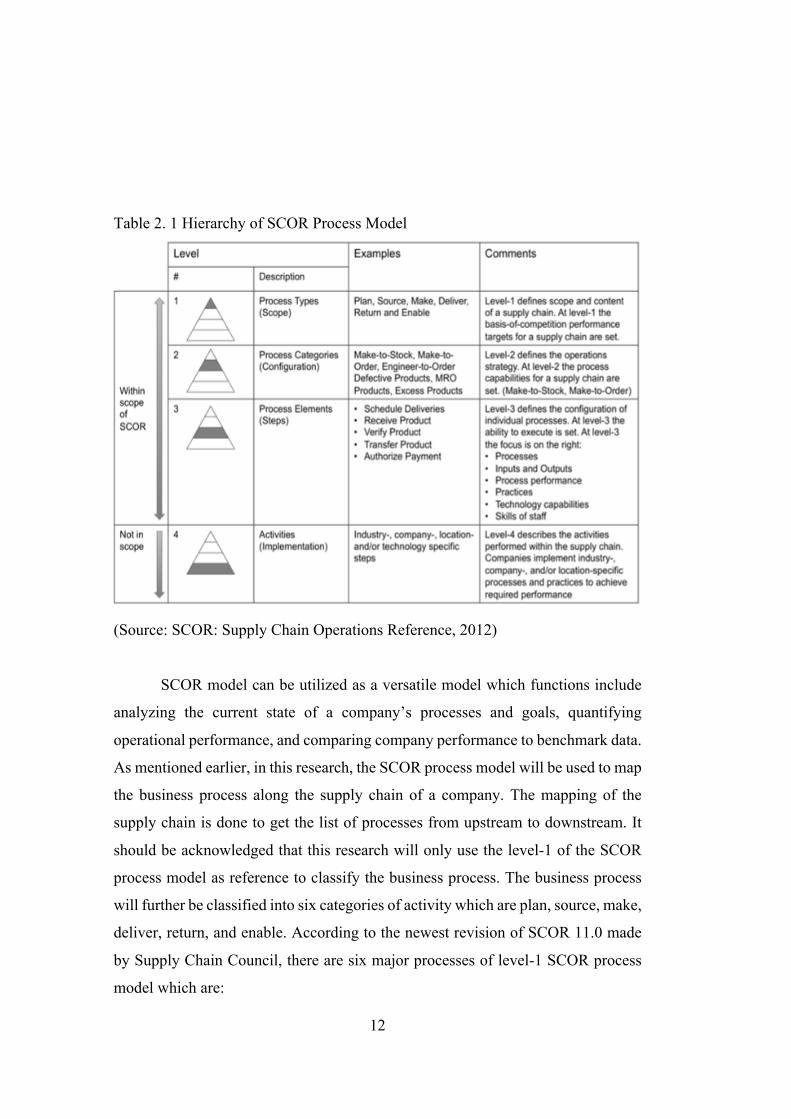
Table 2. 1 Hierarchy of SCOR Process Model
(Source: SCOR: Supply Chain Operations Reference, 2012)
SCOR model can be utilized as a versatile model which functions include
analyzing the current state of a company’s processes and goals, quantifying
operational performance, and comparing company performance to benchmark data.
As mentioned earlier, in this research, the SCOR process model will be used to map
the business process along the supply chain of a company. The mapping of the
supply chain is done to get the list of processes from upstream to downstream. It
should be acknowledged that this research will only use the level-1 of the SCOR
process model as reference to classify the business process. The business process
will further be classified into six categories of activity which are plan, source, make,
deliver, return, and enable. According to the newest revision of SCOR 11.0 made
by Supply Chain Council, there are six major processes of level-1 SCOR process
model which are:
13
1. PLAN
This process consists of the activities regarding the development of
plans to operate the supply chain. It includes the gathering of requirements,
gathering of information on available resources, balancing requirements and
resources to determine planned capabilities and gaps in demand or resources
and identify actions to correct these gaps.
2. SOURCE
Source process explained the activities of ordering (or scheduling
deliveries) and receipt of goods and services. It covers the activities of
purchase order issuance, scheduling deliveries, receiving, validation and
storage of goods and accepting the invoice from the supplier. This process,
however, doesn’t describe the identification, qualification, and contract
negotiation with the supplier.
3. MAKE
In this process, activities which associated with the conversion of
materials or creation of the content for services are described. Make process
is the representation of production or manufacturing process in a common
manufacturing industry.
4. DELIVER
The process of deliver describes activities such as receipt, validation,
and creation of customer orders, scheduling order delivery, pick, pack and
shipment, and invoicing the customer.
5. RETURN
Return process describes the activities associated with the reverse
flow of goods such as the identification of the need to return, the disposition
decision making, the scheduling of the return and the shipment, and receipt
of the return goods.
6. ENABLE
The activities which are included in this process are management of
business rules, performance management, supply chain network
management, managing regulatory compliance and risk management.
14
2.5 Risk Management
Nowadays, more and more companies and organizations conduct risk
management to assess their business processes. In this era of tight competition, risk
management has become an absolute necessity for every company to keep up with
the always-changing business environment. The importance of risk management is
affirmed by Norrman and Jansson (2004) by stating that both Apple and Ericsson
suffered from over 400 and 300 million euro losses due to poor risk management.
Risk by Pettit, Fiksel and Croxton (2010) is defined as changes in the
function of potential output, the probability of their occurrence and amount. Beside
that, Treasury Board of Canada (2010) defines risk as the expression of the
likelihood and impact of an event with the potential to influence the achievement
of an organization’s objectives. Moreover, Hampton (2009) acknowledges risk as
an event with a possibility of loss or injury or an event which has potential for a
negative impact. He also added that risk should have the likelihood of an
undesirable event. In accordance with that, Monahan (2008) stated that anything
that produces a distribution of various outcomes of various probabilities is risk.
Unlike other experts, Collier and Agyei-Ampomah (2006) noted that risk can be
seen as a source of opportunity to business. Risk can be concluded as an event which
yet to occur but the possibility of it occurring can affect the performance of a
company in achieving the goals.
In order to be able to do its business process with minimum disruption,
company usually performs risk management. Risk management aims to manage the
unexpected things that potentially become the obstacle to reach the company’s
objectives. Risk management process aims to protect an organization against the
unfavorable and unfortunate events along with the consequences in order to gain
maximum power and ability to make profit as much as possible. Merna et al. (2008)
describes risk management as a process to identify risks specific to an organization
and to respond to them in an appropriate way. A proper risk management should be
able to provide an organization with the list of potential risks that might affect the
objectives of the organization as well as to guide the organization in managing the
risks through a mitigation strategy.
15
There are several standards that commonly used in conducting a risk
management, including:
• Australia Standards AS/NZS (2004) – Standard on Risk Management
• ISO 31000:2009 – Risk Management Principles and Guidelines
• A Risk Management Standard – IRM/Alarm/AIRMIC (2002) – developed
in 2002 by the UK’s 3 main risk organizations.
• ISO/IEC 31010:2009 – Risk Management - Risk Assessment Techniques
• COSO (2004) – Enterprise Risk Management - Integrated Framework
• OCEG “Red Book” 2.0: 2009 – a Governance, Risk and Compliance
Capability Model
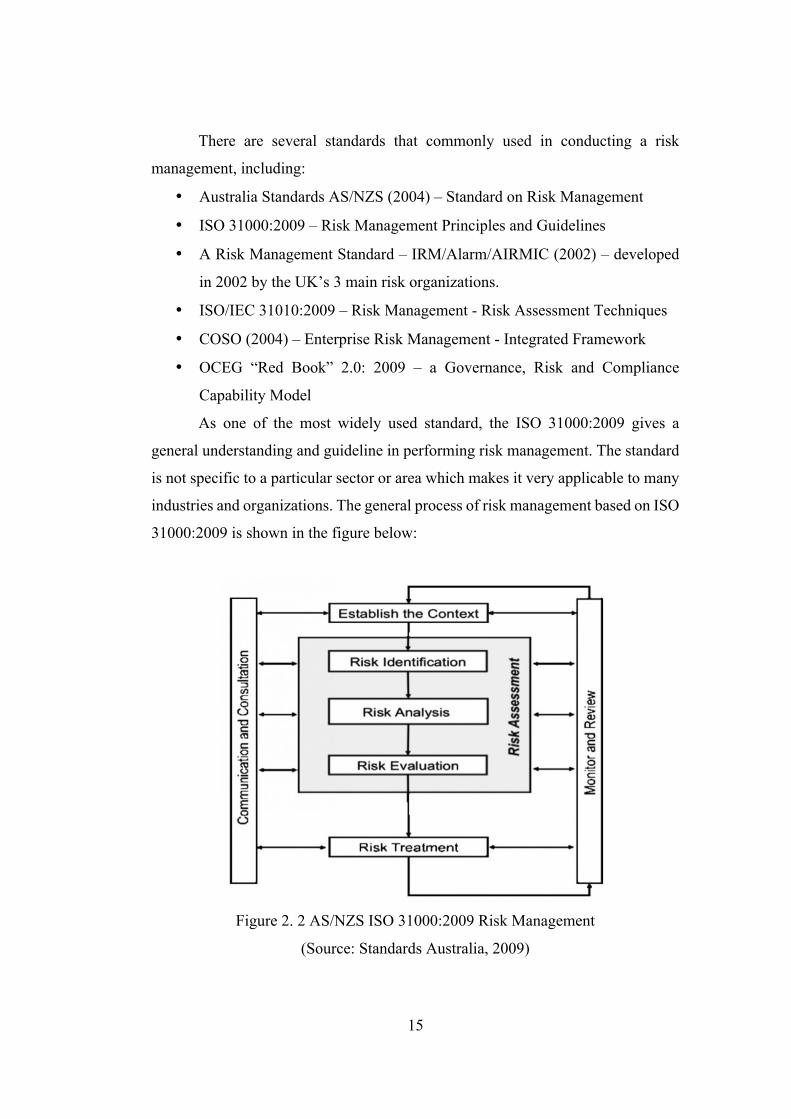
As one of the most widely used standard, the ISO 31000:2009 gives a
general understanding and guideline in performing risk management. The standard
is not specific to a particular sector or area which makes it very applicable to many
industries and organizations. The general process of risk management based on ISO
31000:2009 is shown in the figure below:
Figure 2. 2 AS/NZS ISO 31000:2009 Risk Management
(Source: Standards Australia, 2009)
16
Based on the figure above, there are three main activities in risk
management which are establishing the context, risk assessment, and risk treatment.
Risk assessment consist of risk identification, risk analysis, and risk evaluation.
These activities are accompanied by the process of communication and consultation
and monitoring and review.
2.5.1 Establish the Context
Establishing the context is defined as the basic parameters within which
risks must be managed and sets the scope for the rest of the risk management
process. The context includes the organization’s external and internal environment
and the purpose of the risk management activity. This also includes consideration
of the interface between the external and internal environments.
2.5.2 Risk Identification
Risk identification, as the name implies, is the process to identify the risks
to be managed. The aim of this process is to generate a comprehensive list of
sources of risks and events that might have an impact on the achievement of each
of the objectives identified in the context. All risks must be identified at this stage
to avoid unidentified risk that can appear as a threat in the future. It is also important
to consider the possible causes of the risks. In this step also, not only the risks and
the causes, the source of the risks as well as the consequences will be known.
2.5.3 Risk Analysis
Risk analysis is about developing an understanding of the risk. It provides
an input to decisions on whether risks need to be treated and the most appropriate
and cost-effective risk treatment strategies. Risk analysis involves consideration of
the sources of risk, their positive and negative consequences and the likelihood that
those consequences may occur. Factors that affect consequences and likelihood
may be identified. Risk is analyzed by combining consequences and their
likelihood. In most circumstances existing controls are taken into account. risk is a
function of both likelihood and a measure of consequence. This can be shown
mathematically as:
Risk = Consequence × Likelihood (R = C × L)
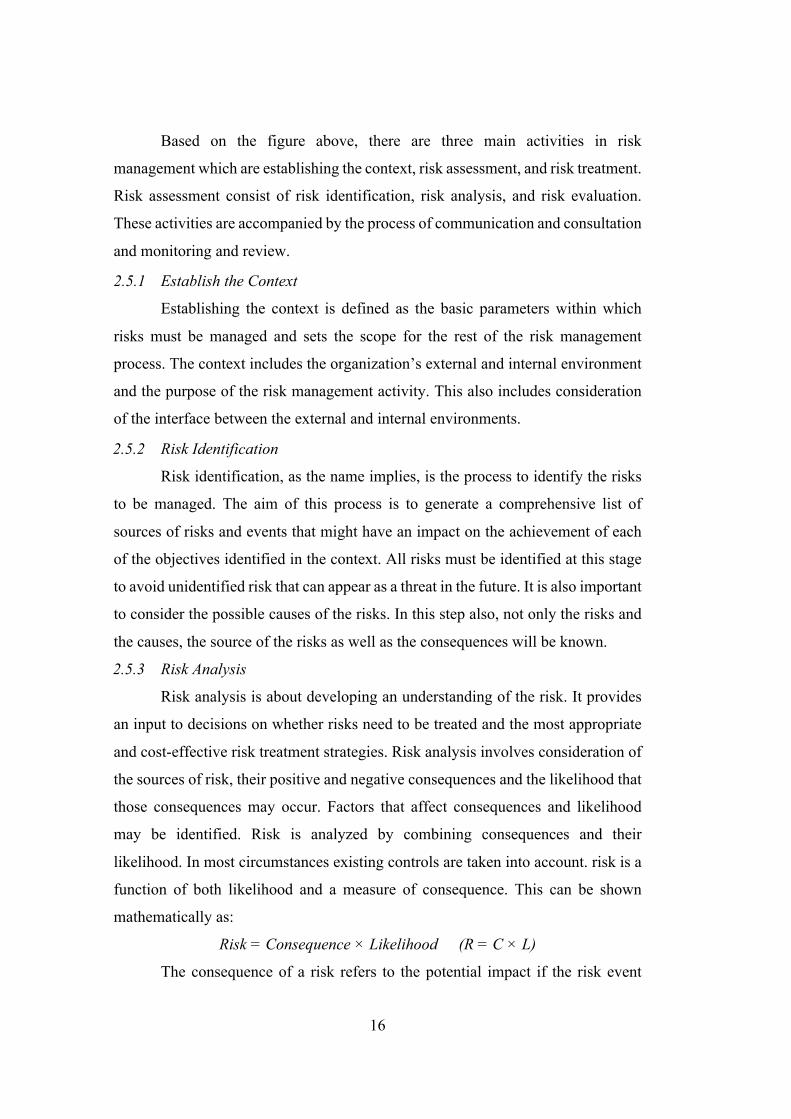
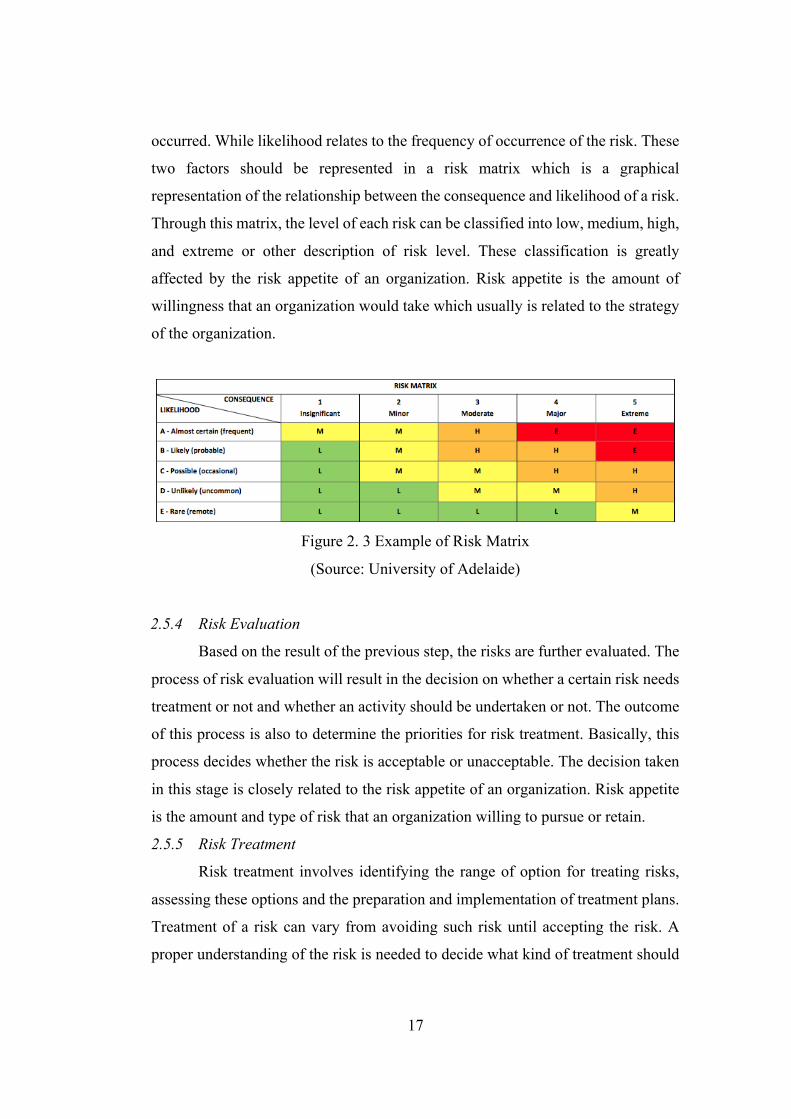
The consequence of a risk refers to the potential impact if the risk event
17
occurred. While likelihood relates to the frequency of occurrence of the risk. These
two factors should be represented in a risk matrix which is a graphical
representation of the relationship between the consequence and likelihood of a risk.
Through this matrix, the level of each risk can be classified into low, medium, high,
and extreme or other description of risk level. These classification is greatly
affected by the risk appetite of an organization. Risk appetite is the amount of
willingness that an organization would take which usually is related to the strategy
of the organization.
Figure 2. 3 Example of Risk Matrix
(Source: University of Adelaide)
2.5.4 Risk Evaluation
Based on the result of the previous step, the risks are further evaluated. The
process of risk evaluation will result in the decision on whether a certain risk needs
treatment or not and whether an activity should be undertaken or not. The outcome
of this process is also to determine the priorities for risk treatment. Basically, this
process decides whether the risk is acceptable or unacceptable. The decision taken
in this stage is closely related to the risk appetite of an organization. Risk appetite
is the amount and type of risk that an organization willing to pursue or retain.
2.5.5 Risk Treatment
Risk treatment involves identifying the range of option for treating risks,
assessing these options and the preparation and implementation of treatment plans.
Treatment of a risk can vary from avoiding such risk until accepting the risk. A
proper understanding of the risk is needed to decide what kind of treatment should
18
be taken to handle it. Treatment to risk generally fall into the following categories
(Harvey, 2007):
• Risk Avoidance
• Risk Reduction
• Risk Sharing or Transfer
• Risk Acceptance
Additionally, risk treatment is then concerned with changing the magnitude
and likelihood of consequences, both positive and negative, to achieve a net
increase in benefit while controls are the outcomes of risk treatment, whose purpose
is to modify risk.
2.6 Supply Chain Risk Management
The supply chain is becoming a very important part of a business operation
more than ever. With the success of several companies who depend greatly on their
supply chain operations; such as ZARA, Seven Eleven, Ikea, and many more; the
activity of supply chain gets more recognition and attention. Corporations become
aware that conducting an efficient supply chain can bring additional benefits to the
company. However, this doesn’t mean that supply chain comes with zero risks.
Some factors and trends are in fact increased the exposure of supply chain to
disturbance (Cagliano et al., 2014). Moreover, Cagliano (2014) added that fiercer
competition and escalated market globalization which recently challenged all
industries will require enterprises to make intra-firm and inter-firm business
processes more efficient and responsive.
When responsiveness is extremely needed, corporations should eliminate
disturbance to its business process to make sure business runs smoothly, including
the supply chain. In order to limit such vulnerability, Sheffi (2005) suggests
organizations to reduce the likelihood of a disruption and to increase its resilience,
which is defined as the ability of an organization to quickly recover from
unanticipated changes and adverse events without rising costs. The fluctuations of
oil price in the market and the unstable political atmosphere in some parts of the
worlds are two examples of uncertainty and unpredictability which contribute to the
19
disruption of supply chain. This is where supply chain risk management is required,
to limit the vulnerability and to tackle disturbance as well as to minimize the
uncertainty faced by supply chain operations. It seems that the frequency and
intensity of catastrophes, disasters, and crises that seem to have increased on a
global scale have triggered the urge of the adaptation of risk management in supply
chain. Beside that, Bode (2008) highlights the terrorist attack of WTC in 2001, the
SARS epidemic in South-East Asia in 2003, and the Hurricane Katrina disaster in
2005 as the main reason of the incremental growth of supply chain risk
management. The ever-changing business environment and the uncertainty that lies
within it has caused supply chain managers to conduct deeper assessment of risks
across the activities involved in supply chain as well as to provide mitigation
strategy that well suited the condition.
The identification and management of risks that influences a supply network
through a coordinated effort within supply chain members to narrow the
vulnerability as a whole is defined as supply chain risk management (Christopher
et al. 2002). Generally, risk identification, risk assessment, risk management and
risk monitoring are the four components of risk management. However, Jüttner,
Peck and Christopher (2003) argued that SCRM consists of four key management
aspects including assessing the risk sources for the supply chain, defining the supply
chain adverse consequences, identifying the risk drivers, and finally mitigating risks
for the supply chain.
2.7 Failure Mode and Effects Analysis (FMEA)
Failure mode and effects analysis is one of the method that can be used to
implement risk assessment process. This method is widely used in manufacturing
company as it can detect failure modes in a product or process. FMEA is able to
identify potential failures which might causes a failure if left unattained. It is also
useful to be used as a tool that allows risks to further be eliminated, and to reduce
the impacts by locating the failure impacts.

20
McDermott et al, (2008) wrote the ten steps for implementing a systematic
FMEA as such:
1. Review the process or product
2. Brainstorm potential failure modes
3. List potential effects of each failure mode
4. Assign a severity rating for each effect
5. Assign an occurrence rating for each failure mode
6. Assign a detection rating for each failure mode and effect
7. Calculate the risk priority number (RPN) for each effect
8. Prioritize the failure modes for action
9. Take action to eliminate or reduce the high risk failure modes
10. Calculate the resulting RPN as the failure modes are reduced or eliminated
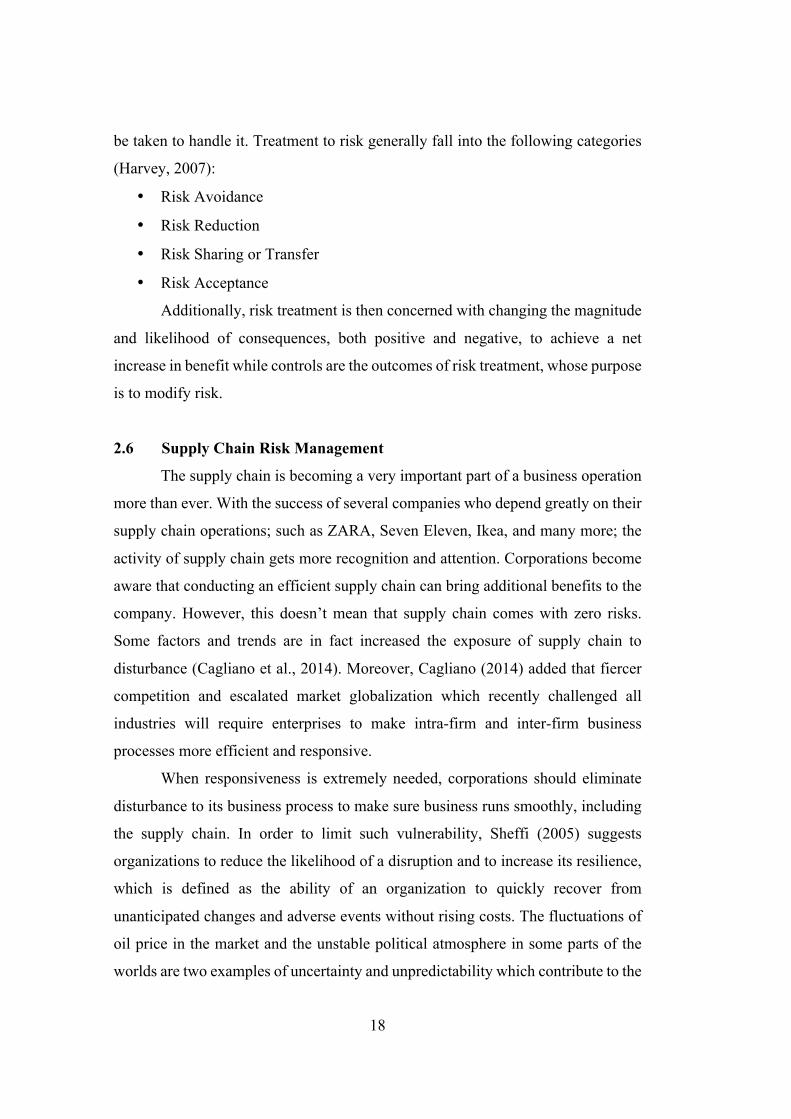
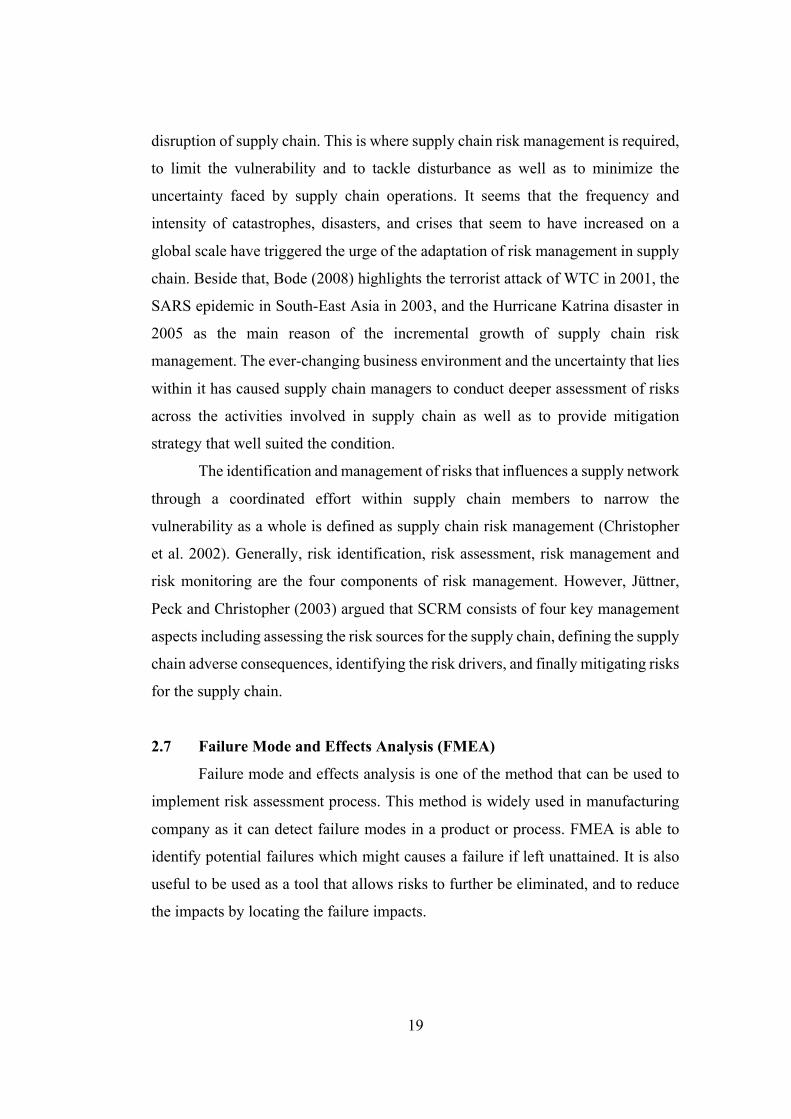
In calculating the RPN, a standard for assigning the rating is used. Actually,
there is no certain standard since risk management is unique for every case, however
usually there is a standard for one research so that the result is not biased in one
research. The standard can be developed in the process of data gathering to adjust
with the condition of the object. The tables below are examples of ratings standard
that can be used to conduct supply chain risk management.
Table 2. 2 Severity Ranking
(Source: Curkovic et al., 2013)
21
Table 2. 3 Occurrence Ranking
(Source: Curkovic et al., 2013)
Table 2. 4 Detection Ranking
(Source: Curkovic et al., 2013)
22
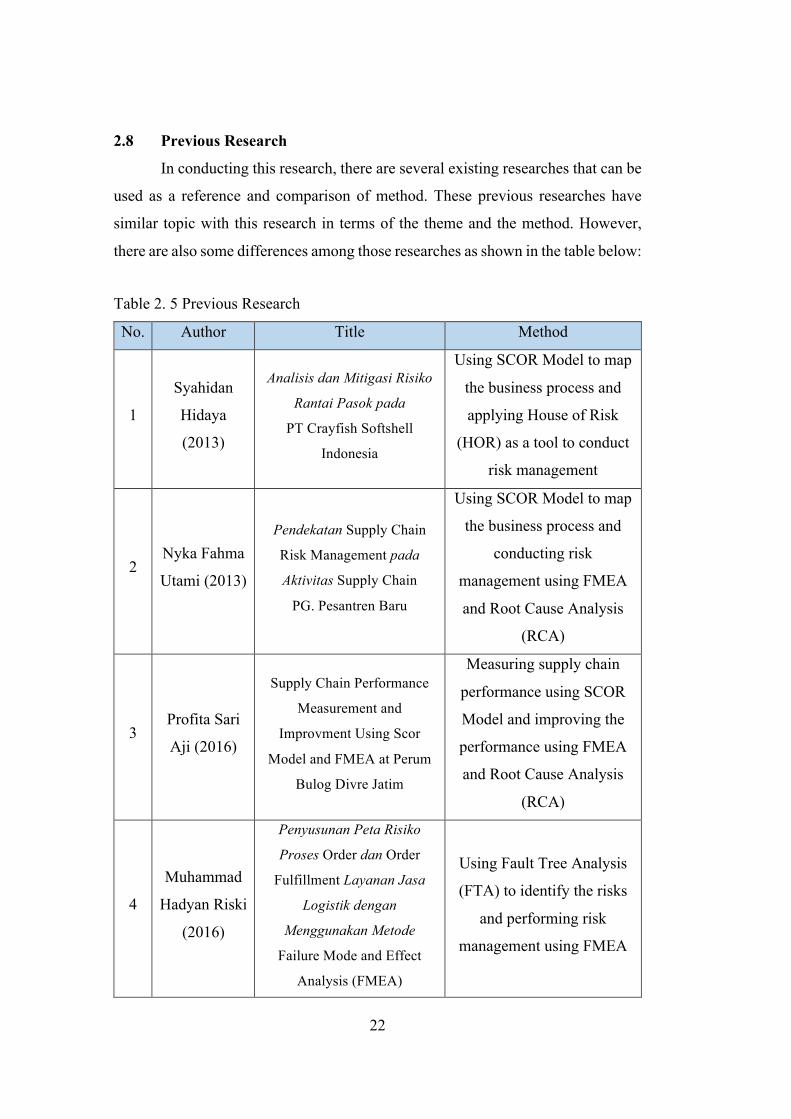
2.8 Previous Research
In conducting this research, there are several existing researches that can be
used as a reference and comparison of method. These previous researches have
similar topic with this research in terms of the theme and the method. However,
there are also some differences among those researches as shown in the table below:
Table 2. 5 Previous Research
No. Author Title Method
1
Syahidan
Hidaya
(2013)
Analisis dan Mitigasi Risiko
Rantai Pasok pada
PT Crayfish Softshell
Indonesia
Using SCOR Model to map
the business process and
applying House of Risk
(HOR) as a tool to conduct
risk management
2 Nyka Fahma
Utami (2013)
Pendekatan Supply Chain
Risk Management pada
Aktivitas Supply Chain
PG. Pesantren Baru
Using SCOR Model to map
the business process and
conducting risk
management using FMEA
and Root Cause Analysis
(RCA)
3 Profita Sari
Aji (2016)
Supply Chain Performance
Measurement and
Improvment Using Scor
Model and FMEA at Perum
Bulog Divre Jatim
Measuring supply chain
performance using SCOR
Model and improving the
performance using FMEA
and Root Cause Analysis
(RCA)
4
Muhammad
Hadyan Riski
(2016)
Penyusunan Peta Risiko
Proses Order dan Order
Fulfillment Layanan Jasa
Logistik dengan
Menggunakan Metode
Failure Mode and Effect
Analysis (FMEA)
Using Fault Tree Analysis
(FTA) to identify the risks
and performing risk
management using FMEA

23
The first research of Syahidan Hidaya (2013) focuses on the analysis and
mitigation of risks in supply chain process of PT Crayfish Softshell Indonesia. The
research is conducted using House of Risk (HOR) and SCOR Model as the business
process mapping tool. The research manages to identify 37 risks and 64 risk agent.
Among them, there are 13 risks which are classified as high-risk. There are 21
mitigation action that are successfully created but only 5 of them that are chosen to
be implemented.
On the other hand, the research of Nyka Fahma Utami (2013) performs
supply chain risk management in PG. Pesantren Baru. The research is done by
mapping the business process using SCOR Model and by performing FMEA. The
result shows that there are 47 risks in which 8 of them are high-risks. The mitigation
strategy is developed using Root Cause Analysis (RCA).
The next research conducts a broader area than just risk management, it also
covers the performance measurement. Profita Sari Aji (2016) measures the supply
chain performance of Perum Bulog Divre Jatim by implementing the SCOR Model.
The result shows that the performance only reaches 75.45% and needs immediate
improvement. The research also suggests several improvements by performing
FMEA to some activities that are below standard. The result of the research, which
is mitigation strategy, is obtained through Root Cause Analysis (RCA).
The last research that will be explained is written by Muhammad Hadyan
Riski (2016). In this research, the author aims to develop a risk mapping in the
process of Order and Order Fulfillment in a logistics service company. There are
60 risks found in the observed processes. Those risks are identified using the help
of Fault Tree Analysis (FTA). Among the 47 high-risks, only 27 risks that are
mitigated with the treatment of risk avoidance and risk mitigation.
Based on the researches above, there are no research that analyzed the
human factor in the supply chain process. In this case, this research aims to conduct
an assessment of risk that related to human factor in the supply chain process of PT
ICS. The research will be conducted using FMEA process and SCOR Model as the
business process mapping. The mitigation plan will be developed with the help of
Root Cause Analysis (RCA) to find the initial problem of each mitigated risk.

24
(This page is intentionally left blank)

25
CHAPTER III
RESEARCH METHODOLOGY
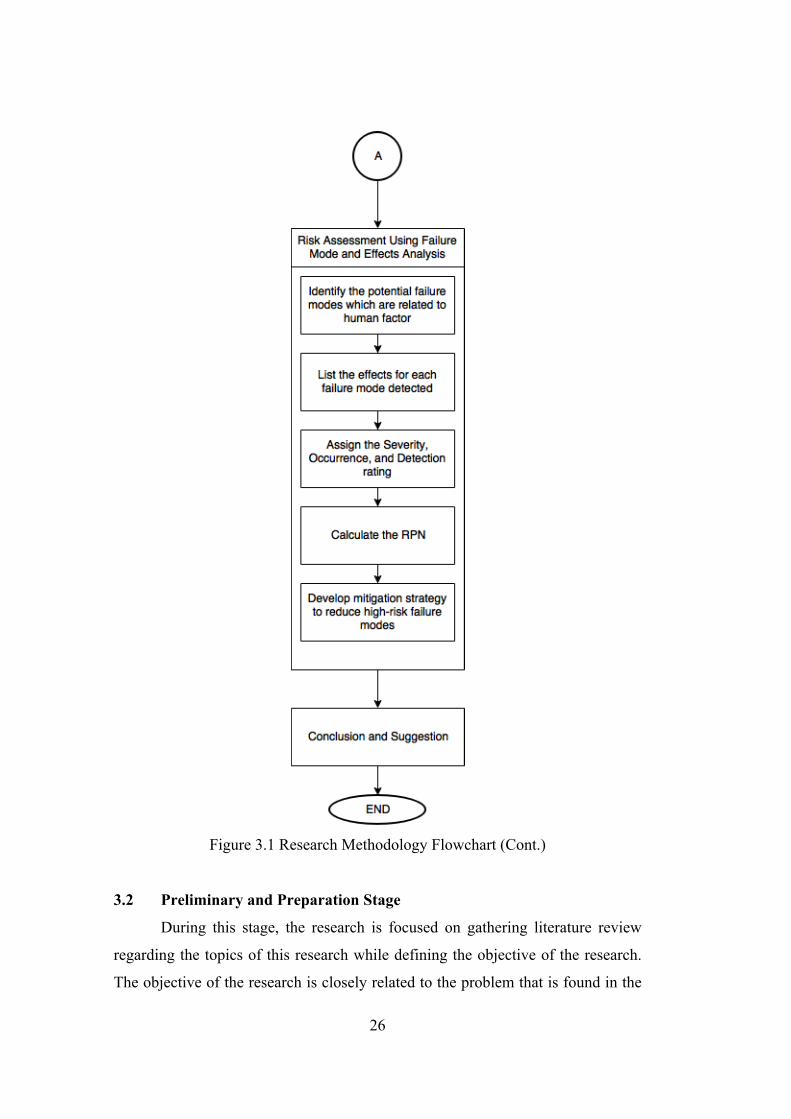
This chapter contains the flowchart that shows the methodology used in this
research. The step by step process of conducting this research will be explained
based on the flowchart. The flowchart is used as a guideline to do the research which
comprises as observation and literature review, supply chain process mapping, risk
assessment using FMEA, and conclusion and suggestion.
3.1 Research Methodology Flowchart
The flowchart below shows the methodology to conduct this research from
the start until the end.
Figure 3. 1 Research Methodology Flowchart
26
Figure 3.1 Research Methodology Flowchart (Cont.)
3.2 Preliminary and Preparation Stage
During this stage, the research is focused on gathering literature review
regarding the topics of this research while defining the objective of the research.
The objective of the research is closely related to the problem that is found in the
27
object, in this case PT ICS. The problem is found during the discussion with the
representative of the company. After the brief discussion, the research will proceed
to the formation of objectives of the research. The objective of the research is
anything that is expected to be achieved by doing this research. The observation is
also done in this stage by doing a visitation which is aimed to get the insight of the
production process in the company. In the observation process, the researcher wants
to observe the current situation of the supply chain process of PT ICS.
Meanwhile, the problem and objectives are supported by the findings in the
form of another researches, books, or articles around the topic of research. The
literature review consists of the explanations of supply chain, supply chain risk
management, human factor, risk management, Failure Mode and Effects Analysis
(FMEA), Supply Chain Operation Reference (SCOR) model, and also the overview
of Indonesia’s fishery industry.
3.3 Supply Chain Process Mapping
After knowing the process of supply chain in PT ICS, the next step is to
classify the activities involved in the supply chain process into the SCOR model.
Supply Chain Operation Reference (SCOR) categorizes the supply chain activity
into six major categories, these categories include plan, source, make, deliver,
return, and enable. The activities of supply chain process of PT ICS will be
categorized according to the nature of the activity itself. These classifications will
become the input of the next step of the research.
3.4 Risk Assessment
In this stage of research, the risk assessment will be conducted. The result
of the previous step, which is activities of supply chain that are already mapped
using SCOR, will be used as an input of this step. The method that will be used to
assess the risks is Failure Mode and Effect Analysis (FMEA).
The first step of the risk assessment process is the identification of all
potential failure modes. The failure modes that will be identified are those that
related to human factor. The failure modes are identified by analyzing every activity
in each category of the supply chain process.
28
The next step is the process of analyzing each failure mode/risk to determine
the effect that can be caused by the risk. This process will also affect the severity
rating that will be given later. Beside that, the cause of each risk should also be
determined. The current control of the risk should also be noted and it will affect
the detection rating later on.
After that, the severity, occurrence, and detection rating should be given to
the already listed risks. The ratings are in the range of 1-10. The score is given by
the respondents through a FMEA questionnaire. The respondents of the
questionnaire are those who are the experts of this field or in this company. There
are three questionnaires that are distributed to the Director of Operational, Head of
Production, and QC of Production. Each of the respondent fills the questionnaire
by giving scores to the severity, occurrence, and detection of the failure modes.
After that, the RPN number can be obtained by multiplying the ratings of severity,
occurrence, and detection. The maximum number of RPN is 1000. The higher the
number means the higher of the risk category.
The RPN number will be used to prioritize the risk that are going to be
mitigated. The risks that are going to be mitigated are the risks that have high RPN
number. Those risks need to be paid attention carefully in order to reduce impact of
the risks or to be eliminated entirely.
The mitigation strategies will be developed based on the risks with high
category. Those risks will be mitigated to prevent it from happen. The mitigation
strategy should also pay attention to the cost incurred by doing an action. The root
cause analysis will be used to find the source of the problem.
3.5 Conclusion and Suggestion
In this stage, the conclusion will be drawn from the result of the research.
The conclusion will answer the objectives that are already stated in the first chapter.
The suggestion will also be added after analyzing the result of the research. The
suggestion will be given to the company and also to the research that will be
conducted later.
29
CHAPTER IV
DATA COLLECTION AND DATA PROCESSING
This chapter provides the information related to data collection and data
processing of this research. The data are collected through a series of interviews
with the object and also through questionnaire. The data that is processed in this
chapter will later be used as an input of the next chapter.
4.1 Company Profile
ICS Group was established on 11 November 1987. ICS Group consists of
several companies that focus their operation in seafood industry. One of them is PT
Insan Citra Prima Sejahtera which focuses its main business in the production of
dried anchovy or sometimes known as chirimen. The head office of PT Insan Citra
Prima Sejahtera is located in Waru, Sidoarjo while the production site is in Jenu,
Tuban. As one of the major seafood company in Indonesia, especially in Java, ICS
Group aims to develop and improve in years ahead. It is reflected through its three
visions and missions which are written below.
1. To produce and serve only in high quality standard
2. Always strive to satisfy ICS’s customers
3. To become a world-class company in food and beverage industry
It can be seen from the first statement that the priority of PT ICS is the
quality of the product. This company values quality as the first criteria to describe
their product. The second priority of this company is the customer’s satisfaction.
Customer satisfaction is fulfilled through high quality standard of product and also
good customer management. Since the company mainly serve international market,
the company also aimed to be a world-class company in food and beverage industry.
Vision and mission of a company functions as an objective that should be achieved
in the future. Risk assessment done in this research is useful to ensure that the
company will be able to achieve its objective by minimizing or eliminating the
obstacle or disruption.

30
PT ICS produces two kinds of dried anchovy, which are Prima Chirimen
and Prima Excellent. Both of the products are produced simultaneously in the same
production site. The difference between the two product lies in the sorting process.
Prima Chirimen requires only one sorting process while Prima Excellent requires
at least four sorting process. The sorting process of Prima Excellent consists of 1st
Sorting and 2nd Sorting which consists of white and green tray sorting process, and
metal magnet sorting process. The complicated sorting process in Prima Excellent
is aimed to produce a high quality product with no or minimum foreign object and
other species contamination. The foreign objects that should be removed from the
dried anchovy through sorting process are listed below.
• Seashell eyes
• Plastic
• Crushed seashell
• Fish scale
• Hair strands
• Flies
• Sea lice
• Seashell
• Wooden scrap
• Paint waste
• Thread and string
• Stones
Besides that, Prima Excellent also needs to be free from other sea species
listed below.
• Buntek
• Amber-amber
• Blirik
• Cemek
• Dodok & Pindang
• Japoh
• Kempel Kuning
• Layur
• Petek & Dodok
• Sumbi
• Red tail anchovy
• Black anchovy
• Yellow anchovy
• Teri padi
• Teri temple
All of the objects above should be removed to get a high quality product and
to maintain the company’s good reputation. PT ICS also provides several sizes of
dried anchovy. There are five sizes available in the company which are SS, S2, S,
S1, and M. The product of dried anchovy is shipped in the packaging of carton
weighed

31
weighed 6 kg each. The export destination of dried anchovy of PT ICS is 85% to
Japan and the rest is to Europe, America , and other Asia Region.
Figure 4. 1 Business Process of PT ICS
The figure above displays the processes of supply chain in PT ICS and its
relation to the other parties. There are three other parties beside PT ICS that is
involved which are the supplier, 3rd party logistics, and the customer.
32
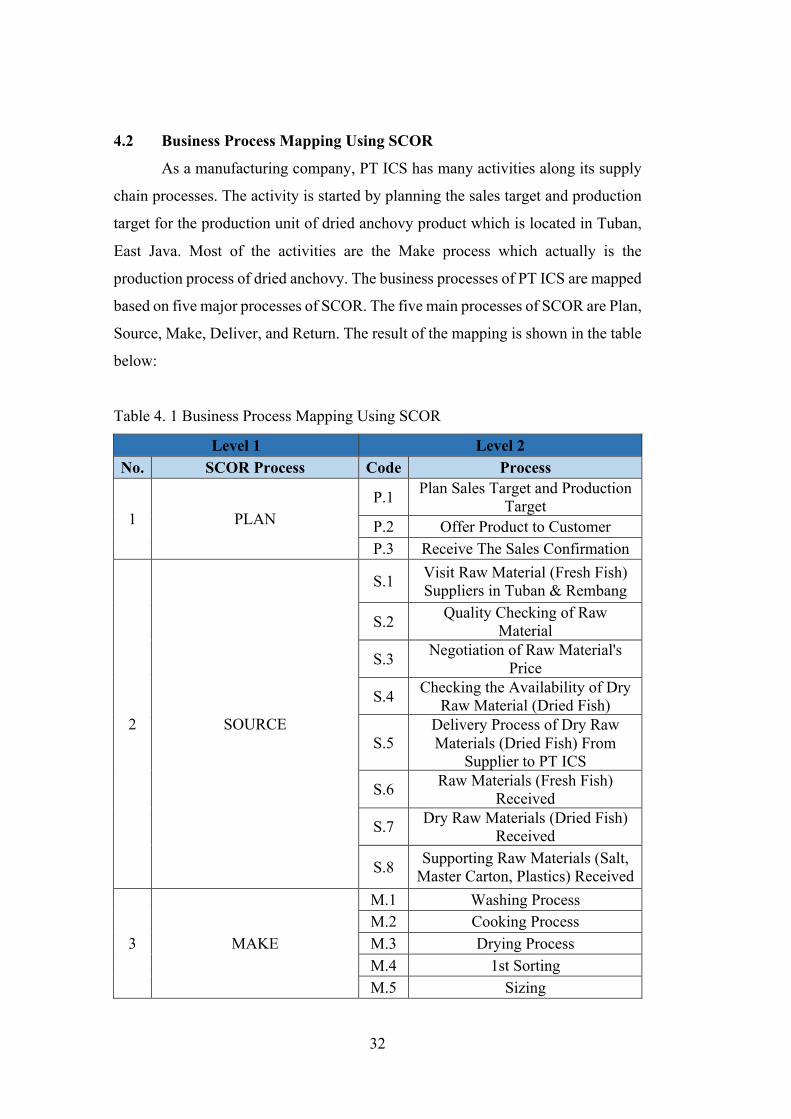
4.2 Business Process Mapping Using SCOR
As a manufacturing company, PT ICS has many activities along its supply
chain processes. The activity is started by planning the sales target and production
target for the production unit of dried anchovy product which is located in Tuban,
East Java. Most of the activities are the Make process which actually is the
production process of dried anchovy. The business processes of PT ICS are mapped
based on five major processes of SCOR. The five main processes of SCOR are Plan,
Source, Make, Deliver, and Return. The result of the mapping is shown in the table
below:
Table 4. 1 Business Process Mapping Using SCOR
Level 1 Level 2 No. SCOR Process Code Process
1 PLAN P.1 Plan Sales Target and Production
Target P.2 Offer Product to Customer P.3 Receive The Sales Confirmation
2 SOURCE
S.1 Visit Raw Material (Fresh Fish) Suppliers in Tuban & Rembang
S.2 Quality Checking of Raw Material
S.3 Negotiation of Raw Material's Price
S.4 Checking the Availability of Dry Raw Material (Dried Fish)
S.5 Delivery Process of Dry Raw Materials (Dried Fish) From
Supplier to PT ICS
S.6 Raw Materials (Fresh Fish) Received
S.7 Dry Raw Materials (Dried Fish) Received
S.8 Supporting Raw Materials (Salt, Master Carton, Plastics) Received
3 MAKE
M.1 Washing Process M.2 Cooking Process M.3 Drying Process M.4 1st Sorting M.5 Sizing
33
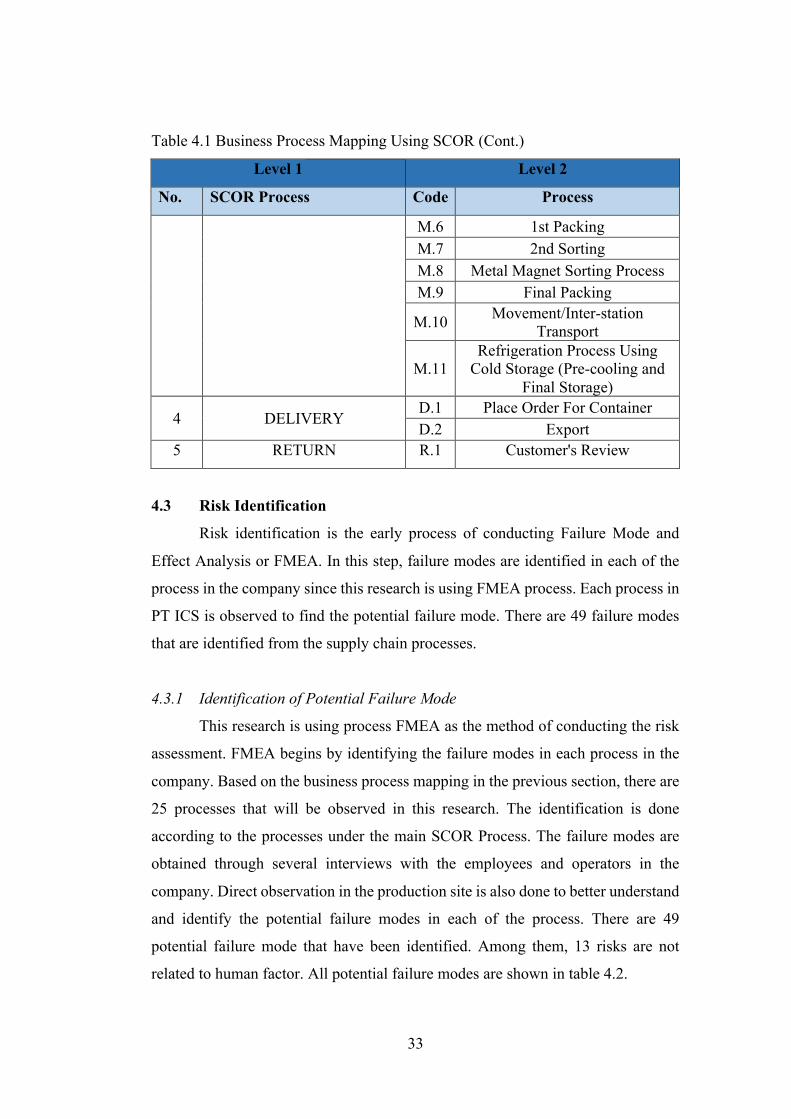
Table 4.1 Business Process Mapping Using SCOR (Cont.)
Level 1 Level 2
No. SCOR Process Code Process
M.6 1st Packing M.7 2nd Sorting M.8 Metal Magnet Sorting Process M.9 Final Packing
M.10 Movement/Inter-station Transport
M.11 Refrigeration Process Using
Cold Storage (Pre-cooling and Final Storage)
4 DELIVERY D.1 Place Order For Container D.2 Export
5 RETURN R.1 Customer's Review
4.3 Risk Identification
Risk identification is the early process of conducting Failure Mode and
Effect Analysis or FMEA. In this step, failure modes are identified in each of the
process in the company since this research is using FMEA process. Each process in
PT ICS is observed to find the potential failure mode. There are 49 failure modes
that are identified from the supply chain processes.
4.3.1 Identification of Potential Failure Mode
This research is using process FMEA as the method of conducting the risk
assessment. FMEA begins by identifying the failure modes in each process in the
company. Based on the business process mapping in the previous section, there are
25 processes that will be observed in this research. The identification is done
according to the processes under the main SCOR Process. The failure modes are
obtained through several interviews with the employees and operators in the
company. Direct observation in the production site is also done to better understand
and identify the potential failure modes in each of the process. There are 49
potential failure mode that have been identified. Among them, 13 risks are not
related to human factor. All potential failure modes are shown in table 4.2.

34
Table 4. 2 List of Potential Failure Mode
No. SCOR Process Code Process Risk Code Potential Failure Mode
1 PLAN
P.1 Plan Sales Target and Production Target
P.1.1 Sales target is not achieved P.1.2 Production target is not achieved
P.2 Offer Product to Customer P.2.1 Customers bid low prices
P.3 Receive The Sales Confirmation P.3.1
The final product (ready-to-deliver product) is not in accordance with the sales confirmation
(regarding the product assortment and shipment schedule)
2 SOURCE
S.1 Visit Raw Material (Fresh Fish) Suppliers in Tuban & Rembang
S.1.1 Raw material is unavailable S.1.2 The amount of the raw material is only a few
S.2 Quality Checking of Raw Material
S.2.1 The quality score given by the procurement
team is not in accordance with the actual fish condition
S.2.2 The quality of the dry raw material is not the same (worse) as what the suppliers promised
S.3 Negotiation of Raw Material's Price
S.3.1 The price demanded by suppliers increases (more expensive)
S.3.2 The price of dry raw materials is too high compared to the quality
S.4 Checking the Availability of Dry Raw Material (Dried Fish) S.4.1 Dry Raw material is unavailable
S.5 Delivery Process of Dry Raw Materials (Dried Fish) From
Supplier to PT ICS S.5.1 Raw materials are damaged during the delivery
process
35
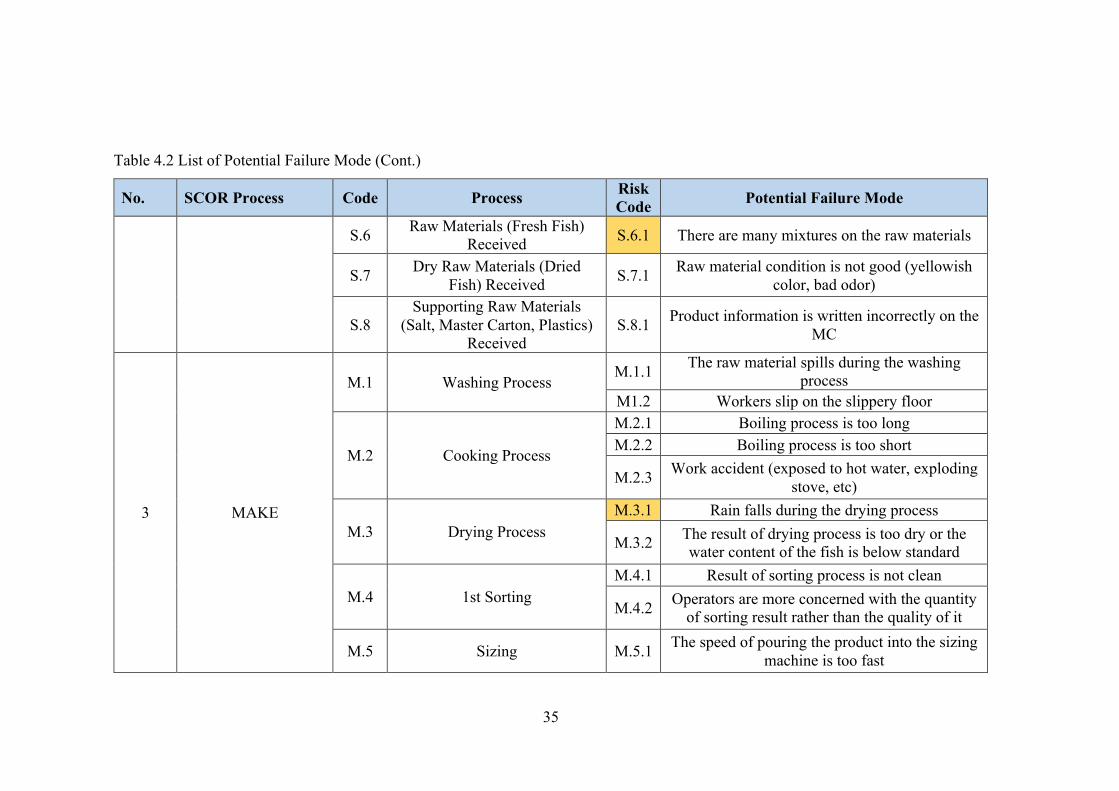
Table 4.2 List of Potential Failure Mode (Cont.)
No. SCOR Process Code Process Risk Code Potential Failure Mode
S.6 Raw Materials (Fresh Fish) Received S.6.1 There are many mixtures on the raw materials
S.7 Dry Raw Materials (Dried Fish) Received S.7.1 Raw material condition is not good (yellowish
color, bad odor)
S.8 Supporting Raw Materials
(Salt, Master Carton, Plastics) Received
S.8.1 Product information is written incorrectly on the MC
3 MAKE
M.1 Washing Process M.1.1 The raw material spills during the washing
process M1.2 Workers slip on the slippery floor
M.2 Cooking Process
M.2.1 Boiling process is too long M.2.2 Boiling process is too short
M.2.3 Work accident (exposed to hot water, exploding stove, etc)
M.3 Drying Process M.3.1 Rain falls during the drying process
M.3.2 The result of drying process is too dry or the water content of the fish is below standard
M.4 1st Sorting M.4.1 Result of sorting process is not clean
M.4.2 Operators are more concerned with the quantity of sorting result rather than the quality of it
M.5 Sizing M.5.1 The speed of pouring the product into the sizing machine is too fast

36
Table 4.2 List of Potential Failure Mode (Cont.)
No. SCOR Process Code Process Risk Code Potential Failure Mode
M.5.2 Supply of products to be sized has an uneven size
M.5.3 Products to be sized is too dry
M.5.4 Product is placed on container of the wrong size group
M.5.5 The size of the product resulted from the sizing process is uneven
M.5.6 The product in the container drops and spills when it is poured into the sizing machine
M.5.7 Fan blower on the sizing machine is broken M.6 1st Packing M.6.1 Running out of Master Carton (MC)
M.7 2nd Sorting
M.7.1 The previous sorting result is not clean yet M.7.2 Result of sorting process is not clean
M.7.3 (Dry raw materials) Products to be sorted contain a lot of mixtures/not clean
M.8 Metal Magnet Sorting Process M.8.1 The magnet is not working properly M.9 Final Packing M.9.1 Operator incorrectly stamped codes on an MC
M.10 Movement/Inter-station Transport
M.10.1 Products (MCs) fall when they're moved from one place to another
M.10.2 The packaging of the product is damaged

37
Table 4.2 List of Potential Failure Mode (Cont.)
No. SCOR Process Code Process Risk Code Potential Failure Mode
M.11 Refrigeration Process Using
Cold Storage (Pre-cooling and Final Storage)
M.11.1 The product is damaged when stored in the cold storage
M.11.2 The packaging of the product is damaged when stored in the cold storage
M.11.3 Temperature of cold storage is unstable M.11.4 The cold storage is full
4 DELIVERY
D.1 Place Order For Container D.1.1 The available schedule is not anytime soon
D.2 Export
D.2.1 Production team fails to achieve the production targets on the delivery schedule
D.2.2 Delivery schedule (from shipping company) is not due anytime soon
D.2.3 The product is damaged when stored in the container
5 RETURN R.1 Customer's Review R.1.1 Complaints From Customers R.2.2 Customers Request Claim
38
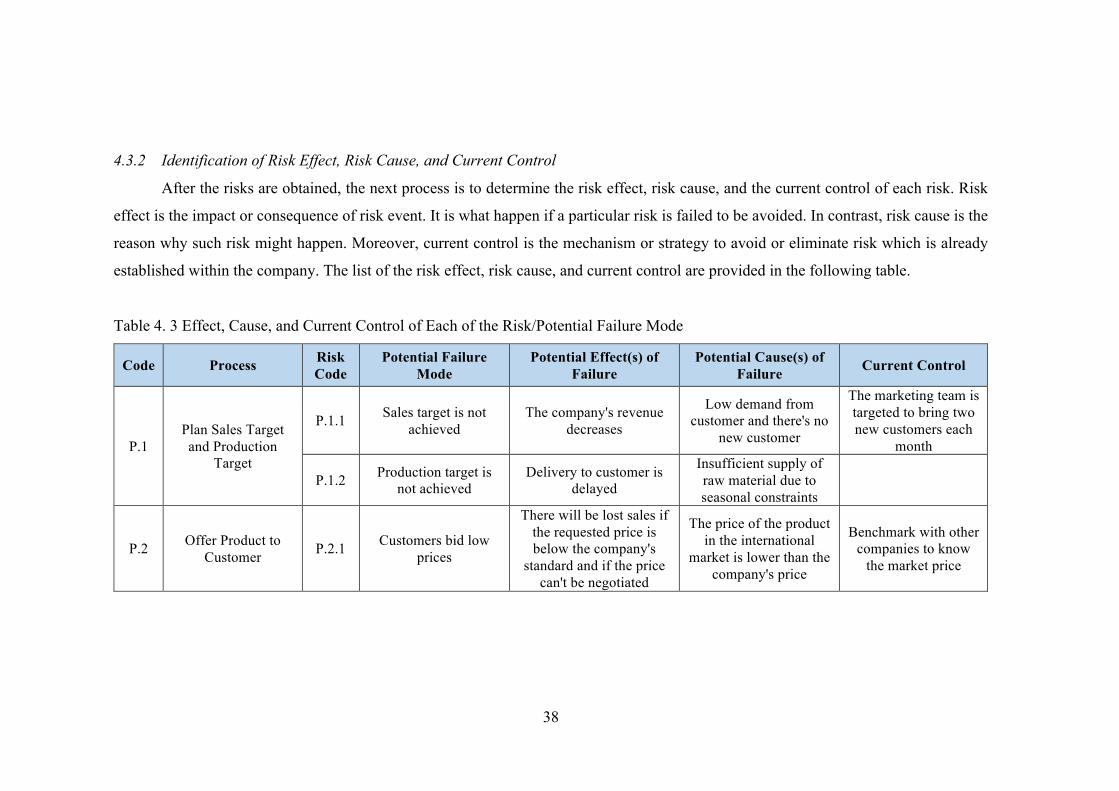
4.3.2 Identification of Risk Effect, Risk Cause, and Current Control
After the risks are obtained, the next process is to determine the risk effect, risk cause, and the current control of each risk. Risk
effect is the impact or consequence of risk event. It is what happen if a particular risk is failed to be avoided. In contrast, risk cause is the
reason why such risk might happen. Moreover, current control is the mechanism or strategy to avoid or eliminate risk which is already
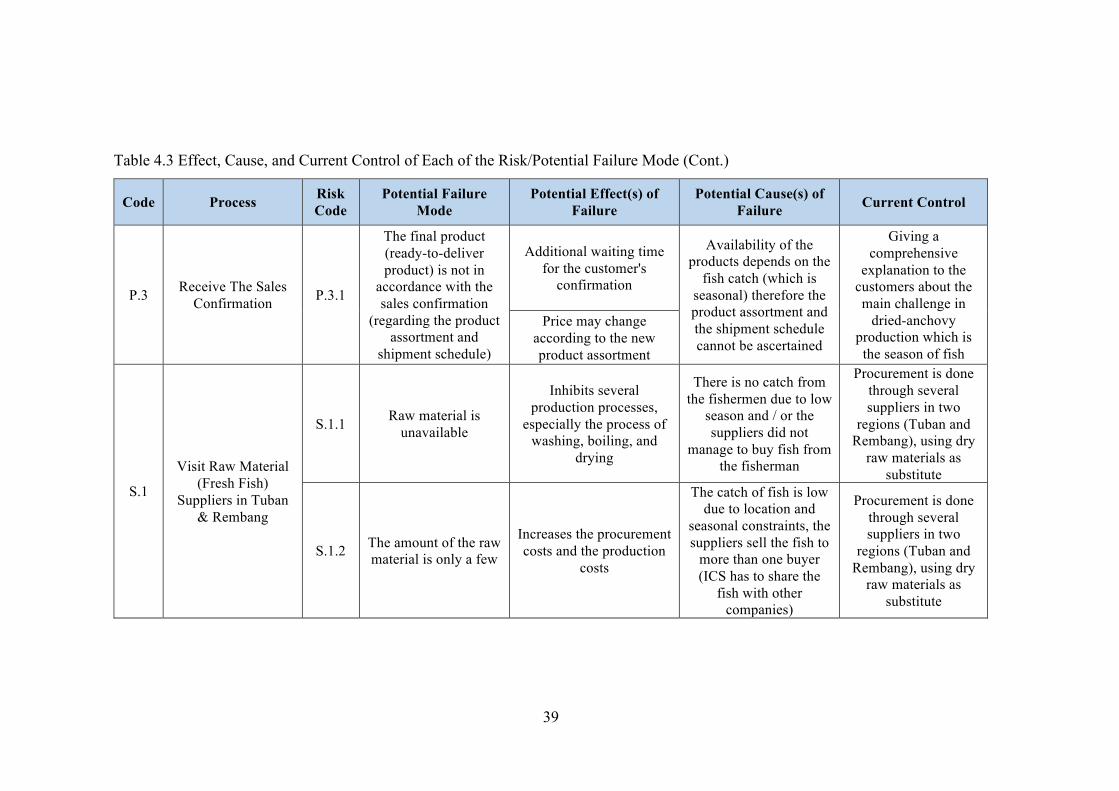
established within the company. The list of the risk effect, risk cause, and current control are provided in the following table.
Table 4. 3 Effect, Cause, and Current Control of Each of the Risk/Potential Failure Mode
Code Process Risk Code
Potential Failure Mode
Potential Effect(s) of Failure
Potential Cause(s) of Failure Current Control
P.1 Plan Sales Target and Production
Target
P.1.1 Sales target is not achieved
The company's revenue decreases
Low demand from customer and there's no
new customer
The marketing team is targeted to bring two new customers each
month
P.1.2 Production target is not achieved
Delivery to customer is delayed
Insufficient supply of raw material due to seasonal constraints
P.2 Offer Product to Customer P.2.1 Customers bid low
prices
There will be lost sales if the requested price is below the company's
standard and if the price can't be negotiated
The price of the product in the international
market is lower than the company's price
Benchmark with other companies to know
the market price
39
Table 4.3 Effect, Cause, and Current Control of Each of the Risk/Potential Failure Mode (Cont.)
Code Process Risk Code
Potential Failure Mode
Potential Effect(s) of Failure
Potential Cause(s) of Failure Current Control
P.3 Receive The Sales Confirmation P.3.1
The final product (ready-to-deliver product) is not in
accordance with the sales confirmation
(regarding the product assortment and
shipment schedule)
Additional waiting time for the customer's
confirmation
Availability of the products depends on the
fish catch (which is seasonal) therefore the product assortment and the shipment schedule cannot be ascertained
Giving a comprehensive
explanation to the customers about the main challenge in
dried-anchovy production which is the season of fish
Price may change according to the new product assortment
S.1
Visit Raw Material (Fresh Fish)
Suppliers in Tuban & Rembang
S.1.1 Raw material is unavailable
Inhibits several production processes,
especially the process of washing, boiling, and
drying
There is no catch from the fishermen due to low
season and / or the suppliers did not
manage to buy fish from the fisherman
Procurement is done through several suppliers in two
regions (Tuban and Rembang), using dry
raw materials as substitute
S.1.2 The amount of the raw material is only a few
Increases the procurement costs and the production
costs
The catch of fish is low due to location and
seasonal constraints, the suppliers sell the fish to
more than one buyer (ICS has to share the
fish with other companies)
Procurement is done through several suppliers in two
regions (Tuban and Rembang), using dry
raw materials as substitute

40
Table 4.3 Effect, Cause, and Current Control of Each of the Risk/Potential Failure Mode (Cont.)
Code Process Risk Code
Potential Failure Mode
Potential Effect(s) of Failure
Potential Cause(s) of Failure Current Control
S.2 Quality Checking of Raw Material
S.2.1
The quality score given by the
procurement team is not in accordance with
the actual fish condition
The raw materials received by the company
is not as good as the quality score which
results in the lower final product quality
Negligence of workers in charge of checking
the quality of raw materials (fresh fish)
Workers who are in charge of checking the quality are those who
are experts in their field so that mistakes
can be minized
S.2.2
The quality of the dry raw material is not the same (worse) as what the suppliers promised
Quality of raw material decreases (quality
downgrade) which results in the declining quality of
the final product
Differences in quality standards between
company and suppliers, differences in
production system / working system between company and suppliers
Providing education on quality standards
and production system to assisted suppliers Less amount of final
product Sorting process takes
more time
S.3 Negotiation of Raw Material's Price
S.3.1 The price demanded
by suppliers increases (more expensive)
Raw material costs increases and cost of
goods manufactured also increases
Scarcity of raw materials
S.3.2
The price of dry raw materials is too high
compared to the quality
Price negotiation process with the suppliers
becomes more complicated
Differences in (dry raw materials) quality standards between
company and suppliers
Providing education on quality standards
and production system to assisted suppliers
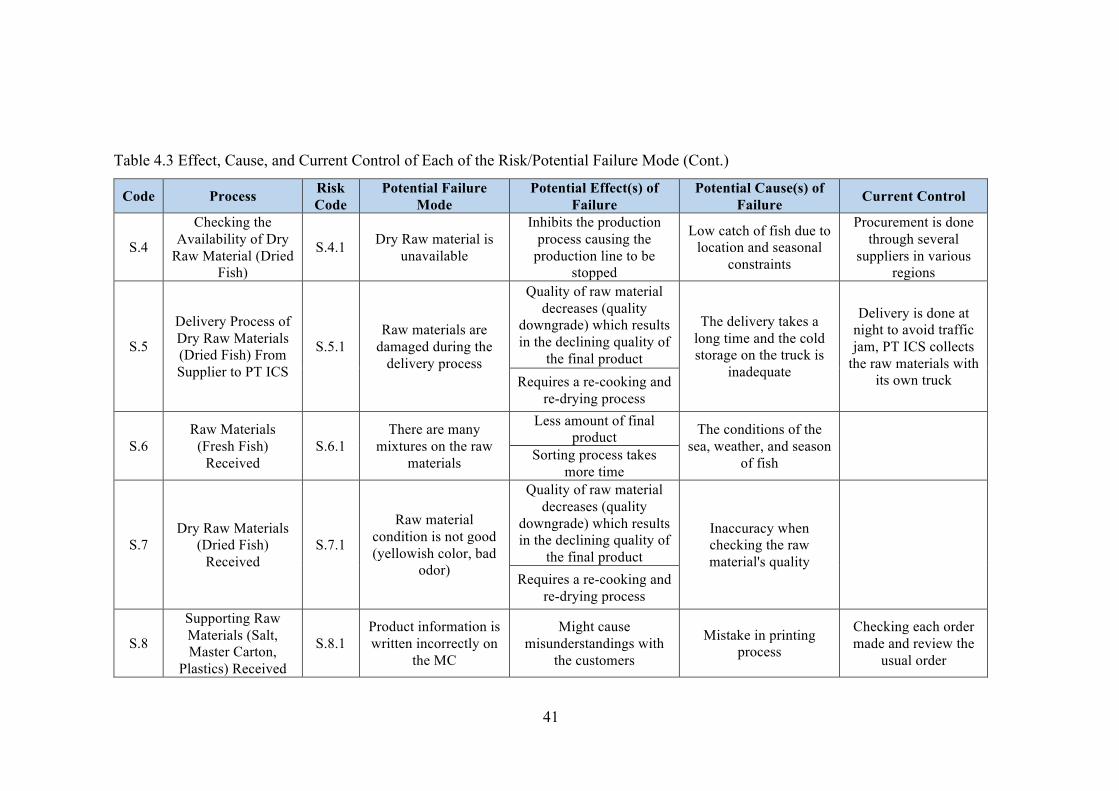
41
Table 4.3 Effect, Cause, and Current Control of Each of the Risk/Potential Failure Mode (Cont.)
Code Process Risk Code
Potential Failure Mode
Potential Effect(s) of Failure
Potential Cause(s) of Failure Current Control
S.4
Checking the Availability of Dry
Raw Material (Dried Fish)
S.4.1 Dry Raw material is unavailable
Inhibits the production process causing the
production line to be stopped
Low catch of fish due to location and seasonal
constraints
Procurement is done through several
suppliers in various regions
S.5
Delivery Process of Dry Raw Materials (Dried Fish) From Supplier to PT ICS
S.5.1 Raw materials are
damaged during the delivery process
Quality of raw material decreases (quality
downgrade) which results in the declining quality of
the final product
The delivery takes a long time and the cold storage on the truck is
inadequate
Delivery is done at night to avoid traffic jam, PT ICS collects
the raw materials with its own truck Requires a re-cooking and
re-drying process
S.6 Raw Materials
(Fresh Fish) Received
S.6.1 There are many
mixtures on the raw materials
Less amount of final product The conditions of the
sea, weather, and season of fish
Sorting process takes more time
S.7 Dry Raw Materials
(Dried Fish) Received
S.7.1
Raw material condition is not good (yellowish color, bad
odor)
Quality of raw material decreases (quality
downgrade) which results in the declining quality of
the final product
Inaccuracy when checking the raw material's quality
Requires a re-cooking and re-drying process
S.8
Supporting Raw Materials (Salt, Master Carton,
Plastics) Received
S.8.1 Product information is written incorrectly on
the MC
Might cause misunderstandings with
the customers
Mistake in printing process
Checking each order made and review the
usual order

42
Table 4.3 Effect, Cause, and Current Control of Each of the Risk/Potential Failure Mode (Cont.)
Code Process Risk Code
Potential Failure Mode
Potential Effect(s) of Failure
Potential Cause(s) of Failure Current Control
M.1 Washing Process
M.1.1 The raw material spills
during the washing process
The weight of the raw material (fish) decreases resulting in reduced final output and increased raw
material costs
Carelessness of the operators in charge of washing the fish, the
condition in the washing room is slippery
Adding anti-slip pads
M.1.2 Workers slip on the slippery floor
Endangers workers' safety and causes minor to
serious injuries
The floor in the washing room tends to be wet
and quite slippery
Adding anti-slip pads, using boots
M.2 Cooking Process
M.2.1 Boiling process is too long
Fish becomes easily crumbled
Negligence of workers in charge of cooking the
fish
Creating a standard of how many times the operator needs to stir the fish before it can
be lifted
M.2.2 Boiling process is too short Fish has bad odor
Negligence of workers in charge of cooking the
fish
Creating a standard of how many times the operator needs to stir the fish before it can
be lifted
M.2.3 Work accident
(exposed to hot water, exploding stove, etc)
Endangers workers' safety and causes minor to
serious injuries
The cooking process uses a high-temperature
stove and is done manually
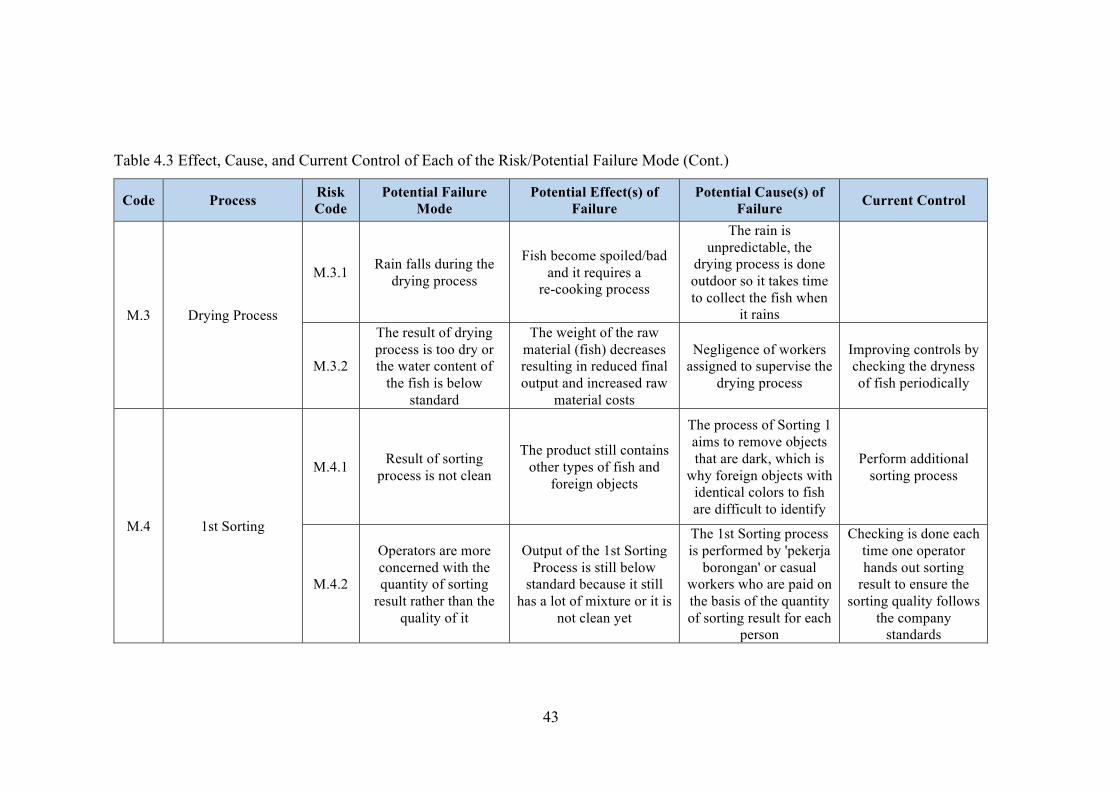
43
Table 4.3 Effect, Cause, and Current Control of Each of the Risk/Potential Failure Mode (Cont.)
Code Process Risk Code
Potential Failure Mode
Potential Effect(s) of Failure
Potential Cause(s) of Failure Current Control
M.3 Drying Process
M.3.1 Rain falls during the drying process
Fish become spoiled/bad and it requires a
re-cooking process
The rain is unpredictable, the
drying process is done outdoor so it takes time to collect the fish when
it rains
M.3.2
The result of drying process is too dry or the water content of
the fish is below standard
The weight of the raw material (fish) decreases resulting in reduced final output and increased raw
material costs
Negligence of workers assigned to supervise the
drying process
Improving controls by checking the dryness of fish periodically
M.4 1st Sorting
M.4.1 Result of sorting process is not clean
The product still contains other types of fish and
foreign objects
The process of Sorting 1 aims to remove objects that are dark, which is
why foreign objects with identical colors to fish are difficult to identify
Perform additional sorting process
M.4.2
Operators are more concerned with the quantity of sorting
result rather than the quality of it
Output of the 1st Sorting Process is still below
standard because it still has a lot of mixture or it is
not clean yet
The 1st Sorting process is performed by 'pekerja
borongan' or casual workers who are paid on the basis of the quantity of sorting result for each
person
Checking is done each time one operator hands out sorting
result to ensure the sorting quality follows
the company standards
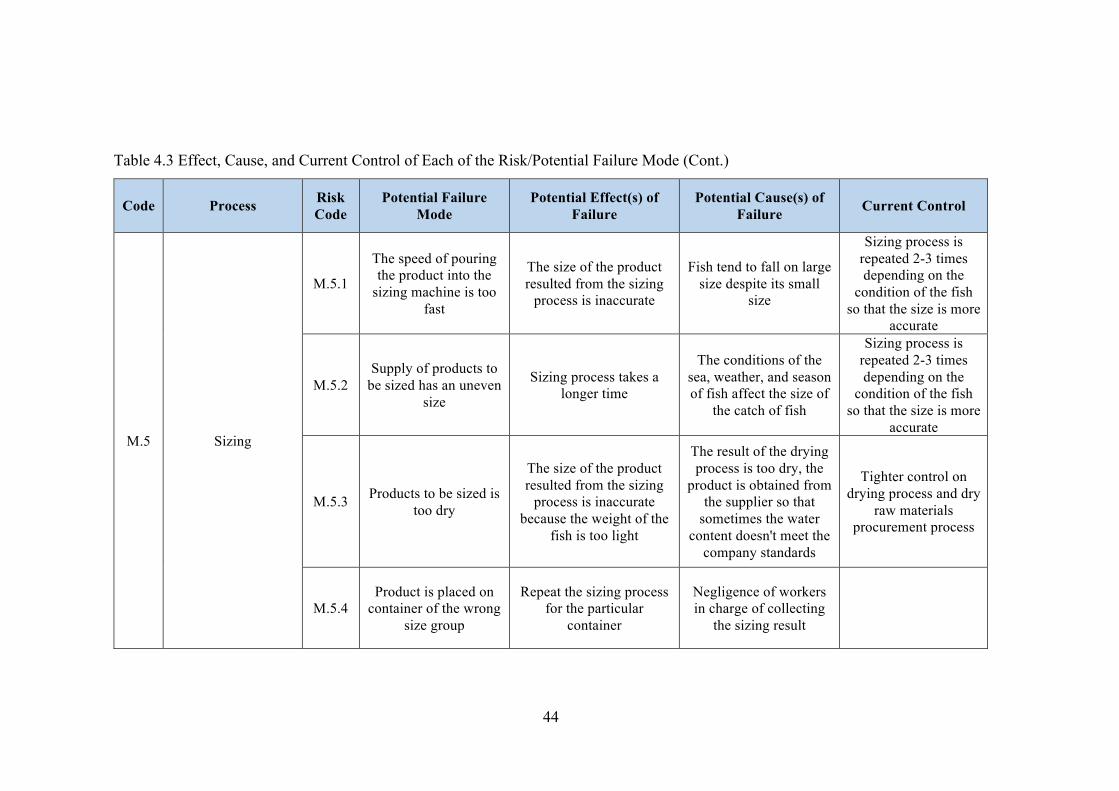
44
Table 4.3 Effect, Cause, and Current Control of Each of the Risk/Potential Failure Mode (Cont.)
Code Process Risk Code
Potential Failure Mode
Potential Effect(s) of Failure
Potential Cause(s) of Failure Current Control
M.5 Sizing
M.5.1
The speed of pouring the product into the
sizing machine is too fast
The size of the product resulted from the sizing
process is inaccurate
Fish tend to fall on large size despite its small
size
Sizing process is repeated 2-3 times depending on the
condition of the fish so that the size is more
accurate
M.5.2 Supply of products to
be sized has an uneven size
Sizing process takes a longer time
The conditions of the sea, weather, and season of fish affect the size of
the catch of fish
Sizing process is repeated 2-3 times depending on the
condition of the fish so that the size is more
accurate
M.5.3 Products to be sized is too dry
The size of the product resulted from the sizing
process is inaccurate because the weight of the
fish is too light
The result of the drying process is too dry, the
product is obtained from the supplier so that
sometimes the water content doesn't meet the
company standards
Tighter control on drying process and dry
raw materials procurement process
M.5.4 Product is placed on
container of the wrong size group
Repeat the sizing process for the particular
container
Negligence of workers in charge of collecting
the sizing result
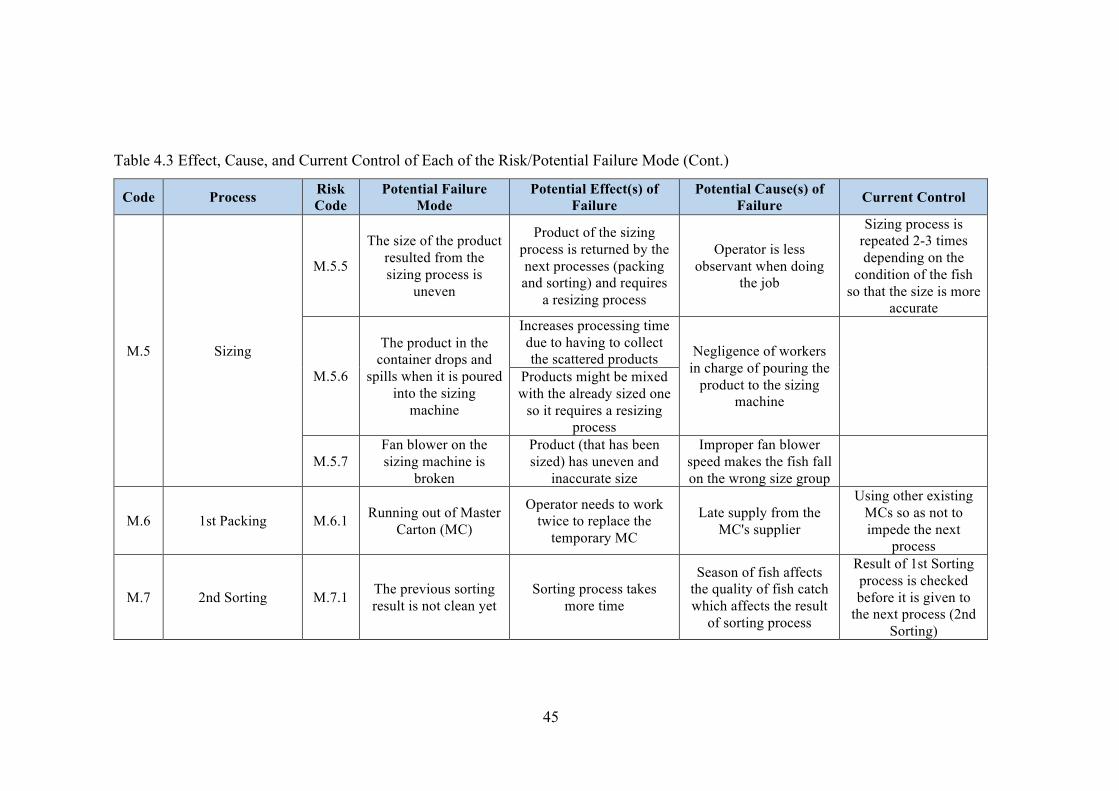
45
Table 4.3 Effect, Cause, and Current Control of Each of the Risk/Potential Failure Mode (Cont.)
Code Process Risk Code
Potential Failure Mode
Potential Effect(s) of Failure
Potential Cause(s) of Failure Current Control
M.5 Sizing
M.5.5
The size of the product resulted from the sizing process is
uneven
Product of the sizing process is returned by the next processes (packing and sorting) and requires
a resizing process
Operator is less observant when doing
the job
Sizing process is repeated 2-3 times depending on the
condition of the fish so that the size is more
accurate
M.5.6
The product in the container drops and
spills when it is poured into the sizing
machine
Increases processing time due to having to collect the scattered products Negligence of workers
in charge of pouring the product to the sizing
machine
Products might be mixed with the already sized one
so it requires a resizing process
M.5.7 Fan blower on the sizing machine is
broken
Product (that has been sized) has uneven and
inaccurate size
Improper fan blower speed makes the fish fall on the wrong size group
M.6 1st Packing M.6.1 Running out of Master Carton (MC)
Operator needs to work twice to replace the
temporary MC
Late supply from the MC's supplier
Using other existing MCs so as not to impede the next
process
M.7 2nd Sorting M.7.1 The previous sorting result is not clean yet
Sorting process takes more time
Season of fish affects the quality of fish catch which affects the result
of sorting process
Result of 1st Sorting process is checked before it is given to
the next process (2nd Sorting)
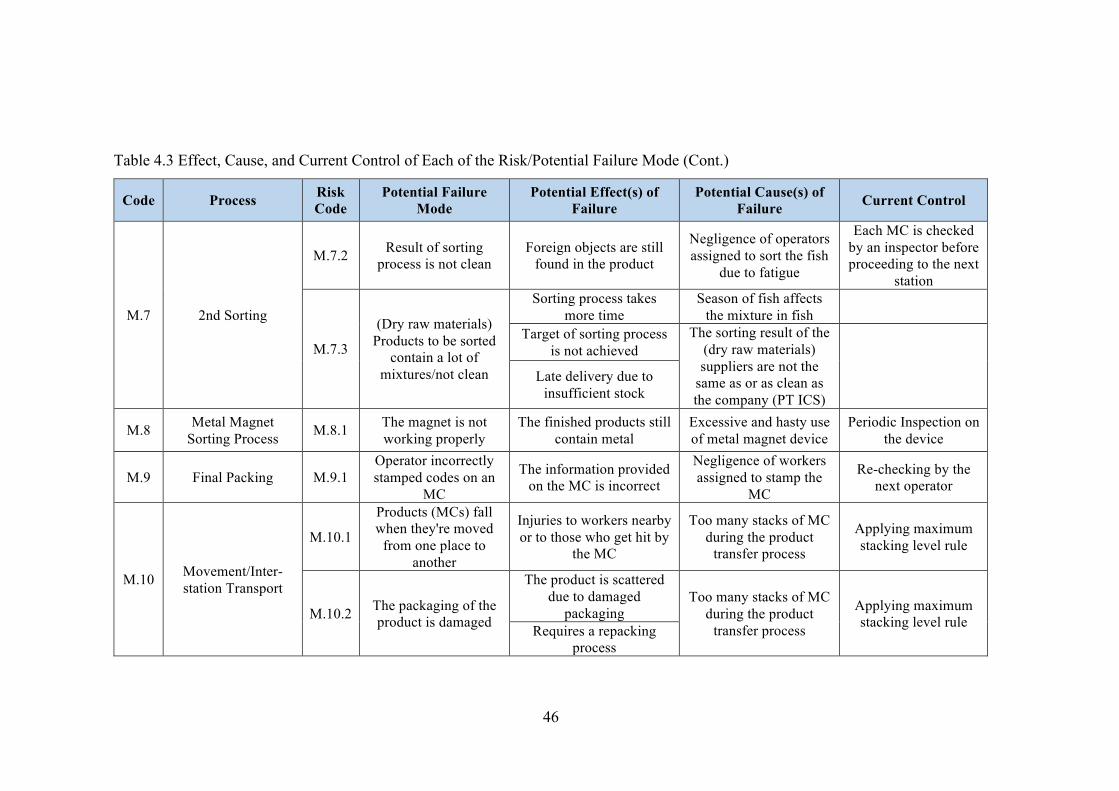
46
Table 4.3 Effect, Cause, and Current Control of Each of the Risk/Potential Failure Mode (Cont.)
Code Process Risk Code
Potential Failure Mode
Potential Effect(s) of Failure
Potential Cause(s) of Failure Current Control
M.7 2nd Sorting
M.7.2 Result of sorting process is not clean
Foreign objects are still found in the product
Negligence of operators assigned to sort the fish
due to fatigue
Each MC is checked by an inspector before proceeding to the next
station
M.7.3
(Dry raw materials) Products to be sorted
contain a lot of mixtures/not clean
Sorting process takes more time
Season of fish affects the mixture in fish
Target of sorting process is not achieved
The sorting result of the (dry raw materials) suppliers are not the
same as or as clean as the company (PT ICS)
Late delivery due to
insufficient stock
M.8 Metal Magnet Sorting Process M.8.1 The magnet is not
working properly The finished products still
contain metal Excessive and hasty use of metal magnet device
Periodic Inspection on the device
M.9 Final Packing M.9.1 Operator incorrectly stamped codes on an
MC
The information provided on the MC is incorrect
Negligence of workers assigned to stamp the
MC
Re-checking by the next operator
M.10 Movement/Inter-station Transport
M.10.1
Products (MCs) fall when they're moved
from one place to another
Injuries to workers nearby or to those who get hit by
the MC
Too many stacks of MC during the product
transfer process
Applying maximum stacking level rule
M.10.2 The packaging of the product is damaged
The product is scattered due to damaged
packaging Too many stacks of MC
during the product transfer process
Applying maximum stacking level rule Requires a repacking
process

47
Table 4.3 Effect, Cause, and Current Control of Each of the Risk/Potential Failure Mode (Cont.)
Code Process Risk Code
Potential Failure Mode
Potential Effect(s) of Failure
Potential Cause(s) of Failure Current Control
M.11
Refrigeration Process Using Cold Storage (Pre-cooling and Final Storage)
M.11.1 The product is
damaged when stored in the cold storage
Requires special treatment depending on the
conditions of damage (re-sorting, re-cooking,
etc.)
Product is stored for too long in the cold storage
since it doesn't use FIFO (First In First Out)
system
Increases production time and costs
M.11.2
The packaging of the product is damaged when stored in the
cold storage
Requires a repacking process Too many stacking level
in the cold storage
Limit the number of stacks in the cold
storage Increases production time and costs
M.11.3 Temperature of cold storage is unstable
Product quality declines (pre-cooling process aims
to inhibit microbial growth)
Failure of the cold storage system Periodic Inspection
M.11.4 The cold storage is full Stacking does not meet the standards
Capacity of cold storage is limited
D.1 Place Order For Container D.1.1 The available schedule
is not anytime soon
Postponement of shipment schedule and
there will be waiting time for confirmation to
customer and production team
The demand for container services is
high so the schedule is often full
Placing orders for containers to several companies at once
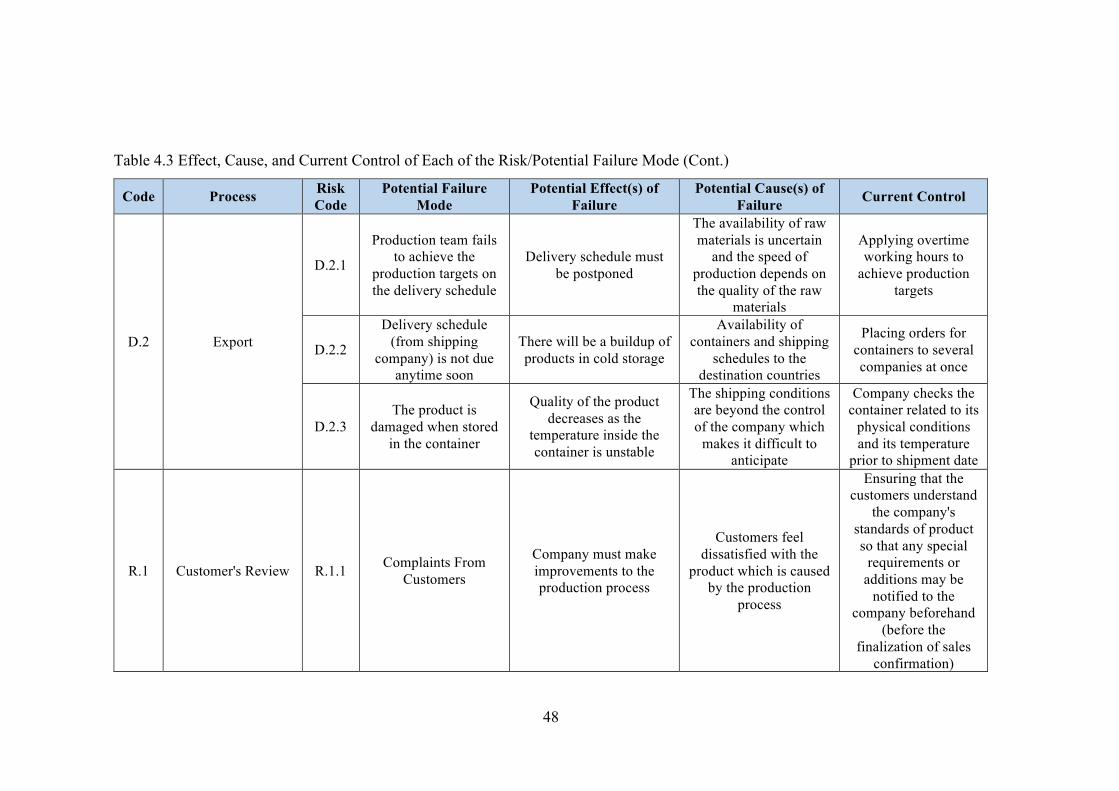
48
Table 4.3 Effect, Cause, and Current Control of Each of the Risk/Potential Failure Mode (Cont.)
Code Process Risk Code
Potential Failure Mode
Potential Effect(s) of Failure
Potential Cause(s) of Failure Current Control
D.2 Export
D.2.1
Production team fails to achieve the
production targets on the delivery schedule
Delivery schedule must be postponed
The availability of raw materials is uncertain
and the speed of production depends on the quality of the raw
materials
Applying overtime working hours to
achieve production targets
D.2.2
Delivery schedule (from shipping
company) is not due anytime soon
There will be a buildup of products in cold storage
Availability of containers and shipping
schedules to the destination countries
Placing orders for containers to several companies at once
D.2.3 The product is
damaged when stored in the container
Quality of the product decreases as the
temperature inside the container is unstable
The shipping conditions are beyond the control of the company which
makes it difficult to anticipate
Company checks the container related to its
physical conditions and its temperature
prior to shipment date
R.1 Customer's Review R.1.1 Complaints From Customers
Company must make improvements to the production process
Customers feel dissatisfied with the
product which is caused by the production
process
Ensuring that the customers understand
the company's standards of product so that any special
requirements or additions may be
notified to the company beforehand
(before the finalization of sales
confirmation)

49
Table 4.3 Effect, Cause, and Current Control of Each of the Risk/Potential Failure Mode (Cont.)
Code Process Risk Code
Potential Failure Mode
Potential Effect(s) of Failure
Potential Cause(s) of Failure Current Control
R.1 Customer's Review R.2.2 Customers Request Claim
Company must give compensation to the
customer
Customers feel dissatisfied with the
product because it does not conform to the
promised specification
Both the company and the customer's
representative check the product right
before it is shipped to make sure final condition of the
product
The table above contains the list of the potential failure modes accompanied by the potential effect of failures, potential cause of
failures, and the current control of the failure. The risk effect is useful to help decide the severity score of the risk. The risk cause will be
used to score the occurrence score of the risk and the current control can be used to determine the detection score of the risk.

50
4.4 Risk Assessment
Risk assessment process is the process where severity, occurrence, and
detection score is given. The score is given by the respondents through a FMEA
questionnaire. The respondents of the questionnaire are those who are the experts
of this field or in this company. There are three questionnaires that are distributed
to the Director of Operational, Head of Production, and QC of Production. Each of
the respondent fills the questionnaire by giving scores to the severity, occurrence,
and detection of the failure modes.
Risk assessment is also the process where RPN is acquired by multiplying
the severity, occurrence and detection. RPN or Risk Priority Number will be ranked
from the largest to the smallest to see which risk that generates the highest RPN and
also as the basis of risk evaluation process. RPN indicates how important the risk
should be mitigated and handled. Risk assessment can be used to help decide which
risk that will be mitigated and which risk that should be accepted. Usually, risk with
low RPN will be neglected since the impact is not significant. However, the risk is
still monitored to see if the impact and frequency of risk changes and becomes
worse.
4.4.1 Severity, Occurrence, and Detection Scoring
Assigning severity, occurrence, and detection score is one of the steps of
conducting FMEA. The scores will be used to determine the Risk Priority Number
for each of the risks. The score of severity and occurrence is in the range of 1-10
with 1 being the lowest score or least severe and least possibility to happen while
10 is the biggest score. Detection score is also in the range of 1-10, but 1 indicates
a better detection mechanism than 10 unlike the severity and occurrence. The
scoring criteria uses likert scale of 1-10. Hence, the final score of the severity,
occurrence, and detection is not found through the mean of the three questionnaire
results but through the median of the results. The data from likert scale is classified
as ordinal data, therefore the appropriate parameter that should be used is median
or mode instead of mean. The median is chosen because some of the data don’t have
mode when the three results produce different values. The criteria used in the
scoring of severity is displayed in table 4.4.
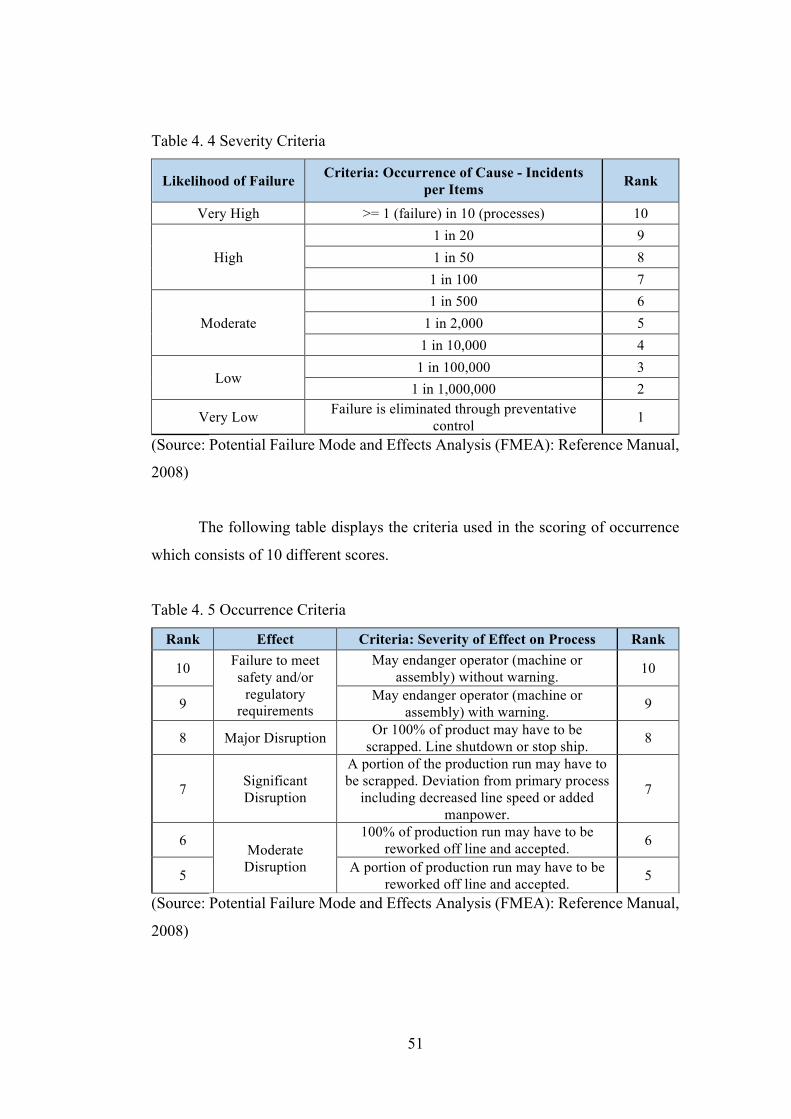
51
Table 4. 4 Severity Criteria
Likelihood of Failure Criteria: Occurrence of Cause - Incidents per Items Rank
Very High >= 1 (failure) in 10 (processes) 10
High 1 in 20 9 1 in 50 8
1 in 100 7
Moderate 1 in 500 6
1 in 2,000 5 1 in 10,000 4
Low 1 in 100,000 3
1 in 1,000,000 2
Very Low Failure is eliminated through preventative control 1
(Source: Potential Failure Mode and Effects Analysis (FMEA): Reference Manual,
2008)
The following table displays the criteria used in the scoring of occurrence
which consists of 10 different scores.
Table 4. 5 Occurrence Criteria
Rank Effect Criteria: Severity of Effect on Process Rank
10 Failure to meet safety and/or
regulatory requirements
May endanger operator (machine or assembly) without warning. 10
9 May endanger operator (machine or assembly) with warning. 9
8 Major Disruption Or 100% of product may have to be scrapped. Line shutdown or stop ship. 8
7 Significant Disruption
A portion of the production run may have to be scrapped. Deviation from primary process
including decreased line speed or added manpower.
7
6 Moderate Disruption
100% of production run may have to be reworked off line and accepted. 6
5 A portion of production run may have to be reworked off line and accepted. 5
(Source: Potential Failure Mode and Effects Analysis (FMEA): Reference Manual,
2008)
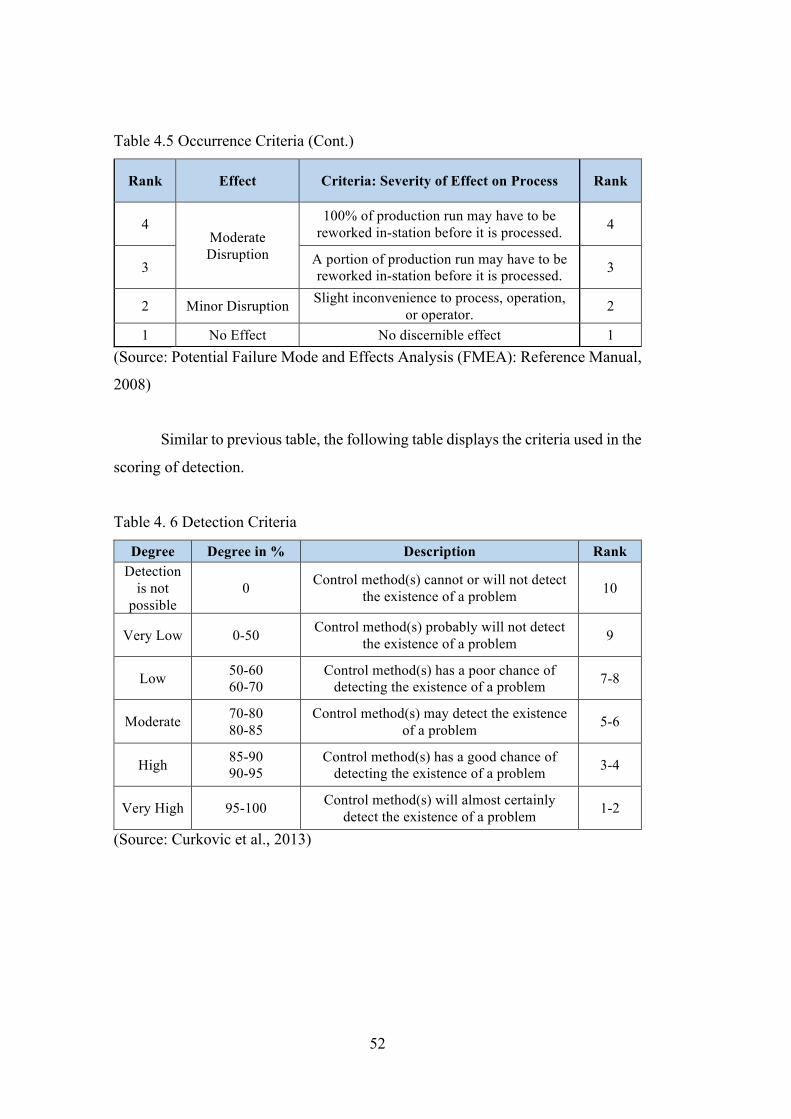
52
Table 4.5 Occurrence Criteria (Cont.)
Rank Effect Criteria: Severity of Effect on Process Rank
4 Moderate Disruption
100% of production run may have to be reworked in-station before it is processed. 4
3 A portion of production run may have to be reworked in-station before it is processed. 3
2 Minor Disruption Slight inconvenience to process, operation, or operator. 2
1 No Effect No discernible effect 1 (Source: Potential Failure Mode and Effects Analysis (FMEA): Reference Manual,
2008)
Similar to previous table, the following table displays the criteria used in the
scoring of detection.
Table 4. 6 Detection Criteria
Degree Degree in % Description Rank Detection
is not possible
0 Control method(s) cannot or will not detect the existence of a problem 10
Very Low 0-50 Control method(s) probably will not detect the existence of a problem 9
Low 50-60 60-70
Control method(s) has a poor chance of detecting the existence of a problem 7-8
Moderate 70-80 80-85
Control method(s) may detect the existence of a problem 5-6
High 85-90 90-95
Control method(s) has a good chance of detecting the existence of a problem 3-4
Very High 95-100 Control method(s) will almost certainly detect the existence of a problem 1-2
(Source: Curkovic et al., 2013)

53
Table 4.7 shows the severity, occurrence, and detection score for each of the
risk. It is the result of the recapitulation from three respondents.
Table 4. 7 The Result of Severity, Occurrence, and Detection Scoring
Code Process Risk Code Potential Failure Mode
Seve
rity
Occ
urre
nce
Det
ectio
n
P.1 Plan Sales Target and Production
Target
P.1.1 Sales target is not achieved 2 1 2
P.1.2 Production target is not achieved 3 4 10
P.2 Offer Product to Customer P.2.1 Customers bid low prices 2 3 3
P.3 Receive The
Sales Confirmation
P.3.1
The final product (ready-to-deliver product) is not in accordance with the
sales confirmation (regarding the product
assortment and shipment schedule)
3 3 3
S.1
Visit Raw Material (Fresh
Fish) Suppliers in Tuban & Rembang
S.1.1 Raw material is unavailable 5 4 2
S.1.2 The amount of the raw material is only a few 5 3 2
S.2 Quality Checking of Raw Material
S.2.1
The quality score given by the procurement team is not in accordance with the actual fish condition
4 3 2
S.2.2
The quality of the dry raw material is not the same
(worse) as what the suppliers promised
4 4 4
S.3 Negotiation of Raw Material's
Price
S.3.1 The price demanded by
suppliers increases (more expensive)
5 4 10
S.3.2 The price of dry raw materials is too high
compared to the quality 3 4 3
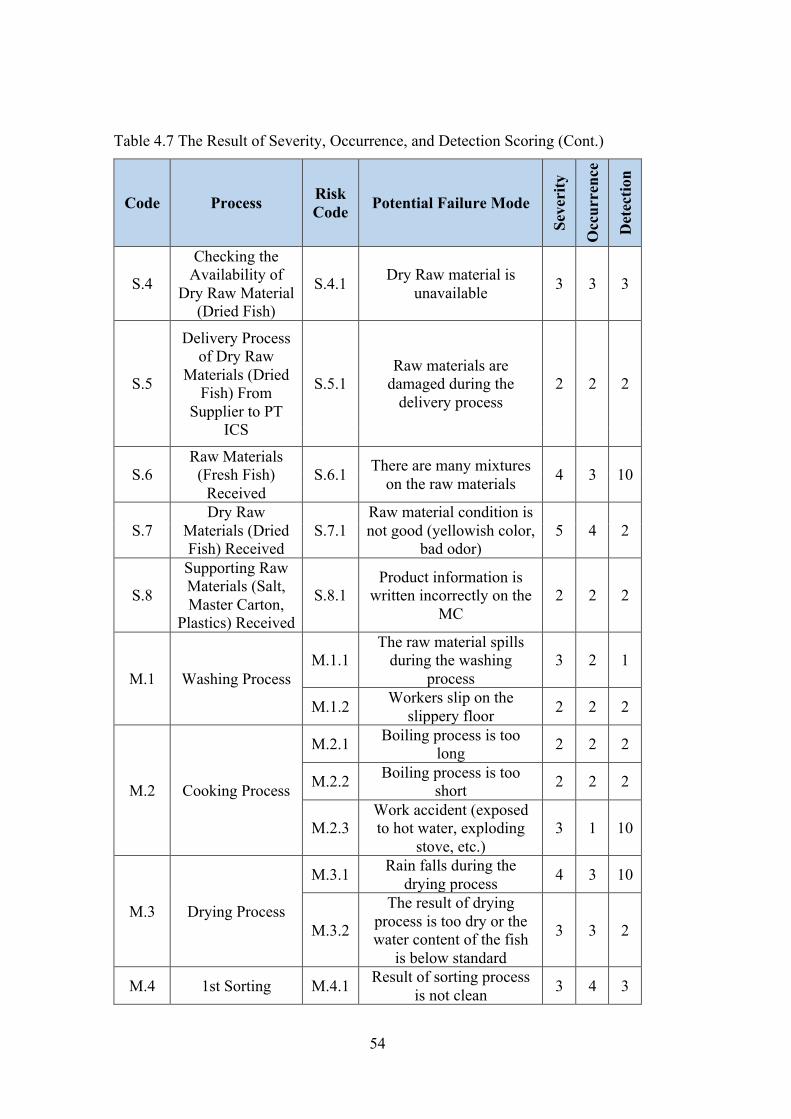
54
Table 4.7 The Result of Severity, Occurrence, and Detection Scoring (Cont.)
Code Process Risk Code Potential Failure Mode
Seve
rity
Occ
urre
nce
Det
ectio
n
S.4
Checking the Availability of
Dry Raw Material (Dried Fish)
S.4.1 Dry Raw material is unavailable 3 3 3
S.5
Delivery Process of Dry Raw
Materials (Dried Fish) From
Supplier to PT ICS
S.5.1 Raw materials are
damaged during the delivery process
2 2 2
S.6 Raw Materials (Fresh Fish)
Received S.6.1 There are many mixtures
on the raw materials 4 3 10
S.7 Dry Raw
Materials (Dried Fish) Received
S.7.1 Raw material condition is not good (yellowish color,
bad odor) 5 4 2
S.8
Supporting Raw Materials (Salt, Master Carton,
Plastics) Received
S.8.1 Product information is
written incorrectly on the MC
2 2 2
M.1 Washing Process M.1.1
The raw material spills during the washing
process 3 2 1
M.1.2 Workers slip on the slippery floor 2 2 2
M.2 Cooking Process
M.2.1 Boiling process is too long 2 2 2
M.2.2 Boiling process is too short 2 2 2
M.2.3 Work accident (exposed to hot water, exploding
stove, etc.) 3 1 10
M.3 Drying Process
M.3.1 Rain falls during the drying process 4 3 10
M.3.2
The result of drying process is too dry or the water content of the fish
is below standard
3 3 2
M.4 1st Sorting M.4.1 Result of sorting process is not clean 3 4 3
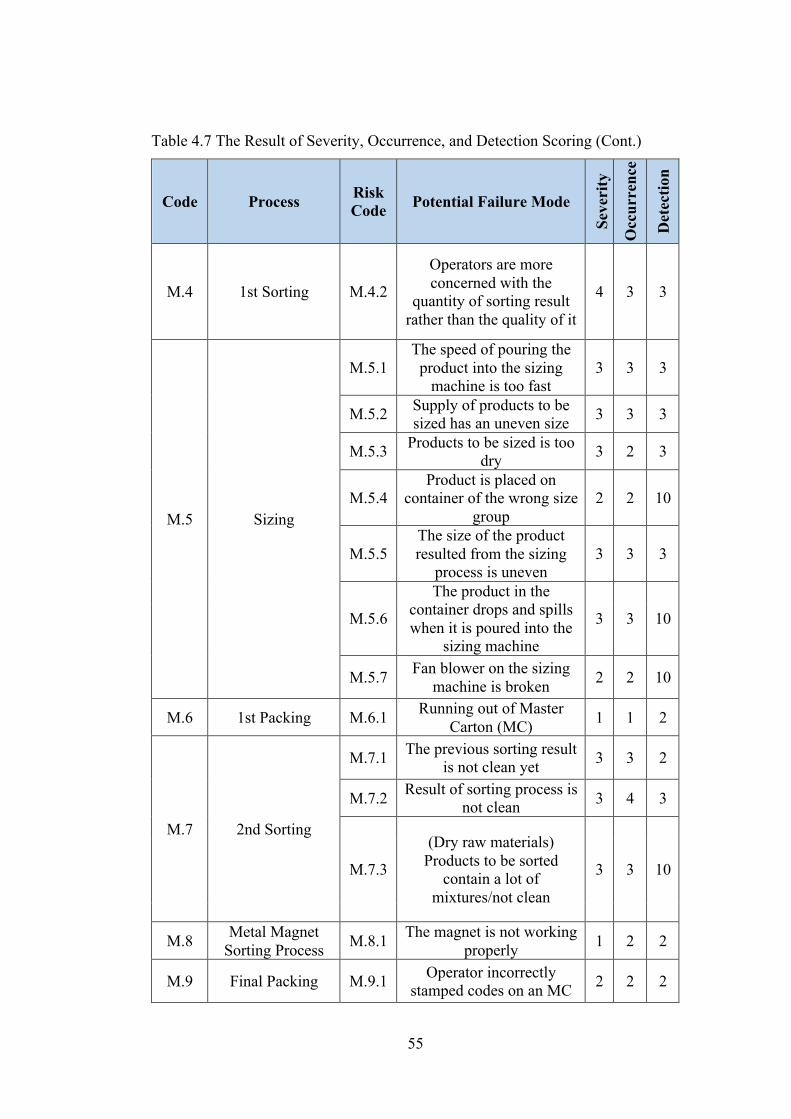
55
Table 4.7 The Result of Severity, Occurrence, and Detection Scoring (Cont.)
Code Process Risk Code Potential Failure Mode
Seve
rity
Occ
urre
nce
Det
ectio
n
M.4 1st Sorting M.4.2
Operators are more concerned with the
quantity of sorting result rather than the quality of it
4 3 3
M.5 Sizing
M.5.1 The speed of pouring the
product into the sizing machine is too fast
3 3 3
M.5.2 Supply of products to be sized has an uneven size 3 3 3
M.5.3 Products to be sized is too dry 3 2 3
M.5.4 Product is placed on
container of the wrong size group
2 2 10
M.5.5 The size of the product resulted from the sizing
process is uneven 3 3 3
M.5.6
The product in the container drops and spills when it is poured into the
sizing machine
3 3 10
M.5.7 Fan blower on the sizing machine is broken 2 2 10
M.6 1st Packing M.6.1 Running out of Master Carton (MC) 1 1 2
M.7 2nd Sorting
M.7.1 The previous sorting result is not clean yet 3 3 2
M.7.2 Result of sorting process is not clean 3 4 3
M.7.3
(Dry raw materials) Products to be sorted
contain a lot of mixtures/not clean
3 3 10
M.8 Metal Magnet Sorting Process M.8.1 The magnet is not working
properly 1 2 2
M.9 Final Packing M.9.1 Operator incorrectly stamped codes on an MC 2 2 2

56
Table 4.7 The Result of Severity, Occurrence, and Detection Scoring (Cont.)
Code Process Risk Code Potential Failure Mode
Seve
rity
Occ
urre
nce
Det
ectio
n
M.10 Movement/Inter-station Transport
M.10.1
Products (MCs) fall when they're moved
from one place to another
2 2 2
M.10.2 The packaging of the product is damaged 2 2 2
M.11
Refrigeration Process Using Cold Storage
(Pre-cooling and Final Storage)
M.11.1 The product is damaged when stored in the cold
storage 3 3 10
M.11.2
The packaging of the product is damaged
when stored in the cold storage
2 2 2
M.11.3 Temperature of cold storage is unstable 3 2 2
M.11.4 The cold storage is full 2 2 10
D.1 Place Order For Container D.1.1 The available schedule
is not anytime soon 2 3 3
D.2 Export
D.2.1
Production team fails to achieve the production targets on the delivery
schedule
2 3 3
D.2.2 Delivery schedule (from
shipping company) is not due anytime soon
3 2 3
D.2.3 The product is damaged
when stored in the container
2 2 2
R.1 Customer's Review
R.1.1 Complaints From Customers 3 2 2
R.2.2 Customers Request Claim 4 2 2

57
4.4.2 Calculation of Risk Priority Number (RPN)
Risk Priority Number is one of the output of conducting FMEA. This
number can be used to prioritize mitigation action that should be taken by the
company. The higher the RPN shows a higher urgency for a risk to be mitigated.
RPN is obtained by multiplying the score of severity, occurrence, and detection.
The formula to calculate RPN is written in the equation below:
!"#=&'(')*+,-.//0))'1/'-2'+'/+*31
The calculation is done for each of the identified failure modes. The result
of the calculation of RPN is shown in the table below.
Table 4. 8 The Result of the RPN Calculation
Risk Code Potential Failure Mode
Seve
rity
Occ
urre
nce
Det
ectio
n
RPN
P.1.1 Sales target is not achieved 2 1 2 4
P.1.2 Production target is not achieved 3 4 10 120 P.2.1 Customers bid low prices 2 3 3 18
P.3.1
The final product (ready-to-deliver product) is not in accordance with the sales confirmation
(regarding the product assortment and shipment schedule)
3 3 3 27
S.1.1 Raw material is unavailable 5 4 2 40 S.1.2 The amount of the raw material is only a few 5 3 2 30
S.2.1 The quality score given by the procurement
team is not in accordance with the actual fish condition
4 3 2 24
S.2.2 The quality of the dry raw material is not the same (worse) as what the suppliers promised 4 4 4 64
S.3.1 The price demanded by suppliers increases (more expensive) 5 4 10 200
S.3.2 The price of dry raw materials is too high compared to the quality 3 4 3 36
S.4.1 Dry Raw material is unavailable 3 3 3 27

58
Table 4.8 The Result of the RPN Calculation (Cont.)
Risk Code Potential Failure Mode
Seve
rity
Occ
urre
nce
Det
ectio
n
RPN
S.5.1 Raw materials are damaged during the delivery process 2 2 2 8
S.6.1 There are many mixtures on the raw materials 4 3 10 120
S.7.1 Raw material condition is not good (yellowish color, bad odor) 5 4 2 40
S.8.1 Product information is written incorrectly on the MC 2 2 2 8
M.1.1 The raw material spills during the washing process 3 2 1 6
M.1.2 Workers slip on the slippery floor 2 2 2 8 M.2.1 Boiling process is too long 2 2 2 8 M.2.2 Boiling process is too short 2 2 2 8
M.2.3 Work accident (exposed to hot water, exploding stove, etc.) 3 1 10 30
M.3.1 Rain falls during the drying process 4 3 10 120
M.3.2 The result of drying process is too dry or the water content of the fish is below standard 3 3 2 18
M.4.1 Result of sorting process is not clean 3 4 3 36
M.4.2 Operators are more concerned with the
quantity of sorting result rather than the quality of it
4 3 3 36
M.5.1 The speed of pouring the product into the sizing machine is too fast 3 3 3 27
M.5.2 Supply of products to be sized has an uneven size 3 3 3 27
M.5.3 Products to be sized is too dry 3 2 3 18
M.5.4 Product is placed on container of the wrong size group 2 2 10 40
M.5.5 The size of the product resulted from the sizing process is uneven 3 3 3 27
M.5.6 The product in the container drops and spills when it is poured into the sizing machine 3 3 10 90
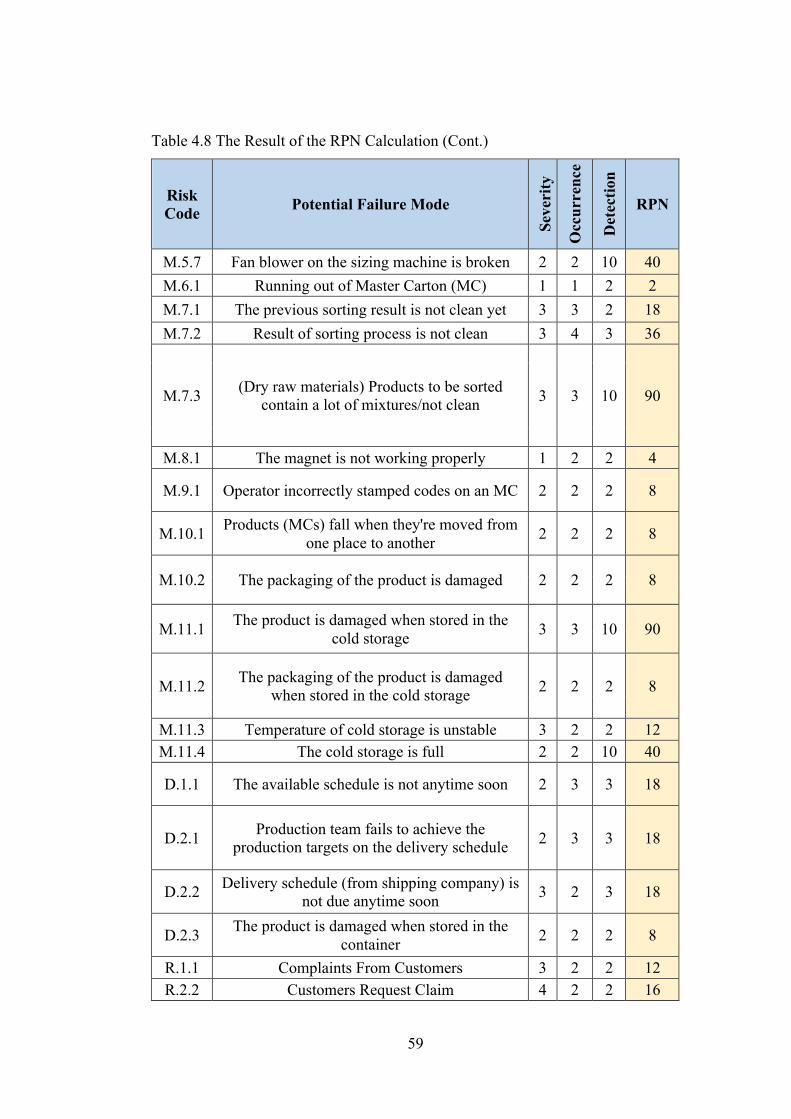
59
Table 4.8 The Result of the RPN Calculation (Cont.)
Risk Code Potential Failure Mode
Seve
rity
Occ
urre
nce
Det
ectio
n
RPN
M.5.7 Fan blower on the sizing machine is broken 2 2 10 40 M.6.1 Running out of Master Carton (MC) 1 1 2 2 M.7.1 The previous sorting result is not clean yet 3 3 2 18 M.7.2 Result of sorting process is not clean 3 4 3 36
M.7.3 (Dry raw materials) Products to be sorted contain a lot of mixtures/not clean 3 3 10 90
M.8.1 The magnet is not working properly 1 2 2 4
M.9.1 Operator incorrectly stamped codes on an MC 2 2 2 8
M.10.1 Products (MCs) fall when they're moved from one place to another 2 2 2 8
M.10.2 The packaging of the product is damaged 2 2 2 8
M.11.1 The product is damaged when stored in the cold storage 3 3 10 90
M.11.2 The packaging of the product is damaged when stored in the cold storage 2 2 2 8
M.11.3 Temperature of cold storage is unstable 3 2 2 12 M.11.4 The cold storage is full 2 2 10 40
D.1.1 The available schedule is not anytime soon 2 3 3 18
D.2.1 Production team fails to achieve the production targets on the delivery schedule 2 3 3 18
D.2.2 Delivery schedule (from shipping company) is not due anytime soon 3 2 3 18
D.2.3 The product is damaged when stored in the container 2 2 2 8
R.1.1 Complaints From Customers 3 2 2 12 R.2.2 Customers Request Claim 4 2 2 16
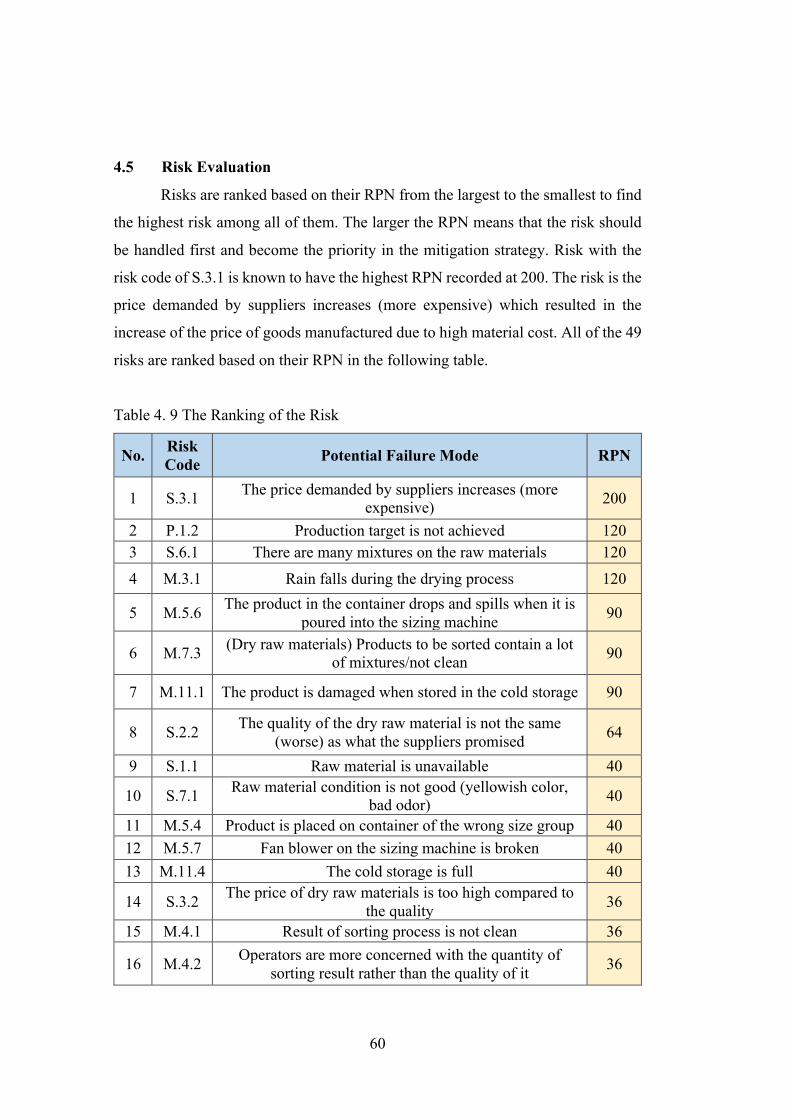
60
4.5 Risk Evaluation
Risks are ranked based on their RPN from the largest to the smallest to find
the highest risk among all of them. The larger the RPN means that the risk should
be handled first and become the priority in the mitigation strategy. Risk with the
risk code of S.3.1 is known to have the highest RPN recorded at 200. The risk is the
price demanded by suppliers increases (more expensive) which resulted in the
increase of the price of goods manufactured due to high material cost. All of the 49
risks are ranked based on their RPN in the following table.
Table 4. 9 The Ranking of the Risk
No. Risk Code Potential Failure Mode RPN
1 S.3.1 The price demanded by suppliers increases (more expensive) 200
2 P.1.2 Production target is not achieved 120 3 S.6.1 There are many mixtures on the raw materials 120
4 M.3.1 Rain falls during the drying process 120
5 M.5.6 The product in the container drops and spills when it is poured into the sizing machine 90
6 M.7.3 (Dry raw materials) Products to be sorted contain a lot of mixtures/not clean 90
7 M.11.1 The product is damaged when stored in the cold storage 90
8 S.2.2 The quality of the dry raw material is not the same (worse) as what the suppliers promised 64
9 S.1.1 Raw material is unavailable 40
10 S.7.1 Raw material condition is not good (yellowish color, bad odor) 40
11 M.5.4 Product is placed on container of the wrong size group 40 12 M.5.7 Fan blower on the sizing machine is broken 40 13 M.11.4 The cold storage is full 40
14 S.3.2 The price of dry raw materials is too high compared to the quality 36
15 M.4.1 Result of sorting process is not clean 36
16 M.4.2 Operators are more concerned with the quantity of sorting result rather than the quality of it 36

61
Table 4.9 The Ranking of the Risk (Cont.)
No. Risk Code Potential Failure Mode RPN
17 M.7.2 Result of sorting process is not clean 36 18 S.1.2 The amount of the raw material is only a few 30 19 M.2.3 Work accident (exposed to hot water, exploding stove) 30
20 P.3.1 The final product (ready-to-deliver product) is not in accordance with the sales confirmation (regarding the
product assortment and shipment schedule) 27
21 S.4.1 Dry Raw material is unavailable 27
22 M.5.1 The speed of pouring the product into the sizing machine is too fast 27
23 M.5.2 Supply of products to be sized has an uneven size 27
24 M.5.5 The size of the product resulted from the sizing process is uneven 27
25 S.2.1 The quality score given by the procurement team is not in accordance with the actual fish condition 24
26 P.2.1 Customers bid low prices 18
27 M.3.2 The result of drying process is too dry or the water content of the fish is below standard 18
28 M.5.3 Products to be sized is too dry 18 29 M.7.1 The previous sorting result is not clean yet 18 30 D.1.1 The available schedule is not anytime soon 18
31 D.2.1 Production team fails to achieve the production targets on the delivery schedule 18
32 D.2.2 Delivery schedule (from shipping company) is not due anytime soon 18
33 R.2.2 Customers Request Claim 16 34 M.11.3 Temperature of cold storage is unstable 12 35 R.1.1 Complaints From Customers 12 36 S.5.1 Raw materials are damaged during the delivery process 8 37 S.8.1 Product information is written incorrectly on the MC 8 38 M.1.2 Workers slip on the slippery floor 8 39 M.2.1 Boiling process is too long 8 40 M.2.2 Boiling process is too short 8 41 M.9.1 Operator incorrectly stamped codes on an MC 8
42 M.10.1 Products (MCs) fall when they're moved from one place to another 8
43 M.10.2 The packaging of the product is damaged 8
44 M.11.2 The packaging of the product is damaged when stored in the cold storage 8
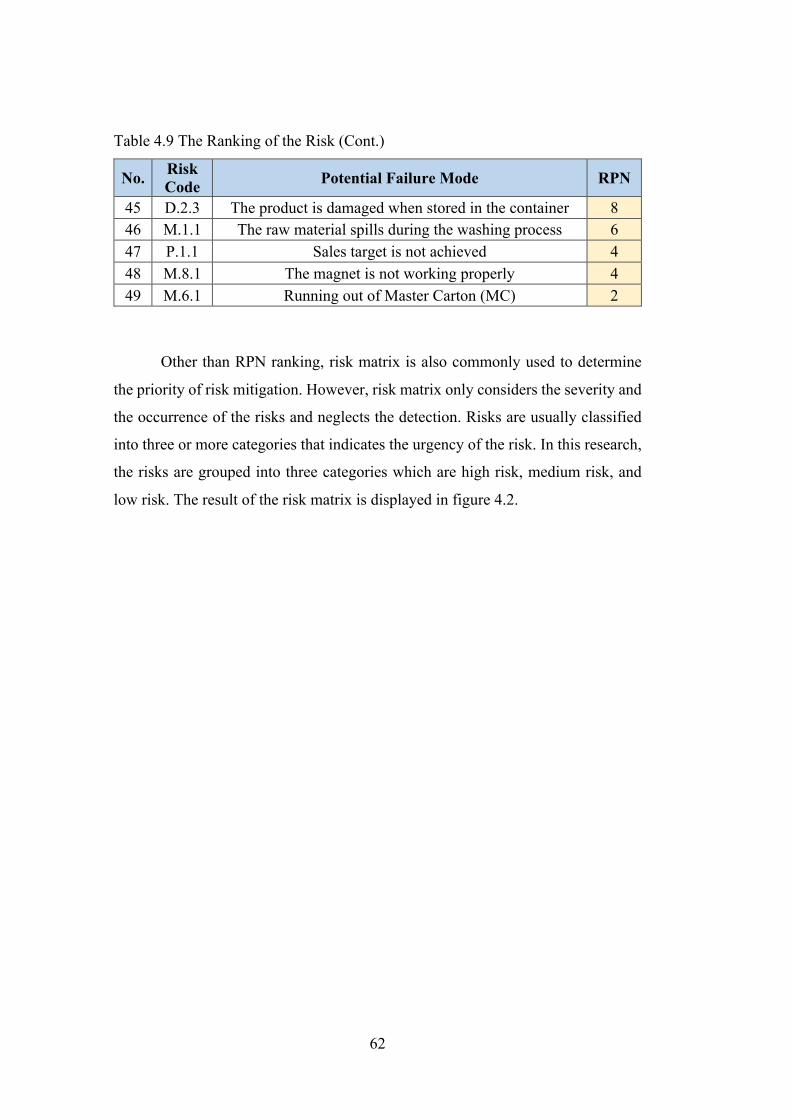
62
Table 4.9 The Ranking of the Risk (Cont.)
No. Risk Code Potential Failure Mode RPN
45 D.2.3 The product is damaged when stored in the container 8 46 M.1.1 The raw material spills during the washing process 6 47 P.1.1 Sales target is not achieved 4 48 M.8.1 The magnet is not working properly 4 49 M.6.1 Running out of Master Carton (MC) 2
Other than RPN ranking, risk matrix is also commonly used to determine
the priority of risk mitigation. However, risk matrix only considers the severity and
the occurrence of the risks and neglects the detection. Risks are usually classified
into three or more categories that indicates the urgency of the risk. In this research,
the risks are grouped into three categories which are high risk, medium risk, and
low risk. The result of the risk matrix is displayed in figure 4.2.
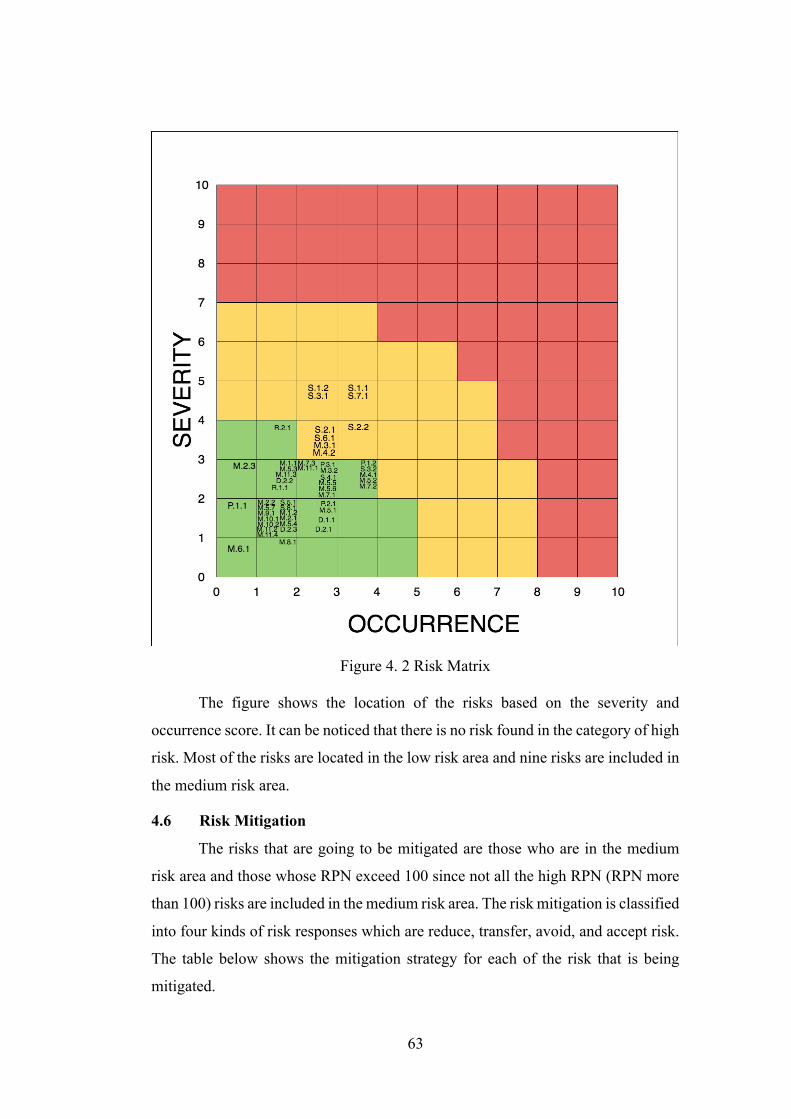
63
Figure 4. 2 Risk Matrix
The figure shows the location of the risks based on the severity and
occurrence score. It can be noticed that there is no risk found in the category of high
risk. Most of the risks are located in the low risk area and nine risks are included in
the medium risk area.
4.6 Risk Mitigation
The risks that are going to be mitigated are those who are in the medium
risk area and those whose RPN exceed 100 since not all the high RPN (RPN more
than 100) risks are included in the medium risk area. The risk mitigation is classified
into four kinds of risk responses which are reduce, transfer, avoid, and accept risk.
The table below shows the mitigation strategy for each of the risk that is being
mitigated.
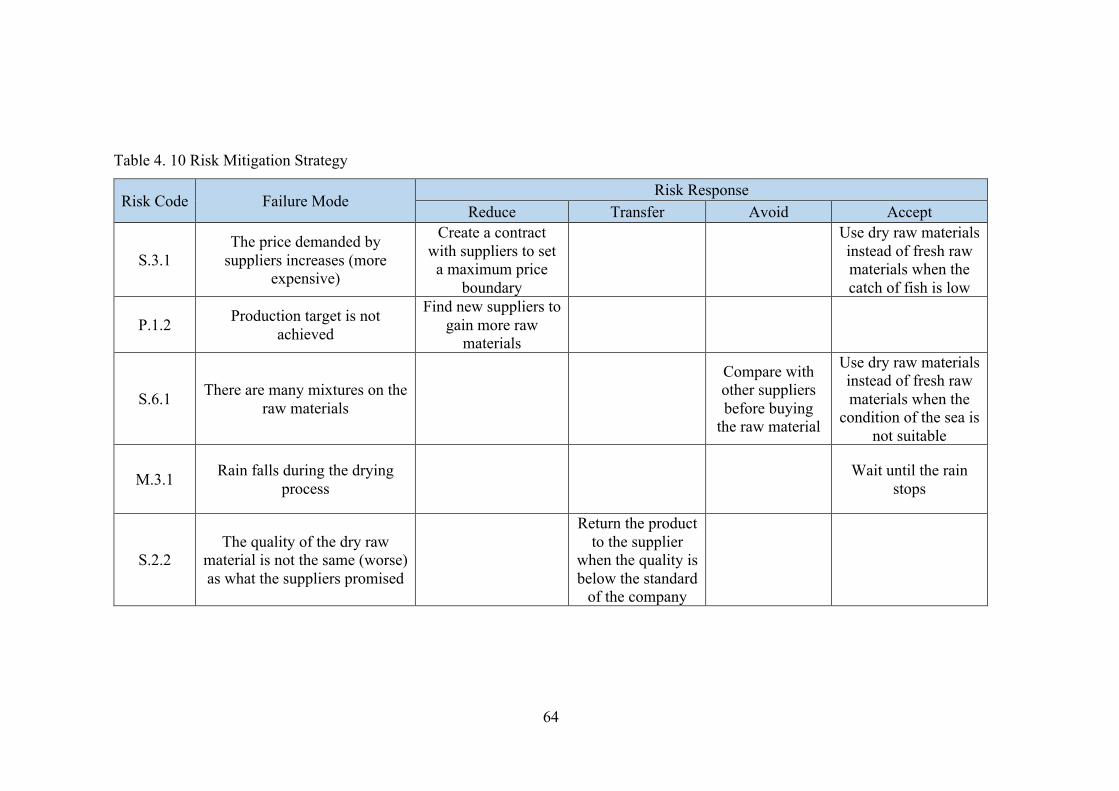
64
Table 4. 10 Risk Mitigation Strategy
Risk Code Failure Mode Risk Response
Reduce Transfer Avoid Accept
S.3.1 The price demanded by
suppliers increases (more expensive)
Create a contract with suppliers to set
a maximum price boundary
Use dry raw materials instead of fresh raw materials when the catch of fish is low
P.1.2 Production target is not achieved
Find new suppliers to gain more raw
materials
S.6.1 There are many mixtures on the raw materials
Compare with other suppliers before buying
the raw material
Use dry raw materials instead of fresh raw materials when the
condition of the sea is not suitable
M.3.1 Rain falls during the drying process Wait until the rain
stops
S.2.2 The quality of the dry raw
material is not the same (worse) as what the suppliers promised
Return the product to the supplier
when the quality is below the standard
of the company

65
Table 4.10 Risk Mitigation Strategy (Cont.)
Risk Code Failure Mode Risk Response
Reduce Transfer Avoid Accept
S.1.1 Raw material is unavailable Find new suppliers to gain more raw materials Wait until the catch of fish
increases
S.7.1 Raw material condition is not
good (yellowish color, bad odor)
Make a quality checking form to help sourcing staff decide whether to buy the
raw material or not
M.4.2
Operators are more concerned with the quantity of sorting
result rather than the quality of it
Give evaluation to all 'pekerja borongan' or
casual workers about their performance related to the
quality of sorting result
S.1.2 The amount of the raw material is only a few
Use dry raw materials instead of fresh raw
materials when the catch of fish is low
S.2.1
The quality score given by the procurement team is not in
accordance with the actual fish condition
Make a quality checking form to help sourcing staff
determine the raw material's quality

66
(This page is intentionally left blank)
67
CHAPTER V
ANALYSIS AND INTERPRETATION
This chapter consists the analysis and interpretation of this research. The
data that are collected and processed in the previous chapter will be analyzed and
interpreted to give better explanation about the result of the research.
5.1 Analysis of Supply Chain Activity Mapping Using SCOR
In order to classify and map the supply chain activity of PT ICS, this
research uses supply chain operation reference or commonly known as SCOR.
SCOR divides the activity into six major categories; namely plan, source, make,
deliver, return, and enable. However, after conducting an observation and
discussion with the company representatives, there is no activity that can be
classified as enable. Enable process is mainly about the management of supply
chain such as management of supply chain risk and performance. Unfortunately,
this company still hasn’t acknowledged the importance of managing supply chain.
Thus, the business process mapping will only show five classifications of activity
which are plan, source, make, deliver, and return.
Plan is the first SCOR process in the classification. The process of planning
the whole supply chain activity is involved in plan. There are three activities of plan
that are found in this company. The activities include plan sales target and
production target, offer product to customer, and receive the sales confirmation.
Plan sales target and production target will determine supply chain planning
indirectly by aggregating the supply chain resource. In planning sales target, the
company must be aware of the capacity of production and availability of the
resource which in the end will result in production target. Offer product to customer
is included in plan because this activity is done prior to the production process and
is needed to plan the production process as well as supply chain activity. Receive
the sales confirmation is also included in this process because this is actually the
continuation of the previous process which is offer product to customer.

68
In source process, there are 8 activities involved in it. Source process is all
processes that related to the sourcing of raw materials to the receiving of the raw
materials. In PT ICS, the sourcing process is begun by visiting the raw materials
suppliers and checking the quality of raw materials directly. Besides that, the
process of price negotiation and raw materials receiving process in the factory are
also included in sourcing process. There are two kinds of raw materials that are used
by the company, dry raw materials and fresh raw materials. Fresh raw material is
obtained through direct visitation to the suppliers to get the recently caught fish,
while the dry raw materials is bought from suppliers in other area outside Tuban
and Rembang. The cooking and drying process is done in the suppliers’ plant for
the dry raw materials to avoid spoilage. PT ICS usually provides assistance and
education to the dry raw material’s suppliers in order to have the same
understanding regarding the cooking and drying process of the fish. In this way, the
quality of dry raw materials from the suppliers are as good as the quality that are
produced by the company.
Most of the activities in PT ICS are found in make process. In total, there
are 11 activities in this process. Make process is basically the production process
that happens in the factory. The process is started by washing the fresh fish which
is continued directly to the process of cooking. After that, the fish is dried under the
sun until it reaches a specific dryness. The fish that is already dried should be at the
level of 39%-42% of water/moisture content. The next process is several steps of
sorting process, sizing, and weighing as well as packing process. Refrigeration
process is needed after finishing every process, so after the fish goes through drying
process it should be stored in the cold storage before it can continue its process to
sorting process. It is applied to every process during the production of dried
anchovy. The refrigeration process is done to prevent bacteria to grow and to avoid
quality degradation due to fungus and germ.
The fourth SCOR process is delivery process. There are two activities found
in delivery process. Delivery process is done in the head office of PT ICS which is
located in Waru, Sidoarjo. The first process is to place order for the container. This
process is done if the head office already receives a notification that the production
plant is ready to ship the product according to the requested amount. The container

69
is booked and an expedition company is also added to bring the container to the
factory in Tuban. A representative from PT ICS would check the container
beforehand prior to the shipment. It is to make sure that the condition of the
container is appropriate for the product. Making sure of the container’s condition is
important to avoid product being damaged while it is shipped to the destination.
The second activity is the export process itself. As mentioned earlier, the condition
of the container is very important to guarantee the quality of the product while it is
stored in the container.
The last SCOR process is the return process. The return process in this
company is not the actual product return but it is in the form of customer’s review
of the product. There are two possible outcome related to negative feedback, which
are complaints and claims. Complaint happens if the customer is not satisfied with
the product but the product actually already fulfills the standards. However,
customer demands some improvement in terms of production process for a better
quality. In the other hand, claim happens when the customer demands compensation
because the product is not in accordance with the requested specification. However,
PT ICS says that compensation is rarely happen.
5.2 Analysis of Risk Identification Process
By using the result of business process mapping that has been done
previously, risk identification process is conducted. Based on the business process
mapping, there are 25 processes in the supply chain of PT ICS starting from
planning the sales and production target until getting the customers’ review of the
products. From those processes, 49 potential failure modes are identified. The
identification process is done by interviewing the people who are involved in the
daily production process and the experts in the field. Beside that, direct observation
is also done to see the production process of dried anchovy on the production site.
The identification process is started by observing a particular process and
looking for something that can be an obstacle or disruption to the process. After
that, discussion with the employees and the operators is done to confirm the
identified failure modes. Furthermore, employees and operators also give some
inputs about the risks of that particular activity through interview. The interview is
70
done with operators and staffs both from the factory and the head office of PT ICS.
It is to make sure that all risks contained in the process can be identified thoroughly.
Out of the 49 potential failure modes, 28 of them are found in the Make
process. Source process also contains a lot of risks with 11 failure modes. The rest
of them are found in Plan process which has 4 failure modes, Delivery process with
4 failure modes, and Return process as the least risky process with 2 failure modes.
In the Make process, the Sizing activity alone counts for 7 of the failure modes.
Among the 49 potential failure modes, 13 of them are not related to human
factor. So, 73.5% of the risk is related to human factor while the rest is not related
to human. The risks that are not related to human factor are P.3.1, S.4.1, S.5.1, S.6.1,
M.3.1, M.5.7, M.8.1, M.11.1, M.11.3, M.11.4, D.1.1, D.2.2, and D.2.3. However,
risk S.1.1 and S.1.2 might be partially caused by human even though the main cause
is due to natural phenomenon. S.1.1 is the risk of the unavailability of raw material
and S.1.2 is the risk of having only a little amount of raw material. These two risks
are mostly caused by the low catch of fish due to seasonal and area constraints,
however it can also be caused by the suppliers. When the catch of fish is low,
suppliers might be failed in securing the fish from the fishers against other suppliers.
In the identification process; the risk effect, risk cause, and current control
are also determined. The risk effect is the impact or consequence of the risk when
it happened. In contrast, what causes the risk to happen is called risk cause. While
current control is a mechanism or method to prevent and avoid the risk from
happening and is associated with the detection level of the risk. The risk effect will
be used to determine the severity of the risk while the risk cause can determine the
occurrence of the risk. Similar with the failure mode identification, the interview
with the employees and staffs also becomes the main input of the risk cause, risk
effect, and current control identification. Some of the processes in the company are
yet to have current controls. This is because the risks are usually associated with
natural constraints, human error, and limited resources.
5.3 Analysis of Risk Assessment Process
In the risk assessment process; all of the identified risks, risk causes, risk
effects, and current controls are used as the input in this process. The risk

71
assessment process consists of two parts which are the scoring of severity,
occurrence, and detection and also the calculation of RPN. In assigning the score of
severity, occurrence, and detection; three respondents are asked to fill out a
questionnaire which consists of the potential failure modes along with the risk
cause, risk effect, and current control. The scoring criteria, which is given in the
questionnaire, uses likert scale of 1-10. Hence, the final score of the severity,
occurrence, and detection is not found through the mean of the three questionnaire
results but through the median of the results. The data from likert scale is classified
as ordinal data, therefore the appropriate parameter that should be used is median
or mode instead of mean. The median is chosen because some of the data don’t have
mode when the three results produce different values.
The figure below is the representation of the severity score that is obtained
from this research.
Figure 5. 1 Recapitulation of the Severity Score
According to figure 5.1, the highest severity is in the scale of 5 which is
found in S.11, S.1.2, S.3.1, and S.7.1. In contrast, the lowest severity is recorded at
the scale of 1 which is found in M.6.1 and M.8.1. The majority of the risks have
severity score of 3 with 20 risks and the score of 2 with 17 risks. Severity rating is
0
1
2
3
4
5
6
S.1.1
S.3.1
S.2.1
S.6.1
M.4.2
P.1.2
S.3.2
M.1.1
M.3.2
M.5.1
M.5.3
M.5.6
M.7.2
M.11.1
D.2.2
P.1.1
S.5.1
M.1.2
M.2.2
M.5.7
M.10.1
M.11.2
D.1.1
D.2.3
M.8.1
Severity

72
aimed to measure the impact of the risk when it happens. In assigning severity score,
the value of 1 indicates the smallest impact while the value of 10 means that the
impact of the risk is huge. It can be seen that all four of the risks with highest
severity is found in the source process. It means that any disruption to the process
of sourcing can create a significant impact to the process. Sourcing is important in
the production of dried anchovy because the raw materials of this product is very
dependent to the nature and is very hard to predict in terms of the availability and
quality.
Figure 5. 2 Recapitulation of the Occurrence Score
The second risk parameter that is assessed in FMEA is occurrence.
Occurrence indicates how often a failure mode happens or becomes an event. The
higher the score means that the risk happens more frequently. In this research, the
highest occurrence score is 4 which is found in eight risks. The risks that score the
highest occurrence value are P.1.2, S.1.1, S.2.2, S.3.2, S.7.1, M.4.1, M.5.2, and
M.7.2. Similar with previous parameter, the source process’s risk dominates the
highest occurrence rating. This indicates that the process of sourcing is frequently
disrupted by several problems. The main problems in the source process is related
to the availability, quality, and price of the raw material. In planning process, the
0
1
2
3
4
5
P.1.2
S.2.2
S.3.2
M.4.1
P.2.1
S.1.2
S.4.1
M.3.1
M.4.2
M.5.2
M.5.6
M.7.3
D.1.1
S.5.1
M.1.1
M.2.1
M.5.3
M.5.7
M.9.1
M.10.2
M.11.3
D.2.2
R.1.1
P.1.1
M.6.1
Occurrence

73
production target is sometimes unachieved. This is due to the limited resource of
raw material rather than the problem of production capacity. For make process, the
biggest problem is about the sorting result. Unclean sorting result happen several
times and it can affect the performance of the production process. Unclean sorting
process can cause repeated working when the operators needs to clean the product
again.
Figure 5. 3 Recapitulation of the Detection Score
Beside the previous two parameters, FMEA also assesses the detection level
of a risk. Detection is related to whether the risk can be detected before it happens.
It also shows how effective the prevention method in detecting and preventing the
risk to happen. The score of 10 indicates that there is no tools or signs which can be
used to detect the risk and that the prevention method failed to stop the risk. There
are ten risks that has the detection score of 10. These risks are those which have no
current controls to prevent the risk, thus the scores are 10. The risks with highest
detection score are P.1.2, S.3.1, S.6.1, M.2.3, M.3.1, M.5.4, M.5.6, M.5.7, M.7.3,
M.11.1, and M.11.4.
After all of the parameters scores are achieved through the questionnaire.,
the calculation of RPN can be done. Risk priority number is obtained by multiplying
012345678910
P.1.2
S.6.1
M.3.1
M.5.6
M.7.3
M.11.4
P.2.1
S.3.2
M.4.1
M.5.1
M.5.3
M.7.2
D.2.1
P.1.1
S.1.2
S.5.1
S.8.1
M.2.1
M.3.2
M.7.1
M.9.1
M.10.2
M.11.3
R.1.1
M.1.1
Detection
74
each score of the severity, occurrence, and detection. Thus, the maximum or the
highest RPN can reach up to 1000. However, the highest RPN found in this case is
200. Risk with higher RPN should be attended first because that risk might have
severe impact or might be frequently happen or it might be undetected.
5.4 Analysis of Risk Evaluation Process
The evaluation of the risk is done through two ways. The first is to rank the
available risk from the largest RPN to the smallest RPN. This process can show the
which risk that has the highest risk priority number. The risk that has RPN more
than 100 will be mitigated in the next step of FMEA. There are four risks with RPN
exceeding 100 which are S.3.1, P.1.2, S.6.1, and M.3.1. The first risk is about the
increase of price demanded by the suppliers which has severity score of 5,
occurrence score of 4, and detection score of 10. The detection score is high since
it doesn’t have any current controls that can be applied to avoid the risk. The second
until the fourth highest RPN risks have the same RPN which is 120. P.1.2 is the risk
of not achieving the production target. The severity score is 3, the occurrence score
is 4, while the detection score is 10. Again, the high number of detection makes this
risk included in the high risk classification which is due to not having a
prevention/detection method to avoid the risk. The third high risk is there are many
mixtures on the raw materials (fresh raw materials). The same as the previous high
risk, this risk also has no current controls thus making the score of detection become
so high in the level of 10. The severity and occurrence is relatively medium in the
range of 4 and 3 respectively. The last high risk is found in the make process which
is the risk of rain when drying process is conducted. This risk also has high detection
score due to unavailability of prevention method since rain is natural phenomenon
that can’t be avoided. The score of severity and occurrence is the same as the
previous risk since they have the exact same RPN.
Beside RPN ranking, the evaluation is also done by mapping the risk using
risk matrix. Risk matrix divides the risks into several categories, this research
decides to classify the risks into 3 categories which are high risk indicated by red
color, medium risk indicated by yellow color, and low risk indicated by green color.
If the RPN ranking is done by sorting the RPN of all the risks from the largest to

75
the smallest, risk matrix is done by mapping the risks based on their severity and
occurrence score. The X axis indicates the occurrence score while the Y axis
indicates the severity score. The area is divided into high risk, medium risk, and
low risk based on the score of both the severity and the occurrence. The result of
this risk matrix is shown in figure 4.2. It can be seen that there is no risk that falls
in the high risk area. The yellow area or the medium risk area is occupied by nine
risk which are S.1.1, S.1.2, S.2.1, S.2.2, S.3.1, S.6.1, S.7.1, M.3.1, and M.4.2. the
first two risks are from the same activity which is visiting the raw material (fresh
fish) suppliers in Tuban and Rembang. This activity is vital to the whole process of
dried anchovy production because without raw materials, the whole production
process will be disrupted. S.2.1 and S.2.2 are also from the same activity which is
quality checking of raw materials. The risk of having bad raw material will affect
the production process especially the activity of sorting. Beside affecting the
process of sorting, bad quality of raw material also has an impact in the final product
in terms of the quality and the amount. Bad raw material produces fewer final
product since there are many objects that should be removed from it. Bad raw
material can also make the quality of the product to be downgraded and resulted in
the lower price of the product.
5.5 Analysis of Risk Mitigation Process
After conducting a risk evaluation process, it is decided that there will be
ten risks that are going to be mitigated in the mitigation process. The risks that are
going to be mitigated are those whose RPN exceeds 100 and also those which falls
in the medium risk area. Among the ten risks, seven of them are from the process
of sourcing. The risks which will be mitigated are P.1.2, S.1.1, S.1.2, S.2.1, S.2.2,
S.3.1, S.6.1, S.7.1, M.3.1, and M.4.2.
In mitigating the risks, there are four alternatives to be used. Risk response
or mitigation strategy is divided into reduce risk, transfer risk, avoid risk, and accept
risk. Risk reduction is defined as an effort to reduce the impact of risk by creating
actions that can decrease the frequency of the risk. Transfer risk means that the
impact of risk is transferred to other party such as the insurance company,
expedition company, suppliers, etc.; while in this case the risk of getting a bad
76
quality of raw material is transferred to the supplier by returning raw material with
low quality back to the supplier. The third form of mitigation strategy is to avoid
risk. Avoiding risk is aimed to lessen the impact of a risk by performing an action
that could eliminate the cause of the risk. The last alternative, which is accept risk,
is used when the risk is unavoidable and can’t be prevented. In this research, accept
risk is used as a mitigation strategy for several risks such as the risk of rain falls
during the drying process. Since rain is a natural phenomenon that can’t be avoided
and prevented, the only mitigation strategy is to wait until the rain to stop. Actually,
drying process can be done using machine and located indoor, however it is not
common and not appropriate for dried anchovy production. Indoor drying process
using artificial sunlight affects the final product of dried anchovy in terms of
quality. That’s why PT ICS keeps using the natural sunlight to dry the anchovy even
though some problems such as rain might disrupt the production process. The risk
of getting many mixtures in the fish is also accepted since the company can use dry
raw materials when the condition of the sea is not good. Unavailability of raw
materials is also accepted by waiting until the catch of fish increases. The limited
amount of raw material is also accepted since the company can use dry raw material
instead of fresh fish when the catch of fish is low. The risk of increasing price
demanded by suppliers is also accepted even though the impact of this risk is among
the highest. It is due to the fact that PT ICS can use dry raw material instead of fresh
raw material. When the price of fish is high, dry raw material can be used as an
alternative. Besides that, the risk should also be reduced by creating a contract with
the suppliers to set the maximum price boundary. Aside from that risk, the risk of
unachieved production target and unavailability of raw material should also be
reduced by finding new suppliers to gain more raw materials. Risk number S.7.1
and S.2.1 which concerns about the condition of the raw material can be reduced
by making a quality checking form that can be used by the procurement staff to
determine the raw material’s quality. Reducing risk is also applicable to the risk
number M.4.2 by giving evaluation to ‘pekerja borongan’ or casual workers
regarding their performance of sorting result.
In the mitigation strategy, there are five methods of risk reduction, five
methods of risk acceptance, one risk transfer, and one risk avoidance. One of the
77
proposed action to reduce the risk is to create a quality checking form that is helpful
for the sourcing staff to assess the raw material’s quality.
5.6 Analysis of Human Factor in Supply Chain Process
Human factor plays a big role in the process of supply chain in this company.
From the early process of planning until the last process of customer’s review all
involved human as the actor to determine the process. The process of planning the
sales target and production target is obviously done by human since it requires
analytical thinking and discussions among the staffs. The process of offering
product to customer also involves human as the actor who markets the product as
well as doing a negotiation in terms of price and other requirements. Sales
confirmation is received and reviewed by the staff and it is can not be done
automatically without the help of human.
The process of sourcing also involves human as the main actor to find and
buy the raw materials. The raw material, which is fish, is obtained by the fishers
manually. Even the quality control of the raw material is also done by human and
it depends fully on the capability of the sourcing staff. However, the judgment of
human can not be 100% accurate, sometimes the sourcing staff are failed to assess
the quality accurately. In sourcing process, the role of human is very important
especially in the process of finding the raw material and checking the quality of the
raw material.
Since the production process of PT ICS is using manual labor, the
involvement of human is very significant in the production process or make process.
The process of washing, cooking, until the sorting process always involve human
as the main actor. In some activities such as metal magnet sorting and sizing,
equipment is used to help operator done its job, however the role of human is still
needed to make the process run smoothly. The process of sorting, which is the main
process in dried anchovy production, is highly dependent on the skill of the
operator. Sorting process, the process of removing the foreign objects from the
product, is impossible to be done without the involvement of human. PT ICS said
that until now there is no machine/technology that can replace human in this
process. The importance of human factor is undeniable in the process of make.
78
Delivery process requires operator to place order for the container and make
sure that the condition of the container is appropriate for transporting food. The last
process, which is customer’s review, is undoubtedly done by human. The review of
the product is done by the customer and PT ICS as the producer will receive the
feedback and uses it to improve the production. These process is only possible to
happen if human is involved in it.
Human factor cannot be separated from the supply chain process of seafood
industry, especially PT ICS. In Indonesia, where most of the fishers still catch fish
manually, human factor plays an important role in the sector. Human involvement
cannot be eliminated from the production process of dried anchovy since most of
the process are using manual labor. However, the problem of unstable productivity
always arises in the industry. Innovation and technology are urgently needed to
tackle the problem related to productivity of human. This research is indirectly
aimed to increase the productivity by eliminating and reducing the risk in the supply
chain in order to have a more efficient and effective process. The assessment of risk
and implementation of mitigation strategy is also very dependent on the human
resource. The staffs and operators’ willingness to improve is the key to achieve an
established risk management which can help to solve the problem of productivity.
79
CHAPTER VI
CONCLUSION AND SUGGESTION
In this chapter, the conclusion and suggestion will be given based on the
result of the research. The conclusion will be drawn from the analysis of the
research while the suggestion will be given in order to improve the next research.
6.1 Conclusion
After conducting the research of risk assessment using failure mode and
effect analysis (FMEA) in PT ICS, the research resulted in several conclusions
which will be shown in the list below.
1. The risk identification process is conducted by observing the supply chain
process of PT ICS and also through some interviews with the staffs and
operators that works in the production facility as well as the head office.
From the direct observation and discussions, the total of 49 risks are found
in the supply process of PT ICS. Among them, nine risks are classified as
medium risk while the others are classified as low risk. The risks are
classified based on the SCOR process mapping since the supply chain
process is already mapped out beforehand. The result of the risk
identification is used as an input for the next step of FMEA which is risk
assessment, risk evaluation, and risk mitigation process.
2. Human factor is involved in all the processes in the supply chain activity of
PT ICS from the plan until the return process. Human factor cannot be
separated from the supply chain process of seafood industry, especially PT
ICS. The importance of human involvement is felt even since the process of
fish catching by the fishers. In the supply chain of PT ICS, human factor is
involved the most in the make process or the production process of dried
anchovy. This activity, especially sorting process, is impossible to be done
without the involvement of manual labor.
80
3. Mitigation strategy is given to 10 risks that are in the category of medium
risk and for risks that have RPN more than 100. These risks are mitigated
by four different risk responses which are risk reduction, risk transfer, risk
avoidance, and risk acceptance. For risk reduction and risk acceptance, there
are five methods obtained for each of them to mitigate the risks. Risk
avoidance and risk transfer are accounted for only one method each for the
mitigation strategy. The highest risk is reduced by creating a contract with
the suppliers to set a maximum price boundary. Reducing risk is also done
to risk number S.7.1 and S.2.1 by making a quality checking form that will
be helpful to the procurement staff in determining the quality of raw
materials and in deciding whether to buy the raw materials or not.
6.2 Suggestion
Based on the research, there are several suggestions that will be given for
the next research. The suggestions are as follows.
1. The risk assessment should be conducted for the whole company in order
to make the business process runs more effectively and efficiently.
2. The risk management in PT ICS should be collaborated with the existing
HAZOP (Hazard and Operability Study) to create a better production
process and to prevent operational hazard from the source.

81
REFERENCE
Berg, H. (2010). Risk Management: Procedures, Methods and Experiences. 1.
Bode, C. (2008). Causes and Effects of Supply Chain Disruptions. Doctoral.
Wissenschaftliche Hochschule für Unternehmensführung (WHU).
Cagliano, A., Rafele, C. and Grimaldi, S. (2010). Enabling the SCOR-Model Risk
Management Process with a Theoretical Performance-Based Approach. 59-
76.
Catchpole, K. (2011). What is Human Factors?. [online] Clinical Human Factors
Group. Available at: https://chfg.org/about-us/what-is-human-factors/
[Accessed 16 Mar. 2018].
CEA (2016). "Indonesia Fisheries: 2015 Review". [online] The David and Lucile
Packard Foundation. Available at: https://www.packard.org/wp-
content/uploads/2016/09/Indonesia-Fisheries-2015-Review.pdf [Accessed
16 Mar. 2018].
Chopra, S. and Meindl, P. (2004). Supply Chain Management: Strategy, Planning,
and Operation. 2nd ed. Upper Saddle River, N.J.: Prentice Hall.
Christopher, M. (2011). Logistics & Supply Chain Management. 4th ed. Harlow:
Financial Times Prentice Hall.
Christopher, M., A. McKinnon, J. Sharp, R. Wilding, H. Peck, P. Chapman, U.
Juttner, and Y. Bolumole. (2002). Supply Chain Vulnerability. Cranfield,
UK: Cranfield University.
Collier, P. and Agyei-Ampomah, S. (2006). Management accounting - risk and
control strategy. 1st ed. Amsterdam: CIMA Publ. Elsevier.
Collier, P.M. and Agyei-Ampomah, S. (2006). Management accounting: risk and
control strategy. Oxford: Elsevier.
Curkovic, S., Scannell, T. and Wagner, B. (2013). Using FMEA for Supply Chain
Risk Management. Modern Management Science & Engineering, [online]
1(2). Available at: http://www.scholink.org/ojs/index.php/mmse [Accessed
17 Mar. 2018].
82
EIBN (2017). Fisheries and Aquaculture. EIBN Sector Report. [online] EU-
Indonesia Business Network. Available at:
http://indonesien.ahk.de/fileadmin/ahk_indonesien/Publications/EIBN/Fish
eries_and_Aquaculture_Sector_Report_2017_FULL.pdf [Accessed 12
Mar. 2018].
FAO (2014). Indonesia. Fishery and Aquaculture Country Profiles. [online] Rome:
Fisheries and Aquaculture Department. Available at:
http://www.fao.org/fishery/facp/IDN/en [Accessed 15 Mar. 2018].
Fellows, P. and Hampton, A. (1992). Small-scale food processing. London:
Intermediate Technology Publications.
Ganeshan, R., & Harrison Terry P. (1995). An. Introduction to Supply Chain
Management. Department of. Management Sciences and Information
Systems.
Gbgindonesia.com. (2016). Indonesia Fishery Sector | GBG. [online] Available at:
http://www.gbgindonesia.com/en/agriculture/article/2016/indonesia_s_fish
eries_sector_under_a_new_paradigm_11566.php [Accessed 12 Mar. 2018].
Hampton, J. (2009). Fundamentals of Enterprise Risk Management: How Top
Companies Assess Risk, Manage Exposure, and Seize Opportunity. New
York: American Management Association.
Harvey, J. (2008). Introduction to managing risk. [ebook] London: The Chartered
Institute of Management Accountants. Available at:
http://www.cimaglobal.com/Documents/ImportedDocuments/cid_tg_intro
_to_managing_rist.apr07.pdf [Accessed 8 Mar. 2018].
Hugos, M. (2003). Essentials of supply chain management. Hoboken, N.J.: John
Wiley & Sons.
IDN Financials. (2018). Indonesia's fish export rank slumps to 14 - IDNFinancials.
[online] Available at: https://www.idnfinancials.com/n/14354/Indonesias-
fish-export-rank-slumps-to-14 [Accessed 8 Mar. 2018].
Iea.cc. (2018). Definition and Domains of Ergonomics | IEA Website. [online]
Available at: http://www.iea.cc/whats/index.html [Accessed 16 Mar. 2018].
International Business Publications. (2015). Indonesia Fishing and Aquaculture
Industry Handbook. Washington: Intl Business Publications Usa.
83
Irindo.com. (2018). Indonesian Fishery Exports Rise 8.12% to USD4.09 Billion in
2017. [online] Available at: https://www.irindo.co.id/single-
post/2018/01/12/Value-On-Indonesian-Fishery-Exports-Rise-812-to-
USD409-Billion-in-2017?m=1 [Accessed 8 Mar. 2018].
Johnson, K. (2002). Column: Back to Basics: It's Fun To Work With an F-M-E-A.
[online] Asq.org. Available at: http://asq.org/quality-
progress/2002/01/back-to-basics/fun-to-work-with-fmea.html [Accessed 12
Mar. 2018].
Juandi, A. (2017). KKP: Tantangan industri perikanan bakal lebih berat. [online]
Elshinta.com. Available at:
https://elshinta.com/news/122022/2017/09/28/kkp-tantangan-industri-
perikanan-bakal-lebih-berat [Accessed 12 Mar. 2018].
Jurčević, M., Ivaković, M. and Babić, D. (n.d.). The Role of Human Factors in
Supply Chains.
Juttner, U., Peck, H. and Christopher, M. (2003), “Supply chain risk management:
outlining an agenda for future research”, International Journal of Logistics
Research and Applications, Vol. 6 No. 4, pp.197-210.
Lambert, D., Stock, J. and Ellram, L. (1998). Fundamentals of logistics
management. London: McGraw-Hill Education.
McDermott, R., Mikulak, R., Beauregard, M. and Mikulak, R. (2008). The Basics
of FMEA, 2nd Edition. Portland: CRC Press.
Merna, T. and Al-Thani, F. (2008). Corporate Risk Management. 2nd ed.
Chichester, England: Wiley.
Monahan, G. (2008). Enterprise Risk Management: A Methodology for Achieving
Strategic Objectives. Hoboken, N.J.: John Wiley & Sons.
Norrman, A. and Jansson, U. (2004). Ericsson's proactive supply chain risk
management approach after a serious sub-supplier accident. International
Journal of Physical Distribution & Logistics Management, 34(5), pp.434-
456.
Pettit, T., Fiksel, J. and Croxton, K. (2010). Ensuring Supply Chain Resilience:
Development of a Conceptual Framework. Journal of Business Logistics,
31(1), pp.1-21.
84
Poernomo, A. and Heruwati, E. (2011). Industrialisasi Perikanan: Suatu Tantangan
Untuk Perubahan. Squalen, [online] 6(3). Available at:
https://www.bbp4b.litbang.kkp.go.id/squalen-
bulletin/index.php/squalen/article/viewFile/65/45 [Accessed 11 Mar. 2018].
Poluha, R. (2007). Application of the SCOR model in supply chain management.
Youngstown, N.Y.: Cambria Press.
Potential Failure Mode and Effects Analysis (FMEA): Reference Manual. (2008).
4th ed. Chrysler LLC, Ford Motor Company, General Motors Corporation.
Purdy, G. (2010). ISO 31000:2009-Setting a New Standard for Risk
Management. Risk Analysis, [online] 30(6), pp.881-886. Available at:
http://broadleaf.com.au/wp-
content/uploads/2010/06/Art_RiskAnalysis_ISO31000.pdf [Accessed 8
Mar. 2018].
Risk Management Handbook. (n.d.). [ebook] Adelaide: University of Adelaide.
Available at:
https://www.adelaide.edu.au/legalandrisk/docs/resources/Risk_Manageme
nt_Handbook.pdf [Accessed 10 Mar. 2018].
Ross, D. (2017). SCOR Overview. [ebook] Chicago: APICS. Available at:
https://www.apics.org/docs/default-source/scor/scor_overview-participant-
workbook.pdf?sfvrsn=2 [Accessed 8 Mar. 2018].
SCOR: Supply Chain Operations Reference Model. (2012). 11th ed. [ebook]
Supply Chain Council. Available at:
https://www.academia.edu/12206892/Supply_Chain_Operations_Referenc
e_Model_SCOR [Accessed 8 Mar. 2018].
Sheffi, Y. (2005). The Resilient Enterprise: Overcoming Vulnerability for
Competitive Advantage. Cambridge (MA): The MIT Press.
Singh, P., Danish, M. and Saxena, A. (n.d.). Spoilage of fish-process and its
prevention. [online] Aquafind.com. Available at:
http://aquafind.com/articles/spolage.php [Accessed 13 Mar. 2018].
Statista. (2017). Leading exporters fish and fishery products worldwide, 2017 |
Statistic. [online] Available at:

85
https://www.statista.com/statistics/268269/top-10-exporting-countries-of-
fish-and-fishery-products/ [Accessed 10 Mar. 2018].
Statista. (2018). Global leading fishing nations 2015 | Statistic. [online] Available
at: https://www.statista.com/statistics/240225/leading-fishing-nations-
worldwide-2008/ [Accessed 8 Mar. 2018].
Sutjiamidjaja, I. dan Sutjiamidjaja, H. (1999). Program pengembangan perikanan
Indonesia sebagai sumber kesejahteraan nelayan, Lowongan pekerjaan,
serta devisa Negara. Pembahasan PROTEKAN 2003. Ditjenkan, Deptan.
The IRM. (2018). About Risk Management. [online] Available at:
https://www.theirm.org/the-risk-profession/risk-management.aspx
[Accessed 8 Mar. 2018].
The Jakarta Post. (2016). Lack of cold storage hampers fish processing industry.
[online] Available at: http://thejakartapost.com/news/2016/01/02/lack-cold-
storage-hampers-fish-processing-industry.html [Accessed 11 Mar. 2018].
Treasury Board of Canada Secretariat. (2001). Integrated Risk Management
Framework.

86
(This page is intentionally left blank)

87
APPENDIX
KUESIONER FMEA
Dengan hormat,
Bersama dengan ini saya,
Nama : Nisrina Gianindya Poer
NRP : 02411440000129
Universitas : Institut Teknologi Sepuluh Nopember
Program Studi : Teknik Industri
memohon kesediaan Bapak/Ibu untuk meluangkan waktu untuk mengisi kuesioner
penelitian tugas akhir yang menjadi syarat untuk menyelesaikan pendidikan S1.
Kuesioner tersebut akan digunakan sebagai data dalam penelitian tugas akhir
dengan judul:
“Assessment of Risk Related to Human Factor in Supply Chain Process of PT
ICS Using FMEA”
Kuesioner ini bertujuan untuk mengukur tingkat risiko pada setiap
proses/aktivitas yang terdapat pada proses supply chain atau rantai pasok. Dengan
kuisioner ini, risiko-risiko yang terjadi pada proses supply chain dapat dicegah dan
diantisipasi sehingga dampak yang ditimbulkan berkurang atau probabilitas
terjadinya dapat dikurangi. Penilaian risiko akan didasarkan pada tiga aspek yaitu
Severity (keparahan dampak risiko), Occurrence (probabilitas terjadinya risko), dan
Detection (deteksi terhadap risiko).
Kuesioner ini ditujukan untuk karyawan PT Insan Citraprima Sejahtera
yang memahami aktivitas-aktivitas pada proses supply chain perusahaan. Mohon
kiranya Bapak/Ibu dapat memberikan jawaban yang jujur dan sesuai dengan
kondisi yang sebenarnya. Dimohon Bapak/Ibu untuk mengisi kuesioner dengan
selengkap-lengkapnya pada bagian yang telah ditentukan. Kuesioner ini terdiri dari
tiga bagian, yaitu Bagian 1: Identitas Responden; Bagian 2: Skala Ranking Severity,
Occurrence, dan Detection; dan Bagian 3: Kuesioner Penelitian.

88
Data-data yang dicantumkan dalam kuisioner ini akan dijaga
kerahasiaannya oleh peneliti dan hanya akan digunakan untuk kepentingan
penelitian. Terima kasih atas kesediaan Bapak/Ibu untuk mengisi kuesioner ini.
Bagian 1: Identitas Responden
Pada bagian ini Bapak/ibu dimohon untuk mengisi biodata sesuai dengan
kolom yang tersedia dibawah. Pengisian dilakukan dengan mengisi kolom yang
kosong serta mencoret pilihan jawaban yang tidak sesuai.
Nama :
Jenis Kelamin : Perempuan / Laki-laki
Jabatan :
Lama Bekerja : Bulan / Tahun
Surabaya, ……………………….
(Tanda tangan dan nama terang)
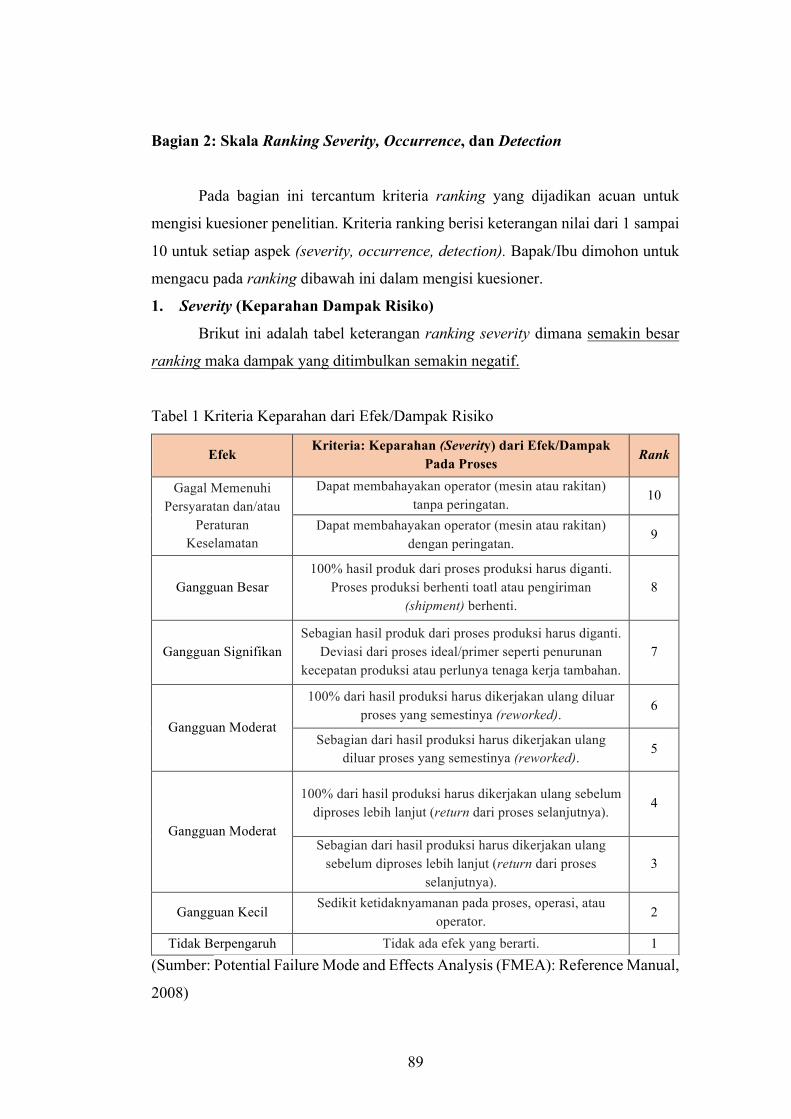
89
Bagian 2: Skala Ranking Severity, Occurrence, dan Detection
Pada bagian ini tercantum kriteria ranking yang dijadikan acuan untuk
mengisi kuesioner penelitian. Kriteria ranking berisi keterangan nilai dari 1 sampai
10 untuk setiap aspek (severity, occurrence, detection). Bapak/Ibu dimohon untuk
mengacu pada ranking dibawah ini dalam mengisi kuesioner.
1. Severity (Keparahan Dampak Risiko)
Brikut ini adalah tabel keterangan ranking severity dimana semakin besar
ranking maka dampak yang ditimbulkan semakin negatif.
Tabel 1 Kriteria Keparahan dari Efek/Dampak Risiko
Efek Kriteria: Keparahan (Severity) dari Efek/Dampak
Pada Proses Rank
Gagal Memenuhi Persyaratan dan/atau
Peraturan Keselamatan
Dapat membahayakan operator (mesin atau rakitan) tanpa peringatan.
10
Dapat membahayakan operator (mesin atau rakitan) dengan peringatan.
9
Gangguan Besar 100% hasil produk dari proses produksi harus diganti.
Proses produksi berhenti toatl atau pengiriman (shipment) berhenti.
8
Gangguan Signifikan Sebagian hasil produk dari proses produksi harus diganti.
Deviasi dari proses ideal/primer seperti penurunan kecepatan produksi atau perlunya tenaga kerja tambahan.
7
Gangguan Moderat
100% dari hasil produksi harus dikerjakan ulang diluar proses yang semestinya (reworked).
6
Sebagian dari hasil produksi harus dikerjakan ulang diluar proses yang semestinya (reworked).
5
Gangguan Moderat
100% dari hasil produksi harus dikerjakan ulang sebelum diproses lebih lanjut (return dari proses selanjutnya).
4
Sebagian dari hasil produksi harus dikerjakan ulang sebelum diproses lebih lanjut (return dari proses
selanjutnya). 3
Gangguan Kecil Sedikit ketidaknyamanan pada proses, operasi, atau
operator. 2
Tidak Berpengaruh Tidak ada efek yang berarti. 1 (Sumber: Potential Failure Mode and Effects Analysis (FMEA): Reference Manual,
2008)
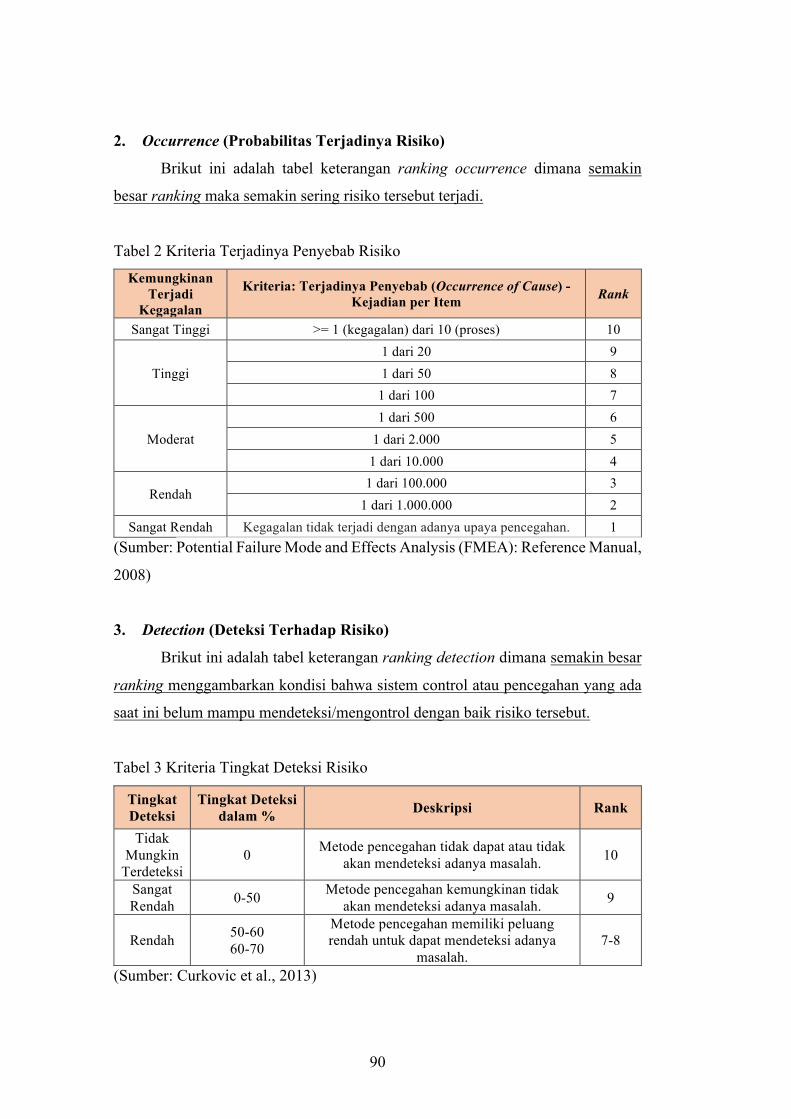
90
2. Occurrence (Probabilitas Terjadinya Risiko)
Brikut ini adalah tabel keterangan ranking occurrence dimana semakin
besar ranking maka semakin sering risiko tersebut terjadi.
Tabel 2 Kriteria Terjadinya Penyebab Risiko
Kemungkinan Terjadi
Kegagalan
Kriteria: Terjadinya Penyebab (Occurrence of Cause) - Kejadian per Item Rank
Sangat Tinggi >= 1 (kegagalan) dari 10 (proses) 10
Tinggi 1 dari 20 9 1 dari 50 8
1 dari 100 7
Moderat 1 dari 500 6
1 dari 2.000 5 1 dari 10.000 4
Rendah 1 dari 100.000 3
1 dari 1.000.000 2 Sangat Rendah Kegagalan tidak terjadi dengan adanya upaya pencegahan. 1
(Sumber: Potential Failure Mode and Effects Analysis (FMEA): Reference Manual,
2008)
3. Detection (Deteksi Terhadap Risiko)
Brikut ini adalah tabel keterangan ranking detection dimana semakin besar
ranking menggambarkan kondisi bahwa sistem control atau pencegahan yang ada
saat ini belum mampu mendeteksi/mengontrol dengan baik risiko tersebut.
Tabel 3 Kriteria Tingkat Deteksi Risiko
Tingkat Deteksi
Tingkat Deteksi dalam % Deskripsi Rank
Tidak Mungkin
Terdeteksi 0 Metode pencegahan tidak dapat atau tidak
akan mendeteksi adanya masalah. 10
Sangat Rendah 0-50 Metode pencegahan kemungkinan tidak
akan mendeteksi adanya masalah. 9
Rendah 50-60 60-70
Metode pencegahan memiliki peluang rendah untuk dapat mendeteksi adanya
masalah. 7-8
(Sumber: Curkovic et al., 2013)
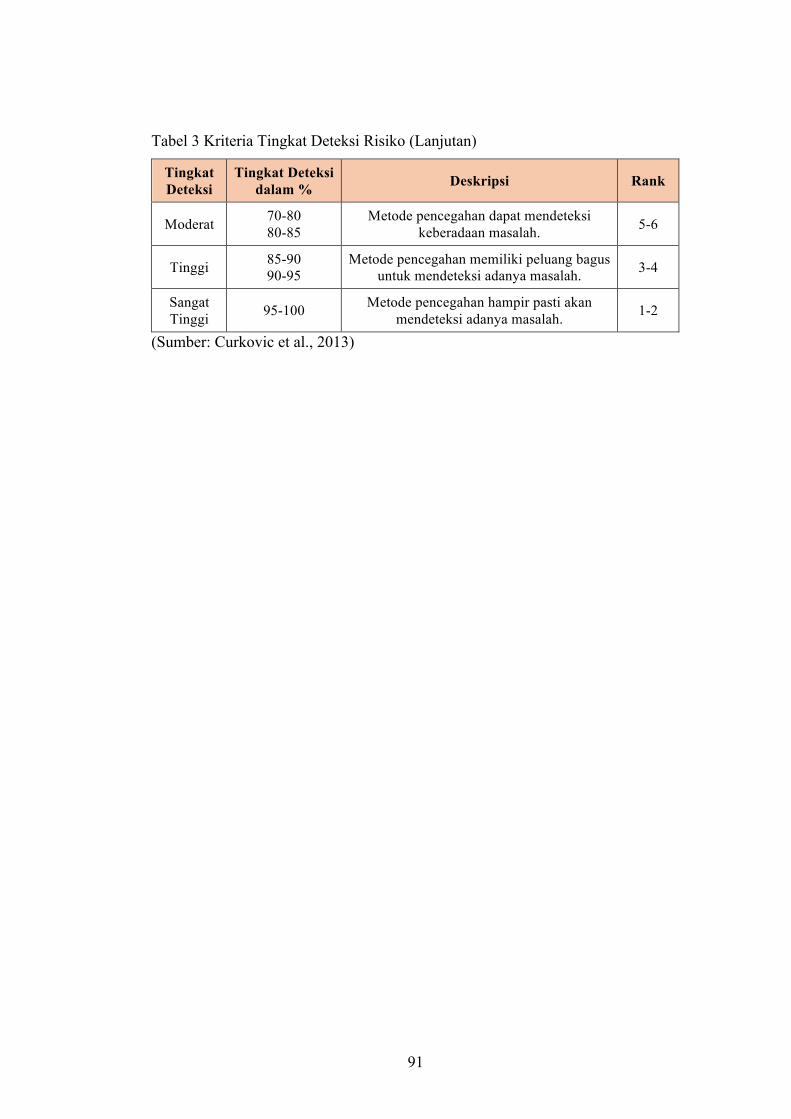
91
Tabel 3 Kriteria Tingkat Deteksi Risiko (Lanjutan)
Tingkat Deteksi
Tingkat Deteksi dalam % Deskripsi Rank
Moderat 70-80 80-85
Metode pencegahan dapat mendeteksi keberadaan masalah. 5-6
Tinggi 85-90 90-95
Metode pencegahan memiliki peluang bagus untuk mendeteksi adanya masalah. 3-4
Sangat Tinggi 95-100 Metode pencegahan hampir pasti akan
mendeteksi adanya masalah. 1-2
(Sumber: Curkovic et al., 2013)
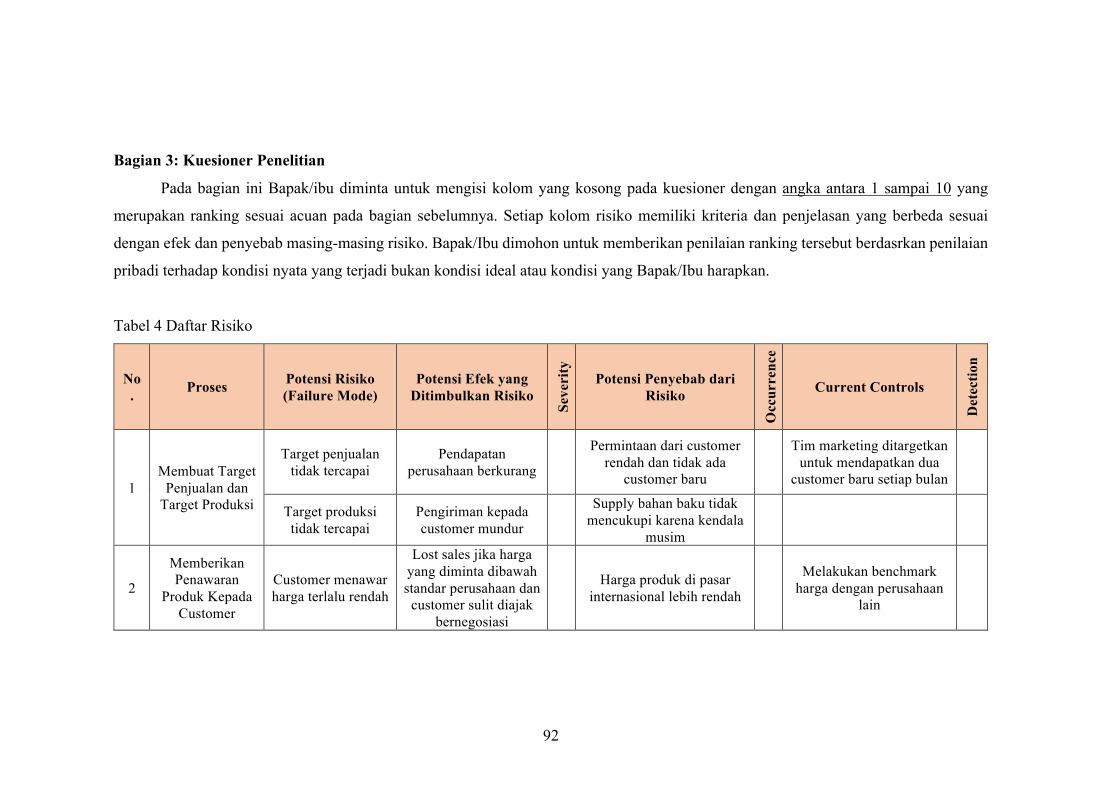
92
Bagian 3: Kuesioner Penelitian
Pada bagian ini Bapak/ibu diminta untuk mengisi kolom yang kosong pada kuesioner dengan angka antara 1 sampai 10 yang
merupakan ranking sesuai acuan pada bagian sebelumnya. Setiap kolom risiko memiliki kriteria dan penjelasan yang berbeda sesuai
dengan efek dan penyebab masing-masing risiko. Bapak/Ibu dimohon untuk memberikan penilaian ranking tersebut berdasrkan penilaian
pribadi terhadap kondisi nyata yang terjadi bukan kondisi ideal atau kondisi yang Bapak/Ibu harapkan.
Tabel 4 Daftar Risiko
No. Proses Potensi Risiko
(Failure Mode) Potensi Efek yang
Ditimbulkan Risiko
Seve
rity
Potensi Penyebab dari Risiko
Occ
urre
nce
Current Controls
Det
ectio
n
1 Membuat Target
Penjualan dan Target Produksi
Target penjualan tidak tercapai
Pendapatan perusahaan berkurang
Permintaan dari customer rendah dan tidak ada
customer baru
Tim marketing ditargetkan untuk mendapatkan dua
customer baru setiap bulan
Target produksi tidak tercapai
Pengiriman kepada customer mundur
Supply bahan baku tidak mencukupi karena kendala
musim
2
Memberikan Penawaran
Produk Kepada Customer
Customer menawar harga terlalu rendah
Lost sales jika harga yang diminta dibawah standar perusahaan dan
customer sulit diajak bernegosiasi
Harga produk di pasar internasional lebih rendah
Melakukan benchmark harga dengan perusahaan
lain
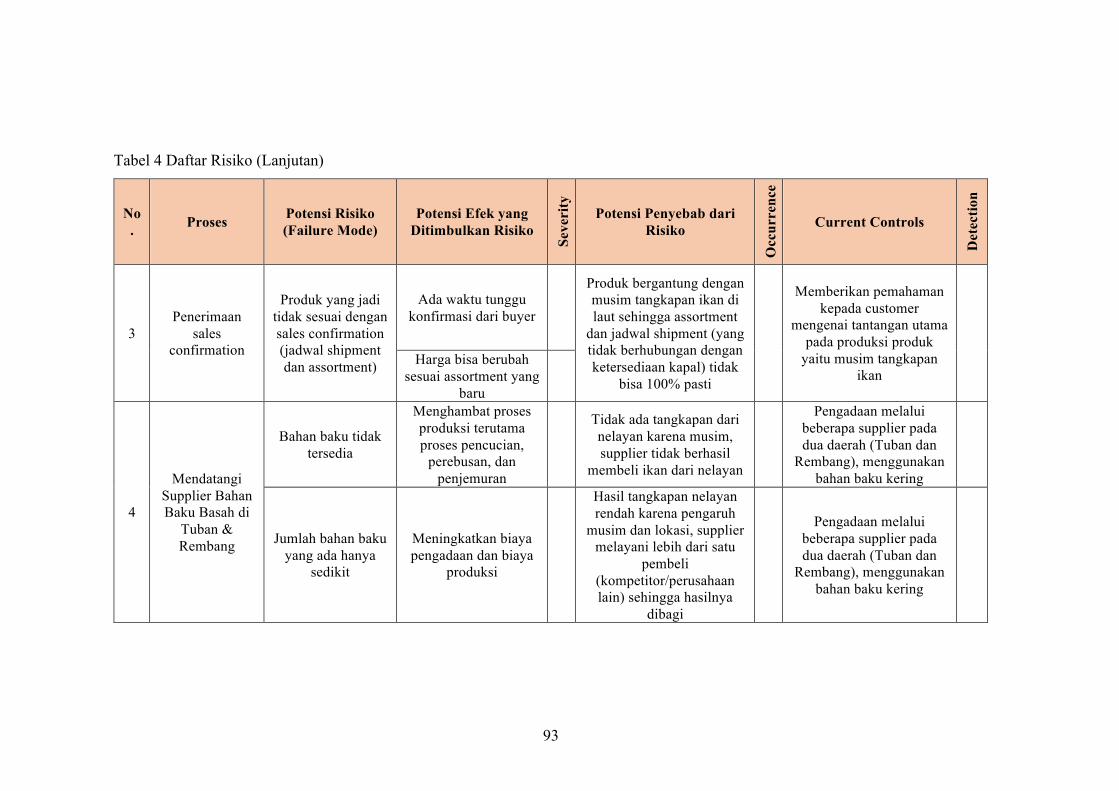
93
Tabel 4 Daftar Risiko (Lanjutan)
No. Proses Potensi Risiko
(Failure Mode) Potensi Efek yang
Ditimbulkan Risiko
Seve
rity
Potensi Penyebab dari Risiko
Occ
urre
nce
Current Controls
Det
ectio
n
3 Penerimaan
sales confirmation
Produk yang jadi tidak sesuai dengan sales confirmation (jadwal shipment dan assortment)
Ada waktu tunggu konfirmasi dari buyer
Produk bergantung dengan musim tangkapan ikan di laut sehingga assortment
dan jadwal shipment (yang tidak berhubungan dengan ketersediaan kapal) tidak
bisa 100% pasti
Memberikan pemahaman kepada customer
mengenai tantangan utama pada produksi produk
yaitu musim tangkapan ikan
Harga bisa berubah sesuai assortment yang
baru
4
Mendatangi Supplier Bahan Baku Basah di
Tuban & Rembang
Bahan baku tidak tersedia
Menghambat proses produksi terutama proses pencucian,
perebusan, dan penjemuran
Tidak ada tangkapan dari nelayan karena musim, supplier tidak berhasil
membeli ikan dari nelayan
Pengadaan melalui beberapa supplier pada dua daerah (Tuban dan
Rembang), menggunakan bahan baku kering
Jumlah bahan baku yang ada hanya
sedikit
Meningkatkan biaya pengadaan dan biaya
produksi
Hasil tangkapan nelayan rendah karena pengaruh
musim dan lokasi, supplier melayani lebih dari satu
pembeli (kompetitor/perusahaan lain) sehingga hasilnya
dibagi
Pengadaan melalui beberapa supplier pada dua daerah (Tuban dan
Rembang), menggunakan bahan baku kering
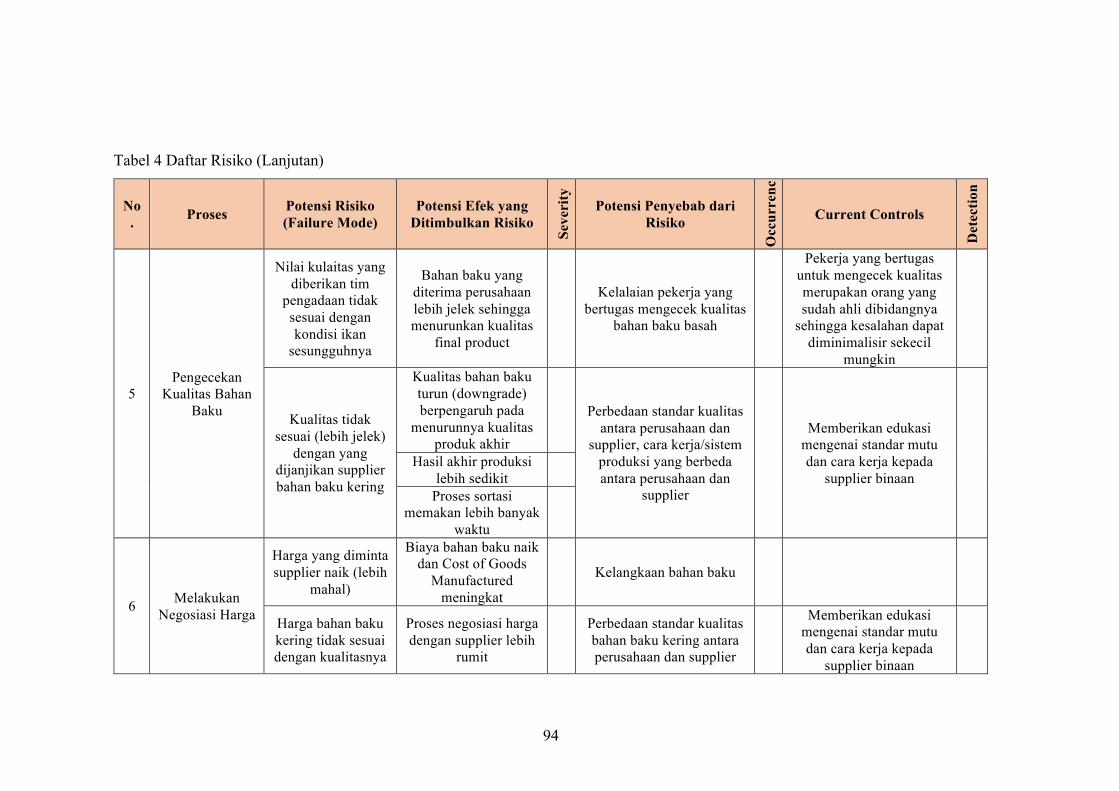
94
Tabel 4 Daftar Risiko (Lanjutan)
No. Proses Potensi Risiko
(Failure Mode) Potensi Efek yang
Ditimbulkan Risiko
Seve
rity
Potensi Penyebab dari Risiko
Occ
urre
nce Current Controls
Det
ectio
n
5 Pengecekan
Kualitas Bahan Baku
Nilai kulaitas yang diberikan tim
pengadaan tidak sesuai dengan kondisi ikan
sesungguhnya
Bahan baku yang diterima perusahaan lebih jelek sehingga menurunkan kualitas
final product
Kelalaian pekerja yang
bertugas mengecek kualitas bahan baku basah
Pekerja yang bertugas untuk mengecek kualitas merupakan orang yang sudah ahli dibidangnya
sehingga kesalahan dapat diminimalisir sekecil
mungkin
Kualitas tidak sesuai (lebih jelek)
dengan yang dijanjikan supplier bahan baku kering
Kualitas bahan baku turun (downgrade) berpengaruh pada
menurunnya kualitas produk akhir
Perbedaan standar kualitas antara perusahaan dan
supplier, cara kerja/sistem produksi yang berbeda antara perusahaan dan
supplier
Memberikan edukasi mengenai standar mutu dan cara kerja kepada
supplier binaan
Hasil akhir produksi lebih sedikit
Proses sortasi memakan lebih banyak
waktu
6 Melakukan Negosiasi Harga
Harga yang diminta supplier naik (lebih
mahal)
Biaya bahan baku naik dan Cost of Goods
Manufactured meningkat
Kelangkaan bahan baku
Harga bahan baku kering tidak sesuai dengan kualitasnya
Proses negosiasi harga dengan supplier lebih
rumit
Perbedaan standar kualitas bahan baku kering antara perusahaan dan supplier
Memberikan edukasi mengenai standar mutu dan cara kerja kepada
supplier binaan

95
Tabel 4 Daftar Risiko (Lanjutan)
No. Proses Potensi Risiko
(Failure Mode) Potensi Efek yang
Ditimbulkan Risiko Seve
rit
y Potensi Penyebab dari Risiko
Occ
urr
ence
Current Controls
Det
ecti
on
7
Mengecek Ketersediaan Bahan Baku
Kering
Bahan baku tidak tersedia
Menghambat proses produksi sehingga
harus menghentikan kegiatan di lantai
produksi
Kelangkaan bahan baku karena rendahnya hasil
tangkapan laut yang dipengaruhi oleh musim
dan lokasi
Pengadaan bahan baku
kering melalui beberapa supplier di berbagai daerah
8
Proses Pengiriman Bahan Baku Kering dari Supplier ke
PT ICS
Bahan baku rusak dalam perjalan
Kualitas bahan baku turun (downgrade) berpengaruh pada
menurunnya kualitas produk akhir
Proses pengiriman yang terlalu lama dan cold
storage pada truck kurang memadai
Pengiriman dilakukan malam hari untuk
menghindari macet, PT ICS melakukan
pengambilan bahan baku dengan truck milik
perusahaan
Perlu dilakukan proses pemasakan dan
penjemuran ulang
9 Penerimaan Bahan Baku
Basah
Terdapat banyak campuran pada
bahan baku basah
Hasil akhir produksi lebih sedikit
Kondisi laut, cuaca, dan musim Proses sortasi
memakan lebih banyak waktu
10 Penerimaan Bahan Baku
Kering
Kerusakan bahan baku (bau tidak
sedap, warna menguning)
Kualitas bahan baku turun (downgrade) berpengaruh pada
menurunnya kualitas produk akhir
Kurang teliti pada saat
pengecekan bahan baku
Perlu dilakukan proses pemasakan dan
penjemuran ulang

96
Tabel 4 Daftar Risiko (Lanjutan)
No. Proses Potensi Risiko
(Failure Mode) Potensi Efek yang
Ditimbulkan Risiko
Seve
rity
Potensi Penyebab dari Risiko
Occ
urre
nce Current Controls
Det
ectio
n
11
Penerimaan Bahan Baku Penunjang
(Garam, Master Carton, Plastik)
Kesalahan penulisan informasi pada Master Carton
Bisa menyebabkan kesalah pahaman
dengan pihak customer Kesalahan pada proses
percetakan
Melakukan pengecekan terhadap setiap pemesanan
yang dilakukan dan me-review pesanan yang sudah biasa dilakukan
12 Pencucian
Bahan baku tumpah saat proses pencucian
Tonase bahan baku (ikan) berkurang
menyebebkan berkurangnya hasil
akhir dan bertambahnya biaya
bahan baku
Kecerobohan operator (pekerja yang bertugas mencuci ikan), kondisi tempat pencucian licin
Menambahakan alas anti selip
Pekerja terpeleset lantai yang licin
Membahayakan keselamatan pekerja
bahkan hingga menyebabkan luka
ringan maupun berat
Lantai di tempat pencucian cenderung basah dan cukup
licin
Menambahakan alas anti selip, menggunakan sepatu
boot
13 Perebusan
Proses perebusan terlalu lama
Ikan menjadi mudah hancur
Kelalaian operator/pekerja yang bertugas melakukan
perebusan
Membuat standar berapa kali operator harus
mengaduk ikan sebelum ikan bisa diangkat
Proses perebusan terlalu sebentar Ikan menjadi bau
Kelalaian operator/pekerja yang bertugas melakukan
perebusan
Membuat standar berapa kali operator harus
mengaduk ikan sebelum ikan bisa diangkat
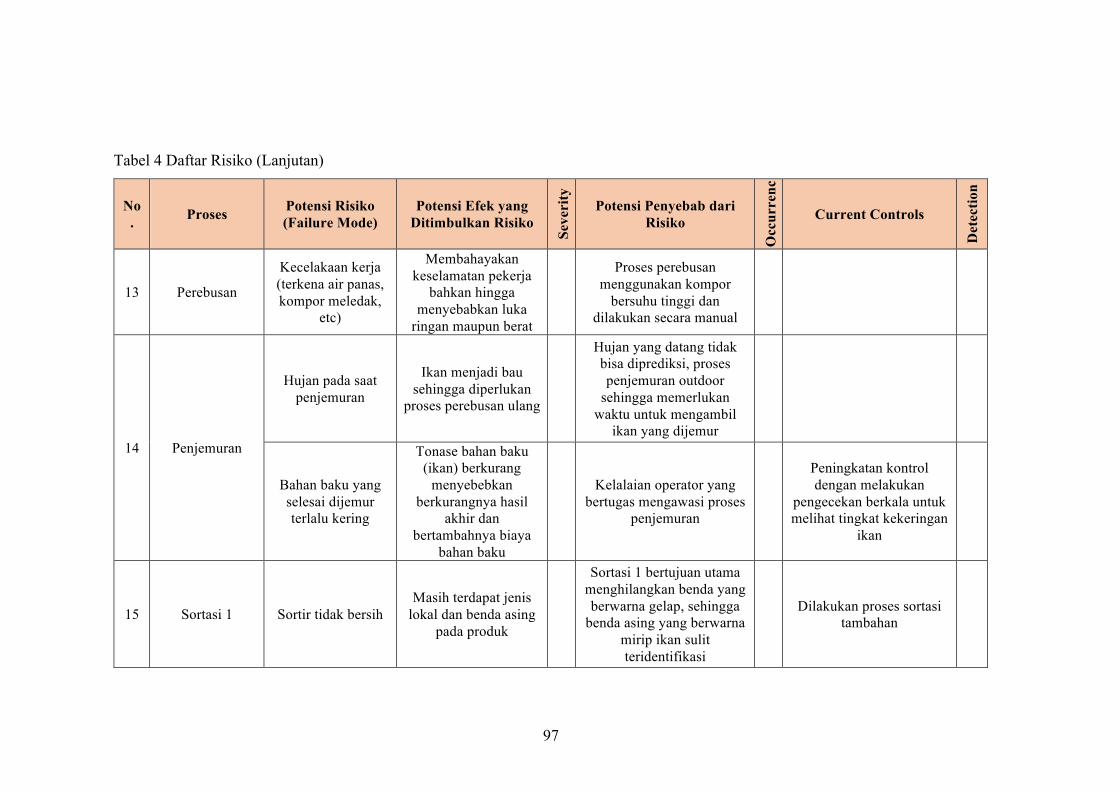
97
Tabel 4 Daftar Risiko (Lanjutan)
No. Proses Potensi Risiko
(Failure Mode) Potensi Efek yang
Ditimbulkan Risiko
Seve
rity
Potensi Penyebab dari Risiko
Occ
urre
nce Current Controls
Det
ectio
n
13 Perebusan
Kecelakaan kerja (terkena air panas, kompor meledak,
etc)
Membahayakan keselamatan pekerja
bahkan hingga menyebabkan luka
ringan maupun berat
Proses perebusan menggunakan kompor
bersuhu tinggi dan dilakukan secara manual
14 Penjemuran
Hujan pada saat penjemuran
Ikan menjadi bau sehingga diperlukan
proses perebusan ulang
Hujan yang datang tidak bisa diprediksi, proses penjemuran outdoor
sehingga memerlukan waktu untuk mengambil
ikan yang dijemur
Bahan baku yang selesai dijemur terlalu kering
Tonase bahan baku (ikan) berkurang
menyebebkan berkurangnya hasil
akhir dan bertambahnya biaya
bahan baku
Kelalaian operator yang
bertugas mengawasi proses penjemuran
Peningkatan kontrol dengan melakukan
pengecekan berkala untuk melihat tingkat kekeringan
ikan
15 Sortasi 1 Sortir tidak bersih Masih terdapat jenis
lokal dan benda asing pada produk
Sortasi 1 bertujuan utama menghilangkan benda yang berwarna gelap, sehingga
benda asing yang berwarna mirip ikan sulit teridentifikasi
Dilakukan proses sortasi tambahan
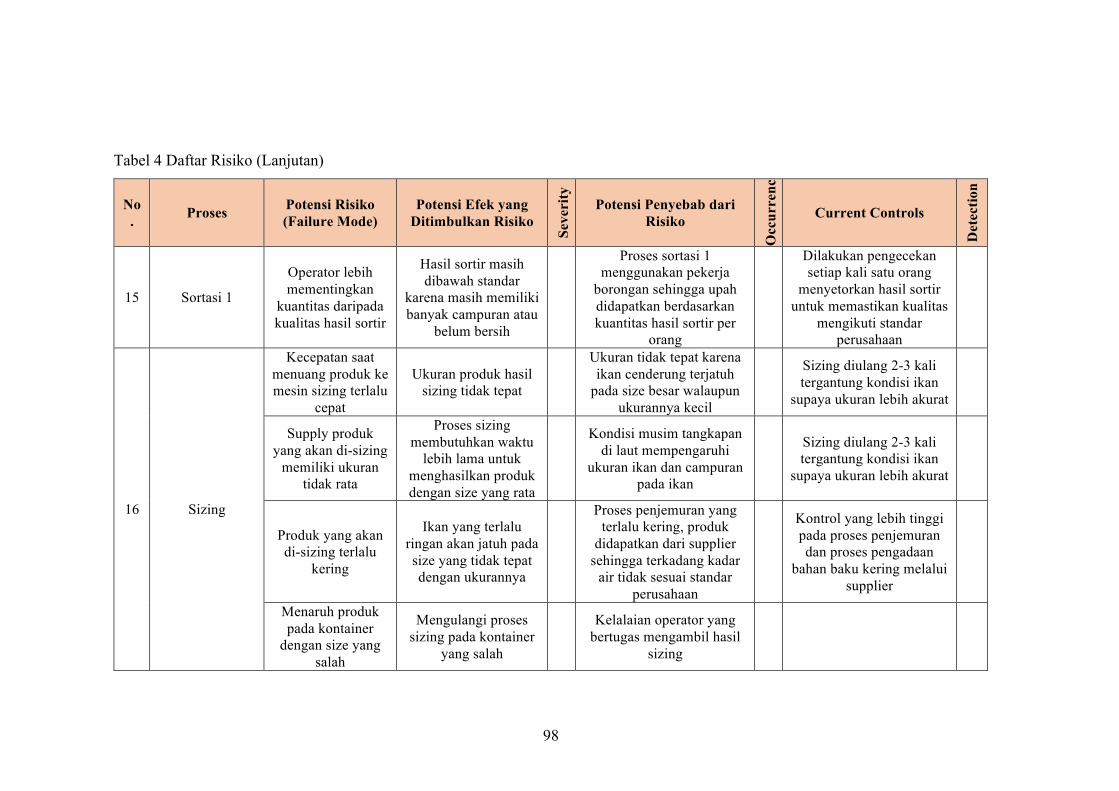
98
Tabel 4 Daftar Risiko (Lanjutan)
No. Proses Potensi Risiko
(Failure Mode) Potensi Efek yang
Ditimbulkan Risiko
Seve
rity
Potensi Penyebab dari Risiko
Occ
urre
nce Current Controls
Det
ectio
n
15 Sortasi 1
Operator lebih mementingkan
kuantitas daripada kualitas hasil sortir
Hasil sortir masih dibawah standar
karena masih memiliki banyak campuran atau
belum bersih
Proses sortasi 1 menggunakan pekerja
borongan sehingga upah didapatkan berdasarkan kuantitas hasil sortir per
orang
Dilakukan pengecekan setiap kali satu orang
menyetorkan hasil sortir untuk memastikan kualitas
mengikuti standar perusahaan
16 Sizing
Kecepatan saat menuang produk ke mesin sizing terlalu
cepat
Ukuran produk hasil sizing tidak tepat
Ukuran tidak tepat karena ikan cenderung terjatuh
pada size besar walaupun ukurannya kecil
Sizing diulang 2-3 kali tergantung kondisi ikan
supaya ukuran lebih akurat
Supply produk yang akan di-sizing
memiliki ukuran tidak rata
Proses sizing membutuhkan waktu
lebih lama untuk menghasilkan produk dengan size yang rata
Kondisi musim tangkapan di laut mempengaruhi
ukuran ikan dan campuran pada ikan
Sizing diulang 2-3 kali tergantung kondisi ikan
supaya ukuran lebih akurat
Produk yang akan di-sizing terlalu
kering
Ikan yang terlalu ringan akan jatuh pada size yang tidak tepat dengan ukurannya
Proses penjemuran yang terlalu kering, produk
didapatkan dari supplier sehingga terkadang kadar
air tidak sesuai standar perusahaan
Kontrol yang lebih tinggi pada proses penjemuran dan proses pengadaan
bahan baku kering melalui supplier
Menaruh produk pada kontainer
dengan size yang salah
Mengulangi proses sizing pada kontainer
yang salah
Kelalaian operator yang bertugas mengambil hasil
sizing
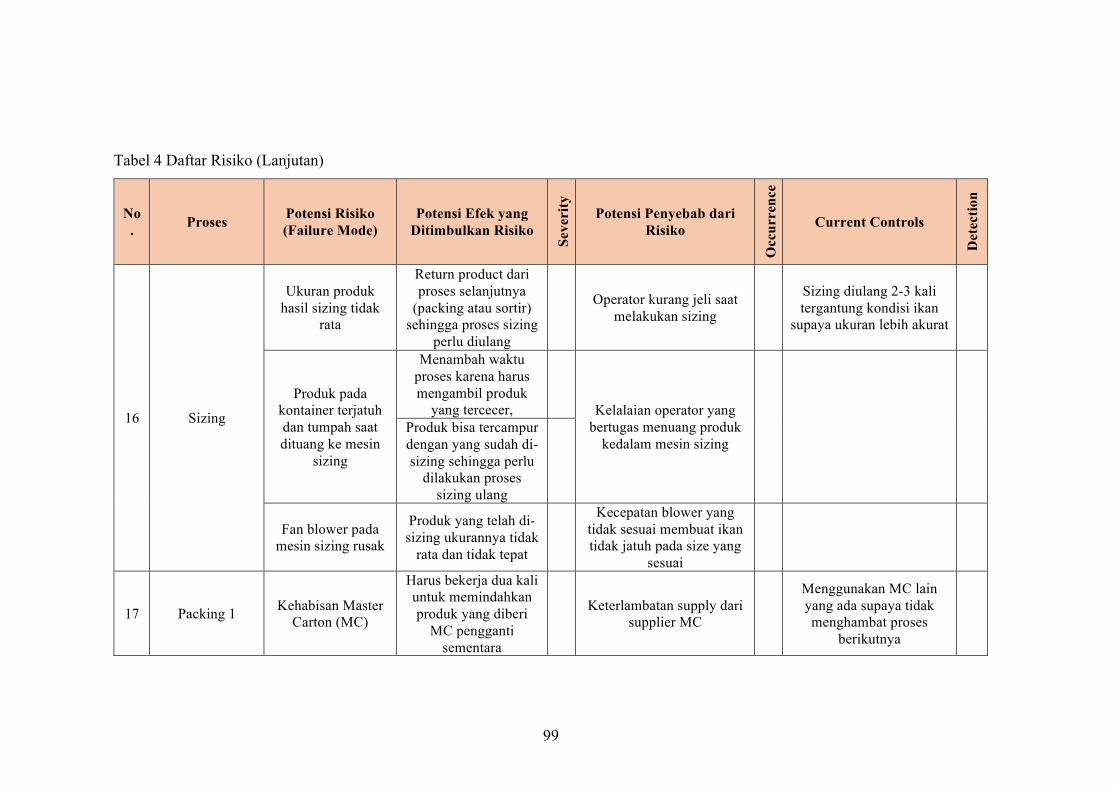
99
Tabel 4 Daftar Risiko (Lanjutan)
No. Proses Potensi Risiko
(Failure Mode) Potensi Efek yang
Ditimbulkan Risiko
Seve
rity
Potensi Penyebab dari Risiko
Occ
urre
nce
Current Controls
Det
ectio
n
16 Sizing
Ukuran produk hasil sizing tidak
rata
Return product dari proses selanjutnya
(packing atau sortir) sehingga proses sizing
perlu diulang
Operator kurang jeli saat melakukan sizing
Sizing diulang 2-3 kali tergantung kondisi ikan
supaya ukuran lebih akurat
Produk pada kontainer terjatuh dan tumpah saat dituang ke mesin
sizing
Menambah waktu proses karena harus mengambil produk
yang tercecer,
Kelalaian operator yang bertugas menuang produk
kedalam mesin sizing Produk bisa tercampur
dengan yang sudah di-sizing sehingga perlu
dilakukan proses sizing ulang
Fan blower pada mesin sizing rusak
Produk yang telah di-sizing ukurannya tidak
rata dan tidak tepat
Kecepatan blower yang tidak sesuai membuat ikan tidak jatuh pada size yang
sesuai
17 Packing 1 Kehabisan Master Carton (MC)
Harus bekerja dua kali untuk memindahkan produk yang diberi
MC pengganti sementara
Keterlambatan supply dari supplier MC
Menggunakan MC lain yang ada supaya tidak menghambat proses
berikutnya

100
Tabel 4 Daftar Risiko (Lanjutan)
No. Proses Potensi Risiko
(Failure Mode) Potensi Efek yang
Ditimbulkan Risiko
Seve
rity
Potensi Penyebab dari Risiko
Occ
urre
nce
Current Controls
Det
ectio
n
18 Finishing/Sortasi 2
Hasil sortasi sebelumnya belum
bersih
Proses sortasi memakan lebih banyak
waktu
Kualitas tangkapan ikan (dipengaruhi oleh musim
dan cuaca) sangat berpengaruh pada kebersihan ikan
Pengecekan pada hasil sortasi 1 sebelum
diserahkan pada proses berikutnya
Sortir tidak bersih Masih terdapat benda asing pada produk Kelelahan mata operator
Dilakukan proses checking oleh inspector untuk setiap
MC produk
Supply produk yang akan disortir memiliki banyak campuran/tidak
bersih
Proses sortasi memakan lebih banyak
waktu
Kondisi musim tangkapan di laut mempengaruhi campuran pada ikan
Tidak mencapai target sortasi
Kebersihan ikan kering dari supplier tidak selalu sama
seperti dari perusahaan (PT ICS)
Late delivery
19 Metal Magnet Magnet tidak
berfungsi dengan baik
Produk jadi masih mengandung logam
Penggunaan metal magnet yang berlebihan dan terlalu
cepat
Melakukan pengecekan metal magnet secara
berkala
20 Final Packing
Kesalahan saat memberikan
stempel kode pada MC
Informasi yang diberikan tidak sesuai
Kelalaian operator (pekerja yang bertugas memberikan
stempel pada MC) Pengecekan ulang
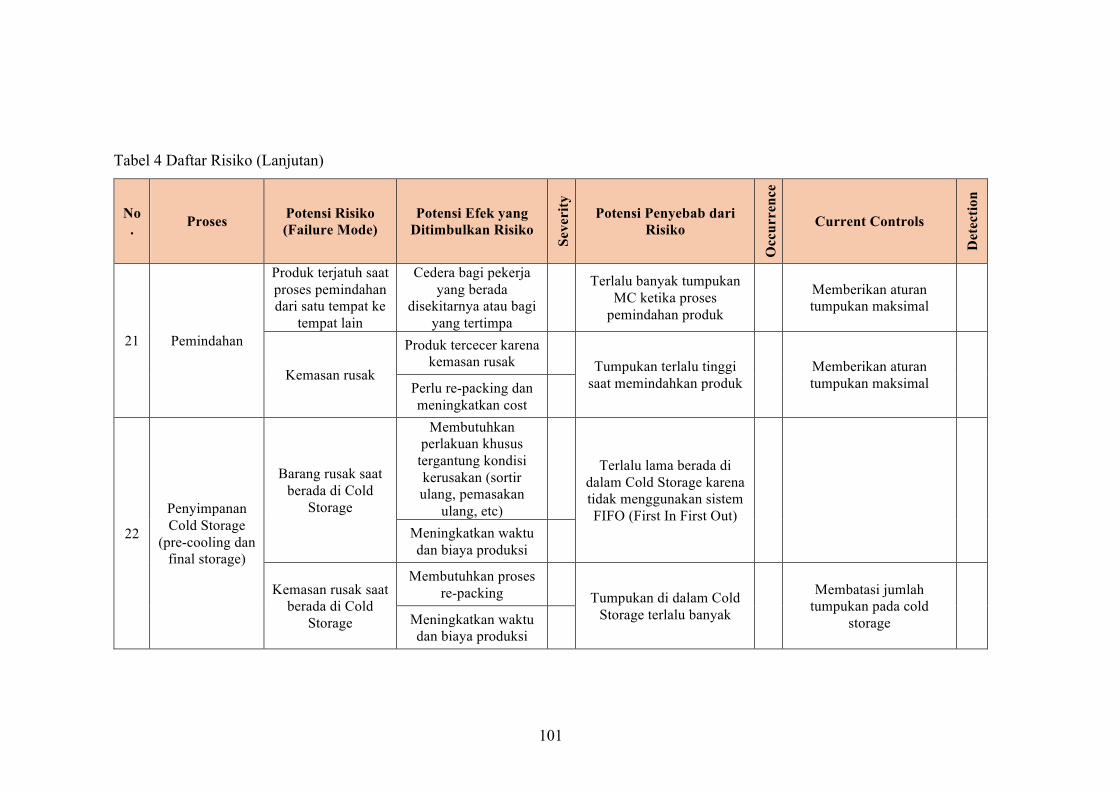
101
Tabel 4 Daftar Risiko (Lanjutan)
No. Proses Potensi Risiko
(Failure Mode) Potensi Efek yang
Ditimbulkan Risiko
Seve
rity
Potensi Penyebab dari Risiko
Occ
urre
nce
Current Controls
Det
ectio
n
21 Pemindahan
Produk terjatuh saat proses pemindahan dari satu tempat ke
tempat lain
Cedera bagi pekerja yang berada
disekitarnya atau bagi yang tertimpa
Terlalu banyak tumpukan
MC ketika proses pemindahan produk
Memberikan aturan tumpukan maksimal
Kemasan rusak
Produk tercecer karena kemasan rusak
Tumpukan terlalu tinggi saat memindahkan produk Memberikan aturan
tumpukan maksimal Perlu re-packing dan meningkatkan cost
22
Penyimpanan Cold Storage
(pre-cooling dan final storage)
Barang rusak saat berada di Cold
Storage
Membutuhkan perlakuan khusus
tergantung kondisi kerusakan (sortir ulang, pemasakan
ulang, etc)
Terlalu lama berada di dalam Cold Storage karena tidak menggunakan sistem FIFO (First In First Out)
Meningkatkan waktu dan biaya produksi
Kemasan rusak saat berada di Cold
Storage
Membutuhkan proses re-packing
Tumpukan di dalam Cold Storage terlalu banyak
Membatasi jumlah tumpukan pada cold
storage
Meningkatkan waktu dan biaya produksi
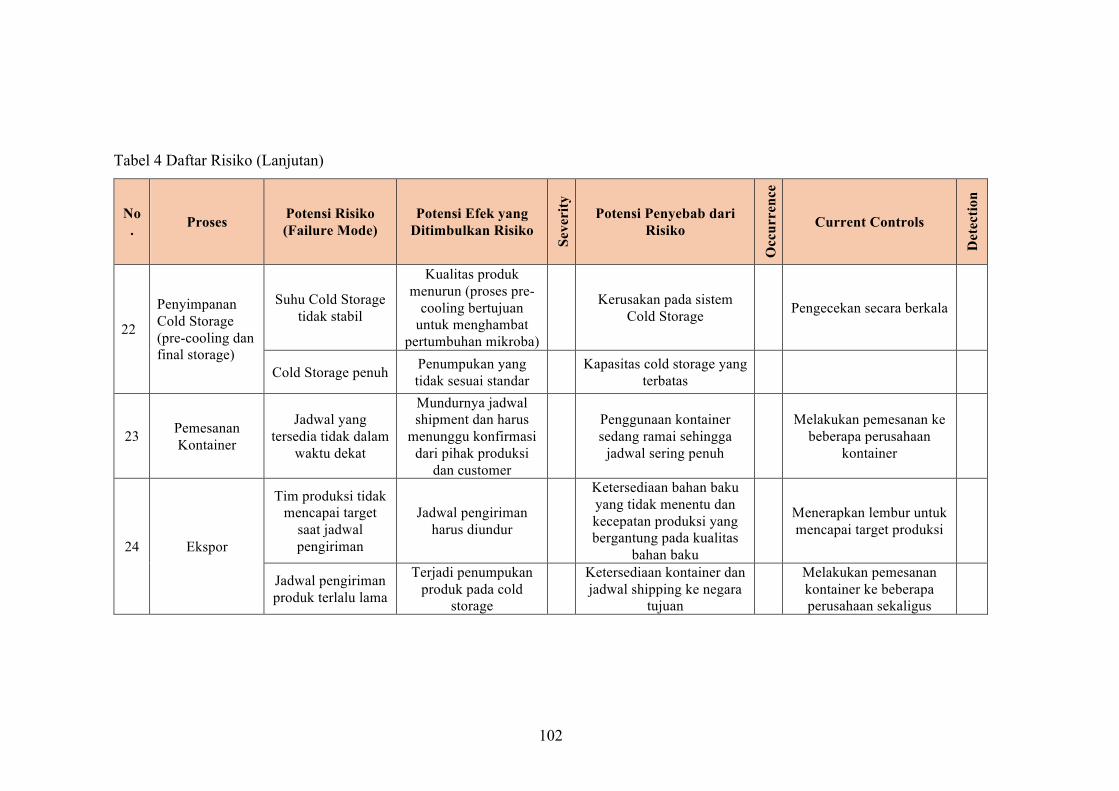
102
Tabel 4 Daftar Risiko (Lanjutan)
No. Proses Potensi Risiko
(Failure Mode) Potensi Efek yang
Ditimbulkan Risiko
Seve
rity
Potensi Penyebab dari Risiko
Occ
urre
nce
Current Controls
Det
ectio
n
22
Penyimpanan Cold Storage (pre-cooling dan final storage)
Suhu Cold Storage tidak stabil
Kualitas produk menurun (proses pre-
cooling bertujuan untuk menghambat
pertumbuhan mikroba)
Kerusakan pada sistem Cold Storage Pengecekan secara berkala
Cold Storage penuh Penumpukan yang tidak sesuai standar Kapasitas cold storage yang
terbatas
23 Pemesanan Kontainer
Jadwal yang tersedia tidak dalam
waktu dekat
Mundurnya jadwal shipment dan harus
menunggu konfirmasi dari pihak produksi
dan customer
Penggunaan kontainer sedang ramai sehingga
jadwal sering penuh
Melakukan pemesanan ke beberapa perusahaan
kontainer
24 Ekspor
Tim produksi tidak mencapai target
saat jadwal pengiriman
Jadwal pengiriman harus diundur
Ketersediaan bahan baku yang tidak menentu dan kecepatan produksi yang bergantung pada kualitas
bahan baku
Menerapkan lembur untuk mencapai target produksi
Jadwal pengiriman produk terlalu lama
Terjadi penumpukan produk pada cold
storage
Ketersediaan kontainer dan jadwal shipping ke negara
tujuan
Melakukan pemesanan kontainer ke beberapa perusahaan sekaligus
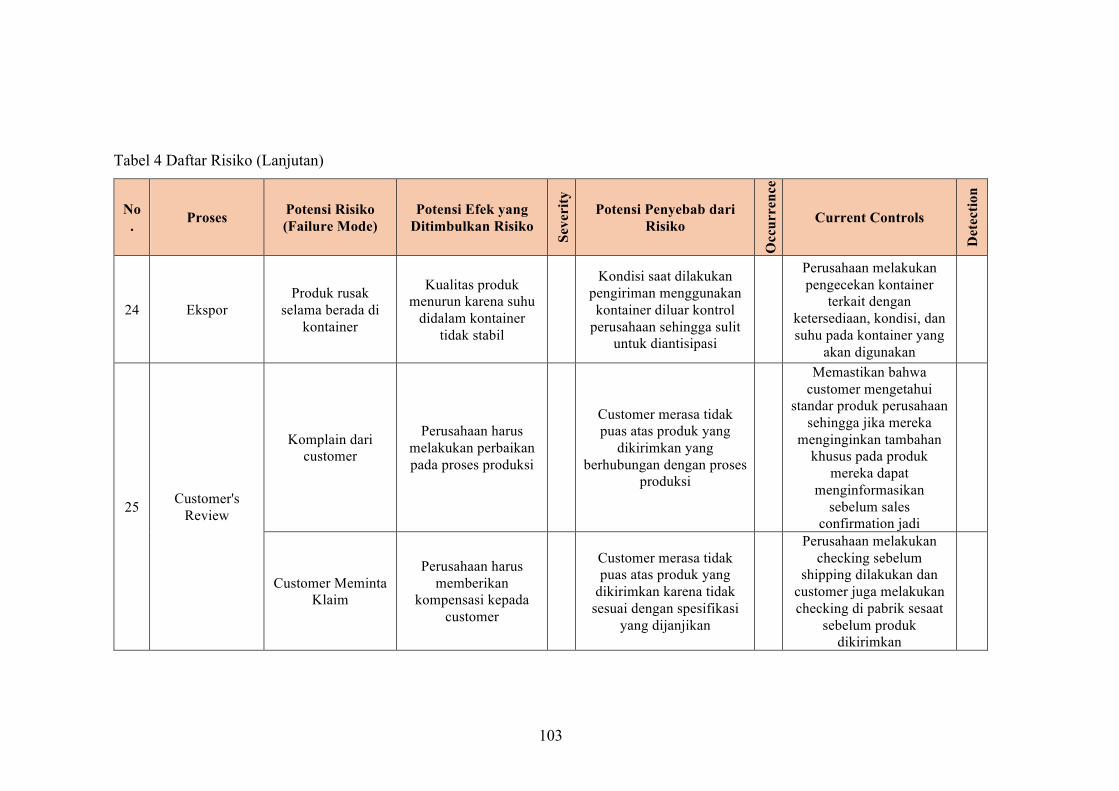
103
Tabel 4 Daftar Risiko (Lanjutan)
No. Proses Potensi Risiko
(Failure Mode) Potensi Efek yang
Ditimbulkan Risiko
Seve
rity
Potensi Penyebab dari Risiko
Occ
urre
nce
Current Controls
Det
ectio
n
24 Ekspor Produk rusak
selama berada di kontainer
Kualitas produk menurun karena suhu
didalam kontainer tidak stabil
Kondisi saat dilakukan pengiriman menggunakan kontainer diluar kontrol
perusahaan sehingga sulit untuk diantisipasi
Perusahaan melakukan pengecekan kontainer
terkait dengan ketersediaan, kondisi, dan suhu pada kontainer yang
akan digunakan
25 Customer's Review
Komplain dari customer
Perusahaan harus melakukan perbaikan pada proses produksi
Customer merasa tidak puas atas produk yang
dikirimkan yang berhubungan dengan proses
produksi
Memastikan bahwa customer mengetahui
standar produk perusahaan sehingga jika mereka
menginginkan tambahan khusus pada produk
mereka dapat menginformasikan
sebelum sales confirmation jadi
Customer Meminta Klaim
Perusahaan harus memberikan
kompensasi kepada customer
Customer merasa tidak puas atas produk yang
dikirimkan karena tidak sesuai dengan spesifikasi
yang dijanjikan
Perusahaan melakukan checking sebelum
shipping dilakukan dan customer juga melakukan checking di pabrik sesaat
sebelum produk dikirimkan

104
(This page is intentionally left blank)
105
BIOGRAPHY
The author, Nisrina Gianindya, was born on 11 December
1995 in Magetan, Indonesia. The author had completed her
formal studies at SDN Pucang I Sidoarjo (2002-2008) for the
elementary school, SMPN 1 Sidoarjo (2008-2011) for the
junior high school, and SMAN 1 Sidoarjo (2011-2014) for the
senior high school. In 2014, the author started to continue her
study in Industrial Engineering Department of Institut Teknologi Sepuluh
Nopember (ITS).
During the study, the author had actively participated in several activities
both inside and outside Intitut Teknologi Sepuluh Nopember. In 2016, the author
was involved in a global volunteering activity conducted by AIESEC. The author
volunteered for one month in Guangzhou, China to teach english to the migrant
workers. Besides that, the author also participated in events held by student
organization in department, INCHALL, as one of the committee. In 2017, the author
was doing an internship at PT General Electric Power Solutions Indonesia in
Surabaya, Indonesia. For further discussion and suggestion regarding to this
research, the author can be reached through email at [email protected].