Assessment of Potential Groundwater Impacts
87
Assessment of Potential Groundwater Impacts Northern Pipeline Project Prepared for: Buena Vista Water Storage District Date: September 15, 2014 Project No: 125941
Transcript of Assessment of Potential Groundwater Impacts

Assessment of Potential Groundwater Impacts
Northern Pipeline Project
Prepared for: Buena Vista Water Storage District
Date: September 15, 2014 Project No: 125941

A S S E S S M E N T O F P O T E N T I A L G R O U N D W A T E R I M P A C T S
ii
Table of Contents
1 Introduction 1 1.1 Project Location 1 1.2 Hydrologic Setting 4
2 Geologic Conditions 7 2.1 Regional Geology 7
Flood Basin Deposits 9 Continental Rock and Deposits 9 Marine Rocks and Deposits 10
2.2 Geologic Structures 10 2.3 Local Geology 11
3 Hydrogeologic Conditions 15 3.1 Perched Aquifer 15 3.2 Perching Bed 19 3.3 Shallow and Deep Aquifers 19 3.4 Confining Beds 19 3.5 Groundwater Levels 20 3.6 Groundwater Flow Direction 27 3.7 Groundwater Gradients 33 3.8 Hydraulic Characteristics 33 3.9 Subsurface Inflow and Outflow Estimates 34 3.10 Groundwater Discharge to Surface Water 34 3.11 Evaporation 37 3.12 Groundwater Storage 37 3.13 Recharge Areas and Sources 38 3.14 Water Supply 39 3.15 Subsidence 42
4 Water Quality 43
5 Baseline Conditions 53 5.1 Baseline Water Balance 54 5.2 Baseline Salt Balance 59
6 Assessment of Project Effects 63 6.1 Approach 63 6.2 Project Effects on Groundwater Levels 64 6.3 Project Effects on Groundwater Quality 67 6.4 Project Effects on Subsidence 70 6.5 Summary of Project Impacts 70

A S S E S S M E N T O F P O T E N T I A L G R O U N D W A T E R I M P A C T S
iii
7 Assessment of Cumulative Effects 72 7.1 Foreseeable Projects and Changes 72
Land Use Changes 72 7.1.1 Climate Change 72 7.1.2
7.2 Approach 73 7.3 Cumulative Effects on Groundwater Levels 73 7.4 Cumulative Effects on Groundwater Quality 74 7.5 Cumulative Effects on Subsidence 74 7.6 Summary of Cumulative Impacts 75 7.7 Impact Evaluation 76 7.8 Mitigation Program 80 7.9 Impacts After Implementation of Mitigation Program 80
8 References 81
Figures Figure 1 Project Location 3 Figure 2 Groundwater Subbasins 5 Figure 3 Proposed Groundwater Subbasins 6 Figure 4 Geology 8 Figure 5 Geologic Cross-Section G-G’ 12 Figure 6 Geologic Cross-Section D-D’ 13 Figure 7 E-Clay Local Extent 14 Figure 8 Monitoring Locations and Aquifer Characteristics Test Locations 17 Figure 9 Perched Water Extent 18 Figure 10 Groundwater Level Comparison DMW01 and BV02D and
BV05A 22 Figure 11 Groundwater Level Comparison DMW01 and BV02D and
BV05A 23 Figure 12 Groundwater Level Comparison DMW03 and BV15 24 Figure 13 Groundwater Level Comparison DMW04 and BV24 and BV26 25 Figure 14 Groundwater Level Comparison DMW05 and BV25 26 Figure 15 Perched Groundwater Level Contours, June 2008 29 Figure 16 Main Aquifer Groundwater Contours, June 2011 30 Figure 17 Main Aquifer Groundwater Contours, June 2013 31 Figure 18 Regional Groundwater Contours, Jan-Feb 1994 32 Figure 19 Perched Groundwater TDS Contours, March 2012 46 Figure 20 Main Aquifer TDS Contours, March 2012 47 Figure 21 TDS Comparison DMW01 and BV02D and BV05A 48 Figure 22 TDS Comparison DMW02 and BV13 49 Figure 23 Groundwater Level Comparison DMW03 and BV15 50 Figure 24 Groundwater Level Comparison DMW04 and BV24 and BV26 51

A S S E S S M E N T O F P O T E N T I A L G R O U N D W A T E R I M P A C T S
iv
Figure 25 Groundwater Level Comparison DMW05 and BV25 52 Figure 26 Year Types and Precipitation 53 Figure 27 Water Budget Diagram 55 Figure 28 Groundwater Level Comparison to Baseline Water Balance –
Perched Aquifer 57 Figure 29 Groundwater Level Comparison to Baseline Water Balance –
Main Aquifer 58 Figure 30 Salinity Comparison to Baseline Salt Balance – Perched Aquifer 61 Figure 31 Salinity Comparison to Baseline Salt Balance – Main Aquifer 62 Figure 32 Project and Cumulative Groundwater Level Comparison to
Baseline Salt Balance - Perched Aquifer 65 Figure 33 Project and Cumulative Groundwater Level Comparison to
Baseline Salt Balance – Main Aquifer 66 Figure 34 Project and Cumulative Salinity Comparison to Baseline Salt
Balance - Perched Aquifer 68 Figure 35 Project and Cumulative Salinity Comparison to Baseline Salt
Balance – Main Aquifer 69
Tables Table 1 Perched Groundwater Body Permeable Sediment Thickness 16 Table 2 Aquifer Hydraulic Characteristics 34 Table 3 Summary of Inflow and Outflow Estimates 36 Table 4 Main Drain Water Reuse Estimates 37 Table 5 Summary of Groundwater in Storage Northern Portion of BSA 38 Table 6 Estimated Groundwater Recharge 39 Table 7 Water Supply Estimates 41 Table 8 Summary of Surface Water Quality 43 Table 9 Project Effects – Groundwater Levels 67 Table 10 Project Effects – Salt Concentrations 70 Table 11 Cumulative Effects – Groundwater Levels 73 Table 12 Cumulative Effects – Groundwater Quality 74
Attachments A Perched Water Zone Hydraulic Characteristics B Groundwater and Salt Balances

A S S E S S M E N T O F P O T E N T I A L G R O U N D W A T E R I M P A C T S
1
1 Introduction
The Buena Vista Water Storage District (BVWSD or District) is seeking to improve their water distribution system, reduce seepage and evaporation losses from canals, and to increase water use efficiency to potentially lower perched groundwater levels beneath the northern portion of the Buttonwillow Service Area (BSA) of the BVWSD. The Northern Area Project (NAP), occurring in the BSA, consists primarily of the installation of 19 miles of buried pipeline and retirement of existing canals. The pipeline would be buried adjacent to the Main Drain Canal and other district facilities, including portions of the East Side and West Side canals. Six miles of lateral canals within the Project area would be buried and may be reclaimed as farmland. Figure 1 shows the extent of the Project area.
Upon completion of the pipeline, the use of the existing West and East Side canals would be minimized in the Northern Area. The East Side and West Side canals would be left intact and would continue to be maintained, but would remain dry except during flood conditions when they could act as groundwater recharge facilities. Portions of the East Side Canal may be reclaimed and placed into conservation at a later date, depending on landowner agreement. The Main Drain Canal would continue to function as a conveyance and drainage facility for irrigation and storm water.
This report evaluates the potential changes to groundwater beneath the Project area as a result of decreasing canal seepage and how it could affect areas outside of BVWSD. The approach used was to evaluate 3 typical years that represent different water supply conditions and then distribute those typical years over a base period. BVWSD identified 2008 as a normal year; 2011 as a wet year; and 2013 as a dry year (BVWSD, 2014) based on their allocation of surface water and precipitation. 2008 was selected as representative of normal operating conditions with a 35 percent from the California Aqueduct allocation, Kern River runoff that was 71 percent of average and annual precipitation approximating the long-term median. 2011 was selected as representative of wet year operating conditions with an 80 percent from the California Aqueduct allocation, Kern River runoff that was 202 percent of average and with precipitation levels that were above average. 2013 was selected as representative of dry year operating conditions with a 35 percent California Aqueduct allocation and Kern River runoff that was 22 percent of average.
1.1 Project Location
BVWSD is located west of Bakersfield along the western edge and southern portion of the San Joaquin Valley and covers a total of about 78.3 square miles west. The BVWSD is lies entirely within Kern County and is subdivided into two separate service areas, the BSA and the Maples Service Area. The BSA covers about 45,000 acres on the west side of the southern San Joaquin Valley groundwater basin. The elongated, northwest-trending BSA is

A S S E S S M E N T O F P O T E N T I A L G R O U N D W A T E R I M P A C T S
2
about 3 miles wide and 24 miles long and bounded to the east by the East Side Canal and to the west by the West Side Canal. The Project is located in the northern half of the BSA. Figure 1 shows the Project location.
The topography of the BSA allows drainage to flow to the center of the service area as the land surface falls to the north towards the former Tulare Lake via the historic low point slough which is now the Main Drain Canal, shown in Figure 1. The Main Drain Canal is over 20 miles long and flows at a gradient of about 2 feet per mile from the southeast portion of the BSA before leaving the District at Highway 46 where it merges with the Goose Lake Canal which conveys water to and beyond the Kern National Wildlife Refuge, approximately eight miles downstream from Highway 46.
The former Tulare Lake is located north of the Project area in Kings County. It was a freshwater dry lake with residual wetlands and marshes. The lake dried up after its tributary rivers were diverted for agricultural irrigation and municipal water uses.
The Goose Lake Slough area is an area extending through the northeastern portion of the Project area and outside the Project area to the southeast. This area now consists of undeveloped land on the San Joaquin Valley floor between the Buttonwillow and Semitropic ridges. Land uses in the area include generally dry habitat lands; three wildlife management areas managed by California Department of Fish and Game; marginal farmlands; and managed wetlands that receive water from nearby canals.

A S S E S S M E N T O F P O T E N T I A L G R O U N D W A T E R I M P A C T S
3
Figure 1 Project Location

A S S E S S M E N T O F P O T E N T I A L G R O U N D W A T E R I M P A C T S
4
1.2 Hydrologic Setting
The Central Valley of California consists of the San Joaquin and the Sacramento valleys. The San Joaquin Valley, forming the southern two-thirds of the Central Valley, is a broad structural trough. It is bordered on the east by the Sierra Nevada and on the west by the Diablo and the Temblor ranges, which are a part of the Coast Ranges. The valley extends 220 miles southeastward from the confluence of the San Joaquin and the Sacramento rivers to the Tehachapi and the San Emigdio Mountains. The width of the valley ranges from 25 miles in the northern portion of the valley to 55 miles in the southern portion, and averages about 35 miles (USGS, 1972).
BVWSD is located in the southwestern portion of the San Joaquin Valley. The southern portion of the valley is internally drained by the Kings, Kaweah, Tule, and Kern rivers that flow into the Tulare drainage basin including the beds of the former Tulare, Buena Vista, and Kern lakes.
BVWSD is located within the western edge of the Kern County groundwater subbasin (DWR, 2004). The subbasin is bounded on the north by the Kern County line and the Pleasant Valley, Tulare Lake, and Tule groundwater subbasins, on the east and southeast by the Sierra Nevada foothills and Tehachapi Mountains, and on the southwest and west by the San Emigdio Mountains and Coast Ranges. Principal rivers and streams include Kern River and Poso Creek. Figure 2 shows the groundwater subbasin and the BVWSD service area.
The Kern County groundwater subbasin has been proposed to be further divided into multiple subbasins solely based on geologic structures (Pacific, 1991). Figure 3 shows the proposed subbasins. The subbasins are bounded by distinct structural highs due to folding and faulting. Some of these structural highs are expressed by the slight topographic relief of the Buttonwillow and Semitropic ridges which rise above the valley floor and are located just east of the BSA. These subbasins may contain isolated or partially isolated hydrogeologic systems. BVWSD is predominantly within the proposed Buttonwillow subbasin. The subbasin is defined on its east and west sides by anticlines but there may be low areas along some boundaries where communication between subbasins may occur.
The Kern County subbasin has been classified by DWR as a critically overdrafted groundwater basin (DWR, 2004). However, as described above, data on local geology and groundwater conditions within BVWSD suggest that the District is substantially isolated from much of the Kern County groundwater subbasin and that this isolation, coupled with the District’s access to surface water, leads to groundwater supply conditions within the District’s boundaries that differ from those characteristic of many other locations within Kern County. Groundwater levels beneath the entire BVWSD service area rose about 6.8 feet since 1974 (CEC, 2013) indicating that the Buttonwillow subbasin is not in overdraft.

A S S E S S M E N T O F P O T E N T I A L G R O U N D W A T E R I M P A C T S
5
Figure 2 Groundwater Subbasins

A S S E S S M E N T O F P O T E N T I A L G R O U N D W A T E R I M P A C T S
6
Figure 3 Proposed Groundwater Subbasins
A S S E S S M E N T O F P O T E N T I A L G R O U N D W A T E R I M P A C T S
7
2 Geologic Conditions
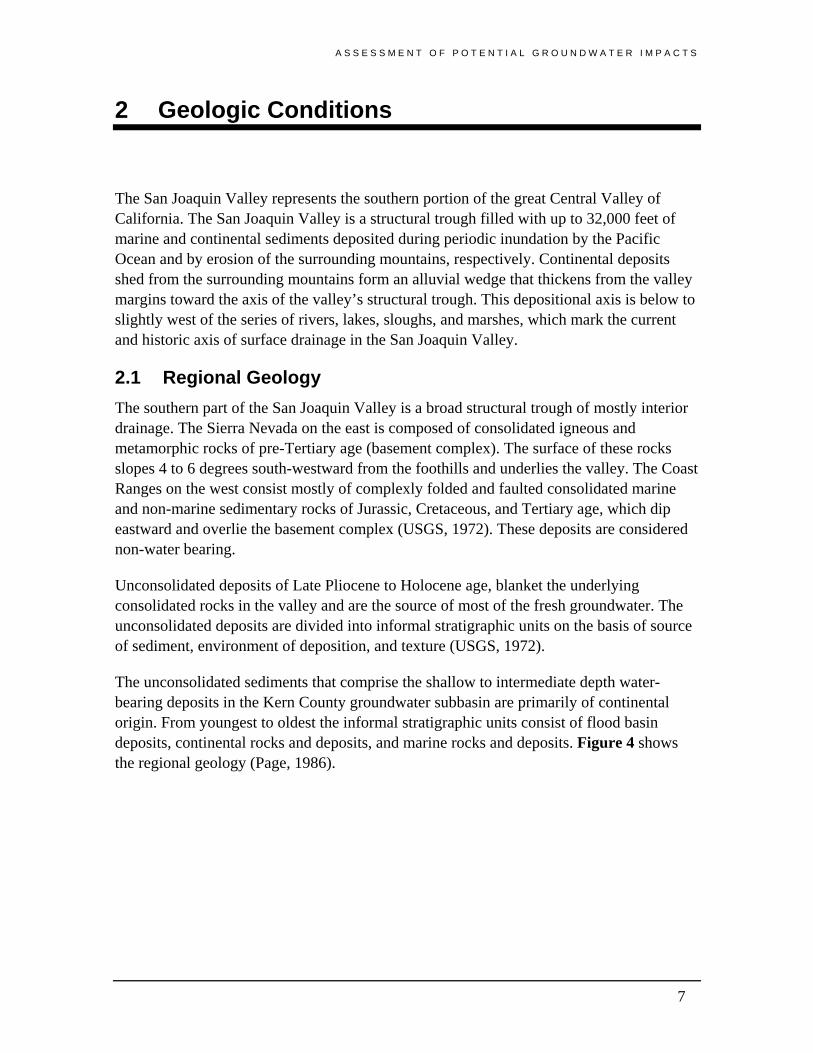
The San Joaquin Valley represents the southern portion of the great Central Valley of California. The San Joaquin Valley is a structural trough filled with up to 32,000 feet of marine and continental sediments deposited during periodic inundation by the Pacific Ocean and by erosion of the surrounding mountains, respectively. Continental deposits shed from the surrounding mountains form an alluvial wedge that thickens from the valley margins toward the axis of the valley’s structural trough. This depositional axis is below to slightly west of the series of rivers, lakes, sloughs, and marshes, which mark the current and historic axis of surface drainage in the San Joaquin Valley.
2.1 Regional Geology
The southern part of the San Joaquin Valley is a broad structural trough of mostly interior drainage. The Sierra Nevada on the east is composed of consolidated igneous and metamorphic rocks of pre-Tertiary age (basement complex). The surface of these rocks slopes 4 to 6 degrees south-westward from the foothills and underlies the valley. The Coast Ranges on the west consist mostly of complexly folded and faulted consolidated marine and non-marine sedimentary rocks of Jurassic, Cretaceous, and Tertiary age, which dip eastward and overlie the basement complex (USGS, 1972). These deposits are considered non-water bearing.
Unconsolidated deposits of Late Pliocene to Holocene age, blanket the underlying consolidated rocks in the valley and are the source of most of the fresh groundwater. The unconsolidated deposits are divided into informal stratigraphic units on the basis of source of sediment, environment of deposition, and texture (USGS, 1972).
The unconsolidated sediments that comprise the shallow to intermediate depth water-bearing deposits in the Kern County groundwater subbasin are primarily of continental origin. From youngest to oldest the informal stratigraphic units consist of flood basin deposits, continental rocks and deposits, and marine rocks and deposits. Figure 4 shows the regional geology (Page, 1986).

A S S E S S M E N T O F P O T E N T I A L G R O U N D W A T E R I M P A C T S
8
Figure 4 Geology
A S S E S S M E N T O F P O T E N T I A L G R O U N D W A T E R I M P A C T S
9
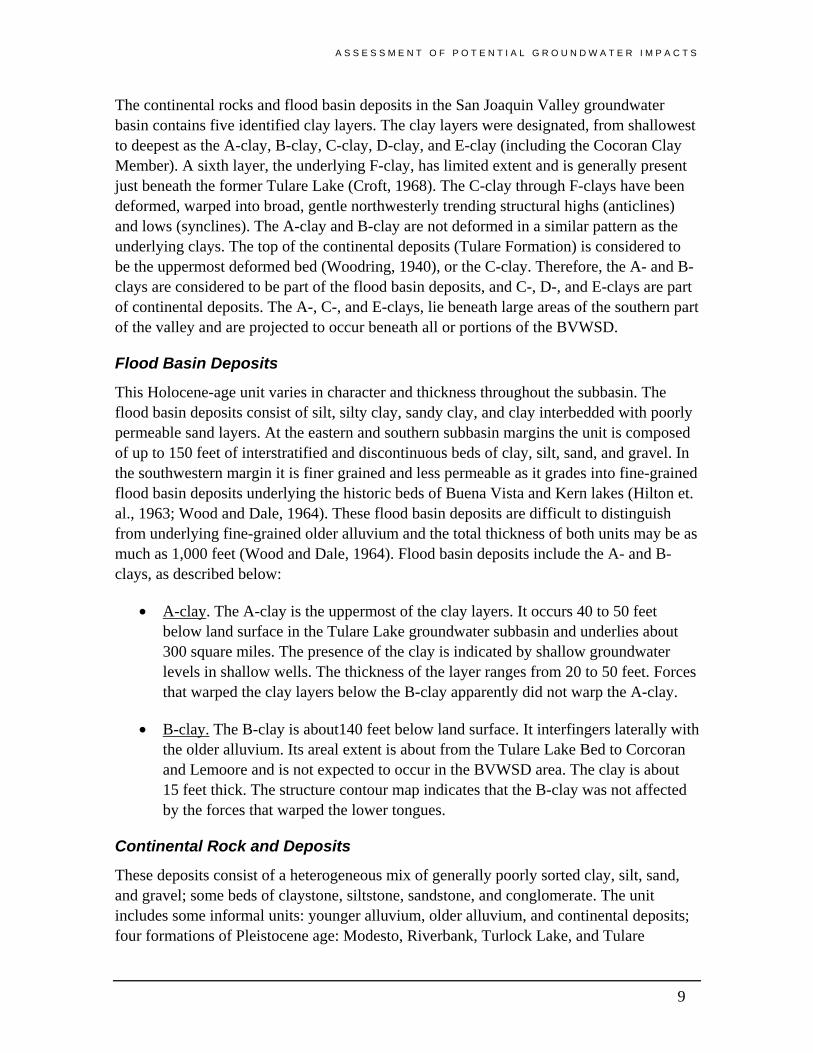
The continental rocks and flood basin deposits in the San Joaquin Valley groundwater basin contains five identified clay layers. The clay layers were designated, from shallowest to deepest as the A-clay, B-clay, C-clay, D-clay, and E-clay (including the Cocoran Clay Member). A sixth layer, the underlying F-clay, has limited extent and is generally present just beneath the former Tulare Lake (Croft, 1968). The C-clay through F-clays have been deformed, warped into broad, gentle northwesterly trending structural highs (anticlines) and lows (synclines). The A-clay and B-clay are not deformed in a similar pattern as the underlying clays. The top of the continental deposits (Tulare Formation) is considered to be the uppermost deformed bed (Woodring, 1940), or the C-clay. Therefore, the A- and B-clays are considered to be part of the flood basin deposits, and C-, D-, and E-clays are part of continental deposits. The A-, C-, and E-clays, lie beneath large areas of the southern part of the valley and are projected to occur beneath all or portions of the BVWSD.
Flood Basin Deposits
This Holocene-age unit varies in character and thickness throughout the subbasin. The flood basin deposits consist of silt, silty clay, sandy clay, and clay interbedded with poorly permeable sand layers. At the eastern and southern subbasin margins the unit is composed of up to 150 feet of interstratified and discontinuous beds of clay, silt, sand, and gravel. In the southwestern margin it is finer grained and less permeable as it grades into fine-grained flood basin deposits underlying the historic beds of Buena Vista and Kern lakes (Hilton et. al., 1963; Wood and Dale, 1964). These flood basin deposits are difficult to distinguish from underlying fine-grained older alluvium and the total thickness of both units may be as much as 1,000 feet (Wood and Dale, 1964). Flood basin deposits include the A- and B-clays, as described below:
• A-clay. The A-clay is the uppermost of the clay layers. It occurs 40 to 50 feet below land surface in the Tulare Lake groundwater subbasin and underlies about 300 square miles. The presence of the clay is indicated by shallow groundwater levels in shallow wells. The thickness of the layer ranges from 20 to 50 feet. Forces that warped the clay layers below the B-clay apparently did not warp the A-clay.
• B-clay. The B-clay is about140 feet below land surface. It interfingers laterally with the older alluvium. Its areal extent is about from the Tulare Lake Bed to Corcoran and Lemoore and is not expected to occur in the BVWSD area. The clay is about 15 feet thick. The structure contour map indicates that the B-clay was not affected by the forces that warped the lower tongues.
Continental Rock and Deposits
These deposits consist of a heterogeneous mix of generally poorly sorted clay, silt, sand, and gravel; some beds of claystone, siltstone, sandstone, and conglomerate. The unit includes some informal units: younger alluvium, older alluvium, and continental deposits; four formations of Pleistocene age: Modesto, Riverbank, Turlock Lake, and Tulare

A S S E S S M E N T O F P O T E N T I A L G R O U N D W A T E R I M P A C T S
10
formations. Beneath the BVWSD, only the Tulare Formation is present (Rector, 1983) and is the primary fresh water bearing formation in the area and much of the Kern County groundwater subbasin. Continental deposits include the C-, D-, and E-clays, described below:
• C-clay. The C-clay occurs about 100 to 210 feet above the D-clay. The thickness of the C-clay ranges from about 10 feet near Riverdale to about 100 feet near Corcoran and averages about 30 feet. Warping of the C-clay has formed troughs and shelves that are nearly identical in position to the troughs and shelves in the D-, E-, and F-clays. However, the intensity of deformation is less than the deformation in the lower clay layers.
• D-clay. The D-clay occurs 60 to 190 feet above the E-clay. This clay zone was mapped in a narrow belt, which extends from Lemoore to Corcoran and is not expected to occur in the BVWSD area. The clay layer ranges from 5 to 20 feet thick.
• E-clay (in part equivalent to the Corcoran Clay Member of the Tulare Formation). The dark greenish blue-gray, silty, diatomaceous E-clay is one of the largest confining beds in the area. The beds were deposited in a prehistoric lake that occupied the San Joaquin Valley and underlies about 3,500 square miles of bottom land in the valley and into the western slopes (Croft, 1972). The extent of the E-clay was further updated in 1986 and showed a greater areal extent. In recognition of these differences the name “modified E-clay” was proposed to describe the mapped clay unit (Page, 1986).
Marine Rocks and Deposits
These deposits consist of sand clay, silt, sandstone, shale, mudstone, and siltstone. On the western side of valley these deposits include the San Joaquin, Etchegoin, Temblow and Kreyenhagen formations. They are exposed in the surrounding watershed to the west of BVWSD and underlie the freshwater bearing continental deposits and overlie the bedrock. These sediments are considered to be non-water bearing.
2.2 Geologic Structures
The sediments deposited in the Kern County groundwater subbasin were deposited into a large trough that has since been compressed and subsided which has resulted in the sediments being folded into troughs and ridges, known in geologic terms as synclines and anticlines, respectively. In general, the anticlines are the Bakersfield arch, and the Buttonwillow and Semitropic ridges. The Buttonwillow and Semitropic ridges are surface expressions of two prominent north-south trending anticlines. Figure 4 shows their locations. The intervening topographic troughs are the surface expressions of prominent

A S S E S S M E N T O F P O T E N T I A L G R O U N D W A T E R I M P A C T S
11
synclines (Croft, 1968). The synclines or troughs typically contain a significantly thicker sequence of young sediments than do the anticlines or broad highs (Pacific, 1991).
Associated with the Buttonwillow and Semitropic anticlines are two concealed faults (CGS, 1991) that dip to the west. The faults are not active and do not extend to ground surface.
2.3 Local Geology
The BSA is located between the Buttonwillow and Semitropic ridges (topographic features) on the east, and the Coast Ranges on the west. The BSA is underlain by Tulare Formation and contains sand from about 200 to 400 feet below ground surface (bgs), which is used by most wells in the region to supply water.
Three of the clay layers identified in regional geology are present in the BSA area. The A-clay extent was poorly defined but was estimated to be at depths of about 20 to 30 feet bgs and is the cause of shallow groundwater levels in the Tulare Lake groundwater subbasin, which adjoins the Kern County groundwater basin to the north (Croft 1972). The Tulare Lake formation in the area also contains the C-clay and E-clays. Figures 5 and 6 show geologic cross sections in the BSA area. In the cross sections, both the C-clay and E-clays are warped and folded into east-west trending troughs (synclines) and ridges (anticlines) different than the Buttonwillow Ridge and Semitropic Ridge anticline trends. The E-clay ranges from about 300 to 450 feet bgs beneath the northern portions of the BSA. To the west both the E-clay and C-clay pinch out and the coarse-grained sediments found elsewhere in the subbasin are separated are combined.
There are varying interpretations of the extent of the E-clay. Reports prepared in 1972 and in 1991 show the E-clay to be continuous across the Buttonwillow and Semitropic ridges and their associated anticlines (Croft, 1972; Pacific, 1991). However, work by the United States Geologic Survey (USGS), which was used to prepare the Central Valley Hydrologic Model (CVHM) groundwater flow model, shows the E-clay does not extend across the Buttonwillow and Semitropic ridges and their associated anticlines. Figure 7 shows the extent of the modified E-clay and the contours of the top of the clay bed. It is possible the anticlines of the Buttonwillow and Semitropic ridges predate the E-clay and therefore the clay was not deposited onto these ridges. If this were the case, sedimentary beds on the east and west sides of the ridges would not be continuous unless they were deposited between the ridges.

A S S E S S M E N T O F P O T E N T I A L G R O U N D W A T E R I M P A C T S
12
Figure 5 Geologic Cross-Section G-G’

A S S E S S M E N T O F P O T E N T I A L G R O U N D W A T E R I M P A C T S
13
Figure 6 Geologic Cross-Section D-D’

A S S E S S M E N T O F P O T E N T I A L G R O U N D W A T E R I M P A C T S
14
Figure 7 E-Clay Local Extent
A S S E S S M E N T O F P O T E N T I A L G R O U N D W A T E R I M P A C T S
15
3 Hydrogeologic Conditions
This chapter presents the definition and extent of aquifers present in the area, the depth and direction of groundwater flow, and the aquifer hydraulic characteristics. Sections 3.1 through 3.4 describe the hydrogeologic character of the northern portion of the BSA from ground surface to depth. There are three main aquifers, the perched aquifer, the shallow aquifer, and the deep aquifer. Sections 3.5 through 3.15 describe the groundwater levels, hydraulic characteristics, groundwater movement, and groundwater quality in these three aquifers. Water supply conditions area also discussed along with subsidence.
3.1 Perched Aquifer
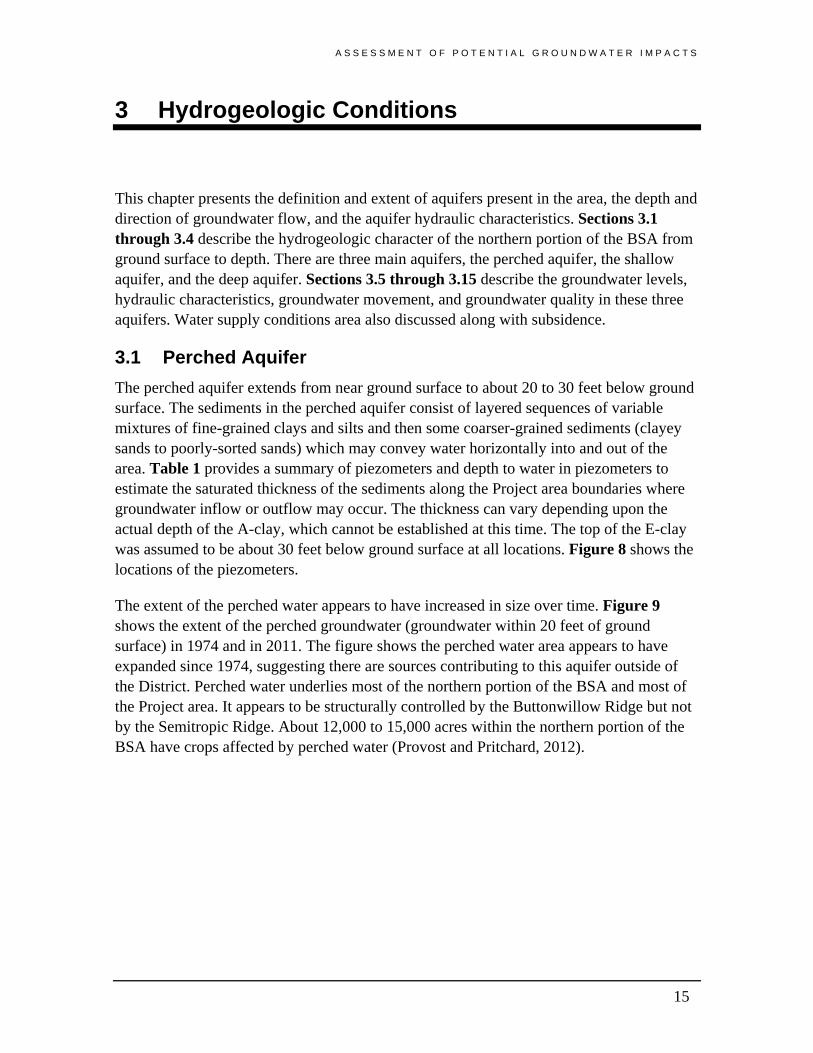
The perched aquifer extends from near ground surface to about 20 to 30 feet below ground surface. The sediments in the perched aquifer consist of layered sequences of variable mixtures of fine-grained clays and silts and then some coarser-grained sediments (clayey sands to poorly-sorted sands) which may convey water horizontally into and out of the area. Table 1 provides a summary of piezometers and depth to water in piezometers to estimate the saturated thickness of the sediments along the Project area boundaries where groundwater inflow or outflow may occur. The thickness can vary depending upon the actual depth of the A-clay, which cannot be established at this time. The top of the E-clay was assumed to be about 30 feet below ground surface at all locations. Figure 8 shows the locations of the piezometers.
The extent of the perched water appears to have increased in size over time. Figure 9 shows the extent of the perched groundwater (groundwater within 20 feet of ground surface) in 1974 and in 2011. The figure shows the perched water area appears to have expanded since 1974, suggesting there are sources contributing to this aquifer outside of the District. Perched water underlies most of the northern portion of the BSA and most of the Project area. It appears to be structurally controlled by the Buttonwillow Ridge but not by the Semitropic Ridge. About 12,000 to 15,000 acres within the northern portion of the BSA have crops affected by perched water (Provost and Pritchard, 2012).

A S S E S S M E N T O F P O T E N T I A L G R O U N D W A T E R I M P A C T S
16
Table 1 Perched Groundwater Body Permeable Sediment Thickness
Estimated
Piezometer Depth Piezometer Total Depth A-clay
No. (feet) (feet)BR01 20.0 30 6.3 8.7 11.1 23.7 21.3 18.9BR02A 20.0 30 - - - - - -BR03 20.0 30 13.7 13.5 14.2 16.3 16.5 15.8BR04A 20.0 30 2.9 4.0 6.5 27.1 26.0 23.5BV07B 20.2 30 3.4 - - 26.6BV07C 22.8 30 - - - - - -BR09 20.0 30 - - - - - -BV34 22.0 30 2.0 4.0 12.6 28.0 26.0 17.4
24.3 22.5 18.9
BV02C 23.1 30 8.8 9.8 9.4 21.2 20.2 20.6BV02B 23.4 30 5.9 7.2 7.3 24.1 22.8 22.7
22.7 21.5 21.7
BV05 25.0 30 4.8 6.1 9.1 25.2 23.9 20.9BV08B 20.9 30 1.5 4.3 4.2 28.5 25.7 25.8
26.9 24.8 23.4
BV15 22.1 30 0.7 6.2 8.3 29.3 23.8 21.7BV16 20.0 30 0.9 5.6 8.0 29.1 24.4 22.0
29.2 24.1 21.9
BV34 22.0 30 2.0 4.0 12.6 28.0 26.0 17.4BV35 22.0 30 7.8 8.0 15.0 22.2 22.0 15.0BV30 21.0 30 7.4 8.1 14.3 22.6 21.9 15.7BV31 19.0 30 4.0 9.1 10.8 26.0 20.9 19.2BV32 20.0 30 11.3 11.9 13.6 18.7 18.1 16.4BV33 20.0 30 10.2 13.1 15.8 19.8 16.9 14.2
22.9 21.0 16.3
NortheastAverage Saturated Thickness (feet)
SoutheastAverage Saturated Thickness (feet)
South
Average Saturated Thickness (feet)
Saturated Sediment Thickness (feet)
2008 2011 2013 2008 2011 2013
Outflow or Inflow Reach
Depth to Water(feet)
West Side
Average Saturated Thickness (feet)
North SideAverage Saturated Thickness (feet)

A S S E S S M E N T O F P O T E N T I A L G R O U N D W A T E R I M P A C T S
17
Figure 8 Monitoring Locations and Aquifer Characteristics Test Locations

A S S E S S M E N T O F P O T E N T I A L G R O U N D W A T E R I M P A C T S
18
Figure 9 Perched Water Extent

A S S E S S M E N T O F P O T E N T I A L G R O U N D W A T E R I M P A C T S
19
3.2 Perching Bed
The A-clay layer is likely the perching bed. The A-clay has been shown to extend beneath this area at a depth of about 20 to 30 feet, but is poorly defined. The extent of the clay can be approximated to correlate with where perched water is occurring, as shown on Figure 9. The clay may extend beyond the outline shown for the extent of the perched water.
3.3 Shallow and Deep Aquifers
The groundwater aquifers under the BSA consist of sequences of interbedded, laterally discontinuous, sandy and silty sediments. The shallow aquifer extends from the base of the A-clay down to a depth of about 200 feet where silty sediments tend to predominate. The C-clay occurs at about this depth and may separate the shallow aquifer from the deep aquifer. The deep aquifer extends from about 200 to 400 feet with sandy and silty sediments occurring in approximately equal proportion. This deep aquifer is being used by most growers within BVWSD.
The majority of irrigation wells in the District are completed to depths between 200 and 500 feet with perforated intervals around 150 feet to the bottom (BVWSD, 2014). Wells in the area adjacent to BVWSD are also likely completed in this manner.
To the west both the C-clay and the E-clay pinch out and the coarse-grained sediments near the mountain front are continuous and allow deep percolation of precipitation runoff from the Coast Range bedrock and marine sediments to recharge the aquifers.
3.4 Confining Beds
The C-clay and E-clay are present beneath the northern portions of the BSA as shown on Figure 5. Little information is known about the C-clay and whether it may be a vertical barrier to groundwater flow. However, due to its relatively large extent and its approximately 30-foot thickness, it is likely to result in semi-confining conditions to the underlying deep aquifer beneath the BSA. Based on its depth beneath the BSA it may separate the shallow aquifer from the deeper aquifer.
The E-clay is known regionally to be a barrier to groundwater flow, but it is not impermeable. It generally divides the aquifers system into unconfined aquifers above and confined aquifers below. The clay layer is about 300 to 450 feet bgs beneath the northern portions of the BSA and is folded with two northwest-southeast trending troughs and ridges. Within the northern part of the BSA, where the deep aquifer is present and where the water quality is good, groundwater wells are typically constructed above the E-clay, but some wells appear to be constructed into sediments beneath the E-clay. Groundwater quality beneath the E-clay may be poor quality because of recharge from the marine sediments of the Coast Ranges. East of the Buttonwillow and Semitropic ridges wells are constructed both above and below the E-clay as the groundwater in this area is typically of better quality.

A S S E S S M E N T O F P O T E N T I A L G R O U N D W A T E R I M P A C T S
20
3.5 Groundwater Levels
BVWSD has been measuring groundwater levels since about 1991 in the perched aquifer and in the deep aquifer (for purposes of discussion, the shallow and deep aquifers hereafter are described as the “main aquifer.”). No monitoring wells have been constructed to monitor just the shallow aquifer so it is being presumed that the shallow aquifer is behaving similarly to the deep aquifer.
The perched aquifer is monitored with a network of 58 piezometers. The piezometer locations are shown on Figure 8. Other piezometers in the network have been monitored quarterly since 2000, but not necessarily all piezometers were measured at a similar time.
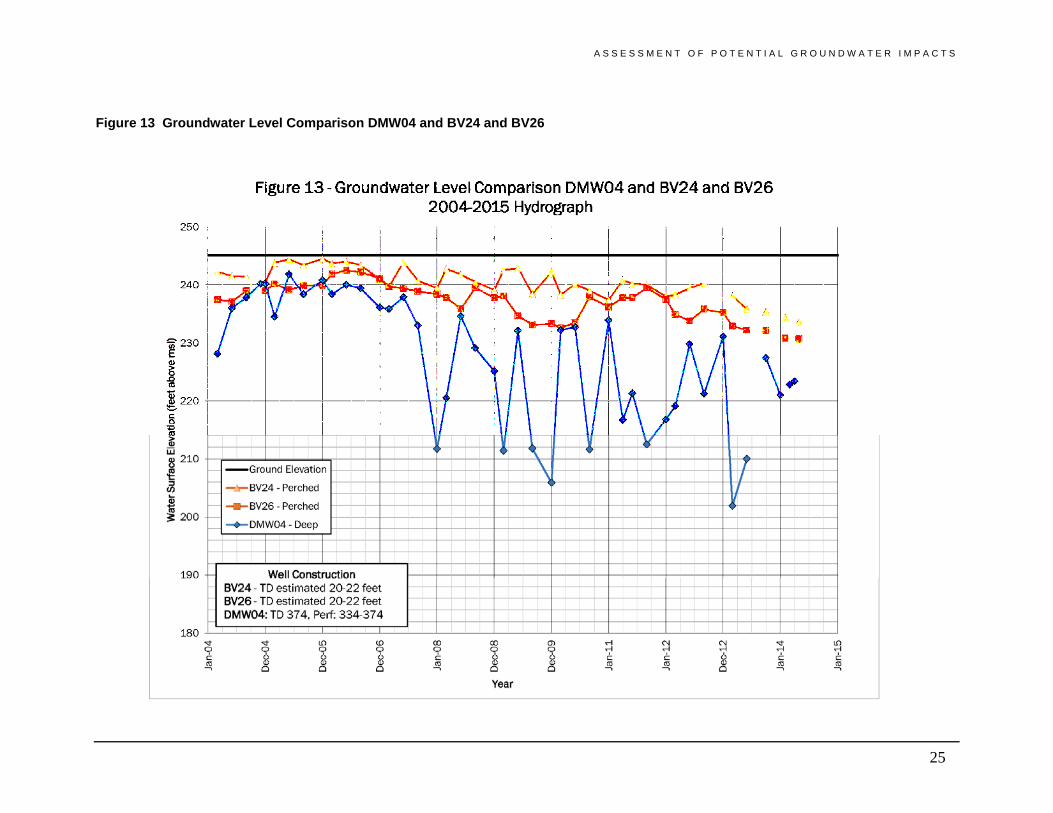
The depth to groundwater in the perched aquifer in the northern portion of the BSA has ranged from about 2 to 12 feet bgs over the last 20 years (Provost and Pritchard, 2012). Figures 10 through 14 show the groundwater levels within the Project area. Groundwater levels have been relatively constant through at least 2006 and in some cases up to 2012. The levels have typically been within 2 to 4 feet of ground surface in most piezometers. Groundwater levels since 2012 have declined predominately due to the extended drought. When the groundwater levels have been within 6 feet of ground surface, groundwater in the perched aquifer could discharge to the Main Drain Canal. In 2008, groundwater levels within the Project area were less than 5 feet bgs, over a large area of about 2,800 acres.
The depth to groundwater below ground surface in the main aquifer in the Project area is typically about 2 to 70 feet bgs with some deeper levels recorded during the summer peak pumping periods. The locations of monitoring wells (DMW series) are shown on Figure 8. Figures 10 through 14 show the groundwater levels within the Project area. The groundwater levels remained relatively consistent from 1992 through about 2007. Since 2007, the groundwater levels have been about 10 feet lower in some areas but in other areas the decreases are much less, in some locations less than 2 feet. Generally groundwater levels within the entire BVWSD service area over the past 20 years appear to be stable in the north while declining in the south which suggests that the north-to-south gradient has been increasing (BVWSD, 2014).
The groundwater levels in the regional aquifer just east of the BVWSD are by as much as 170 feet deeper, than within the BSA.
Groundwater levels in the perched and deep aquifers vary throughout the Project area. Figures 10 through 14 show the hydrographs for a deep aquifer monitoring well and nearby perched aquifer piezometers. Figures 10 through 12 shows about a 15 to 20 foot difference in elevation between the perched and deep aquifers, which suggests the A-clay maybe an effective barrier to vertical flow in the northern portions of the Project area. Since about 2006 the groundwater levels appear to be at or below the A-clay suggesting that the deep aquifer is semi-confined to unconfined in this area. Near DMW04 and DMW05 (Figures 13 and 14), in the southern portion of the Project area, the groundwater

A S S E S S M E N T O F P O T E N T I A L G R O U N D W A T E R I M P A C T S
21
levels in the deep aquifer are close to the ground surface and have similar levels as the perched aquifer. This suggests that the perching bed may be locally absent and the two aquifers may be interconnected and also suggests that this area is where groundwater from the perched aquifer could recharge the underlying aquifers. The deep aquifer would be unconfined to semi-confined in this area.

A S S E S S M E N T O F P O T E N T I A L G R O U N D W A T E R I M P A C T S
22
Figure 10 Groundwater Level Comparison DMW01 and BV02D and BV05A

A S S E S S M E N T O F P O T E N T I A L G R O U N D W A T E R I M P A C T S
23
Figure 11 Groundwater Level Comparison DMW01 and BV02D and BV05A

A S S E S S M E N T O F P O T E N T I A L G R O U N D W A T E R I M P A C T S
24
Figure 12 Groundwater Level Comparison DMW03 and BV15
A S S E S S M E N T O F P O T E N T I A L G R O U N D W A T E R I M P A C T S
25
Figure 13 Groundwater Level Comparison DMW04 and BV24 and BV26

A S S E S S M E N T O F P O T E N T I A L G R O U N D W A T E R I M P A C T S
26
Figure 14 Groundwater Level Comparison DMW05 and BV25

A S S E S S M E N T O F P O T E N T I A L G R O U N D W A T E R I M P A C T S
27
3.6 Groundwater Flow Direction
The groundwater flow directions are interpreted from groundwater level elevation contours. Contour maps were attempted to be developed for 3 representative years, 2008, representing normal water supply conditions; 2011, representing wet conditions; and 2013, representing dry conditions. In 2011 and 2013 for the perched aquifer and for 2008 in the main aquifer sufficient groundwater level measurements were not available so maps could not be drawn. Monitoring wells outside of the District to the west were also incorporated into the analyses to better define conditions in the deep aquifer, however, the well construction details were not available for these wells. Figures 15 through 17 show groundwater contour maps for the perched aquifer in 2008 and the deep aquifers in 2011 and 2013.
Groundwater flows from higher elevations to lower elevations in a direction that is perpendicular to contour lines. Where contours are 90 degrees to a feature such as the Buttonwillow Ridge and its concealed fault, they show that flow is not passing through that boundary. Also where linear groundwater features are observed, they suggest potential barriers to groundwater flow.
Groundwater contours for the perched water aquifer are limited to areas where shallow groundwater has been identified. Figure 15 shows these groundwater contours and arrows showing the groundwater flow path. Overall, the flow direction is from the south to the north generally parallel to the ground surface. The contours show that there is limited groundwater inflow from the west to the perched aquifer, but further assessment of piezometers along this western area confirms that inflow takes place from this area along a 10-mile length. However, locally and seasonally conditions may change to produce outflow. Groundwater inflow is also occurring from the south into the Project area, over a 2.5-mile wide area. Groundwater outflow from the northern portion of the Project area occurs along about a 5-mile wide boundary to the east and a 2-mile wide boundary to the north, both areas being north of the Buttonwillow Ridge.
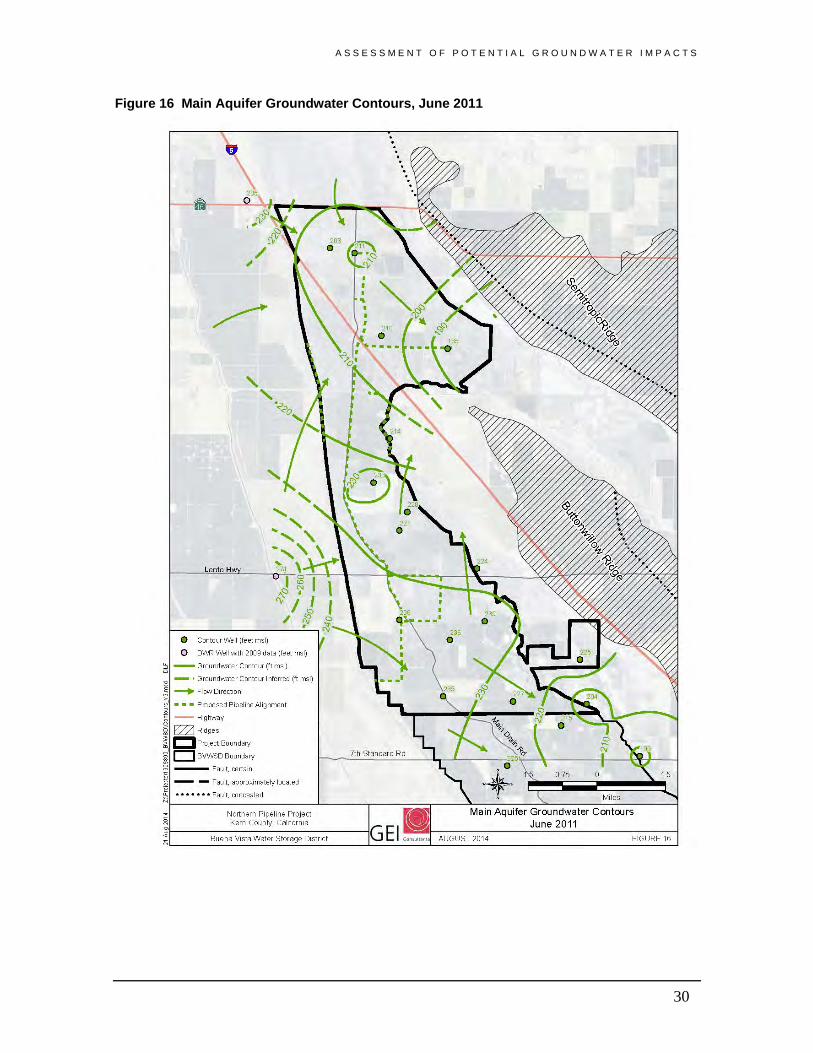
The groundwater contours for the deep aquifer beneath the Project area are shown on Figures 16 and 17. The contours show there is a groundwater high that is located near the southern end of the Project area. The groundwater high is potentially where groundwater recharge from the perched aquifer is reaching the main aquifer and functions as a divide with groundwater flowing to the south on one side of the high and to the north on the other side. North of the divide the groundwater moves to the northern end of the Project area where it then turns to the east to southeast to flow between the gap between the Buttonwillow and Semitropic ridges concealed faults. Throughout most of the BSA the contours are perpendicular to the Buttonwillow and Semitropic faults suggesting these faults are mostly barriers to groundwater flow. Groundwater inflow to the shallow and deep aquifer is from the west along a 10-mile-wide area and from the north along a 2-mile-wide area, but this is poorly defined due to the lack of monitoring wells.

A S S E S S M E N T O F P O T E N T I A L G R O U N D W A T E R I M P A C T S
28
Figure 18 shows this distinct change in groundwater levels between the Buttonwillow groundwater subbasin and areas to the east. The deeper groundwater levels are due to pumping both above and below the E-clay in the adjacent Semitropic Water Storage District (SWSD). The change in groundwater levels is occurring along a fairly straight line, coincident with the concealed faults associated with the Buttonwillow and Semitropic ridges. The fault associated with the Buttonwillow Ridge appears to be offset to the east of where the groundwater level change is occurring but the fault dips to the west so that at depth the fault would affect sediments to the west of its surface trace. Based on the change in groundwater contours this fault may extend to the south. The northern portions of the fault associated with the Semitropic Ridge appear to be a barrier to groundwater flow where the southern portions do not appear to affect groundwater flow.

A S S E S S M E N T O F P O T E N T I A L G R O U N D W A T E R I M P A C T S
29
Figure 15 Perched Groundwater Level Contours, June 2008
A S S E S S M E N T O F P O T E N T I A L G R O U N D W A T E R I M P A C T S
30
Figure 16 Main Aquifer Groundwater Contours, June 2011

A S S E S S M E N T O F P O T E N T I A L G R O U N D W A T E R I M P A C T S
31
Figure 17 Main Aquifer Groundwater Contours, June 2013

A S S E S S M E N T O F P O T E N T I A L G R O U N D W A T E R I M P A C T S
32
Figure 18 Regional Groundwater Contours, Jan-Feb 1994

A S S E S S M E N T O F P O T E N T I A L G R O U N D W A T E R I M P A C T S
33
3.7 Groundwater Gradients
The groundwater gradients in part govern the rate that groundwater will leave or enter the area. The perched and deep aquifers groundwater gradients were estimated from the groundwater contours shown on Figures 15 through 17 for just those areas where inflow or outflow is projected to occur. Where insufficient measurements were available to develop groundwater contours, a pair of wells were used to estimate the gradient.
The groundwater gradient for the perched aquifer to the outflow areas to the north and east is flat, ranging from about 0.0002 to 0.0009. The groundwater gradient from the inflow area from the south also flat and is estimated to be about 0.001. The groundwater gradient from the west was about 0.003. The gradient of the ground surface from south to north in the Project area is about 0.0003.
The groundwater gradient in the deep aquifer at the northeast end of the Project area, between the Buttonwillow and Semitropic ridges is about 0.003. The groundwater gradient from the west and north are poorly defined and appears to be variable. For estimating purposes, a gradient of between 0.001 and 0.008 was assumed. Groundwater outflow is also occurring to the south and the gradient appears to be controlled by pumping in the aquifer just south of the Project area.
Groundwater contours presented on Figure 18 shows there to be a very steep gradient associated with the Buttonwillow and Semitropic ridges’ concealed faults. This steep gradient near the linear feature suggests that the faults are a barrier to groundwater flow, creating about 170 feet of difference in the groundwater levels over a short distance. For this reason, the outflow is likely to be very small due to this subsurface barrier to flow. The gap between the faults is a small area where groundwater outflow from the Project area to the east can occur.
3.8 Hydraulic Characteristics
The aquifer hydraulic characteristics govern the rate that water will recharge and move through the aquifers. Figure 8 shows the locations where tests of the aquifer hydraulic characteristics were made. Table 2 provides a summary of the aquifer characteristics.
In 2014, GEI Consultants, Inc. and BVWSD performed slug testing in piezometers to estimate the hydraulic conductivity of the perched water aquifer. The details and analyses of the slug testing are provided in Attachment A. The slug tests showed clayey to silty sediments had a hydraulic conductivity of 0.7 feet per day where silty to sandy sediments had a hydraulic conductivity of 3 to 8 feet per day.
Long-term aquifer tests were performed at three locations, using one pumping well and one observation well (URS, 2010). All of these tests were performed just south of the Project area as shown on Figure 8. This type of testing can provide highly reliable data if the test

A S S E S S M E N T O F P O T E N T I A L G R O U N D W A T E R I M P A C T S
34
conditions are valid. However, based on our review of the results it appears that only one of the test locations had valid testing conditions and only the results from this test have been used in the analysis in this study.
Specific yield estimates are best determined by aquifer testing with pumping and observation wells. However, none have been made within the Project area. The test made south of the Project area produced a very low value of 0.02, which would indicate the deep and shallow aquifers are unconfined in this area. Regional specific yield estimates made by the USGS for the San Joaquin Valley have an average specific yield of 0.15. Recent estimates made by the California Energy Commission for the BSA also used 0.15 as the specific yield (CEC, 2012).
Although the E-clay is a confining bed it is not impermeable. The vertical hydraulic conductivity of the clay is estimated to be about 0.0001 feet per day. It is estimated that this could allow about 500 acre feet per year (AFY) to seep from the deep aquifer through the E-clay in the Project area.
Table 2 Aquifer Hydraulic Characteristics
Range Average Hydraulic Hydraulic Thickness Conductivity Thickness Conductivity Aquifers (feet) (feet/day) (feet) (feet/day)
Perched 1 0-30 1-8 23 4
Shallow 30-200 3-20 180 2 12 3
Deep 4 200-400 30-80 200 47
Notes: 1 See Attachment A
2 Total estimated thickness of aquifer less A- and E-Clay thicknesses
3 Soils Engineering, 2011, hydraulic conductivity for top 100 feet of aquifer
4 URS, 2010, from well N-4
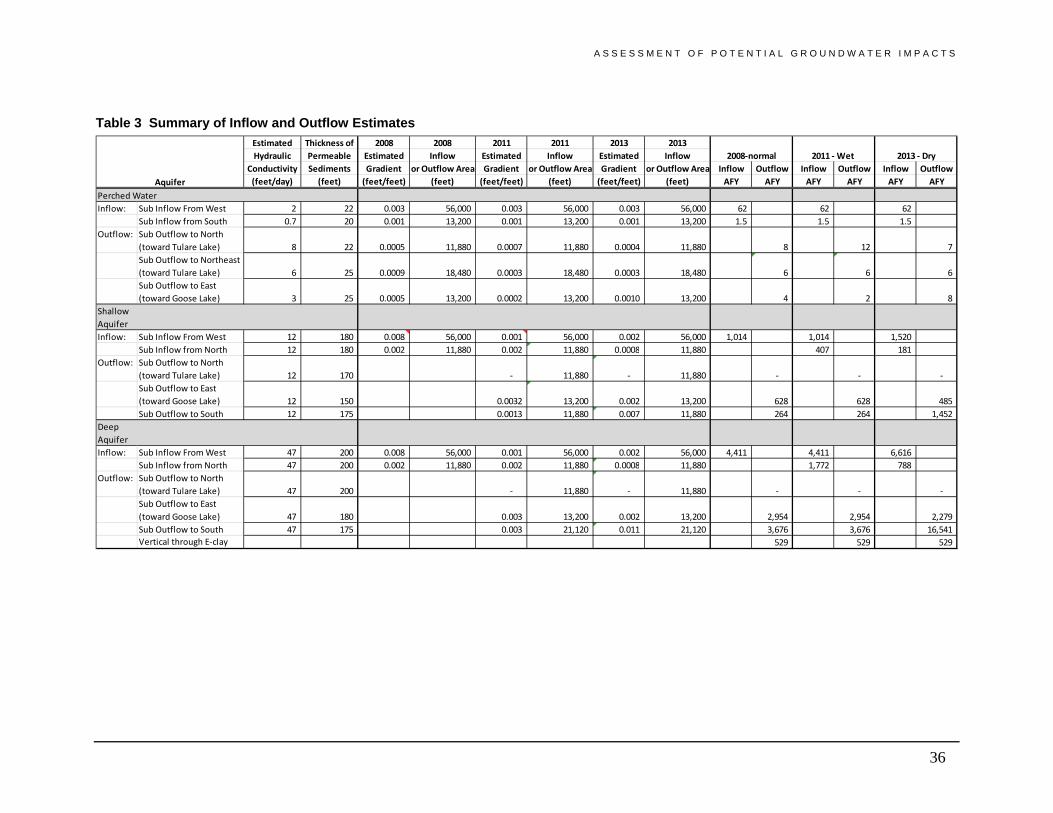
3.9 Subsurface Inflow and Outflow Estimates
Subsurface inflow and outflow estimates were developed for the perched, shallow, and deep aquifers using the width of the inflow and outflow areas, thickness of the aquifer, gradient, and hydraulic conductivity information presented above. The results of the estimates are present in Table 3.
3.10 Groundwater Discharge to Surface Water
Groundwater could discharge to the Main Drain Canal in years where the groundwater levels are within 6 feet of ground surface. However, it is not possible to measure the

A S S E S S M E N T O F P O T E N T I A L G R O U N D W A T E R I M P A C T S
35
discharge directly. Water in the Main Drain Canal is from stormwater runoff; tailwater from agricultural fields; spilled water from canals; and groundwater.
Tailwater and storm runoff from the community of Buttonwillow are collected by drainage ditches which flow to the Main Drain Canal. Most of the water conveyed in the canal is reclaimed and re-used by District landowners; the remainder is either delivered by the Goose Lake Canal to non-District landowners to the north or pumped to SWSD to the east. The District has an interconnection with SWSD used to transfer water into Buena Vista’s system and to transport reclaimed tailwater collected by the Main Drain Canal to SWSD's system. Agricultural runoff typically enters the Main Drain Canal during the January and February pre-irrigation season and the May through August irrigation season, but the canal can also carry flows during other months due to additional agricultural operations or storm runoff.
A S S E S S M E N T O F P O T E N T I A L G R O U N D W A T E R I M P A C T S
36
Table 3 Summary of Inflow and Outflow Estimates
Estimated Thickness of 2008 2008 2011 2011 2013 2013Hydraulic Permeable Estimated Inflow Estimated Inflow Estimated Inflow
Conductivity Sediments Gradient or Outflow Area Gradient or Outflow Area Gradient or Outflow Area Inflow Outflow Inflow Outflow Inflow Outflow(feet/day) (feet) (feet/feet) (feet) (feet/feet) (feet) (feet/feet) (feet) AFY AFY AFY AFY AFY AFY
Perched WaterInflow: Sub Inflow From West 2 22 0.003 56,000 0.003 56,000 0.003 56,000 62 62 62
Sub Inflow from South 0.7 20 0.001 13,200 0.001 13,200 0.001 13,200 1.5 1.5 1.5 Outflow: Sub Outflow to North
(toward Tulare Lake) 8 22 0.0005 11,880 0.0007 11,880 0.0004 11,880 8 12 7 Sub Outflow to Northeast (toward Tulare Lake) 6 25 0.0009 18,480 0.0003 18,480 0.0003 18,480 6 6 6 Sub Outflow to East (toward Goose Lake) 3 25 0.0005 13,200 0.0002 13,200 0.0010 13,200 4 2 8
Shallow AquiferInflow: Sub Inflow From West 12 180 0.008 56,000 0.001 56,000 0.002 56,000 1,014 1,014 1,520
Sub Inflow from North 12 180 0.002 11,880 0.002 11,880 0.0008 11,880 407 181 Outflow: Sub Outflow to North
(toward Tulare Lake) 12 170 - 11,880 - 11,880 - - - Sub Outflow to East (toward Goose Lake) 12 150 0.0032 13,200 0.002 13,200 628 628 485 Sub Outflow to South 12 175 0.0013 11,880 0.007 11,880 264 264 1,452
Deep AquiferInflow: Sub Inflow From West 47 200 0.008 56,000 0.001 56,000 0.002 56,000 4,411 4,411 6,616
Sub Inflow from North 47 200 0.002 11,880 0.002 11,880 0.0008 11,880 1,772 788 Outflow: Sub Outflow to North
(toward Tulare Lake) 47 200 - 11,880 - 11,880 - - - Sub Outflow to East (toward Goose Lake) 47 180 0.003 13,200 0.002 13,200 2,954 2,954 2,279 Sub Outflow to South 47 175 0.003 21,120 0.011 21,120 3,676 3,676 16,541 Vertical through E-clay 529 529 529
2008-normal 2011 - Wet 2013 - Dry
Aquifer

A S S E S S M E N T O F P O T E N T I A L G R O U N D W A T E R I M P A C T S
37
The water from the Main Drain Canal is pumped and reused by growers and BVWSD. Table 4 provides an estimate of the amount of water reused or allowed to flow out of the Project area. It establishes a maximum allowable amount of groundwater that could discharge to the canal.
Table 4 Main Drain Water Reuse Estimates
Type of Year Main Drain Canal
Water Reuse 2008 – Normal
(AFY) 2011 – Wet
(AFY) 2013 – Dry
(AFY)
Outflow to outside of BVWSD 1,527 6,647 0 BV Grower Reclamation 4,431 3,134 5,175 BV Reclamation 5,658 5,731 2,148 Total 11,616 15,512 7,323
3.11 Evaporation
Because groundwater levels in the perched water aquifer have been within 6 feet of the ground surface and the soils are clayey, capillary action can wick moisture up from the groundwater surface and evaporate at ground surface. The capillary fringe for silts is greater than 6 feet (Todd, 1980) and could be even greater for clayey soils similar to those present beneath the Project area. When groundwater levels decline in excess of 6 feet of ground surface this evaporation would stop. In 2008 groundwater levels were within 5 feet of ground surface over an area of about 2,800 acres. Assuming the evaporation would be about 1 AFY per acre the estimated outflow from the perched aquifer due to evaporation could be about 2,800 AFY.
3.12 Groundwater Storage
For purposes of this analysis groundwater in storage is the amount of water between grains of sediment in the subsurface that can drain by gravity and be recovered. Groundwater in storage is calculated in aquifers by multiplying the area being studied by the thickness of permeable sediment and by the specific yield. Groundwater can also be stored in fine-grained sediments but this water is slow to drain; may not be replaced; and removal may cause clay compaction and subsidence, thus making removal undesirable. This groundwater storage was not included in our estimates.
Table 5 shows the estimated storage in the aquifers and the amount of groundwater storage per foot of saturated sediments. The total groundwater in storage just beneath the Project area is about 1.2 million acre feet (AF). Because the actual depth of the A-clay is poorly defined and is believed to be up to 30 feet below ground surface, an average thickness of 23 feet was chosen for the perched aquifer thickness based on Table 1. Even with this thickness, the volume of water in the perched water zone is relatively small due to the

A S S E S S M E N T O F P O T E N T I A L G R O U N D W A T E R I M P A C T S
38
thinness of the sediments and only represents about 6 percent of the total water in storage beneath the Project area.
Table 5 Summary of Groundwater in Storage Northern Portion of BSA
Average
Permeable Sediment Thickness
(feet)
USGS Specific
Yield (unitless)
Area (acres)
Estimated Groundwater
in Storage (AF)
Estimated Groundwater
per Foot of Saturated
Thickness (AF/foot)
Aquifers
Perched 23 0.15 20,400 70,380 3,060
Shallow and Deep 380 0.15 20,400 1,162,800 3,060
3.13 Recharge Areas and Sources
Within the Kern County groundwater subbasin, groundwater recharge occurs from stream seepage along the eastern portion of the subbasin and the along the Kern River, as well as recharge from applied irrigation water (DWR 1995).
In BVWSD groundwater recharge occurs from precipitation within the BSA, subsurface inflow from aquifers west of the district, which results from precipitation in the watershed west of BVWSD, from district-owned spreading ponds, seepage from District and private canals and deep percolation from applied water. Estimates of the recharge from these sources are provided in Table 6 along with estimates for just the Project area.
Irrigation water is conveyed from south to north by the East Side and West Side canals that define the BSA’s eastern and western boundaries. Water is diverted from these canals to irrigated fields via a system of smaller lateral canals and private ditches which are interconnected by manually-operated weirs and turnouts operated by District staff. Average annual seepage from the East Side and West Side canals was estimated to be about 15,400 AFY (BVWSD, 2014).

A S S E S S M E N T O F P O T E N T I A L G R O U N D W A T E R I M P A C T S
39
Table 6 Estimated Groundwater Recharge
All Values in Acre-Feet
Sources: 1 BVWSD, 2014
2 Sierra Scientific Services, 2012, 37,000 AFY average year seepage losses for BSA canals 3 BVWSD, 2014, WaterSMART Grant Application, used for normal year projection, remainder are based on
percent of service area
4 BSA is 92% of total BVWSD project area.
5 Average annual rainfall times area times assumed deep perc of 10%
Annual precipitation typically ranges from less than 1 to 9 inches. The average annual precipitation is about 5.643 inches per year (BVWSD, 2014). Recharge from precipitation was estimated based on the total area of BVWSD and assuming about 10 percent of the precipitation becomes deep percolation.
3.14 Water Supply
About 40,000 acres of land are used for growing crops in the BSA. The primary water demand within the District is irrigation for agriculture. The crop water demand is met by the in-season delivery of surface water from seasonally regulated flows of Kern River
Type of YearLocation 2008 - Normal 2011 - Wet 2013 - Dry
BVWSD Total Area 1 PDeep percolation rainfall 5 2,758 2,493 849 District Spreading Ponds - 67,917 - District Canal Seepage 33,137 55,720 16,595 Main Drain Canal Seepage Unknown Unknown UnknownDeep Percolation Applied Water 5,596 6,273 5,243 BVSWD Total 41,491 129,910 21,838 BSA Total Estimate (92% of total BVWSD area)Deep percolation rainfall 2,538 2,294 781 District Spreading Ponds - - - District Canal Seepage 2 30,486 53,491 15,931 Main Drain Canal Seepage Unknown Unknown UnknownDeep Percolation Applied Water 4 5,148 5,771 4,824 BSA Total 38,172 59,262 20,755 Project Area Estimate (44% of total BSA)Deep percolation rainfall 1,117 1,009 344 District Spreading Ponds - - - District Canal Seepage 3 13,414 23,536 7,010 Main Drain Canal Seepage 3,105 Unknown UnknownDeep Percolation Applied Water 1,544 1,731 1,447 Project Area Total 19,179 25,267 8,456

A S S E S S M E N T O F P O T E N T I A L G R O U N D W A T E R I M P A C T S
40
water; schedulable deliveries of State Water Project (SWP) water through the California Aqueduct; and occasional purchases or exchanges for water from the federal Central Valley Project, delivered to the Kern River Channel via the Friant-Kern Canal from westward flowing Sierran drainages north of Kern County. Irrigation demand that cannot be met by surface water deliveries must be satisfied by groundwater pumping. Table 7 shows water supplies used in the BVWSD for normal, wet, and dry years.
Table 7 contains estimates for the entire BVWSD, in order to estimate the amount of water supplies used just within the Project area. For the period of 2000 to 2009 the annual District surface supply was 63,700 AFY of which 5,300 AFY was delivered to the Maples Service Area. Based on ratio of these delivers about 92 percent of the surface water supplies were delivered to the BSA area. The northern portion of the BSA where the Project area is located is about 44 percent of the total BSA area so the surface water pumping was proportioned in this manner.
The total number of District and privately owned wells in the BSA area is 165 wells, with 36 wells being within the Project area. The total pumped volume was distributed based on the percent of wells in the Project area.

A S S E S S M E N T O F P O T E N T I A L G R O U N D W A T E R I M P A C T S
41
Table 7 Water Supply Estimates
Source: 1BVWSD 2014
Type of Year2008 - Normal
(Acre-Feet)2011 - Wet (Acre-Feet)
2013 - Dry (Acre-Feet)
BVWSD Total Area 1
Groundwater - within BVWSDDistrict Deep Wells 6,100 219 2,905 Non-District Deep WellsEstimate Private Wells 40,313 35,729 54,572 Subtotal 46,413 35,948 57,477
Imported Surface Water and GroundwaterImported Groundwater (Olces 10,000 - 6,924 KR/ST Exchanges (total) 2 32,232 66,919 41,539
SWP 25,786 53,535 33,231 Friant-Kern 6,446 13,384 8,308
Kern River 42,610 93,674 1,018 Subtotal 84,842 160,593 49,481
BSA Total EstimateGroundwater 42,700 33,072 52,879 Imported Surface Water and Groundwater 77,814 147,290 45,382
Project Area EstimateGroundwater 8,796 7,795 11,907 Imported Surface Water and Groundwater 34,238 64,807 19,968
Source

A S S E S S M E N T O F P O T E N T I A L G R O U N D W A T E R I M P A C T S
42
3.15 Subsidence
Land subsidence has occurred throughout much of the San Joaquin Valley. Most of the subsidence is attributed to groundwater extractions and dewatering of relatively thick clay layers, including the E-clay. Subsidence has occurred within the Kern County groundwater subbasin along the east side of the subbasin both north and south of Bakersfield. Little, if any, recent or historic subsidence has occurred due to groundwater extractions beneath BVWSD (Luhdorff and Scalamni, 2014).

A S S E S S M E N T O F P O T E N T I A L G R O U N D W A T E R I M P A C T S
43
4 Water Quality
The District receives their surface water supplies from the Kern River, the State Water Project, and occasionally the federal Central Valley Project. The average total dissolved solids (TDS) concentrations for each of these water sources is shown in Table 8. Information in Table 8 is based on data provided from the Kern County Water Agency from BVWSD files and other reports.
Table 8 Summary of Surface Water Quality
Sources: 1BVWSD, GMP 2012, and AWMP 2014
Range Average Type of Year - Inflow or OutflowTDS TDS 2008 - Normal 2011 - Wet 2013 - Dry
Sources mg/L mg/L mg/L mg/L mg/L
Imported Water 1
SWP 350-450 400 400 400 400Kern River 90-120 105 105 105 105Friant-Kern 50 50 50 50Olcese Wells 264 264 264 264
Weighted Average based on Mixtures of Imported Water 236 228 375Perched WaterInflow: Sub Inflow From West 4915 4915 4915
Sub Inflow from South 1715 2015 2315Outflow: Sub Outflow to North
(toward Tulare Lake) 1733 2600 2800Sub Outflow to Northeast (toward Tulare Lake) 3068 2600 2800Sub Outflow to East (toward Goose Lake) 950 1100 1100
Shallow Aquifer
Inflow: Sub Inflow From West 3000 3000 3000Outflow: Sub Outflow to North
(toward Tulare Lake) 1600 1400 1400Sub Outflow to East (toward Goose Lake) 2300 2100 2500Sub Outflow to South 1500 1500 1500
Deep Aquifer
Inflow: Sub Inflow From West 3000 3000 3000Outflow: Sub Outflow to North
(toward Tulare Lake) 1600 1400 1400Sub Outflow to East (toward Goose Lake) 2300 2100 2500Sub Outflow to South 1500 1500 1500
Main Drain 1
Tailwater 1920-3129 2525 458 458 2525

A S S E S S M E N T O F P O T E N T I A L G R O U N D W A T E R I M P A C T S
44

A S S E S S M E N T O F P O T E N T I A L G R O U N D W A T E R I M P A C T S
45
Groundwater quality varies by location and depth. There are some suggestions in different reports that the water quality in the aquifers has the highest TDS near the Coast Ranges. As groundwater migrates from the Coast Ranges to the east into the valley, the TDS concentrations decrease (Rector, 1983). However, the well screen intervals are unknown so the data are not specific to a single aquifer and could be related to groundwater beneath the E-clay and the underlying marine sediments.
Ten wells were sampled in 2010 that obtained water from various depths (URS, 2010). The TDS ranged from 860 mg/L up to 4,300 mg/L. The highest concentration appears to have well screens below the E-clay.
Electrical conductivity measurements, which can be used to approximate the TDS, are made by BVWSD in their piezometers and deep aquifer monitoring wells. Measurements are only obtained once annually generally in the spring of each year but in some cases in the fall or not at all. Figure 19 shows salinity contours for the perched aquifer, prepared from March 2012 monitoring data. Figure 20 shows salinity contours for the deep aquifer, prepared from March 2012 monitoring data. The contours show the concentrations are highly variable throughout the Project area. These figures were used to estimate the TDS for each of the groundwater inflow and outflow areas.
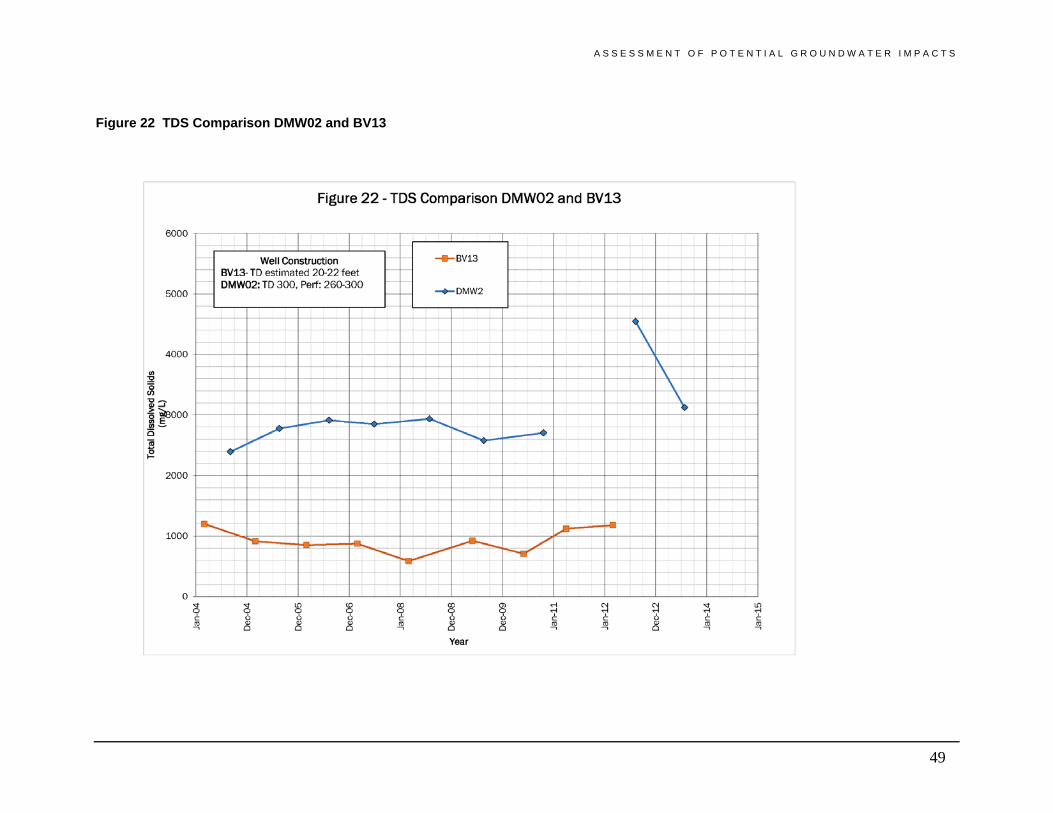
Figures 21 through 25 show the trend in TDS concentrations over time at deep wells and nearby piezometers. The trends in the concentrations for the perched and main aquifer are quite different from location to location but overall the trend is flat. The perched aquifer has a much wider range of concentrations from as low as 350 mg/L where piezometers are adjacent to and are influenced by canal water seepage to as high as 5,000 mg/L. Figure 8 shows the locations of piezometers and deep monitoring wells.

A S S E S S M E N T O F P O T E N T I A L G R O U N D W A T E R I M P A C T S
46
Figure 19 Perched Groundwater TDS Contours, March 2012

A S S E S S M E N T O F P O T E N T I A L G R O U N D W A T E R I M P A C T S
47
Figure 20 Main Aquifer TDS Contours, March 2012

A S S E S S M E N T O F P O T E N T I A L G R O U N D W A T E R I M P A C T S
48
Figure 21 TDS Comparison DMW01 and BV02D and BV05A
A S S E S S M E N T O F P O T E N T I A L G R O U N D W A T E R I M P A C T S
49
Figure 22 TDS Comparison DMW02 and BV13

A S S E S S M E N T O F P O T E N T I A L G R O U N D W A T E R I M P A C T S
50
Figure 23 Groundwater Level Comparison DMW03 and BV15

A S S E S S M E N T O F P O T E N T I A L G R O U N D W A T E R I M P A C T S
51
Figure 24 Groundwater Level Comparison DMW04 and BV24 and BV26

A S S E S S M E N T O F P O T E N T I A L G R O U N D W A T E R I M P A C T S
52
Figure 25 Groundwater Level Comparison DMW05 and BV25

A S S E S S M E N T O F P O T E N T I A L G R O U N D W A T E R I M P A C T S
53
5 Baseline Conditions
Baseline groundwater level and salinity levels were developed using water and salt balances to establish current conditions. The baseline balances were then changed to reflect groundwater conditions due to implementation of the Project and cumulative effects of other foreseeable projects in the area to forecast the potential affects. The forecasted future effects are compared to the baseline conditions to assess the potential impact of the proposed Project.
The balances were developed using three typical water supply years, 2008 as the normal water supply year; 2011 to represent a wet year; and 2013 to represent a dry year. These representative years were then assigned to other similar types of years during a 15-year historic base period, from 1999 to 2014. Figure 26 shows the distribution of the typical years to the entire base period. The baseline water and salt balances results were then calibrated and reviewed against measured groundwater levels and salt concentrations in Project area piezometers and groundwater monitoring wells to further calibrate the results. Both the water and salt balances were developed with multiple iterations until a reasonable match to the physical data was obtained.
Figure 26 Year Types and Precipitation

A S S E S S M E N T O F P O T E N T I A L G R O U N D W A T E R I M P A C T S
54
It should be noted that during the 15-year base period, the last 3 years were drought years and have not been present in the historic record for over 40 years, since 1976 and 1977, when two back-to-back critically dry years occurred.
The projected 15-year groundwater level and salt concentrations from the balances were compared to conditions measured at piezometer and monitoring well BV14A and DMW03 as these are located near the middle of the Project area. Although BV15 is adjacent to DMW03, piezometer BV15 is located next to and is affected by the East Side Canal. The groundwater from BV15 had a TDS of 350 mg/L, which indicates that it is affected by water in the canal. This makes it a less desirable location for comparison to the water and salt balances, so piezometer BV14A was used for calibration purposes. Locations for the monitoring wells are shown on Figure 8. Figure 12 shows the hydrograph of groundwater levels in these piezometers and wells. Figure 23 shows salinity over time for these piezometers and wells.
5.1 Baseline Water Balance
A groundwater body balance was prepared to represent baseline conditions in the Project area for the 3 typical years. Water balance components were derived from information presented in the previous sections of this report.
Water balances are the summation of flow into (inflow) and flows from (outflow) a defined area. There are two different types of water balances, a basin balance and a body balance. A basin balance contains all components of inflow and outflow for a specified area and contains many items that may not necessarily affect groundwater. Basin balances are more complex than a groundwater body balance.
A groundwater body balance only accounts for inflow or outflow components that directly affect the groundwater body and are easier to construct and simpler to interpret. For this study, a groundwater body balance was chosen for its simplicity. Figure 27 shows a schematic of the water balance components for the Project area. The shallow and deep aquifers were grouped together due to the lack of evidence that the C-clay is acting as a barrier to groundwater flow and separating these aquifers. For purposes of discussion, the shallow and deep aquifers hereafter are described as the “main aquifer.” The water balance is split into the perched aquifer and the unconfined aquifer, and inflows and outflows from each aquifer were assigned.
As shown on the diagram the Main Drain Canal is considered to be a component of both inflow and outflow from the perched aquifer. The conditions which govern whether it creates outflow or inflow are based on groundwater levels and canal flows. Both of these conditions may vary along the canal.

A S S E S S M E N T O F P O T E N T I A L G R O U N D W A T E R I M P A C T S
55
Figure 27 Water Budget Diagram
Water balances for this analysis were developed using readily available data. It is common that water balances contain some well-quantified components and some poorly-quantified components. Components with poorer quantification are typically back-solved as being the component that is not known. A certainty index (CI) was assigned to each component in the water balance to identify well-quantified and poorly-quantified components. The CI is expressed as a percent and the value contained in the balance could vary by plus or minus this percent of the value contained in the balance. Major components with high CI’s should be investigated in the future to better quantify these components and the higher quality data should be incorporated into the balances as this additional information becomes available.
The water balance contains many calculated values which are being expressed with an implied accuracy to the single digit. However, in reality the accuracy of these values are at best to the nearest hundred. Discussions within the text round the values from the tables to the hundreds.
Attachment B, Table B-1 provides the baseline water balance for the Project area. The baseline water balance shows inflow and outflow from the perched aquifer. Inflow to the perched aquifer include deep percolation of applied water and precipitation, subsurface inflow, seepage from the East Side and West Side canals, and the Main Drain Canal The total inflow to the perched aquifer, based on the typical years, ranges from about 19,200 to 29,200 AFY. The lowest inflow was in 2013, a dry year when surface water deliveries were about 50 percent of those in 2008 or 2011. In all years, three-quarters of this inflow

A S S E S S M E N T O F P O T E N T I A L G R O U N D W A T E R I M P A C T S
56
was the result of District canal seepage. Outflows include groundwater discharges to surface water (Main Drain Canal); subsurface outflows; leakance to the main aquifer; and evaporation. The subsurface components of outflow from the perched aquifer are relatively well-quantified and are small volumes. The greatest uncertainties occur in the estimate of leakance to the underlying aquifers and discharges of groundwater to the Main Drain Canal, both represent some of the largest values in the perched aquifer balance.
The main aquifer water balance includes two inflows and four outflows. Groundwater contours from 2011 and 2013 (Figures 11 and 12) were used to estimate the direction of inflows and outflows from the main aquifer. Inflows to the main aquifer include subsurface inflow from the north and west and leakance from the perched aquifer. The total inflow to the main aquifer ranges from about 16,600 to 18,100 AFY. Outflows from the main aquifer are subsurface outflow to the east, south and through the E-clay and from groundwater pumping. Groundwater pumping is for the most part the largest component of outflow. Subsurface outflow to the south at times can surpass groundwater pumping, especially during drought years when pumping south of the Project area increases. Outflows in normal and dry years exceed inflows but during wet years the inflows are greater than outflows. The greatest uncertainty occurs in the estimate of leakance from the overlying perched aquifer and represents one of the largest values.
The results of the water balance are produced in AFY. These values were converted to change in groundwater levels using the storage coefficient of 3,000 AF per foot of storage. Figures 28 and 29 shows the results of the long-term projection of the water balance for the perched and main aquifers in comparison to the groundwater level measurements. The results show the water balance has the capability of reasonably simulating groundwater conditions.

A S S E S S M E N T O F P O T E N T I A L G R O U N D W A T E R I M P A C T S
57
Figure 28 Groundwater Level Comparison to Baseline Water Balance – Perched Aquifer

A S S E S S M E N T O F P O T E N T I A L G R O U N D W A T E R I M P A C T S
58
Figure 29 Groundwater Level Comparison to Baseline Water Balance – Main Aquifer

A S S E S S M E N T O F P O T E N T I A L G R O U N D W A T E R I M P A C T S
59
5.2 Baseline Salt Balance
The baseline salt (TDS) balance was developed similar to the baseline water balance. The salt balance is a summation of salts into and out from the perched and main aquifers. The baseline water balance provides the volumes. The salinity concentrations of each component of the water balance was assigned from values provided in Table 8 and estimates for unavailable data such as the salinity of deep percolation of applied water.
The salt concentration of each inflow and outflow component was estimated by converting TDS to tons of salt per AF (1 ton per acre-foot = 735 mg/L). To be able to compare these results to measured concentrations in the aquifers for calibration purposes, the calculated change in tons of salt were then added back to the total tons of salt in the aquifers within the Project area and a revised estimate of the salt concentration in the water was calculated.
Attachment B, Table B-2 shows salt balance elements. The salt balance was calibrated using estimated TDS values taken from the piezometers and deep monitoring wells used for the water balance. As shown on Figures 21 through 25 the water being used to forecast the potential effects have some of the worst quality in the Project area and therefore are providing a worst case scenario. The percent increases projected in this analysis could be used to project the water quality that may occur at other monitoring wells in the Project area.
The concentration of salts leaking into the main aquifer from the perched aquifer was obtained by averaging the concentration of salt concentrations in the subsurface outflow areas. This same average concentration was used for the salt concentration when evaporation occurred.
The water balance projects some groundwater was evaporated through the soils in 2008 and 2011 as a result of shallow perched water. The salts from evaporation are then flushed back into the perched aquifer by deep percolation of precipitation and applied water. In 2013, with groundwater levels declining, the amount of evaporation through the soils decreased. Also, a significant amounts of salt were imported with the surface water, of which most was retained in the soils and leached to the perched aquifer. Therefore, a balance was obtained by increasing the salinity of the deep percolation of precipitation and applied water to account for the flushing of the salts.
The concentration of salt in the imported surface water was based on a weighted average as the sources and volumes of water varied each year.
Salt concentrations (TDS) in the Main Drain Canal have been reported to range from 220 to 1,370 mg/L. No measurements were available for 2008 so the values from 2011 were used for 2008. Average concentrations salt concentration for each year, where avaialable were for each year.
A S S E S S M E N T O F P O T E N T I A L G R O U N D W A T E R I M P A C T S
60
Figures 30 and 31 show the salt balance projections versus measured salt concentrations in the perched and main aquifers. The graphs show there are significant swings in the groundwater concentrations that could not be entirely matched, but the general trend in the data was captured. The results show the salt balance has the capability of reasonably simulating groundwater conditions.

A S S E S S M E N T O F P O T E N T I A L G R O U N D W A T E R I M P A C T S
61
Figure 30 Salinity Comparison to Baseline Salt Balance – Perched Aquifer

A S S E S S M E N T O F P O T E N T I A L G R O U N D W A T E R I M P A C T S
62
Figure 31 Salinity Comparison to Baseline Salt Balance – Main Aquifer

A S S E S S M E N T O F P O T E N T I A L G R O U N D W A T E R I M P A C T S
63
6 Assessment of Project Effects
About 63 miles of the East Side and West Side canals will no longer be used to for delivery of surface water to growers. As such the canals will no longer recharge high quality surface water to the perched water zone. BVWSD has estimated the amount of seepage loses to be about 15,400 AFY (Table 5).
The effects of this Project on groundwater within the Project and surrounding areas will be reduction of groundwater recharge with low salinity due to the conversion of the West Side and East Side canals to a pipeline along the Main Drain Canal. The baseline water and salt balances were used to assess the potential impacts of these changes into the future.
The baseline water balance results for 1999 through 2011 were repeated to simulate and forecast conditions for 2015 through 2027. The last 3 years of the baseline period were not projected as these climatic conditions would not be expected to be repeated for another 40 years.
6.1 Approach
The baseline water balance was modified and then used to assess the changes in groundwater levels as a result of the addition of the Project. Changes to the baseline water balance include:
• The inflow to the perched aquifer from seepage from the East Side and West Side canals was reduced to zero.
• With the reduction of recharge groundwater levels in the perched aquifer would be below levels where the capillary fringe could evaporate water. Therefore, the evaporation was reduced to zero for all years.
• Seepage from the Main Drain Canal will continue.
• Groundwater discharges to the Main Drain Canal will not continue as the groundwater levels will be lower.
• To account for variable groundwater levels in the perched water aquifer affecting the amount of leakance to the main aquifer, the leakance was allowed to vary throughout the years. The assumption was made that the A-clay or the bottom of the perched aquifer was located about 30 feet below ground surface. There was an average of about 23 feet of saturated interval and there was about 9,000 AFY of
A S S E S S M E N T O F P O T E N T I A L G R O U N D W A T E R I M P A C T S
64
vertical leakance. This amount of leakance was used to calculate a rate of 400 AFY of leakance per foot of saturated thickness.
• Groundwater recharge along the West Side Canal was included in the water balance only in wet years.
• Groundwater pumping may change during the forecasted period, but the forecast uses pumping as reported in 2013.
The modified baseline water balance with the Project assumed conditions above are provided in Attachment B, Table B-3.
6.2 Project Effects on Groundwater Levels
The results of the water balance analysis estimate the Project’s effects on groundwater levels for the perched and main aquifers. Results were compared to the forecasted baseline conditions on Figures 28 and 29. Figures 32 and 33 show the forecasted Project groundwater level conditions in comparison to the baseline conditions. Table 9 summarizes the projected effects.
If the proposed Project is not constructed groundwater levels in the perched aquifer will rise by about 2 feet from 2014 through 2027. If the proposed Project is constructed, groundwater levels in the perched aquifer will be unaffected. The last year of the forecasted period projects that groundwater levels may rise back to the baseline conditions but this is likely due to the analyses period ending in a wet year. The reason that the potential effect is small is due to the reduction of seepage from the canals (inflow) being offset by reduction in outflow due to groundwater discharges to the Main Drain Canal being eliminated with lower groundwater levels and the reduction of evaporation through the soils.
Repeating the baseline conditions for the main aquifer forecasts that groundwater levels in the aquifer will decline by about 13 feet from 2014 through 2027. Because groundwater levels are being forecasted to decline in the perched aquifer through much of the period with the Project there will be a decline in leakance from the perched aquifer to the main aquifers. This results in groundwater levels in the main aquifer being about 2 feet lower than baseline conditions.

A S S E S S M E N T O F P O T E N T I A L G R O U N D W A T E R I M P A C T S
65
Figure 32 Project and Cumulative Groundwater Level Comparison to Baseline Salt Balance - Perched Aquifer
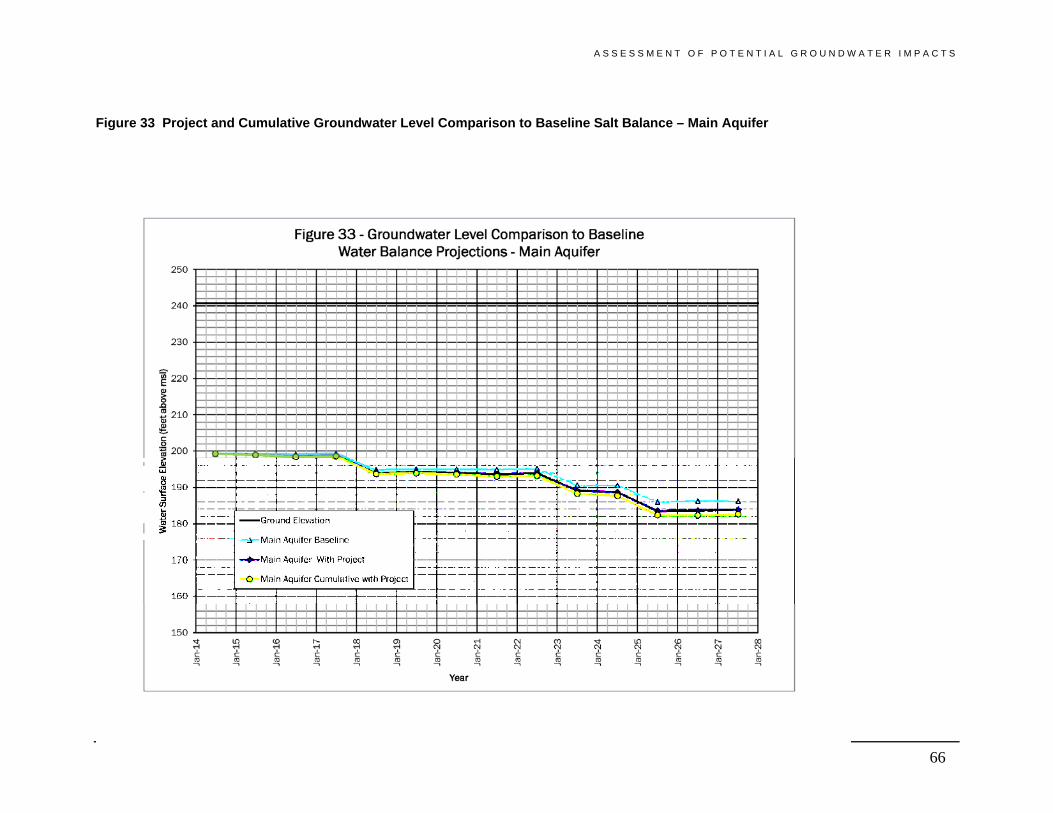
A S S E S S M E N T O F P O T E N T I A L G R O U N D W A T E R I M P A C T S
66
Figure 33 Project and Cumulative Groundwater Level Comparison to Baseline Salt Balance – Main Aquifer

A S S E S S M E N T O F P O T E N T I A L G R O U N D W A T E R I M P A C T S
67
Table 9 Project Effects – Groundwater Levels
Groundwater Level (in feet msl) Analysis Start Finish 2014 2027 Change
Perched Aquifer Baseline 232.5 234.2 1.6With Project 232.5 234.2 1.6Main Aquifer Baseline 199.3 186.1 -13.1With Project 199.3 183.8 -15.4
6.3 Project Effects on Groundwater Quality
The baseline salt balance was used to assess the changes in water quality with the Project. The salt balance was modified after the initial runs as it was showing that the TDS in the perched aquifer was going to increase to about 7,000 mg/L yet using the baseline salt balance only allowed leakance of perched water to the main aquifer of about 1,900 mg/L. Therefore, the concentration of salts in the water that leaks between the two aquifers was increased to an average of 3,500 mg/L to better forecast water quality effects. The salt balance calculations are provided in Attachment B, Table B-4. The results of the analyses are shown on Figures 34 and 35. Table 10 summarizes the projected effects.
The baseline forecast for the main aquifer shows that TDS concentrations in the aquifer would be expected to decline by 110 mg/L between 2014 and 2027. The results of the analyses with the Project for the perched aquifer shows the salinity will gradually increase by 1,635 mg/L or an increase of 1,745 mg/L above baseline conditions. The increase is due to the decrease in recharge of low TDS water and the elimination of salts being exported due to groundwater discharge to the Main Drain Canal.
The baseline forecasted conditions in the main aquifer are showing the salinity is expected to rise by 252 mg/L between 2014 and 2027. The salinity with the Project is showing the TDS is expected to increase by 422 mg/L, an increase of 170 mg/L above baseline conditions. The increase is predominately due to the increased salinity in the leakance from the perched aquifer.

A S S E S S M E N T O F P O T E N T I A L G R O U N D W A T E R I M P A C T S
68
Figure 34 Project and Cumulative Salinity Comparison to Baseline Salt Balance - Perched Aquifer

A S S E S S M E N T O F P O T E N T I A L G R O U N D W A T E R I M P A C T S
69
Figure 35 Project and Cumulative Salinity Comparison to Baseline Salt Balance – Main Aquifer

A S S E S S M E N T O F P O T E N T I A L G R O U N D W A T E R I M P A C T S
70
Table 10 Project Effects – Salt Concentrations
Salt Concentrations (mg/L) Analysis Start Finish 2014 2027 Change
Perched Aquifer Baseline 1,772 1,662 -110With Project 1,772 3,407 1,635Main Aquifer Baseline 3,965 4,217 252With Project 3,965 4,387 422
6.4 Project Effects on Subsidence
Dewatering of saturated clayey sediments can results in inelastic subsidence, especially if they have not previously been dewatered. The perched aquifer is overlain by clayey soils. Existing groundwater levels in 2013 are beneath these soils prior to the Project. Therefore, lowering of the perched aquifer would have a low potential to create subsidence.
The A-clay is about 20 to 50 feet thick and is estimated to be about 20 to 30 feet below ground surface. A reduction of groundwater levels by about 4 feet in the main aquifer would not lower groundwater levels beneath the bottom of the A-clay and therefore the potential to create subsidence with the Project is low.
6.5 Summary of Project Impacts
Groundwater levels in the perched aquifer are projected to rise by about 2 feet using the baseline conditions from 2014 to 2027. The groundwater levels with the Project will rise be at a similar level in 2027 as the baseline conditions.
The main aquifer beneath the Project area contains over 400 feet of saturated sediments. The decline in water levels of 2 feet in this aquifer would only be a change of about 0.5 percent.
Subsurface outflow in the main aquifer to the east, towards the main Kern County groundwater basin and SWSD, was projected to average about 3,400 AFY under baseline conditions. With the decline in groundwater levels by about 2 feet, the outflow would decrease about 20 AFY. This represents about a 0.5 percent decrease in outflow. SWSD performed in-lieu recharge operations in 2011 of 338,000 AF and 146,000 AF in 2013 and therefore the reduction of 20 AFY is a very small percentage of the overall recharge.
The most notable change will be the changes in water quality in the perched aquifer which supplies some water to the Tulare Lake and main Kern County groundwater subbasins. The salinity is forecasted to increase from about 1,800 mg/L to about 3,400 mg/L.

A S S E S S M E N T O F P O T E N T I A L G R O U N D W A T E R I M P A C T S
71
The increase in salinity in the main aquifer with the Project will be about 170 mg/L above the baseline conditions and it appears to be a long term trend. This represents a change of about 4 percent.

A S S E S S M E N T O F P O T E N T I A L G R O U N D W A T E R I M P A C T S
72
7 Assessment of Cumulative Effects
Other projects in the area could affect the groundwater conditions beneath the Project area and result in cumulative impacts. Foreseeable projects and changes were identified. The effects of land use changes, climate change, and a proposed project within the northern portion of the BSA were evaluated using the groundwater and salt balances to assess the cumulative effects on the groundwater. The cumulative analyses include the changes due to implementation of the Project and these foreseeable projects.
7.1 Foreseeable Projects and Changes
Anticipated projects and changes that could affect the northern portion of the BSA include land use changes and climate change as discussed in the following sections.
Land Use Changes 7.1.1
As noted earlier, land use within both the BSA and the Maples Service Area is predominately agricultural. As neither service area encompasses or borders an urban or municipal area, there is little pressure to convert irrigated lands to urban uses.
Long-term changes in farmed acreage are likely to result from implementation of programs such as the Conservation Easement Water Acquisition and Management Project (CEWAMP). Under this program, Buena Vista is investigating acquiring and managing water service rights in the “Northern Area Lands” (i.e., BSA lands generally north of Lerdo Highway) that have already entered into, or that will soon enter into, conservation easement programs and that have transitioned away from full agricultural production.
The District anticipates about 2,815 acres of irrigated land will be transitioned into these conservation easements.
Climate Change 7.1.2
Annual precipitation typically ranges from 5 to 7 inches and averages 5.64 inches per year between 1940 to 2013 (BVWSD, 2014).
Several investigations were conducted by the USGS California Water Science Center (CAWSC) regarding hydrological effects of climate scenarios in the Sierra Nevada Mountain Range (USGS 2009; Water Resources Research, 2012). The Kern River and CVP water supplies are directly affected by the quantities of runoff and recharge in the Sierras. Each of these investigations predict that California’s climate will become warmer (+2 to +4° C) and drier (10-15%) during the mid- to late-21st century, relative to historical conditions. This will reduce precipitation in the area.
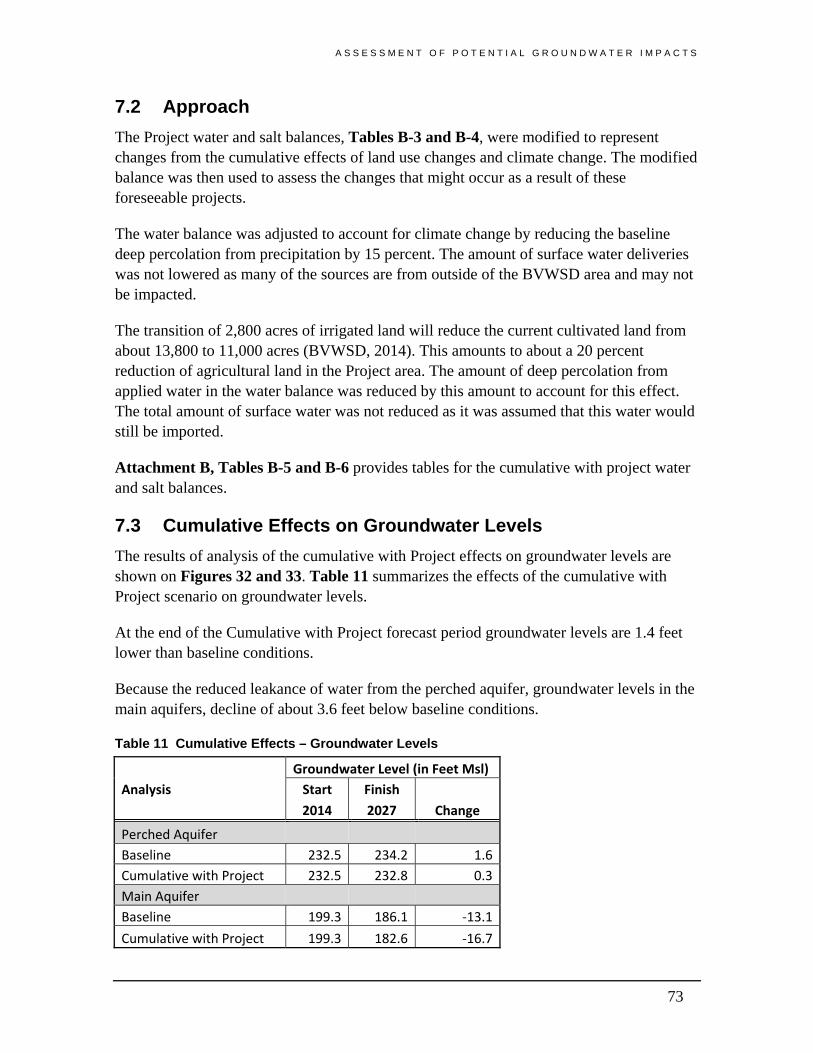
A S S E S S M E N T O F P O T E N T I A L G R O U N D W A T E R I M P A C T S
73
7.2 Approach
The Project water and salt balances, Tables B-3 and B-4, were modified to represent changes from the cumulative effects of land use changes and climate change. The modified balance was then used to assess the changes that might occur as a result of these foreseeable projects.
The water balance was adjusted to account for climate change by reducing the baseline deep percolation from precipitation by 15 percent. The amount of surface water deliveries was not lowered as many of the sources are from outside of the BVWSD area and may not be impacted.
The transition of 2,800 acres of irrigated land will reduce the current cultivated land from about 13,800 to 11,000 acres (BVWSD, 2014). This amounts to about a 20 percent reduction of agricultural land in the Project area. The amount of deep percolation from applied water in the water balance was reduced by this amount to account for this effect. The total amount of surface water was not reduced as it was assumed that this water would still be imported.
Attachment B, Tables B-5 and B-6 provides tables for the cumulative with project water and salt balances.
7.3 Cumulative Effects on Groundwater Levels
The results of analysis of the cumulative with Project effects on groundwater levels are shown on Figures 32 and 33. Table 11 summarizes the effects of the cumulative with Project scenario on groundwater levels.
At the end of the Cumulative with Project forecast period groundwater levels are 1.4 feet lower than baseline conditions.
Because the reduced leakance of water from the perched aquifer, groundwater levels in the main aquifers, decline of about 3.6 feet below baseline conditions.
Table 11 Cumulative Effects – Groundwater Levels
Groundwater Level (in Feet Msl) Analysis Start Finish 2014 2027 Change
Perched Aquifer Baseline 232.5 234.2 1.6Cumulative with Project 232.5 232.8 0.3Main Aquifer Baseline 199.3 186.1 -13.1Cumulative with Project 199.3 182.6 -16.7

A S S E S S M E N T O F P O T E N T I A L G R O U N D W A T E R I M P A C T S
74
7.4 Cumulative Effects on Groundwater Quality
The results of analysis of the cumulative with Project effects on groundwater quality are shown on Figures 34 and 35. Table 12 summarizes the effects of the cumulative with Project scenario on groundwater levels.
The analysis forecasts that salinity will be greater in the perched aquifer in the Project scenario than in the Cumulative with Project scenario. Salinity is forecast to be 1,040 mg/L less than the forecast under the Project scenario, and about 700 mg/L greater than the baseline forecast under the Cumulative with Project scenario. The cumulative water quality forecast is less than that projected with just the Project because cumulative effects reduce applied water to agricultural lands. The applied water percolates into the perched aquifer and carries salt back to the perched aquifer. This effect is also present in the amount of deep percolation from precipitation leaching salts from the soils. Therefore the reduction agricultural lands and climate change reduces the amount of water leaching salts into the perched aquifer and is the reason why the cumulative effects are less than the Project effects alone.
The forecasted changes in TDS in the main aquifer show the concentrations will gradually increase and be about 155 mg/L greater than the baseline forecast under the Cumulative with Project scenario.
Table 12 Cumulative Effects – Groundwater Quality
Salt Concentrations (mg/L) Analysis Start Finish 2014 2027 Change
Perched Aquifer Baseline 1,772 1,662 -110Cumulative with Project 1,772 2,367 594Main Aquifer Baseline 3,965 4,217 252Cumulative with Project 3,965 4,372 407
7.5 Cumulative Effects on Subsidence
Dewatering of saturated clayey sediments can results in inelastic subsidence, especially if they have not previously been dewatered. The perched aquifer is overlain by clayey soils. Existing groundwater levels in 2013 are beneath these soils prior to the cumulative projects. Therefore, lowering of the perched aquifer would have a low potential to create subsidence.
A S S E S S M E N T O F P O T E N T I A L G R O U N D W A T E R I M P A C T S
75
The A-clay is about 20 to 50 feet thick and is estimated to be about 20 to 30 feet below ground surface. A reduction of groundwater levels by about 4 feet in the main aquifer would not lower groundwater levels beneath the bottom of the A-clay and therefore the potential to create subsidence with the cumulative effects is low.
7.6 Summary of Cumulative Impacts
Decreasing the groundwater levels in the perched aquifer by 1.4 feet below the baseline conditions will be beneficial to growers within the Project area.
The lowering of the perched groundwater levels by about 1.4 feet more than baseline will affect the subsurface outflow from the area to the Tulare Lake groundwater subbasin. This reduction of groundwater levels will change the outflow to the Tulare Lake subbasin from the Project area from an average of about 10 to 9.4 AFY or a change of about 6 percent at the Project’s northern boundary. The subsurface inflow to the Tulare Lake groundwater subbasin was estimated to be about 40 AFY. Therefore, the inflow to the subbasin from the perched aquifer would only be reduced to about 39.4 AFY or a change of about 1.5 percent. However, the amount of water in the Tulare Lake groundwater subbasin is about 12,100,000 AF and therefore a reduction by 0.6 AFY is a very small change to the total amount of groundwater in storage.
Additional subsurface outflow from the perched aquifer occurs to the northeast to a small perched water area that is overlain by farmland. About 6 AFY outflows through this area. Recuding groundwater levels by 1.4 would reduce the out flow to 5.4 AFY. The effects of reducing the outflow of water to this area would not be considered significant and again would be beneficial to growers.
The baseline subsurface outflow from the perched aquifer towards the east and the main Kern County groundwater basin was estimated to average about 4 AFY. The subsurface inflow to the main Kern County groundwater basin is similar to that at the Project boundary as most of inflow is from the Project area. Reduction of groundwater levels by 1.4 feet in the perched aquifer would result in about 0.2 AFY or a 5 percent reduction of subsurface inflow from the perched aquifer to the Kern County groundwater basin and the SWSD. However, SWSD performed in-lieu recharge operations in 2011 of 338,000 AF and 146,000 AF in 2013 and therefore the reduction of 0.2 AFY is a small percentage of the total available recharge.
The main aquifer beneath the Project area contains over 400 feet of saturated sediments. The decline in water levels in this aquifer would be about 4 feet below baseline conditions and would only be a change of less than 1 percent.
Subsurface outflow in the main aquifer to the east towards the main Kern County groundwater basin and SWSD was projected to average about 3,400 AFY under baseline conditions. With the decline in groundwater levels by about 4 feet, the outflow would

A S S E S S M E N T O F P O T E N T I A L G R O U N D W A T E R I M P A C T S
76
decrease about 34 AFY. This represents a 1 percent decrease in outflow. SWSD performed in-lieu recharge operations in 2011 of 338,000 AF and 146,000 AF in 2013 and therefore the reduction of 34 AFY is less than significant.
The most notable change will be the changes in water quality in the perched aquifer which supplies some water to the Tulare Lake and main Kern County groundwater basins. The salinity is forecasted to increase from about 1,700 mg/L to about 2,400 mg/L.
The increase in salinity in the main aquifer with the cumulative effects will be about 150 mg/L greater than baseline conditions. This represents a change of about 4 percent over the long-term.
7.7 Impact Evaluation
The potential effects of the Project and cumulative effects were evaluated against significance criteria and mitigation measures are proposed for those potential impacts that have potential significant impacts. Significance criteria from the Environmental Checklist Form, Appendix G of the CEQA Guidelines, were used to evaluate the significance of the potential impacts to groundwater.
Significance criteria relevant to potential groundwater impacts used were:
Will the project:
a) Violate any water quality standards or waste discharge requirements?
b) Substantially deplete groundwater supplies or interfere substantially with groundwater recharge such that there would be a net deficit in aquifer volume or a lowering of the local groundwater table level (e.g., the production rate of pre-existing nearby wells would drop to a level which would not support existing land uses or planned uses for which permits have been granted)?
f) Will the project substantially degrade water quality?
Potential Groundwater Quantity Impacts: The project will lower the local groundwater levels. Shallow perched groundwater with elevated salinity has adversely impacted plant growth and crop yields in affected areas of the District. Lowering the water level in the perched aquifer is one of the goals of the project, because the perched aquifer has poor water quality which has a detrimental effect on agricultural production. The water balance described in this report shows that the Project with cumulative impact may potentially lower the perched aquifer by 1.4 feet below baseline conditions. This impact will not harm existing land uses and is not a significant impact requiring mitigation.
The project will also lower the local groundwater table of the main aquifer. This is not anticipated to reduce the production rate of nearby wells or cause the aquifer to fail to

A S S E S S M E N T O F P O T E N T I A L G R O U N D W A T E R I M P A C T S
77
support existing planned uses. BVWSD will continue to monitor groundwater levels in the main aquifer to confirm that no significant impact is occurring.
There will be a very slight decrease in water flow off-site, feeding other aquifers downstream (Table 13). This change will not result in reduced production rate of wells or cause the downstream aquifers to fail to support existing planned uses and is therefore less than significant.
Potential Groundwater Quality Impacts: The project will increase salinity in the perched and unconfined aquifers and may substantially degrade water quality. Therefore, this impact is potentially significant. However, water quality in the perched aquifer is already poor. The proposed Project with cumulative effects will result in a decline in the water level in the perched aquifer, resulting in less impact to agriculture and other users from the high-saline water.
The TDS in the main aquifer already limits the direct use of the groundwater on most crops. The proposed project with cumulative effects will increase salinity by a small percentage over baseline conditions (Table 13). However the impact is long-term and is considered potentially significant.

A S S E S S M E N T O F P O T E N T I A L G R O U N D W A T E R I M P A C T S
78
Table 13 Impact Assessment Summary
Impact Change from baseline Percent change Level of significance
With Project Cumulative with Project
With Project Cumulative with Project
Decline groundwater level in perched aquifer (in comparison to baseline)
0 Feet 1.4 Feet 0 6% No impact, decline in groundwater levels in cumulative scenario is considered beneficial
Decline in groundwater level in main aquifer (in comparison to baseline)
2.3 Feet 3.6 Feet 0.6% <1% Less than significant
Decline in subsurface outflow from perched aquifer to Tulare Lake groundwater basin
0 AFY 0.6 AFY 0% 6% Less than significant. Total was supply in Tulare Lake groundwater subbasin is 12,100,000 AF
Decline in subsurface outflow from perched aquifer to northeast
0 0.6 AFY 0% 10% Less than significant. Land overlain by farmland, so decline in water level is beneficial to agricultural production
Subsurface outflow from perched aquifer to main Kern County groundwater basin
0 AFY 0.2 AFY 0% of outflow to from perched aquifer, but a tiny fraction of total
5% of outflow from perched aquifer, but a tiny fraction of total
Less than significant. Total recharge in SWSD ranges from 146,000 AFY to 338,000 AFY

A S S E S S M E N T O F P O T E N T I A L G R O U N D W A T E R I M P A C T S
79
Impact Change from baseline Percent change Level of significance
With Project Cumulative with Project
With Project Cumulative with Project
and SWSD recharge recharge
Decline in subsurface outflow from main aquifer to main Kern County groundwater basin and SWSD
20 AFY 34 AFY <1% 1% Less than significant
Increase in TDS in perched aquifer (compared to baseline)
1,745 mg/L 700 mg/L 192% 133% Potentially significant
Increase in TDS in main aquifer
170 mg/L 155 mg/L 4% 4% Potentially significant. Change in TDS is small, but long term

A S S E S S M E N T O F P O T E N T I A L G R O U N D W A T E R I M P A C T S
80
7.8 Mitigation Program
In order to address potentially significant impacts, BVWSD will adopt a mitigation program to lower impacts to a level of non-significance.
Mitigation Measure GW -1: construct a new set of nested or clustered monitoring wells, with screens placed opposite the perched, shallow and deep aquifers to confirm the changes in water quality and water levels these different aquifers.
Mitigation Measure GW -2: If monitoring of the main aquifer (as described in Mitigation Measure GW-1) detects that the water level is declining to a degree that potential impacts to water users may occur, then water conserved by construction of the Northern Area Project will be used to periodically provide additional groundwater recharge to the main aquifer. This recharge will be conducted where the A-clay is not present, as necessary to compensate for the loss of groundwater recharge from the perched aquifer. (Note: this impact is not anticipated based on the analysis in this report, but this mitigation measure is incorporated to address an unexpected outcome.)
Mitigation Measure GW-3: The Brackish Groundwater Remediation Project (BGRP) will be implemented to lower water levels in the perched aquifer and control salinity in both the perched and main aquifer.
The BGRP is designed to remediate brackish groundwater within the BSA by recovering groundwater from two aquifer zones. In the northern Buttonwillow Service Area, the BGRP consists of construction and operating strategically-located shallow and medium depth brackish groundwater recovery wells and collection and conveyance pipelines. The project will pump low quality water from the aquifer and blend it with higher quality water delivered to the Project area through the Northern Area Pipeline, making this water available for agricultural uses. The BGRP will lower and control the salinity in the perched aquifer and the main aquifer.
7.9 Impacts After Implementation of Mitigation Program
The potentially significant impact to water quality will be lowered to a level of less than significant with the implementation of the mitigation program, specifically mitigation measure GW-1 (monitoring of water levels and water quality) and GW-3 (implementation of the Brackish Groundwater Remediation Program).

A S S E S S M E N T O F P O T E N T I A L G R O U N D W A T E R I M P A C T S
81
8 References
Buena Vista Water Storage District (BVWSD). 2014. Agricultural Water Management Plan.
Buena Vista Water Storage District (BVWSD). 2014. Northern Area Pipeline Project, 2014 WaterSMART Grant Application FOA No. R14AS00021.
California Department of Water Resources (DWR). 2004. California’s Groundwater. Bulletin 118 – Update 2003.
California Geologic Survey, 1991. California Geologic Data Map Series – Map No. 2 – Geologic Map of California.
Croft, M.G. and Gordon, G.V. 1968. Geology, Hydrology, and Quality of Water in the Hanford-Visalia Area, San Joaquin Valley, California. USGS Open-File Report 68-67.
Croft. 1972. Subsurface Geology of the Late Tertiary and Quaternary Water-bearing Deposits of the Southern Part of the San Joaquin Valley, California. Geological Water-Supply Paper 1999-H.
Dale R.H., French J.J., and Gordon G.V. 1966. Ground-Water Geology and Hydrology of the Kern River Alluvial-Fan Area, California.
Johnson. 1967. Specific Yield- Compilation of Specific Yields for Various Materials. Geological Survey Water-Supply Paper 1662-D.
Luhdorff and Scalmamni Consulting Engineers. 2014. Land Subsidence from Groundwater Use in California.
Pacific Geotechnical Associates. 1991. Study of the Regional Geologic Structure related to Ground Water Aquifers in the Southern San Joaquin Valley Groundwater Basin, Kern County, California (Phase 1A and Phase 1B).
Page R. W. 1986. Geology of the Fresh Ground-Water Basin of the Central Valley, California with Texture Maps and Sections. Professional Paper 1401-C.
Provost and Pritchard. 2013. Groundwater Management Plan, Buena Vista Water Storage District.
Rector, Michael R. 1983. Westside Groundwater Study, Kern County, California.
Todd. 1980. Groundwater Hydrology.
A S S E S S M E N T O F P O T E N T I A L G R O U N D W A T E R I M P A C T S
82
URS March, 2010. Hydrogeologic Data Acquisition Report, Groundwater Monitoring and Process-Water Well-Field Development Project.
Wood, P.R. and Dale R. H. 1964. Geology and Ground-water Features of the Edison-Maricopa area, Kern County, California. USGS Water Supply Paper 1656.
Woodring, W.P., Stewart, R., and Richards, R.W. 1940. Geology of the Kettleman Hills oilfield, California: U.S. Geol. Survey Prof. Paper 195.