Assessment of Particle Measurement Methods - OICAoica.net/wp-content/uploads/annex-5-1-ada.pdf ·...
34
ADA; S. Weßels, H. Eiterer, Dr. M. Schneider, Dr.-Ing. W. Sebbeße Seite 1 10/2002 Assessment of Particle Measurement Methods Contents 1 Project Description ............................................................................................................ 2 2 The Complexity of Aerosol Measurement ....................................................................... 3 2.1 Basic Considerations .................................................................................................... 3 2.2 Influence of the Sampling Line .................................................................................... 3 2.3 Influence of the Boundary Conditions ......................................................................... 5 2.4 Requirements for a Suitable Method for Type Approval ............................................ 7 3 Assessment of Individual Measurement Methods .......................................................... 8 3.1 DEKATI Electrical Low Pressure Impactor ELPI Method ......................................... 8 3.2 Matter-Engineering Diffusion-Charging Sensor LQ1-DC Measurement Method .... 10 3.3 EcoChem Photoelectric Aerosol Sensor PAS 2000 Measurement Method ............... 13 4 Correlation Measurements ............................................................................................. 14 4.1 Measurement Programme and Overview of Results.................................................. 14 4.2 Correlation ELPI Surface Area – LQ1-DC Active Surface Area .............................. 15 4.3 Correlation LQ1-DC Active Surface – PAS 2000 Measured Value .......................... 16 4.4 Correlation of ELPI Mass – SmartSamplerMass ....................................................... 16 4.5 Assessment of the Correlation Measurements ........................................................... 17 5 Summary and Recommmendations ............................................................................... 18 6 Literature ......................................................................................................................... 20 7 Illustrations ...................................................................................................................... 21
Transcript of Assessment of Particle Measurement Methods - OICAoica.net/wp-content/uploads/annex-5-1-ada.pdf ·...

ADA; S. Weßels, H. Eiterer, Dr. M. Schneider, Dr.-Ing. W. Sebbeße Seite 1 10/2002
Assessment of Particle Measurement Methods
Contents
1 Project Description ............................................................................................................ 2
2 The Complexity of Aerosol Measurement....................................................................... 3 2.1 Basic Considerations.................................................................................................... 3 2.2 Influence of the Sampling Line.................................................................................... 3 2.3 Influence of the Boundary Conditions ......................................................................... 5 2.4 Requirements for a Suitable Method for Type Approval ............................................ 7
3 Assessment of Individual Measurement Methods .......................................................... 8 3.1 DEKATI Electrical Low Pressure Impactor ELPI Method ......................................... 8 3.2 Matter-Engineering Diffusion-Charging Sensor LQ1-DC Measurement Method .... 10 3.3 EcoChem Photoelectric Aerosol Sensor PAS 2000 Measurement Method............... 13
4 Correlation Measurements ............................................................................................. 14 4.1 Measurement Programme and Overview of Results.................................................. 14 4.2 Correlation ELPI Surface Area – LQ1-DC Active Surface Area .............................. 15 4.3 Correlation LQ1-DC Active Surface – PAS 2000 Measured Value.......................... 16 4.4 Correlation of ELPI Mass – SmartSamplerMass....................................................... 16 4.5 Assessment of the Correlation Measurements ........................................................... 17
5 Summary and Recommmendations ............................................................................... 18
6 Literature ......................................................................................................................... 20
7 Illustrations ...................................................................................................................... 21

ADA; S. Weßels, H. Eiterer, Dr. M. Schneider, Dr.-Ing. W. Sebbeße Seite 2 10/2002
1 Project Description Within the context of the continuing uncertainties about possible health-related parameters of
particle emissions from engine combustion [1], discussion continues about the extension to
the definition of the limits. In addition, new particle measurement methods, which ought to be
able make statements on certain particle sizes possible, are increasingly forcing their way onto
the market. Apart from determining the mass by a gravimetric measurement method,
additional information is to be so obtained on particle size or surface area.
For the corresponding measured variables, there are measurement methods on the market or
in development that can be used as laboratory instruments and for immission measurement.
It is the task of the ADA project to assess these methods in terms of their implementation and
suitability in determining the measured variables in the exhaust gas of internal combustion
engines. Still to be cleared up are the relevant measurement boundary conditions that can
influence the measurement result. For the overall assessment, the correlations between the
individual measurement methods and the gravimetric method are to be reviewed. The aim is
the derivation of a standard procedure that is then suitable for the determination of particle
emissions in the exhaust gas of internal combustion engines, both on engine test bench and
chassis dynamometer test bench. To guarantee a secure and reproducible measurement
operation, a suitable calibration procedure is an absolute precondition for test stand operation.
All investigations carried out up to now within the project refer to a current automobile diesel
engine with common rail injection (EU III exhaust gas standard ) that is run on a stationary
engine test bench.
The particle measurement methods used in the project are listed in Table 1.1.
As hardly any of these measurement methods can be used in undiluted engine exhaust gas,
systems for the dilution of raw exhaust gas are necessary.
The dilution systems used in the project are listed in Table 1.2.
These dilution systems cannot be combined with all particle measurement methods as the
volumetric flow necessary in each particular case is device-specific. A comparison of dilution
systems using one selected particle measurement method is therefore only possible within
certain restrictions.

ADA; S. Weßels, H. Eiterer, Dr. M. Schneider, Dr.-Ing. W. Sebbeße Seite 3 10/2002
2 The Complexity of Aerosol Measurement
2.1 Basic Considerations
As fundamental difference between gravimetric particle mass determination and measurement of the parameters: particle number, particle size or surface area; individual particles are measured using the latter of these two methods.
These particles in engine exhaust gas are in principle undefined in terms of their phase – liquid or solid particles can occur; particles with mixed properties (e.g. a solid core surrounded by a liquid phase) are also possible.
These particles are spatially distributed within the gas surrounding them – an aerosol is the result. Having to measure in diluted exhaust gas can give rise to problems with disturbances. Components of the dilution air can increase the total number of particles and make the demarcation between them and the particles produced by the combustion more difficult. Processes of change caused by external influences are taking place all the time in the aerosol. Coagulation, agglomeration and condensation take place as a function of temperature, air humidity and particle concentration. The number and the morphology of the particles are especially influenced by these factors. Systems for exhaust gas dilution must be in a position to stabilize these processes – in the ideal case, to avoid them completely. At the very least, precise knowledge must be available concerning changes in the aerosol along the path from the sampling point in the exhaust gas to the measuring instrument. These changes must be quantifiable in order to guarantee the comparison of measurements from different test stands.
A comparison is only possible when the boundary conditions that prevailed during the measurement are precisely stated and adhered to. A standardization of these conditions is an urgent necessity.
Even when the aspects listed here are guaranteed, an aerosol measurement can only represent a momentary snapshot.
2.2 Influence of the Sampling Line
The transport of the measurement gas from the sampling point (e.g. in the exhaust gas equipment) to the dilution system requires a sampling line.
Stainless steel sampling lines of various lengths are used one after the other on the stationary engine test stand. The particle measurement is carried out with SMPS at a constant engine operating point and with lines heated to 120°C.
The given length of the line (0.3 or 1.7 meters) is the distance between the sampling point close to the engine (exhaust probe ahead of the catalytic converter) and the inlet to the dilution system NanoMet Md19-2E. This then constitutes the transport path of the undiluted exhaust gas.
ADA; S. Weßels, H. Eiterer, Dr. M. Schneider, Dr.-Ing. W. Sebbeße Seite 4 10/2002
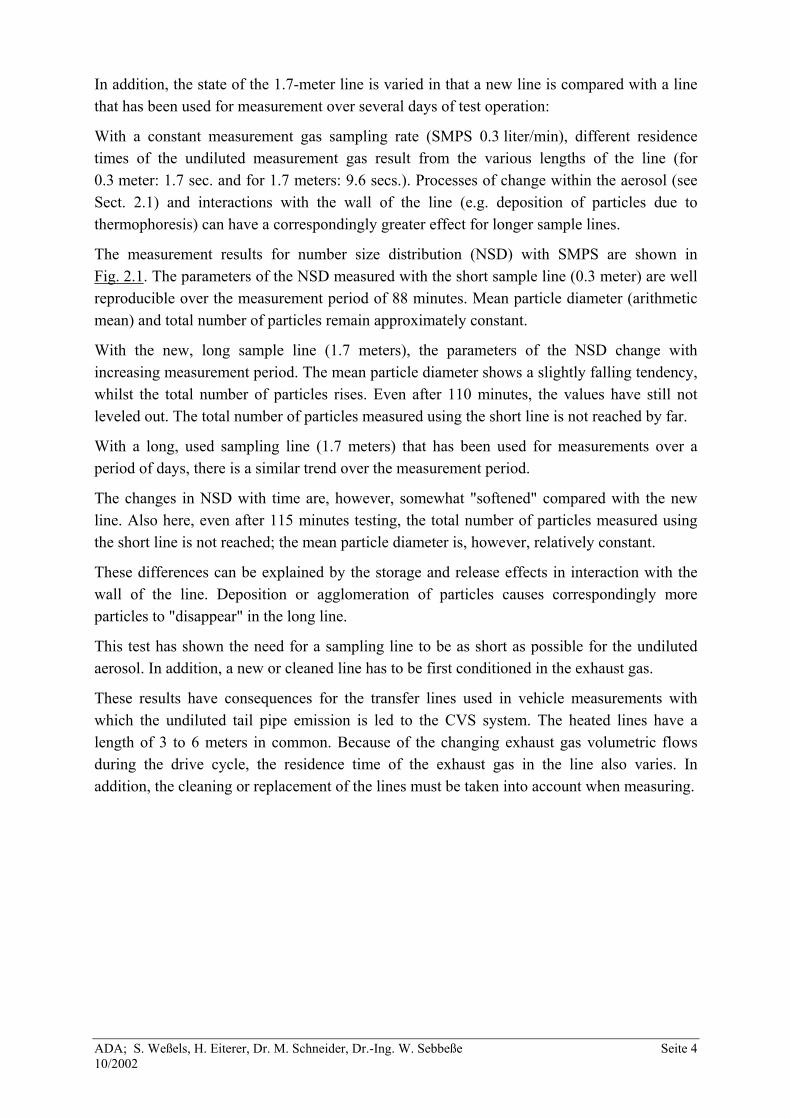
In addition, the state of the 1.7-meter line is varied in that a new line is compared with a line that has been used for measurement over several days of test operation:
With a constant measurement gas sampling rate (SMPS 0.3 liter/min), different residence times of the undiluted measurement gas result from the various lengths of the line (for 0.3 meter: 1.7 sec. and for 1.7 meters: 9.6 secs.). Processes of change within the aerosol (see Sect. 2.1) and interactions with the wall of the line (e.g. deposition of particles due to thermophoresis) can have a correspondingly greater effect for longer sample lines.
The measurement results for number size distribution (NSD) with SMPS are shown in Fig. 2.1. The parameters of the NSD measured with the short sample line (0.3 meter) are well reproducible over the measurement period of 88 minutes. Mean particle diameter (arithmetic mean) and total number of particles remain approximately constant.
With the new, long sample line (1.7 meters), the parameters of the NSD change with increasing measurement period. The mean particle diameter shows a slightly falling tendency, whilst the total number of particles rises. Even after 110 minutes, the values have still not leveled out. The total number of particles measured using the short line is not reached by far.
With a long, used sampling line (1.7 meters) that has been used for measurements over a period of days, there is a similar trend over the measurement period.
The changes in NSD with time are, however, somewhat "softened" compared with the new line. Also here, even after 115 minutes testing, the total number of particles measured using the short line is not reached; the mean particle diameter is, however, relatively constant.
These differences can be explained by the storage and release effects in interaction with the wall of the line. Deposition or agglomeration of particles causes correspondingly more particles to "disappear" in the long line.
This test has shown the need for a sampling line to be as short as possible for the undiluted aerosol. In addition, a new or cleaned line has to be first conditioned in the exhaust gas.
These results have consequences for the transfer lines used in vehicle measurements with which the undiluted tail pipe emission is led to the CVS system. The heated lines have a length of 3 to 6 meters in common. Because of the changing exhaust gas volumetric flows during the drive cycle, the residence time of the exhaust gas in the line also varies. In addition, the cleaning or replacement of the lines must be taken into account when measuring.

ADA; S. Weßels, H. Eiterer, Dr. M. Schneider, Dr.-Ing. W. Sebbeße Seite 5 10/2002
2.3 Influence of the Boundary Conditions
An enhanced nanoparticle concentration can arise under certain conditions, depending on the type of sampling and dilution process used.
It still has to be clarified how the magnitude of the nanoparticle mode in the NSD (here during the SMPS measurement) can be influenced by the type of boundary condition.
To understand these processes, a NSD measurement of the ambient air is carried out on the engine test bench using SMPS. The measurement set-up is shown in Fig. 2.2. A part of the exhaust gas flow from the engine can freely exit from the open sampling point. There is no dilution system, the exhaust gas is spontaneously diluted and simultaneously cooled during the outflow into the surrounding air. The resulting dilution factor of around 10,000 can be estimated from the number of particles in the agglomeration mode.
Nanoparticles can be created by condensation when the pressure falls below the saturation value for volatile components in the exhaust gas.
The NSD measurement of the exhaust gas-enriched ambient air using SMPS takes place at about 1.4 meters from the open sampling point.
Fuel (sulfur content), engine operating point (exhaust gas temperature) and oxidation catalytic converter activity are varied during the test series in order to influence the effect.
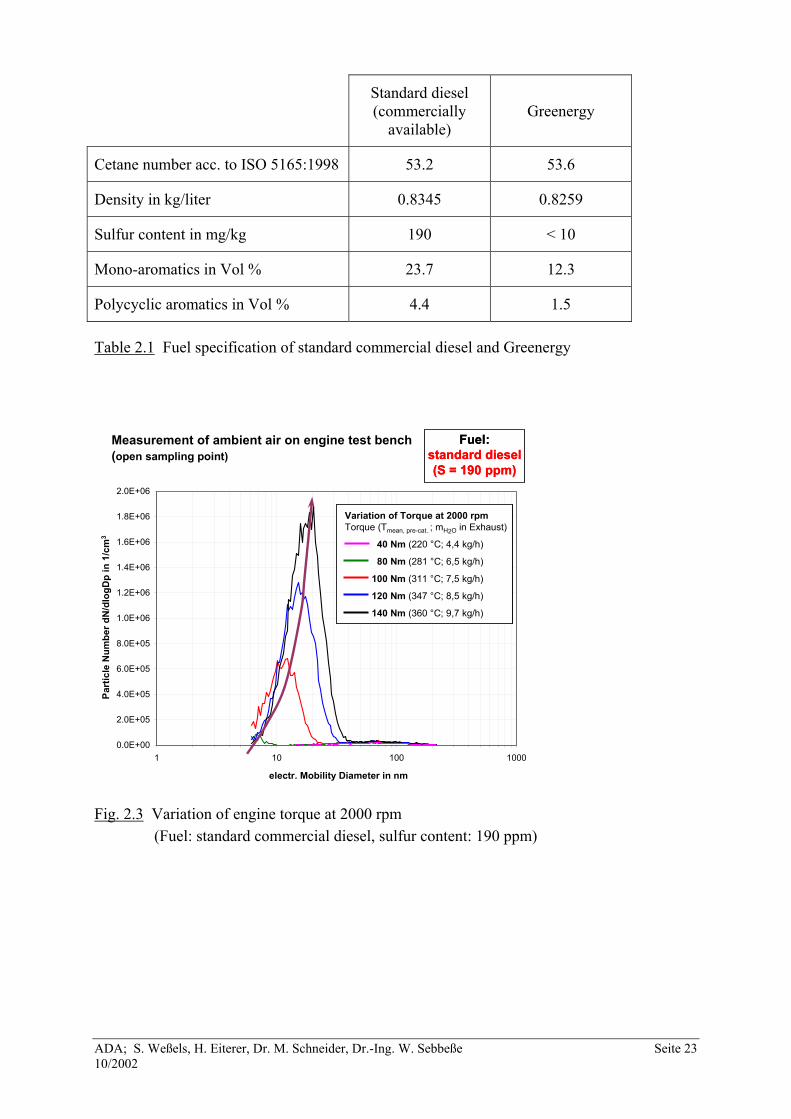
The fuels used are standard commercial diesel from the filling station and Greenergy (see specifications in Table 2.1).
Firstly, using standard commercial diesel fuel and positioning the sampling after the catalytic converter, the engine torque is raised from 40 Nm to 140 Nm at 2000 rpm (see Fig. 2.3). The water content of the exhaust gas and the catalyst temperature (from 220°C to 360°C) rise correspondingly.
At 40 Nm, the NSD measurement shows no nanoparticles in the ambient air. At 80 Nm, a small nanoparticle mode forms with a mean particle diameter of < 10 nm.
With further increases in load, a steeper rise in the number of nanoparticles results with an increase in the mean particle diameter from approximately 10 nm to 20 nm. To estimate the character of the nanoparticle, measurements are carried out with a DMA setting of 15 nm for electrical mobility diameter. For this, a sample filter is placed between DMA and CPC to yield monodisperse (= one size class) particles. Subsequently the particles are analyzed in a transmission electron microscope (TEM). The copper grid filter used is covered with a carbon film which is also suitable for separating off particles in this size range. A CPC comparison measurement, with and without filter, gives correspondingly large differences in the number of particles.
The optical analysis of the TEM samples from the fresh air supplied to engine test bench and of the sample from the air mixture containing elements of exhaust gas shows no differences (see Fig. 2.4).

ADA; S. Weßels, H. Eiterer, Dr. M. Schneider, Dr.-Ing. W. Sebbeße Seite 6 10/2002
In both cases, the number of the particles separated onto the filter is very small. The very large difference in the number of particles as measured by SMPS (see Fig. 2.5) is not found here.
The comparison of SMPS and TEM results leads to the supposition that in the case of the SMPS-measured nanoparticles it must be a matter of liquid components, e.g. condensates (water, hydrocarbons) or sulfates. The SMPS measurement method cannot differentiate between solid and liquid particles whilst the TEM can only depict solid particles (TEM measurements are made in high vacuum).
A repetition of these tests (sampling point downstream of the catalytic converter, increasing engine load) with Greenergy show (see Fig. 2.6) no nanoparticle formation at low engine loads (up to 100 Nm). Only above this level is there a small nanoparticle mode at a mean particle diameter of < 10 nm. The number of particles measured with standard commercial diesel fuel is not reached by far.
To determine the effect of catalyst activity, measurements with the sampling point placed ahead of and behind the catalytic converter are compared. This is carried out separately in turn for each fuel. Firstly, the engine operating point is selected: 2000 rpm, 120 Nm (catalytic converter temperature relatively high at 340°C, above light off).
The comparison (Fig. 2.7) shows that the formation of nanoparticles with standard commercial diesel fuel only takes place downstream of the catalytic converter, the NSD ahead of the converter is more or less identical for the two fuels. With the selection of an engine operating point at very low load (Fig. 2.8): 1430 rpm, 35 Nm, catalytic converter temperature 165°C, below light-off), the NSDs are essentially the same, regardless of the fuel used or the position of the sampling point.
As an overall result, the following conclusions can be drawn:
- The formation of nanoparticles only takes place after having left the exhaust gas equipment. Decisive here is the temperature gradient with time (∆T/∆t) during cooling.
- This process is furthered by a high engine load (high exhaust gas temperature),
high catalytic converter activity and high sulfur content of the fuel.
- The nanoparticles formed under these conditions are not of a solid nature.

ADA; S. Weßels, H. Eiterer, Dr. M. Schneider, Dr.-Ing. W. Sebbeße Seite 7 10/2002
2.4 Requirements for a Suitable Method for Type Approval
An aerosol measurement, i.e. an assessment of individual particles, is a complex process in which the measurement result depends on many boundary conditions.
Even when the actual measurement process can be successfully stabilized, the problems of the necessity to take a sample and to dilute always remain.
Possible changes in the NSD via the sampling point and dilution system during the aerosol measurement must be quantifiable under all circumstances; especially a suitable measuring process for vehicle type approval with the necessity for reproducible absolute measured values.
If this does not succeed then, as a consequence, you have to measure without a sampling and dilution system. Only a direct measurement in undiluted exhaust gas can then lead to a conclusion.
This results in a set of requirements for a method that is specially suited to type approval:
- No dilution necessary
- No sampling necessary => direct measurement in the exhaust gas
- Calibration possible on the test stand
ADA; S. Weßels, H. Eiterer, Dr. M. Schneider, Dr.-Ing. W. Sebbeße Seite 8 10/2002
3 Assessment of Individual Measurement Methods
3.1 DEKATI Electrical Low Pressure Impactor ELPI Method
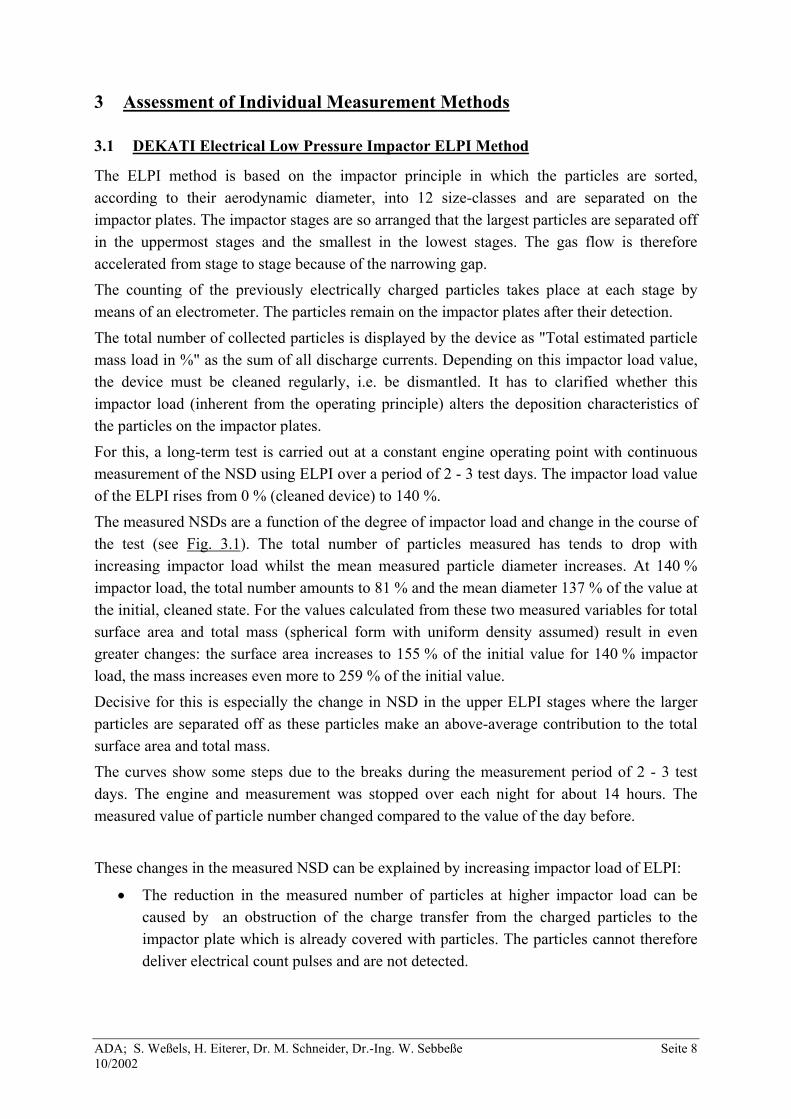
The ELPI method is based on the impactor principle in which the particles are sorted, according to their aerodynamic diameter, into 12 size-classes and are separated on the impactor plates. The impactor stages are so arranged that the largest particles are separated off in the uppermost stages and the smallest in the lowest stages. The gas flow is therefore accelerated from stage to stage because of the narrowing gap. The counting of the previously electrically charged particles takes place at each stage by means of an electrometer. The particles remain on the impactor plates after their detection. The total number of collected particles is displayed by the device as "Total estimated particle mass load in %" as the sum of all discharge currents. Depending on this impactor load value, the device must be cleaned regularly, i.e. be dismantled. It has to clarified whether this impactor load (inherent from the operating principle) alters the deposition characteristics of the particles on the impactor plates. For this, a long-term test is carried out at a constant engine operating point with continuous measurement of the NSD using ELPI over a period of 2 - 3 test days. The impactor load value of the ELPI rises from 0 % (cleaned device) to 140 %. The measured NSDs are a function of the degree of impactor load and change in the course of the test (see Fig. 3.1). The total number of particles measured has tends to drop with increasing impactor load whilst the mean measured particle diameter increases. At 140 % impactor load, the total number amounts to 81 % and the mean diameter 137 % of the value at the initial, cleaned state. For the values calculated from these two measured variables for total surface area and total mass (spherical form with uniform density assumed) result in even greater changes: the surface area increases to 155 % of the initial value for 140 % impactor load, the mass increases even more to 259 % of the initial value. Decisive for this is especially the change in NSD in the upper ELPI stages where the larger particles are separated off as these particles make an above-average contribution to the total surface area and total mass. The curves show some steps due to the breaks during the measurement period of 2 - 3 test days. The engine and measurement was stopped over each night for about 14 hours. The measured value of particle number changed compared to the value of the day before. These changes in the measured NSD can be explained by increasing impactor load of ELPI:
• The reduction in the measured number of particles at higher impactor load can be caused by an obstruction of the charge transfer from the charged particles to the impactor plate which is already covered with particles. The particles cannot therefore deliver electrical count pulses and are not detected.
ADA; S. Weßels, H. Eiterer, Dr. M. Schneider, Dr.-Ing. W. Sebbeße Seite 9 10/2002
• The gas flow is accelerated when the space between jet plate and collection plate within an impactor stage becomes smaller, caused by the deposition of the particles. Smaller particles are therefore separated off on this impactor plate. When the device is clean, these particles would not be separated until the next lower impactor stage. The particle size distribution shifts towards the larger diameters, i.e. the mean particle diameter increases.
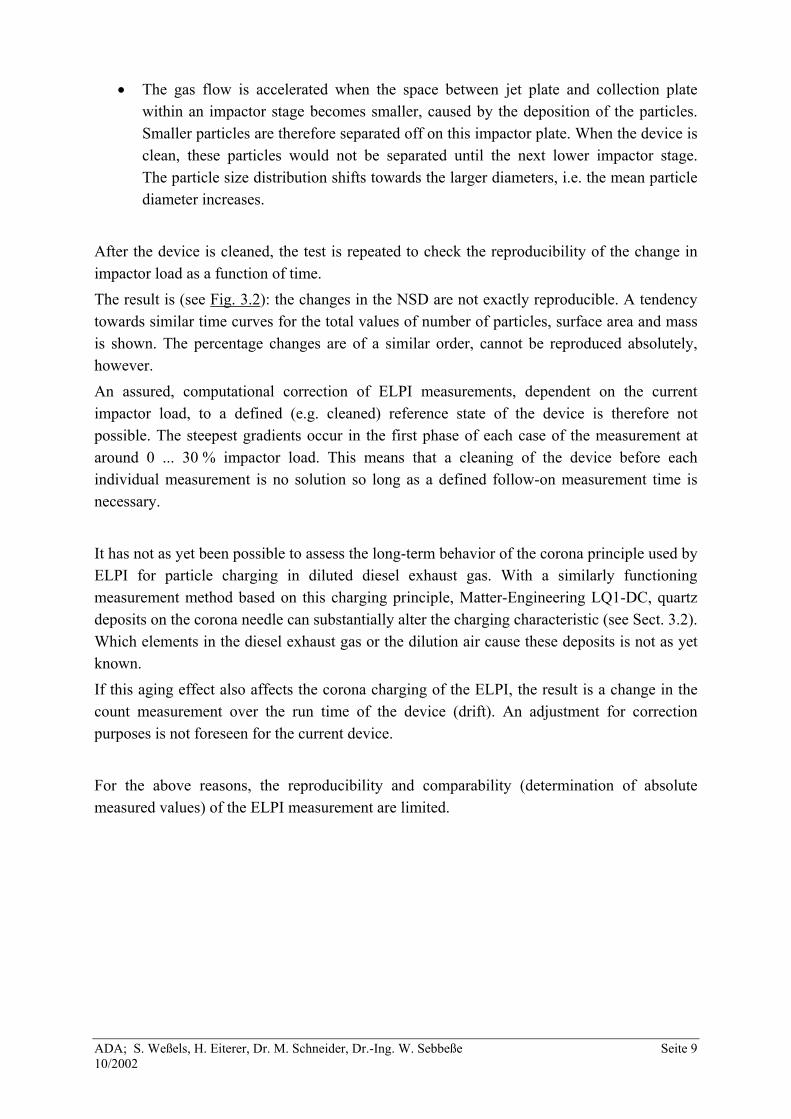
After the device is cleaned, the test is repeated to check the reproducibility of the change in impactor load as a function of time. The result is (see Fig. 3.2): the changes in the NSD are not exactly reproducible. A tendency towards similar time curves for the total values of number of particles, surface area and mass is shown. The percentage changes are of a similar order, cannot be reproduced absolutely, however. An assured, computational correction of ELPI measurements, dependent on the current impactor load, to a defined (e.g. cleaned) reference state of the device is therefore not possible. The steepest gradients occur in the first phase of each case of the measurement at around 0 ... 30 % impactor load. This means that a cleaning of the device before each individual measurement is no solution so long as a defined follow-on measurement time is necessary. It has not as yet been possible to assess the long-term behavior of the corona principle used by ELPI for particle charging in diluted diesel exhaust gas. With a similarly functioning measurement method based on this charging principle, Matter-Engineering LQ1-DC, quartz deposits on the corona needle can substantially alter the charging characteristic (see Sect. 3.2). Which elements in the diesel exhaust gas or the dilution air cause these deposits is not as yet known. If this aging effect also affects the corona charging of the ELPI, the result is a change in the count measurement over the run time of the device (drift). An adjustment for correction purposes is not foreseen for the current device. For the above reasons, the reproducibility and comparability (determination of absolute measured values) of the ELPI measurement are limited.

ADA; S. Weßels, H. Eiterer, Dr. M. Schneider, Dr.-Ing. W. Sebbeße Seite 10 10/2002
3.2 Matter-Engineering Diffusion-Charging Sensor LQ1-DC Measurement Method
The LQ1-DC measurement method uses the probability of deposition of ions on particles for measuring the active particle surface area. Firstly, particles are electrically charged by diffusion (unipolar corona charging). The discharge current of the particles is determined by a downstream measurement filter (electrometer). This is a measure for the deposition coefficients of the ions from which the so-called Fuchs surface area or active surface area can be calculated. The measurement does not take place on a single particle basis, only the total active surface area within a defined aerosol volume is given. In combination with number and size measurement methods, an attempt is made to determine a size-specific active surface area of the particles. For this, particles are selected with the DMA which have a defined electrical mobility class. With the CPC, the number of particles in the particular mobility class is determined; with the LQ1-DC, the active surface area in this mobility class is determined. By varying the setting of the DMA, various mobility classes are selected one after the other and the number and surface area are determined for each mobility class alternately. In this, the computational corrections, necessary because of the size-dependent charging efficiency of the DMA, are deactivated. Only those particles leaving the DMA are measured. The particle size distribution put together from the particle number measurements (see Fig. 3.3) shows the well-known curve with the maximum number occurring at around 80 nm electrical mobility diameter. Below approx. 10 nm there are no more particles, above 200 nm the number is quite small. The size-dependent curve of the active surface area reaches its maximum value at approx. 120 nm electrical mobility diameter. Below around 50 – 70 nm, the active surface area shows a finite value of about 45 µm2/cm3. Although the number continues to fall with reduction in particle size, the surface area remains constant. The measurement of the numbers by the CPC is reliable, also in this size range [2]. With that, the surface area value given by the LQ1-DC is not plausible. The method determines a finite surface area of the smallest particles which, according to the CPC measurement, do not exist. The surface area measurement using LQ1-DC therefore leads to an overestimation of the nanoparticles (electrical mobility diameter < 50 nm). According to Kittelson [3], the detection limit in methods with diffusion charging (DC) lies with particles under 80 nm electrical mobility diameter. No plausible measured values are to be expected below this particle size. After a longer time in operation with the LQ1-DC when used to measure surface area in dilute diesel engine exhaust gas, a much slower response time of the device was observed when connected to the gas sample. In addition, it was no longer possible to carry out measurements of the ambient air at low aerosol concentrations with the device. With the corona charging switched off, the measured value should always be zero as no ionization of the particles takes

ADA; S. Weßels, H. Eiterer, Dr. M. Schneider, Dr.-Ing. W. Sebbeße Seite 11 10/2002
place. The zero value can be adjusted on the device by a potentiometer. This adjustment must be made very often if the LQ1-DC has been in operation for a longer period of time (several times per day when measurements are being made). A stable zero setting was therefore no longer achievable. An inspection of the LQ1-DC by the manufacturer Matter-Engineering found a "massive loss in sensitivity". The cause was found to be a white quartz layer that had built up on the platinum wire of the corona charger during measuring operation. This reduces the corona current and the aerosol can no longer be charged as in the initial state. Which elements ("chemical influences") in the diesel exhaust gas cause these deposits is not as yet known. Similar quartz deposits have also been observed [4] in electrostatic air cleaners that function by corona charging. Longer operating times of the cleaner in ambient air polluted with cyclomethicone (a siloxane, e.g. present in deodorant sprays) led to a contamination of the corona wire (Fig. 3.4). The corona-voltage necessary for the charging of the ambient air has to be increased considerably. At the same time, a severe change in the charging characteristic takes place – the voltage/current curve is no longer linear. A loss of the evenly distributed discharges for a clean wire caused by deposits occurs; only few discharge centers are formed. The volume of influence of the corona on the gas decreases sharply. The diffusion charging of the aerosol using a corona is the basis of the LQ1-DC measuring principle. If the aging effect of the corona found in the air cleaner can be transferred to the measurement method of the LQ1-DC, it means that: The charging of the particles is no longer reproducible; only a small fraction of the aerosol will be charged. In this situation, no reproducible measurement is possible. A retro-fitted corona current control from the manufacturer ought to bring an improvement. A comparison of the surface area measurements with the original device (Fig. 3.5) and with a modified variant (Fig. 3.6) shows severe oscillations in the measurement signals for the variant with corona current control. A renewed inspection by the manufacturer showed the cause to be an inadequate electrical insulation between the measuring filter and the surrounding enclosure. The measuring filter captures the charged particles. The electrical resistance between it and the enclosure should be approximately 1012 Ohm as only very small discharge currents of a few fA are measured. With particle deposits on the insulating surfaces (carbon is an electrical conductor), the insulation effect can be reduced and corresponding discharge currents can flow over the surfaces with deposits. This leads to instability and drift of the measurement signal. Similar effects occur when moisture is present in the device.
ADA; S. Weßels, H. Eiterer, Dr. M. Schneider, Dr.-Ing. W. Sebbeße Seite 12 10/2002
This results in an assessment of the suitability of the LQ1-DC measurement method for particle measurements in diluted diesel engine exhaust gas:
• Low stability of the measurement signal => continual zero adjustment necessary, possible causes: moisture in the device, change in the insulation resistance
• The basic suitability of corona charging is questionable because of the unknown "chemical influences" in the measurement gas with the formation of deposits on the corona wire
• The basic suitability for the surface area measurement of particles < 50 nm (nanoparticles) is questionable
As in testing practice the exhaust gas is neither dry nor carbon-free, the method is not very suitable for long-term measurements in dilute diesel exhaust gas. In addition, the nanoparticles are much overestimated in the current model of the LQ1-DC.

ADA; S. Weßels, H. Eiterer, Dr. M. Schneider, Dr.-Ing. W. Sebbeße Seite 13 10/2002
3.3 EcoChem Photoelectric Aerosol Sensor PAS 2000 Measurement Method
The EcoChem Photoelectric Aerosol Sensor PAS 2000 measurement method makes use of the sensitivity of particles to photoelectric charging. The wavelength of the UV radiator (222 nm) used for the charging is adjusted to suit the ionization of the polycyclic aromatic hydrocarbons (PAH) deposited on the particles. The discharge current of the particles is determined by a downstream measurement filter (electrometer). This is then a measure for the PAH deposited on the particles. With an appropriate calibration, predictions of mass concentration of PAH in µg/m3 can be made. There are hints, that this method can be used to determine the mass concentration of elemental carbon (EC) [5]. This presupposes an unambiguous correlation of the PAS 2000 signal with the mass of the EC, which would only be satisfied by a constant PAH deposition mechanism and a constant PAH deposition quota. To check this correlation, measurements were made with PAS 2000 and AVL SmartSampler in dilute exhaust gas ahead of and after the catalyst (see Sect. 4.1). The particle mass was able to be determined from the deposits on the sample filters of the SmartSampler as total mass concentration and as mass concentration of the insoluble fractions (insoluble organic fraction INSOF). The INSOF fraction for the diesel engine consists essentially of elemental carbon. Hence a good correlation with the PAS 2000 signal should be obtained if this method can really determine EC. However, the measurements especially after the catalyst are not plausible as there is almost no PAS 2000 measurement signal present here – although no severe change in particulate mass (especially INSOF) has taken place in the catalyst. On the other hand, it can be assumed that the PAH fractions are oxidized in the catalyst, especially at engine operating points with higher exhaust gas temperature. This therefore excludes a correlation of the PAS 2000 measurement signal with the mass of the EC for measurements in dilute diesel engine exhaust gas. The assessment of the suitability of this measurement method is therefore:
• An uncertainty exists about the real measurement variable (EC mass concentration is not plausible)
• Measurements after the catalyst indicate no correlation with other measurement methods (e.g. also not with gravimetrically determined particulate mass)
• The photoelectric charging as an optical process functions only at low particle number concentration or high dilution
The method is especially unsuitable for measurements downstream of the catalyst as practically no signal exists there. The method cannot therefore be used for the assessment of the particle emission for a vehicle in an emission test cycle (tailpipe measurement or from the CVS dilution system).

ADA; S. Weßels, H. Eiterer, Dr. M. Schneider, Dr.-Ing. W. Sebbeße Seite 14 10/2002
4 Correlation Measurements
4.1 Measurement Programme and Overview of Results
With the measurement methods to be assessed here, various physical properties of the particles are determined in each case. The morphology and the chemical properties of the particles should play a subordinate role or no role at all here.
Of interest is now the question of how far the measurements of various particle properties can be compared with each other. Independent of the type of measurement method used, a correlation between principally identical measurement variables can be expected. The particle number determined by ELPI should, for example, correlate with the number of the SMPS measurement or even, in the ideal case, be identical to it. The same is then true for the measurement or calculation of the comparable surface areas or masses.
If correlations independent off the boundary conditions of the measurement do clearly exist between the various particle measurement variables, this can also be used for calibration or as a chain of traceability to a standard aerosol.
To check the correlations between the measurement methods considered here (SMPS, LQ1-DC, PAS 2000, ELPI, AVL 415S Smokemeter, AVL 472 SmartSampler), a comparison measurement is carried out on the stationary engine test bench. The tests are carried out on a currently available automobile diesel engine with common rail injection (EU III exhaust gas standard ) and oxidation catalyst. All measurement methods are connected to a selection valve developed by ADA that feeds a part flow of the engine exhaust gas selectively to each measurement method or dilution system. The measurement set-up is shown in Fig. 4.1.
By switching over the valve, a series of measurements from all the methods with identical exhaust gas is generated. The engine operating point is held stable over the entire measurement period. Twenty-eight operating points are selected from the overall engine map as shown in Fig. 4.2. This series of tests is carried out in sequence with sampling ahead of and behind the oxidation catalyst.
To interpret the results, the assumed linear correlations of seven direct and five derived measured variables are examined and, with the respective coefficient of determination R2 stated in each case, are shown in Table 4.1. The results are shown in Table 4.2.
The derived variables are calculated from the direct measured variables with certain assumptions. From the aerodynamic diameter of a particle determined by ELPI, a geometric "surface aerodynamics" can be calculated with the simple assumption of a spherical form and a "mass aerodynamics" can be calculated with the assumption of a size-independent, uniform particle density. In combination with the measurement variable particle number, values can in this way be specified for the "aerodynamics" total surface area and total mass. This calculation makes at first no claim to determine quantitatively comparable values for surface area and mass and is not intended to replace a direct measurement.

ADA; S. Weßels, H. Eiterer, Dr. M. Schneider, Dr.-Ing. W. Sebbeße Seite 15 10/2002
Interesting, however, is the observation of the correlations between measured and values calculated from the NSD based on simple assumptions.
In addition, because of the grouping of the operating points, the measurement conditions are examined that can influence a correlation. In this, it is differentiated between all measurements, those only ahead of and only after the catalyst as well as the engine operating points under exhaust gas test conditions in the NEDC (these only downstream of the catalyst).
The results of the correlation check of the methods considered here (ELPI, LQ1-DC, PAS 2000, AVL 472 SmartSampler) are compiled in Table 4.2. The particular coefficients of determination R2 are given with a color-coding depending on the quality of the linear correlation. The cell in the table shows the different measurement conditions.
The highest correlations (R2 = 0.74 ... 0.97) are obtained between the comparison of the surface calculated from ELPI data and that of the active surface measured with LQ1-DC. There are also, in part, high correlations between the ELPI surface area or mass with the gravimetrically determined mass concentrations of the SmartSampler. The distinction of the mass concentration between total and mass of the insoluble components (INSOF) has no great influence on these correlations.
Nor shown here are the correlations between the mean particle diameter determined from the NSD of ELPI and the measured variables for surface area or mass. All the correlations determined in this series of measurements in combination with the mean diameter have indices of determination with R2 < 0.50 and are therefore not worthy of consideration here.
In the following, several selected correlations will be studied more closely.
4.2 Correlation ELPI Surface Area – LQ1-DC Active Surface Area
Depending on the measurement conditions, medium to high correlations (R2 = 0.74 ... 0.97, see Fig. 4.3) between the comparison of the surface area calculated from the ELPI's NSD and that of the active surface area measured with LQ1-DC are obtained . The distinction between before and after the catalyst is the difference between the gradients of the linear trend curves. With this separate consideration, higher indices of determination are achieved in each case. Under the conditions of the emission test cycle NEDC, a very high correlation of R2 = 0.97 is obtained with very low deviations from the trend curve.
If these results can be transferred to vehicle measurements, then a suitable correlation under exhaust gas test conditions can be assumed.

ADA; S. Weßels, H. Eiterer, Dr. M. Schneider, Dr.-Ing. W. Sebbeße Seite 16 10/2002
4.3 Correlation LQ1-DC Active Surface – PAS 2000 Measured Value
According to information from the manufacturer, a constant as "chemical fingerprint" for the clear identification of combustion particles [7] should be obtainable from the ratio of the measured values for active surface area (LQ1-DC) and deposited PAH (PAS 2000).
The correlation check (see Fig 4.4) can, however, only confirm the validity of this statement for measurements ahead of the catalyst (R2 = 0.93). The correlation after the catalyst is, at R2 = 0.71, lower and differs greatly from that ahead of the catalyst in the gradient of the trend curve. Under the conditions of the exhaust gas test, virtually no correlation is visible at R2 = 0.46.
So, from this unsuitable correlation no useful statements can be expected for vehicle measurements under emission test cycle conditions like NEDC.
4.4 Correlation of ELPI Mass – SmartSamplerMass
The calculated mass concentration "Aerodynamic" is determined from the NSD calculated with ELPI on the assumption of particle with spherical form and size-independent, uniform density of 1.2 g/cm3. The comparison of the values obtained by this method with those of the gravimetrically determined total mass of the SmartSampler measurement shows medium to high correlations (R2 = 0.70 ... 0.93; see Fig. 4.5). The coefficient of determination is higher (R2 = 0.93) for the for the measurements downstream of the catalyst. This is also true for the conditions of the emission test cycle with R2 = 0.89. The correlation ahead of the catalyst can be improved to R2 = 0.88 if only the insoluble parts of the particulate matter (INSOF) are considered, while the correlation after the catalyst is not affected (see Fig. 4.6).
As a size-independent density for particles sorted on a size basis from diesel engines cannot be assumed [8], a further improvement in the correlation of the mass values compared here is to be expected from knowledge of this size-dependent density function. However, it still has to be checked here to what extent this density function is engine-specific.

ADA; S. Weßels, H. Eiterer, Dr. M. Schneider, Dr.-Ing. W. Sebbeße Seite 17 10/2002
4.5 Assessment of the Correlation Measurements
A combination of number and diameter in the form of the NSD with the calculated values obtained for surface area or mass yields to a usable correlation with the corresponding measurement values. Even with the hypothetical assumption of the spherically-shaped particle and uniform, size-independent density, good correlations are obtained from the NSD for active surface area or gravimetrically determined mass. A further improvement in the correlation quality is to be expected when more realistic assumptions for particle geometry and density are made. For this, however, the state of knowledge in this area still has to be set up or improved. Vehicle measurements on chassis dynamometer show a good correlation between the route-related values for total particle number (in number/km) and particulate mass (in grams/km) [6].
Based on the measurements introduced here, the result is that suitable correlations are those that can be obtained via the measured or calculated values for surface area or mass.
These correlations are then also valid downstream of the catalyst under emission test conditions.

ADA; S. Weßels, H. Eiterer, Dr. M. Schneider, Dr.-Ing. W. Sebbeße Seite 18 10/2002
5 Summary and Recommmendations
The relevant parameters are still uncertain in terms of possible health effects due to particulate emission from internal combustion engines. There is an ongoing discussion at the moment about new parameters to be measured in the future such as particle diameter, particle number or particle surface area in addition to particulate mass. The task of this ADA project is to assess the measurement technology for these new parameters in measuring particulate emissions from internal combustion engines.
Measurement of Aerosols is much more complex than determining mass as spatially distributed single particles within a carrier gas are being measured. The number concentration and morphology of the particles are changing continuously under external influences. For this reason, an aerosol measurement is always only a snapshot at a certain measuring point. Large changes in the number concentration of the particles can occur because of agglomeration and interactions of the aerosol with the exhaust gas sampling lines. The residence time of the aerosol in the lines and the condition of the line itself are the major factors affecting the measurement result. The exhaust gas sampling lines should therefore be as short as possible and preconditioned in exhaust gas.
The formation of nanoparticles can increase - even at high dilution ratios - due to the rapid cooling of engine exhaust gas. This process is enhanced by high engine load (corresponding to high exhaust gas temperature), high activity of the catalyst and high fuel sulfur content. The nanoparticles formed under these conditions are not of a solid nature.
Should an aerosol measurement be employed for vehicle type approval, the possible resulting changes in particle size distribution from the boundary conditions of the measurement must be quantifiable as absolute limiting values have to be observed. Without this quantification, no reproducible absolute measurement values can be expected. The only promising solution here is a direct measurement in undiluted engine exhaust gas without the necessity of exhaust gas sampling lines and dilution systems. Without a calibration process that works in practice, there can be no reliable and secure measurement of particulate emission.
Particle size distribution measured using the ELPI method and the variables which can be derived therefrom (number, aerodynamic diameter, surface area, mass) are dependent on the value of impactor total load (governed by the process) in the measuring device. This effect is inherent in the measuring principle.
Reproducibility and comparability of ELPI measurements are therefore limited.
The basic suitability of a corona charger in order to charge particles electrically has to be called into question if this principle is applied to exhaust gas from internal combustion engines.
ADA; S. Weßels, H. Eiterer, Dr. M. Schneider, Dr.-Ing. W. Sebbeße Seite 19 10/2002
The measurements with LQ1-DC are not plausible in the nanoparticle range – which is why nanoparticles are overestimated. Here also, the basic suitability of a corona charger for electrical charging of the particles in combustion engine exhaust gas has to be called into question due to aging effects observed. Moisture and a change in the internal electrical insulation resistance due to particle deposition lead to poor stability in the measurement signal. Long-term stability in the measurement of combustion engine exhaust gas is therefore not possible.
In the PAS 2000 measurement method, there is an uncertainty concerning the actual measurement variable. Because of the poor correlation of the measurement output signal with the gravimetric particulate mass determination, especially for measurements downstream of the catalyst, elemental carbon (EC) is practically eliminated as a measurement variable. The method cannot therefore be used for the assessment of the particulate emission for a vehicle during a driving cycle. There are correlations between methods which determine the number size distribution (NSD) and methods where surface or mass is measured. A combination of number and diameter in the form of the NSD with the values calculated from it for surface area or mass yield to a usable correlation with the corresponding measurement values. Vehicle measurements on chassis dynamometer show a good correlation between the route-related values for total particle number (in number/km) and particulate mass (in grams/km) [6].
None of the measurement methods investigated here (ELPI, LQ1-DC, PAS 2000) is suitable for reliable and quantitative determination of particulate emission in exhaust gas from internal combustion engines.
Especially the long-term stability of the particle measurement methods has to be called into question.
According to the current technical state of the measurement methods, none of the particle measurement instruments investigated here (ELPI, LQ1-DC, PAS 2000) can be recommended for the measurement of number or surface area concentration in the exhaust gas of internal combustion engines.
The reasons for this are in part of a fundamental nature and in part for reasons associated with a specific instrument.

ADA; S. Weßels, H. Eiterer, Dr. M. Schneider, Dr.-Ing. W. Sebbeße Seite 20 10/2002
6 Literature
[1] Wass, U.
"Health effects of particulate matter - what is known and what role is played
by exhaust particles?"
FISITA-Paper F02E333, FISITA World Automotive Congress,
2. - 7. June 2002, Helsinki
[2] TSI Product Information "Model 3025A Ultrafine Condensation Particle Counter"
TSI Inc. 1993
[3] Kittelson, D.B.; Zachariah, M.R.
"Response of DC and PAS to size fractionated particles"
5th ETH Conference on Nanoparticle Measurement, Zürich, August 6, 2001
[4] Davidson; McKinney
"Chemical Vapor Deposition in the Corona Discharge of Electrostatic Air Cleaners"
Aerosol Science and Technology 29/1998
[5] Przybilla; Berkhahn; Burtscher; Dahmann; Matter; Rietschel
"Monitoring diesel particulates in working areas with the photoelectric aerosol sensor"
Gefahrstoffe - Reinhaltung der Luft Nr. 6, June 2002
[6] Bechmann; Carli; Engeler; Garbe; Lach; Ryan; Schindler
"Partikelemission und -messung aus Sicht des Anwenders: heute und morgen"
23. Internationales Wiener Motorensymposium, April 25-26, 2002
[7] Siegmann, K.; Siegmann, H.C.
"Die Entstehung von C-Partikeln bei der Verbrennung organischer Treibstoffe"
HdT-Tagung Feinpartikelemissionen von Verbrennungsmot., October 12-13, 1999
[8] Kittelson; McMurry; Park; Sakurai; Tobias; Ziemann
"Chemical and physical characteristics of diesel aerosol"
8th Diesel Engine Emission Reduction Conference, August 27, 2002

ADA; S. Weßels, H. Eiterer, Dr. M. Schneider, Dr.-Ing. W. Sebbeße Seite 21 10/2002
7 Illustrations
Measurement Method
Measurement Principle Measurement Variables Dilution System
Required
SMPS
Scanning Mobility Particle Sizer
Deflection of electrically charged particles combined
with optical counting
• Number size distribution
• Electrical mobility diameter
• Total particle number
Yes
ELPI
Electrical Low
Pressure Impactor
Impactor principle with electrical counting
• Number size distribution
• Aerodynamic diameter
• Total particle number
Yes
LQ1-DC
Diffusion Charger
Diffusion charging with electrical detection
• Active particle surface area (not on a single particle basis)
Yes
PAS 2000
Photoelectric Aerosol Sensor
Photoelectric charging (UV light) with electrical detection
• Polycyclic aromatic hydrocarbons (PAH) deposited on particles
Yes
AVL 415 S Smokemeter
Light reflection from a filter paper
• Filter smoke number FSN No
AVL SPC 472 SmartSampler
Part flow dilution with filter layer deposit
and subsequent gravimetric mass determination
• Particulate mass on filter Integrated in instrument
Table 1.1 Particle measurement methods used in the project
System Principle Heating Dilution Factor
AVL SPC 472 SmartSampler
Mini dilution tunnel, part flow (constant volume flow)
50 °C (Tunnel) 5 - 50
Matter Engineering NanoMet MD 19-2 E
Addition of exhaust gas using rotating chamber disk
120 °C, 150 °C 20 - 3000
TSI / Dekati Ejector dilution stage (2-stage)
Ejector dilution 2nd Stage max.
450 °C approx. 100
Table 1.2 Dilution systems used in the project

ADA; S. Weßels, H. Eiterer, Dr. M. Schneider, Dr.-Ing. W. Sebbeße Seite 22 10/2002
all measurements in diluted exhaust (DF: 300)
0 20 40 60 80 100 1206.0x104
8.0x10⁴
1.0x10⁵
1.2x10⁵
1.4x10⁵
1.6x10⁵
1.8x10⁵
2.0x10⁵
2.2x10⁵
2.4x10⁵
Time after 1. Measurement in Min
Tota
l Par
ticle
Num
ber i
n 1/
cm3
Transfer Line: Short Long New Long Used
10 1000.0
5.0x10⁴
1.0x10⁵
1.5x10⁵
2.0x10⁵
2.5x10⁵
3.0x10⁵
3.5x10⁵
4.0x10⁵
Time
Parti
cle
Num
ber d
N/d
logD
p in
1/c
m³
electr. Mobility Diameter in nm
1) Short Transfer Line Time after 1. Meas.:
0 Min 32 Min 88 Min
10 1000.0
5.0x10⁴
1.0x10⁵
1.5x10⁵
2.0x10⁵
2.5x10⁵
3.0x10⁵
3.5x10⁵
4.0x10⁵
2) Long Transfer Line new
electr. Mobility Diameter in nm
Parti
cle
Num
ber d
N/d
logD
p in
1/c
m³
Time after 1. Meas.:
0 Min 30 Min 80 Min 110 Min
10 1000.0
5.0x10⁴
1.0x10⁵
1.5x10⁵
2.0x10⁵
2.5x10⁵
3.0x10⁵
3.5x10⁵
4.0x10⁵
Time
3) Long Transfer Line used
electr. Mobility Diameter in nm
Parti
cle
Num
ber d
N/d
logD
p in
1/c
m³
Time after 1. Meas.:
0 Min 31 Min 81 Min 115 Min
Fig. 2.1 Influence of the transfer line
SMPSPoint of Aerosol - Measurement
Engine Oxidation-Catalyst Muffler
Outlet ofused air
Supply offresh air(filtered)
1.40 m
Measurement of ambient air on engine test bench(open sampling point)
1.40 m
Fig. 2.2 Measurement set-up for ambient air measurement on engine test bench
ADA; S. Weßels, H. Eiterer, Dr. M. Schneider, Dr.-Ing. W. Sebbeße Seite 23 10/2002
Standard diesel (commercially
available) Greenergy
Cetane number acc. to ISO 5165:1998 53.2 53.6
Density in kg/liter 0.8345 0.8259
Sulfur content in mg/kg 190 < 10
Mono-aromatics in Vol % 23.7 12.3
Polycyclic aromatics in Vol % 4.4 1.5
Table 2.1 Fuel specification of standard commercial diesel and Greenergy
0.0E+00
2.0E+05
4.0E+05
6.0E+05
8.0E+05
1.0E+06
1.2E+06
1.4E+06
1.6E+06
1.8E+06
2.0E+06
1 10 100 1000elektr. Mobilitätsdurchmesser in nm
Part
ikel
anza
hl d
N/d
logD
p in
1/c
m³
nach KatSchwefel KRSTLastvar bei 2000(Last und Vorkattemp. angeben)40,80,100,120,140 Nm
Variation of Torque at 2000 rpmTorque (Tmean, pre-cat. ; mH2O in Exhaust)
40 Nm (220 °C; 4,4 kg/h)
80 Nm (281 °C; 6,5 kg/h)
100 Nm (311 °C; 7,5 kg/h)
120 Nm (347 °C; 8,5 kg/h)
140 Nm (360 °C; 9,7 kg/h)
Variation of Torque at 2000 rpmTorque (Tmean, pre-cat. ; mH2O in Exhaust)
40 Nm (220 °C; 4,4 kg/h)
80 Nm (281 °C; 6,5 kg/h)
100 Nm (311 °C; 7,5 kg/h)
120 Nm (347 °C; 8,5 kg/h)
140 Nm (360 °C; 9,7 kg/h)
Measurement of ambient air on engine test bench(open sampling point)
Fuel:standard diesel(S = 190 ppm)
Fuel:standard diesel(S = 190 ppm)
electr. Mobility Diameter in nm
Part
icle
Num
ber d
N/d
logD
p in
1/c
m3
Fig. 2.3 Variation of engine torque at 2000 rpm (Fuel: standard commercial diesel, sulfur content: 190 ppm)

ADA; S. Weßels, H. Eiterer, Dr. M. Schneider, Dr.-Ing. W. Sebbeße Seite 24 10/2002
SMPS: Setting of DMA: monodisperse 15 nm for TEM-Filter Sampling
CPCCPC
DMATEM-Sample Filter
1,4 m33
22
22 33supplied Fresh Air
= ambient air before engine start
Ambient Air open Sampling Pointapp. 15 min after engine start
(undefined Dilution)DF ≈ 10.000
Supply offresh air(filtered)
Outlet ofused air
Engine Oxidation-Catalyst Muffler
Point of Aerosol - Measurement
Fig. 2.4 Sampling and TEM analysis of monodisperse nanoparticles, open sampling point (Setting of DMA to electrical Mobility Diameter of 15 nm)

ADA; S. Weßels, H. Eiterer, Dr. M. Schneider, Dr.-Ing. W. Sebbeße Seite 25 10/2002
SMPS: Measurement of NSD polydisperse with CPC
CPCCPC
DMA
1,4 m33
22Supply offresh air(filtered)
Outlet ofused air
Engine Oxidation-Catalyst Muffler
Point of Aerosol - Measurement
0.0E+00
2.0E+05
4.0E+05
6.0E+05
8.0E+05
1.0E+06
1.2E+06
1 10 100 1000
Mobilitätsdurchmesser in nm
Exhaust Gas in Exhaust LinesEngine at 2000 rpm, 120 Nm
(Dilution with NanoMet)DF = 300
11
0.0E+00
2.0E+05
4.0E+05
6.0E+05
8.0E+05
1.0E+06
1.2E+06
1 10 100 1000
Mobilitätsdurchmesser in nm
22
0.0E+00
2.0E+05
4.0E+05
6.0E+05
8.0E+05
1.0E+06
1.2E+06
1 10 100 1000
Mobilitätsdurchmesser in nm
33
11
electr. Mobility Diameter in nm electr. Mobility Diameter in nm electr. Mobility Diameter in nm
supplied Fresh Air= ambient air before engine start
(undiluted)
Ambient Air open Sampling Pointapp. 15 min after engine start
(undefined Dilution)DF ≈ 10.000
Fig. 2.5 SMPS measurement (polydisperse) of exhaust gas, fresh air and ambient air (open sampling)
0.0E+00
2.0E+05
4.0E+05
6.0E+05
8.0E+05
1.0E+06
1.2E+06
1.4E+06
1.6E+06
1.8E+06
2.0E+06
1 10 100 1000elektr. Mobilitätsdurchmesser in nm
Part
ikel
anza
hl d
N/d
logD
p in
1/c
m³
nach KatGreenergyLastvar bei 2000(Last und Vorkattemp. angeben)40,80,100,120,140 Nm
Measurement of ambient air on engine test bench(open sampling point)
electr. Mobility Diameter in nm
Part
icle
Num
ber d
N/d
logD
p in
1/c
m3
Variation of Torque at 2000 rpmTorque (Tmean, pre-cat. ; mH2O in Exhaust)
40 Nm (210 °C; 5,1 kg/h)
80 Nm (270 °C; 7,0 kg/h)
100 Nm (301 °C; 8,2 kg/h)
120 Nm (334 °C; 9,3 kg/h)
140 Nm (348 °C; 10,5 kg/h)
Variation of Torque at 2000 rpmTorque (Tmean, pre-cat. ; mH2O in Exhaust)
40 Nm (210 °C; 5,1 kg/h)
80 Nm (270 °C; 7,0 kg/h)
100 Nm (301 °C; 8,2 kg/h)
120 Nm (334 °C; 9,3 kg/h)
140 Nm (348 °C; 10,5 kg/h)
Fuel:Greenergy
(S < 10 ppm)
Fuel:Greenergy
(S < 10 ppm)
Fig. 2.6 Variation of engine torque at 2000 rpm (Fuel: Greenergy, sulfur content: < 10 ppm)

ADA; S. Weßels, H. Eiterer, Dr. M. Schneider, Dr.-Ing. W. Sebbeße Seite 26 10/2002
upstream Catalyst downstream Catalyst
Variation: Position of open Sampling Point and Fuel Sulfur Content
Engine: 2000 rpm; 120 Nm => Mean Temp. Pre-cat.: 340 °C
0.0E+00
2.0E+05
4.0E+05
6.0E+05
8.0E+05
1.0E+06
1.2E+06
1.4E+06
1 10 100 1000elektr. Mobilitätsdurchmesser in nm
Part
ikel
anza
hl d
N/d
logD
p in
1/c
m³
0.0E+00
2.0E+05
4.0E+05
6.0E+05
8.0E+05
1.0E+06
1.2E+06
1.4E+06
1 10 100 1000elektr. Mobilitätsdurchmesser in nm
Part
ikel
anza
hl d
N/d
logD
p in
1/c
m³
0.0E+00
2.0E+05
4.0E+05
6.0E+05
8.0E+05
1.0E+06
1.2E+06
1.4E+06
1 10 100 1000elektr. Mobilitätsdurchmesser in nm
Part
ikel
anza
hl d
N/d
logD
p in
1/c
m³
0.0E+00
2.0E+05
4.0E+05
6.0E+05
8.0E+05
1.0E+06
1.2E+06
1.4E+06
1 10 100 1000elektr. Mobilitätsdurchmesser in nm
Part
ikel
anza
hl d
N/d
logD
p in
1/c
m³
Gre
ener
gy(S
< 1
0 pp
m)
Stan
dard
Fue
l(S
= 19
0 pp
m)
electr. Mobility Diameter in nm
electr. Mobility Diameter in nm electr. Mobility Diameter in nm
electr. Mobility Diameter in nm
Part
icle
Num
ber d
N/d
logD
p in
1/c
m3
Part
icle
Num
ber d
N/d
logD
p in
1/c
m3
Part
icle
Num
ber d
N/d
logD
p in
1/c
m3
Part
icle
Num
ber d
N/d
logD
p in
1/c
m3
Fig 2.7 Fuel and catalyst influence on nanoparticle formation (engine operating point: 2000 rpm , 120 Nm) Variation: Position of open Sampling Point and Fuel Sulfur Content
Engine: 1430 rpm; 35 Nm (50 km/h) => Mean Temp. Pre-cat.: 165 °C
0.0E+00
2.0E+05
4.0E+05
6.0E+05
8.0E+05
1.0E+06
1.2E+06
1.4E+06
1 10 100 1000elektr. Mobilitätsdurchmesser in nm
Part
ikel
anza
hl d
N/d
logD
p in
1/c
m³
0.0E+00
2.0E+05
4.0E+05
6.0E+05
8.0E+05
1.0E+06
1.2E+06
1.4E+06
1 10 100 1000elektr. Mobilitätsdurchmesser in nm
Part
ikel
anza
hl d
N/d
logD
p in
1/c
m³
0.0E+00
2.0E+05
4.0E+05
6.0E+05
8.0E+05
1.0E+06
1.2E+06
1.4E+06
1 10 100 1000elektr. Mobilitätsdurchmesser in nm
Part
ikel
anza
hl d
N/d
logD
p in
1/c
m³
0.0E+00
2.0E+05
4.0E+05
6.0E+05
8.0E+05
1.0E+06
1.2E+06
1.4E+06
1 10 100 1000elektr. Mobilitätsdurchmesser in nm
Part
ikel
anza
hl d
N/d
logD
p in
1/c
m³
Gre
ener
gy(S
< 1
0 pp
m)
Stan
dard
Fue
l(S
= 19
0 pp
m)
electr. Mobility Diameter in nm
electr. Mobility Diameter in nm electr. Mobility Diameter in nm
electr. Mobility Diameter in nm
Part
icle
Num
ber d
N/d
logD
p in
1/c
m3
Part
icle
Num
ber d
N/d
logD
p in
1/c
m3
Part
icle
Num
ber d
N/d
logD
p in
1/c
m3
Part
icle
Num
ber d
N/d
logD
p in
1/c
m3
upstream Catalyst downstream Catalyst
Fig 2.8 Fuel and catalyst influence on nanoparticle formation (engine operating point: 1430 rpm , 35 Nm)

ADA; S. Weßels, H. Eiterer, Dr. M. Schneider, Dr.-Ing. W. Sebbeße Seite 27 10/2002
dN/dlog Dp in 1/cm(im verd. Abgas)
3
0 20 40 60 80 100 120 140
Verschmutzung in %
78
910
1112
ELPI-Stufe
5.0·102
1.0·103
1.5·103
2.0·103
2.5·103
3.0·103
3.5·103
4.0·103
4.5·103
5.0·103
Parti
kela
nzah
l
Partikelanzahl
0
1000
2000
3000
4000
Influence of ELPI – Total Impactor Load
1st Measurement:Engine at 2000 rpm, 120 NmSampling after TurbochargerDekati – Ejector Dilution (DF = 140)ELPI with Absolut Filter StageDuration of Measurement app. 16 h
Measurement 1 (23./26.02.01)
020406080100120140
Verschmutzung in %1
23
45
6
ELPI-Stufe
1·105
2·105
3·105
4·105
5·105
6·105
7·105
8·105
9·105
1·106
Parti
kela
nzah
l
dN/dlog Dp in 1/cm3
(im verd. Abgas)
0 20 40 60 80 100 120 140
Verschmutzung in %
12
34
56
ELPI-Stufe
1·105
2·105
3·105
4·105
5·105
6·105
7·105
8·105
9·105
1·106Pa
rtike
lanz
ahl
100000
200000
300000
400000
500000
600000
700000
800000
Partikelanzahl
Particle Number dN/dlogDp in 1/cm3
(diluted exhaust gas)
Part
icle
Num
ber
ELPI StageTotal Impactor Load in %
Particle Number dN/dlogDp in 1/cm3
(diluted exhaust gas)Pa
rtic
le N
umbe
r
ELPI StageTotal Impactor Load in %
ELPI StageTotal Impactor Load in %
Part
icle
Num
ber
Particle Number
0.0E+00
1.0E+05
2.0E+05
3.0E+05
4.0E+05
5.0E+05
6.0E+05
7.0E+05
8.0E+05
9.0E+05
1.0E+06
0 20 40 60 80 100 120 140
Impactor load in %
Parti
cle
Num
ber i
n 1/
cm3
Variation in %:100 % → 81 %
mean aerodyn. Diameter
0
10
20
30
40
50
60
70
80
0 20 40 60 80 100 120 140
Impactor load in %
mea
n D
iam
eter
in n
m
Variation in %:100 % → 137 %
Particle Surface
0.0E+00
2.0E+03
4.0E+03
6.0E+03
8.0E+03
1.0E+04
1.2E+04
1.4E+04
1.6E+04
1.8E+04
2.0E+04
0 20 40 60 80 100 120 140
Impactor load in %
Parti
cle
Surfa
ce in
µm
2 /cm
3
Variation in %:100 % → 155 %
Particle Mass
0
200
400
600
800
1000
1200
1400
0 20 40 60 80 100 120 140
Impactor load in %
Parti
cle
Mas
s in
µg/
m3
Variation in %:100 % → 259 %
Impactor load value as displayed by ELPI Fig. 3.1 Influence of the ELPI total Impactor load (1st measurement)

ADA; S. Weßels, H. Eiterer, Dr. M. Schneider, Dr.-Ing. W. Sebbeße Seite 28 10/2002
dN/dlog Dp in 1/cm(im verd. Abgas)
3
0 20 40 60 80 100 120 140
Verschmutzung in %
78
910
1112
ELPI-Stufe
5.0·102
1.0·103
1.5·103
2.0·103
2.5·103
3.0·103
3.5·103
4.0·103
4.5·103
5.0·103
Parti
kela
nzah
l
Partikelanzahl
0
1000
2000
3000
4000
020406080100120140
Verschmutzung in %1
23
45
6
ELPI-Stufe
1·105
2·105
3·105
4·105
5·105
6·105
7·105
8·105
9·105
1·106
Parti
kela
nzah
l
dN/dlog Dp in 1/cm3
(im verd. Abgas)
0 20 40 60 80 100 120 140
Verschmutzung in %
12
34
56
ELPI-Stufe
1·105
2·105
3·105
4·105
5·105
6·105
7·105
8·105
9·105
1·106
Parti
kela
nzah
l
100000
200000
300000
400000
500000
600000
700000
800000
Partikelanzahl
Influence of ELPI – Total Impactor Load
2nd Measurement:Engine at 2000 rpm, 120 NmSampling after TurbochargerDekati – Ejector Dilution (DF = 140)ELPI with Absolut Filter StageDuration of Measurement app. 16 h
Measurement 2 (27.02./05.03.01)
Particle Number dN/dlogDp in 1/cm3
(diluted exhaust gas)
Part
icle
Num
ber
ELPI StageTotal Impactor Load in %
Particle Number dN/dlogDp in 1/cm3
(diluted exhaust gas)
Part
icle
Num
ber
ELPI StageTotal Impactor Load in %
ELPI StageTotal Impactor Load in %
Part
icle
Num
ber
Impactor load value as displayed by ELPI
Particle Number
0.0E+00
1.0E+05
2.0E+05
3.0E+05
4.0E+05
5.0E+05
6.0E+05
7.0E+05
8.0E+05
9.0E+05
1.0E+06
0 20 40 60 80 100 120 140
Impactor load in %
Parti
cle
Num
ber i
n 1/
cm3
Variation in %:100 % → 68 %
mean aerodyn. Diameter
0
10
20
30
40
50
60
70
80
0 20 40 60 80 100 120 140
Impactor load in %
mea
n D
iam
eter
in n
m
Variation in %:100 % → 134 %
Particle Surface
0.0E+00
2.0E+03
4.0E+03
6.0E+03
8.0E+03
1.0E+04
1.2E+04
1.4E+04
1.6E+04
1.8E+04
2.0E+04
0 20 40 60 80 100 120 140
Impactor load in %
Parti
cle
Surfa
ce in
µm
2 /cm
3
Variation in %:100 % → 129 %
Particle Mass
0
200
400
600
800
1000
1200
1400
0 20 40 60 80 100 120 140
Impactor load in %
Parti
cle
Mas
s in
µg/
m3
Variation in %:100 % → 277 %
Fig. 3.2 Influence of the ELPI total Impactor load (2nd measurement)

ADA; S. Weßels, H. Eiterer, Dr. M. Schneider, Dr.-Ing. W. Sebbeße Seite 29 10/2002
0
20
40
60
80
100
120
0 50 100 150 200 250electr. Mobility Diameter in nm
activ
e Pa
rtic
le S
urfa
ce (L
Q1-
DC
) in
µm²/c
m³
0.0E+00
2.0E+03
4.0E+03
6.0E+03
8.0E+03
1.0E+04
1.2E+04
Tota
l Par
ticle
Num
ber N
in
1/cm
³
Number
Surface
Measurement of Number and active Surface (monodisperse)Number with Particle Size increasing Number with Particle Size decreasing Surface with Particle Size increasing Surface with Particle Size decreasing
Measurement of Number and active Surface (monodisperse)Number with Particle Size increasing Number with Particle Size decreasing Surface with Particle Size increasing Surface with Particle Size decreasing
DC-Value decreases not to Zero=> Offset is not explainable
Fig. 3.3 Measurement of active surface area for monodisperse particles (engine operating point: 2000 rpm, 120 Nm , downstream catalyst, DF = 25) Contamination of Corona Needle (Electrostatic Air Cleaner after 180 h in Use)
(Air contains Cyclomethicone, which is often used in deodorant sprays)
0.16
0.14
0.12
0.10
0.08
0.06
0.04
0.02
0.005.0 5.5 6.0 6.5 7.0 7.5 8.0 8.5 9.0
Stro
m in
mA
Spannung in kV
Coronadraht sauber kontaminiert
Charakteristik der CoronaaufladungMap of Corona Charge
Corona Needlecleancontaminated
Cur
rent
in m
A
Voltage in kV
Fig. 3.4 Contamination of the corona needle of an electrostatic air cleaner

ADA; S. Weßels, H. Eiterer, Dr. M. Schneider, Dr.-Ing. W. Sebbeße Seite 30 10/2002
0
20
40
60
80
100
120
140
10 30 50 70 90 110 130 150 170 190 210
elektrischer Mobilitätsdurchmesser in nm
Ges
amto
berf
läch
e D
C in
µm
2 /cm
3
210501 steigend
220501 steigend
220501 fallend
290501 steigend
300501 steigend
300501 fallend
all Measurements with Original Device LQ1-DC
Engine operating point+ Fuel identical(2000 rpm, 120 Nm)
electr. Mobility Diameter in nm
Tota
l Act
ive
Surf
ace
DC
in µ
m2 /c
m3
rising
rising
falling
rising
rising
falling
Fig. 3.5 Surface area measurements with LQ1-DC (original device without corona current control)
0
20
40
60
80
100
120
140
10 30 50 70 90 110 130 150 170 190 210
elektrischer Mobilitätsdurchmesser in nm
Ges
amto
berf
läch
e D
C in
µm
2 /cm
3
171201 steigend
181201 steigend
181201 fallend
191201 steigend
201201 steigend
080102 steigend
140102 steigend
140102 fallend
all Measurements with modified Device LQ1-DC
Engine operating point+ Fuel identical(2000 rpm, 120 Nm)
rising
rising
falling
rising
rising
rising
rising
falling
electr. Mobility Diameter in nm
Tota
l Act
ive
Surf
ace
DC
in µ
m2 /c
m3
Fig. 3.6 Surface area measurements with LQ1-DC (modified device with corona current control)

ADA; S. Weßels, H. Eiterer, Dr. M. Schneider, Dr.-Ing. W. Sebbeße Seite 31 10/2002
DekatiEjector-Dilution(2 Stage)
DekatiEjector-Dilution(2 Stage)
Exhaust lineExhaust line
Dilution Factors:Dekati: app. 100 (2 bar / 200 °C)NanoMet: app. 430 (Poti 5 / 10disc / 120 °C)(tuned to max. Range of modifiedLQ1-DC at 4000 rpm / Full Load)SmartSampler: 4, controlled
Dilution Factors:Dekati: app. 100 (2 bar / 200 °C)NanoMet: app. 430 (Poti 5 / 10disc / 120 °C)(tuned to max. Range of modifiedLQ1-DC at 4000 rpm / Full Load)SmartSampler: 4, controlled
Dilution Factors:Dekati: app. 100 (2 bar / 200 °C)NanoMet: app. 430 (Poti 5 / 10disc / 120 °C)(tuned to max. Range of modifiedLQ1-DC at 4000 rpm / Full Load)SmartSampler: 4, controlled
SMPSNSD
(electricalMobility Diameter)
SMPSNSD
(electricalMobility Diameter)
PAS 2000 LQ1-DCdeposited PAH active Particle SurfacePAS 2000 LQ1-DCdeposited PAH active Particle Surface
AVL 415SSmoke MeterFSN (Filtersmokenumber)
AVL 415SSmoke MeterFSN (Filtersmokenumber)
AVL 472SmartSampler
Particulate Mass
AVL 472SmartSampler
AVL 472SmartSampler
Particulate Mass ADA Selection Valve
1
23
4
05 (closed)
ELPI NSD(aerodynamic Diameter)
NanoMetMd19EDilution
NanoMetMd19EDilution
Fig. 4.1 Measurement set-up for correlation measurements
1 Spherical Form of Particles assumed2 Spherical Form of Particles with uniform Density 1,2 g/cm3 assumed3 Calculation based on AVL Statement4 arithmetic mean
Surface Mass Particle Size
SMPS (DMA+CPC)
Surface1
"Mobility"[µm2/cm3]
Mass2
"Mobility" [µg/cm3]
mean4
electrical Mobility Diameter
[nm]
ELPISurface1
"Aerodynamic" [µm2/cm3]
Mass2
"Aerodynamic" [µg/cm3]
mean4
aerodynamic Diameter
[nm]
LQ1-DC active Surface [µm2/cm3]
PAS 2000Value of deposited Polyaromatics PAH
[fA]
AVL 415 S Smokemeter
FilterSmokeNumber FSN [-]
Mass FSN3
[mg/m3]
AVL SPC 472 SmartSampler
Total Mass PM + Mass INSOF
[µg/m3]
Methoddirect Variables / derived Variables
Table 4.1 Direct and derived variables for correlation measurements

ADA; S. Weßels, H. Eiterer, Dr. M. Schneider, Dr.-Ing. W. Sebbeße Seite 32 10/2002
Engine operating Points used for Correlation MeasurementsTorque at Full Engine Load complete map Conditions in Emission Test (NEDC)
1000 1500 2000 2500 3000 3500 4000
0
50
100
150
200
250
300
350
400
450
Drehzahl in 1/min
Dre
hmom
ent i
n N
m
Engine Speed in rpm
Engi
ne T
orqu
e in
Nm
Fig. 4.2 Position of the selected engine operating points in the engine map
Correlation Matrix of the Measurement Methods (Selection)Coefficients of Determination due to assumed linear Correlation(Measuring Conditions: BMW 3.0 CR, stationary Engine Test Bench, ADA Selection Valve)
LQ1-DC 0.74 0.86 0.54 0.75
active Surface 0.90 0.97 0.59 0.64
PAS 2000 0.84 0.93 0.59 0.83 0.76 0.93
deposited PAH 0.67 0.35 0.32 0.04 0.71 0.46
SmartSampler 0.74 0.78 0.82 0.70 0.49 0.73 0.56 0.82
Total Mass PM 0.78 0.76 0.93 0.88 0.53 0.71 0.36 0.11
SmartSampler 0.81 0.92 0.87 0.88 0.64 0.81 0.61 0.90
Mass INSOF 0.76 0.73 0.92 0.85 0.55 0.70 0.32 0.12
Correlation Measuring Conditionshigh R2 > 0.90 middel 0.70 < R2 < 0.90 low 0.50 < R2 < 0.70 no R2 < 0.50
LQ1-DCELPI
only downstreamCatalyst
only Emission Test Conditions
(downstr. Cat., EGR)
PAS 2000
deposited PAH
x
x
alloperating points
only upstreamCatalyst
x
Surface(NSD aerodyn. Ø)
Mass (NSD aerodyn. Ø) active Surface
Table 4.2 Correlation matrix of the measurement methods (coefficients of determination R2)

ADA; S. Weßels, H. Eiterer, Dr. M. Schneider, Dr.-Ing. W. Sebbeße Seite 33 10/2002
Correlation between Particle Surface (ELPI) and active Surface (LQ1-DC)
y = 0,0179x + 63,648R2 = 0,7354
0
200
400
600
800
1000
0,0E+00 5,0E+03 1,0E+04 1,5E+04 2,0E+04 2,5E+04 3,0E+04 3,5E+04 4,0E+04 4,5E+04 5,0E+04
ELPI Gesamtfläche in µm²/cm³
DC
in µ
m²/c
m³
Berechnung Oberfläche aus ELPI-Daten (Kugelform) (Verdünnung nicht eingerechnet)
y = 0,017x + 18,907R2 = 0,8636
0
200
400
600
800
1000
0,0E+00 5,0E+03 1,0E+04 1,5E+04 2,0E+04 2,5E+04 3,0E+04 3,5E+04 4,0E+04 4,5E+04 5,0E+04
ELPI Gesamtfläche in µm²/cm³
DC
in µ
m²/c
m³
y = 0,0234x + 72,338R2 = 0,8983
0
200
400
600
800
1000
0,0E+00 5,0E+03 1,0E+04 1,5E+04 2,0E+04 2,5E+04 3,0E+04 3,5E+04 4,0E+04 4,5E+04 5,0E+04
ELPI Gesamtfläche in µm²/cm³
DC
in µ
m²/c
m³
y = 0,0287x + 60,618R2 = 0,9674
0
200
400
600
800
1000
0,0E+00 5,0E+03 1,0E+04 1,5E+04 2,0E+04 2,5E+04 3,0E+04 3,5E+04 4,0E+04 4,5E+04 5,0E+04
ELPI Gesamtfläche in µm²/cm³
DC
in µ
m²/c
m³
all operating points only upstream cat.
only downstream cat. only NEDC conditions
Surface calculated based on ELPI-Data(Dilution not included)
Surface ELPI in µm2/cm3
activ
e Su
rfac
e D
C in
µm
2 /cm
3
Surface ELPI in µm2/cm3
activ
e Su
rfac
e D
C in
µm
2 /cm
3
Surface ELPI in µm2/cm3
activ
e Su
rfac
e D
C in
µm
2 /cm
3
Surface ELPI in µm2/cm3
activ
e Su
rfac
e D
C in
µm
2 /cm
3
Fig. 4.3 Correlation between the particle surface area concentration (ELPI) and the active surface area (LQ1-DC)
Corr. between active Surface (LQ1-DC) and Value for deposited PAH (PAS 2000)
y = 2,295x + 12,981R2 = 0,7566
0,0E+00
5,0E+02
1,0E+03
1,5E+03
2,0E+03
2,5E+03
3,0E+03
0 100 200 300 400 500 600 700 800 900 1000
DC in µm²/cm³
Meß
wer
t ang
elag
erte
PA
H in
fA
y = 2,9563x - 8,0842R2 = 0,9327
0,0E+00
5,0E+02
1,0E+03
1,5E+03
2,0E+03
2,5E+03
3,0E+03
0 100 200 300 400 500 600 700 800 900 1000
DC in µm²/cm³
Meß
wer
t ang
elag
erte
PA
H in
fA
y = 1,8652x + 23,581R2 = 0,7131
0,0E+00
5,0E+02
1,0E+03
1,5E+03
2,0E+03
2,5E+03
3,0E+03
0 100 200 300 400 500 600 700 800 900 1000
DC in µm²/cm³
Meß
wer
t ang
elag
erte
PA
H in
fA
y = 1,0941x + 247,56R2 = 0,4605
0,0E+00
5,0E+02
1,0E+03
1,5E+03
2,0E+03
2,5E+03
3,0E+03
0 100 200 300 400 500 600 700 800 900 1000
DC in µm²/cm³
Meß
wer
t ang
elag
erte
PA
H in
fA
all operating points only upstream cat.
only downstream cat. only NEDC conditions
Dilution not included
active Surface DC in µm2/cm3
Valu
e fo
r dep
osite
d PA
H in
fA
active Surface DC in µm2/cm3
Valu
e fo
r dep
osite
d PA
H in
fA
active Surface DC in µm2/cm3
Valu
e fo
r dep
osite
d PA
H in
fA
active Surface DC in µm2/cm3
Valu
e fo
r dep
osite
d PA
H in
fA
Fig. 4.4 Correlation between the active surface area concentration (LQ1-DC) and the measured value for deposited PAH (PAS 2000)
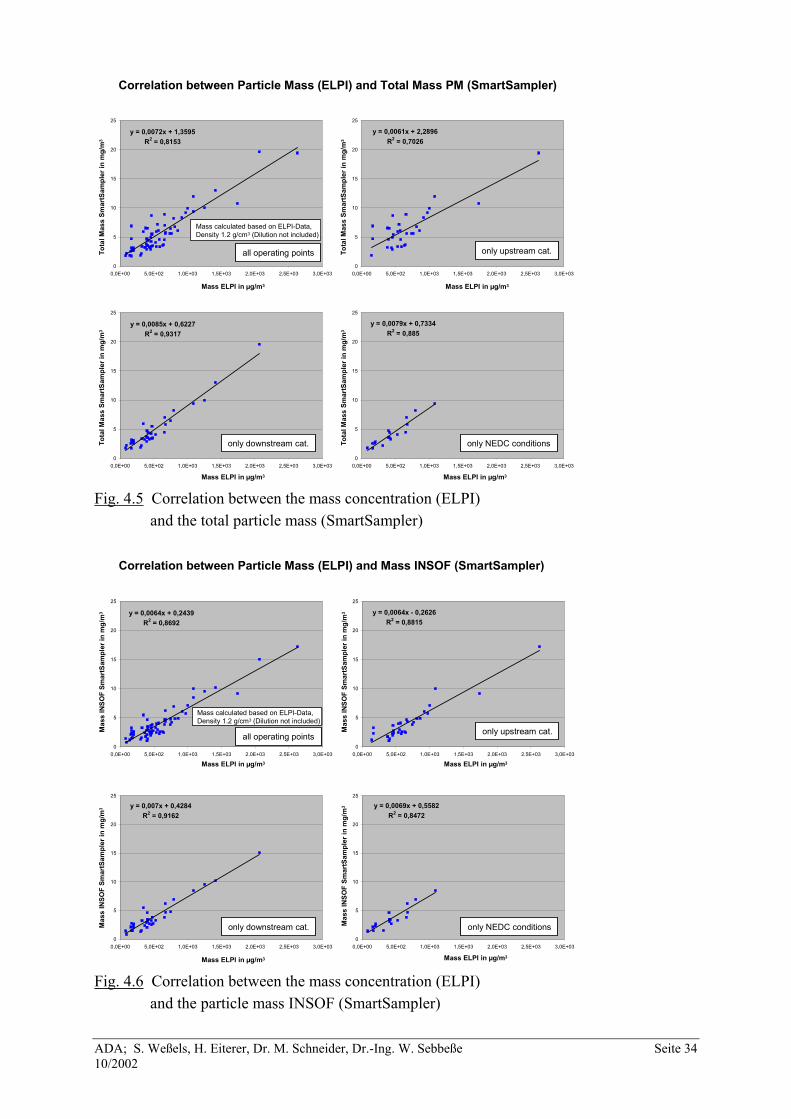
ADA; S. Weßels, H. Eiterer, Dr. M. Schneider, Dr.-Ing. W. Sebbeße Seite 34 10/2002
y = 0,0072x + 1,3595R2 = 0,8153
0
5
10
15
20
25
0,0E+00 5,0E+02 1,0E+03 1,5E+03 2,0E+03 2,5E+03 3,0E+03
Masse aus ELPI in µg/m³
Mas
senk
onz.
Sm
artS
ampl
er in
mg/
m³
Berechnung Masse aus ELPI-Daten (Kugel) mit Dichte 1,2 g/cm3 (Verdünnung nicht eingerechnet)
y = 0,0061x + 2,2896R2 = 0,7026
0
5
10
15
20
25
0,0E+00 5,0E+02 1,0E+03 1,5E+03 2,0E+03 2,5E+03 3,0E+03
Masse aus ELPI in µg/m³
Mas
senk
onz.
Sm
artS
ampl
er in
mg/
m³
y = 0,0085x + 0,6227R2 = 0,9317
0
5
10
15
20
25
0,0E+00 5,0E+02 1,0E+03 1,5E+03 2,0E+03 2,5E+03 3,0E+03
Masse aus ELPI in µg/m³
Mas
senk
onz.
Sm
artS
ampl
er in
mg/
m³
y = 0,0079x + 0,7334R2 = 0,885
0
5
10
15
20
25
0,0E+00 5,0E+02 1,0E+03 1,5E+03 2,0E+03 2,5E+03 3,0E+03
Masse aus ELPI in µg/m³
Mas
senk
onz.
Sm
artS
ampl
er in
mg/
m³
Correlation between Particle Mass (ELPI) and Total Mass PM (SmartSampler)
all operating points only upstream cat.
only downstream cat. only NEDC conditions
Mass calculated based on ELPI-Data,Density 1.2 g/cm3 (Dilution not included)
Mass ELPI in µg/m3
Tota
l Mas
s Sm
artS
ampl
er in
mg/
m3
Mass ELPI in µg/m3
Tota
l Mas
s Sm
artS
ampl
er in
mg/
m3
Mass ELPI in µg/m3
Tota
l Mas
s Sm
artS
ampl
er in
mg/
m3
Mass ELPI in µg/m3
Tota
l Mas
s Sm
artS
ampl
er in
mg/
m3
Fig. 4.5 Correlation between the mass concentration (ELPI) and the total particle mass (SmartSampler)
y = 0,0064x + 0,2439R2 = 0,8692
0
5
10
15
20
25
0,0E+00 5,0E+02 1,0E+03 1,5E+03 2,0E+03 2,5E+03 3,0E+03
Masse aus ELPI in µg/m³
Mas
senk
onz.
INSO
F Sm
artS
ampl
er in
mg/
m³
Berechnung Masse aus ELPI-Daten (Kugel) mit Dichte 1,2 g/cm3 (Verdünnung nicht eingerechnet)
y = 0,0064x - 0,2626R2 = 0,8815
0
5
10
15
20
25
0,0E+00 5,0E+02 1,0E+03 1,5E+03 2,0E+03 2,5E+03 3,0E+03
Masse aus ELPI in µg/m³
Mas
senk
onz.
INSO
F Sm
artS
ampl
er in
mg/
m³
y = 0,007x + 0,4284R2 = 0,9162
0
5
10
15
20
25
0,0E+00 5,0E+02 1,0E+03 1,5E+03 2,0E+03 2,5E+03 3,0E+03
Masse aus ELPI in µg/m³
Mas
senk
onz.
INSO
F Sm
artS
ampl
er in
mg/
m³ y = 0,0069x + 0,5582
R2 = 0,8472
0
5
10
15
20
25
0,0E+00 5,0E+02 1,0E+03 1,5E+03 2,0E+03 2,5E+03 3,0E+03
Masse aus ELPI in µg/m³
Mas
senk
onz.
INSO
F Sm
artS
ampl
er in
mg/
m³
Correlation between Particle Mass (ELPI) and Mass INSOF (SmartSampler)
all operating points only upstream cat.
only downstream cat. only NEDC conditions
Mass calculated based on ELPI-Data,Density 1.2 g/cm3 (Dilution not included)
Mass ELPI in µg/m3
Mas
s IN
SOF
Smar
tSam
pler
in m
g/m
3
Mass ELPI in µg/m3
Mas
s IN
SOF
Smar
tSam
pler
in m
g/m
3
Mass ELPI in µg/m3
Mas
s IN
SOF
Smar
tSam
pler
in m
g/m
3
Mass ELPI in µg/m3
Mas
s IN
SOF
Smar
tSam
pler
in m
g/m
3
Fig. 4.6 Correlation between the mass concentration (ELPI) and the particle mass INSOF (SmartSampler)