Assessment of mangrove ecosystems in Colombia and their ... · average 1,494 USD ha-1 y-1, ranging...
29
Assessment of mangrove ecosystems in Colombia and their potential for emissions reductions and restoration Blanca Bernal, Gabriel Sidman, and Timothy Pearson. Winrock International, December 2017.
Transcript of Assessment of mangrove ecosystems in Colombia and their ... · average 1,494 USD ha-1 y-1, ranging...

Assessment of mangrove ecosystems in Colombia and their potential for emissions reductions and
restoration
Blanca Bernal, Gabriel Sidman, and Timothy Pearson.
Winrock International, December 2017.

Assessment of mangrove ecosystems in Colombia. | December 2017
2
Table of Contents
INTRODUCTION ........................................................................................................................................... 3
MANAGEMENT OF COASTAL AREAS IN COLOMBIA ....................................................................................... 4
BENEFITS OF CONSERVING COLOMBIA’S COASTAL ECOSYSTEMS .................................................................. 6
MANGROVE COVER AND LOSS RATE IN COLOMBIA ...................................................................................... 7
MANGROVE DEGRADATION DUE TO FUELWOOD COLLECTION ................................................................... 13
POTENTIAL EMISSIONS REMOVAL WITH MANGROVE RESTORATION .......................................................... 15
CURRENT STATE OF MANGROVES IN THE CARIBBEAN REGION ................................................................... 19 Drivers of mangrove loss, degradation, and expansion in the Caribbean region ............................................................ 19
CURRENT STATE OF MANGROVES IN THE PACIFIC REGION ......................................................................... 22 Drivers of mangrove loss, degradation, and expansion in the Pacific region .................................................................... 22
REFERENCES .............................................................................................................................................. 24
ANNEX 1: FUELWOOD NON-RENEWABLE BIOMASS .................................................................................... 27 References of Annex 1 .............................................................................................................................................................................. 28
ANNEX 2: COLOMBIA’S MANGROVE SUSTAINABILITY TARGET ................................................................... 29
Document developed by Winrock International. Suggested citation: Bernal B., G. Sidman, T. Pearson. 2017. Assessment of mangrove ecosystems in Colombia and their potential for emissions reductions and restauration. Winrock International. 29 pp. For comments or questions please contact the lead author: Blanca Bernal ([email protected]). Winrock gratefully acknowledges the support of the Government of the Federal Republic of Germany under the International Climate Initiative.
This project is part of the International Climate Initiative (IKI). The German Federal Ministry for the Environment, Nature Conservation, Building and Nuclear Safety (BMUB) supports this initiative on the basis of a decision adopted by the German Bundestag.

Assessment of mangrove ecosystems in Colombia. | December 2017
3
INTRODUCTION
Understanding of the importance of resilient growth and adaptation to environmental change has been increasing
in response to the increasing realization that maladapted environments have direct and significant negative effects
on human wellbeing. Where once the goal was a sustainable development strategy, it is now a resilient development
strategy, where environmental change is acknowledged and an active role must be taken to adapt to it. Many
countries, including Colombia, are working towards such a strategy.
This report is a preliminary evaluation of the potential of including mangrove restoration and sustainable mangrove
use in Colombia’s Nationally Appropriate Mitigation Actions (NAMA) strategy. Mangrove forests are key for coastal
resilience in tropical countries; they provide multiple ecosystem services while increasing the ability of coastal
communities to adapt to a changing climate. Some of the services provided by mangroves include carbon storage in
biomass and soils, support of coastal community livelihoods through coastline protection and the provision of
nursery habitat for fish and crustaceans. Colombia has mangrove swamps along its Pacific and Caribbean coasts.
These mangroves are degrading quickly due to anthropogenic pressure from urban and agricultural development,
causing a decline in the services provided to nearby communities. The largest mangrove forest in Colombia (in the
Ciénaga Grande de Santa Marta), for example, has lost 60% of its coverage since the mid-1950’s1, and ten years ago
about 21% of Colombia’s remaining mangroves were considered degraded2. Mangrove restoration and conservation
are therefore of key importance for the country.
To this end, we evaluate available information from publications by the Colombian Government and environmental
entities as well as peer reviewed publications on site-specific mangrove conditions in Colombia, as a first attempt to
assess the current mangrove conditions in the country. We discuss the main drivers that are responsible for
mangrove degradation and deforestation, and assess the potential benefits of mangrove restoration in Colombia. The
intention of this work is to lay the ground for a more in-depth analysis of site-specific causes of mangrove
degradation and loss, and point out the needs of country-specific and up to date mangrove restoration targets. Next
steps following on from this report would be an accurate assessment of Colombia’s mangrove environmental
conditions and opportunities of improvement. Such an assessment would entail site-specific data and on-site impact
evaluation, to accurately assess the interaction of hydrological processes, vegetation cover, and ecosystem dynamics
with the communities living in and around the mangrove areas.
1 Elster 2000. 2 INVEMAR 2004.

Assessment of mangrove ecosystems in Colombia. | December 2017
4
MANAGEMENT OF COASTAL AREAS IN COLOMBIA
Most of the reports describing Colombia’s initiatives and legislation on mangrove management and land use were
released around the start of the 21st century. In 2002, Colombia released their first countrywide strategy on
mangrove restoration and conservation3. Also in that year, Colombia developed a national environmental policy, the
Proyecto Colectivo Ambiental, that sought to improve the country’s land use planning and the management and
restoration of its natural resources, both inland and coastal. These two initiatives were not the starting point on
mangrove awareness in the country; the Proyecto Colectivo Ambiental policy emphasized the importance of
developing coastal ecosystems management plans under the already published framework Manejo Integrado de
Zonas Costeras (MIZC), a framework created in the 80’s that envisioned a collaboration among scientists,
stakeholders, and local and national government entities. A decade after the MIZC was created, INVEMAR
(Colombia’s Coastal Research Institute) took the lead in keeping MIZC relevant by promoting capacity building and
technical support to decision makers on the management and land use planning of coastal zones in Colombia. Aside
from the training of professionals, the major accomplishments since then on INVEMAR’s coastal management has
been the development of a National Network of Coastal Zones, the setup of 35 monitoring stations in coastal areas
(19 in the Caribbean and 16 in the Pacific coast)4, and the mapping of mangrove coverage in collaboration with the
national Government in 20075. In parallel to INVEMAR’s achievements, the national Government, with the regional
natural resource management corporations and the participation of local communities, coordinated the
development and implementation of two key initiatives that have been supported with a set of new pieces of
legislation to ensure their success:
o Proyecto Manglares de Colombia in the decade of the 90’s, which assessed national mangrove coverage in
1995 and coverage change, and boosted the restoration of degraded mangrove areas in the next 10 years by
listing strategic actions for the conservation and sustainable use of mangroves in Colombia6.
o Programa Nacional para el Uso Sostenible, Manejo y Conservación de los Ecosistemas de Manglar (PNM), in
2002, whose goal was to integrate feedback from stakeholders and local communities into the development
and implementation of sustainable mangrove uses.
Additionally, the Government of Colombia releases regularly the National Plan of Forest Development and the
National Plan of Forest Restoration; the latest one was published in 20157. These Plans outline the country’s strategy
3 Uso sostenible, manejo y conservación de los Ecosistemas de manglar en Colombia. 2002. MINAMBIENTE. Santa Fe de Bogotá D.C., Colombia. 4 Álvarez-León. 2003. 5 http://www.invemar.org.co/ 6 Sánchez-Páez et al. 2000. 7 Plan Nacional de Restauración: Recuperación Ecológica, Rehabilitación y Recuperación de Áreas Disturbadas. 2015. MINAMBIENTE. Santa Fe de Bogotá D.C., Colombia.

Assessment of mangrove ecosystems in Colombia. | December 2017
5
towards forest resources management, including mangroves, and lists the regulations on mangrove management
and land use.
Despite the Colombian Government’s interest in preserving its mangrove ecosystems, demonstrated by the
development of regulations, initiatives, and management plans to achieve a sustainable use of mangroves and coastal
zones, the country recognizes a failure to properly communicate the importance of sustainable mangrove use to local
communities living in and around mangrove areas (called mangleros), and to monitor compliance with and enforce
of mangrove protection regulations5. Consequently, despite some restoration initiatives in the country, Colombia
estimated in 2004 that 21% of the total mangrove cover was degraded8. To reverse this trend, the central
Government outlined a series of strategies and programs towards meeting the target of developing a comprehensive
and sustainable land use planning and management of Colombia’s mangrove ecosystems by 2025 (listed in Annex
2). However, to the date, an accurate country-wide assessment of “mangrove baseline conditions” seems to be
lacking.
Defining “mangrove baseline conditions” to which restoration initiatives would be compared is key to assess
short and long-term success of mangrove restoration and conservation initiatives. The first steps towards
defining this baseline would be (1) perform a review of studies and reports to assess the condition and functionality
of coastal ecosystems, to identify opportunities and constraints of restoration and assess the feasibility of coastal
restoration projects in the country; (2) identify stakeholders and beneficiaries of the restoration project; and (3)
evaluate historical trends on mangrove cover change through historical land cover maps, as well as a thorough
assessment of the drivers of mangrove loss and degradation in the country.
8 INVEMAR 2004.

Assessment of mangrove ecosystems in Colombia. | December 2017
6
BENEFITS OF CONSERVING COLOMBIA’S COASTAL ECOSYSTEMS
Coastal areas around the world are being degraded or replaced by other land uses through anthropogenic pressure
and, to a lesser extent, climatic impacts9. The loss of coastal ecosystems such as mangroves entails the loss of the
multiple ecosystem services they provide10. The provision of these services (see Box 1) makes coastal ecosystems
one of the most valued in the planet11, and their rapid loss accentuates the urgent need to restore them worldwide.
Bayraktarov et al.12 published a synthesis of the cost and feasibility of coastal restoration and determined that
mangrove restoration projects around the world are the largest yet the least expensive (on a per area basis) of the
coastal and marine ecosystems. Mangroves are a resilient system that, once their environmental requirements are
met, spread quickly on the landscape. Given the wide array of services these ecosystems provide, their restoration
yields social, economic, and ecological benefits.
Colombia’s mangroves are suffering from land use change and degradation, as explained in detail in the following
sections of this report. The direct beneficiaries of achieving mangrove conservation through protection and
restoration projects would be the communities living in and around mangrove ecosystems. Sustainable management
of mangrove ecosystems, however, benefits the entire country indirectly. Specific benefits obtained from ecosystem
services are usually difficult to translate into economic gains, a metric that is frequently used to assess the
9 UNEP 2006. https://www.millenniumassessment.org/en/Articlee27e.html?id=76 10 Supporting, provisioning, regulating, and cultural services. Botero & Salzwedel. 1999 11 Costanza et al. 1997, 2014. 12 Bayraktarov et al. 2016.
Box 1: Main ecosystem services provided by mangroves
- Provision of food and fibers (biodiversity haven)
- Coastal protection and stabilization (storm and erosion abatement)
- Flood mitigation
- Water purification (sediment and nutrient filtering)
- Cultural services (tourism and recreation)
- Mitigation to climate change (GHG removal in biomass and soil)
- Adaptation to climate change (sea level rise and storm events)
Alongi 2008, Hussain & Badola 2008, McLeod et al. 2011, Duarte et al. 2013, Mukherjee et al. 2014, Mitsch & Gosselink 2015.

Assessment of mangrove ecosystems in Colombia. | December 2017
7
justification for a restoration investment13. A recent ecosystem services valuation database14 reviewed over 150
economic valuations of the ecosystem services provided by mangroves around the world, classifying them by
ecosystem service (storm protection, food provision, erosion prevention, nursery, etc) and by valuation method
(direct market pricing, avoided cost, replacement cost, among others), and obtained that mangroves were worth, on
average 1,494 USD ha-1 y-1, ranging between <0.1 and <60,000 USD ha-1 y-1. Colombia would benefit from a
country-specific ecosystem valuation assessment of its mangrove forests, as it could help identifying
restoration hotspots in the country.
MANGROVE COVER AND LOSS RATE IN COLOMBIA
Colombia’s national Government claims that even though their mangroves have been severely degraded by intensive
logging, infrastructure development, urban expansion, and pollution, there are still areas in the country where
mangroves are valued and sustained15. Colombia’s mangroves covered about 371,250 ha in 1997, with about three-
fourths located in the Pacific coast (~283,000 ha) and one-fourth in the Caribbean coast (~88,250 ha)16. By 2014,
the total coverage had decreased to 286,804 ha (Table 1), a 23% decrease from the 1997 coverage at a loss rate of
4,967 ha y-1 (assuming a constant rate of mangrove loss). The review by Álvarez-León17 reported an even higher loss
rate between 1966 and 1991 of 7,965 ha y-1. The decrease in the mangrove deforestation rate could be due to the
conservation initiatives implemented by the Government, even though they have been proved not to be 100%
successful18. Logging permits for red mangrove forests (Rhizophora sp.)7 are still being issued in the Pacific coast
and shrimp ponds development continues along the Caribbean coast. In addition, illegal logging persists as a common
practice in the country and especially in the Pacific, including illegal mangrove logging19. Despite extensive logging,
the Pacific coast still has extensive mangrove strips that go up to 20 km inland20, whereas the Caribbean coast has
only narrow strips of mangrove forests along freshwater tidal creeks and lagoons21 (Figure 1).
Shrimp pond construction is one of the land uses replacing Colombian mangroves. The shrimp industry is growing
in Colombia, particularly in the Caribbean where the local Government issues shrimp ponds certificates (permits)
and encourages shrimp exports22. Shrimp industry in the Caribbean coast is centered in the States of Bolivar and
13 Barbier 2017. 14 TEED Valuation Database. Van der Ploeg and de Groot. 2010. 15 http://www.minambiente.gov.co/ 16 Sánchez-Páez et al. 1997b. 17 Álvarez-León. 2003. 18 Uso sostenible, manejo y conservación de los Ecosistemas de manglar en Colombia. 2002. MINAMBIENTE. Santa Fe de Bogotá D.C., Colombia. 19 Programa BIOREDD+, Producto 6. 2014. 20 Villalba Malaver. 2004. 21 Polania et al. 2015. 22 ICA 2012.

Assessment of mangrove ecosystems in Colombia. | December 2017
8
Sucre, covering about 1,971 ha of coastal land23 and being responsible of over 95% of the national shrimp production,
most of which is sold in the international market24. The Pacific coast has 245 ha of active shrimp production, located
in Nariño, whose produce is sold within Colombia. The shrimp business is an important driver of mangrove loss
because shrimp ponds have typically a lifetime of 3-9 years25 and thus, for a country to maintain shrimp productivity
coastal areas need to keep on being cleared to build new ponds. Other land uses replacing mangrove forests such as
urban construction or croplands do not have such a short life expectancy. Old abandoned shrimp ponds, however,
have the potential to be restored to their former mangrove land cover.
Figure 1. Mangrove distribution in the Pacific (left) and Caribbean coasts (right) of Colombia. Map developed with INVEMAR data (2014)26.
A review of the drivers of mangrove loss and degradation in Colombia (described in detail by state at the end of this
report) shows that mangroves are being lost at a rapid rate in the Caribbean, where land use change for coastal
development (resorts and ports, among others) and economic expansion (shrimp ponds, crops, and
plantations) are the leading drivers of mangrove deforestation. In the Pacific coast, on the other hand, the
shrimp ponds are less abundant than in the Caribbean and mangrove timber logging becomes one of the main
drivers of mangrove loss and degradation. Specific local drivers are described in the following sections of this
report.
23 FAO-INCODER 2011. 24 PTP 2014. 25 Kauffman et al. 2017. 26 http://www.caribbeanmarineatlas.net/maps/6322

Assessment of mangrove ecosystems in Colombia. | December 2017
9
Table 1. Latest mangrove zoning in Colombia, according to INVEMAR (2014) and to the central Government27.
State (Departamento) Total mangrove
cover (ha) Protected mangrove
area (ha) Protected
mangrove area (%)
San Andrés y Providencia 208 35 16.8 La Guajira 2,730 166 1.4 Sucre 12,190 0 0.0 Magdalena 38,042 21,106 55.5 Atlántico 237 0 0.0 Bolívar 9,739 2,929 30.1 Córdoba 8,975 0 0.0 Antioquia 5,810 0 0.0 Caribbean Region, Total 77,938 24,236 31.3 Chocó 40,774 33 0.1 Valle del Cauca 32,386 0 0.0 Cauca 23,204 0 0.0 Nariño 113,041 42,771 37.8 Pacific Region, Total 209,405 42,804 20.4
Country, Total 286,804 67,040 23.4
27 http://www.minambiente.gov.co/
Box 2: Common drivers of mangrove deforestation and degradation
DEFORESTATION DRIVERS:
- Most common land use changes leading the deforestation of mangroves are the creation of aquaculture ponds (shrimp
farms), the construction of infrastructure (roads and ports), and urban development of the coast.
- Indirectly, hydrological alterations (water diversions) and dredging of the peat soil can lead to mangrove
disappearance, when the alteration is severe.
DEGRADATION DRIVERS:
- Hydrological alterations are the leading cause of mangrove degradation. This entails the restriction of water flow in
the tidal channels, either from the salt water or from the freshwater source. Mangroves are brackish ecosystems and
as such thrive in salinities of 3 (oligohaline) to 30 ppt (saline), with different species adapted to different salinity
gradients. Eliminating the freshwater input can lead to the desiccation of the mangrove system and to the
overconcentration of salts that create hypersaline conditions, resulting in mangrove death.
- Fuelwood extraction is common in rural coastal communities, leading to ecosystem overharvest and deterioration.
- Eutrophication can result in the long term in mangrove degradation, due to an increase in the shoot:root ratio of the
trees and thus, becoming more vulnerable to storm events.
Cardona y Botero 1998, Elster et al 1999, Lovelock et al. 2009, Sathe et al. 2013, Kauffman et al. 2014, Lang’at et al. 2014, Mitsch & Gosselink 2015, Thomas et al. 2017.

Assessment of mangrove ecosystems in Colombia. | December 2017
10
Figure 2 shows a collection of aerial images of the Colombian coastline where degradation and deforestation drivers
(described in Box 2) have been identified, ranging from plantations to aquaculture ponds to eutrophication plumes
polluting the mangrove waters.
To date, there is no clear assessment of the extent of mangrove degradation in Colombia. The country would
benefit from an accurate evaluation of mangrove degradation and an estimation of the extent of degraded mangrove
land. Such an assessment would help Colombia in targeting restoration in specific coastal areas, in evaluating
Figure 2. Aerial images of current and former mangrove ecosystems in the coastal regions in Colombia with reported mangrove loss and degradation due to known drivers (according to the information in INVEMAR 2004, MINAMBIENTE 2012, and publications cited in the following sections and in the reference list). A. Palm plantations in the coast of Antioquia. B. Banana plantations by the desiccating Ciénaga de Santa Marta (Magdalena). C. Eutrophication plumes in Ciénaga de Santa Marta. D. Zoom-in of plantations by the Ciénaga de Santa Marta. E, F. Aquaculture ponds in Bolívar.
E
F
D
Assessment of mangrove ecosystems in Colombia. | December 2017
11
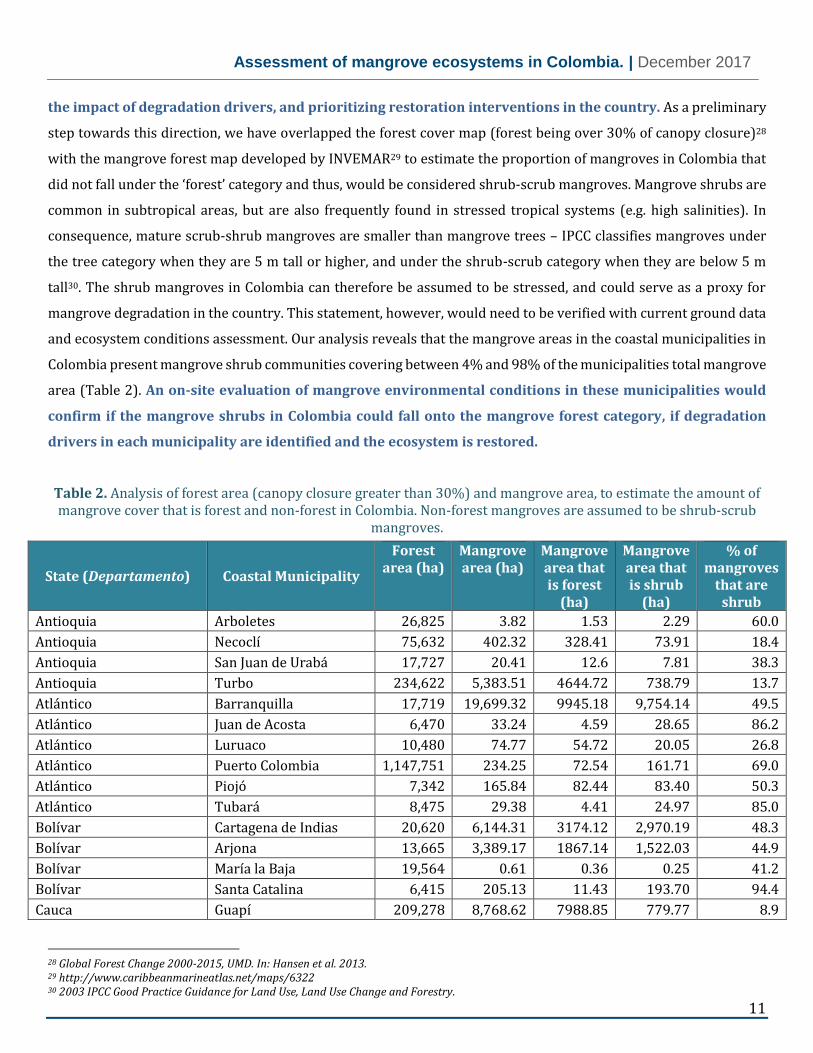
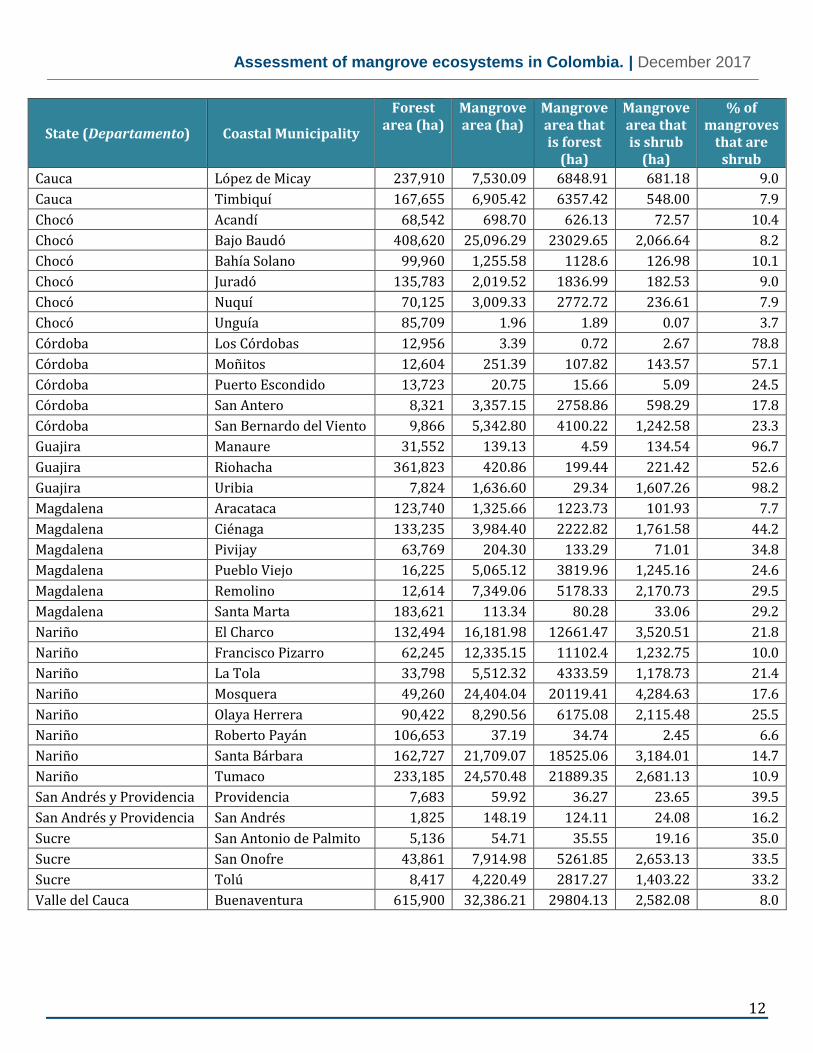
the impact of degradation drivers, and prioritizing restoration interventions in the country. As a preliminary
step towards this direction, we have overlapped the forest cover map (forest being over 30% of canopy closure)28
with the mangrove forest map developed by INVEMAR29 to estimate the proportion of mangroves in Colombia that
did not fall under the ‘forest’ category and thus, would be considered shrub-scrub mangroves. Mangrove shrubs are
common in subtropical areas, but are also frequently found in stressed tropical systems (e.g. high salinities). In
consequence, mature scrub-shrub mangroves are smaller than mangrove trees – IPCC classifies mangroves under
the tree category when they are 5 m tall or higher, and under the shrub-scrub category when they are below 5 m
tall30. The shrub mangroves in Colombia can therefore be assumed to be stressed, and could serve as a proxy for
mangrove degradation in the country. This statement, however, would need to be verified with current ground data
and ecosystem conditions assessment. Our analysis reveals that the mangrove areas in the coastal municipalities in
Colombia present mangrove shrub communities covering between 4% and 98% of the municipalities total mangrove
area (Table 2). An on-site evaluation of mangrove environmental conditions in these municipalities would
confirm if the mangrove shrubs in Colombia could fall onto the mangrove forest category, if degradation
drivers in each municipality are identified and the ecosystem is restored.
Table 2. Analysis of forest area (canopy closure greater than 30%) and mangrove area, to estimate the amount of mangrove cover that is forest and non-forest in Colombia. Non-forest mangroves are assumed to be shrub-scrub
mangroves.
State (Departamento) Coastal Municipality
Forest area (ha)
Mangrove area (ha)
Mangrove area that is forest
(ha)
Mangrove area that is shrub
(ha)
% of mangroves
that are shrub
Antioquia Arboletes 26,825 3.82 1.53 2.29 60.0
Antioquia Necoclí 75,632 402.32 328.41 73.91 18.4
Antioquia San Juan de Urabá 17,727 20.41 12.6 7.81 38.3
Antioquia Turbo 234,622 5,383.51 4644.72 738.79 13.7
Atlántico Barranquilla 17,719 19,699.32 9945.18 9,754.14 49.5
Atlántico Juan de Acosta 6,470 33.24 4.59 28.65 86.2
Atlántico Luruaco 10,480 74.77 54.72 20.05 26.8
Atlántico Puerto Colombia 1,147,751 234.25 72.54 161.71 69.0
Atlántico Piojó 7,342 165.84 82.44 83.40 50.3
Atlántico Tubará 8,475 29.38 4.41 24.97 85.0
Bolívar Cartagena de Indias 20,620 6,144.31 3174.12 2,970.19 48.3
Bolívar Arjona 13,665 3,389.17 1867.14 1,522.03 44.9
Bolívar María la Baja 19,564 0.61 0.36 0.25 41.2
Bolívar Santa Catalina 6,415 205.13 11.43 193.70 94.4
Cauca Guapí 209,278 8,768.62 7988.85 779.77 8.9
28 Global Forest Change 2000-2015, UMD. In: Hansen et al. 2013. 29 http://www.caribbeanmarineatlas.net/maps/6322 30 2003 IPCC Good Practice Guidance for Land Use, Land Use Change and Forestry.
Assessment of mangrove ecosystems in Colombia. | December 2017
12
State (Departamento) Coastal Municipality
Forest area (ha)
Mangrove area (ha)
Mangrove area that is forest
(ha)
Mangrove area that is shrub
(ha)
% of mangroves
that are shrub
Cauca López de Micay 237,910 7,530.09 6848.91 681.18 9.0
Cauca Timbiquí 167,655 6,905.42 6357.42 548.00 7.9
Chocó Acandí 68,542 698.70 626.13 72.57 10.4
Chocó Bajo Baudó 408,620 25,096.29 23029.65 2,066.64 8.2
Chocó Bahía Solano 99,960 1,255.58 1128.6 126.98 10.1
Chocó Juradó 135,783 2,019.52 1836.99 182.53 9.0
Chocó Nuquí 70,125 3,009.33 2772.72 236.61 7.9
Chocó Unguía 85,709 1.96 1.89 0.07 3.7
Córdoba Los Córdobas 12,956 3.39 0.72 2.67 78.8
Córdoba Moñitos 12,604 251.39 107.82 143.57 57.1
Córdoba Puerto Escondido 13,723 20.75 15.66 5.09 24.5
Córdoba San Antero 8,321 3,357.15 2758.86 598.29 17.8
Córdoba San Bernardo del Viento 9,866 5,342.80 4100.22 1,242.58 23.3
Guajira Manaure 31,552 139.13 4.59 134.54 96.7
Guajira Riohacha 361,823 420.86 199.44 221.42 52.6
Guajira Uribia 7,824 1,636.60 29.34 1,607.26 98.2
Magdalena Aracataca 123,740 1,325.66 1223.73 101.93 7.7
Magdalena Ciénaga 133,235 3,984.40 2222.82 1,761.58 44.2
Magdalena Pivijay 63,769 204.30 133.29 71.01 34.8
Magdalena Pueblo Viejo 16,225 5,065.12 3819.96 1,245.16 24.6
Magdalena Remolino 12,614 7,349.06 5178.33 2,170.73 29.5
Magdalena Santa Marta 183,621 113.34 80.28 33.06 29.2
Nariño El Charco 132,494 16,181.98 12661.47 3,520.51 21.8
Nariño Francisco Pizarro 62,245 12,335.15 11102.4 1,232.75 10.0
Nariño La Tola 33,798 5,512.32 4333.59 1,178.73 21.4
Nariño Mosquera 49,260 24,404.04 20119.41 4,284.63 17.6
Nariño Olaya Herrera 90,422 8,290.56 6175.08 2,115.48 25.5
Nariño Roberto Payán 106,653 37.19 34.74 2.45 6.6
Nariño Santa Bárbara 162,727 21,709.07 18525.06 3,184.01 14.7
Nariño Tumaco 233,185 24,570.48 21889.35 2,681.13 10.9
San Andrés y Providencia Providencia 7,683 59.92 36.27 23.65 39.5
San Andrés y Providencia San Andrés 1,825 148.19 124.11 24.08 16.2
Sucre San Antonio de Palmito 5,136 54.71 35.55 19.16 35.0
Sucre San Onofre 43,861 7,914.98 5261.85 2,653.13 33.5
Sucre Tolú 8,417 4,220.49 2817.27 1,403.22 33.2
Valle del Cauca Buenaventura 615,900 32,386.21 29804.13 2,582.08 8.0

Assessment of mangrove ecosystems in Colombia. | December 2017
13
MANGROVE DEGRADATION DUE TO FUELWOOD COLLECTION
One of the drivers of mangrove degradation in Colombia is the extraction of mangrove biomass for fuelwood and
charcoal, especially in the Caribbean coast31. The selective biomass harvest for fuelwood and charcoal is causing
forest degradation when the forest biomass is removed at a rate that exceeds the capacity of the forest to grow
(thereby considered non-renewable biomass - NRB). Population is therefore driving the fuelwood demand and, in
coastal communities in and around a mangrove forest, their fuelwood is supplied from the nearby upland and
mangrove forests. To evaluate the pressure that Colombia’s fuelwood demand has on mangrove resources in the
coastal communities with mangrove cover, a spatial analysis32 of fuelwood demand and supply potential using the
Woodfuel Integrated Supply/Demand Overview Mapping (WISDOM) model was used. For this analysis, only the
fuelwood demand that was satisfied by non-land use change forest by-products was considered33. NRB already
accounts for the available biomass of mangrove forests, but likely does not consider shrub biomass.
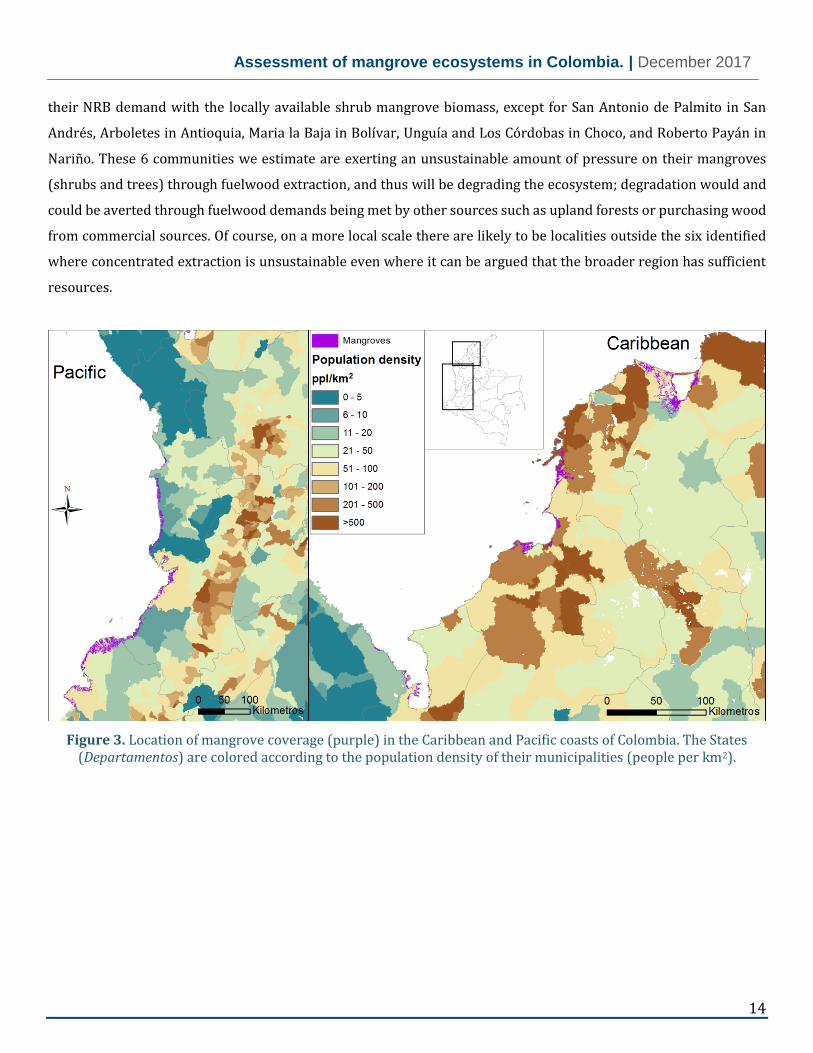
To assess the pressure that fuelwood demand has on Colombia’s mangrove ecosystems, we
(A) evaluated the location of the most densely-populated coastal municipalities and overlapped it with the
mangrove cover map (Figure 3); and
(B) calculated the average biomass carbon pool of mangrove shrubs from a review of published worldwide
mangrove carbon stocks33, and assessed if mangrove shrubs in the area can meet the local NRB need (see
list of references and the detailed data in Annex 1).
The overlapping of population density and mangrove cover maps indicate that the coastal Colombian regions that
could be exerting more pressure on their mangroves ecosystems would be the coast of Valle del Cauca and southern
Nariño, in the Pacific, and the coasts of Sucre, Cordoba, Bolívar, and Magdalena in the Caribbean. Additionally, the
estimate of the biomass carbon (C) pool contained in the shrub mangrove ecosystems revealed the coastal
communities in the country could meet the local NRB demand through mangrove shrub biomass. Given the available
country information, we do not know where Colombian coastal communities obtain their fuelwood biomass (i.e.
whether it is from upland forests or from mangrove forests), but we know that these communities demand more
fuelwood biomass than what would be available under a sustainable biomass extraction, which means that forests
(mangrove and/or upland forests) are being degraded for fuelwood extraction (see NRB for Colombia’s coastal
communities in Annex 1). Shrub mangrove biomass, however, is not accounted for in WISDOM and can be used to
meet the fuelwood demand as well. Our analysis reveals that almost all coastal communities in Colombia can meet
31 Uso sostenible, manejo y conservación de los Ecosistemas de manglar en Colombia. 2002. MINAMBIENTE. Santa Fe de Bogotá D.C., Colombia. 32 Drigo. 2014. 33 https://infoflr.org/what-flr/global-emissions-and-removals-databases
Assessment of mangrove ecosystems in Colombia. | December 2017
14
their NRB demand with the locally available shrub mangrove biomass, except for San Antonio de Palmito in San
Andrés, Arboletes in Antioquia, Maria la Baja in Bolívar, Unguía and Los Córdobas in Choco, and Roberto Payán in
Nariño. These 6 communities we estimate are exerting an unsustainable amount of pressure on their mangroves
(shrubs and trees) through fuelwood extraction, and thus will be degrading the ecosystem; degradation would and
could be averted through fuelwood demands being met by other sources such as upland forests or purchasing wood
from commercial sources. Of course, on a more local scale there are likely to be localities outside the six identified
where concentrated extraction is unsustainable even where it can be argued that the broader region has sufficient
resources.
Figure 3. Location of mangrove coverage (purple) in the Caribbean and Pacific coasts of Colombia. The States (Departamentos) are colored according to the population density of their municipalities (people per km2).

Assessment of mangrove ecosystems in Colombia. | December 2017
15
POTENTIAL EMISSIONS REMOVAL WITH MANGROVE RESTORATION
To the date, there is no specific information available on Colombia’s mangrove restoration targets. Several peer-
reviewed publications and Government reports evaluate the success of mangrove restoration in some areas of the
country (see the following sections on Caribbean and Pacific mangrove current status and the list of bibliographical
references used). Mangroves are included in the latest National Restoration Plan34, without specifying explicit
restoration locations, target areas (size) of restoration, or even a current extension of degraded mangroves in the
country. Therefore, it seems that an evaluation of priority restoration targets is lacking in Colombia, as well
as a restoration feasibility plan that would allow identifying benefits of restoring specific mangrove areas in
the country.
There are some sources of information that could help Colombia to set a restoration target. For example, INVEMAR
developed a coastal erosion map35 that shows the coastal areas where erosion is occurring. This map could be used
to identify priority areas for coastal restoration. More ground data would be necessary to assess the proportion of
mangrove area being affected by this coastal erosion phenomenon, and determine if eroding areas can actually
support mangrove growth to aid in decreasing the coastal erosion process. Additionally, the zonation of protected
mangrove areas (Table 1) would suggest that, under a land management that ensures that protected areas are not
degraded in the country, the mangrove areas that can potentially be degraded in Colombia and thus potentially
restored would be those that are not protected with the current legislation. Furthermore, the coverage of mangroves
that do not fall under the forest category could also indicate potential areas that are under environmental stress and
could potentially be restored (Table 2). Lastly, the coastal land covered by shrimp and aquaculture ponds will be
unfit for its current land use once the ponds surpass their life expectancy, and will likely be abandoned36, thereby
becoming coastal land suitable for mangrove restoration. In Table 3 we show the area of each coastal State in
Colombia that could potentially be a restoration target. This estimate, however, should be verified with actual on-
site data, when it becomes available. According to this assumption, if shrub mangroves are indeed degraded
mangroves in Colombia and are located only in non-protected areas, more than half of the unprotected mangroves
in the Caribbean coast would be degraded, while only about one-sixth in the Pacific coast. Table 3 also shows the
area of active shrimp pond infrastructure37 that will be appropriate for restoration once the ponds are no longer in
use.
34 Plan Nacional de Restauración: Recuperación Ecológica, Rehabilitación y Recuperación de Áreas Disturbadas. 2015. MINAMBIENTE. Santa Fe de Bogotá D.C., Colombia. 35 http://gis.invemar.org.co/erosioncostera/ 36 Kauffman et al. 2017. 37 FAO-INCODER 2011.
Assessment of mangrove ecosystems in Colombia. | December 2017
16
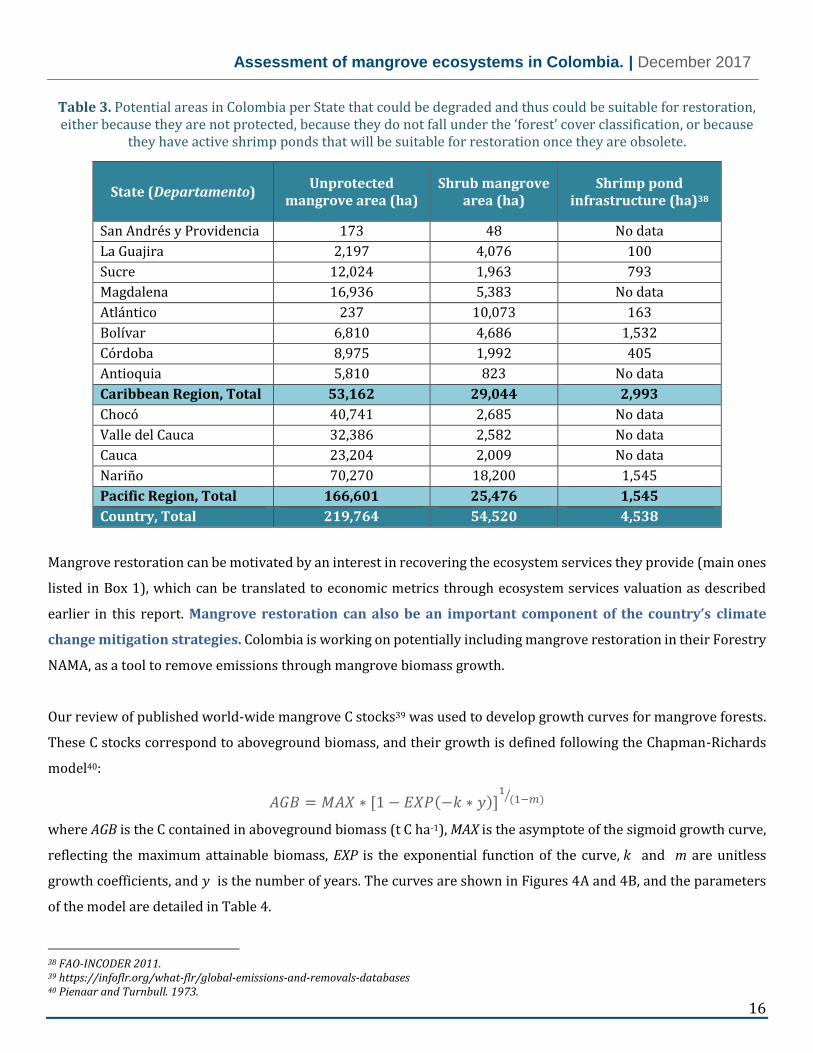
Table 3. Potential areas in Colombia per State that could be degraded and thus could be suitable for restoration, either because they are not protected, because they do not fall under the ‘forest’ cover classification, or because
they have active shrimp ponds that will be suitable for restoration once they are obsolete.
State (Departamento) Unprotected
mangrove area (ha) Shrub mangrove
area (ha) Shrimp pond
infrastructure (ha)38
San Andrés y Providencia 173 48 No data
La Guajira 2,197 4,076 100
Sucre 12,024 1,963 793
Magdalena 16,936 5,383 No data
Atlántico 237 10,073 163
Bolívar 6,810 4,686 1,532
Córdoba 8,975 1,992 405
Antioquia 5,810 823 No data
Caribbean Region, Total 53,162 29,044 2,993
Chocó 40,741 2,685 No data
Valle del Cauca 32,386 2,582 No data
Cauca 23,204 2,009 No data
Nariño 70,270 18,200 1,545
Pacific Region, Total 166,601 25,476 1,545
Country, Total 219,764 54,520 4,538
Mangrove restoration can be motivated by an interest in recovering the ecosystem services they provide (main ones
listed in Box 1), which can be translated to economic metrics through ecosystem services valuation as described
earlier in this report. Mangrove restoration can also be an important component of the country’s climate
change mitigation strategies. Colombia is working on potentially including mangrove restoration in their Forestry
NAMA, as a tool to remove emissions through mangrove biomass growth.
Our review of published world-wide mangrove C stocks39 was used to develop growth curves for mangrove forests.
These C stocks correspond to aboveground biomass, and their growth is defined following the Chapman-Richards
model40:
𝐴𝐺𝐵 = 𝑀𝐴𝑋 ∗ [1 − 𝐸𝑋𝑃(−𝑘 ∗ 𝑦)]1
(1−𝑚)⁄
where AGB is the C contained in aboveground biomass (t C ha-1), MAX is the asymptote of the sigmoid growth curve,
reflecting the maximum attainable biomass, EXP is the exponential function of the curve, 𝑘 and m are unitless
growth coefficients, and 𝑦 is the number of years. The curves are shown in Figures 4A and 4B, and the parameters
of the model are detailed in Table 4.
38 FAO-INCODER 2011. 39 https://infoflr.org/what-flr/global-emissions-and-removals-databases 40 Pienaar and Turnbull. 1973.

Assessment of mangrove ecosystems in Colombia. | December 2017
17
Table 4. Parameters developed for the Chapman-Richards biomass growth curves for mangrove ecosystems in Colombia.
Mangrove type R2 Growth curve parameters
MAX k m 1/(1-m)
Tree 0.56 158 0.073 0.55 2.222
Shrub-scrub 0.53 37 0.111 0.71 3.448
The uncertainty associated to the biomass growth is calculated with a 95% confidence interval, using the following
equation:
𝐼𝐶 = 𝑇𝐼𝑁𝑉 ∗ 𝜎𝑟𝑒𝑠 ∗ √(1
𝑛) + [(𝑦 − 𝑦𝑎)2 ∑ 𝑦𝑟𝑒𝑠⁄ ]
where, 𝐼𝐶 is the half-width of the 95% confidence Interval of the AGB (t C ha-1), 𝑇𝐼𝑁𝑉 is the inverse of the t-Student
distribution of the Chapman-Richards curve with a p-value of 0.05, 𝜎𝑟𝑒𝑠 is the standard deviation of the residuals of
the Chapman-Richards curve, n is the number of data points that produced the curve, 𝑦 is the number of years, 𝑦𝑎 is
the average of the years that were used to develop the Chapman-Richards curve, ∑ 𝑦𝑟𝑒𝑠 is the sum of the residuals
of the years in the curve. These parameters are detailed in Table 5.
Table 5. Parameters developed for the 95% confidence intervals of the Chapman-Richards biomass growth curves for mangrove ecosystems in Colombia.
Mangrove type Parameters of the confidence Interval of the model.
TINV σ res a p ∑ a res n
Tree 2.01 54.24 17 18,202.50 50
Shrub-scrub 2.16 6.60 15 1,169.08 13
The analysis indicates that mangrove restoration in Colombia can potentially remove CO2e, through aboveground
mangrove biomass growth, at a rate of 16.1 ± 2.9 t CO2e ha-1 y-1, and 4.4 ± 0.7 t CO2e ha-1 y-1 during the first 20 years
of restoration of mangrove trees and shrubs, respectively. After the first 20 years since planting, the emission
removal rates would be 7.4 ± 1.9 t CO2e ha-1 y-1 for mangrove trees and 1.4 ± 1.3 t CO2e ha-1 y-1 for mangrove shrubs
over the next 30 years, assuming a constant rate of growth. These removal rates can be applied to mangrove
restoration areas to estimate the total CO2e removals with mangrove restoration. The NAMA Tool developed by
Winrock International for Colombia’s Ministry of Environment and Sustainable Development (MADS) uses this logic

Assessment of mangrove ecosystems in Colombia. | December 2017
18
to support stakeholder decision making, as part of Colombia’s Forestry NAMA initiative. As an example of how these
removal rates could be applied to a mangrove restoration area, Table 6 shows the result of multiplying the described
aboveground mangrove tree biomass growth to the areas potentially suitable for mangrove restoration (from Table
3), if all those areas were able to achieve a successful restoration and grow healthy mangrove trees. Such a suitability
must ultimately be determined on-site with current ground-data in a restoration feasibility assessment.
Table 6. Average CO2e removal rates (t CO2e y-1) that Colombia could potentially achieve if all the unprotected mangrove areas, shrub mangrove areas, and shrimp pond areas estimated above were fitted for mangrove
restoration and were able to grow healthy mangrove trees once the restoration is implemented.
State (Departamento)
Average potential CO2e removal rate, years 0-20 since of restoration
Average potential CO2e removal rate, years 20-50 since of restoration
Unprotected mangroves
Shrub mangroves
Shrimp ponds
Unprotected mangroves
Shrub mangroves
Shrimp ponds
San Andrés y Providencia 2,785 773 No data 1,280 355 No data
La Guajira 35,372 65,624 1,610 16,258 30,162 740
Sucre 193,586 31,604 12,767 88,978 14,526 5,868
Magdalena 272,670 86,666 No data 125,326 39,834 No data
Atlántico 3,816 162,175 2,624 1,754 74,540 1,206
Bolívar 109,641 75,445 24,665 50,394 34,676 11,337
Córdoba 144,498 32,071 6,521 66,415 14,741 2,997
Antioquia 93,541 13,250 No data 42,994 6,090 No data
Caribbean Region 855,908 467,608 48,187 393,399 214,926 22,148
Chocó 655,930 43,229 No data 301,483 19,869 No data
Valle del Cauca 521,415 41,570 No data 239,656 19,107 No data
Cauca 373,584 32,345 No data 171,710 14,867 No data
Nariño 1,131,347 293,020 24,875 519,998 134,680 11,433
Pacific Region 2,682,276 410,164 24,875 1,232,847 188,522 11,433
Country, Total 3,538,200 877,772 73,062 1,626,254 403,448 33,581
Figure 4. A. Biomass-C growth curve of mangrove trees; and B. biomass-C growth curve of mangrove shrub-scrub.

Assessment of mangrove ecosystems in Colombia. | December 2017
19
CURRENT STATE OF MANGROVES IN THE CARIBBEAN REGION
The Caribbean region has a total mangrove forest area of 77,938 ha41, of which about one-third is protected42 (Table
1). Magdalena is the state with the highest mangrove cover in this coast. This region has four main estuaries,
developed by the river Magdalena and the river Sinú, that have 59 coastal lagoons where mangroves grow43. One of
these lagoons is the Ciénaga Grande de Santa Marta, the largest in the country. The most common mangrove species
in the Caribbean coast of Colombia are Avicennia germinans and Rhizophora mangle, followed by Laguncularia
racemosa, Conocarpus erecta and Pelliciera rhizophorae44. Coastal communities in the Caribbean have traditionally
used the natural resources that grow and inhabit the mangrove ecosystems, such as fishing, recollection, biomass
extraction, tourism, etc. Mangrove biomass has traditionally been used in this region to build canoes and utensils, or
as fuelwood and charcoal, given its high calorific content and low ash production45,46.
The information on the conditions of the mangroves in this coastal region and the drivers impacting the ecosystem
in each Caribbean State has been compiled from reports from INVEMAR47 and the central Government48,49, and from
the numerous research publications listed in the references list.
Drivers of mangrove loss, degradation, and expansion in the Caribbean region La Guiajira: Mangroves in this State have had little anthropogenic pressure, but they are impacted by increasing
drought desiccating freshwater supply channels, resulting in hyper salinization of the soil and the surviving water
ponds and in the death of vegetation and aquatic animals. Mangroves in the upper region of the State have also
suffered from pests that caused in the die-off of the species Avicenia germinans.
Magdalena: The most significant impacts to the mangrove ecosystems in this State are located in the delta estuary
of the river Magdalena, particularly in the Ciénaga Grande de Santa Marta and the Isla de Salamanca, due to the
diversion, diking, and drainage of freshwater courses for construction of infrastructure (roads) and agricultural
41 http://www.caribbeanmarineatlas.net/maps/6322 42 http://www.minambiente.gov.co/ 43 INVEMAR 2004. 44 Álvarez-León 2003. 45 Sathe et al. 2013. 46 Sánchez-Páez et al. 1997b. 47 INVEMAR 2004 48 Plan Nacional de Restauración: Recuperación Ecológica, Rehabilitación y Recuperación de Áreas Disturbadas. 2012. MINAMBIENTE. Santa Fe de Bogotá D.C., Colombia. 49 Uso sostenible, manejo y conservación de los Ecosistemas de manglar en Colombia. 2002. MINAMBIENTE. Santa Fe de Bogotá D.C., Colombia.

Assessment of mangrove ecosystems in Colombia. | December 2017
20
purposes (e.g. banana plantations)50,51. These actions have led to the hyper salinization (reportedly up to 10 times
the ocean’s salinity) of the ecosystem52. This area has also suffered from the increased sedimentation consequence
of the deforestation in key watersheds of the State (rivers Sevilla and Fundación)53. In consequence, it was estimated
that up to 95% of the mangrove trees in the Ciénaga Grande de Santa Marta and the Isla de Salamanca since the
1950s had died in a single event54. In 1995–2001, the Government worked on the restoration of the ecosystem under
a project with IDB and GTZ funds that reopened and cleared freshwater inlets to restore the hydrology of the
ecosystem. The area thereby recovered part of its original mangrove cover and density in the Ciénaga. Further
restoration activities and planting of mangroves were implemented in 2004, but seedlings presented high rates of
mortality55, likely because of the persistence of the drivers of mangrove degradation in the area (hyper salinization
and altered hydrology)56. Additional drivers of mangrove degradation in this area are the extraction of biomass for
fuelwood and charcoal production. The Ciénaga Grande de Santa Marta is the largest extent of mangrove forests in
the country and one of the most studied in the last two decades.
Atlántico: In this State, high pollution and eutrophication levels have been the main drivers of mangrove
degradation, particularly in the Ciénaga de Mallorquín, Ciénaga de Balboa, and Ciénaga del Rincón, due to the
discharge of waste and contaminated waters and sediments on the river Magdalena, accumulating on the mangrove
ecosystem. Additionally, industrial activities in the area have also been diverting water channels and altering the
hydrology of the ecosystem.
Bolívar: Sedimentation blocked the freshwater tidal channels and restricting their flow in large sections of the
Bolívar coast, where numerous large size mangroves have been found standing dead. These sediments come mainly
from the Canal del Dique. Additionally, the Bahía de Cartagena and the Ciénaga de la Virgen experiences high
pollution levels from industry and aquatic traffic, decreasing mangrove productivity in the area. Numerous
development of infrastructures around Cartagena have incurred in the clearing of some mangrove areas to construct
roads and resorts, and in the modification of waterways that led to the desiccation and hyper salinization of the
remaining mangrove areas. In the region of Canal del Dique and in Bahía de Barbacoas there is additional
degradation due to the biomass extraction by local communities for fuelwood, and numerous mangrove
deforestation areas where the mangrove forest has been replaced by industrial shrimp ponds, which polluted the
surrounding areas with their unmanaged wastewater from the shrimp production process.
50 Botero and Salzwedel. 1999. 51 Cardona and Botero. 1998. 52 Elster et al. 1999. 53 Sánchez-Páez et al. 2000. 54 Polania et al. 2015. 55 Salas-Leiva et al. 2009. 56 Elster 2000.

Assessment of mangrove ecosystems in Colombia. | December 2017
21
Sucre: The delta of the Canal del Dique and the Ciénaga La Caimanera receive a substantial amount of the sediments
that this waterway carries, in addition to those carried from the deforested hills on the west bordering with Córdoba.
Additionally, the mangroves in the Golfo de Morrosquillo were severely impacted by the cutting down of the trees
and filling of the wetland to convert it to other land uses and create roads57. Standing mangroves in the Golfo de
Morrosquillo and the Ciénaga La Caimanera have been suffering from significant degradation as well due to these
hydrological alterations, leading to hypersaline conditions and to the overharvesting of their biomass for fuelwood.
Overall, much of the mangrove areas in Sucre have been replaced by pastures for livestock, crops, and salt flats.
Córdoba: In the Delta Antiguo del Río Sinú, mangrove expansion due to salt water intrusion in former rice paddies.
The intrusion of salt water is reported to be consequence of the hydrological alteration of the freshwater flow from
the main river feeding the delta. On the other hand, this delta has been negatively affected by the development of
shrimp ponds, and the net result on mangrove cover is unclear. Punta Bolívar and the Bahía de Cispatá are frequently
experiencing mangrove damages due to strong wind currents in the area. Industrial salt flats in the area have
modified the hydrology of the tidal channels, despite the State’s regulation. The Bahía de Cispatá is a mangrove
ecosystem highly valued by the local communities, and the Government claims that these communities are aware of
the need to preserve it for their own subsistence.
Antioquia: The mangroves in the Golfo de Urabá suffer from pollution from communities’ trash and from
wastewaters originated in the banana plantations and in the port on Bahía Colombia. There is also an important
illegal mangrove biomass extraction for charcoal production in Turbo and Necoclí. The mangroves in the Golfo de
Urabá have also been impacted since 1997 by a parasite mollusk (Neoteredo reynei) that has killed many mangrove
individuals, mature and successional.
Chocó (Urabá chocoano): Mangroves in the tidal creeks of Capurganá have been cleared for the construction of
resorts and for the establishment of coconut plantations, leaving a few isolated individuals.
San Andrés y Providencia: Mangroves in these islands are mainly impacted by the pollution of their waters due
to fuel combustion, grey waters, and garbage dumped by the coastal communities. They have also been deforested
for development purposes and, to a lesser extent, due to the expansion of the shrimp industry.
57 Urueta et al. 2010.

Assessment of mangrove ecosystems in Colombia. | December 2017
22
CURRENT STATE OF MANGROVES IN THE PACIFIC REGION
The Pacific region has a total mangrove forest area of 209,405 ha58, of which about one-fifth is protected59 (Table 1).
More than half of the mangrove forest cover in this coast is concentrated in the State of Nariño. The most extended
species are the red mangroves (Rhizophora sp.); Avicenia germinans and Pelliciera rhizophorae are also abundant60.
Communities in the Pacific coast have also been traditionally using the natural resources offered by the mangrove
forests, extracting wood to build houses and canoes, collecting fuelwood for fuel and charcoal for their daily needs,
fishing and catching sea food inhabiting the ecosystem, etc. The shrimp industry, once strong in this coast and leading
mangrove loss, has decreased substantially due to the inefficiency of the shrimp ponds in this area, whose larvae had
to be imported and had frequent diseases, and whose products had a highly variable price shrimp market.
The information on the conditions of the mangroves in this coastal region and the drivers impacting the ecosystem
in each Pacific State has been compiled from reports from INVEMAR61 and the central Government62,63, and from the
numerous research publications listed in the references list.
Drivers of mangrove loss, degradation, and expansion in the Pacific region Chocó: Mangroves in this State have been impacted by the extraction of biomass (logging) for diverse marketable
wood products, because of the wood quality of mangroves growing in this coast (Rhizophora sp. and P. rhizophorae).
Valle del Cauca: The development of the Bahía de Buenaventura has incurred in severe impacts on the
surrounding mangrove ecosystems, due to then expansion of its urban area and maritime port. This entailed
deforestation, land filling, hydrological alterations, and contamination with fuels, urban and industrial wastewaters,
and trash. The Southern region of the State has also been affected by the diversion of freshwater ways to supply
urban areas and by the conversion of mangroves to coconut plantations. The conversion of mangrove forests to
coconut plantations has been frequent in this State, and has led to an accelerated coastal erosion. The local
Government has restricted mangrove biomass extraction in the State, but local communities still collect mangrove
wood at a small scale for their community use.
58 http://www.caribbeanmarineatlas.net/maps/6322 59 http://www.minambiente.gov.co/ 60 Álvarez-León. 2003. 61 INVEMAR 2004 62 Plan Nacional de Restauración: Recuperación Ecológica, Rehabilitación y Recuperación de Áreas Disturbadas. 2012. MINAMBIENTE. Santa Fe de Bogotá D.C., Colombia. 63 Uso sostenible, manejo y conservación de los Ecosistemas de manglar en Colombia. 2002. MINAMBIENTE. Santa Fe de Bogotá D.C., Colombia.
Assessment of mangrove ecosystems in Colombia. | December 2017
23
Valle del Cauca has high deforestation in their watersheds, and the sediments produced by the increasing erosion
accumulate in the estuaries along the coastline64, forming small islands that get colonized by herbaceous vegetation
and mangrove propagules. These islands are semi-permanent, and are gaining stability as vegetation colonizes them.
Mangroves are also extending upwards into the tidal creeks, likely due to an increase in the tidal frame.
Cauca: The drivers of mangrove loss and degradation in this State are similar to those described for Valle del Cauca,
such as fuelwood extraction, logging, charcoal production, and replacement of mangrove forests by coconut
plantations. This state also presents mangrove loss due to the development of shrimp ponds. The phenomenon of
mangrove expansion upon the creation of semi-permanent sedimentary islands is also frequent in Cauca.
Nariño: The greatest historical impact on the mangroves in this State are located in the watersheds of the river Patía
and the river Sanquianga. These watersheds have been significantly altered by major water diversions and
channelization to allow a quicker and easier extraction of logged trees from the upland forest than the traditional
terrestrial log extraction route. In the Ensenada de Tumaco, the impacts on mangrove ecosystems are related to an
increased development of urban areas, tourism, commercial and industrial activity, port traffic, and shrimp ponds
development, resulting in high levels of pollution and eutrophication from the urban and industrial wastewaters and
sediments.
64 Uso sostenible, manejo y conservación de los Ecosistemas de manglar en Colombia. 2002. MINAMBIENTE. Santa Fe de Bogotá D.C., Colombia.

Assessment of mangrove ecosystems in Colombia. | December 2017
24
REFERENCES
Álvarez-León R. 2003. Los manglares de Colombia y la recuperación de sus áreas degradadas: revisión bibliográfica
y nuevas experiencias. Madera y Bosques 9: 3-25.
Alongi D.M. 2008. Mangrove forests: Resilience, protection from tsunamis, and responses to global climate change.
Estuarine, Coastal and Shelf Science 76: 1-13.
Alongi D.M. 2012. Carbon Sequestration in Mangrove Forests. Carbon Management 3: 313-322.
Barbier E.B. 2017. Valuation of Mangrove Restoration. Oxford Research Encyclopedia of Environmental Science. DOI:
10.1093/acrefore/9780199389414.013.458
Barker T., L. Bernstein, P. Bosch, et al. 2007. Climate Change 2007: An Assessment of the Intergovernmental Panel
on Climate Change.
Bayraktarov E., M.I. Saunders, S. Abdullah, M. Mills, J. Beher, H.P. Possingham, P.J. Mumby, C. Lovelock. 2016. The cost
and feasibility of marine coastal restoration. Ecological Applications 26: 1055-1074.
Botero L., H. Salzwedel. 1999. Rehabilitation of the Ciénaga Grande de Santa Marta, a mangrove-estuarine system in
the Caribbean coast of Colombia. Ocean and Coastal Management 42: 243-256.
Chen G., N.F.Y. Tam, Y. Ye. 2012. Spatial and seasonal variations of atmospheric N2O and CO2 fluxes from a subtropical
mangrove swamp and their relationships with soil characteristics. Soil Biology and Biochemistry 48: 175-181
Cardona P., L. Botero. 1998. Soil characteristics and vegetation structure in a heavily deteriorated mangrove forest
in the Caribbean coast of Colombia. Biotropica 30: 24-34.
Costanza R., R. D’Arge, R. de Groot, et al. 1997. The value of the world’s ecosystem services and natural capital. Nature
387: 253-260.
Costanza R., R. de Groot, P. Sutton, S. van der Ploeg, S. J. Anderson, I. Kubiszewski, S. Farber, and R. K. Turner. 2014.
Changes in the global value of ecosystem services. Global Environmental Change 26: 152–158.
Drigo, R. 2014. “Elaboration of the pan-tropical analysis of NRB harvesting (Tier 1 data, version 01 April 2014).”
Produced by the Yale-UNAM GACC Project: Geospatial Analysis and Modeling of Non-Renewable Biomass: WISDOM
and Beyond for Global Alliance for Clean Cookstoves.
Duarte C.M., I.J. Losada, I.E. Hendriks, I. Mazarrasa, N. Marbá. 2013. The role of coastal plant communities for climate
change mitigation and adaptation. Nature Climate Change 3:961–968.
Elster C., L. Pedromo, M.L. Schnetter. 1999. Impact of ecological factors on the regeneration of mangroves in the
Ciénaga Grade de Santa Marta, Colombia. Hydrobiologia 413: 35-46.
Elster, C. 2000. Reasons for reforestation success and failure with three mangrove species in Colombia. Forest
Ecology and Management 131: 201-214.
FAO – INCODER. 2011. Plan Nacional de Desarrollo de la Acuicultura Sostenible en Colombia. Diagnóstico del Estado
de la Acuicultura en Colombia. MADR, Santa Fe de Bogotá D.C., Colombia.
Hansen M. C., P. V. Potapov, R. Moore, et al. 2013. High-Resolution Global Maps of 21st-Century Forest Cover Change.
Science 342 (6160): 850-853.

Assessment of mangrove ecosystems in Colombia. | December 2017
25
Hussain S.A., R. Badola. 2008. Valuing mangrove ecosystem services: linking nutrient retention function of mangrove
forests to enhanced agroecosystem production. Wetlands Ecology and Management 16: 441-450.
[ICA] Instituto Colombiano Agropecuario. 2012. El sector camaronicultor colombiano: evolución y admisibilidad.
Presentación Reunión ICA – 50 años. https://www.ica.gov.co/
[INVEMAR] Instituto de Investigaciones Marinas y Costeras. 2004. Estado de los estuarios y manglares en Colombia.
In: Informe del Estado de los Ambientes Marinos y Costeros en Colombia 2004. pp 125-146.
Kairo J.G., J. Bosire, J. Langat, B. Kirui, N. Koedam. 2009. Allometry and Biomass Distribution in Replanted Mangrove
Plantations at Gazi Bay, Kenya. In: Aquatic Conservation: Marine and Freshwater Ecosystems 19: 63-69.
Kathiresan K., R. Anburaj, V. Gomathi, K. Saravanakumar. 2013. Carbon Sequestration potential of Rhizophora
mucronata and Avicennia marina as influenced by age, season, growth and sediment characteristics in southeast
coast of India. Coastal Conservation Planning and Management 17: 397-408.
Kauffman J.B, C. Heider, J. Norfolk, F. Payton. 2014. Carbon stocks of intact mangroves and carbon emissions arising
from their conversion in the Dominican Republic. Ecological Applications 24: 518-527.
Kauffman J.B, V.B. Arifanti, H. Hernandez Trejo, M.C.J. Garcia, J. Norfolk, M. Cifuentes, D. Hadriyanto, D. Murdiyarso.
2017. The jumbo carbon footprint of a shrimp: carbon losses from mangrove deforestation. Frontiers in Ecology and
the Environment. doi:10.1002/fee.1482.
Lang’at J.K.S., J.G. Kairo, M. Mencuccini, S. Bouillon, M.W. Skov, et al. 2014. Rapid Losses of Surface Elevation following
Tree Girdling and Cutting in Tropical Mangroves. PLoS ONE 9: e107868.
Lovelock, C.E., M.C. Ball, K.C. Martin, I.C. Feller. 2009. Nutrient Enrichment Increases Mortality of Mangroves. PLoS
ONE 4: e5600.
Lovelock, C.E.; B.K. Sorrell; N. Hancock; Q. Hua; A. Swales. 2010. Mangrove Forest and Soil Development on a Rapidly
Accreting Shore in New Zealand. Ecosystems. doi:10.1007/s10021-010-9329-2.
Lugo A.E. 1992. Comparison of Tropical Tree Plantations with Secondary Forests of Similar Age. Ecological
Monographs Ecological Monographs 62: 1–41.
Matsui N., S. Putth, M. Keiyo. 2012. Mangrove Rehabilitation on Highly Eroded Coastal Shorelines at Samut Sakhon,
Thailand. International Journal of Ecology 2012: 11pp.
McLeod E., G. L. Chmura, S. Bouillon, R. Salm, M. Bjork, C. M. Duarte, C. E. Lovelock, W. H. Schlesinger, B. R. Silliman.
2011. A blueprint for blue carbon: toward an improved understanding of the role of vegetated coastal habitats in
sequestering CO2. Frontiers in Ecology and the Environment 9: 552–560.
MINAMBIENTE. 2012. Plan Nacional de Restauración: Recuperación Ecológica, Rehabilitación y Recuperación de
Áreas Disturbadas. 2012. MINAMBIENTE. Santa Fe de Bogotá D.C., Colombia.
MINAMBIENTE. 2015. Plan Nacional de Restauración: Recuperación Ecológica, Rehabilitación y Recuperación de
Áreas Disturbadas. 2015. MINAMBIENTE. Santa Fe de Bogotá D.C., Colombia.
Mitsch W.J., J.G. Gosselink. 2015. Wetlands. 5th Edition. Willey and Sons. Hoboken, New Jersey. 582 pp.
Mukherjee N., W.J. Sutherland, L. Dicks, J. Huge, et al. 2014. Ecosystem Service Valuations of Mangrove Ecosystems
to Inform Decision Making and Future Valuation Exercises. PLoS ONE 9: e107706.
Assessment of mangrove ecosystems in Colombia. | December 2017
26
Pienaar L.V., K.J. Turnbull. 1973. The Chapman-Richards Generalization of Von Bertalanffy’s Growth Model for Basal
Area Growth and Yield in Even-Aged Stands. Forest Science 19: 2-22.
Polania J., L.E. Urrego, C.M. Agudelo. 2015. Recent advances in understanding Colombian mangroves. Acta Oecologica
63: 82-90.
[PTP] Programa de Transformación Productiva. 2014. Estudio para definir y caracterizar la informalidad en 8
sectores seleccionados del Programa de Transformación Productiva: Resumen ejecutivo del sector camaronicultura.
Universidad Sergio Arboleda. https://www.ptp.com.co/
Salas-Leiva S.E., V.M. Mayor-Durán, N. Toro-Perea. 2009. Genetic diversity of black mangrove (Avicennia germinans)
in natural and reforested areas of Salamanca Island Parkway, Colombian Caribbean. Hydrobiologia 620: 17-24.
Salmo S.G., C. Lovelock, N.C. Duke. 2013. Vegetation and Soil Characteristics as Indicators of Restoration Trajectories
in Restored Mangroves. Hydrobiologia 720: 1-18.
Sánchez-Páez H., R. Alvarez-León, O.A. Guevara-Mancera, et al. 1997a. Diagnóstico y zonificación preliminar de los
manglares del Pacífico de Colombia. In: Sánchez-Páez, H. y R. Alvarez- León (eds.) Proy. PD 171/91 Rev. 2 (F) Fase I.
Conservación y Manejo para el Uso Múltiple y el Desarrollo de los Manglares de Colombia. MINAMBIENTE/OIMT.
Santa Fe de Bogotá D.C., Colombia.
Sánchez-Páez H., R. Alvarez-León, F. Pinto-Nolla, et al. 1997b. Diagnóstico y zonificación preliminar de los manglares
del Caribe de Colombia. In: Sánchez-Páez, H. y R. Alvarez-León (eds.) Proy. PD 171/91 Rev. 2 (F) Fase I. Conservación
y Manejo para el Uso Múltiple y el Desarrollo de los Manglares de Colombia. MINAMBIENTE/OIMT. Santa Fe de
Bogotá D.C., Colombia.
Sánchez-Páez H., R. Alvarez-León, O.A. Guevara-Mancera, G.A. Ulloa- Delgado. 2000. Lineamientos estratégicos para
la conservación y uso sostenible de los manglares de Colombia. Proy. PD 171/91 Rev. 2 (F) Fase II (Etapa II).
Conservación y Manejo para el Uso Múltiple y el Desarrollo de los Manglares de Colombia. MINAMBIENTE/OIMT.
Santa Fe de Bogotá D.C., Colombia.
Sathe S.S., R. A. Lavate, L. J. Bhosale. 2013. Mangrove as source of energy for Rural development with special reference
to Ratnagiri and Sindhudarg district (MS) India. Bioscience Discovery 4: 198-201.
Sherman R.E., T.J. Fahey, P. Martinez. 2003. Spatial Patterns of Biomass and Aboveground Net Primary Productivity in a Mangrove Ecosystem in the Dominican Republic. Ecosystems 6: 384-398. Silver W.L., L.M. Kueppers, A.E. Lugo, R. Ostertag, V. Matzek. 2004. Carbon Sequestration and Plant Community
Dynamics Following Reforestation of Tropical Pasture. Ecological Applications 14: 1115–27.
[UNEP] United Nations Environmental Program. 2006. Marine and coastal ecosystems and human wellbeing: a
synthesis report based on the findings of the Millennium Ecosystem Assessment. 76 pp.
Thomas N., R. Lucas, P. Bunting, A. Hardy, A. Rosenqvist, M. Simard. 2017. Distribution and drivers of global
mangrove forest change, 1996-2010. PLoS ONE 12: e0179302.
Urueta S.J., S.C. Garay, G.A. Zamora, S. Galvan-Guevara, V.J. de la Ossa. 2010. Ciénaga de la Caimanera: Manglares y
aves asociadas. Rev. Colombiana Cienc. Anim. 2: 365-372.
Van der Ploeg S., R.S. de Groot. 2010. The TEEB Valuation Database – a searchable database of 1310 estimates of
monetary values of ecosystem services. Foundation for Sustainable Development, Wageningen, The Netherlands.

Assessment of mangrove ecosystems in Colombia. | December 2017
27
Villalba Malaver JC. 2004. Los manglares en el mundo y en Colombia: Estudio descriptivo básico. Sociedad Geográfica
de Colombia. www.sogeocol.edu.co.
ANNEX 1: FUELWOOD NON-RENEWABLE BIOMASS
Non-renewable biomass C (NRB) was calculated using WISDOM [1], fuelwood emissions were calculated from NRB
[2], mangrove shrub area was obtained from crossing mangrove data [3] with forest cover data [4], and the
mangrove biomass C tons were calculated multiplying the mangrove areas by the global mangrove shrub-scrub pool
average of 16.43 tons C ha-1 [2].
State (Departamento) Municipality
A) Non-renewable biomass-C
(tons)
B) Mangrove shrub area
(ha)
C) Mangrove shrub
biomass-C pool (tons)
Mangrove shrub can
satisfy NRB? (i.e. A≤C) y/n
Antioquia Arboletes 143.22 2.29 37.63 n
Antioquia Necoclí 201.39 73.91 1,214.03 y
Antioquia San Juan de Urabá 103.42 7.81 128.24 y
Antioquia Turbo 566.07 738.79 12,135.46 y
Atlántico Barranquilla 15,260.83 9,754.14 160,223.06 y
Atlántico Juan de Acosta 122.27 28.65 470.55 y
Atlántico Luruaco 234.16 20.05 329.43 y
Atlántico Puerto Colombia 503.10 161.71 2,656.19 y
Atlántico Piojó 110.74 83.40 1,369.89 y
Atlántico Tubará 116.30 24.97 410.18 y
Bolívar Cartagena de Indias 4,689.98 2,970.19 48,788.83 y
Bolívar Arjona 292.27 1,522.03 25,001.16 y
Bolívar María la Baja 245.20 0.25 4.15 n
Bolívar Santa Catalina 307.87 193.70 3,181.79 y
Cauca Guapí 0.01 779.77 12,808.63 y
Cauca López de Micay 0.01 681.18 11,189.23 y
Cauca Timbiquí 0.01 548.00 9,001.53 y
Chocó Acandí 70.44 72.57 1,192.00 y
Chocó Bajo Baudó 172.23 2,066.64 33,946.95 y
Chocó Bahía Solano 60.93 126.98 2,085.75 y
Chocó Juradó 35.02 182.53 2,998.26 y
Chocó Nuquí 40.59 236.61 3,886.59 y
Chocó Unguía 89.94 0.07 1.20 n
Córdoba Los Córdobas 0.00 2.67 43.90 n
Córdoba Moñitos 0.01 143.57 2,358.23 y

Assessment of mangrove ecosystems in Colombia. | December 2017
28
Córdoba Puerto Escondido 0.01 5.09 83.64 y
Córdoba San Antero 0.01 598.29 9,827.65 y
Córdoba San Bernardo del Viento 0.01 1,242.58 20,410.79 y
Guajira Manaure 34.64 134.54 2,210.04 y
Guajira Riohacha 139.97 221.42 3,637.04 y
Guajira Uribia 74.70 1,607.26 26,401.14 y
Magdalena Aracataca 206.24 101.93 1,674.33 y
Magdalena Ciénaga 594.51 1,761.58 28,935.96 y
Magdalena Pivijay 208.55 71.01 1,166.34 y
Magdalena Pueblo Viejo 51.26 1,245.16 20,453.17 y
Magdalena Remolino 61.10 2,170.73 35,656.82 y
Magdalena Santa Marta (Dist. Esp.) 1,268.38 33.06 543.01 y
Nariño El Charco 38.91 3,520.51 57,828.46 y
Nariño Francisco Pizarro 23.96 1,232.75 20,249.38 y
Nariño La Tola 14.74 1,178.73 19,361.96 y
Nariño Mosquera 22.57 4,284.63 70,379.99 y
Nariño Olaya Herrera 47.86 2,115.48 34,749.14 y
Nariño Roberto Payán 28.61 2.45 40.20 n
Nariño Santa Bárbara 24.21 3,184.01 52,300.96 y
Nariño Tumaco 270.12 2,681.13 44,040.63 y
San Andrés y Providencia Providencia 81.13 23.65 388.55 y
San Andrés y Providencia San Andrés 961.87 24.08 395.55 y
Sucre San Antonio de Palmito 5.24 19.16 314.67 n
Sucre San Onofre 17.13 2,653.13 43,580.64 y
Sucre Tolú 11.15 1,403.22 23,049.59 y
Valle del Cauca Buenaventura 2,985.85 2,582.08 42,413.60 y
References of Annex 1 [1] Drigo, R. 2014. “Elaboration of the pan-tropical analysis of NRB harvesting (Tier 1 data, version 01 April 2014).”
Produced by the Yale-UNAM GACC Project: Geospatial Analysis and Modeling of Non-Renewable Biomass: WISDOM
and Beyond for Global Alliance for Clean Cookstoves.
[2] Global Emissions and Removals FLR dataset: https://infoflr.org/what-flr/global-emissions-and-removals-
databases.
[3] INVEMAR dataset: http://www.caribbeanmarineatlas.net/maps/6322.
[4] Hansen M.C., P.V. Potapov, R. Moore, M. Hancher, S.A. Turubanova, A. Tyukavina, D. Thau, S.V. Stehman, S.J. Goetz,
T.R. Loveland, A. Kommareddy, A. Egorov, L. Chini, C.O. Justice, J.R.G. Townshend. 2013. High-Resolution Global Maps
of 21st-Century Forest Cover Change. Science 342 (6160): 850-853.
Assessment of mangrove ecosystems in Colombia. | December 2017
29
ANNEX 2: COLOMBIA’S MANGROVE SUSTAINABILITY TARGET
The central Government is working towards meeting the target of developing a comprehensive and sustainable land
use planning and management of Colombia’s mangrove ecosystems by 2025. To accomplish this task, the country
has outlined the following ambitious strategies and programs65:
1. Delineation of mangrove areas and zoning of their land use management in every coastal state.
2. Formulation and implementation of mangrove land use planning for their conservation and sustainable use.
3. Support the creation and management of protected areas in mangrove ecosystems, and collaborate with local
communities to establish new areas under protection.
4. Foster scientific research on mangrove ecosystems to improve decision making related to mangrove land
use and management.
5. Foster interaction with local communities and citizens, for a better general understanding of the importance
of preserving mangrove ecosystems and their sustainable use, and for better mangrove land use planning
that integrates the knowledge and needs of the local communities.
6. Restoration and afforestation of degraded and deforested mangrove areas, identified by local communities,
government entities, research agencies, and other stakeholders.
7. Development of pilot projects that encourage mangrove conservation while benefiting local communities.
8. Update and implementation of regulation and legislation on mangrove use along with adoption of
mechanisms for dissemination.
9. Establishment of an information system that efficiently conveys the information regarding mangroves in a
region, to disseminate knowledge and facilitate mangrove conservation and sustainable use.
10. Strengthening of institutions (e.g. Corporaciones Autonómicas Regionales) with competencies on mangrove
areas, to ensure their capabilities to meet the requirements of a successful mangrove management.
11. Monitorization of nationwide actions on mangrove conservation and sustainable use.
12. Promotion of international collaboration and technical and financial support among Latin American
countries, oriented to the conservation and sustainable use of mangroves.
To the date, there is no specific information available on Colombia’s mangrove restoration area goal, or on the
expected achievement of emissions removal though mangrove restoration.
65 Uso sostenible, manejo y conservación de los Ecosistemas de manglar en Colombia. 2002. MINAMBIENTE. Santa Fe de Bogotá D.C., Colombia.