Assessment of left ventricular outflow tract dynamics ...
5
ECHOCARDIOGRAPHY Assessment of left ventricular outflow tract dynamics during the cardiac cycle by three-dimensional echocardiography Received: 10/26/2011 Accepted: 11/02/2011 Address for reprints: Dr. Mariano L. Falconi Sección Imágenes Cardiovasculares Servicio de Cardiología Instituto de Medicina Cardiovascular Hospital Italiano de Buenos Aires (C1199ABB) Juan D. Perón 4190 Tel. (54 11) 4959-0200 (ext. 8820) ABSTRACT Cardiovascular Imaging Unit and Department of Cardiology, Institute of Cardiovascular Medicine, Hospital Italiano de Buenos Aires MTSAC Full member of the Argentine Society of Cardiology † To apply as full member of the Argentine Society of Cardiology MARIANO FALCONI MTSAC , DIEGO FUNES † , ANÍBAL ARIAS, RODRIGO BAGNATI † , GUILLERMO JAIMOVICH, MAURO GIACOMINI, PABLO OBERTI MTSAC , ARTURO CAGIDE MTSAC Key words > Heart Ventricles - Three-Dimensional Echocardiography – Physiology Background Anatomical and anatomo-functional disorders of the left ventricular outflow tract (LVOT) are subject of numerous studies. However, LVOT normal dynamic behavior, especially in procedures involving its area is also relevant, and may be evaluated with new three-dimensional imaging methods. Objective The aim of this study was to assess LVOT dynamics during the cardiac cycle with three-dimensional transesophageal echocardiography (TEE). Methods Forty two patients referred for transesophageal echocardiography (TEE) were prospectively included. All TEE studies were performed with a three-dimensional transesophageal probe. For full-volume images, 4 gated beats were acquired for off- line analysis. The cardiac cycle was divided in proto-systole (S1), mid-systole (S2) and tele-systole (S3) and proto-diastole (D1), mid-diastole (D2) and tele-diastole (D3). The LVOT area was measured by planimetry of the short axis, through orthogonal sections to the LVOT long axis in each phase. Results Mean age was 67±10 years, and 63% of the patients were male. The LVOT area (cm2) in the different phases of the cardiac cycle was: S1: 4.44±1.02; S2: 4.15±0.91; S3: 3.9±0.89; D1: 3.76±0.98; D2: 3.89±1.04; D3: 4.34±1.11. Maximum area was observed in S1, corresponding to the closed position of the anterior leaflet of the mitral valve (AML) and reduced motion of the interventricular septum (IVS) towards LVOT; minimum area was obtained in D1 consistent with a certain persistence of the IVS in the LVOT and maximal AML opening occupying part of the LVOT. Total area reduction was 15±11% (p<0.0001), changing the LVOT from a partially elliptical or circular shape (systole) to a markedly elliptical or semilunar one (diastole). Conclusion The LVOT modifies its area and shape during the cardiac cycle, depending basically on IVS excursion during systole and mitral valve opening during diastole. REV ARGENT CARDIOL 2012;80. http://dx.doi.org/10.7775/rac.v80.i5.1573 Abbreviations > AAVA Aortic valve area 3D TE EchoThree-dimensional transesophageal echocardiography IVS Interventricular septum MSCT Multislice computed tomography LVOT Left ventricular outflow tract AML Anterior mitral leaflet SEE RELATED ARTICLE: http://dx.doi.org/10.7775/rac.v80.i5.1594
Transcript of Assessment of left ventricular outflow tract dynamics ...
ECHOCARDIOGRAPHY
Assessment of left ventricular outflow tract dynamics during the cardiac cycle by three-dimensional echocardiography
Received: 10/26/2011 Accepted: 11/02/2011
Address for reprints:Dr. Mariano L. FalconiSección Imágenes CardiovascularesServicio de CardiologíaInstituto de Medicina CardiovascularHospital Italiano de Buenos Aires(C1199ABB) Juan D. Perón 4190Tel. (54 11) 4959-0200 (ext. 8820)
ABSTRACT
Cardiovascular Imaging Unit and Department of Cardiology, Institute of Cardiovascular Medicine, Hospital Italiano de Buenos AiresMTSAC Full member of the Argentine Society of Cardiology† To apply as full member of the Argentine Society of Cardiology
MARIANO FALCONIMTSAC, DIEGO FUNES†, ANÍBAL ARIAS, RODRIGO BAGNATI†, GUILLERMO JAIMOVICH, MAURO GIACOMINI, PABLO OBERTIMTSAC, ARTURO CAGIDEMTSAC
Key words > Heart Ventricles - Three-Dimensional Echocardiography – Physiology
BackgroundAnatomical and anatomo-functional disorders of the left ventricular outflow tract (LVOT) are subject of numerous studies. However, LVOT normal dynamic behavior, especially in procedures involving its area is also relevant, and may be evaluated with new three-dimensional imaging methods.
ObjectiveThe aim of this study was to assess LVOT dynamics during the cardiac cycle with three-dimensional transesophageal echocardiography (TEE).
MethodsForty two patients referred for transesophageal echocardiography (TEE) were prospectively included. All TEE studies were performed with a three-dimensional transesophageal probe. For full-volume images, 4 gated beats were acquired for off-line analysis. The cardiac cycle was divided in proto-systole (S1), mid-systole (S2) and tele-systole (S3) and proto-diastole (D1), mid-diastole (D2) and tele-diastole (D3). The LVOT area was measured by planimetry of the short axis, through orthogonal sections to the LVOT long axis in each phase.
ResultsMean age was 67±10 years, and 63% of the patients were male. The LVOT area (cm2) in the different phases of the cardiac cycle was: S1: 4.44±1.02; S2: 4.15±0.91; S3: 3.9±0.89; D1: 3.76±0.98; D2: 3.89±1.04; D3: 4.34±1.11. Maximum area was observed in S1, corresponding to the closed position of the anterior leaflet of the mitral valve (AML) and reduced motion of the interventricular septum (IVS) towards LVOT; minimum area was obtained in D1 consistent with a certain persistence of the IVS in the LVOT and maximal AML opening occupying part of the LVOT. Total area reduction was 15±11% (p<0.0001), changing the LVOT from a partially elliptical or circular shape (systole) to a markedly elliptical or semilunar one (diastole).
ConclusionThe LVOT modifies its area and shape during the cardiac cycle, depending basically on IVS excursion during systole and mitral valve opening during diastole.
REV ARGENT CARDIOL 2012;80. http://dx.doi.org/10.7775/rac.v80.i5.1573
Abbreviations > AAVA Aortic valve area
3D TE Echo Three-dimensional transesophageal
echocardiography
IVS Interventricular septum
MSCT Multislice computed tomography
LVOT Left ventricular outflow tract
AML Anterior mitral leaflet
SEE RELATED ARTICLE: http://dx.doi.org/10.7775/rac.v80.i5.1594
REVISTA ARGENTINA DE CARDIOLOGÍA / VOL 80 Nº 5 / SEPTEMBER-OCTOBER 20122
BACKGROUND The left ventricular outflow tract (LVOT) is a structure mainly limited by the interventricular septum and the anterior mitral valve leaflet, where the systolic flow is directed prior to its outflow through the aortic valve. Both LVOT limits are very mobile (especially the anterior leaflet of the mitral valve) and thus it is expected that the LVOT changes both its dimensions and shape during the cardiac cycle.
The LVOT is frequently involved in anatomical and anatomo-functional disorders (anterior systolic septal motion, sub-aortic membranes). However, its normal dynamic behavior is also relevant, especially in procedures involving its area, as percutaneous aortic valve prosthesis grafting where, depending on the model, a variable portion of the prosthetic structure lies in the LVOT. The purpose of this study was to evaluate the changes in LVOT total area and shape during the cardiac cycle by three-dimensional transesophageal echocardiography.
METHODS Forty-two patients, > 18 years of age and with normal sinus rhythm at the time of the study, referred for transesopha-geal echocardiography, were prospectively included between June 2010 and March 2011. Patients with structural or func-tional disorders that could affect LVOT dynamics, as history of percutaneous aortic valve grafting, cardiac surgery with pericardial opening, aortic or mitral valve replacement, alco-hol septal ablation, myocardial infarction with anterior sep-tal involvement, left bundle branch block, anterior systolic mitral motion, mitral stenosis, ventricular dysfunction (ejec-tion fraction < 50%, and frequent ventricular or supraven-tricular arrhythmia were excluded from the study.
Multiplanar transesophageal echocardiography was performed using a Philips IE 33 echocardiography system (Philips Ultrasound, Bothell WA, USA) and a transesopha-geal X7-2t probe that enabled conventional and three-di-mensional acquisitions (in real time, real time zoom, com-plete volume and orthogonal planes). LVOT analysis was made employing “full-volume images” for off-line analysis.
Studies were performed under topical lidocaine spray and gel anesthesia in the left lateral decubitus position, after fasting for at least 6 hours. Patients were connected to elec-trocardiographic monitoring continuous to the echocardiog-raphy equipment to acquire gated images. A conventional multiplanar echocardiography was performed and necessary three-dimensional images were obtained to assess the un-derlying pathology. Then, three series of three-dimensional full-volume images oriented to the center of the LVOT were acquired during suspended breathing. Each series was ob-tained by acquisition of 4 cardiac cycles for off-line full-vol-ume reconstruction. In the event of an alteration of normal sinus rhythm (generally, an isolated extrasystole), this series was rejected and a new one was acquired, until three series were obtained without gating faults. Image parameters were adjusted to obtain a sampling rate of 15-20 frames/second.
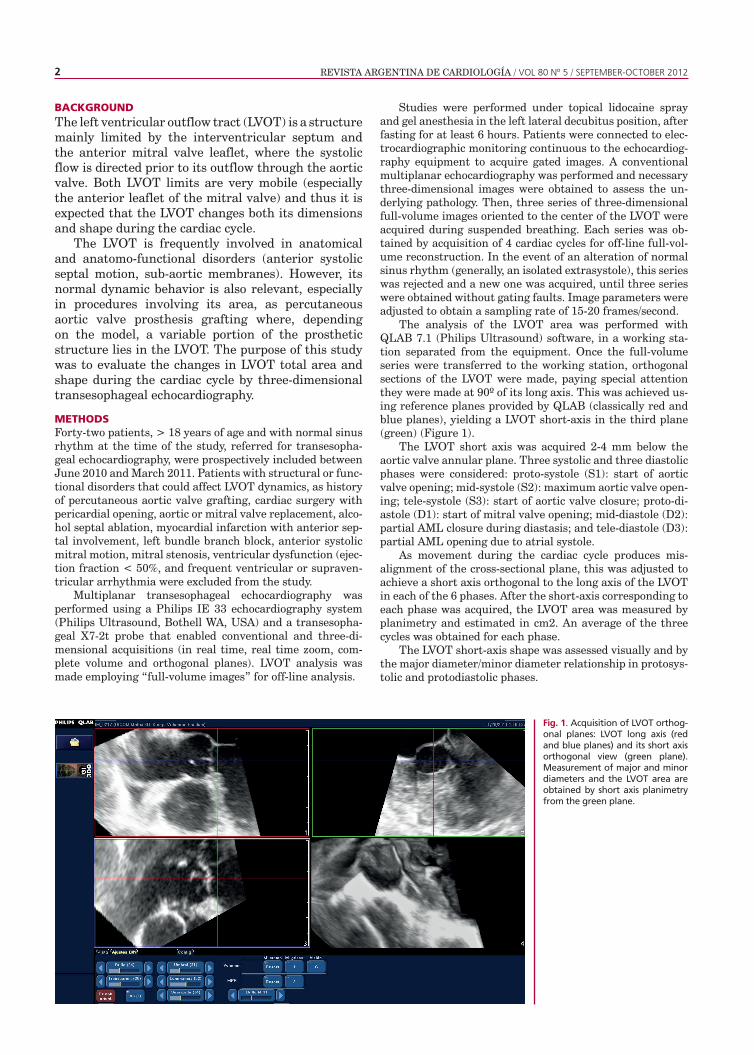
The analysis of the LVOT area was performed with QLAB 7.1 (Philips Ultrasound) software, in a working sta-tion separated from the equipment. Once the full-volume series were transferred to the working station, orthogonal sections of the LVOT were made, paying special attention they were made at 90º of its long axis. This was achieved us-ing reference planes provided by QLAB (classically red and blue planes), yielding a LVOT short-axis in the third plane (green) (Figure 1).
The LVOT short axis was acquired 2-4 mm below the aortic valve annular plane. Three systolic and three diastolic phases were considered: proto-systole (S1): start of aortic valve opening; mid-systole (S2): maximum aortic valve open-ing; tele-systole (S3): start of aortic valve closure; proto-di-astole (D1): start of mitral valve opening; mid-diastole (D2): partial AML closure during diastasis; and tele-diastole (D3): partial AML opening due to atrial systole.
As movement during the cardiac cycle produces mis-alignment of the cross-sectional plane, this was adjusted to achieve a short axis orthogonal to the long axis of the LVOT in each of the 6 phases. After the short-axis corresponding to each phase was acquired, the LVOT area was measured by planimetry and estimated in cm2. An average of the three cycles was obtained for each phase.
The LVOT short-axis shape was assessed visually and by the major diameter/minor diameter relationship in protosys-tolic and protodiastolic phases.
Fig. 1. Acquisition of LVOT orthog-onal planes: LVOT long axis (red and blue planes) and its short axis orthogonal view (green plane). Measurement of major and minor diameters and the LVOT area are obtained by short axis planimetry from the green plane.
LEFT VENTRICULAR ASSESMENT WITH THREE-DIMENSIONAL ECHOCARDIOGRAPHY / Mariano Falconi et col. 3
Values were expressed as mean ± standard deviation, median and ranges.
Maximum and minimum areas were compared, and in the same phases, major and minor LVOT diameters were measured. Comparison between areas and between diame-ters was performed using the non parametric Wilcoxon rank sum test for paired or dependent data, as these numerical variables did not comply with all the normal distribution as-sumptions.
The percent difference between maximum and mini-mum areas for each patient was used to assess percent area variation. The same procedure was adopted with major and minor diameters to assess percent diameter variation. The comparison of percent area and diameter variation was test-ed against the null hypothesis (variation = 0%) using the non-parametric Wilcoxon test.
RESULTSMean age was 67 ±10 years. Patients were referred for investigation of embolic source (37%), assessment of valvulopathy (37%), suspicion of endocarditis (21%) or interatrial communication (5%). The remaining characteristics are detailed in Table 1.
Planimetric LVOT measurement was possible in 100% of cases. The LVOT shape and area were modified during the cardiac cycle (Figure 2). The largest LVOT area was observed during proto-systole, coincident with the scarce septal excursion towards the cavity and AML in the closed position. As systole progresses the septum protrudes towards the cavity and the LVOT area decreases. The smallest LVOT area was observed during proto-diastole, coincident with a certain septal persistence towards the cavity and AML opening. Then, with the displacement of the anterior leaflet to a partially closed (in mid-diastole) or partially opened (in tele-diastole) position, the area increases again reaching its maximum in the next proto-systole. The total LVOT area variation was statistically significant (15% ± 11%; p < 0.0001). Similarly, the difference between proto-systolic and proto-diastolic areas was also significant (p < 0.0001) (Table 2, Figure 3).
Shape tended to be partially elliptical or circular in systolic phases and markedly elliptical or semilunar in diastolic phases, the latter mainly due to AML morphological and positional modifications in the LVOT: concave towards the LVOT in systolic phases
and flat or convex in diastolic phases (see Figure 2).The major diameter in proto-systole was 2.46 ±
0.22 cm (median 2.38 cm) and the minor diameter 2.20 ± 0.25 cm (median 2.18 cm). The average proto-systolic major diameter / minor diameter relationship was 1.12 (a relationship = 1 indicates circular LVOT): Fifty percent of the patients had a major diameter / minor diameter relationship below 1.1, compatible with a predominantly circular shape (coincident with the visual estimation). The rest of the patients presented a partially elliptical shape with a maximum major diameter / minor diameter relationship of 1.34 in this phase.
The major diameter in proto-diastole was 2.46 ± 0.26 cm (median 2.40 cm) and the minor diameter 1.74 ± 0.28 cm (median 1.74 cm) with an average major diameter / minor diameter relationship of 1.44. Only one patient had a relationship below 1.1 (compatible with a circular shape); the rest of the patients presented elliptical or semilunar shapes according to the AML degree of protrusion during diastole (the maximum major diameter / minor diameter relationship was 2.29).
The greatest LVOT variation was due to modification of the minor diameter, mainly due to AML motion, with a difference between proto-systole and proto-diastole of 0.46 ± 0.19 cm, median 0.42 cm and p < 0.0001, and percent reduction of 21 ± 9%, median 19% and p < 0.0001. On the other hand, the major diameter evidenced a scarce non- significant variation (0 ± 0.14 cm, median -0.03 cm and p = 0.99), with a percent reduction of 0 ± 6%; median 1.3% and p = 0.76.
These findings indicate that the main contribution to LVOT area and shape variations is at the expense of the minor axis and seems to be more dependent on the mitral component (anterior leaflet) than on the interventricular septum.
DISCUSSIONCurrently, LVOT area is estimated with two-dimensional imaging techniques, using the expression π × (D/2)2, where D is LVOT diameter measured in the mid-systolic long axis. (1) The introduction of new techniques for the treatment of valvulopathies, as percutaneous aortic valve replacement, demands detailed reports of LVOT and aortic root anatomy.
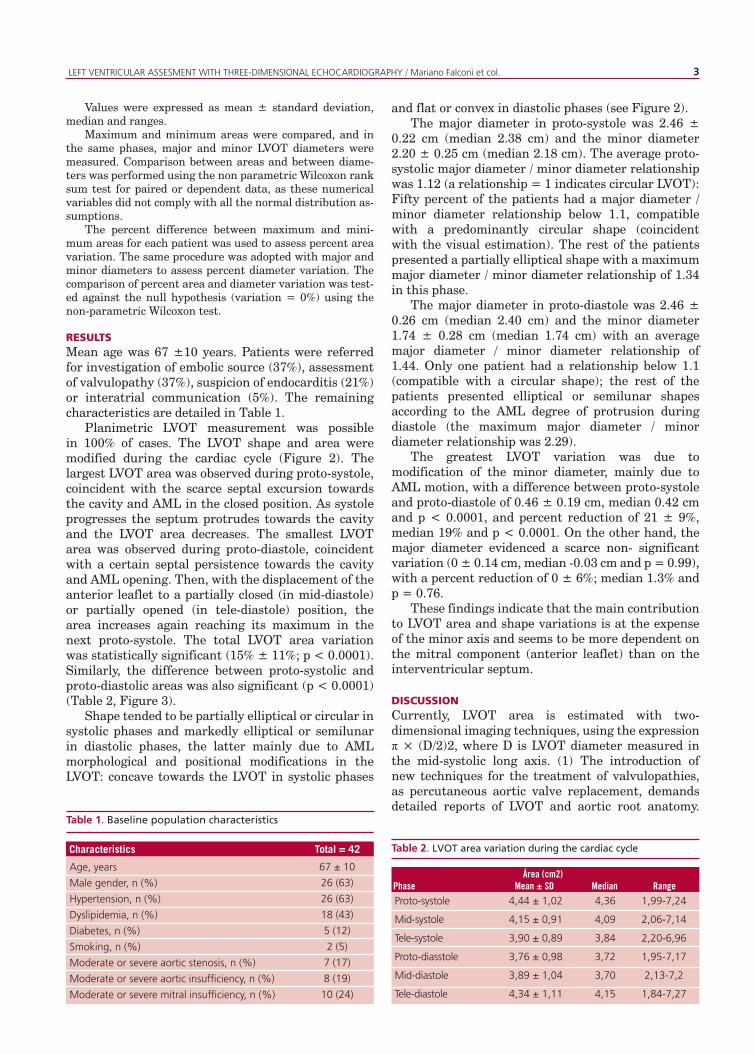
Table 1. Baseline population characteristics
Characteristics Total = 42
67 ± 10
26 (63)
26 (63)
18 (43)
5 (12)
2 (5)
7 (17)
8 (19)
10 (24)
Age, years
Male gender, n (%)
Hypertension, n (%)
Dyslipidemia, n (%)
Diabetes, n (%)
Smoking, n (%)
Moderate or severe aortic stenosis, n (%)
Moderate or severe aortic insufficiency, n (%)
Moderate or severe mitral insufficiency, n (%)
Proto-systole
Mid-systole
Tele-systole
Proto-diasstole
Mid-diastole
Tele-diastole
1,99-7,24
2,06-7,14
2,20-6,96
1,95-7,17
2,13-7,2
1,84-7,27
4,36
4,09
3,84
3,72
3,70
4,15
4,44 ± 1,02
4,15 ± 0,91
3,90 ± 0,89
3,76 ± 0,98
3,89 ± 1,04
4,34 ± 1,11
Área (cm2)Phase Mean ± SD Median Range
Table 2. LVOT area variation during the cardiac cycle

REVISTA ARGENTINA DE CARDIOLOGÍA / VOL 80 Nº 5 / SEPTEMBER-OCTOBER 20124
Fig. 2. LVOT planimetry in the dif-ferent phases of the cardiac cycle (S1: proto-systole, S2: mid-systole, S3: tele-systole, D1: proto-diastole, D2: mid-diastole, D3: tele-diastole). In this case, a modification in the area and shape can be seen (par-tially elliptical in systolic phases, semilunar in diastolic phases).
New three-dimensional imaging methods show that the normal LVOT anatomy is not circular in every case, as assumed with two-dimensional methods.
We may add that the two-dimensional section does not always go through the LVOT central axis, resulting in another source of potential error. (2)
Several studies have confirmed that the LVOT anatomy is more elliptical than circular, with a significant decrease of the LVOT area compared with that measured by planimetry. (3-6) This difference entails underestimation of the LVOT major and minor diameters, which are essential for the correct choice of percutaneous prosthesis, and increase of perivalvular leak risk and prosthesis migration, among other complications. (7)
In this study, we could verify the predominantly elliptical LVOT shape. We have also shown for the first time that this anatomical region changes substantially in shape and size during the cardiac cycle. Tops et al. assessed major and minor diameter modifications with multislice computed tomography (MSCT), verifying elliptical LVOT shapes. They also assessed diameter changes during tele-systole
and tele-diastole using a simple oblique sagital view, which normally corresponds to the left parasternal long axis view (minor axis), and found no significant differences. (8) One of the deficiencies of this method is the low temporal resolution compared with 3D TE echo, with a frame rate not greater than 10-12 frames per second.
Although there is no reference method to evaluate the aortic root geometry, MSCT is generally used to assess the accuracy of 3D TE echo measurements. Otani et al, have demonstrated the good correlation between these two methods to assess the LVOT planimetric area (r = 0.96, mean difference: 0.35 ± 0.29 cm2). (5)
This method would also allow a modification of the continuity equation normally used to calculate AVA. There is general agreement that AVA measurement using the continuity equation overestimates the severity of aortic stenosis, (9-11) in part because the area is calculated and not measured directly, underestimating the component of the equation numerator. Using the planimetric LVOT area measurement, Burgstahler et al employed magnetic resonance to assess LVOT area by planimetry and AVA in normal and with moderate to severe stenosis populations. Results showed that using the modified continuity equation, the planimetric LVOT area gave the best correlation with the planimetric AVA measured by magnetic resonance. (4)
In medical databases, no studies are aimed to assess LVOT area modifications during the cardiac cycle. The present finding draws the attention on the interaction of new devices for percutaneous valve replacement. This is particularly important in our setting, where the only approved device relies mostly on the LVOT shape, whose modification during the cardiac cycle may influence its performance.
LimitationsOne of the limitations of this study is the absence of a gold standard to measure LVOT area. Even though the correlation with MSCT is very good, the method has not been completely validated. Moreover, included patients were not consecutive, and the number of
Fig. 3. LVOT area in the different phases of the cardiac cycle (S1 vs. D1: p < 0.0001). This box plot shows minimum measured values, lower quartile, median, upper quartile and maximum measured values, as well as outliers.

LEFT VENTRICULAR ASSESMENT WITH THREE-DIMENSIONAL ECHOCARDIOGRAPHY / Mariano Falconi et col. 5
REFERENCES
1. Baumgartner H, Hung J, Bermejo J, Chambers JB, Evangelista A, Griffin BP, et al; American Society of Echocardiography; European Association of Echocardiography. Echocardiographic assessment of valve stenosis: EAE/ASE recommendations for clinical practice. J Am Soc Echocardiogr 2009;22:1-23. http://dx.doi.org/10.1016/j.echo.2008.11.029 2. Piazza N, de Jaegere P, Schultz C, Becker AE, Serruys PW, Anderson RH. Anatomy of the aortic valvar complex and its implications for transcatheter implantation of the aortic valve. Circ Cardiovasc Interv 2008;1:74-81. http://dx.doi.org/10.1161/CIRCINTERVENTIONS.108.7808583. Doddamani S, Bello R, Friedman MA, Banerjee A, Bowers JH Jr, Kim B, et al. Demonstration of left ventricular outflow tract eccentricity by real time 3D echocardiography: implications for the determination of aortic valve area. Echocardiography 2007;24:860-6. http://dx.doi.org/10.1111/j.1540-8175.2007.00479.x4. Burgstahler C, Kunze M, Löffler C, Gawaz MP, Hombach V, Merkle N. Assessment of left ventricular outflow tract geometry in non-stenotic and stenotic aortic valves by cardiovascular magnetic resonance. J Cardiovasc Magn Reson 2006;8:825-9.5. Otani K, Takeuchi M, Kaku K, Sugeng L, Yoshitani H, Haruki N, et al. Assessment of the aortic root using real-time 3D transesophageal echocardiography. Circ J 2010;74:2649-57. http://dx.doi.org/10.1253/circj.CJ-10-05406. Doddamani S, Grushko MJ, Makaryus AN, Jain VR, Bello R, Friedman MA, et al. Demonstration of left ventricular outflow tract eccentricity by 64-slice multi-detector CT. Int J Cardiovasc Imaging 2009;25:175-81. http://dx.doi.org/10.1007/s10554-008-9362-97. Delgado V, Bax JJ. Classical methods to measure aortic valve area in the era of new invasive therapies: still accurate enough? Int J Cardiovasc Imaging 2009;25:183-5. http://dx.doi.org/10.1007/s10554-008-9365-68. Tops LF, Wood DA, Delgado V, Schuijf JD, Mayo JR, Pasupati S, et al. Noninvasive evaluation of the aortic root with multislice computed tomography implications for transcatheter aortic valve replacement. JACC Cardiovasc Imaging 2008;1:321-30. http://dx.doi.org/10.1016/j.jcmg.2007.12.0069. Garcia D, Dumesnil JG, Durand LG, Kadem L, Pibarot P. Discrepancies between catheter and Doppler estimates of valve effective orifice area can be predicted from the pressure recovery phenomenon: practical implications with regard to quantification of aortic stenosis severity. J Am Coll Cardiol 2003;41:435-42. http://dx.doi.org/10.1016/S0735-1097(02)02764-X10. Wippermann CF, Schranz D, Stopfkuchen H, Huth R, Freund M, Jüngst BK. Evaluation of the valve area underestimation by the continuity equation. Cardiology 1992;80:276-82. http://dx.doi.org/10.1159/00017501311. Oh JK, Taliercio CP, Holmes DR Jr, Reeder GS, Bailey KR, Seward JB, et al. Prediction of the severity of aortic stenosis by Doppler aortic valve area determination: prospective Doppler-catheterization correlation in 100 patients. J Am Coll Cardiol 1988;11:1227-34. http://dx.doi.org/10.1016/0735-1097(88)90286-0
Conflict of interestsNone declared.
RESUMEN
Dinámica del tracto de salida del ventrículo izquierdo durante el ciclo cardíaco evaluada con ecocardiografía tridimensional
IntroducciónEl tracto de salida del ventrículo izquierdo (TSVI) suele es-tar implicado con relativa frecuencia en alteraciones ana-tómicas y anatomofuncionales, que son objeto de estudios. Sin embargo, su dinámica normal también es importante, en particular en procedimientos que involucran su área, y los nuevos métodos de imágenes tridimensionales permiten evaluarla.
ObjetivoEvaluar la dinámica del TSVI durante el ciclo cardíaco por ecocardiografía tridimensional transesofágica (eco 3D TE).
Material y métodosSe incluyeron en forma prospectiva 42 pacientes derivados para ecocardiografía transesofágica. Los estudios se realiza-ron con sonda transesofágica tridimensional, con adquisicio-nes de volumen completo integradas por 4 latidos gatillados para análisis off-line. El ciclo cardíaco se dividió en proto-sístole (S1), mesosístole (S2) y telesístole (S3) y en proto-diástole (D1), mesodiástole (D2) y telediástole (D3). El área del TSVI se estimó por planimetría del eje corto por cortes ortogonales al eje mayor del TSVI en cada fase.
ResultadosLa edad media fue de 67 ± 10 años; el 63% eran hombres. El área del TSVI (cm2) en las diferentes fases del ciclo cardíaco fue: S1: 4,44 ± 1,02; S2: 4,15 ± 0,91; S3: 3,9 ± 0,89; D1: 3,76 ± 0,98; D2: 3,89 ± 1,04; D3: 4,34 ± 1,11. El área máxima se observó en S1, correspondiendo a la aposición de cierre de la valva anterior mitral (VaM) y escasa excursión del septum interventricular (SIV) hacia el TSVI; el área mínima se ob-servó en D1 coincidiendo con cierta persistencia del SIV en el TSVI y la apertura máxima de la VaM ocupando parte del TSVI. La modificación total del área fue del 15% ± 11% (p < 0,0001), cambiando además de forma parcialmente elípti-ca o circular (sístole) a marcadamente elíptica o semilunar (diástole).
ConclusiónEl TSVI presenta una variación en su área y su forma du-rante el ciclo cardíaco, con dependencia fundamentalmente
patients with moderate and/or severe aortic stenosis was insufficient to compare with the total cohort. Neither was MSCT performed to compare with 3D TE echo. Patients with structural cardiomyopathies that modify LVOT dynamics were excluded, precluding the extrapolation of results to these populations.
CONCLUSIONSThe LVOT area and shape is modified during the cardiac cycle, mostly at the expense of the minor axis due to AML motion and less to IVS excursion. 3D TE echo becomes a reliable alternative to assess LVOT anatomy and geometry.
del movimiento del SIV (en sístole) y de la apertura mitral (en diástole).
Palabras clave > Ventrículos cardíacos – Ecocardiografía tridimensional – Fisiología