Assessment of In SituBiodegradation Probing (SIP) · Assessment of In SituBiodegradation ... (SIP)...
35
Transcript of Assessment of In SituBiodegradation Probing (SIP) · Assessment of In SituBiodegradation ... (SIP)...


Assessment of In Situ Biodegradation Potential of Benzene Using Stable Isotope
Probing (SIP)J.L. Busch-Harris, K.L. Sublette, Eleanor Jennings
and Ken Roberts Center for Applied Biogeosciences
University of Tulsa D.C. White and Aaron PeacockCenter for Biomarker Analysis
University of Tennessee Greg Davis -cba
Microbial Insights, Inc. William E. Holmes
School of Natural Resources University of Michigan
Ravi Kolhatkar and Xiaomin Yang Atlantic Richfield (a BP affiliated company)

A New Tool: Bio-Sep Bio-traps
• Demonstrate biodegradation of benzene and other hydrocarbons by indigenous microbes in – Aquifers
– Surface waters
– Sediments
– Soil • Characterize the microbial ecology of
benzene biodegradation

Bio-Sep Beads
• 3-4 mm in diameter • 25 % Nomex, 75% PAC • 74% porosity • 600 m2 of surface area/g• Surrounded by ultrafiltration-like membrane
with 1-10 micron holes • Autoclavable• Cleaned of fossil biomarkers by heating to
300 oC

SEM of Bio-Sep Beads
Surface
Interior

Biofilms Form Rapidly in Bio-Sep Beads
• High surface area
• Low shear • Concentration of
nutrients by PAC • Rapid formation of pre
conditioning films
Live-dead stain of biofilm in Bio-Sep bead

What Do Bio-Sep Beads Collect?
• Bacteria have to enter the bead and growthere to be detected
• Slow-growing, non-growing, or dormant organisms are less likely to be collected in thebeads unless the beads offer them a significant advantage
• Organisms collected in the beads are more likely to be the more active members of thesampled community

A Simple Example
Groundwater Beads
Blue = inactive
Red = active

Total Branched Fatty Acids 6
5
4
3
2
1
0
Large O2 Infusion
Groundwater
Bio-Sep Bio-trapsPerc
ent o
f Tot
al P
LFA
0 20 40 60 80 100 120 140 160 180 200 220 240 260 Time Since Initiation of Sulfate Injection

Applications Bio-Sep Bead Samplers• Drinking water systems
– Measurable biofilms in 24 hrs – Detecting leaks in distribution
lines– Pathogen tracking– Trouble shooting
• 70-m deep storage tank on offshore platform – Microbial ecology with depth – SRB and sulfide-oxidizers
• Aqueous phase of a solvent extraction system (pH < 2) – Cause of biological fouling
• Contaminated aquifers – PCE – Hydrocarbons – MTBE
• Stream monitoring – Source tracking for coliforms

Hydrocarbon Biodegradation Assessment Using In Situ Microcosms
Bio-Sep Bio-trap
1. Load with hydrocarbon (13C-labeled and/or non-labeled)
2. Expose under in situ conditions for 4-5 weeks
3. Analyze biomass, search biomarkers for the 13C-labeling

Vapor Phase Loading of Hydrocarbon
Dry Bio-Sep beads
vacuum
valve
vacuum
p ~ 60mbar valve closed
pump
open
pump
hydrocarbon

Does Benzene Leach From the Beads?
Leaching experiment:
• 25-mL VOA vials with 50 Bio-Sep beads in each, set up in triplicate
• 10 mM sodium azide to prevent microbial growth
• Solution replaced after each sampling to avoid vapor space
• Samples analyzed quantitatively by GC-MS

Benzene Leaching in Sterile WaterAvg. benzene
Incubation concentration in time leachate (mg/L) Day 0 9.93E-04 Day 1 9.70E-04 Day 2 9.76E-04 Day 3 9.82E-04 Day 4 9.78E-04 Day 5 9.75E-04 Day 6 9.74E-04 Day 7 9.74E-04 Day 8 BDL Day 9 9.74E-04 Day 10 9.74E-04 Day 11 9.74E-04 Day 12 9.75E-04 Day 13 BDL Day 14 BDL Day 15 9.78E-04
Incubation Benzene extracted time from beads (mg/bead ±
std. dev) N=3 t0 1.05 ± 0.04 Day 15 0.99 ± 0.02
Day 30 0.97 ± 0.03
Benzene does not easily leach from the beads!

TGA analysis of benzene-loaded Bio-Sep beads
TGA Analysis of Benzene-loaded Bio-Sep Beads
0.8400
0.8600
0.8800
0.9000
0.9200
0.9400
0.9600
0.9800
1.0000
1.0200
Nor
mal
ized
Wei
ght
Without Benzene With Benzene
0 50 100 150 200 250 300 350 400 450
Temperature (C)

Biomarker of Choice: PLFA
Lipids with 13C incorporated into the phospholipid bilayer indicate utilization of the 13C-labeled compound and incorporation into biomass

Two Case Studies
• BTEX impacted aquifer in Germany
• LUST site in southern California

Germany
5660800 0 100
Saf Zz 32/02
200 300 400m 750 700 [Benzene] up to 850 mg/L650 600 550 500
5660700
5660600 450 400 350 Aquifer is virtually3005660500 free of dissolved250 200 oxygen 150
5660400 100 50 0
4514300 4514400 4514500 4514600 4514700 4514800
groundwater flow
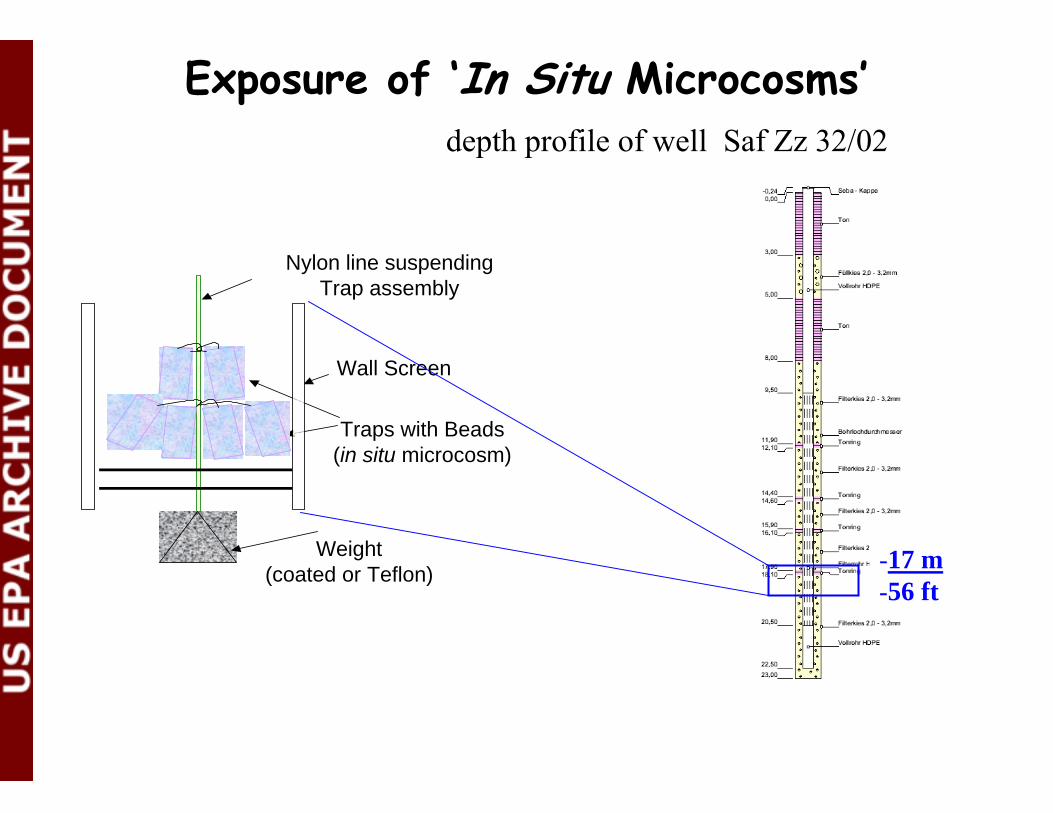
depth profile of well Saf Zz 32/02
Wall Screen
Traps with Beads (in situ microcosm)
Weight(coated or Teflon)
Nylon line suspending Trap assembly
-17 m-56 ft
Exposure of ‘In Situ Microcosms’

Analysis of Microcosm BTEX Loading After 4 Weeks In situ Exposure
13C abundance Residual Loss (%) At% hydrocarbon (mg/trap)
natural benzene 0.1 7.9 ± 0.1 82 13C6-benzene 98.0 7.9 ± 0.1 82 natural toluene 0.1 8.0 ± 0.7 85 13C1-toluene 14.0 8.9 ± 0.7 84 blank 0.1 0.23 benzene N/A
¾ isotopic composition of contaminants unchanged • no significant exchange with aquifer • no crosstalk between traps
¾ 80 % decrease in contaminant concentration(biodegradation)

Analysis of Microcosm Biomass After In Situ Exposure
rela
tive
abun
danc
e (c
ps) 1200000
1100000
1000000
900000
800000
700000
600000
500000
400000
300000
200000
100000
6.00 12.0014.0016.0018.0020.0022.0024.0026.0028.0030.00
21:0 (int. Std.)
citric acid
14:0
i-15:0
a-15:0 15:0
16:1ω7c
i-16:0
16:0 18:1ω9c
phtalate 18:1ω7c
18:0 10me 18:010me
16:0
8.00 10.00
retention time (min)
Total lipid fatty acids profile from 13C-toluene loaded microcosm or bio-
trap

Analysis of Microcosm Biomass After
rela
tive
abun
danc
e (c
ps)
In Situ Exposure
Toluene 13C label detected in
1200000
1100000
1000000
900000
800000
700000
600000
500000
400000
300000
200000
100000
6.00 12.0014.0016.0018.0020.0022.0024.0026.0028.0030.00
21:0 (int. std.)
7556 ‰
acid? 805 ‰ 14:0
60.3 ‰ i-15:0
15.5 ‰ a-15:0 7946 ‰
15:0
13355 ‰ 16:1ω7c
i-16:0
6283 ‰ 16:0
16.0 ‰ 18:1ω9c
phtalate 9684 ‰ 18:1ω7c
92.9 ‰ 18:0
10me 18:010me 16:0
total lipid fatty acids
8.00 10.00
- 29.6 ‰
citric - 24.1 ‰
retention time (min)
Stabile isotope analysis proves toluene biodegradation and growth of microbial biomass
under in situ conditions

8.51 13.83
18.91
21.34
29.92
Analysis of Microcosm Biomass After In Situ Exposure
Total lipid fatty acids profile from13C benzene loaded bio-trap
200000
400000
600000
800000
1000000
1200000
1400000
1600000
23.59
-24.6 ‰ 12:0
21:0 (int. Std.)
14:0
16:1ω9c
16:0 18:1ω9c
18:0
phtalate
rela
tive
abun
danc
e (c
ps) - 28.8 ‰
6.00 8.00 10.0012.0014.0016.0018.0020.0022.0024.0026.0028.00
retention time (min)

8.51 13.83
18.91
21.34
29.92
Analyze Microcosms Biomass After In Situ Exposure
Benzene 13C label detected in total lipid fatty acids
200000
400000
600000
800000
1000000
1200000
1400000
1600000
23.59
-24.6 ‰ 12:0
21:0 (int. std.)
46 ‰ 14:0
13414 ‰ 16:1ω7c
998 ‰ 16:0
191 ‰ 18:1ω9c
264 ‰ 18:0
phtalate
rela
tive
abun
danc
e (c
ps) - 28.8 ‰
6.00 8.00 10.0012.0014.0016.0018.0020.0022.0024.0026.0028.00
retention time (min)
Stabile isotope analysis proves benzene biodegradation and growth of microbial biomass
under in situ conditions

Polar Lipid Fatty Acid (PLFA) Profiles of Viable Microorganisms Enriched in Bio-traps
31.38
550000
500000
32.05
450000toluene 400000
350000baited 300000
250000
200000
150000
37.29
100000same PLFAs, 37.14 31.4950000 39.48
30.32 35.02
24.00 26.00 28.00 30.00 32.00 34.00 36.00 38.00different TIC: ZEITZ_1B.D
900000abundance 850000
800000 14:0 16:1ω7c 16:0 18:1ω9c 18:1ω7c 18:0 fatty acid750000
70000037.13
650000
600000
550000
500000
450000
400000
350000
benzene 31.37
300000
250000
baited 32.06200000
150000
100000
37.29
50000 26.08 37.94
24.00 26.00 28.00 30.00 32.00 34.00 36.00 38.00
Time >

Yucaipa, CA
• Site of gasoline LUST• Is there intrinsic bioremediation of benzene at this
site? • Will nitrate stimulate the intrinsic bioremediation of
benzene? • Bio-Sep in situ microcosms (non-baited and nitrate
baited), both with 13C-benzene, installed in triplicateinto MW20 suspended 30 cm below water table withfloat; incubated for 45 days
• Specific activity of 13C-benzene only about 8%

Geochemistry of MW20 and Unimpacted Background Well
Parameter Background well MW20
Benzene ND 6.6 µg/L
TEX ND ND
MTBE ND 1.2 µg/L
pH 7.4 7.5
Nitrate-N 9.4 mg/L 8.6 mg/L
Sulfate 23 mg/L 19 mg/L
Alkalinity 140 mg/L 130 mg/L
TDS 280 mg/L 250 mg/L

Bio-Sep® Tube-in-Tube Nitrate-baited Sampler
Nitrate-baited
beads
Standard Bio-Sep® beads
PFA tubing
Nylon spacer

SEM of Nitrate-baited Bio-Sep Beads
Surface
KNO3 crystals
Interior

Relative Abundances of Phospholipid Fatty Acids Structural Groups and Key Fatty Acids in Non-baited and Nitrate-baited Bio-traps
Phospholipid structural group or fatty acid
Non-baited Bio-traps*
Nitrate-baited Bio-traps*
Terminally branched
1.33 ± 1.12 2.00 ± 0.17
Monoenoics 72.2 ± 2.8 73.9 ± 1.1 Branched Monos 0.1 ± 0.17 0.4 ± 0 Mid-branched Sats 0.6 ± 0.17 0.6 ± 0.17 n-Sats 23.0 ± 1.89 21.5 ± 0.45 16:1ω7c 32.0 ± 3.5 35.5 ± 1.9 16:0 20.5 ± 2.1 19.7 ± 0.70 18:1ω7c 22.3 ± 4.0 24.7 ± 2.5 18:1ω9c 9.7 ± 3.1 5.9 ± 3.6 cy19:0 2.0 ± 0.55 2.0 ± 0.15
*Mean ± std.dev. (n=3)

δ13C Values of Individual Fatty Acids Derived from Phospholipids From the Non-
baited and Nitrate-baited Bio-traps.
Phospholipid fatty acid
Non-baited Bio-traps
Nitrate-baited Bio-traps
16:1ω7c +5699 ± 161* +6095 (n=2)*** 16:0 +5342 ± 240 +5762 (n=2) 18:1ω7c +3514 ± 756 +4037 ± 251 18:1ω9c +754 (n=1)** +1137 (n=1) cy19:0 +1055 (n=1)
The δ 13C of natural benzene is about -26 o/oo. Values more positive reflect increasing enrichment with 13C. * Mean ± std. dev. (n=3) **One observation *** Avg. of two observations

12 %
13C
-ben
zene
13C-benzene Enrichment in Yucaipa Bio-traps
11
10
9
8
7 Mean Mean±SE Mean±SD Outliers 6
Pre-deployment Post-incubation Nitrate Extremes Post-incubation Controls

Yucaipa Conclusions
• Bacteria indigenous to the aquifer at Yucaipa are capable of biodegradation of benzeneunder aquifer conditions.
• No evidence that nitrate stimulated benzene biodegradation or had a significant effect onthe subsurface microbial community structure.
• Incorporation of 13C-benzene into PLFA was easily detected with low specific activity inloaded beads

What’s Next?
• Deployment of in situ microcosms in sediments and soil
• 13C-fuel oxygenates
• 13C incorporation into DNA – from labeled 16S rDNA we can potentially identify degraders

Acknowledgement
This work was funded by
the Integrated Petroleum Environmental Consortium (IPEC)
and Atlantic Richfield, a BP affiliated company


![The Spawn of Fashan [RPG] by K.L. Davis](https://static.fdocuments.in/doc/165x107/577cce631a28ab9e788dede7/the-spawn-of-fashan-rpg-by-kl-davis.jpg)