Proton Exchange Membrane Electrolyzer Emulator for Power ...
Upload
duongthienCategory
view
216download
1
1
ASSESSMENT OF HYDROGEN-FUELED PROTON EXCHANGEMEMBRANE FUEL CELLS FOR DISTRIBUTED GENERATION AND
COGENERATION
Thomas G. KreutzJoan M. Ogden
Center for Energy and Environmental StudiesPrinceton UniversityPrinceton, NJ 08544
Abstract
Proton exchange membrane fuel cells (PEMFCs) are highly efficient power generators,achieving up to 50-60% conversion efficiency, even at sizes of a few kilowatts. PEMFCshave zero pollutant emissions when fueled directly with hydrogen, and near zero emissionswhen coupled to reformers. These attributes make them potentially attractive for a variety ofapplications including electric vehicles and distributed generation and cogeneration of heat andpower in buildings. Over the past few years, there have been intense efforts worldwide todevelop low-cost PEMFC systems. While the primary focus has been on vehicle applications,an equally important application may be combined heat and power generation in commercialand residential buildings.
In this progress report (covering the period July 1999-May 2000), we summarize resultsfrom ongoing technical and economic assessments of hydrogen-fueled proton exchangemembrane fuel cell systems for distributed generation and cogeneration in residential markets .The objective of this research is to understand the prospects for hydrogen fueled PEMFCcogeneration technology for residential applications, and to identify the conditions underwhich hydrogen fueled PEM fuel cells might compete with other distributed generationoptions. Engineering and economic models of PEM fuel cell systems are developed for avariety of configurations. Using realistic load profiles for single and multi-family residentialbuildings, we size the system components and estimate the cost of producing electricity andcogenerated heat for a range of PEMFC costs, energy prices, and system sizes. The potentialimpact of distributed benefits will be addressed in future work under this contract. This workwas carried out as part of the systems analysis activity of the US Department of EnergyHydrogen R&D Program under Contract No. DE-FG01-99EE35100.

2
Introduction
Motivation and Background
Proton exchange membrane fuel cells (PEMFCs) are highly efficient power generators,achieving up to 50-60% conversion efficiency, even at very small sizes (down to thehousehold level – 1 to 5 kW). PEMFCs have zero pollutant emissions when fueled directlywith hydrogen, and near zero emissions when coupled to reformers. These attributes makethem potentially attractive for a variety of applications including electric vehicles anddistributed generation and cogeneration of heat and power in buildings.
Over the past few years, there have been intense efforts worldwide to develop low-costPEMFC systems. While the primary emphasis has been on vehicle applications, an equallyimportant application may be combined heat and power generation in commercial andresidential buildings.
Since the 1970s, there have been ongoing efforts to commercialize fuel cell cogenerationsystems for use in buildings. Initially, these efforts focussed on phosphoric acid fuel cell(PAFC) technology. Phosphoric acid fuel cell (PAFC) systems run on reformed natural gashave been developed in the 200 kW size range for commercial building applications. Thesehave shown good operational characteristics and reliability. However, the current capital costof PAFC systems ($3000/kW) is still too high for large penetration into building markets.Even at larger scale production PAFC system costs are projected to be $1500/kW, and wouldface tough competition from natural gas fired engines or microturbines in the 50-500 kW sizerange.
Recently there has been considerable R&D aimed at commercializing PEMFC systems forcogeneration in buildings. PEM fuel cell cogeneration systems in the 200 kW size range areunder development (a size appropriate for commercial or multifamily residential buildings), aswell as smaller units (in the 5-10 kW size range), for use in individual houses.
There are several reasons why PEMFCs might become competitive for buildings applicationsbefore they appear in vehicles:
1) The cost barrier is lower for PEMFC cogeneration systems than for automotiveapplications. To compete with internal combustion engines in automobiles,PEMFCs must achieve stringent cost goals of perhaps $50/kW. Recent studiesindicate that significant cogeneration markets in commercial buildings could open forPEMFC stack costs of perhaps $300-500/kW (corresponding to complete systemcosts of $1000-1500/kW) [1]. Residential markets might open at stack costs of~$200/kW [2].
2) The technical challenges are in many respects less severe for stationary powergeneration than for vehicles. (Start-up behavior and transient operation is likely tobe less of a problem for power generation than for vehicles which are characterizedby rapidly varying loads; heat and water management issues should be much easier;weight and volume constraints are less stringent; peak power devices will not beneeded; control systems should be simpler; robustness and resistance to mechanicalshocks during driving will not be an issue.) In one respect, technical requirementsare more demanding for cogeneration applications: a longer operating lifetime(50,000-100,000 hours) would be needed for a stationary power system ascompared to perhaps 5000 hours for vehicles.
3
3) Infrastructure considerations might be easier for hydrogen fueled stationary powersystems than for hydrogen vehicles. Hydrogen could be made as needed for PEMFCsystems in buildings from widely available natural gas at the individual building orneighborhood level.
Scope of this Study
In this study we are carrying out a series of detailed technical and economic assessmentsaimed at understanding the prospects for hydrogen fueled PEM fuel cell cogenerationtechnology for residential applications. We concentrate on hydrogen derived from naturalgas, a primary energy source which is widely available today, and is likely to give the lowesthydrogen cost in the near term.
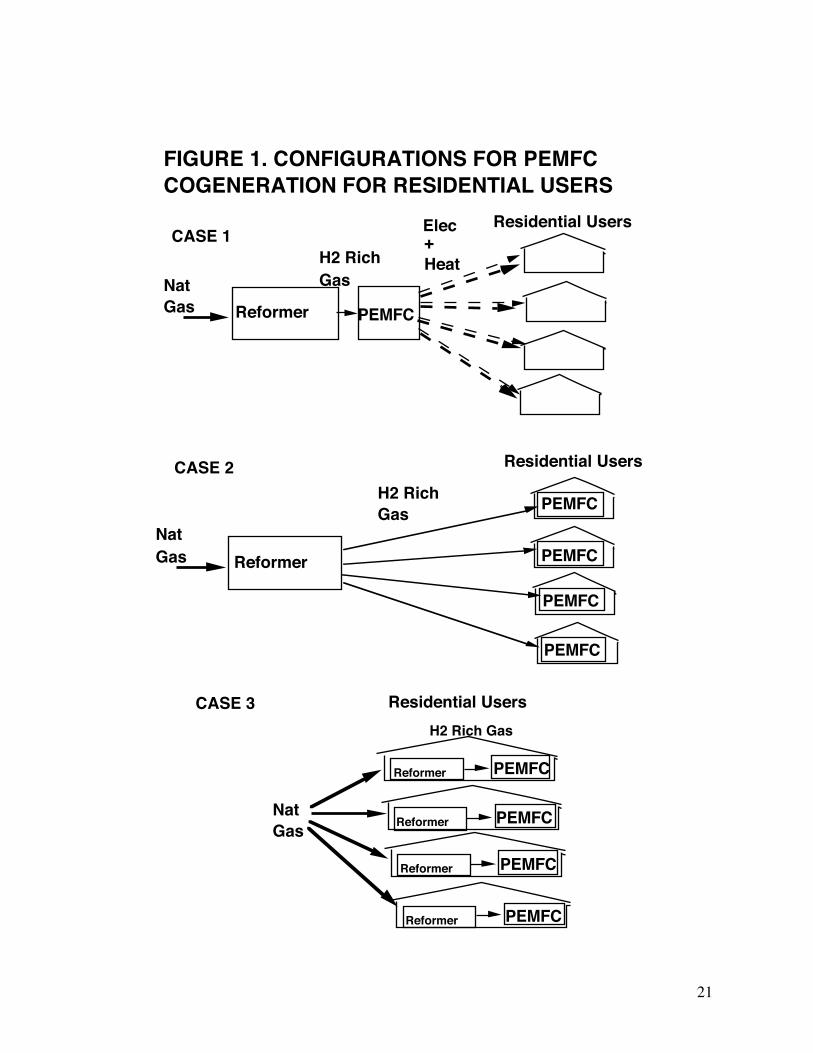
We compare three types of PEM fuel cell cogeneration systems which could provide powerand heat to residential users (see Figure 1).
Case 1) a centralized "neighborhood" scale (200-1000 kW) natural gas reformer/PEM fuelcell system which distributes heat (via district heating) and electricity (via wire) to40-200 residential users.
Case 2) a centralized "neighborhood" scale natural gas reformer, which produces hydrogenor a hydrogen rich gas for distribution to users. Each house has a small hydrogenfueled (1 to 5 kWe) PEM fuel cell providing electricity and heat.
Case 3) individual natural gas reformers coupled to small (1 to 5 kW) PEM fuel cells at eachhouse.
For each case energy storage (in the form of hydrogen storage, hot water storage or electricbatteries) could be used to meet time varying energy demands. Connections to the electricutility system could be made at the household or neighborhood level, allowing dispatch ofpower.
Building on earlier work by our group for the USDOE Office of Transportation TechnologiesCARAT program [5], we have developed engineering and economic models of hydrogenPEM fuel cell based cogeneration systems. The potential advantages and disadvantages ofeach configuration are investigated in terms of overall energy efficiency, performance,economics (capital cost, delivered cost of electricity and heat), and greenhouse gas emissions.PEMFC cogeneration systems are compared to other alternatives for production of residentialheat and power.
Several tasks are underway:
Task 1. Develop engineering models of various types of PEM fuel cell cogeneration systems capableof supplying residential heat and power at a household and neighborhood level. Model heat-integrated PEMFC cogeneration system using ASPEN-Plus software to simulate steady stateperformance.
Task 2 Develop component sizing algorithms for various types of PEMFC cogeneration systems,based on the demand profile, energy prices, component performance and scale (single housevs. multi-family).
Task 3 Investigate design trade-offs for various options: Reformer type (steam reformer vs.autothermal reformer); operating strategy (load following vs. non-load following);

4
cogeneration (hot water and/or space heating?); scale (single vs. multi-family); various typesof loads; energy prices (natural gas, electricity); and utility connection strategies.
Task 4. Discuss the costs and trade-offs involved in distributing different forms of energy tohouses (case 1: electricity and heat , case 2: hydrogen or hydrogen-rich gas, case 3:natural gas.
Task 5. Estimate the cost of electricity and heat from PEM fuel cells, as compared toalternatives.
Task 6. Analyze and discuss the role of distributed benefits and emissions benefits in theeconomic competitiveness of fuel cells. Estimate the required component cost andperformance goals for small scale PEMFC cogeneration systems to competeeconomically with alternatives, when distributed and emissions benefits areincluded. (This task is being performed in coordination with researchers atDistributed Utilities Associates.)
Tasks 1, 2, 3 and 5 are essentially completed and results will be given in this report, Tasks 4and 6 will be completed in future work, and will be discussed in the final report for thiscontract.
Modeling the PEMFC Cogeneration System (Tasks 1, 2, 3 and 5)
System Design Options
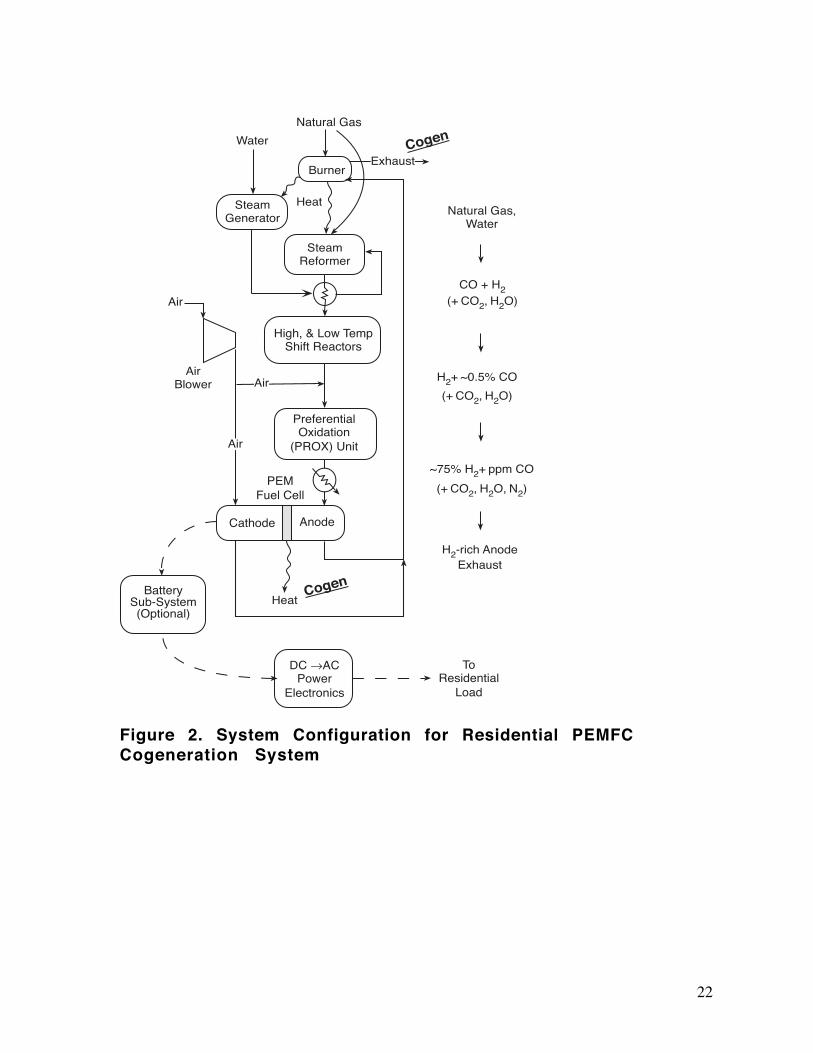
The primary components of a residential PEMFC cogeneration system (as shown in Figure 2)are: 1) a fuel processor that converts natural gas into a hydrogen-rich fuel gas for the fuel cell,2) a proton exchange membrane fuel cell (PEMFC) stack (and integrated air blower) thatgenerates DC electricity from the hydrogen, 3) power conditioning electronics that convert theDC electricity into grid-quality AC power, 4) an optional battery subsystem to increase thepeak power of the system, and 5) optional cogeneration for hot water production and/or spaceheating.
As shown in Figure 1, a variety of paths are possible for using natural gas derived hydrogenPEMFCs to supply power and heat to single-family or multi-family residences. In our resultsto date (which cover “case 3” above), we have assumed a connection to the electricaltransmission grid so that the fuel cell power system is not required to provide all of theelectrical load; rather, it generates a portion of the residential power demand while the gridprovides “back-up” power when demand exceeds the fuel cell capacity. Cogeneration of hotwater and space heating are considered as system options. The options of space and waterheating from natural gas are included. Cases 1 and 2 will be explored in future work on thiscontract.
We assume that the system is owned by the consumer as a home (or neighborhood) “energyappliance” that generates electricity (and, optionally, heat). The consumer’s economicmotivation for installing a fuel cell cogeneration system is to reduce overall energy costsrelative to standard utility service. [In future work (Task 6), we plan to address the economicsof distributed generation systems that are owned and potentially dispatched by the electricutility in order to capture various economic benefits associated with distributed powergeneration.]
5
A variety of options are examined that determine the system performance and economics.These include:
Various reformer types (steam reforming vs. autothermal reformer).
Various building sizes and types of energy load (single-family vs. multi-family dwellingvs. multiple single-family dwellings).
Optional cogeneration of hot water or space heat.
Various strategies for operating the fuel cell system. The power output can be: 1) variedduring the day to meet the building electrical load (such a system is called a “loadfollower”), or 2) operated continuously at full load with the excess electricity sold back tothe utility at reduced rates (“non-load follower”).
Various utility interconnection scenarios (standard single meter, PURPA-type dualmeters, monthly net metering, stand alone/grid-isolated system.)
Various gas and electricity prices.
Various assumptions about capital and O&M costs for the system.
We estimate the cost of electricity and the internal rate of return to the consumer for a varietyof cases. We perform sensitivity analyses to identify the most important variables governingsystem performance and economics. The estimated cost of residential electric power fromPEM fuel cells is compared to other electricity supply options, including grid power andmicroturbines.
System Component Models
PEMFC Stack
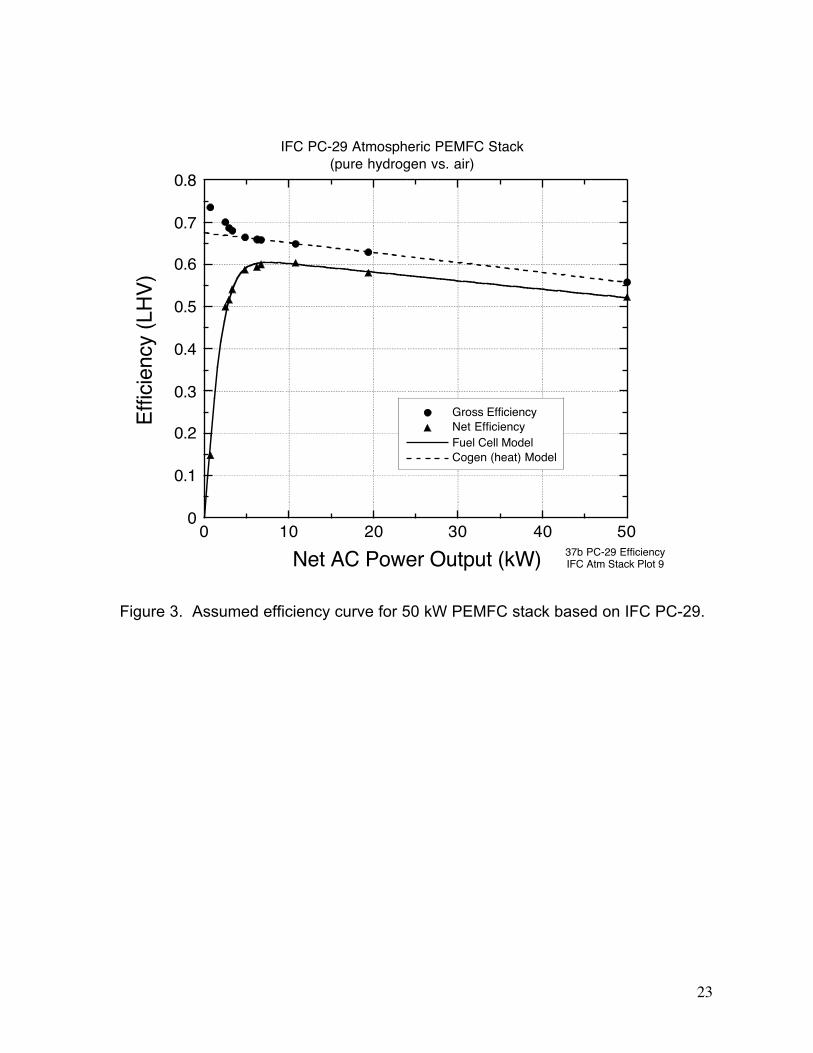
To model fuel cell (FC) stack performance, we use the measured performance (Fig. 3) of theIFC PC-29, a 50 kW atmospheric pressure, hydrogen-air, automotive PEMFC stack (with anintegrated variable-speed blower) built by International Fuel Cells and delivered to the USDepartment of Energy in the fall of 1997 [3]. Our fuel cell model consists of an analyticformula used to fit the PC-29 performance data, with scaling variables included that allow usto model cogeneration systems of arbitrary size. We assume that the net fuel cell systemefficiency curve as a function of power (see Fig. 3) is invariant with system scale. Thisallows us to model fuel cells over a range of sizes from about 1 to 100 kW.
Hydrogen utilization of 80% is assumed for PEMFCs run on reformate.
Fuel Processor
Hydrogen is produced from natural gas in a fuel processor at the neighborhood or householdlevel. The fuel processor is a series of catalytic chemical reactors that convert natural gas intoPEMFC-quality hydrogen gas. As shown in Fig. 2, the first stages of the fuel processor is afuel reformer - either a steam methane reformer (SMR) or an autothermal reformer (ATR) -that converts natural gas into a synthesis gas that is rich in H2 and CO. The syngas is thenprocessed in high- and low-temperature water-gas shift reactors that convert the bulk of theCO to H2 (down to ~0.5%vol). Finally, a preferential oxidation (PROX) unit is used removeCO (to less than ~100 ppmv) from the reformate in order to avoid poisoning the catalyst in thefuel cell anode. The fuel processor includes ancillary equipment such as a steam generator andnumerous heat exchangers for heat integration.
6
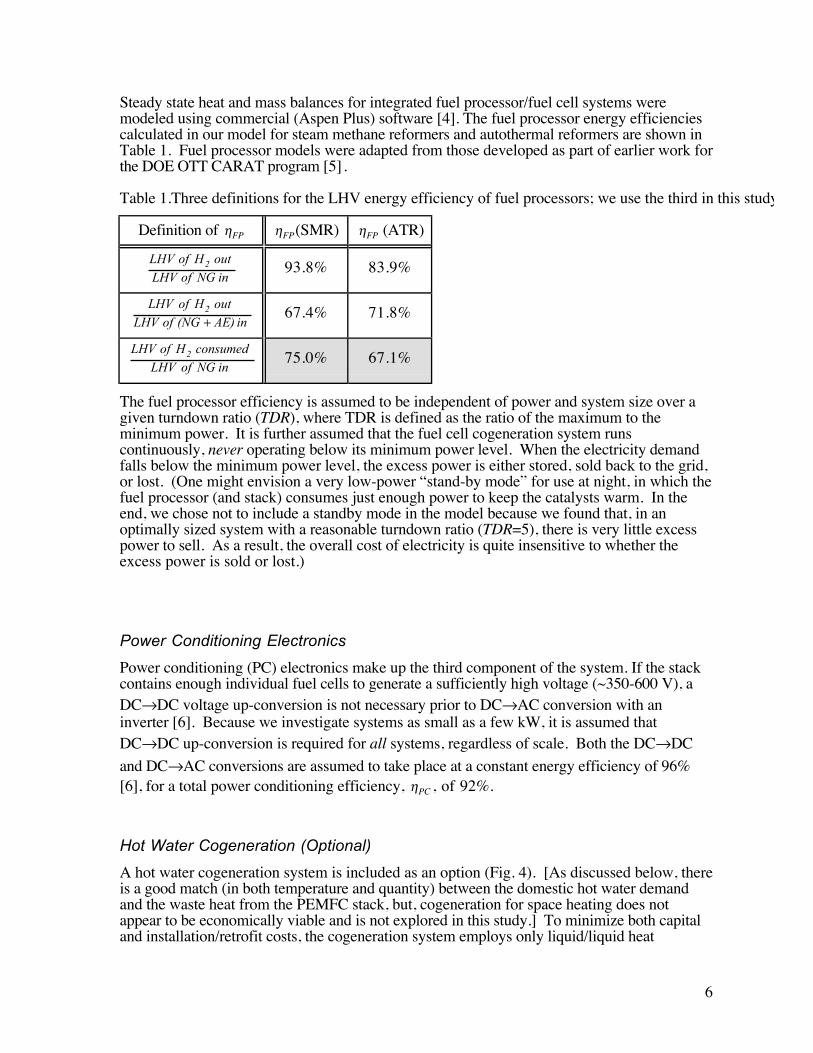
Steady state heat and mass balances for integrated fuel processor/fuel cell systems weremodeled using commercial (Aspen Plus) software [4]. The fuel processor energy efficienciescalculated in our model for steam methane reformers and autothermal reformers are shown inTable 1. Fuel processor models were adapted from those developed as part of earlier work forthe DOE OTT CARAT program [5].
Table 1.Three definitions for the LHV energy efficiency of fuel processors; we use the third in this study
Definition of ηFP ηFP(SMR) ηFP (ATR)
inNG of LHVout H of LHV 2 93.8% 83.9%
in AE) (NG of LHVout H of LHV 2
+67.4% 71.8%
inNG of LHVconsumed H of LHV 2 75.0% 67.1%
The fuel processor efficiency is assumed to be independent of power and system size over agiven turndown ratio (TDR), where TDR is defined as the ratio of the maximum to theminimum power. It is further assumed that the fuel cell cogeneration system runscontinuously, never operating below its minimum power level. When the electricity demandfalls below the minimum power level, the excess power is either stored, sold back to the grid,or lost. (One might envision a very low-power “stand-by mode” for use at night, in which thefuel processor (and stack) consumes just enough power to keep the catalysts warm. In theend, we chose not to include a standby mode in the model because we found that, in anoptimally sized system with a reasonable turndown ratio (TDR=5), there is very little excesspower to sell. As a result, the overall cost of electricity is quite insensitive to whether theexcess power is sold or lost.)
Power Conditioning Electronics
Power conditioning (PC) electronics make up the third component of the system. If the stackcontains enough individual fuel cells to generate a sufficiently high voltage (~350-600 V), aDC→DC voltage up-conversion is not necessary prior to DC→AC conversion with aninverter [6]. Because we investigate systems as small as a few kW, it is assumed thatDC→DC up-conversion is required for all systems, regardless of scale. Both the DC→DC
and DC→AC conversions are assumed to take place at a constant energy efficiency of 96%[6], for a total power conditioning efficiency, ηPC , of 92%.
Hot Water Cogeneration (Optional)
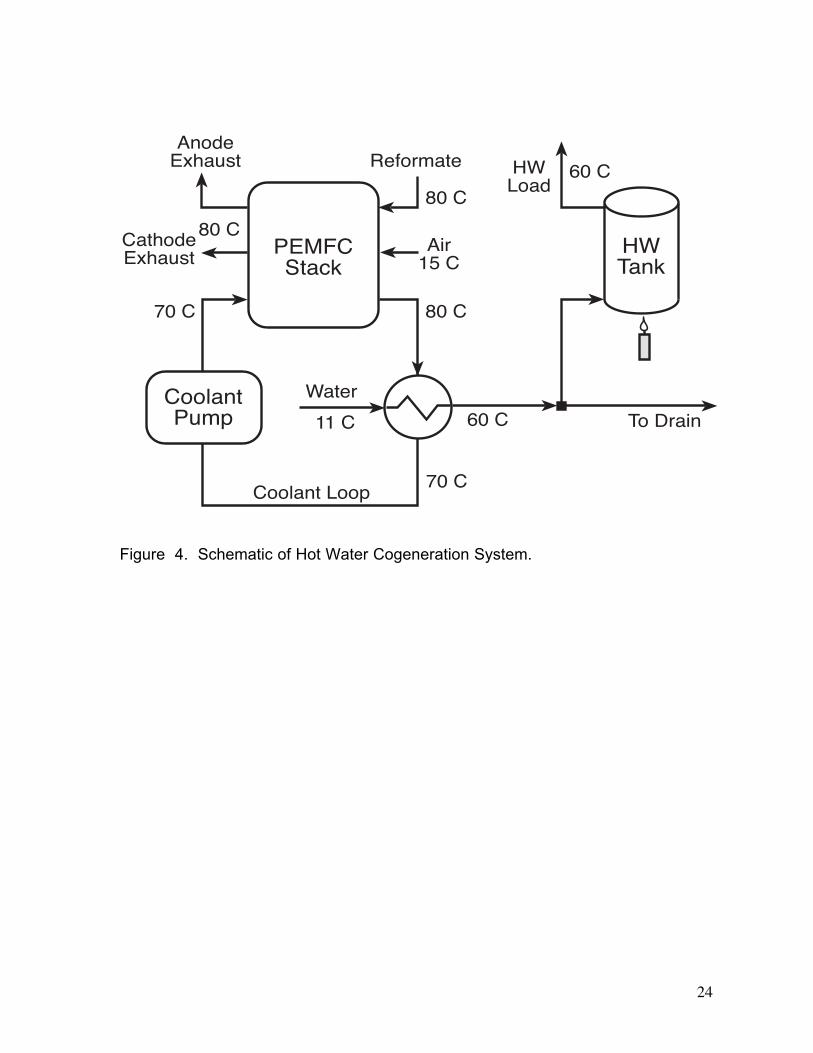
A hot water cogeneration system is included as an option (Fig. 4). [As discussed below, thereis a good match (in both temperature and quantity) between the domestic hot water demandand the waste heat from the PEMFC stack, but, cogeneration for space heating does notappear to be economically viable and is not explored in this study.] To minimize both capitaland installation/retrofit costs, the cogeneration system employs only liquid/liquid heat

7
exchangers (i.e. heat is not recovered from the stack but not from the cathode exhaust), andutilizes a pre-existing natural gas-fired hot water tank. The tank is assumed to have a 50 galcapacity, a HHV energy efficiency of 76%, and a HHV energy factor (i.e. including standbylosses) of 70.1%. Aspen modeling of the heat recovery scheme in Fig. 4 indicates that ~68%of the waste heat from the stack can be captured as 60 C water for domestic hot water.
The cogeneration system is operated with a time varying load (determined by the buildingelectricity demand profile), while continuously monitoring the extent to which water in thetank is fully heated. The available waste heat at any point in the fuel cell operating range wasestimated with a simple linear fit to the PC-29 data shown in Fig. 3. Operationally, the tank isheld between a minimum “set point” of 90% and a maximum of 100% by: 1) discarding anysurplus hot water, and 2) firing the tank burner with natural gas when the tank falls below theset point. The 90% set point insures that adequate hot water is always available to theconsumer, while leaving 10% of the full tank capacity for buffering the PEMFC stack fromthe domestic hot water demand.
Total Fuel Cell System Efficiency
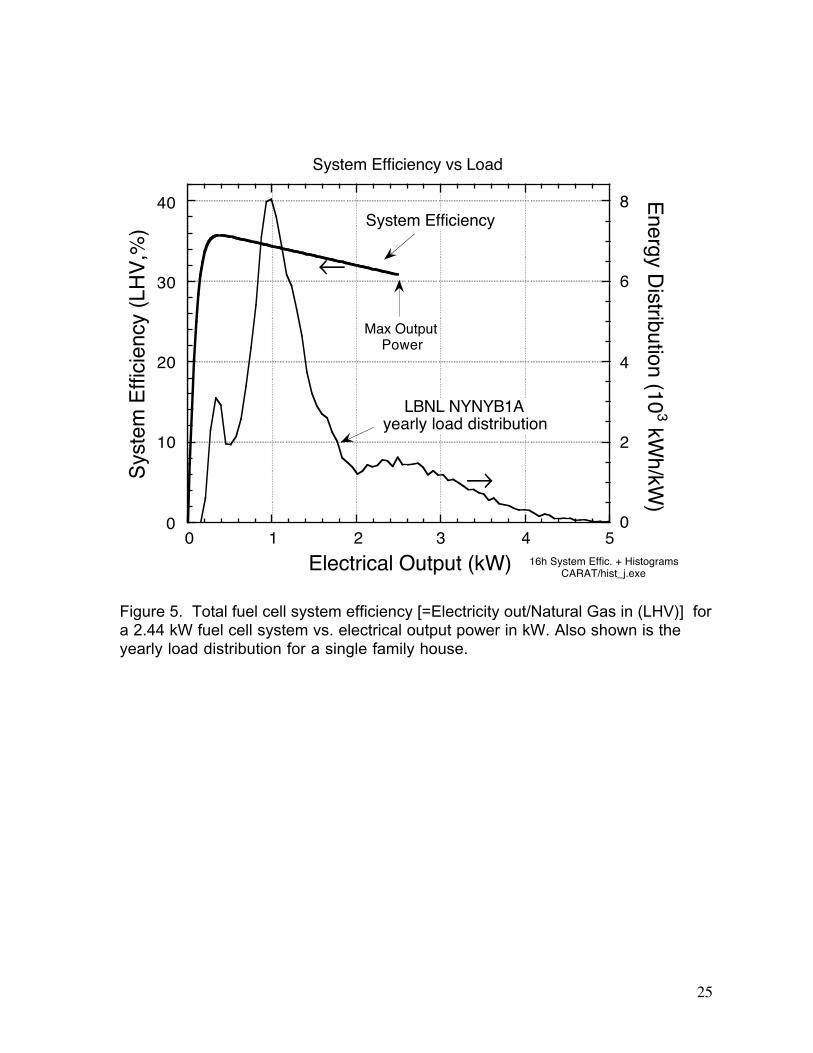
The total fuel cell system efficiency [natural gas (LHV) to electricity] is the product of thestack net electrical efficiency (which varies with system output as shown in Figure 3) times thefuel processor efficiency (which is found from our ASPEN simulations to be 75.0% for asteam methane reformer) times the power conditioning efficiency, which is assumed to be92%. Multiplying these factors together, we find a total system efficiency which varies withpower output as shown in Figure 5. The maximum system electrical efficiency is about 36%which occurs at 20% part load.
Costs for Distributing Energy from Neighborhood Fuel Cell Systems
In cases 1 and 2 (Figure 1), electricity, heat or hydrogen-rich syngas are distributed to houses.Costs for distribution are being developed, and will be used in future work under this contract(Task 4).
Residential Electric Load Profiles
In order to model system performance, we obtained time-resolved electric load profiles forsingle- and multi-family residences from a series of studies on residential and commercialenergy use by Lawrence Berkeley National Laboratory (LBNL) and the Gas Research Institute(GRI) conducted between 1988 and 1990 [7,8,9]. In those studies, the existing stock ofU.S. residences was surveyed and broken down in to a small number of categories (from 8 to16 different types in each of 16 separate U.S. climatic regions) that represent the dominantbuilding practices between 1940 and 1990. Using DOE-2 software, prototypical modelbuildings were created for each category in each geographic region.
Space heating, cooling, and electric loads were generated on an hourly basis by subjectingeach prototype to WYEC (Weather Year for Energy Calculations) weather tapes, whichencapsulate average weather data (temperature, humidity, wind speed, solar insolation, etc.)throughout a “typical” year. In this study we focus primarily on the New York/New Jerseyregion because its energy prices are highly favorable for cogeneration systems (i.e. relativelyhigh electricity prices and relatively low natural gas prices). Results presented here arecalculated for the so-called “B1A” prototype, a thermally-improved, 2-story, wood framehouse with a basement, built between 1950 and 1970. The NYBIA prototype represents thelargest category of homes in the New York region and, as will be shown later, is a good
8
representative for all New York dwellings from the standpoint of the economics of PEMFCcogeneration.
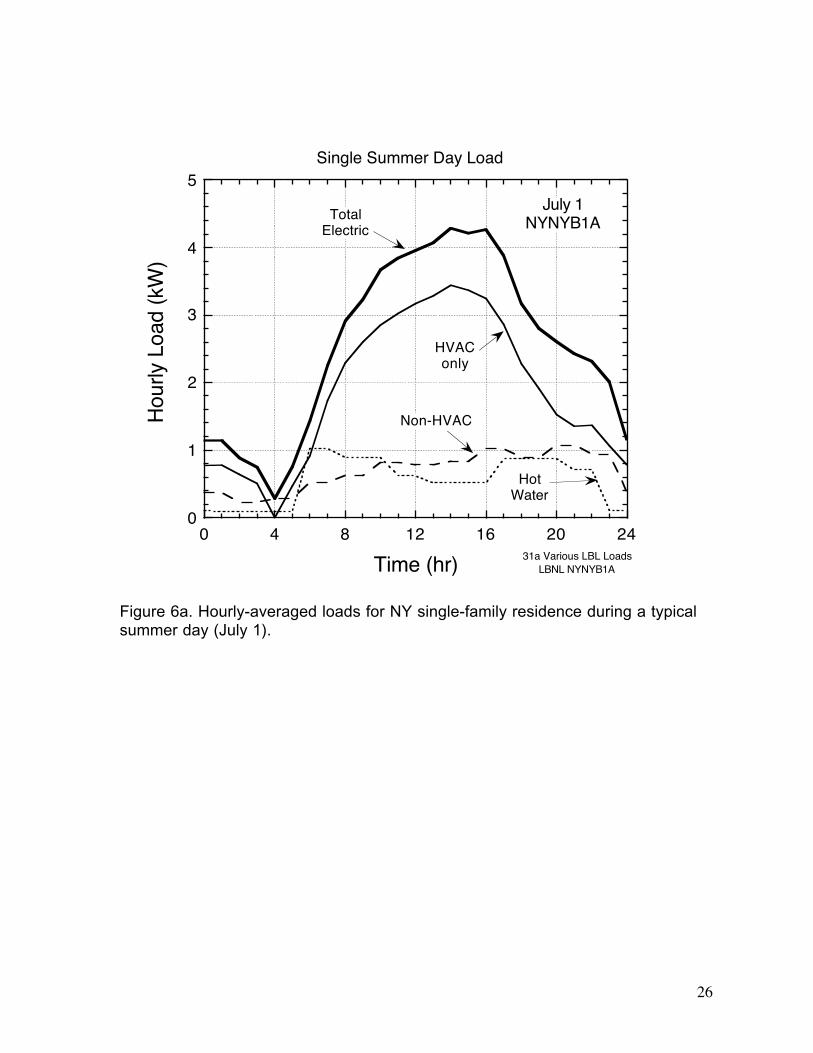
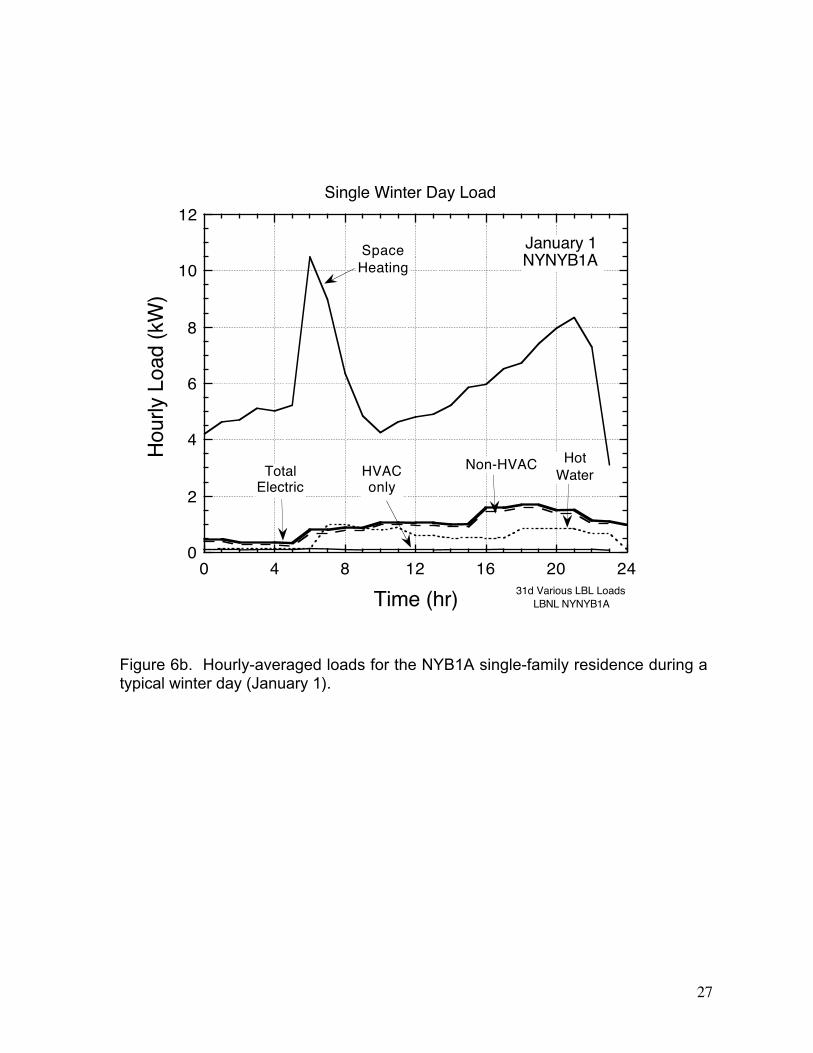
Hourly energy demand, broken out as HVAC and non-HVAC electric, space heating, and hotwater, are shown for a winter and a summer day in Figs. 6a and 6b. The difference in electricloads during summer and winter shown in the two figures is indicative of the characteristic“peakiness” of residential electric loads throughout the year. The peak hourly electric load forthe whole year is 4.4 kW, while the average is only 1.0 kW. Depending on the connectionscenario between the PEMFC system and the electric grid, the system economics can be quitesensitive to this peak-to-average load ratio, since the peak power governs the system size (i.e.maximum power output) - and therefore cost - while the average power controls the rate atwhich the system can generate revenue by producing power at a lower cost than it can bepurchased from the public utility.
Figures 6a and 6b also illuminate the prospects for space heating and hot water cogeneration.In both figures the hot water demand is seen to be smaller than the electricity demand and alsofairly well correlated (temporally) with it. Waste heat from the stack appears to be wellmatched with the hot water demand, both in terms of magnitude and temperature. Thesefigures suggest that hot water cogeneration is a likely prospect, probably not requiring anunusually large storage tank to act as a buffer between supply and demand. In contrast, thespace heating and electric loads are anti-correlated, with the space heating demand largest inwinter when the average electric load is smallest, and vice versa.
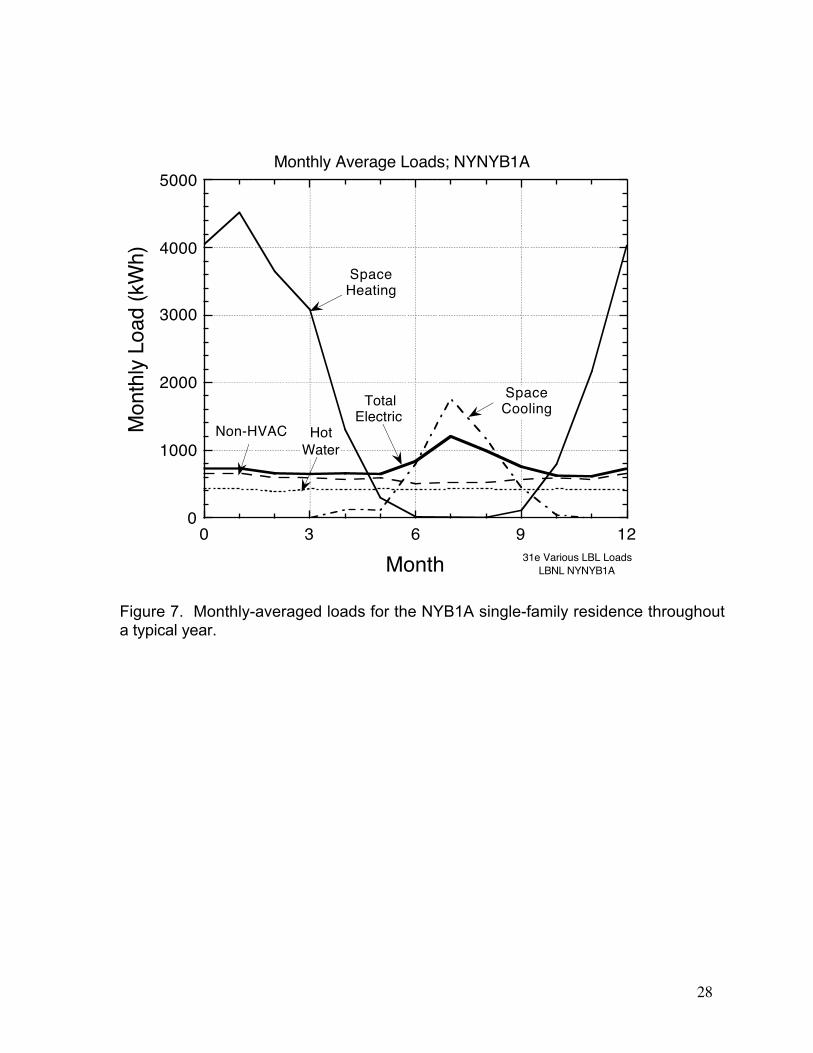
The dim prospects for space heating cogeneration can be seen more clearly in Fig. 7 where themonthly average energy loads for the New York B1A prototype are plotted throughout theyear. The peak demands for space heating and space cooling are out of phase by manymonths making thermal storage impractical. Furthermore, the space heating demand dwarfsthe waste heat available from a PEMFC system, especially if the bulk of the heat (from thestack) is already used for hot water production. Finally, space heating cogeneration mayrequire more expensive gas-liquid (or gas-gas) heat exchangers and more complex installationthan hot water cogeneration. For these reasons, cogeneration for space heating does notseems (at first glance) to be economically viable, and was not examined further. [BecausePEM fuel cells operate at relatively low temperatures (70-80 C), we also did not considerabsorption air conditioning.]
In the LBNL-GRI studies, domestic hot water (DHW) demands for single-family residenceswere calculated on an hourly basis throughout the year. For cogeneration calculations, wemodified their computer code to generate an hourly “composite” DHW load that includes boththe energy for heating the water as well as “standby losses”, i.e. heat loss from the storagetank. The calculations are based upon the national average hot water consumption of 62.4gal/day/person, 3 persons/household, a tank temperature 140 F (60 C), and in the base case(New York region), a well temperature of 52 F (11.1 C) and an average air temperature of54.2 F (12.3 C).
System Economic Assumptions
In order to estimate the long-term potential economics of PEMFC cogeneration, we use costestimates for PEM fuel cell cogeneration systems manufactured in high volume (e.g. hundredsof thousands of units per year—similar to the scale projected for manufacturing automotivefuel cell systems). As such, contingencies and design and engineering costs are deliberatelyexcluded. The capital cost for each system component is assumed to be a linear function of itssize (kW), with a cost-axis intercept that represents the minimum cost for manufacturing thesystem at any size.
9
Because cost and performance estimates for automotive components are more readily availablethan for stationary systems, we have chosen to construct the PEMFC cogeneration systemstudied here out of “automotive-grade” components whenever possible. Our “high volume”case uses automotive type component cost estimates, and assumes manufacturing levels ofseveral hundred thousand units per year. We have compared these costs to those of a recentstudy by Directed Technologies, Inc. of costs for stationary PEMFC systems manufactured atlower volume (10,000 units per year) [10,11].
Perhaps the most significant difference between stationary and mobile fuel cell systems is theirrequired lifetimes. While automotive equipment is generally designed to last for only ~5000hours, the service life of residential furnaces and hot water heaters is typically 10 years ormore, roughly 18 times as long. To model a stationary power system “built” of automotivecomponents, we assume that various components are replaced or refurbished, as requiredduring the 10 year life of the fuel cell system.
Assumed “high volume” mass produced capital costs for PEMFC cogeneration systems madefrom automotive type components are given in Table 2.
The fuel cell is assumed to be an automotive stack whose membrane electrode assemblies(MEAs) and bipolar plates are replaced at 5-year intervals. Long time (>9000 hr)performance tests on a hydrogen-fuelled PEMFC stack at Mitsubishi Electric Corporationshow a degradation rate of 4 mV per 1000 hr (at 250 mA/cm2), or 5.8% per year [12].This implies a ~30% drop over 5 years, which would probably warrant MEA replacementat the end of that period. In this study, we assume that reformate-fueled fuel cells can bemade to operate as well as hydrogen-fuelled systems (from the standpoint of degradation),and adopt a performance loss rate of 5.8%/yr, with complete MEA replacement every 5years. For this system, whose lifetime is assumed to be 10 years, only one stackrefurbishment is necessary, at the end of the 5th year.
Detailed cost estimates for cost-optimized, high volume manufacturing of automotive fuelprocessors (gasoline-fueled ATR) [13] and PEMFC stacks [14] have been made byDirected Technologies Inc. (DTI) using a methodology known as Design For Manufactureand Assembly (DFMA) that has been formally adopted by the Ford Motor Company. Thefuel processor costs used here ($42/kWe at a scale of 50 kWe) are somewhat higher thanthose obtained in cost studies performed by Arthur D. Little on their 50 kWe catalyticpartial oxidation/autothermal reformer (16-29 $/kWe) [15,16]. In this study, we assumeequal costs for the SMR and ATR systems.
Price estimates for power electronics are from Trace Technologies and correspond tosomewhat lower volumes (e.g. 10,000 units/yr at a size of 10 kW) [6].
The added cost for hot water cogeneration (from stack cooling water) is assumed to benegligible; a pre-existing 50 gallon natural gas-fired hot water tank is presumed.
Estimates for advanced lead-acid batteries are taken from a study of electric vehicle batterystorage systems that was commissioned by the California Air Resources Board [17].
O&M costs include annual maintenance and replacement of MEAs and bipolar plates after year5. The equipment is assumed to have no salvage value at the end of its lifetime. Systemavailability is assumed to be 99.7%, based on a single day of down time per year forscheduled and unscheduled service. A real discount rate of 8% and a system lifetime of 10years are assumed.
10
We use as our base case scenario New Jersey residential gas and electric prices, 6.07$/MMBtu HHV (2.07 ¢/kWh) and 12.65 ¢/kWh, respectively; the disparity between the twoprovides an exceptionally favorable economic climate for PEMFC cogeneration.
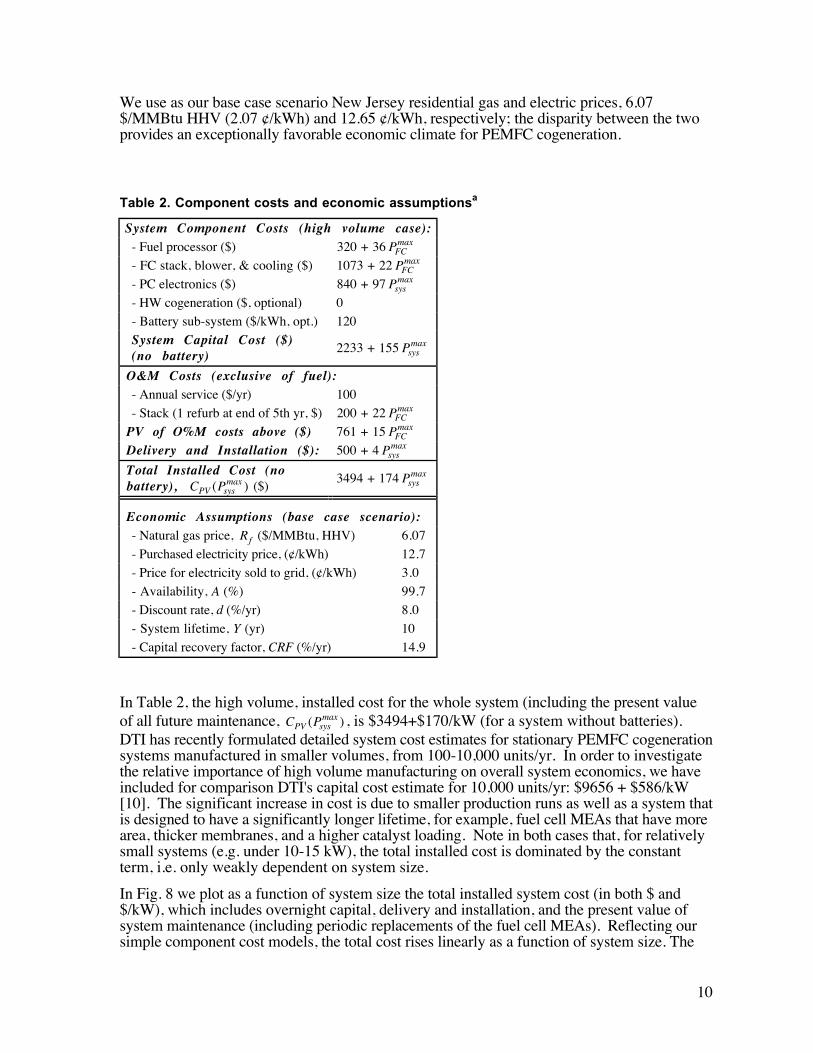
Table 2. Component costs and economic assumptionsa
System Component Costs (high volume case):- Fuel processor ($) 320 + 36 PFC
max
- FC stack, blower, & cooling ($) 1073 + 22 PFCmax
- PC electronics ($) 840 + 97 Psysmax
- HW cogeneration ($, optional) 0
- Battery sub-system ($/kWh, opt.) 120
System Capital Cost ($)(no battery)
2233 + 155 Psysmax
O&M Costs (exclusive of fuel):- Annual service ($/yr) 100
- Stack (1 refurb at end of 5th yr, $) 200 + 22 PFCmax
PV of O%M costs above ($) 761 + 15 PFCmax
Delivery and Installation ($): 500 + 4 Psysmax
Total Installed Cost (nobattery), C PPV sys( )max ($)
3494 + 174 Psysmax
Economic Assumptions (base case scenario):- Natural gas price, Rf ($/MMBtu, HHV) 6.07
- Purchased electricity price, (¢/kWh) 12.7
- Price for electricity sold to grid, (¢/kWh) 3.0
- Availability, A (%) 99.7
- Discount rate, d (%/yr) 8.0
- System lifetime, Y (yr) 10
- Capital recovery factor, CRF (%/yr) 14.9
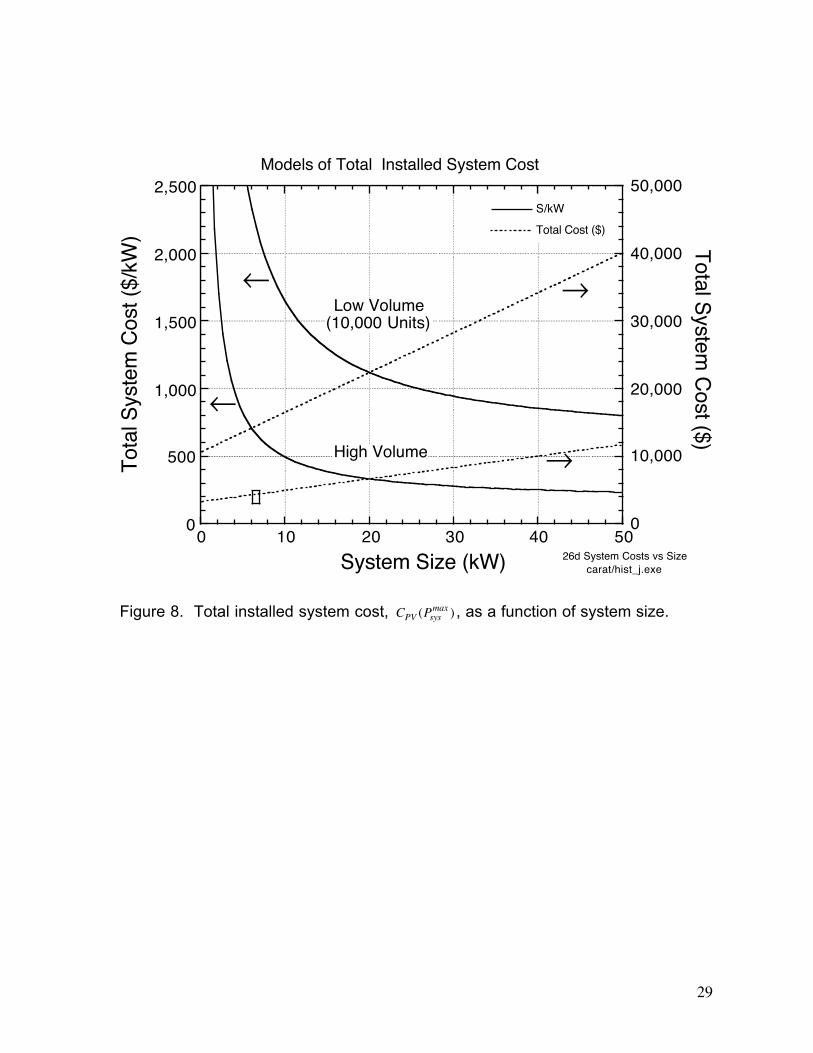
In Table 2, the high volume, installed cost for the whole system (including the present valueof all future maintenance, C PPV sys( )max , is $3494+$170/kW (for a system without batteries).DTI has recently formulated detailed system cost estimates for stationary PEMFC cogenerationsystems manufactured in smaller volumes, from 100-10,000 units/yr. In order to investigatethe relative importance of high volume manufacturing on overall system economics, we haveincluded for comparison DTI's capital cost estimate for 10,000 units/yr: $9656 + $586/kW[10]. The significant increase in cost is due to smaller production runs as well as a system thatis designed to have a significantly longer lifetime, for example, fuel cell MEAs that have morearea, thicker membranes, and a higher catalyst loading. Note in both cases that, for relativelysmall systems (e.g. under 10-15 kW), the total installed cost is dominated by the constantterm, i.e. only weakly dependent on system size.
In Fig. 8 we plot as a function of system size the total installed system cost (in both $ and$/kW), which includes overnight capital, delivery and installation, and the present value ofsystem maintenance (including periodic replacements of the fuel cell MEAs). Reflecting oursimple component cost models, the total cost rises linearly as a function of system size. The
11
cost per kW varies dramatically with power. Most importantly for single-family powersystems, it rises sharply below 10-20 kW.
As a point of comparison with our cost model (indicated in Fig. 8 as a small box), the retailprice of the 7 kW residential PEMFC cogeneration unit manufactured by Plug Power, LLC. isexpected to be in the range of $3000-5000 (430-714 $/kW) [18]. (Not all of the 7 kW poweris provided by the fuel cell; a portion of the power is provided by a less expensive battery sub-system [19].)
Economic Calculations: The SERC Method
Here we describe a novel method we have developed during earlier work for the DOE OTTCARAT program [5] -- called the “SERC” method -- for estimating the cost of electricity froma fuel cell cogeneration system. This method allows us to efficiently simulate many alternativeconfigurations for cogeneration systems, to find the optimum (lowest cost) system.
Calculating the system performance and economics is traditionally carried out by simple time-domain (i.e. hour-by-hour) accounting, an effective technique, but one whose results are oftenunenlightening; in-depth analysis typically requires brute force finite difference sensitivitystudies. For that reason, we have developed a novel alternative formalism called the “systemeconomic response curve” (SERC) method which organizes the raw load data into a readilycharacterized load histogram (the “load energy distribution”) that is entirely separate from theeconomic parameters of the PEMFC cogeneration system. The final electricity costs resultfrom the interaction between these two components, which is both intuitively obvious andanalytically simple. As a result, the method is extremely efficient with regard to computation,thereby facilitating multi-parameter system optimization. We begin the exposition of thismethod by looking first at the load.
Load Energy Distribution
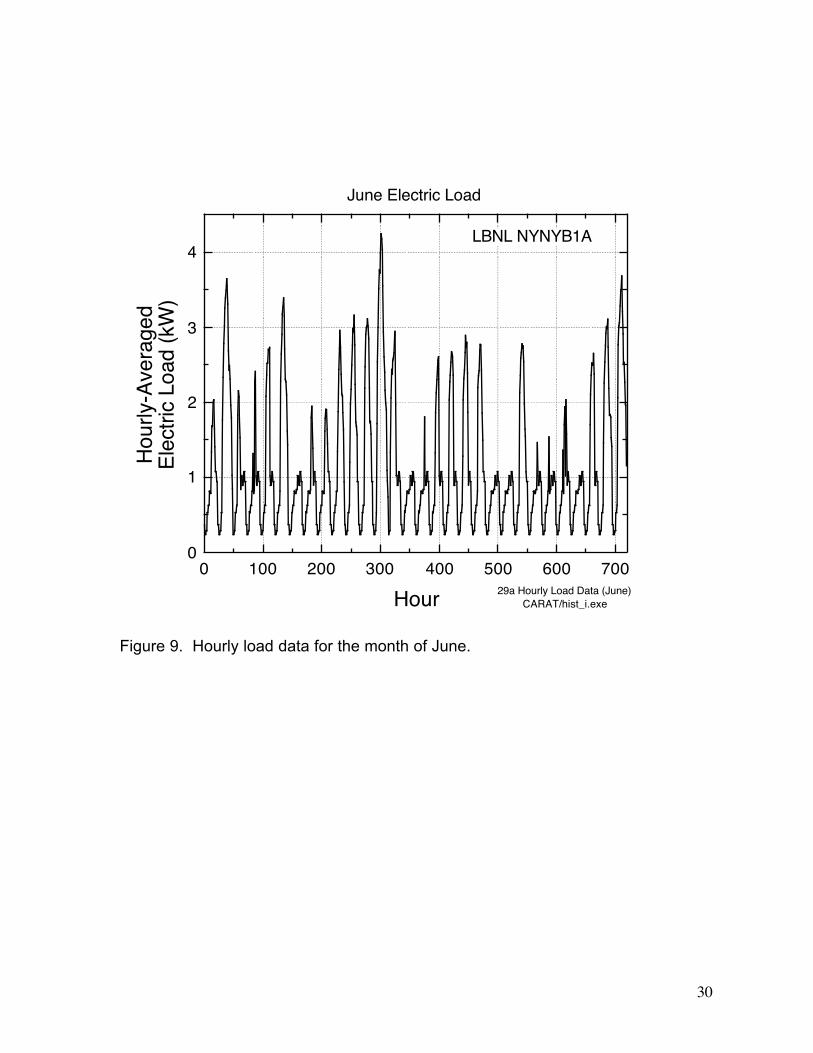
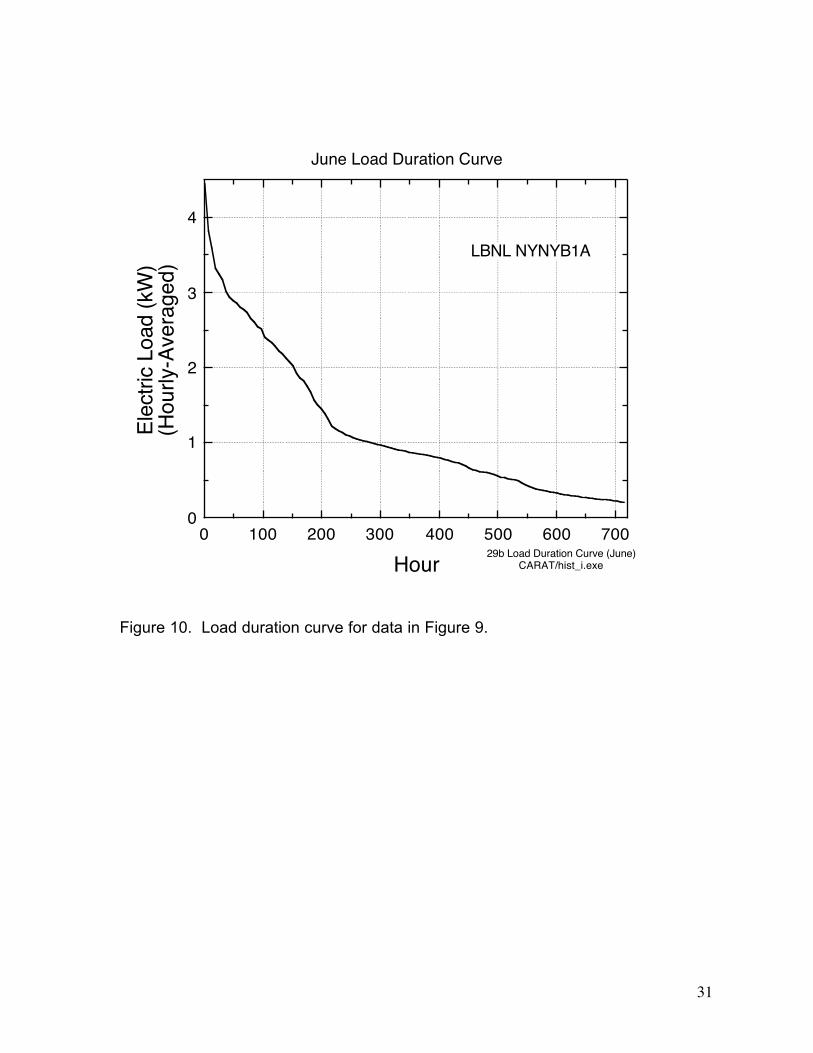
A typical “load profile” consists of a time series of N consecutive values, )(nPl (n=1,N), thatrepresent the load power averaged over the corresponding temporal widths, )(nt∆ . The LBNLload profiles used in this study are hourly averaged values for one year (e.g. they have aconstant time resolution of t∆ =1 hr, and span a single year, i.e. N=8760 hours/yr). As seenin Fig. 9, such a massive set of raw data is rather difficult to interpret, and is thus oftentransformed into a format that is more readily understood. For example, ordering the loadsaccording to their size produces a so-called “load duration curve” (Fig. 10) which readilyreveals the percentage of time is spent above (or below) any given power level.
In the SERC methodology, we transform the data into a “load energy distribution function”,)(PL , which quantifies how much energy is demanded at any given power. This function is
simply a power-weighted histogram obtained by “binning” the load data into discrete intervalsof load power, P∆ , as follows:
L PP
PP n P P t nl
n
N
( ) ( ) ; ( )≡ −[ ]=
∑∆∆ ∆δ
1
, (7)
where the pseudo-delta binning function is defined by
12
δ P n P P
PP
P n PP
P n PP
P n PP
l
l
l l
( ) ;
( )
( ) ( )
−[ ] ≡
−
≤ < +
< −
≥ +
∆
∆ ∆
∆ ∆
12 2
02 2
for
for ,
. (8)
The 1 / ∆P factor in Eq. (7) yields a “probability density” distribution function whoseamplitude is independent of the “binning width”, ∆P. The function is further weighted by P toreflect our interest in the energy required at any given power rather than the time spent there.As such, )(PL has units of kWh/kW, and integrating over all load power yields the total loadenergy, Eload (kWh):
E L P dPload ≡ ∫ ( ) . (9)
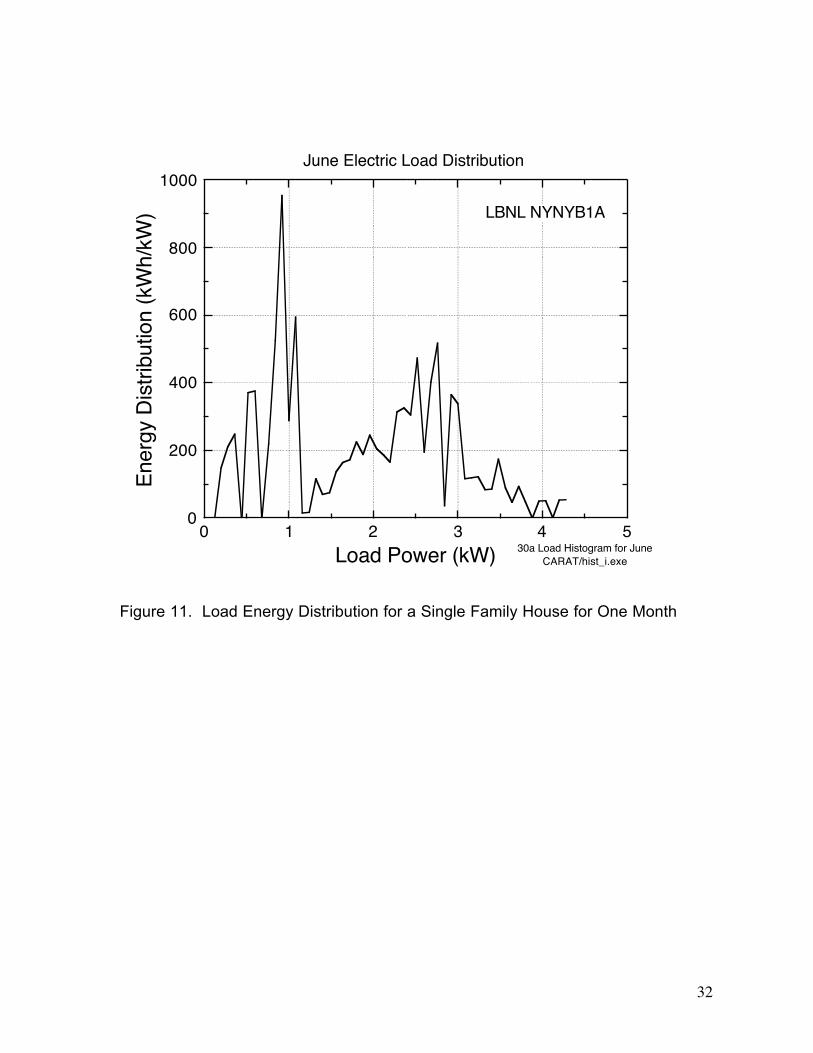
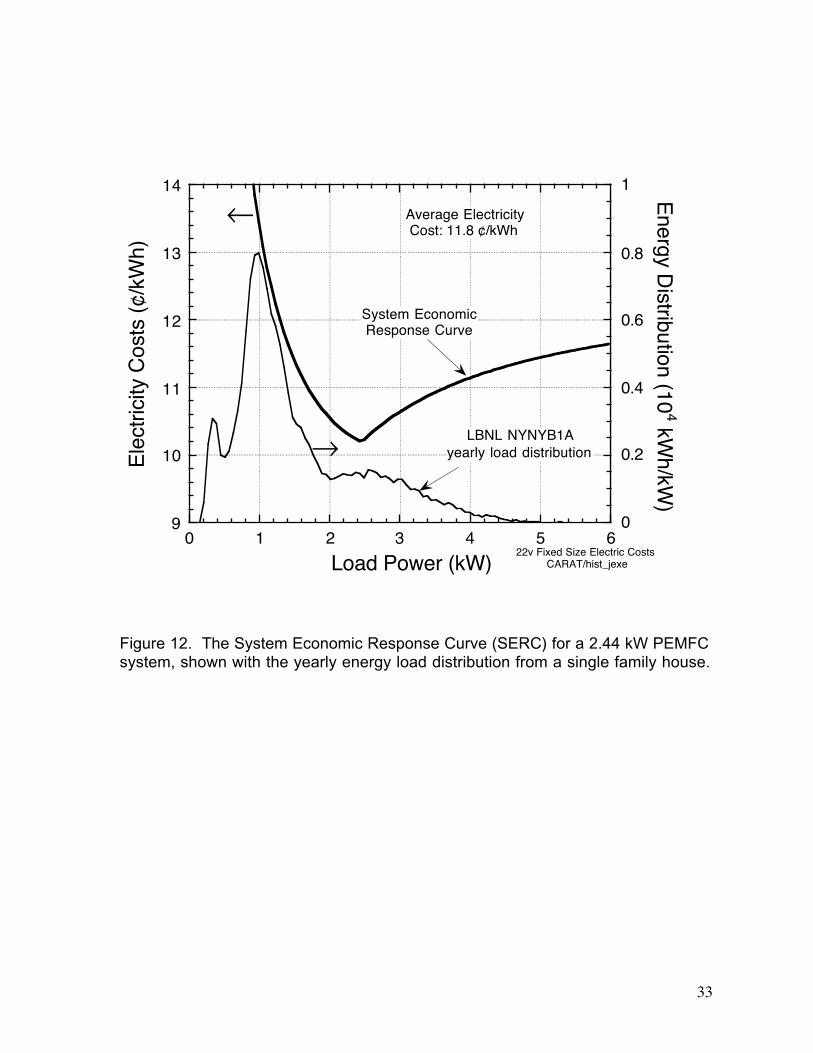
The load energy distribution function in Fig 11 is seen to be roughly bi-modal. The wide“spike” centered at ~1 kW (the yearly average power) is due primarily to non-HVAC “plug”loads. The broad hump from 1.5-4 kW is largely due to air conditioning (AC) electric loadsthat occur each day in the summer months. Note in the yearly load distributions shown belowin Fig. 12, the AC hump is somewhat diminished relative to the plug load peak at 1 kW.
The System Economic Response Curve
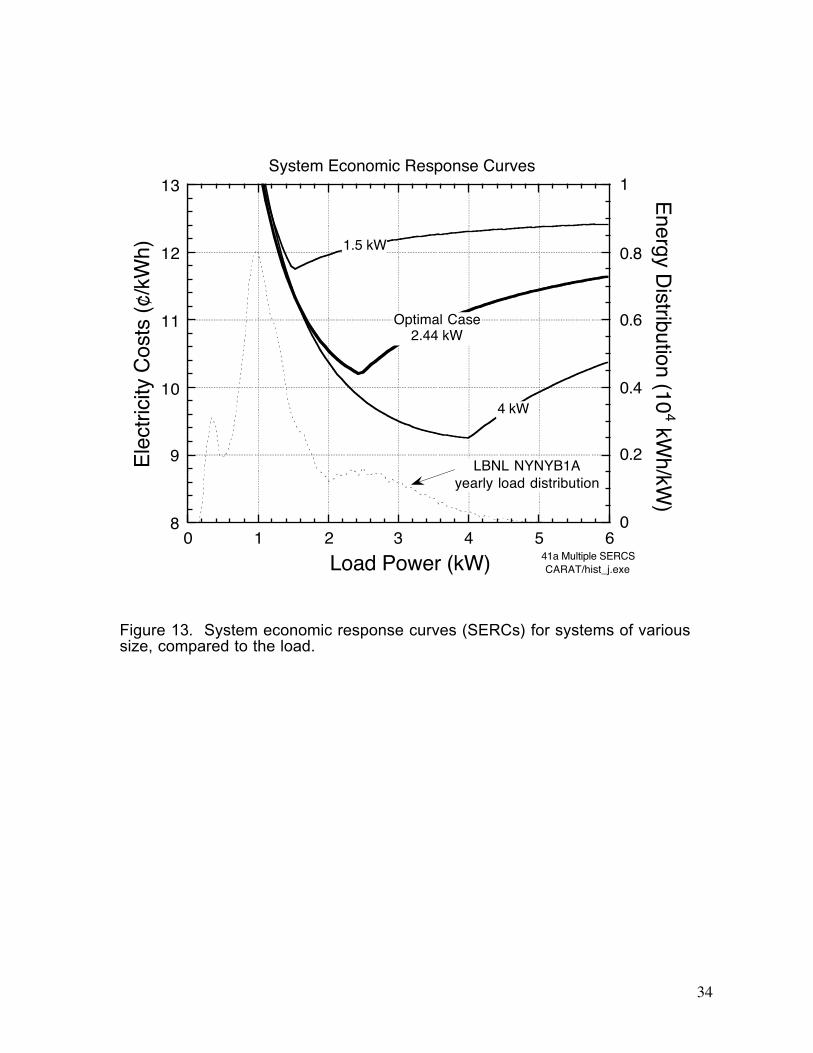
The System Economic Response Curve (or “SERC”) is defined as the cost of electricity froma PEMFC system with capacity Pmax (kW) when it is operated a constant output P, where P >Pmax/TDR . As P is varied, the cost of electricity goes through a minimum value at aboutP=Pmax. (At low values of P (P<Pmax), the fuel cell capacity is not fully utilized, so that thecapital cost contribution is large. At high values of P, (P>Pmax), expensive electricity must bepurchased from the grid, so that the SERC increases.
The SERC can be expressed mathematically in the fuel cell’s operating range (Pmax /TDR<P< Pmax) as:
SERC (P) = CRF CPV(Pmax)/( P A 8760 h/y) + Rf/ηsys(P) x 0.00341 MBTU/kWh
where:
SERC(P) = levelized cost of electricity ($/kWh) from a PEMFC system with powercapacity Pmax, operated at constant power output P.
P = constant electrical power output of system kW
CRF = capital recovery factor = 1/[1-(1+d)-Y]
d= real discount rate

13
Y = system lifetime in years
CPV(Pmax) = present value of installed cost of system plus replacement of components(see Table 2)
A = availability of system
Rf = price of natural gas in $/MBTU
ηsys (P) = ηFC(P) ηFP ηPC, where ηFC(P) is taken from Figure 3.
When P> Pmax, a term is added to reflect the cost of buying electricity from the grid. When P<
Pmax /TDR, electricity is sold back to the grid yielding a credit.
For different sized fuel cell systems, the SERC changes as shown in Figure 13. It is importantto note that the SERC is independent of the building load.
Estimating the Cost of Electricity
The cost of electricity R for a PEMFC system meeting a particular load is found bymultiplying the energy load profile L(P) times the SERC and integrating over P.
R ≡ ∫1
EP L P dP
load
SERC( ) ( ) .
This is formally equivalent to, but computationally much simpler than conducting the analysisby integrating over time, and gives an intuitive way to size the system for lowest cost for aparticular load profile. The idea is to overlap the lowest cost part of the SERC with thepeak/bulk of the load distribution to minimize the integral (and therefore the electricity cost).
We have used the SERC method to conduct sensitivity studies to find PEMFC system size thatyields the minimum electricity cost to meet a particular load (or alternatively, gives the bestinternal rate of return for investing in a PEMFC system).
Sensitivity Studies
Sensitivity of Electricity Cost to System Size
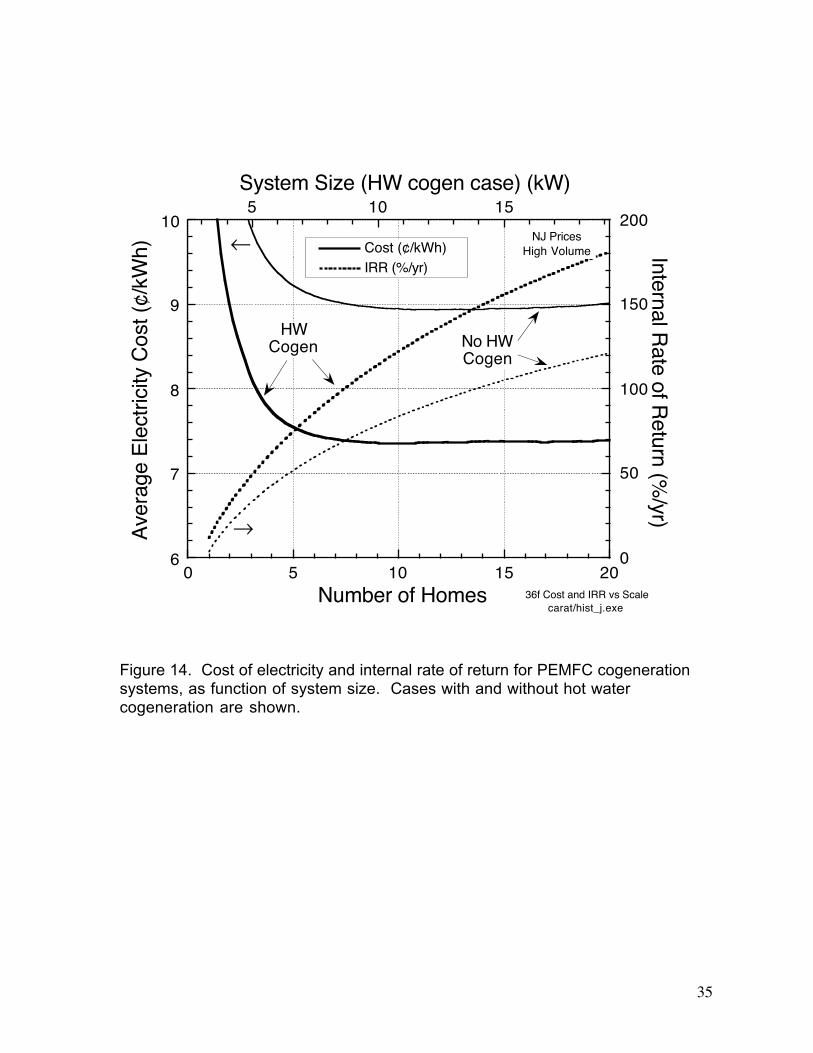
We have used the SERC method to find optimized PEMFC systems designed to meet loadsranging in size from one household to 20 households. In Figure 14, the cost of electricity andthe internal rate of return are plotted versus the number of single family homes served.
System scale is seen to have a tremendous impact upon the system economics. The strongdependence of electricity cost on system size is mostly due to the strong scale economies in thecapital cost of PEMFC cogeneration systems (see Figure 7).
For example (Figure 14), without cogeneration, the electricity cost for a 2.6 kW systempowering a single New Jersey residence is as high as 13.2 ¢/kWh, while a 22 kW system for20 homes is less than 9.0 ¢/kWh. Over this same change of scale (from 1 to 20), the internal
14
rate of return rises from 3.6%/yr to 121%/yr! Despite the favorable economic climate - NewJersey has energy rates that are extremely conducive to residential power generation (naturalgas: 6.1 $/MMBtu HHV, electricity: 12.7 ¢/kWh) - the single-family system appears to be justbarely viable from an economic standpoint. On the other hand, a 22 kW (half-automotive-scale) PEMFC system that powers multiple homes (or, more likely, a multi-family dwelling)shows great economic promise, with a simple payback times significantly less than a year.
The Effect of Cogeneration
The economics of hot water cogeneration was studies using a time domain analysis thatmonitors the flow of hot water in and out of the hot water tank. Surplus heat is discardedwhile deficit heat is generated by firing the tank’s natural gas burner. The economic effect ofhot water cogeneration is shown in Fig. 14 where optimized (i.e. minimum IRR) values of Rand IRR - with and without cogeneration - are plotted as a function of system scale factor.Cogeneration is seen to add roughly 50% to the rate or return, and lowers the cost ofelectricity by ~1.5 ¢/kWh. It is clearly an attractive option where technically/economicallyfeasible, for example, in a single family house or multi-family apartment building.
The Effect of Energy Prices
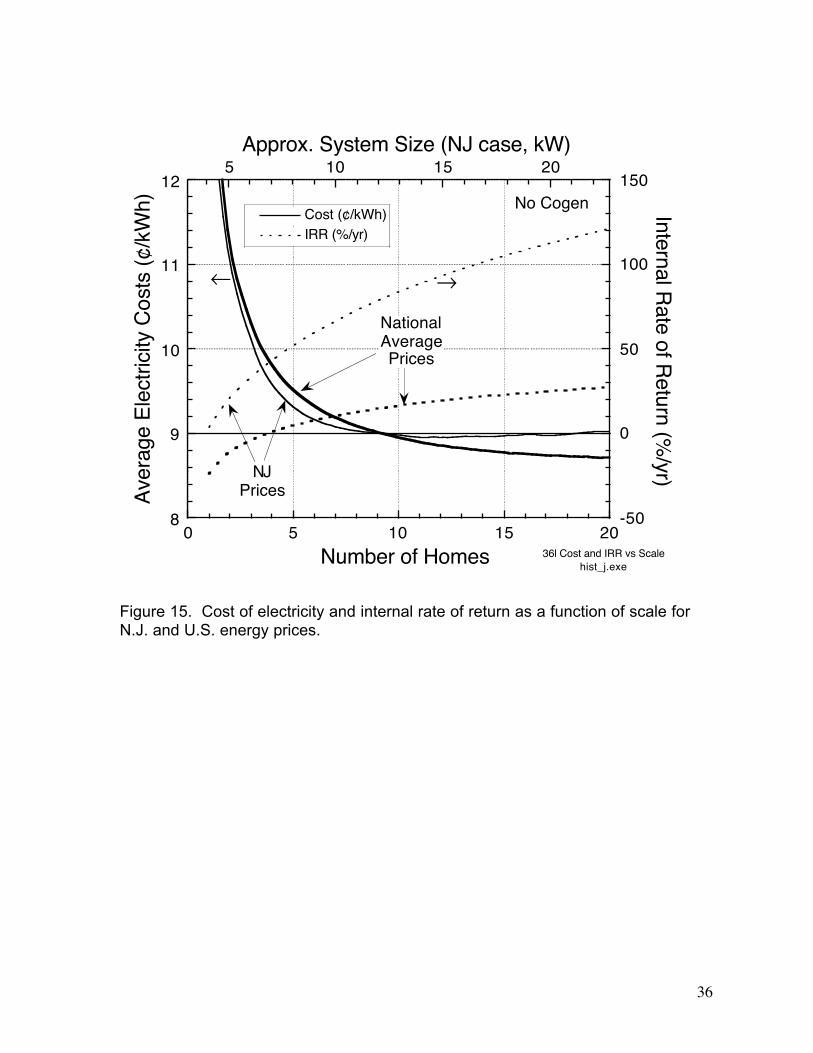
Energy prices have a strong impact on the economic viability of natural gas fired PEMFCsystems. In our base case, we used New Jersey energy prices (which are favorable for naturalgas fired cogeneration because of the high electricity cost and low natural gas cost). Plots ofelectricity cost and IRR are shown in Fig. 15 for average U.S. energy prices (natural gas: 6.6$/MMBtu HHV, electricity: 9.3 ¢/kWh) and for New Jersey prices. While the optimizedelectricity prices are roughly the same over the full range of scales, the rates of return aredramatically different between the two cases. The great disparity in IRR is due to the muchhigher cost of electricity in N.J. which allows the N.J. system to generate ‘revenue’ (bydisplacing purchased power) more rapidly and thus offset the cost of installed capital. At U.S.average gas and electricity prices, the system is not economically viable at any scale.
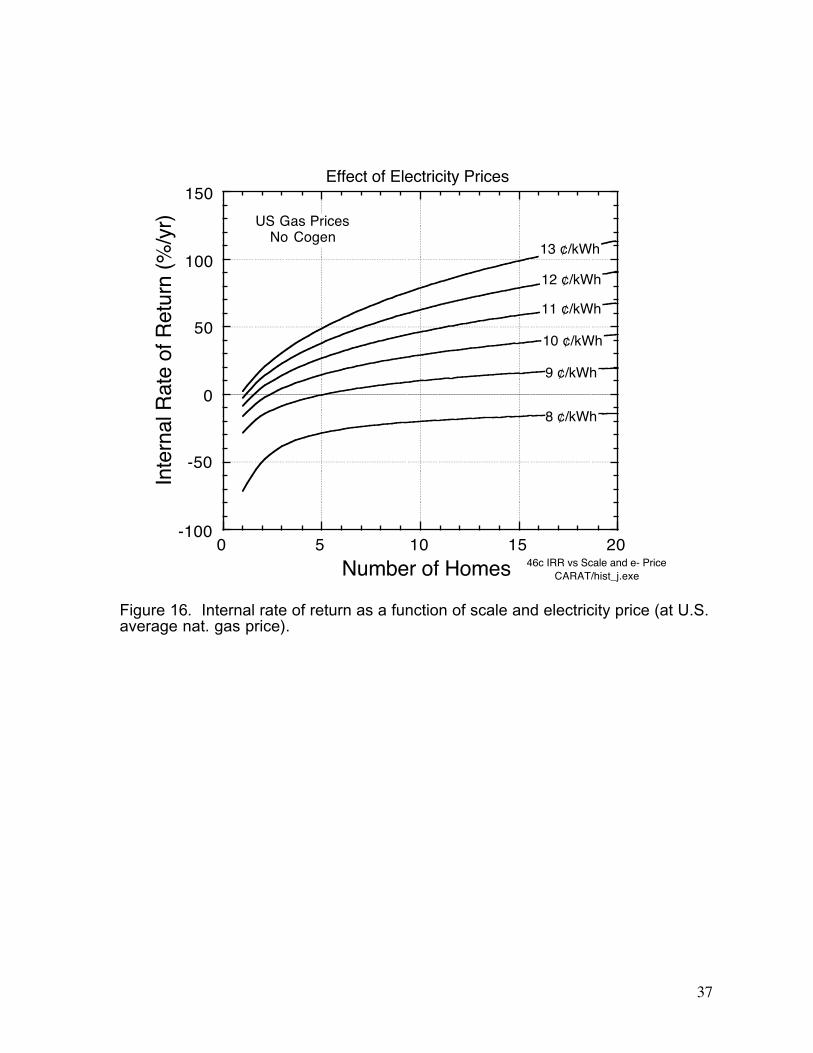
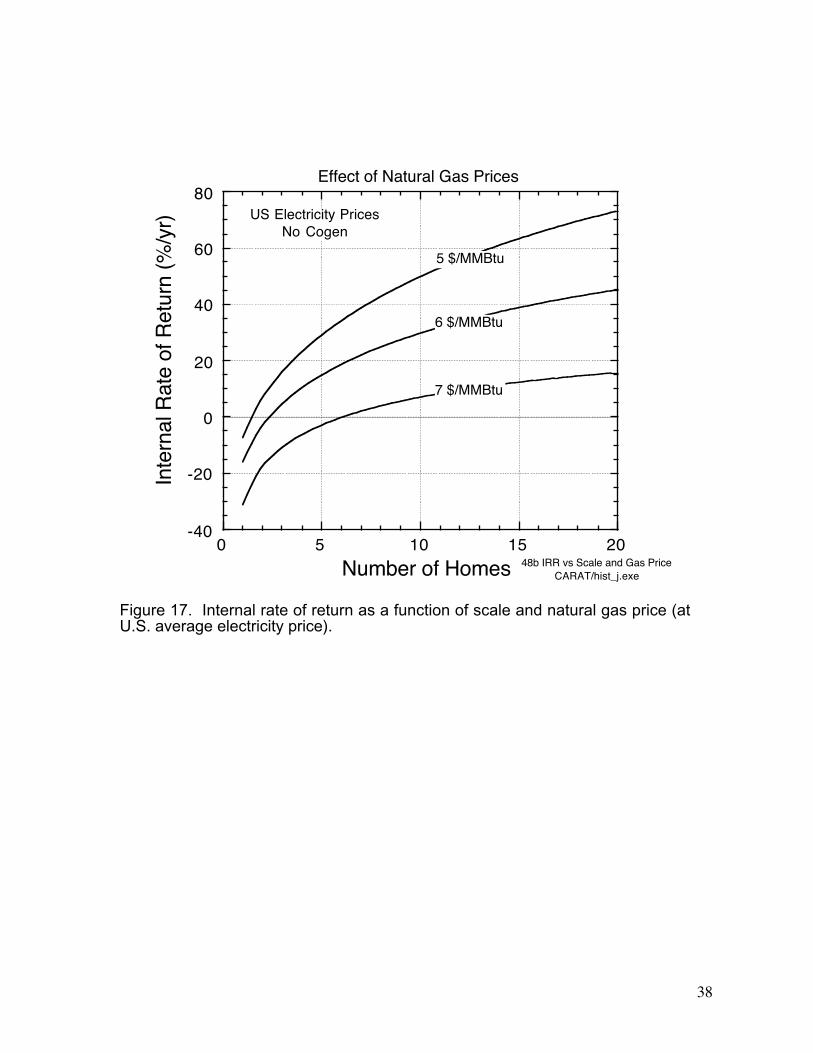
Given the high variability of energy prices throughout the U.S., we plot in Figs 16 and 17 theinternal rate of return as a function of scale, electricity, and natural gas prices. These figuressuggest that the PEMFC cogeneration system in a multiple single-family configuration(without cogeneration) will be viable in regions where: 1) at average U.S. gas prices (6.6$/MMBtu HHV), the electricity price exceeds 9-10 ¢/kWh, and 2).at average U.S. electricityprices (9.3 ¢/kWh), the gas price is below ~7 $/MMBtu HHV.
The Effect of System Capital Cost
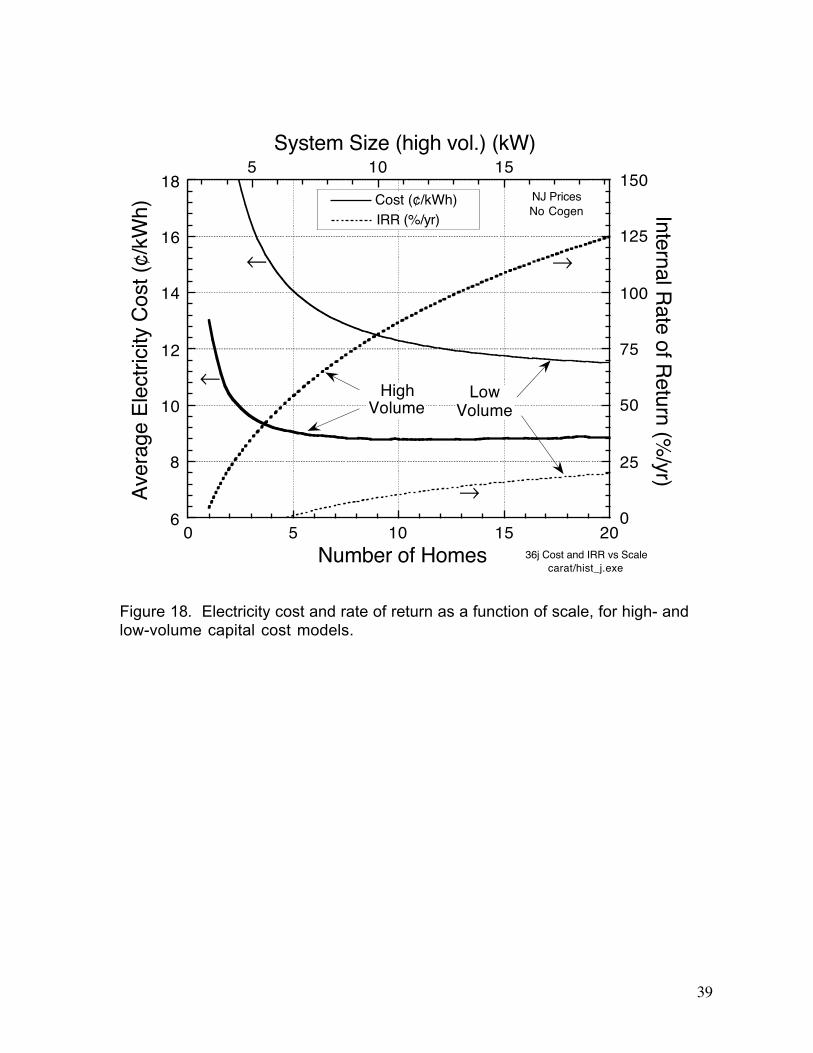
Capital costs plays a critical role in the economics of these systems. In Fig. 18 the optimized(i.e. minimum IRR) values of both R and IRR (without hot water cogeneration) are plotted asa function of system scale factor for both the high and low volume capital cost models. Whilethe high volume model shows economic promise at almost all scales, the low volume systemis economically unfeasible or marginal at all but the largest scale.
15
The Effect of Operational Strategy: Load Follower vs. Non-Load Follower
The SERCs plotted in Fig. 19 suggests that optimal economics are obtained with a system thatis as large as possible yet have an operating range (i.e. P TDRsys
max / to Psysmax ) that overlaps the
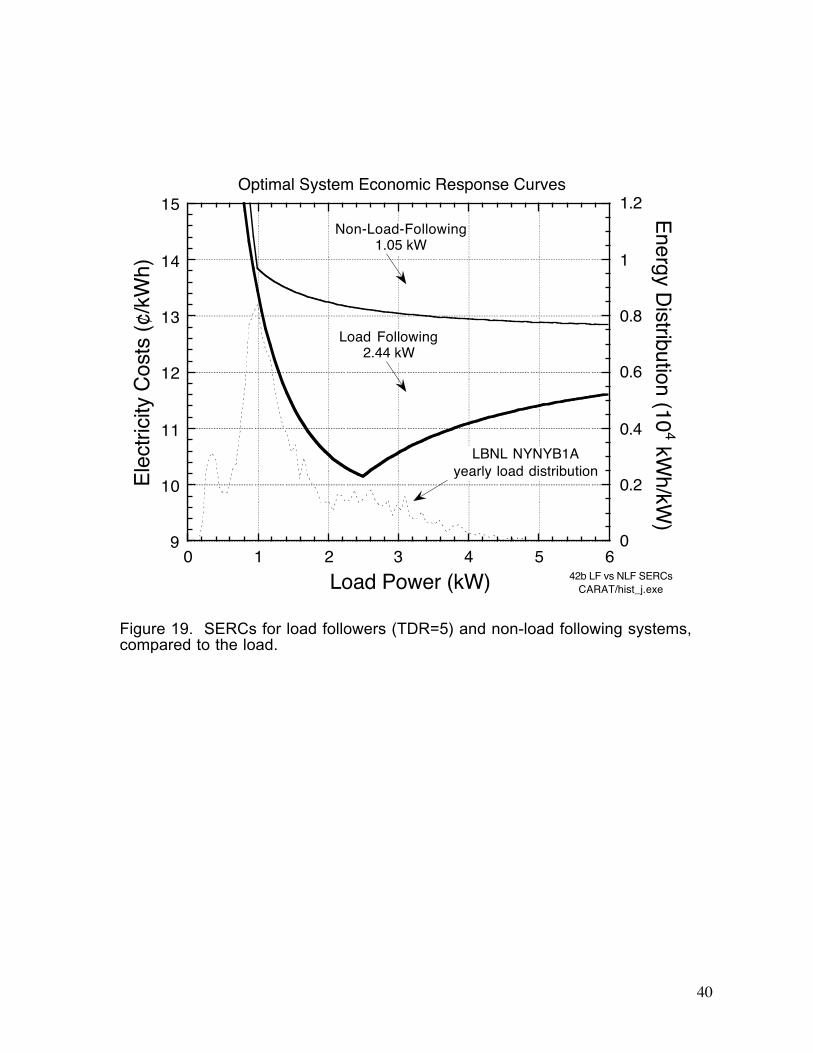
bulk of the load distribution. This minimizes the amount of power that must be either boughtfrom the utility (at a relatively high price) or produced and sold back to the grid at a loss. Forexample, in the optimized base case system (a load follower with a turndown ratio of 5), thegreat bulk of the load falls within the operating range from 2.44/5 kW to 2.44 kW. As theturndown ratio falls and the operating range shrinks (with the limit being a non-load follower,TDR=1), the optimized system size is found to “track” ever more closely the peak of the loaddistribution. This is because the cost of electricity is, in general, minimized when as much ofthe load as possible is generated by the PEMFC system. This is seen clearly in Fig. 19 whereoptimized SERC for both a load follower (TDR=5) and a non-load follower are plotted againstthe load distribution. Note that the non-load follower is optimally sized at 1.05 kW, almostthe peak of the load distribution, and costs ~1.5 ¢/kWh more than the load follower to operate.
PEMFCs versus Microturbines
Since the preceding results illustrate the economic attractiveness of large (e.g. multi-family)PEMFC cogeneration systems relative to single family units, it is appropriate to make acomparison with another emerging advanced technology for distributed electric powergeneration from natural gas: the microturbine. For this brief examination, we employ thepublished performance of the Capstone model 350 microturbine, which produces 27.4 kW ofgrid-quality AC power from natural gas delivered at 5 psig at a LHV energy conversionefficiency of 24.3% [20,21]. Part load performance is calculated using the work ofCampanari [22]; a turndown ratio of 10 is assumed. The power-dependent LHV efficiency ofthe microturbine, ηmic sysP( ), can be expressed as a third order polynomial:
ηmic sys
sc sc sc
P
P P P
( ) . .
( . . ) ,
= + [ +
− + ]0 0608 0 548
0 592 0 226(21)
where P P Psc sys sys≡ / max is the scaled part load power. Installed capital costs are derived fromextremely uncertain cost projections from Capstone and Allied Signal: $7500+300 $/kW [23].
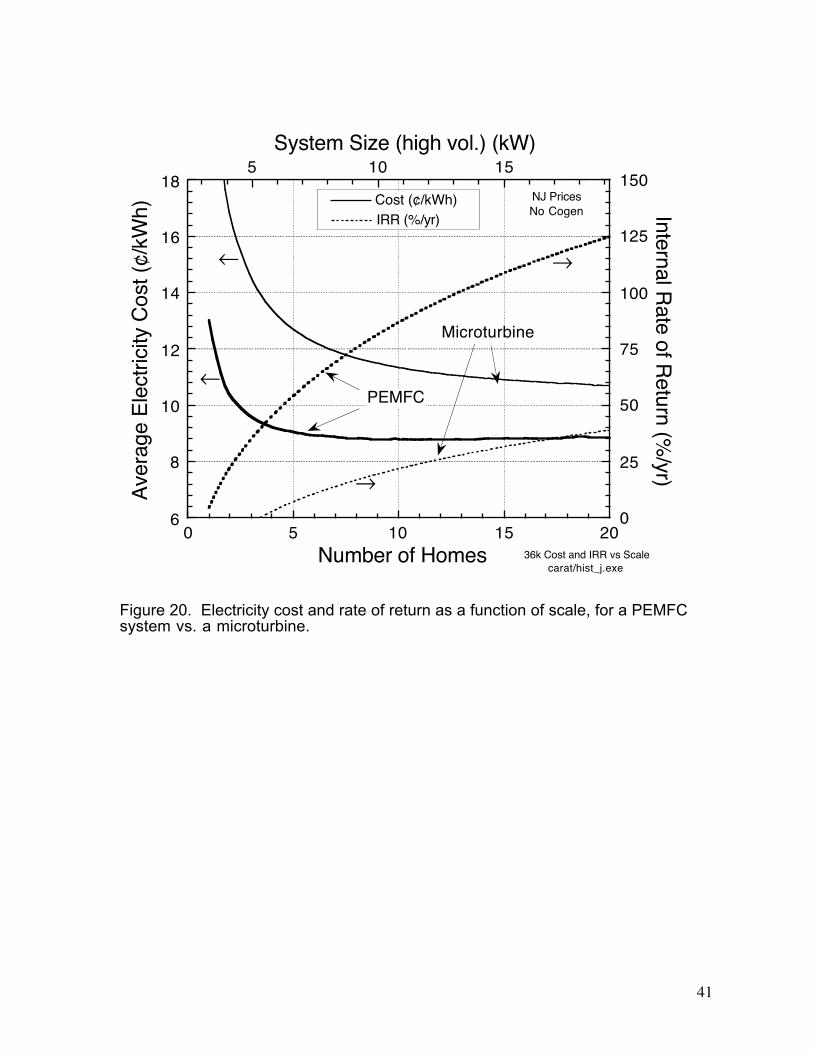
Microturbine system economics are compared to PEMFCs in Fig. 20. It can be seen that,even with aggressive and highly uncertain cost projections for the microturbine, the economicsare less promising than that of the PEMFC system.
Summary of ResultsResults to Date
We have determined that the most favorable configuration for PEMFC cogeneration systemsin residential buildings has the following characteristics :
a load follower with a large (>5) turndown ratio,
the fuel processor used a steam methane reformer,
16
hot water cogeneration from PEMFC stack waste heat was economically attractive,
Scale is fund to be crucially important for good economics. Our results indicate that, evenwith high volume (automotive-scale) cost assumptions and extremely favorable gas-to-electricity price ratios, PEMFC systems are likely to be only marginally attractive on the scaleof a single-family residence. In contrast, multi-family units (above ~ 10 kW) appear to beeconomically extremely attractive, even when using less than optimal (e.g. national average)gas-to-electricity price ratios. Hence, in our initial economic modeling, there appears to be apotentially significant market for multi-family scale PEMFC cogeneration systems.
In typical residences, the domestic hot water demand is well correlated with the electric load,and also well matched - both in terms of magnitude and temperature - to the supply of wasteheat from the fuel cell stack. Our preliminary analysis has shown that hot water cogenerationis an inexpensive option that lowers the cost of electricity by roughly 1.5 ¢/kWh.Cogeneration for space heating, on the other hand, does not appear to be economically viable.
Energy prices have a strong effect on the economic attractiveness of residential PEMFCcogeneration systems. At average US electricity and gas prices, the rates of return areeconomically unattractive. However, our calculations suggest that a PEMFC cogenerationsystem in a multiple single-family configuration (without cogeneration) will be viable inregions where: 1) at average U.S. gas prices (6.6 $/MMBtu HHV), the electricity priceexceeds 9-10 ¢/kWh, and 2).at average U.S. electricity prices (9.3 ¢/kWh), the gas price isbelow ~7 $/MMBtu HHV.
Capital costs plays a critical role in the economics of residential PEMFC cogenerationsystems. PEMFC systems must reach low mass produced costs to compete. Our high volumecost model shows economic promise at almost all system scales, the low volume system iseconomically unfeasible or marginal at all but the largest scale.
Comparing PEMFC systems to microturbines, we found a 32% increase in system efficiency(and therefore greenhouse gas benefit), lower criteria pollutant emissions, and potentiallybetter economics. When compared with central station power systems, the overall efficiencywas less favorable. Obtaining hot water and electric power from a PEMFC cogenerationsystem results in a 26% loss in energy efficiency compared with traditional hot watergeneration and electricity generation using modern natural gas-fired GTCC. It does offer thepotential for reduced emissions of criteria pollutants, but precludes carbon sequestration.
The overall economic viability shows strong dependence on system size. A small (< 5 kW)single-family system unlikely. Multiple single-family system is potentially attractive (especiallywith hot water cogeneration). A system for multiple-family residence could be quite attarctivein markets with high electric/gas price ratios (such as NY, NJ, CA).
We have developed an analytical methodology for calculating PEMFC system economics thatgreatly clarifies the key issue of system sizing as well as dramatically increasingcomputationally efficiency, thereby facilitating multi-parameter system optimization.
Work Plan To Complete This Study
Task 4. Discuss the costs and trade-offs involved in distributing different forms ofenergy to houses (case 1 electricity and heat:, case 2: hydrogen orhydrogen-ruch gas, 3: natural gas
17
Task 6: Understanding the Role of Distributed Benefits
Our analysis thusfar has used a “consumer-driven” model where the decision topurchase a PEMFC power system is based on the expectation of long term savings, not unlikethe decision to invest in a more efficient but more expensive appliance (such as a furnace,water heater, refrigerator, etc.). An important alternative model is a “utility-driven” strategy inwhich the public utility owns, locates, and operates these distributed power systems in orderto offset the local load, thereby either avoiding (or delaying) having to upgrade thetransmission system or, in sparsely populated areas, avoiding constructing a transmission gridaltogether. In future work (Task 6) we will address how the newly deregulated energy marketmight accommodate (and be perturbed by) the introduction of PEMFC-based residential powersystems. In some markets, such systems could forestall the electric utility from having tobuild additional generation and distribution capacity, thus perhaps qualifying for “credits” fordistributed power generation.
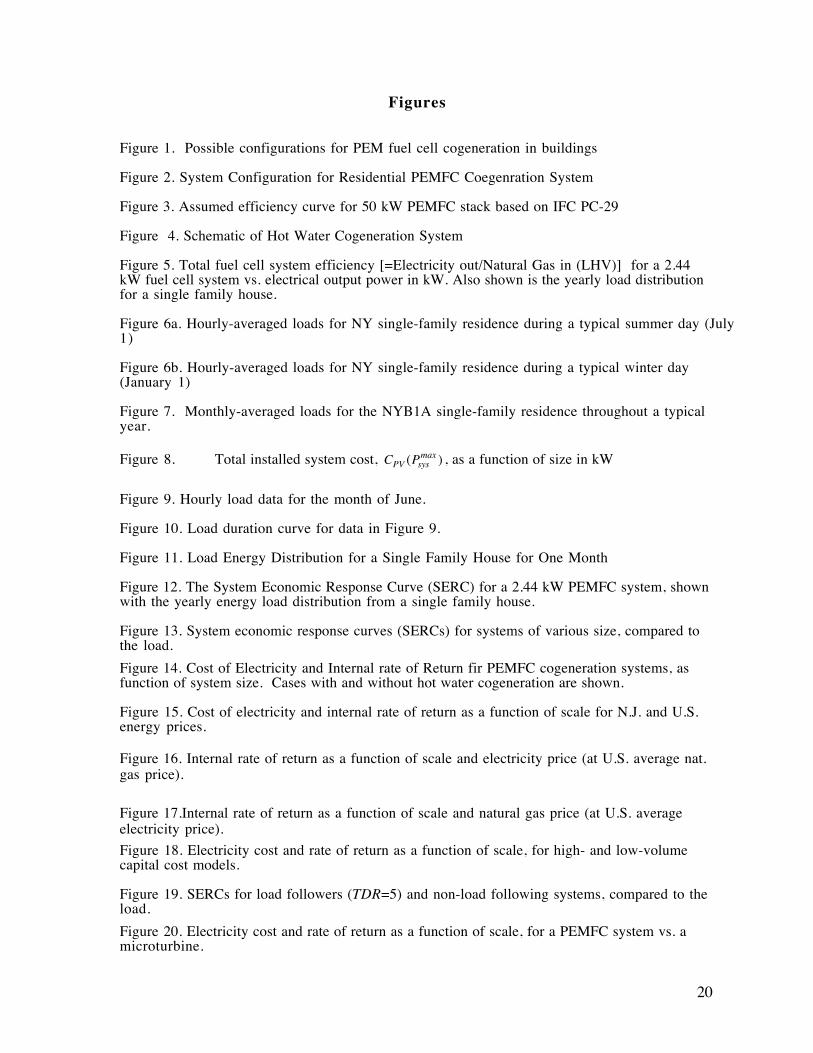
Publications and PresentationsPast Results
Since 1986, researchers at Princeton University's Center for Energy and EnvironmentalStudies have carried out technical and economic assessments of hydrogen energy systems.We have published numerous papers on: assessments of renewable hydrogen energysystems, use of hydrogen from natural gas as a transition strategy, studies of hydrogeninfrastructure (including case studies of hydrogen refueling infrastructure in California andNew York), studies of hydrogen as a fuel for fuel cell vehicles, and studies of the implicationsof CO2 sequestration for hydrogen energy. Our approach is to assess the entire hydrogenenergy system from production through end-use from several perspectives (fuel producer,consumer, society) considering technical performance, economics (e.g. capital cost, deliveredhydrogen cost, cost of energy services), infrastructure, environmental and resource issues.The long term goal of our work is to illuminate possible pathways leading from presenthydrogen markets and technologies toward wide scale use of hydrogen as an energy carrier,highlighting important technologies for RD&D. This work has been part of the systemsanalysis activity of the DOE Hydrogen Program since 1991.
Current Year Publications and Presentations
Over the past year (January 1999-May 2000), several papers based on our DOE sponsoredwork on hydrogen infrastructure and fuel cell system modeling have been published in peerreviewed journals. In addition, we have written several general review articles on hydrogen.These include:
J. Ogden, "Developing a Refueling Infrastructure for Hydrogen Vehicles: A SouthernCalifornia Case Study," International Journal of Hydrogen Energy, vol. 24, pp. 709-730, 1999.
18
J. Ogden, M. Steinbugler and T. Kreutz, "A Comparison of Hydrogen, Methanol andGasoline as Fuels for Fuel Cell Vehicles," Journal of Power Sources, vol. 79, pp.143-168, 1999.
J. Ogden, 1999, “Prospects for Building a Hydrogen Energy Infrastructure,” AnnualReview of Energy and the Environment, Vol. 24, pp. 227-279.
J. Ogden, T. Kreutz and M. Steinbugler, "Fuels for Fuel Cell Vehicles," Fuel CellsBulletin, Elsevier Advanced Technology, January 2000. p. 5-13.
We presented talks on our work on Hydrogen Energy Systems and CO2 Sequestration at the10th National Hydrogen Association Meeting (April 1999), and on our work on PEMFCsystems for residential cogeneration at the 11th National Hydrogen Association meeting(March 2000).
J. Ogden, “Strategies for Developing Low-Emission Hydrogen Energy Systems:Implications of CO2 Sequestration,” Proceedings of the 10th National HydrogenAssociation Meeting, Arlington, VA, April 7-9, 1999.
T. Kreutz and J, Ogden, “Assessment of PEM Fuel Cells for Residential CogenerationApplications,” Proceedings of the 11th National Hydrogen Association Meeting,Arlington, VA, February 29-March 2, 2000, pp. 303-324.
We have also given invited talks on hydrogen infrastructure to the LERDWG group (a groupof energy R&D leaders at the National Laboratories) in November 1999, to the EnergyFrontiers International meeting in January 2000 (to a group of oil and gas industry leaders inalternative fuels development) and at the IQPC Fuel Cells Infrastructure Meeting in December1999 (to a group of energy and chemical industry engineers). In addition, we participated inthe DOE/California Energy Commission, California Air Resources Board Workshop onHydrogen Infrastructure (October 1999). I have been an invited speaker at the June 1999Department of Transportation Meeting on the Spirit of Innovation in Transportation and theApril 2000 American Physical Society Meeting, speaking on future roles for hydrogen andfuel cells in transportation.
Plans for Future Work (beyond this contract)
During the next year we propose to carry out technical and economic assessments of advancedfossil to hydrogen systems with co-production of electricity and CO2 sequestration. Theobjective of the proposed work is to understand the implications of new process technologiesfor reducing the cost of fossil-derived hydrogen with CO2 sequestration and co-production ofelectricity.
Acknowledgments
For useful conversations, the authors would like to thank Jeff Chen (Plug Power, LLC.),James Cross (Epyx), Pete Fonda-Bonardi, (Meruit, Inc.), Mark Haug (Trace Technologies),Joe Huang (Lawrence Berkeley National Laboratory), Joseph Iannucci (Distributed Utilities,Assoc.), Brian James (Directed Technologies, Inc.), Ryan Katofsky (Arthur D. Little ), Lyle

19
Rawlings (FIRST, Inc.), Chris Larsen (North Carolina Solar Center), Colleen Mathis (BallardGeneration Systems), Al Meyer (International Fuel Cells), Jessica Reinkingh (JohnsonMatthey), Richard Root Woods (Hydrogen Burner Technology), Nick Vanderborgh (LosAlamos National Laboratory), Sandy Thomas (Directed Technologies, Inc.) Brian Wells(Ballard Power Systems), and Robert Williams (Princeton University).
20
Figures
Figure 1. Possible configurations for PEM fuel cell cogeneration in buildings
Figure 2. System Configuration for Residential PEMFC Coegenration System
Figure 3. Assumed efficiency curve for 50 kW PEMFC stack based on IFC PC-29
Figure 4. Schematic of Hot Water Cogeneration System
Figure 5. Total fuel cell system efficiency [=Electricity out/Natural Gas in (LHV)] for a 2.44kW fuel cell system vs. electrical output power in kW. Also shown is the yearly load distributionfor a single family house.
Figure 6a. Hourly-averaged loads for NY single-family residence during a typical summer day (July1)
Figure 6b. Hourly-averaged loads for NY single-family residence during a typical winter day(January 1)
Figure 7. Monthly-averaged loads for the NYB1A single-family residence throughout a typicalyear.
Figure 8. Total installed system cost, C PPV sys( )max , as a function of size in kW
Figure 9. Hourly load data for the month of June.
Figure 10. Load duration curve for data in Figure 9.
Figure 11. Load Energy Distribution for a Single Family House for One Month
Figure 12. The System Economic Response Curve (SERC) for a 2.44 kW PEMFC system, shownwith the yearly energy load distribution from a single family house.
Figure 13. System economic response curves (SERCs) for systems of various size, compared tothe load.
Figure 14. Cost of Electricity and Internal rate of Return fir PEMFC cogeneration systems, asfunction of system size. Cases with and without hot water cogeneration are shown.
Figure 15. Cost of electricity and internal rate of return as a function of scale for N.J. and U.S.energy prices.
Figure 16. Internal rate of return as a function of scale and electricity price (at U.S. average nat.gas price).
Figure 17.Internal rate of return as a function of scale and natural gas price (at U.S. averageelectricity price).
Figure 18. Electricity cost and rate of return as a function of scale, for high- and low-volumecapital cost models.
Figure 19. SERCs for load followers (TDR=5) and non-load following systems, compared to theload.
Figure 20. Electricity cost and rate of return as a function of scale, for a PEMFC system vs. amicroturbine.
21
Residential UsersElec
PEMFCReformer
Nat Gas
H2 Rich Gas
+ Heat
CASE 1
Residential Users
Reformer
Nat Gas
H2 Rich Gas
CASE 2
PEMFC
PEMFC
PEMFC
PEMFC
Residential Users
Nat Gas
CASE 3
H2 Rich Gas
PEMFCReformer
PEMFCReformer
PEMFCReformer
PEMFCReformer
FIGURE 1. CONFIGURATIONS FOR PEMFC COGENERATION FOR RESIDENTIAL USERS
22
Natural Gas,Water
CO + H2(+ CO2, H2O)
High, & Low TempShift Reactors
PreferentialOxidation
(PROX) Unit
PEMFuel Cell
AnodeCathode
~75% H2+ ppm CO
(+ CO2, H2O, N2)
H2-rich AnodeExhaust
Air
H2+ ~0.5% CO
(+ CO2, H2O)
AirBlower
Heat
Water
SteamReformer
Burner
BatterySub-System(Optional)
ToResidential
Load
Natural Gas
SteamGenerator
Cogen
Air
Exhaust
CogenHeat
Air
DC →ACPower
Electronics
Figure 2. System Configuration for Residential PEMFCCogeneration System
23
0
0.1
0.2
0.3
0.4
0.5
0.6
0.7
0.8
0 10 20 30 40 50
Gross EfficiencyNet EfficiencyFuel Cell ModelCogen (heat) Model
Effi
cien
cy (
LHV
)
Net AC Power Output (kW) 37b PC-29 EfficiencyIFC Atm Stack Plot 9
IFC PC-29 Atmospheric PEMFC Stack(pure hydrogen vs. air)
Figure 3. Assumed efficiency curve for 50 kW PEMFC stack based on IFC PC-29.
24
PEMFCStack
80 C
11 C
70 C
Water
70 C
60 C
HWTank
To Drain
HWLoad
60 C
Coolant Loop
Reformate
CoolantPump
80 C
Air15 C
CathodeExhaust
AnodeExhaust
80 C
Figure 4. Schematic of Hot Water Cogeneration System.
25
0
10
20
30
40
0
2
4
6
8
0 1 2 3 4 5
Sys
tem
Effi
cien
cy (
LHV
,%)
Energy D
istribution (103 kW
h/kW)
Electrical Output (kW) 16h System Effic. + HistogramsCARAT/hist_j.exe
→
System Efficiency
LBNL NYNYB1Ayearly load distribution
→
Max OutputPower
System Efficiency vs Load
Figure 5. Total fuel cell system efficiency [=Electricity out/Natural Gas in (LHV)] fora 2.44 kW fuel cell system vs. electrical output power in kW. Also shown is theyearly load distribution for a single family house.
26
0
1
2
3
4
5
0 4 8 12 16 20 24
Hou
rly L
oad
(kW
)
Time (hr) 31a Various LBL LoadsLBNL NYNYB1A
TotalElectric
HVAConly
HotWater
Non-HVAC
July 1NYNYB1A
Single Summer Day Load
Figure 6a. Hourly-averaged loads for NY single-family residence during a typicalsummer day (July 1).
27
0
2
4
6
8
10
12
0 4 8 12 16 20 24
Hou
rly L
oad
(kW
)
Time (hr) 31d Various LBL LoadsLBNL NYNYB1A
TotalElectric
HVAConly
HotWater
Non-HVAC
SpaceHeating
January 1NYNYB1A
Single Winter Day Load
Figure 6b. Hourly-averaged loads for the NYB1A single-family residence during atypical winter day (January 1).
28
0
1000
2000
3000
4000
5000
0 3 6 9 12
Mon
thly
Loa
d (k
Wh)
Month 31e Various LBL LoadsLBNL NYNYB1A
TotalElectric
SpaceCooling
HotWater
Non-HVAC
Monthly Average Loads; NYNYB1A
SpaceHeating
Figure 7. Monthly-averaged loads for the NYB1A single-family residence throughouta typical year.
29
0
500
1,000
1,500
2,000
2,500
0
10,000
20,000
30,000
40,000
50,000
0 10 20 30 40 50
S/kW
Total Cost ($)
Tot
al S
yste
m C
ost (
$/kW
) Total S
ystem C
ost ($)
System Size (kW)
→
26d System Costs vs Sizecarat/hist_j.exe
→
Low Volume(10,000 Units)
→
→
High Volume
Models of Total Installed System Cost
Figure 8. Total installed system cost, C PPV sys( )max , as a function of system size.
30
0
1
2
3
4
0 100 200 300 400 500 600 700
Hou
rly-A
vera
ged
Ele
ctric
Loa
d (k
W)
Hour 29a Hourly Load Data (June)CARAT/hist_i.exe
LBNL NYNYB1A
June Electric Load
Figure 9. Hourly load data for the month of June.
31
Figure 10. Load duration curve for data in Figure 9.
0
1
2
3
4
0 100 200 300 400 500 600 700
Ele
ctric
Loa
d (k
W)
(Hou
rly-A
vera
ged)
Hour29b Load Duration Curve (June)
CARAT/hist_i.exe
LBNL NYNYB1A
June Load Duration Curve
32
0
200
400
600
800
1000
0 1 2 3 4 5
Ene
rgy
Dis
trib
utio
n (k
Wh/
kW)
Load Power (kW) 30a Load Histogram for JuneCARAT/hist_i.exe
LBNL NYNYB1A
June Electric Load Distribution
Figure 11. Load Energy Distribution for a Single Family House for One Month
33
9
10
11
12
13
14
0
0.2
0.4
0.6
0.8
1
0 1 2 3 4 5 6
Ele
ctric
ity C
osts
(¢/
kWh)
Energy D
istribution (104 kW
h/kW)
Load Power (kW)22v Fixed Size Electric Costs
CARAT/hist_jexe
→
System EconomicResponse Curve
LBNL NYNYB1Ayearly load distribution
→
Average ElectricityCost: 11.8 ¢/kWh
Figure 12. The System Economic Response Curve (SERC) for a 2.44 kW PEMFCsystem, shown with the yearly energy load distribution from a single family house.
34
8
9
10
11
12
13
0
0.2
0.4
0.6
0.8
1
0 1 2 3 4 5 6
Ele
ctric
ity C
osts
(¢/
kWh)
Energy D
istribution (104 kW
h/kW)
Load Power (kW) 41a Multiple SERCSCARAT/hist_j.exe
System Economic Response Curves
LBNL NYNYB1Ayearly load distribution
1.5 kW
Optimal Case2.44 kW
4 kW
Figure 13. System economic response curves (SERCs) for systems of varioussize, compared to the load.
35
6
7
8
9
10
0
50
100
150
200
0 5 10 15 20
Cost (¢/kWh)IRR (%/yr)
5 10 15
Ave
rage
Ele
ctric
ity C
ost (
¢/kW
h) Internal Rate of R
eturn (%/yr)
36f Cost and IRR vs Scalecarat/hist_j.exe
No HWCogen
HWCogen
System Size (HW cogen case) (kW)
Number of Homes
NJ PricesHigh Volume
→
→
Figure 14. Cost of electricity and internal rate of return for PEMFC cogenerationsystems, as function of system size. Cases with and without hot watercogeneration are shown.
36
8
9
10
11
12
-50
0
50
100
150
0 5 10 15 20
Cost (¢/kWh)IRR (%/yr)
5 10 15 20A
vera
ge E
lect
ricity
Cos
ts (
¢/kW
h) Internal Rate of R
eturn (%/yr)
36l Cost and IRR vs Scalehist_j.exe
NJPrices
Number of Homes
NationalAveragePrices
No Cogen
Approx. System Size (NJ case, kW)
→
→
Figure 15. Cost of electricity and internal rate of return as a function of scale forN.J. and U.S. energy prices.
37
-100
-50
0
50
100
150
0 5 10 15 20
Number of Homes 46c IRR vs Scale and e- PriceCARAT/hist_j.exe
Effect of Electricity PricesIn
tern
al R
ate
of R
etur
n (%
/yr) US Gas Prices
No Cogen13 ¢/kWh
12 ¢/kWh
11 ¢/kWh
10 ¢/kWh
9 ¢/kWh
8 ¢/kWh
Figure 16. Internal rate of return as a function of scale and electricity price (at U.S.average nat. gas price).
38
-40
-20
0
20
40
60
80
0 5 10 15 20
Number of Homes 48b IRR vs Scale and Gas PriceCARAT/hist_j.exe
Effect of Natural Gas PricesIn
tern
al R
ate
of R
etur
n (%
/yr) US Electricity Prices
No Cogen
5 $/MMBtu
7 $/MMBtu
6 $/MMBtu
Figure 17. Internal rate of return as a function of scale and natural gas price (atU.S. average electricity price).
39
6
8
10
12
14
16
18
0
25
50
75
100
125
150
0 5 10 15 20
Cost (¢/kWh)IRR (%/yr)
5 10 15
Ave
rage
Ele
ctric
ity C
ost (
¢/kW
h) Internal Rate of R
eturn (%/yr)
36j Cost and IRR vs Scalecarat/hist_j.exe
HighVolume
System Size (high vol.) (kW)
Number of Homes
NJ PricesNo Cogen
→
→
LowVolume
→
→
Figure 18. Electricity cost and rate of return as a function of scale, for high- andlow-volume capital cost models.
40
9
10
11
12
13
14
15
0
0.2
0.4
0.6
0.8
1
1.2
0 1 2 3 4 5 6
Ele
ctric
ity C
osts
(¢/
kWh)
Energy D
istribution (104 kW
h/kW)
Load Power (kW) 42b LF vs NLF SERCsCARAT/hist_j.exe
Optimal System Economic Response Curves
LBNL NYNYB1Ayearly load distribution
Load Following2.44 kW
Non-Load-Following1.05 kW
Figure 19. SERCs for load followers (TDR=5) and non-load following systems,compared to the load.
41
6
8
10
12
14
16
18
0
25
50
75
100
125
150
0 5 10 15 20
Cost (¢/kWh)IRR (%/yr)
5 10 15
Ave
rage
Ele
ctric
ity C
ost (
¢/kW
h) Internal Rate of R
eturn (%/yr)
36k Cost and IRR vs Scalecarat/hist_j.exe
PEMFC
System Size (high vol.) (kW)
Number of Homes
NJ PricesNo Cogen
→
→
Microturbine
→
→
Figure 20. Electricity cost and rate of return as a function of scale, for a PEMFCsystem vs. a microturbine.

42
References
1. Arthur D. Little, “Fuel Cells for Building Cogeneration Applications - Cost/Performance Requirementsand Markets”, for the U.S. Department of Energy Office of Buildings Technologies by Arthur D. Little,Inc., Cambridge, MA, Reference No. 42526, January, 1995.
2. John O’Sullivan, Electric Power Research Institute, personal communication, January, 1998.
3. M. E. Gorman and T. F. Fuller, “50-Kilowatt Ambient Pressure Automotive PEM Fuel Cell and DirectMethanol Fuel Cell Development”, Proceedings of the Annual Automotive Technology DevelopmentCustomer’s Coordination Meeting, DOE-OTT, Dearborn, MI, October 27-30, 1997, pp. 317.
4. Aspen Technology, Inc., Cambridge, MA 02141.
5. T. G. Kreutz and J. M. Ogden, “Development of an Efficient, Low Cost, Small Scale, Natural Gas FuelReformer for Residential-Scale Electric Power Generation”, DOE Contract No. DE-FC02-98EE50534,Final Report, July, 2000.
6. Mark Haug, Trace Technologies Corp., personal communication, Sept. 3, 1999.
7. R. L. Ritschard, J. W. Hanford, and A. O. Sezgen, “Single-Family Heating and Cooling Requirements:Assumptions, Methods, and Summary Results”, Gas Research Institute Report GRI-91/0236, LawrenceBerkeley Laboratory Report LBL-30377, March, 1992.
8. R. L. Ritschard and Y. J. Huang, “MultiFamily Heating and Cooling Requirements: Assumptions,Methods, and Summary Results”, Gas Research Institute Report GRI-88/0239, November, 1989.
9. J. Huang , H. Akbari, L. Rainer, and R. Ritschard, “481 Prototypical Commercial Buildings for 20 UrbanMarket Areas”, Gas Research Institute Report GRI-90/0326, Lawrence Berkeley Laboratory Report LBL-29798, April, 1991.
10. C. E. Thomas, J. P. Barbour, B. D. James, and F. D. Lomax, Jr., “Analysis of Utility Hydrogen Systemsand Hydrogen Airport Ground Support Equipment”, Proceedings of the U.S. DOE Annual HydrogenProgram Review, Golden, CO, May 6, 1999.
11. B. D. James, F. D. Lomax, Jr., and C. E. Thomas, “Manufacturing Cost of Stationary PolymerElectrolyte Membrane (PEM) Fuel Cell Systems”, Report to the National Renewable Energy Laboratory,November, 1999.
12. K. Mitsuda, Y. Gonjo, H. Maeda, and H. Fukumoto, “Development of PEFC Technology at MitsubishiElectric”, Proceedings of the 1998 Fuel Cell Seminar, Palm Springs, CA, Nov. 16-19, 1998, pp. 541.
13. B. D. James, F. D. Lomax, Jr., C. E. Thomas, and W. G. Colella, “PEM Fuel Cell System CostEstimates: Sulfur-Free Gasoline Partial Oxidation and Compressed Direct Hydrogen”, October 17, 1997.
14. F. D. Lomax, Jr. B. D. James, G. N. Baum, and C. E. Thomas, “Detailed Manufacturing Cost Estimatesfor Polymer Electrolyte Membrane (PEM) Fuel Cells for Light Duty Vehicles”, Report to the U.S.Department of Energy ,August, 1998.
15. W. L. Mitchell, J. H. J. Thijssen, J. M. Bentley, and N. J. Marek, “Development of a Catalytic PartialOxidation Ethanol Reformer for Fuel Cell Applications”, SAE Paper No. 952761, The Society ofAutomotive Engineers, 1995.
16. W. P. Teagan, J. Bently, and B. Barnett, “Cost Reductions of Fuel Cells for Transportation Applications:Fuel Processing Options”, Journal of Power Sources, 71(1998) 80-85.
17. F. R. Kalhammer, A. Kozawa, C. B. Moyer, and B. B. Owens, “Performance and Availability of Batteriesfor Electric Vehicles: A Report of the Battery Technical Advisory Panel”, California Air Resources Board,El Monte, CA, December 11, 1995.
18. Plug Power, LLC. press releases; see: http://www.plugpower.com/news/.

43
19. Jeffery Chen, Plug Power, LLC., personal communication, April, 1998.
20. Chris Broshart, Capstone Turbine Corporation, personal communication, July, 1999.
21. Capstone Turbine Corporation, http://www.capstoneturbine.com/.
22. S. Campanari, “Full Load and Part-Load Performance Prediction for Integrated SOFC and MicroturbineSystems”, Proceedings of the International Gas Turbine and Aerospace Congress and Exposition,Indianapolis, IN, June 7-10, 1999.
23. Glenn Murphy, Public Service Gas and Electric Company, personal communication, August, 1999.