Plants and Soil Soil Degradation Addressing Soil Degradation.

Assessment of human and physical factors influencing spatial distribu-tion of vegetation degradation - Environmental Protection Area Cachoeira
das Andorinhas, Brazil
Marise Barreiros Horta March, 2002
Assessment of human and physical factors influencing spatial distribu-tion of vegetation degradation - Environmental Protection Area Ca-
choeira das Andorinhas, Brazil
by
Marise Barreiros Horta Thesis submitted to the International Institute for Aerospace Survey and Earth Sciences in partial ful-filment of the requirements for the degree of Master of Science in Natural Resources Management Degree Assessment Board Name Professor Name Examiners
INTERNATIONAL INSTITUTE FOR GEO-INFORMATION SCIENCE AND EARTH OBSERVATION
ENSCHEDE, THE NETHERLANDS

Disclaimer This document describes work undertaken as part of a programme of study at the International Institute for Geo-Information Science and Earth Observation. All views and opinions expressed therein remain the sole responsibility of the author, and do not necessarily represent those of the institute.
ASSESSMENT OF HUMAN AND PHYSICAL FACTORS INFLUENCING SPATIAL DISTRIBUTION OF VEGETATION DEGRADATION -ENVIRONMENTAL PROTECTION AREA CACHOEIRA DAS ANDORINHAS, BRAZIL
1

ASSESSMENT OF HUMAN AND PHYSICAL FACTORS INFLUENCING SPATIAL DISTRIBUTION OF VEGETATION DEGRADATION -ENVIRONMENTAL PROTECTION AREA CACHOEIRA DAS ANDORINHAS, BRAZIL
2

ASSESSMENT OF HUMAN AND PHYSICAL FACTORS INFLUENCING SPATIAL DISTRIBUTION OF VEGETATION DEGRADATION -ENVIRONMENTAL PROTECTION AREA CACHOEIRA DAS ANDORINHAS, BRAZIL
3
ACKNOWLEDGMENTS
I am very grateful to all the teachers and staff of ITC, for the patient and encouragement in the task of introducing me in the world of pixels, and its amazing applications in ecological issues. I would like also to express my gratitude to the Dutch Government and the Netherlands Fellowship Pro-gram (NFP) for providing me the opportunity to continue my studies. I extend my thanks to Roberto Car-doso, director of AMBIO Geology and Environmental Engineering Company in Brazil, for all the sup-port. I am very thankful that I had the generous and wise supervision of Dr. Wietske Bijker, through the jour-ney of learning and growing during my research. Many thanks to Ir. Edwin Keizer for his excellent super-vision, involvement, encouragement, suggestions, and pleasant friendship. Many special thanks to Prof. Hans ter Steege that provided fundamental critical guidance in statistics. Thank you Dr.Michael Weir, for the comprehension and help during the hard times. Thank you Dr. Robert Albricht and Dr. Iris van Duren, for the openness and unconditional willingness to help. I appreci-ated that. Thank you Dr. Jan de Leew for the important critical advises during mid term evaluation. To the Ilwiss expert …….. , thanks for the tips. To my many colleagues in ITC: my love and gratitude. It was a pleasure to be part of this multicultural environment. My special thanks to José Santos for the immeasurable help, support, care, present during times of laughs, tears and fears. My friends Alejandra Fregoso and Valéria Gonçalves, you are in my heart girls. In Brazil there are several people and organisations that I would like to thanks, and without them this re-search would not be possible. I would like to thanks to Aristides Guimarães Neto from the State Forestry Institute (IEF) for the logistics support, assistance in the field, suggestions and friendship. To the IEF, my gratitude for the interest and support. Many thanks to fieldwork assistants: Paulo, Walmir and Jorge. My deepest appreciation to all the team of Geoinformatics Division in FEAM (State Foundation for Environ-mental Control) for the provision of the Landsat TM image 2000 used during the research and many other maps. My thanks to the directors Luiz Fernando Assis and Adriano Macedo. Special thanks to Regina Camargos, Bernadete Barros and Ivana Lamas for inspiring me to take this challenge. Much gratitude to you Polynice Rabello, for providing all the maps and sharing immeasurable helpful emails. My thanks extend to IBAMA, CETEC and CPTEC for providing image and maps. From UFOP (Federal University of Ouro Preto) I would like to thanks my friend and colleague Hildeberto Caldas and the herbarium cura-

ASSESSMENT OF HUMAN AND PHYSICAL FACTORS INFLUENCING SPATIAL DISTRIBUTION OF VEGETATION DEGRADATION -ENVIRONMENTAL PROTECTION AREA CACHOEIRA DAS ANDORINHAS, BRAZIL
4
tor Maria Cristina Messias. In São Bartolomeu my thanks to Ronald de Carvalho (Manuelzão Project) and Mrs. Serma Fortes. Finally, I am in debt with my mother, father, sister and brothers, for the loving support and encourage-ment. I extend my thanks to my family in New York (Brown family and Capoeiristas) for the support, encouragement, care and love.
ABSTRACT
Most of the investigation of factors influencing vegetation degradation in the spatial context has been di-rected at arid landscapes or at degradation of temperate and tropical forests. This study examined the influence of human and physical factors in the spatial distribution of vegetation degradation in the Environmental Protection Area Cachoeira das Andorinhas (Brazil), characterized by subtropical moderately humid climate. The degradation affects forest, savannah and rocky shrublands formations. Remote Sensing, Geographic Information Systems (GIS) and statistical analysis techniques were used together with field data collection. Landsat TM image, topographic map, DEM and secondary data were used for generation of maps of the human and physical factors examined. Those factors comprised: dis-tance to the roads, distance to rural settlements/village/city, distance to tourist sites, distance to mining sites, distance to agricultural areas, distance to the drainage, slope and geology. The diagnosis of vegeta-tion degradation variations was made with utilization of five ecological indicators: invasive species cover, understory cover, canopy cover, bare soil cover and dead shrub percentage. The total of 47 sample plots was classified according to vegetation degradation variations. Principal Component Analysis was per-formed for generation of scores that represented numerically the levels of vegetation degradation. Regres-sion analysis was used to investigate the relationship between vegetation degradation and human and physical factors, and to select significant variables, used in the assessment of areas at risk of vegetation degradation. The factors slope and distance to tourist sites presented significantly negatively correlated to the vegeta-tion degradation in forest and savannah /rocky shrublands formations, respectively. The assessment of areas at risk of vegetation degradation was based on those factors that represented 20% and 19% respec-tively of the variability of the vegetation degradation variations in the area. The spatial variations of vege-tation degradation were mapped for the extremely degraded forest areas (scrub). The factors slope and distance to tourist sites can enhance accessibility of humans and livestock to natural vegetation areas, which may increase intensity of damaging activities in areas of lower slope and shorter distance to tourist sites. The low significance of the factors used to assess areas at risk of vegetation deg-radation suggested limitations for further use of the information. The possibility of mapping spatial distri-
ASSESSMENT OF HUMAN AND PHYSICAL FACTORS INFLUENCING SPATIAL DISTRIBUTION OF VEGETATION DEGRADATION -ENVIRONMENTAL PROTECTION AREA CACHOEIRA DAS ANDORINHAS, BRAZIL
5
bution of vegetation degradation only for extremely degraded areas suggested limitations of using remote sensing techniques (Landsat TM imagery) to detect the degradation process when considering one snap-shot in time, few undisturbed situations and lower levels of degradation. The information can contribute to improvements in conservation management strategies in the protection area, but the low influence of the factors in the overall vegetation degradation process has to be consid-ered.
CHAPTER1. INTRODUCTION
1.1. Introduction
Human induced chronic disturbance has been referred as one of the major causes of vegetation degrada-tion in developing countries (Singh 1998). At the global level, socio-economic and political forces that determine the mode of development in many developing countries play an important role in the processes of vegetation degradation and destruction (Mather 1992). At the national and local levels, forest degrada-tion has been suggested to be linked to rural population pressure, through subsistence farming, grazing, and selective wood extraction, and as a result of large-scale development projects (World Resources Insti-tute 1996). Vegetation degradation is defined as the deterioration of the healthy conditions of the vegetation, ex-pressed through changes in its composition, structure and function (Kakembo 2001;TCM 1998). The global assessment of forest conditions comprehends some standard measurement, that include (World Resources Institute 1996): • the degree of degradation, or the extent of fragmentation and biomass removal • the degree of naturalness, or the extent to which recent human activity has modified forest structure
and species composition • the intensity of forest management • the relative health of the tree species within a forest
Vegetation degradation, unlike deforestation, is not a very obvious phenomenon. The changes are re-vealed gradually, sometimes not in terms of decrease of area, but represented by qualitative losses, for example, through the reduction of species diversity, increase of invasive species, decrease of the shrub layer, reduction of woody species and biomass decline (TCM 1998, Hargyono 1993). For that reason, the condition of the world’s forest and vegetation has not been assessed comprehensively since degradation, naturalness, and health is difficult to quantify on a regional or global scale. Despite
ASSESSMENT OF HUMAN AND PHYSICAL FACTORS INFLUENCING SPATIAL DISTRIBUTION OF VEGETATION DEGRADATION -ENVIRONMENTAL PROTECTION AREA CACHOEIRA DAS ANDORINHAS, BRAZIL
6
that, forest degradation is a significant concern due to the substantial losses of biomass and habitat frag-mentation, not reflected in deforestation estimates (World Resources Institute 1996). Some authors investigated factors influencing vegetation degradation in the spatial and temporal context. Kakembo (2001) investigated the trends in vegetation degradation in relation to land tenure, rainfall and population changes in South Africa. The study revealed land tenure as the main controlling factor to the spatial and temporal variations in vegetation degradation in the area. De Pietri (1995) examined the spa-tial configuration of vegetation as an indicator of landscape degradation due to livestock enterprises in Argentina, and developed an index for detection of significant changes in the spatial configuration of plant communities. De Hier and Hussin (1993) refined the Area Production Model (APM), originally de-veloped by Nilsson in the early 1980s. The model makes use of the factors population growth, gross do-mestic product (GDP) and agriculture productivity to predict the amount of land that might be transferred from forest and other land uses, to agriculture. Mather (1992) emphasized the influence of some proximate factors in the processes of deforestation and forest degradation: roads network, that increases accessibility, and slope steepness, found usually in-versely related to the cited processes. According to the author, those factors represent a physical expres-sion to some underlying structural driving forces, such as demographic and political factors. Most of the vegetation degradation research has been directed at arid landscapes associated with land degradation, desertification and soil erosion processes (Michael Bridges et al 2001, Guerrero-Campo & Montserrat –Marti 2000, Kembron 2001), or at degradation of temperate and tropical forests (World Re-source Institute 1996). Eswaran (2001) mentioned the need for establishment of distinct criteria for evalu-ating vegetation degradation. The author argued that the overlap between vegetation and land degradation is associated to conceptual similarities, since both processes may imply on reduction of biomass, decrease in species diversity, or decline in nutritional value for livestock and wildlife. The situation has generated studies that combine vegetation degradation with other processes, such as, soil erosion. In general, how-ever, they lack considerations of the quality and quantity of vegetation. The present research, on the other hand, examines the vegetation degradation phenomenon in a protected area, characterized by subtropical moderately humid climate, where degradation affects not only forest, but also other vegetation types. It aims to investigate the influence of human (rural settlements, villages, city, agricultural areas, tourist sites, mining sites, roads network) and physical factors (slope, geology, drainage) in the spatial distribution of vegetation degradation, in the Environmental Protection Area (EPA) Cachoeira das Andorinhas, Minas Gerais, Brazil. For that, Remote Sensing and Geographic Infor-mation Systems (GIS) techniques are used coupled with detailed field data collection. Therefore, it can widen the perspective over the problem, and be a contribution to the understanding of the influence of some spatially explicit factors, in the vegetation degradation process. Additionally, it can offer some in-sight into the situation of nature conservation in Brazil, especially regarding the EPAs that intend to har-monize land use development and biodiversity protection.
1.2. Aspects of nature conservation and Environmental Protection Areas in Brazil
ASSESSMENT OF HUMAN AND PHYSICAL FACTORS INFLUENCING SPATIAL DISTRIBUTION OF VEGETATION DEGRADATION -ENVIRONMENTAL PROTECTION AREA CACHOEIRA DAS ANDORINHAS, BRAZIL
7
Nature conservation in Brazil has been taken into consideration since the 1930s with the first delimitation of areas to be protected. Nevertheless, it was in the 1980s that the network of protected areas expanded. Nowadays, the country has 785 conservation areas, corresponding to 69 174 600 ha or 8.13 % of the total national territory, which are administrated and controlled by the IBAMA - Brazilian Institute for Envi-ronment and Renewable Natural Resources (MMA 1998; Camargos & Lana 1996). The conservation areas belong to several management categories. These categories are divided in areas of indirect and direct use, according to the level of restriction for the exploitation of natural resources. The indirect use conservation areas comprise strict reserves, where the exploitation of natural resources is pro-hibited, and the principal objective is ecosystem preservation. Examples are the National Parks, Bio-logical Reserves and Ecological Stations. The direct use areas are those where the exploitation of natural resources are allowed, according to specific management plans and legislation. Examples are the National Forests and Environmental Protection Areas (MMA 1998). The Environmental Protection Areas (EPAs) corresponds to IUCN category V or “Protected Landscapes and Seascapes” (IUCN 1992). They were created in the 1980s, as a result of the search for innovative strategies that harmonize nature conservation and economic development, in areas of intensive population pressure in Brazil. The general objectives of the EPAs are the biodiversity protection and the land use development, in a sustainable perspective. Currently, there are 38 EPAs in Minas Gerais state covering 1 352 031 ha, equivalent to 64% of the total protected area and 2% of the total area of the state (Camargos 2001). The sites are selected, according to the presence of remarkable natural and semi-natural characteristics, related to their biotic, abiotic, cultural and aesthetic attributes (Camargos & Lana 1996). The EPAs allows the maintenance of private ownership and economic activities compatible with the na-ture conservation, such as ecotourism and recreation. Some other activities are not allowed, such as indus-tries, mining activities, abusive use of pesticides, predatory hunting, edification, construction, and others, that contribute to erosion processes. Activities related to the road construction, urban projects, mining activities and earthwork depend on licensing procedures, operated by the state or federal environmental protection agencies (Minas Gerais 1989). The planning framework for the EPAs includes a cluster of political and administrative activities, that starting from the actual reality in the area, lead to a new scenario, where the use of natural resources is oriented to the biodiversity protection and improvement of life quality of the local people involved. The management plan generated comprehends the socio-environmental analysis, logical framework, action plan and environmental zoning (Arruda 1999). Despite of the importance of the creation of the EPAs, most of them exist only on paper and lack envi-ronmental functional zoning, land use and management plans for the true implementation of this conser-vation category.
ASSESSMENT OF HUMAN AND PHYSICAL FACTORS INFLUENCING SPATIAL DISTRIBUTION OF VEGETATION DEGRADATION -ENVIRONMENTAL PROTECTION AREA CACHOEIRA DAS ANDORINHAS, BRAZIL
8
1.3. Vegetation degradation process in the Environmental Protection Area Cachoeira das Andorinhas
A first concern that was raised during the present research was about what and in which extent major variations in the vegetation conditions of the EPA Cachoeira das Andorinhas can be attributed to human disturbance. This consideration was made because natural disturbance processes are a normal component of vegetation ecosystems (Sprugel 1991) and affect community structure and dynamics (Pickett et al 1989; Harmon et al 1983). When it comes to a long-term time scale, it becomes patent that most of the vegetation ecosystems have been shaped by interactions between human and natural disturbances (Sprugel 1991). However, chronic human disturbances can lead to large alterations in the structure and composition of vegetation, and establishment of degradation processes (Singh 1998). Those processes are pronounced by inappropriate land-use practices, and increase in population pressure (Kakembo 2001). Considering the reports of human activities in the EPA Cachoeira das Andorinhas (Andrade 2000) and the findings of damaging activities signs in most of the areas investigated during the research, the human activity was considered of great importance and major influence for the vegetation degradation conditions evidenced. Another relevant concern was from which point a vegetation ecosystem can be considered degraded and what quantitative measurements could be used. Andreasen et al (2001) argued that a degraded condition is the end of a continuum that comes from an “unimpacted state”, and defines the “socially unacceptable state”. The author suggested that for definition of degraded and unimpacted conditions it is fundamental the use of expert judgment, reconstruction from historical records, and selection of candidate metrics to measure in the location under study. Those candidate metrics or ecological indicators are then used to assess the conditions of the environment (Dale & Beyeler 2001). The present study had the underlying orientation of the verification of occurrence of degradation proc-esses in the different vegetation types of the EPA Cachoeira das Andorinhas and establishment of quanti-tative measurements of the vegetation conditions, through the use of ecological indicators.
1.4. Problem statement
The understanding of the environmental conditions and factors involved in the deterioration of the eco-systems found inside protection areas are fundamental for appropriate management. Chronic disturbances can lead to vegetation degradation and subsequent reduction of desirable characteristics of an area for nature conservation. Ferreira et al (1999) pointed out the relevance of studies of the situation and vulnerability of protected areas in Brazil, since most of them have not been properly implemented. This is the case of the EPA Ca-choeira das Andorinhas (located in Ouro Preto county) that lacks a proper management plan and in this context, vegetation degradation is taking place. The protected area was created by the decree number 30264 on 16/10/1989, and since then, no effective intervention for biodiversity protection and land use development has been undertaken.
ASSESSMENT OF HUMAN AND PHYSICAL FACTORS INFLUENCING SPATIAL DISTRIBUTION OF VEGETATION DEGRADATION -ENVIRONMENTAL PROTECTION AREA CACHOEIRA DAS ANDORINHAS, BRAZIL
9
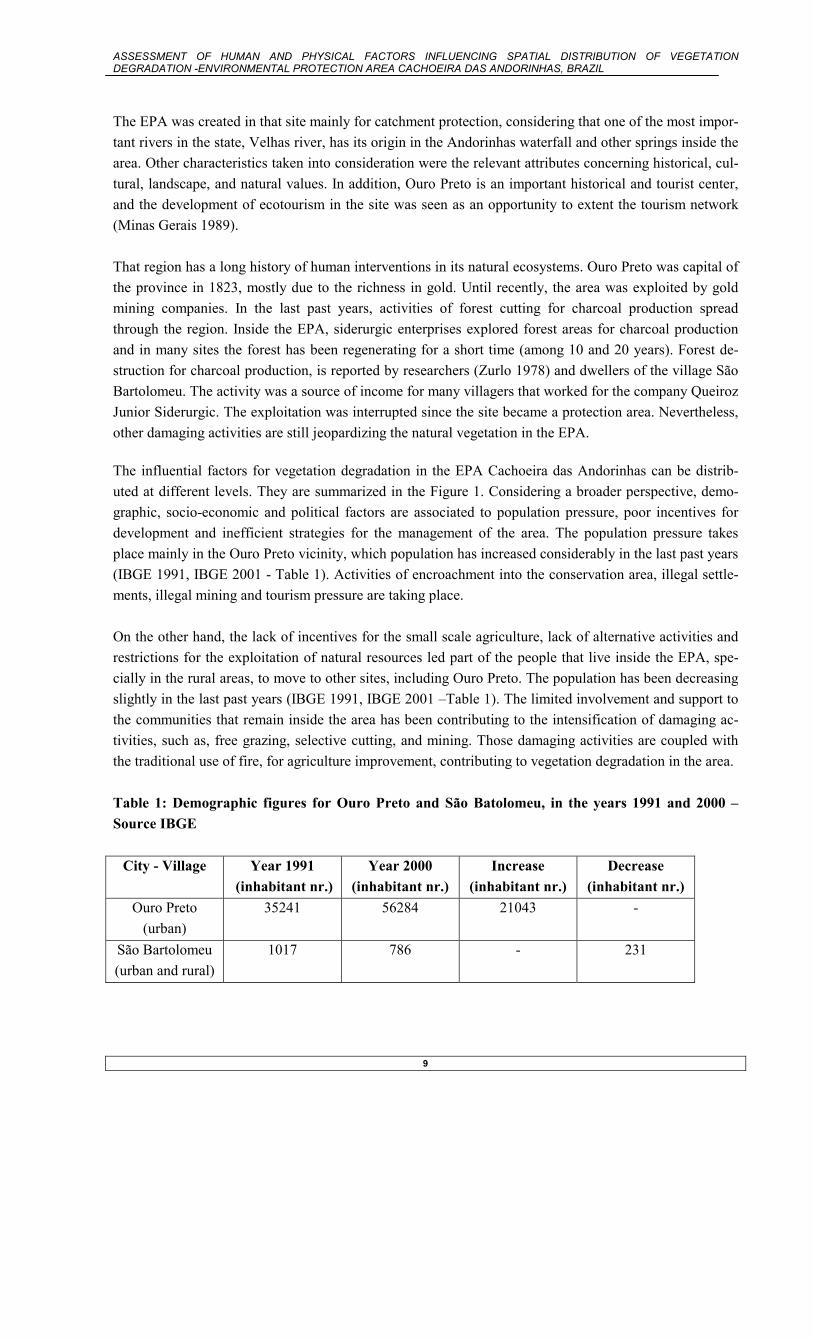
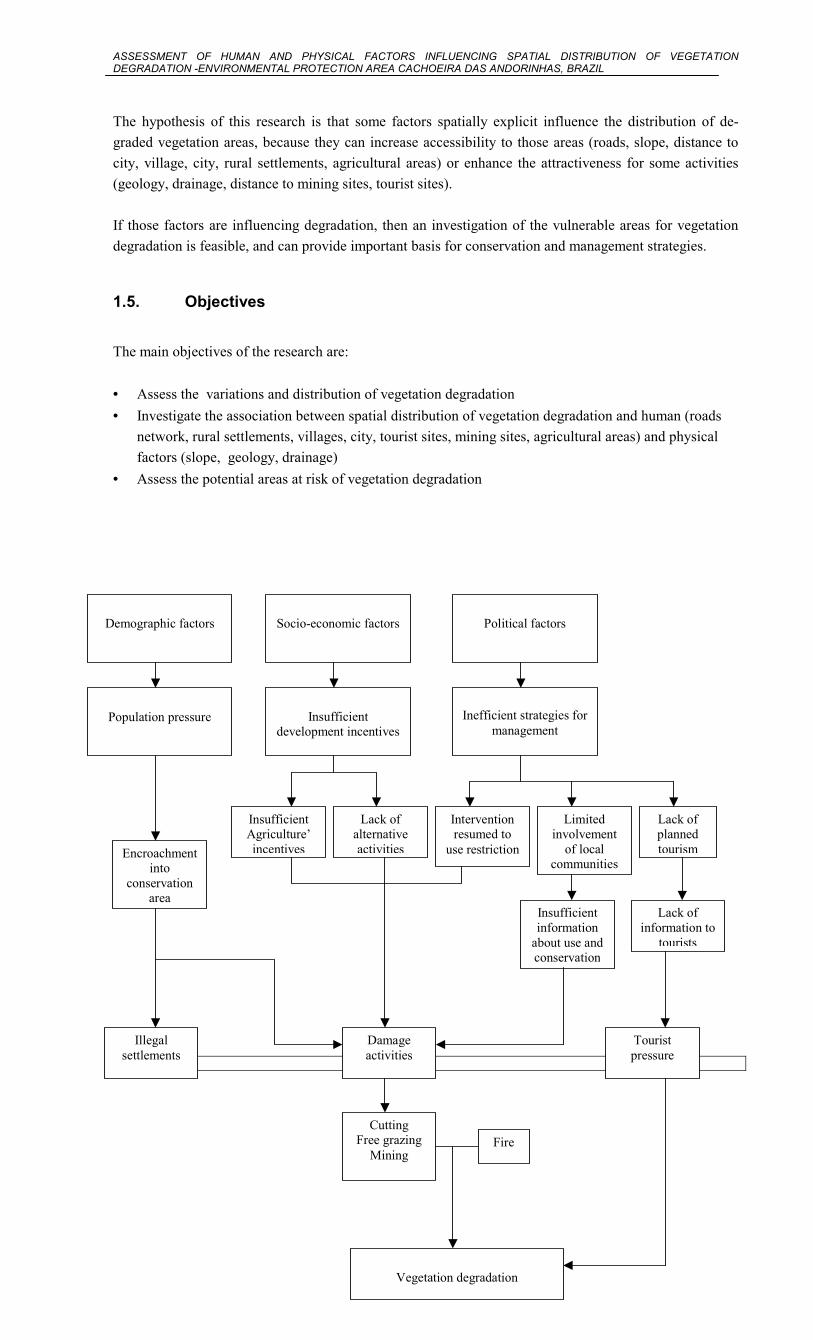
The EPA was created in that site mainly for catchment protection, considering that one of the most impor-tant rivers in the state, Velhas river, has its origin in the Andorinhas waterfall and other springs inside the area. Other characteristics taken into consideration were the relevant attributes concerning historical, cul-tural, landscape, and natural values. In addition, Ouro Preto is an important historical and tourist center, and the development of ecotourism in the site was seen as an opportunity to extent the tourism network (Minas Gerais 1989). That region has a long history of human interventions in its natural ecosystems. Ouro Preto was capital of the province in 1823, mostly due to the richness in gold. Until recently, the area was exploited by gold mining companies. In the last past years, activities of forest cutting for charcoal production spread through the region. Inside the EPA, siderurgic enterprises explored forest areas for charcoal production and in many sites the forest has been regenerating for a short time (among 10 and 20 years). Forest de-struction for charcoal production, is reported by researchers (Zurlo 1978) and dwellers of the village São Bartolomeu. The activity was a source of income for many villagers that worked for the company Queiroz Junior Siderurgic. The exploitation was interrupted since the site became a protection area. Nevertheless, other damaging activities are still jeopardizing the natural vegetation in the EPA. The influential factors for vegetation degradation in the EPA Cachoeira das Andorinhas can be distrib-uted at different levels. They are summarized in the Figure 1. Considering a broader perspective, demo-graphic, socio-economic and political factors are associated to population pressure, poor incentives for development and inefficient strategies for the management of the area. The population pressure takes place mainly in the Ouro Preto vicinity, which population has increased considerably in the last past years (IBGE 1991, IBGE 2001 - Table 1). Activities of encroachment into the conservation area, illegal settle-ments, illegal mining and tourism pressure are taking place. On the other hand, the lack of incentives for the small scale agriculture, lack of alternative activities and restrictions for the exploitation of natural resources led part of the people that live inside the EPA, spe-cially in the rural areas, to move to other sites, including Ouro Preto. The population has been decreasing slightly in the last past years (IBGE 1991, IBGE 2001 –Table 1). The limited involvement and support to the communities that remain inside the area has been contributing to the intensification of damaging ac-tivities, such as, free grazing, selective cutting, and mining. Those damaging activities are coupled with the traditional use of fire, for agriculture improvement, contributing to vegetation degradation in the area. Table 1: Demographic figures for Ouro Preto and São Batolomeu, in the years 1991 and 2000 – Source IBGE
City - Village Year 1991 (inhabitant nr.)
Year 2000 (inhabitant nr.)
Increase (inhabitant nr.)
Decrease (inhabitant nr.)
Ouro Preto (urban)
35241 56284 21043 -
São Bartolomeu (urban and rural)
1017 786 - 231
ASSESSMENT OF HUMAN AND PHYSICAL FACTORS INFLUENCING SPATIAL DISTRIBUTION OF VEGETATION DEGRADATION -ENVIRONMENTAL PROTECTION AREA CACHOEIRA DAS ANDORINHAS, BRAZIL
10
The hypothesis of this research is that some factors spatially explicit influence the distribution of de-graded vegetation areas, because they can increase accessibility to those areas (roads, slope, distance to city, village, city, rural settlements, agricultural areas) or enhance the attractiveness for some activities (geology, drainage, distance to mining sites, tourist sites). If those factors are influencing degradation, then an investigation of the vulnerable areas for vegetation degradation is feasible, and can provide important basis for conservation and management strategies.
1.5. Objectives
The main objectives of the research are: • Assess the variations and distribution of vegetation degradation • Investigate the association between spatial distribution of vegetation degradation and human (roads
network, rural settlements, villages, city, tourist sites, mining sites, agricultural areas) and physical factors (slope, geology, drainage)
• Assess the potential areas at risk of vegetation degradation
Vegetation degradation
Fire
Socio-economic factors
Population pressure
Inefficient strategies for
management
Limited involvement
of local communities
Lack of planned tourism
Insufficient information
about use and conservation
Lack of information to
tourists
Tourist pressure
Damage activities
Insufficient Agriculture’ incentives
Lack of alternative activitiesEncroachment
into conservation
area
Illegal settlements
Cutting Free grazing
Mining
Demographic factors
Political factors
Insufficient
development incentives
Intervention resumed to
use restriction

ASSESSMENT OF HUMAN AND PHYSICAL FACTORS INFLUENCING SPATIAL DISTRIBUTION OF VEGETATION DEGRADATION -ENVIRONMENTAL PROTECTION AREA CACHOEIRA DAS ANDORINHAS, BRAZIL
11
1.6. Research questions
The research objectives will be achieved by answering the following research questions:
General
• What are the human and physical factors that influence the spatial distribution and variations of vege-
tation degradation, and is it possible to assess areas at risk of vegetation degradation based on those factors?
Specific
• What are the variations and the spatial distribution of vegetation degradation? • What kind of association is there among spatial distribution of vegetation degradation, and the human
(roads network, rural settlements, villages, city, tourist sites, mining sites) and physical factors (slope, geology, drainage)?
• Where might be the areas at risk of vegetation degradation?
1.7. Hypothesis
The hypothesis of the study can be summarized as: • The spatial distribution of vegetation degradation is influenced by the human (roads network, rural
settlements, villages, city, tourist sites, mining sites, agricultural areas) and physical factors (slope, geology, drainage)
• It is possible to assess areas at risk of vegetation degradation based on the analysis of the influence of human and physical factors in the spatial distribution of degraded areas
1.8. Study area
The EPA Cachoeira das Andorinhas comprises an area of 18700 ha. It is located in the north of the Ouro Preto Mountain Range, showing variation of elevation from 900 to 1600 meters above sea level. The cli-mate is subtropical moderately humid. The mean annual temperature varies from 19.5ºC to 21.8ºC. The annual rainfall concentrates in the summer, and varies from 1000 to 2100 mm (Andrade 2000; Messias 1999; Guimarães Neto 1999). The area is located in the west extreme of the Brazilian Atlantic Forest dominion, setting bounds with the Savannah dominion (Rizzini 1979). That situation coupled with physical factors, such as elevation and geomorphology, determine variation on the vegetation formations found in the site. Besides the Atlantic
ASSESSMENT OF HUMAN AND PHYSICAL FACTORS INFLUENCING SPATIAL DISTRIBUTION OF VEGETATION DEGRADATION -ENVIRONMENTAL PROTECTION AREA CACHOEIRA DAS ANDORINHAS, BRAZIL
12
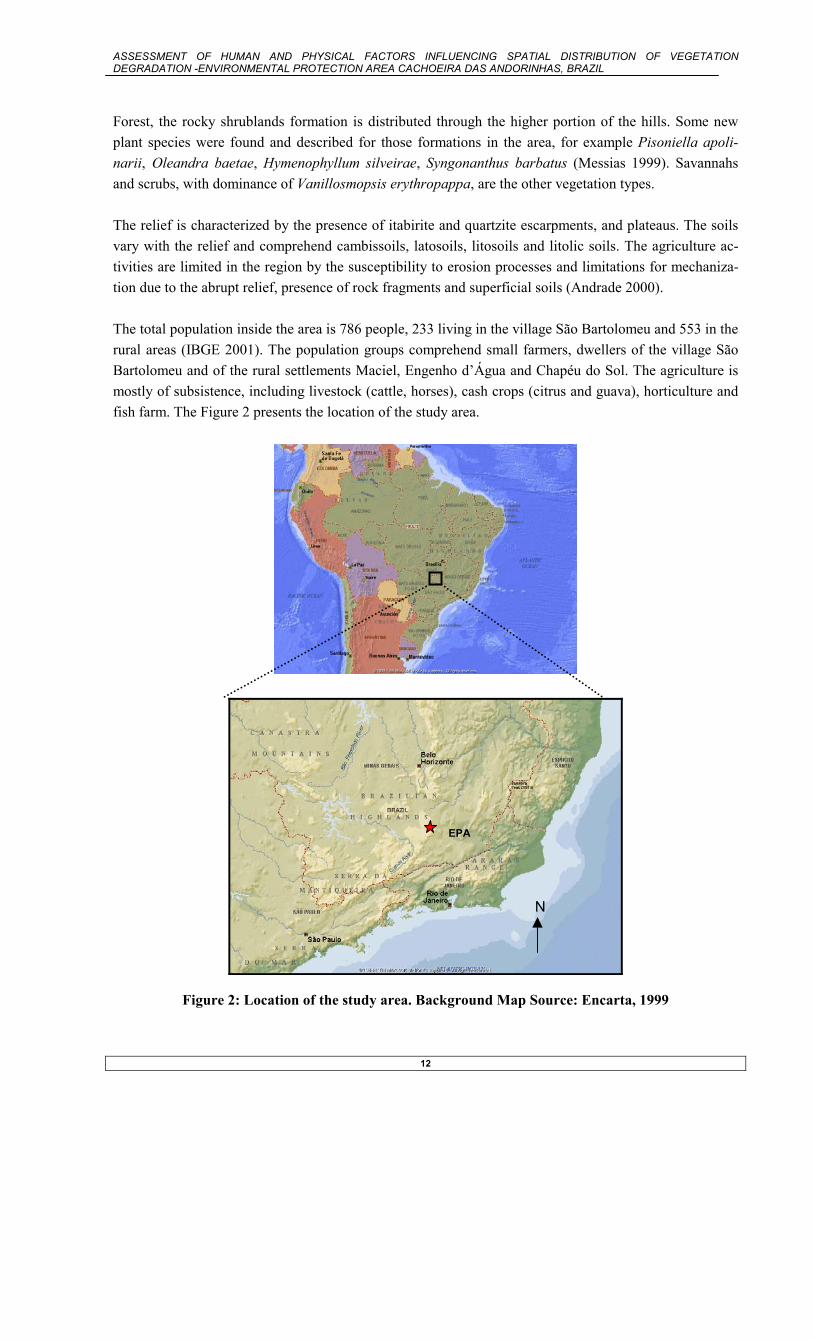
Forest, the rocky shrublands formation is distributed through the higher portion of the hills. Some new plant species were found and described for those formations in the area, for example Pisoniella apoli-narii, Oleandra baetae, Hymenophyllum silveirae, Syngonanthus barbatus (Messias 1999). Savannahs and scrubs, with dominance of Vanillosmopsis erythropappa, are the other vegetation types. The relief is characterized by the presence of itabirite and quartzite escarpments, and plateaus. The soils vary with the relief and comprehend cambissoils, latosoils, litosoils and litolic soils. The agriculture ac-tivities are limited in the region by the susceptibility to erosion processes and limitations for mechaniza-tion due to the abrupt relief, presence of rock fragments and superficial soils (Andrade 2000). The total population inside the area is 786 people, 233 living in the village São Bartolomeu and 553 in the rural areas (IBGE 2001). The population groups comprehend small farmers, dwellers of the village São Bartolomeu and of the rural settlements Maciel, Engenho d’Água and Chapéu do Sol. The agriculture is mostly of subsistence, including livestock (cattle, horses), cash crops (citrus and guava), horticulture and fish farm. The Figure 2 presents the location of the study area.
Figure 2: Location of the study area. Background Map Source: Encarta, 1999
EPA
N
ASSESSMENT OF HUMAN AND PHYSICAL FACTORS INFLUENCING SPATIAL DISTRIBUTION OF VEGETATION DEGRADATION -ENVIRONMENTAL PROTECTION AREA CACHOEIRA DAS ANDORINHAS, BRAZIL
13
1.9. Organization of the thesis
The thesis comprehends six chapters and thirteen appendices. Chapter 1 introduces the research, problem statement, objectives, research questions, hypothesis adopted and study area. Chapter 2 describes the ma-terials required, collected and acquired, and the method used. Chapter 3 presents the analysis and results, divided in: Land cover and vegetation characterization; Variations and distribution of vegetation degrada-tion; Vegetation degradation distribution in response to human and physical factors; Assessing areas at risk of vegetation degradation. The Chapter 4 comprehends the discussion of the results. The Chapter 5 presents the general conclusions and recommendations. The references are presented in the Chapter 6 and are followed by the Appendices.

ASSESSMENT OF HUMAN AND PHYSICAL FACTORS INFLUENCING SPATIAL DISTRIBUTION OF VEGETATION DEGRADATION -ENVIRONMENTAL PROTECTION AREA CACHOEIRA DAS ANDORINHAS, BRAZIL
14
CHAPTER2. MATERIALS AND METHODS
In this chapter the materials and methods used to investigate the spatial distribution of vegetation degra-dation variations and its association with human and physical factors are described.
1.1. Materials
1.9.1. Maps, images, land cover and vegetation data
The maps, images and environmental data used in this study are listed in Table 2, with respective sources. Table 2: Data and information required and sources
Data and information required
Secondary data Primary data
a- Land cover types Remote sensing image Landsat TM image 2000,
Pixel size 30 m (FEAM)
Ground truth Field sampling (78 plots) b- Vegetation conditions and environmental factors Roads Topographic map 1978,
1: 10000 (IBGE)
Rural settlements, villages, city
Topographic map 1978, 1: 10000 (IBGE)
Tourist , mining sites Landsat TM image 2000 Field sampling (6 plots) Contour map Contour map (FEAM) Geology map Geology map (CETEC) Drainage map Drainage map (FEAM) Remote sensing image Landsat TM image 2000 Degradation indicators Literature Field sampling (47 plots) Broader factors associated to degradation
Literature Interviews (18)
1.9.2. Equipment
The following instruments were used during the research: Global Positioning System (GPS), slope meter, compass, altimeter, plant press, pruning hook and measuring tape.
1.9.3. Software
The software packages used are given in Table 3.
ASSESSMENT OF HUMAN AND PHYSICAL FACTORS INFLUENCING SPATIAL DISTRIBUTION OF VEGETATION DEGRADATION -ENVIRONMENTAL PROTECTION AREA CACHOEIRA DAS ANDORINHAS, BRAZIL
15
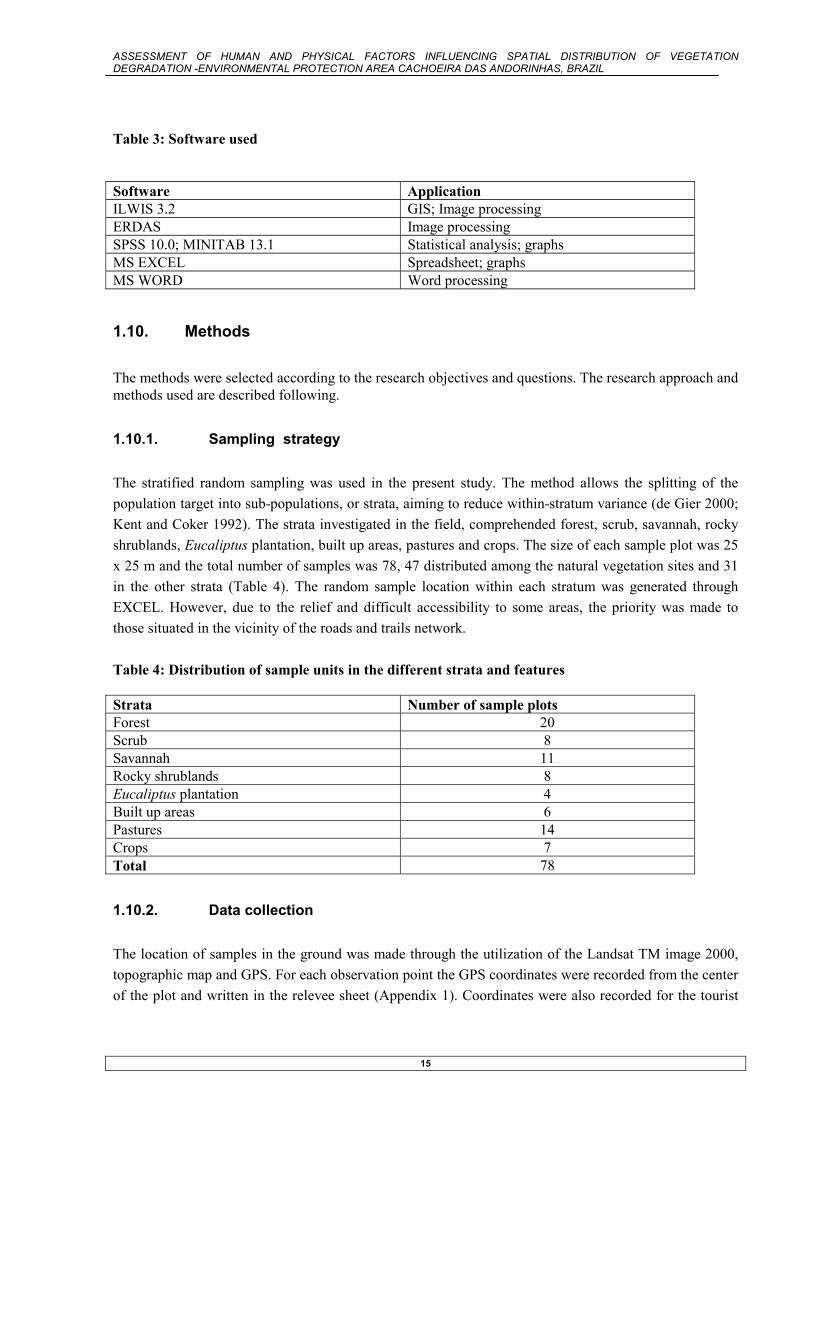
Table 3: Software used Software Application ILWIS 3.2 GIS; Image processing ERDAS Image processing SPSS 10.0; MINITAB 13.1 Statistical analysis; graphs MS EXCEL Spreadsheet; graphs MS WORD Word processing
1.10. Methods
The methods were selected according to the research objectives and questions. The research approach and methods used are described following.
1.10.1. Sampling strategy
The stratified random sampling was used in the present study. The method allows the splitting of the population target into sub-populations, or strata, aiming to reduce within-stratum variance (de Gier 2000; Kent and Coker 1992). The strata investigated in the field, comprehended forest, scrub, savannah, rocky shrublands, Eucaliptus plantation, built up areas, pastures and crops. The size of each sample plot was 25 x 25 m and the total number of samples was 78, 47 distributed among the natural vegetation sites and 31 in the other strata (Table 4). The random sample location within each stratum was generated through EXCEL. However, due to the relief and difficult accessibility to some areas, the priority was made to those situated in the vicinity of the roads and trails network. Table 4: Distribution of sample units in the different strata and features Strata Number of sample plots Forest 20 Scrub 8 Savannah 11 Rocky shrublands 8 Eucaliptus plantation 4 Built up areas 6 Pastures 14 Crops 7 Total 78
1.10.2. Data collection
The location of samples in the ground was made through the utilization of the Landsat TM image 2000, topographic map and GPS. For each observation point the GPS coordinates were recorded from the center of the plot and written in the relevee sheet (Appendix 1). Coordinates were also recorded for the tourist
ASSESSMENT OF HUMAN AND PHYSICAL FACTORS INFLUENCING SPATIAL DISTRIBUTION OF VEGETATION DEGRADATION -ENVIRONMENTAL PROTECTION AREA CACHOEIRA DAS ANDORINHAS, BRAZIL
16
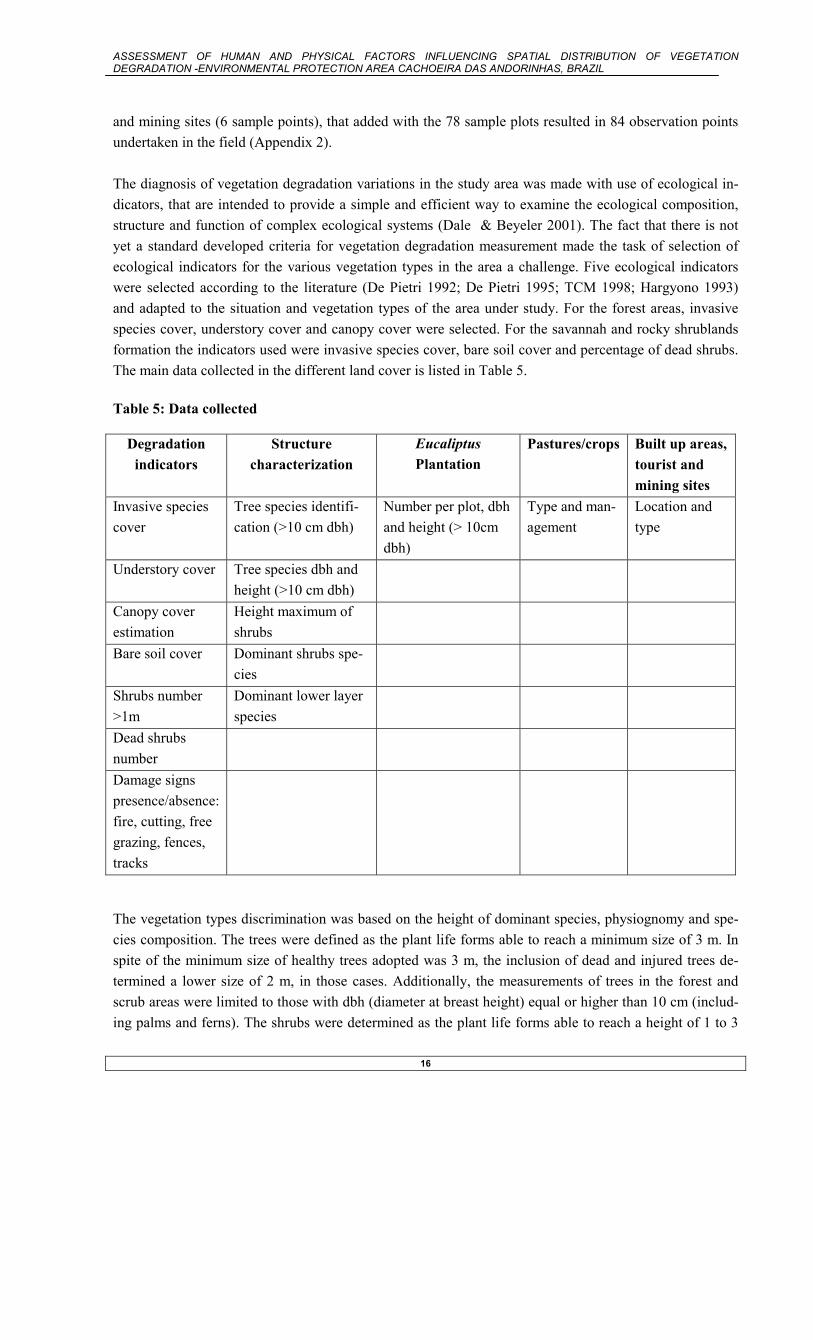
and mining sites (6 sample points), that added with the 78 sample plots resulted in 84 observation points undertaken in the field (Appendix 2). The diagnosis of vegetation degradation variations in the study area was made with use of ecological in-dicators, that are intended to provide a simple and efficient way to examine the ecological composition, structure and function of complex ecological systems (Dale & Beyeler 2001). The fact that there is not yet a standard developed criteria for vegetation degradation measurement made the task of selection of ecological indicators for the various vegetation types in the area a challenge. Five ecological indicators were selected according to the literature (De Pietri 1992; De Pietri 1995; TCM 1998; Hargyono 1993) and adapted to the situation and vegetation types of the area under study. For the forest areas, invasive species cover, understory cover and canopy cover were selected. For the savannah and rocky shrublands formation the indicators used were invasive species cover, bare soil cover and percentage of dead shrubs. The main data collected in the different land cover is listed in Table 5. Table 5: Data collected
Degradation indicators
Structure characterization
Eucaliptus Plantation
Pastures/crops Built up areas, tourist and mining sites
Invasive species cover
Tree species identifi-cation (>10 cm dbh)
Number per plot, dbh and height (> 10cm dbh)
Type and man-agement
Location and type
Understory cover Tree species dbh and height (>10 cm dbh)
Canopy cover estimation
Height maximum of shrubs
Bare soil cover Dominant shrubs spe-cies
Shrubs number >1m
Dominant lower layer species
Dead shrubs number
Damage signs presence/absence: fire, cutting, free grazing, fences, tracks
The vegetation types discrimination was based on the height of dominant species, physiognomy and spe-cies composition. The trees were defined as the plant life forms able to reach a minimum size of 3 m. In spite of the minimum size of healthy trees adopted was 3 m, the inclusion of dead and injured trees de-termined a lower size of 2 m, in those cases. Additionally, the measurements of trees in the forest and scrub areas were limited to those with dbh (diameter at breast height) equal or higher than 10 cm (includ-ing palms and ferns). The shrubs were determined as the plant life forms able to reach a height of 1 to 3
ASSESSMENT OF HUMAN AND PHYSICAL FACTORS INFLUENCING SPATIAL DISTRIBUTION OF VEGETATION DEGRADATION -ENVIRONMENTAL PROTECTION AREA CACHOEIRA DAS ANDORINHAS, BRAZIL
17
m. This was the case of the shrubs found in the savannah, rocky shrublands and scrub areas. The under-story or lower layer of the forest areas included, in this study, shrubs, herbs and seedlings with height maximum of 3 m. The invasive species are referred as “organisms which successfully establish themselves in, and then overcome, otherwise intact, pre-existing native ecosystems” (van Duren 2001). They are also known as alien invasive species and are considered a threat for the native biological diversity (van Duren 2001). In the present research, were considered as part of the group of the invasive species, exotic grasses and ferns (Mellinis minutiflora, Pteridium aquilinum), as well as opportunist species of the native flora. The oppor-tunist species are those that take advantage of situations of disturbance and degradation and spread them-selves over larger areas (Arundinaria effusa, Rhynchospora exaltata, among others). The species consid-ered are listed in the Appendix 3. The estimation of cover for invasive species, understory, bare soil and canopy were made in percentage, with consideration of the total area sampled in each plot (625 m2). For the verification of the understory conditions the presence of common species of herbs, shrubs and seedlings was notified. The species con-sidered included, among others: Leandra scabra, Coccosypselum erythrocephalum, Diodia brasiliensis, Psychotria tetraphylla, Miconia spp, ferns and bromeliads. The identification of plants species was made using own expert knowledge, literature (Lorenzi 1992), and consultation to the Herbarium Professor Jose Badini of the Federal University of Ouro Preto (OUPR). For the understanding of the overall environmental and socio-economic problems related to vegetation degradation in the area 18 interviews were conducted: 5 (to villagers and rural settlers); 7 (farmers); 1 (mining worker); 5 (key actors from organizations involved in the management of the area - FEAM, IEF, UFOP). The semi-structured questionnaire used is shown in the Appendix 4. The interviews were used for the understanding of the vegetation degradation process in the study area and for supporting discus-sions and recommendations.
1.10.3. Digitizing, image processing, classification and data processing
The digitizing was carried out for the roads, rural settlements and village using the Topographic map 1978. The Landsat TM image 2000 and other maps were georeferenced by the team of the agencies that collaborated for the thesis research, but some adjustments were made in the GIS environment to unify the data obtained from different sources. For the fieldwork, stretching, filtering and unsupervised classification techniques were undertaken be-forehand. The hard copy used was a false color composite (combination of bands 4,5,3) for improvement of discrimination of vegetation areas. The classification of the Landsat TM image 2000 into land cover classes was carried out through a cluster of steps of supervised classification including: selection and use of training sets (sample points), classifi-cation using the maximum likelihood classifier, application of majority filter, generation of output and accuracy assessment.

ASSESSMENT OF HUMAN AND PHYSICAL FACTORS INFLUENCING SPATIAL DISTRIBUTION OF VEGETATION DEGRADATION -ENVIRONMENTAL PROTECTION AREA CACHOEIRA DAS ANDORINHAS, BRAZIL
18
The DEM (Digital Elevation Model) was obtained from a digitized contour map aiming the creation of the slope map. Line interpolation technique was used. The primary and secondary data collected and acquired were divided into dependent and independent variables presented in Table 6 and Table 7. The classes of vegetation degradation defined comprehended: not degraded, low degraded, moderately degraded, highly degraded and extremely degraded. Forest and scrub were grouped together during the data processing, since the occurrence of scrub is related to the forest degradation process. Savannah and rocky shrublands formed the other group, considering the fact that the same indicators were useful for both. The direction of the influence of each indicator in the vege-tation degradation process was defined through the use of multivariate analysis (Principal Component Analysis/PCA – described in 2.2.4). Higher proportion of invasive species cover, lower estimation of canopy cover and lower proportion of understory cover meant higher level of degradation in the forest areas. The higher degradation condition in the savannah and rocky shrublands formations was determined according to the higher proportion of invasive species cover, higher proportion of bare soil and higher percentage of dead shrubs. The definition of each class of vegetation degradation was made by the sum of the values obtained for each of the indicators and verification of what it represented considering the high-est value possible in each of the vegetation group (12). The classes were intended to provide a basis for the investigation of spatial distribution of vegetation degradation variations. The criteria, threshold values and weights used for different indicators are presented on the Appendix 5. The establishment of classes expressing the levels of vegetation degradation can bring about some subjectivity, due to the need of use of arbitrary endpoints and weights. Although expert opinion and judgement is referred by Andreasan et al (2001) as part of the choice of relevant degraded locations and scale metrics of degradation, the use of PCA (2.2.4) granted confidence to the categorization of sample plots in low, moderately, highly, ex-tremely and not degraded classes. The scores generated in the PCA (2.2.4) gave the numerical expression of the vegetation degradation. The values of independent variables were mostly obtained in the GIS environment during the evaluation of the distribution of vegetation degradation variations in relation to distance to the roads, rural settle-ments, village, city, tourist sites, mining sites, agricultural areas and drainage. The rural settlements, vil-lage and city map comprehended Maciel, Engenho d’Água, Chapéu do Sol, São Bartolomeu and Ouro Preto neighborhoods. The tourist sites map comprised Andorinhas waterfall, São Bartolomeu waterfall, São Bartolomeu and Ouro Preto neighborhoods. The mining sites included the quartzite exploitation (close to Ouro Preto) and the Capanema Mining Co., located in the boundary north of the EPA. In the case of slope, a slope percentage map was obtained from the DEM (Digital Elevation Model). The geol-ogy map was generalized in two categories. The rocky formations grouped the quartzite, itabirite, schist, and phyllites. The other group (not rocky) comprehended the sedimentary deposits. The investigation of geology was based on the presence or absence of rocky formations, since the presence of rocks could be a source of attraction for some activities, such as mining. Table 6: Vegetation degradation scores (dependent variable)
Classes Variable Zero One Two Three Four
Vegetation degradation
Not degraded Low de-graded
Moderately degraded
Highly Degraded
Extremely degraded

ASSESSMENT OF HUMAN AND PHYSICAL FACTORS INFLUENCING SPATIAL DISTRIBUTION OF VEGETATION DEGRADATION -ENVIRONMENTAL PROTECTION AREA CACHOEIRA DAS ANDORINHAS, BRAZIL
19
scores Table 7: Human and physical factors (independent variables)
Variables Human factors Physical factors
Distance to the roads
Distance to village, city, rural settle-ments
Distance to tourist sites
Distance to mining sites
Distance to agricul-tural areas
Slope Geology Distance to the drainage
1.10.4. Statistical analysis
The analysis of the categorization of vegetation observation points into degradation classes and the defini-tion of values for the degradation situation of each sample plot was implemented through the use of an ordination method, the Principal Component Analysis (PCA). The PCA is performed to summarize envi-ronmental data and to produce an ordination of the sample plots, based on the environmental variables (Kent & Coker 1992). It aims to provide an understanding of the underlying data structure and to stan-dardize the measurements. The use of PCA allowed the investigation of how good and in which direction each of the indicators used could be related to vegetation degradation. The technique constructs the theo-retical variable that minimizes the total residual sum of squares after fitting straight lines to the environ-mental data (Jongman et al 1995). Through the PCA the most important components, that account for the higher variability are generated with respective eigenvalues or scores (Kent & Coker 1992). The scores of the best principal component were used to represent numerically the vegetation degradation variations in the area. They were obtained by the multiplication of the original values of each variable (Appendix 6) by the variable eigenvector value. Additionally, the PCA was performed for checking redundancy in the data and selection of the independent variables to be used in the regression analysis. For the dependent vari-ables, that had the same scale measurements, the covariance matrix was used to calculate the principal components. The independent variables had the principal components calculated through the correlation matrix, in order to standardize variables. The equations of the PCA are (Jongman et al 1995): n bk= ∑ yki xi i=1 Where bk is the slope parameter for the variable k, yki the centred abundance of the variable k (indica-tors) at the site i and xi the score of the variable at site i. m xi=∑ yki bk k=1 Where xi refers to site scores (vegetation degradation)
ASSESSMENT OF HUMAN AND PHYSICAL FACTORS INFLUENCING SPATIAL DISTRIBUTION OF VEGETATION DEGRADATION -ENVIRONMENTAL PROTECTION AREA CACHOEIRA DAS ANDORINHAS, BRAZIL
20
yki=(bk1 xi1 + bk2 xi2) +residual Where bk1 and bk2 are the scores of the variable k; xi1 xi2 are the scores of site i on Axis 1 and Axis 2, respectively. The normality test of Kolmogorov-Smirnov was performed to examine whether or not the variables fol-lowed a normal distribution. The Kolmogorov-Smirnov is an empirical cumulative distribution function based test. The test performs a hypothesis test where the null hypothesis states that the data follow a nor-mal distribution. The alternative hypothesis states that the data do not follow a normal distribution. The normality test provides indication whether to use parametric statistics (variables close to normal distribu-tion) or non parametric statistics (variables not normally distributed). The latter tests are known as distri-bution-free tests, because they make no assumptions about the underlying distribution of the data. The hypothesis statement of the normality test is: Ho: Fo (X) =SN(X) (null hypothesis) versus Ha: Fo(X) ≠ SN(X) (alternative hypothesis) Where Fo(X) Is theoretical normal cumulative distribution and SN(X) is the observed cumulative fre-quency distribution of the variable at N observations. In order to investigate the relationship among the variations in vegetation degradation (scores) and human and physical factors, and furthermore to support the prediction of areas under risk of degradation, regres-sion and correlation analysis were performed. Regression analysis is a statistical method that describes the response variable as a function of one or more explanatory variables (Jongman et al 1995). The method is used for assessing which environmental variables contributes more to the response, and to pre-dict environmental responses on sites from the observed value of one or more variables. The correlation analysis is used to determine the strength of relationships between variables. The result of a correlation analysis (correlation coefficient - r) is a statistic lying between –1 to +1, which describes the degree of relationship between two varibles (Kent & Coker 1992). The correlation coefficient is used to describe the success of regression in explaining the response y (More & McCabe 1998). The prediction of areas at risk of vegetation degradation used as input variables (factors) those that presented p values significant at α = 0.05, for a one-tailed test. The regression equation is (Jongman et al 1995): y = bo + b1x + ε Where y is the response variable; x is the explanatory variable; ε is the error; and bo and b1 are fixed but unknown coefficients corresponding to the intercept and slope parameters, respectively. The hypothesis statement of the relationship vegetation degradation and human and physical factors, through correlation analysis is: Ho: ps = 0 (null hypothesis) versus
ASSESSMENT OF HUMAN AND PHYSICAL FACTORS INFLUENCING SPATIAL DISTRIBUTION OF VEGETATION DEGRADATION -ENVIRONMENTAL PROTECTION AREA CACHOEIRA DAS ANDORINHAS, BRAZIL
21
Ha: ps ≠ 0 (alternative hypothesis) Where ps is the population correlation coefficient. The overall accuracy of the land cover map was calculated in a Confusion Matrix. The overall accuracy is represented by the ratio of the number of correctly classified pixels by the total number of pixels checked or sampled. For the land cover mapping half o the sample plots (39) were used, and the other half (39) were used for the accuracy assessment. A general overview of the methods is presented in Figure 4.

ASSESSMENT OF HUMAN AND PHYSICAL FACTORS INFLUENCING SPATIAL DISTRIBUTION OF VEGETATION DEGRADATION -ENVIRONMENTAL PROTECTION AREA CACHOEIRA DAS ANDORINHAS, BRAZIL
22
Figure 4: General overview of methods
Geology Map
Spatial and Statis-tical Analysis
Landsat TM Image 2000
Topographic Map
Drainage Map
Contour Map
Digitizing
RoadsMap
Settlements/ Village Map
DEM
Tourist Sites, Mining Sites
Training set
Slope Map
Vegetation degrada-tion Point
Classifica-
Land Cover Map
Vegetation Map
Relationship fac-tors/vegetation
degradation
Map of vegeta-tion degrada-
tion distribution
Field Data: Observation Points
Map of areas at risk
of vegetation degradation
Agricu-tural
A M
GIS Opera-
GIS Opera-
ASSESSMENT OF HUMAN AND PHYSICAL FACTORS INFLUENCING SPATIAL DISTRIBUTION OF VEGETATION DEGRADATION -ENVIRONMENTAL PROTECTION AREA CACHOEIRA DAS ANDORINHAS, BRAZIL
23
CHAPTER 3. RESULTS
The results are presented in four parts starting with a characterization of the land cover and vegetation in the study area, aiming to provide a general idea of the spatial distribution and qualitative aspects of the different environments, specially the vegetation. The situation of the observed vegetation sample plots regarding variations and distribution of vegetation degradation is described in the second part, and was used as a basis for the investigation and understanding of the association among vegetation degradation and human and physical factors. The resulted significant responses were used to assess the vegetation areas at risk of degradation and comprehend the last part of this chapter.
3.1 Land cover and vegetation characterization
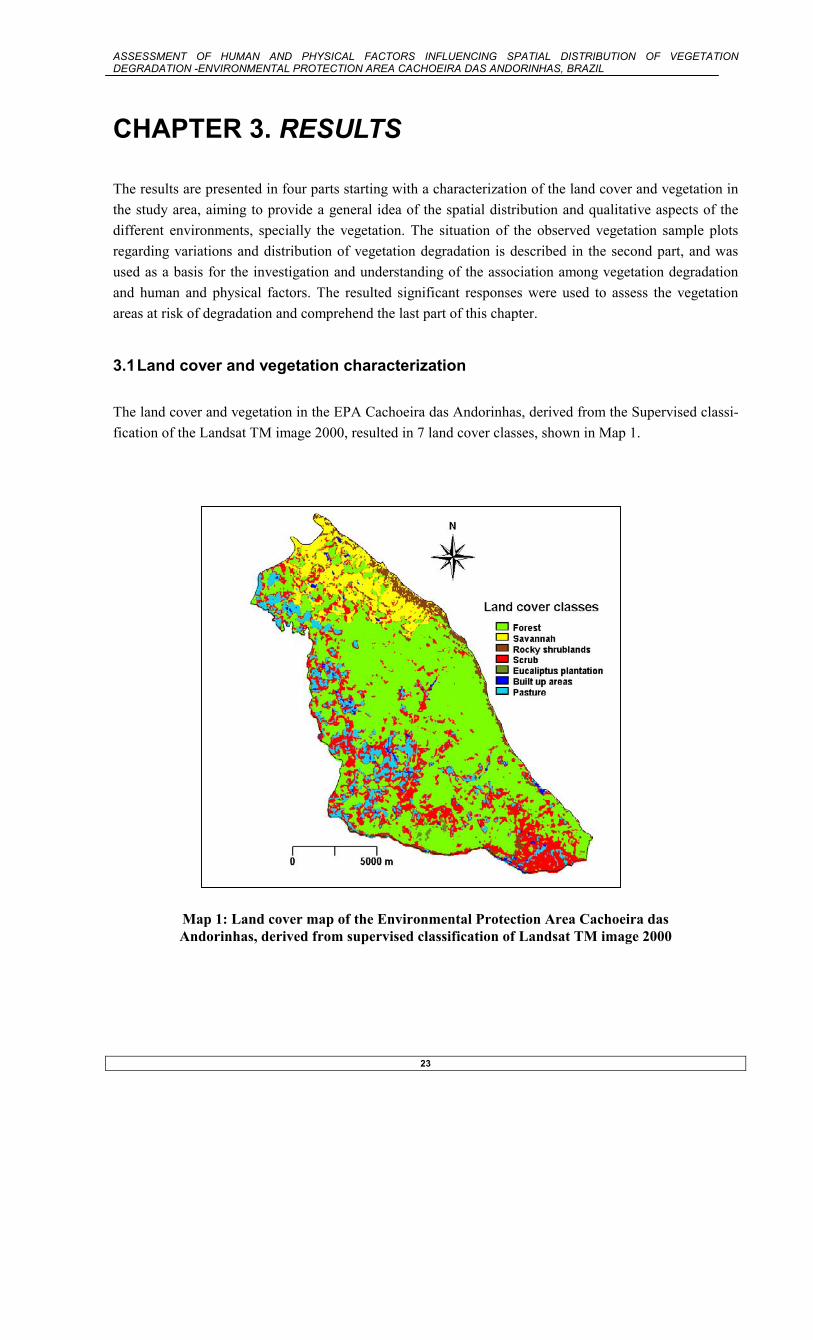
The land cover and vegetation in the EPA Cachoeira das Andorinhas, derived from the Supervised classi-fication of the Landsat TM image 2000, resulted in 7 land cover classes, shown in Map 1.
Map 1: Land cover map of the Environmental Protection Area Cachoeira das Andorinhas, derived from supervised classification of Landsat TM image 2000
ASSESSMENT OF HUMAN AND PHYSICAL FACTORS INFLUENCING SPATIAL DISTRIBUTION OF VEGETATION DEGRADATION -ENVIRONMENTAL PROTECTION AREA CACHOEIRA DAS ANDORINHAS, BRAZIL
24
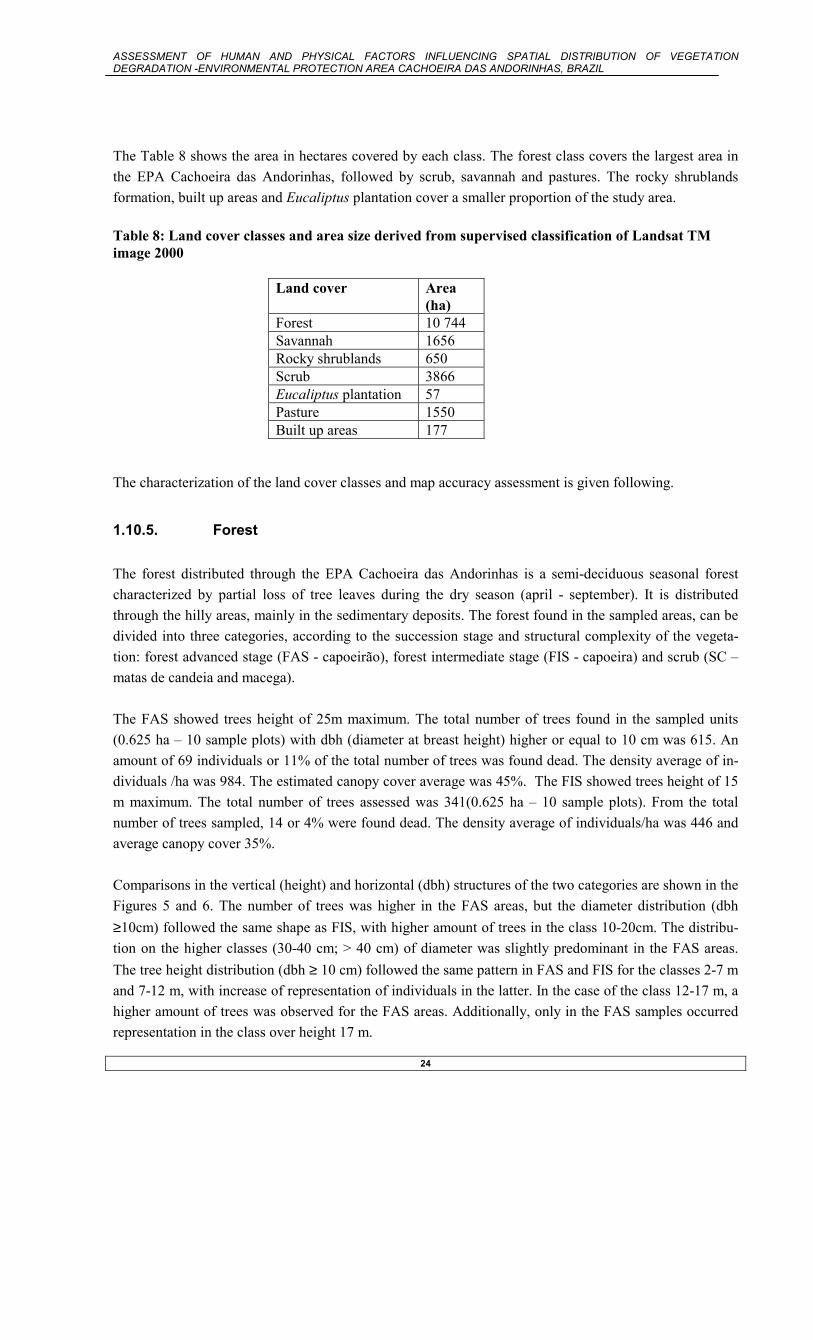
The Table 8 shows the area in hectares covered by each class. The forest class covers the largest area in the EPA Cachoeira das Andorinhas, followed by scrub, savannah and pastures. The rocky shrublands formation, built up areas and Eucaliptus plantation cover a smaller proportion of the study area. Table 8: Land cover classes and area size derived from supervised classification of Landsat TM image 2000
Land cover Area (ha)
Forest 10 744 Savannah 1656 Rocky shrublands 650 Scrub 3866 Eucaliptus plantation 57 Pasture 1550 Built up areas 177
The characterization of the land cover classes and map accuracy assessment is given following.
1.10.5. Forest
The forest distributed through the EPA Cachoeira das Andorinhas is a semi-deciduous seasonal forest characterized by partial loss of tree leaves during the dry season (april - september). It is distributed through the hilly areas, mainly in the sedimentary deposits. The forest found in the sampled areas, can be divided into three categories, according to the succession stage and structural complexity of the vegeta-tion: forest advanced stage (FAS - capoeirão), forest intermediate stage (FIS - capoeira) and scrub (SC – matas de candeia and macega). The FAS showed trees height of 25m maximum. The total number of trees found in the sampled units (0.625 ha – 10 sample plots) with dbh (diameter at breast height) higher or equal to 10 cm was 615. An amount of 69 individuals or 11% of the total number of trees was found dead. The density average of in-dividuals /ha was 984. The estimated canopy cover average was 45%. The FIS showed trees height of 15 m maximum. The total number of trees assessed was 341(0.625 ha – 10 sample plots). From the total number of trees sampled, 14 or 4% were found dead. The density average of individuals/ha was 446 and average canopy cover 35%. Comparisons in the vertical (height) and horizontal (dbh) structures of the two categories are shown in the Figures 5 and 6. The number of trees was higher in the FAS areas, but the diameter distribution (dbh ≥10cm) followed the same shape as FIS, with higher amount of trees in the class 10-20cm. The distribu-tion on the higher classes (30-40 cm; > 40 cm) of diameter was slightly predominant in the FAS areas. The tree height distribution (dbh ≥ 10 cm) followed the same pattern in FAS and FIS for the classes 2-7 m and 7-12 m, with increase of representation of individuals in the latter. In the case of the class 12-17 m, a higher amount of trees was observed for the FAS areas. Additionally, only in the FAS samples occurred representation in the class over height 17 m.

ASSESSMENT OF HUMAN AND PHYSICAL FACTORS INFLUENCING SPATIAL DISTRIBUTION OF VEGETATION DEGRADATION -ENVIRONMENTAL PROTECTION AREA CACHOEIRA DAS ANDORINHAS, BRAZIL
25
Figure 5: Distribution of trees in height classes in Figure 6: Distribution of trees in diameter classes
the forest intermediate and advanced stage in the forest intermediate and advanced stage The tree species composition presented a total of 95 species (identified at least at botanic family level), 39 common for the FAS and FIS areas, 34 occurring only in the FAS and 22 in the FIS (Appendix 5). In the FAS a total of 15 individuals were found unknown and 31 (5% of the total) had no leaves, making the task of identification unfeasible. For the FIS, 3 individuals were unknown and 10 (3%) had no leaves, due to the deciduous behavior of the trees in the study area. Many of the species found are pioneers such as Cecropia hololeuca, Clethra scabra, Cordia sellowianna, Hyptiodendron asperrimum, Vismia brasiliensis and Vanillosmopsis erythropappa. The latter cited spe-cies has a high importance in terms of use by the local people, not only for fuelwood production, but also as building material. Some other species found are secondary, for example, Sclerolobium rugosum, Guarea guidonia, Anadenathera colubrina. A number of woody species has potential commercial use including Aspidosperma parvifolium, Cupania vernalis, Bowdichia virgilioides, Copaifera langsdorffii, Machaerium villosum, Myrcia rostrata, Xylopia sericea, Vanillosmopsis erythropappa (IEF 1994). The tree like fern species, Cyathea arborea, occurred in the areas investigated. One species found in the FAS, Ocotea odorifera, is threatened of extinction according to the Red List of Threatened Plant Species of Minas Gerais State (Mendonça & Lins 2000). The species composition of the understory was similar for the two categories and included the presence of Leandra scabra, Coccosypselum erythrocephalum, Diodia brasiliensis, Psychotria tetraphylla, Miconia spp, as well as some ferns, bromeliads and seedlings.

ASSESSMENT OF HUMAN AND PHYSICAL FACTORS INFLUENCING SPATIAL DISTRIBUTION OF VEGETATION DEGRADATION -ENVIRONMENTAL PROTECTION AREA CACHOEIRA DAS ANDORINHAS, BRAZIL
26
Although differences in structure were found between FAS and FIS, they were merged as one group (for-est), since the spectral reflectance was similar and the dn (digital number) values for pixels overlapped in many cases (Map 1). The scrub (SC) comprehends the forest areas that have been regenerating for a shorter time and conse-quently the structure is less complex and poorer comparing to the FAS and FIS. It also includes aban-doned pasture and agricultural areas. Two different types of scrub were found: scrub with small trees (ST – matas de candeia) and scrubs with predominance of shrubs (SS - macega). In both cases Vanillosmopsis erythropappa was found an important dominant species. The ST presented height maximum of 7 m and few trees reaching trunk diameter at or over 10cm. The maximum canopy cover estimated on those areas was 20%. Besides Vanillosmopsis erythropappa, other pioneer trees were found, for example, Clethra scabra, Vismia brasiliensis, Lithraea molleoides, Lama-nonia ternata, Rapanea umbellata. The understory showed varied composition with some savannahs’ and other common species combined, such as Byrsonima coccolobifolia, Jacaranda caroba, Baccharis dracunculifolia, Vernonia polyanthes, Lantana lilacina. The SS showed predominant cover of shrubs and herbs, with height maximum of 2 m. The species com-position was largely dominated by invasive and opportunist species, that spread easily over open areas, with high sun light availability. Some of the species found were pastures’ grasses coupled with others such as, Vannilosmopsis erythropappa, Vernonia polyanthes, Lantana lilacina, Baccharis dracunculifo-lia, Achyrocline satureoides, Chamaecrista sp, Eupatorium sp. The different spectral reflectance showed by the scrub in relation to the other forest succession stages made it possible to map them separately, as one land cover class (scrub - Map 1).
1.10.6. Savannah
The brazilian savannah like formation (cerrado) is distributed through the north part of the study area (Map 1). Three different forms of savannah are found in the site: savannah with dominance of grasses (campo limpo), savannah with sparse shrubs (campo sujo) and savannah with short trees (campo cerrado). In all of them, a continuous grass layer is found, interrupted in some places by shrubs and/or short trees. In spite of the physiognomy differences, not many variations in the species composition was found in the areas under study. The height maximum of trees in the savannah areas was 7 m with an average of 4 m. Vochysia tucanorum, Byrsonima verbascifolia, Tabebuia ochracea, Dydimopanax morototoni, Roupala montana, Eugenia dysenterica, Erythroxyllum suberosum, Sthryphnodendron adstringens and Rapanea sp were some of the most common short trees found. Those species were also found in shrub form, dis-tributed sparsely among the grass cover. The lower layer comprehends a continuous layer of grasses and herbs, some of them members of the neighboring rocky shrublands formation. The species composition included Echinolaena inflexa, Lippia sp, Heteropteris sp, Microlicia spp, Cambessedesia spp, Erythroxyllum spp.

ASSESSMENT OF HUMAN AND PHYSICAL FACTORS INFLUENCING SPATIAL DISTRIBUTION OF VEGETATION DEGRADATION -ENVIRONMENTAL PROTECTION AREA CACHOEIRA DAS ANDORINHAS, BRAZIL
27
1.10.7. Rocky shrublands
The rocky shrublands (campo rupestre) is distributed through the quartzite and itabirite rocks formation in the north, south and east regions of study area (Map 1). Rocks interrupted sparsely by the layer of shrubs and herbs dominate the ground cover. Some variations are found among the rocky shrublands of the area depending on the rock type. The most important shrub species found were Lychnophora linearis, Lychnophora spp, Diplusodon sp, Baccharis sp, Vellozia compacta, Marcetia sp, Periandra mediterranea, Lavoisiera sp, Tibouchina sp and Van-nilosmopsis capitata. The herbs comprehended many ornamental species of orchids, such as, Laelia flava, Epidendrum ellipticum, Oncidium sp, Bulbophyllum sp. Other species found were Dickia coccinea, Pa-epalanthus planifolius, Paepalanthus aequalis, Vellozia gramineae, Syngonanthus sp.
1.10.8. Eucaliptus plantation
The main species of the plantation forest in the area is Eucaliptus sp, an exotic species. The plantations are distributed irregularly in areas in the south and north of the EPA. Most of the plantations are managed by the private owners and the principal purpose is commercial, specially regarding charcoal production. Variations on the age of the stands and consequently in height of the trees were found. In the older ones the height maximum was around 20 m. The unsderstory was found invaded by species of the neighboring vegetation formations and invasive species, such as Pteridium aquilinum.
1.10.9. Agricultural areas
The most evident agriculture activity in the area is cattle raising and the pastures are established for the livestock grazing. The grasses species used are mainly Brachiaria spp, but in some cases the lack of ap-propriate management facilitates the invasion and establishment of other species such as Mellinis minuti-flora and Pteridium aquilinum. The agriculture crops are in the majority situated close to the houses and villages and do not cover exten-sive areas. For that reason, they were not classified as a specific category and were mapped combined with the pastures and built up areas. From the 7 sample plots undertaken citrus, guava and other fruit plantation were found in all the areas. Vegetable horticulture was found in 4 plots and annual crops (corn) in 3. Only one of the areas visited had a commercial organic vegetable horticulture activity, and in the other areas the crops were grown for subsistence purposes. In the case of guava and citrus, some families in São Bartolomeu and Engenho d’Água have been developing the production of fruit sweets, that is sold to stores in Ouro Preto and other cities.
1.10.10. Built up areas
The built up areas are usually comprised of areas of intensive use with much of the land covered by struc-tures (Anderson 1976). In the EPA Cachoeira das Andorinhas they comprehend the settlements, villages,

ASSESSMENT OF HUMAN AND PHYSICAL FACTORS INFLUENCING SPATIAL DISTRIBUTION OF VEGETATION DEGRADATION -ENVIRONMENTAL PROTECTION AREA CACHOEIRA DAS ANDORINHAS, BRAZIL
28
farms, houses and transportation facilities inside the area. Most of the built up areas are distributed through out the flat and undulating slope or following the drainage system of the Velhas river.
1.10.11. Map accuracy
The accuracy of the map is showed in the error matrix (Table 6). The table shows the derived errors and accuracy expressed as percentages. A total of 78 observation points were sampled in the field, 39 used as training set during the supervised land cover classification, and 39 for accuracy assessment. The overall accuracy refers to the number of correctly classified pixels, that in the case were 32, divided by the total number of pixels (39). The overall accuracy obtained was 82 %. The user accuracy is the probability that a reference pixel has been correctly classified, and it is calculated by dividing the diagonal value of each class by the column total. The producer accuracy is the probability that a pixel classified on the map represents that class on the ground (Anderson 1976). The values obtained for the producer and user accu-racy were 85% and 78% respectively. Table 6: Error matrix after land cover classification – Landsat TM image 2000
Land cover types
For-est
Rocky shrub-lands
Savan-nah
Eucalytus planta-tion
Scrub Pas-ture
Built up areas
Total Pro-ducer Accu-
racy % Forest
8 0 0 0 2 0 0 10 80
Rocky shrub-lands
0 2 2 0 0 0 0 4 50
Savannah
0 0 7 0 0 0 0 7 100
Eucalyptus Plantation
1 0 0 2 0 0 0 3 67
Scrub
0 0 0 0 4 0 0 4 100
Pasture
0 0 0 0 0 7 1 8 88
Built up ar-eas
1 0 0 0 0 0 2 3 67
Total
10 2 9 2 6 7 3 39 78
User Accu-racy %
89 100 78 100 67 100 67 85
Overall Ac-curacy %
82

ASSESSMENT OF HUMAN AND PHYSICAL FACTORS INFLUENCING SPATIAL DISTRIBUTION OF VEGETATION DEGRADATION -ENVIRONMENTAL PROTECTION AREA CACHOEIRA DAS ANDORINHAS, BRAZIL
29
1.11. Variations and distribution of vegetation degradation
The results of the categorization of the 28 sample plots of the forest and scrub areas into vegetation deg-radation conditions are presented in the Table 7. The criteria, threshold values and original data used are shown in Appendices 5, 6 and 7. From the total areas sampled, 8 cases or 28% were classified as ex-tremely degraded (class four), 10 units or 36% as highly degraded (class three), and 10 cases or 36% were found moderately degraded (class two). The forest intermediate stage presented 60% of the sample plots classified as highly degraded and 40% as moderately degraded. The forest advanced stage, otherwise, comprehended 40% of sample units classified as highly degraded and 60% as moderately degraded. The scrub areas were all (100%) classified as extremely degraded. For the savannah and rocky shrublands formations (Table 8), in the totality of 19 sample plots, 2 cases or 10 % were found extremely degraded (class four), 1 case or 6% presented highly degraded (class three), 7 units or 37% were classified as mod-erately degraded (class two), 7 cases or 37% low degraded (class one) and 2 cases or 10% not degraded (class zero). The savannah had 9% of the sample plots classified as highly degraded, 46% as moderately degraded, 36% as low degraded and 9% as not degraded. The rocky shrublands comprehended 25% clas-sified as extremely degraded, 25% moderately degraded, 38% as low degraded and 12% as not degraded. The vegetation degradation scores were generated in the PCA and used as input data for the regression analysis.
ASSESSMENT OF HUMAN AND PHYSICAL FACTORS INFLUENCING SPATIAL DISTRIBUTION OF VEGETATION DEGRADATION -ENVIRONMENTAL PROTECTION AREA CACHOEIRA DAS ANDORINHAS, BRAZIL
30
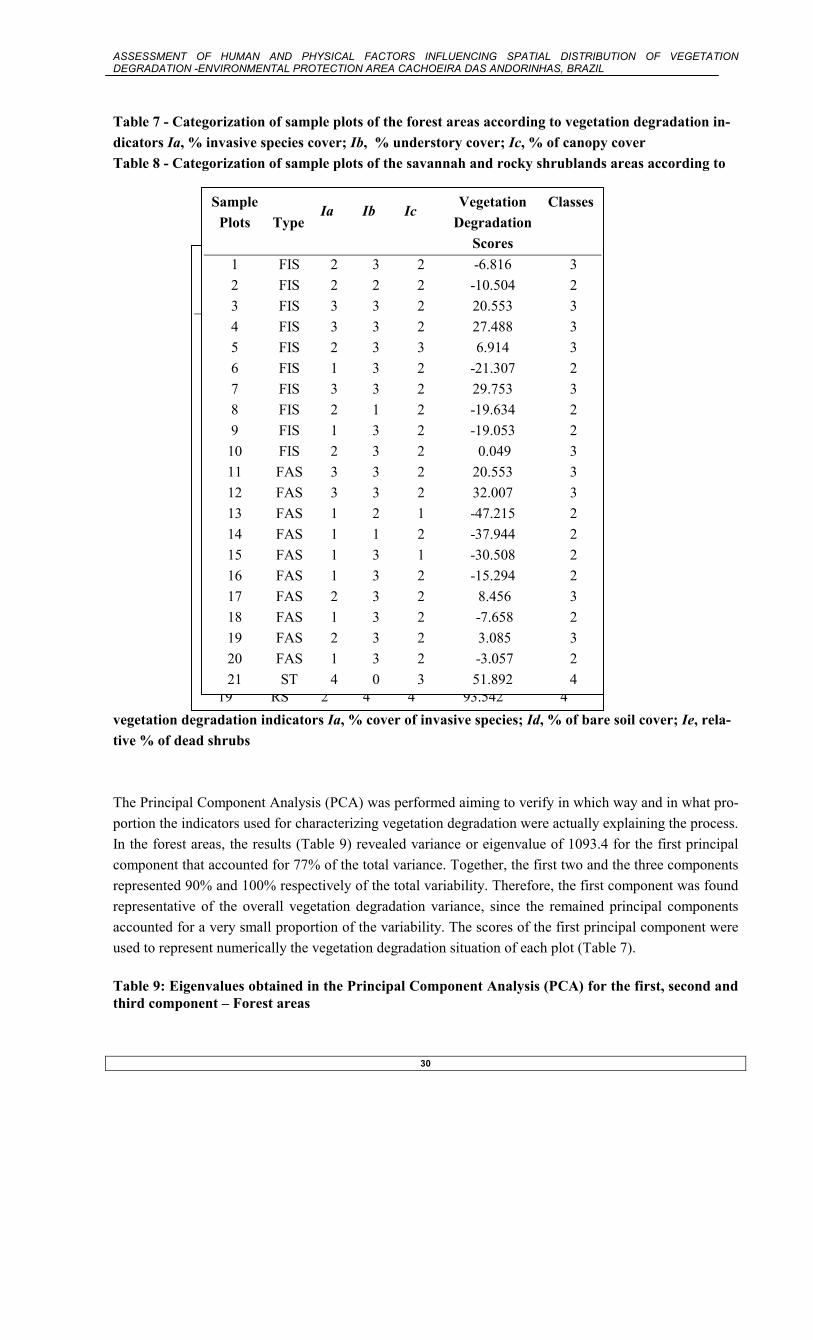
Table 7 - Categorization of sample plots of the forest areas according to vegetation degradation in-dicators Ia, % invasive species cover; Ib, % understory cover; Ic, % of canopy cover Table 8 - Categorization of sample plots of the savannah and rocky shrublands areas according to
vegetation degradation indicators Ia, % cover of invasive species; Id, % of bare soil cover; Ie, rela-tive % of dead shrubs The Principal Component Analysis (PCA) was performed aiming to verify in which way and in what pro-portion the indicators used for characterizing vegetation degradation were actually explaining the process. In the forest areas, the results (Table 9) revealed variance or eigenvalue of 1093.4 for the first principal component that accounted for 77% of the total variance. Together, the first two and the three components represented 90% and 100% respectively of the total variability. Therefore, the first component was found representative of the overall vegetation degradation variance, since the remained principal components accounted for a very small proportion of the variability. The scores of the first principal component were used to represent numerically the vegetation degradation situation of each plot (Table 7). Table 9: Eigenvalues obtained in the Principal Component Analysis (PCA) for the first, second and third component – Forest areas
Sample Plots
Type Ia Id Ie Vegetation Degradation
Scores
Classes
1 SA 3 2 2 70.965 3 2 SA 3 1 1 62.608 2 3 SA 0 0 3 1.425 1 4 SA 3 0 1 48.332 2 5 SA 2 1 0 30.965 1 6 SA 1 1 2 20.719 2 7 SA 0 2 2 22.127 2 8 SA 2 1 1 34.830 2 9 SA 1 1 1 0.570 1 10 SA 0 1 0 3.640 1 11 SA 0 0 0 0.000 0 12 RS 1 0 1 3.815 1 13 RS 0 0 2 1.083 1 14 RS 0 0 3 1.824 1 15 RS 0 0 0 0.000 0 16 RS 1 2 2 29.471 2 17 RS 1 2 2 36.360 2 18 RS 2 4 2 100.823 4 19 RS 2 4 4 93.542 4
Sample Plots
Type
Ia Ib Ic Vegetation Degradation
Scores
Classes
1 FIS 2 3 2 -6.816 3 2 FIS 2 2 2 -10.504 2 3 FIS 3 3 2 20.553 3 4 FIS 3 3 2 27.488 3 5 FIS 2 3 3 6.914 3 6 FIS 1 3 2 -21.307 2 7 FIS 3 3 2 29.753 3 8 FIS 2 1 2 -19.634 2 9 FIS 1 3 2 -19.053 2 10 FIS 2 3 2 0.049 3 11 FAS 3 3 2 20.553 3 12 FAS 3 3 2 32.007 3 13 FAS 1 2 1 -47.215 2 14 FAS 1 1 2 -37.944 2 15 FAS 1 3 1 -30.508 2 16 FAS 1 3 2 -15.294 2 17 FAS 2 3 2 8.456 3 18 FAS 1 3 2 -7.658 2 19 FAS 2 3 2 3.085 3 20 FAS 1 3 2 -3.057 2 21 ST 4 0 3 51.892 4

ASSESSMENT OF HUMAN AND PHYSICAL FACTORS INFLUENCING SPATIAL DISTRIBUTION OF VEGETATION DEGRADATION -ENVIRONMENTAL PROTECTION AREA CACHOEIRA DAS ANDORINHAS, BRAZIL
31
Eigenvalues First Component Second Component Third Component Eigenvalues 1093.4 191.3 133.0
Percentages 0.771 0.135 0.094
Cumulative Percent-ages
0.771 0.906 1.000
The variables factor loadings or eigenvector values resulted from the PCA (Table 10), are a set of scores, that represents the weighting of each of the original variable on each component. They are scaled like cor-relation coefficients and range from +1 to –1. The nearest the score is to +1 or –1, or the furthest away from zero, the more important is that variable in terms of weighting that component (Kent & Coker 1992). In the first component the variables’ eigenvectors (Table 10) were positive for the indicator invasive spe-cies cover and negative for the understory cover and canopy cover. The indicator invasive species cover had the highest weight (0.764) followed by canopy cover (-0.453) and understory cover (-0.460). The di-rection of the influence of each variable of the first component was used to determine the orientation of the vegetation degradation classes weighting (Appendix 5). Thus, the variable invasive species cover was considered positively correlated with the vegetation degradation process. Understory cover and canopy cover were arranged negatively related to the process, since they presented negative eigenvector values. The orientation and weighting importance of the variables in the first and second components can be visualized in the ordination diagram, presented in the Figure 7. In the diagram, the variable invasive spe-cies cover is located much further of the center in comparison with the other two, and lies in the positive region of the axis x (first component) and axis y (second component). Table 10: Eigenvector values of the Principal Component Analysis (PCA) for the variables invasive species cover, understory cover and canopy cover – Forest areas
Eigenvectors (Factor loadings) Variables
First Component Second Component Third Component
Invasive species cover 0.764 0.644 0.039 Understory cover -0.453 0.492 0.743 Canopy cover -0.460 0.585 -0.660
I
-0.6
-0.4
-0.2
0
0.2
0.4
0.6
0.8
-0.6 -0.4 -0.2 0 0.2 0.4 0.6 0.8
First component
Seco
nd c
ompo
nent
Variables
UC
I- Invasivespecies coverU- Understory coverC- Canopy cover
ASSESSMENT OF HUMAN AND PHYSICAL FACTORS INFLUENCING SPATIAL DISTRIBUTION OF VEGETATION DEGRADATION -ENVIRONMENTAL PROTECTION AREA CACHOEIRA DAS ANDORINHAS, BRAZIL
32
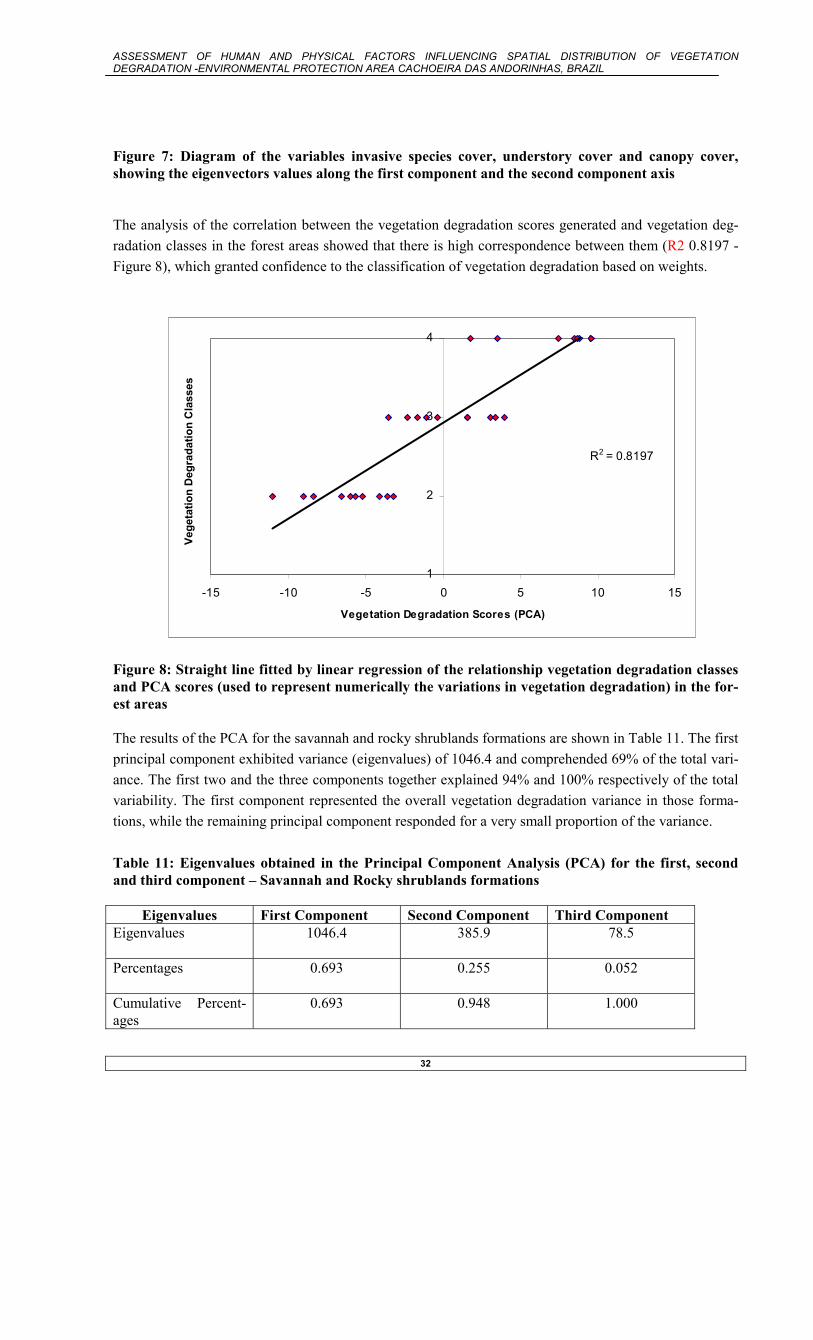
Figure 7: Diagram of the variables invasive species cover, understory cover and canopy cover, showing the eigenvectors values along the first component and the second component axis The analysis of the correlation between the vegetation degradation scores generated and vegetation deg-radation classes in the forest areas showed that there is high correspondence between them (R2 0.8197 - Figure 8), which granted confidence to the classification of vegetation degradation based on weights.
Figure 8: Straight line fitted by linear regression of the relationship vegetation degradation classes and PCA scores (used to represent numerically the variations in vegetation degradation) in the for-est areas The results of the PCA for the savannah and rocky shrublands formations are shown in Table 11. The first principal component exhibited variance (eigenvalues) of 1046.4 and comprehended 69% of the total vari-ance. The first two and the three components together explained 94% and 100% respectively of the total variability. The first component represented the overall vegetation degradation variance in those forma-tions, while the remaining principal component responded for a very small proportion of the variance. Table 11: Eigenvalues obtained in the Principal Component Analysis (PCA) for the first, second and third component – Savannah and Rocky shrublands formations
Eigenvalues First Component Second Component Third Component Eigenvalues 1046.4
385.9 78.5
Percentages 0.693
0.255 0.052
Cumulative Percent-ages
0.693 0.948 1.000
R2 = 0.8197
1
2
3
4
-15 -10 -5 0 5 10 15
Vegetation Degradation Scores (PCA)
Vege
tatio
n D
egra
datio
n C
lass
es
ASSESSMENT OF HUMAN AND PHYSICAL FACTORS INFLUENCING SPATIAL DISTRIBUTION OF VEGETATION DEGRADATION -ENVIRONMENTAL PROTECTION AREA CACHOEIRA DAS ANDORINHAS, BRAZIL
33
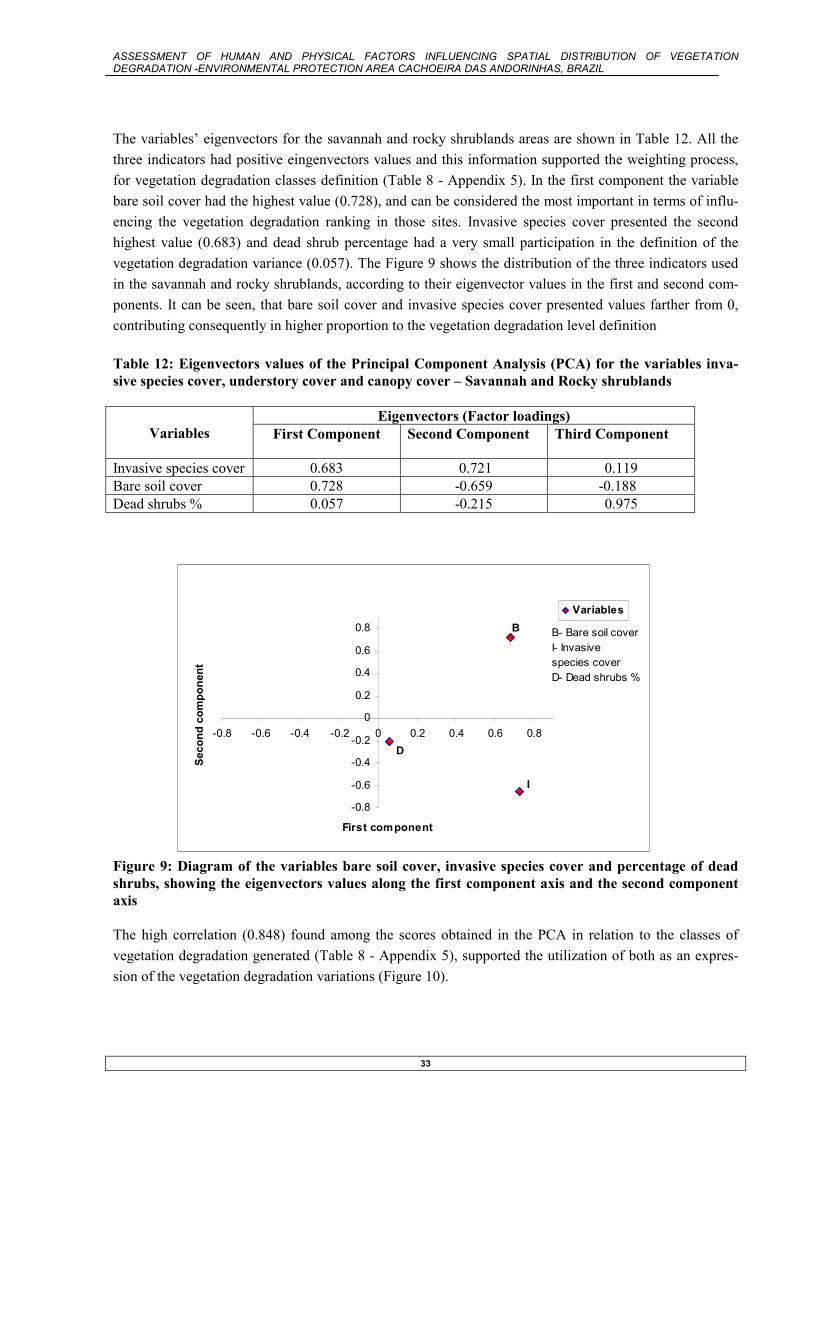
The variables’ eigenvectors for the savannah and rocky shrublands areas are shown in Table 12. All the three indicators had positive eingenvectors values and this information supported the weighting process, for vegetation degradation classes definition (Table 8 - Appendix 5). In the first component the variable bare soil cover had the highest value (0.728), and can be considered the most important in terms of influ-encing the vegetation degradation ranking in those sites. Invasive species cover presented the second highest value (0.683) and dead shrub percentage had a very small participation in the definition of the vegetation degradation variance (0.057). The Figure 9 shows the distribution of the three indicators used in the savannah and rocky shrublands, according to their eigenvector values in the first and second com-ponents. It can be seen, that bare soil cover and invasive species cover presented values farther from 0, contributing consequently in higher proportion to the vegetation degradation level definition Table 12: Eigenvectors values of the Principal Component Analysis (PCA) for the variables inva-sive species cover, understory cover and canopy cover – Savannah and Rocky shrublands
Eigenvectors (Factor loadings) Variables
First Component Second Component Third Component
Invasive species cover 0.683 0.721 0.119 Bare soil cover 0.728 -0.659 -0.188 Dead shrubs % 0.057 -0.215 0.975
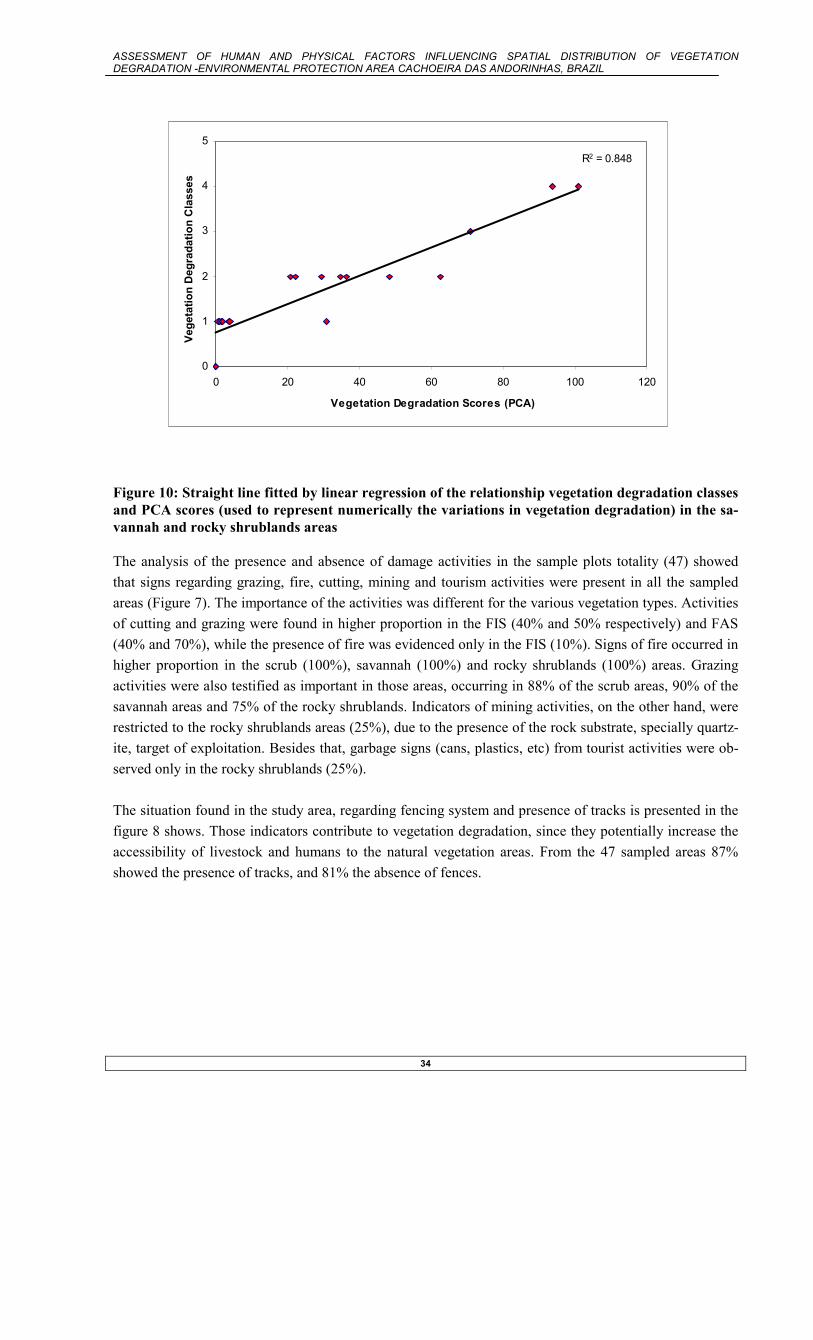
Figure 9: Diagram of the variables bare soil cover, invasive species cover and percentage of dead shrubs, showing the eigenvectors values along the first component axis and the second component axis The high correlation (0.848) found among the scores obtained in the PCA in relation to the classes of vegetation degradation generated (Table 8 - Appendix 5), supported the utilization of both as an expres-sion of the vegetation degradation variations (Figure 10).
I
-0.8
-0.6
-0.4
-0.2
0
0.2
0.4
0.6
0.8
-0.8 -0.6 -0.4 -0.2 0 0.2 0.4 0.6 0.8
First component
Seco
nd c
ompo
nent
Variables
D
B B- Bare soil coverI- Invasivespecies coverD- Dead shrubs %
ASSESSMENT OF HUMAN AND PHYSICAL FACTORS INFLUENCING SPATIAL DISTRIBUTION OF VEGETATION DEGRADATION -ENVIRONMENTAL PROTECTION AREA CACHOEIRA DAS ANDORINHAS, BRAZIL
34
Figure 10: Straight line fitted by linear regression of the relationship vegetation degradation classes and PCA scores (used to represent numerically the variations in vegetation degradation) in the sa-vannah and rocky shrublands areas The analysis of the presence and absence of damage activities in the sample plots totality (47) showed that signs regarding grazing, fire, cutting, mining and tourism activities were present in all the sampled areas (Figure 7). The importance of the activities was different for the various vegetation types. Activities of cutting and grazing were found in higher proportion in the FIS (40% and 50% respectively) and FAS (40% and 70%), while the presence of fire was evidenced only in the FIS (10%). Signs of fire occurred in higher proportion in the scrub (100%), savannah (100%) and rocky shrublands (100%) areas. Grazing activities were also testified as important in those areas, occurring in 88% of the scrub areas, 90% of the savannah areas and 75% of the rocky shrublands. Indicators of mining activities, on the other hand, were restricted to the rocky shrublands areas (25%), due to the presence of the rock substrate, specially quartz-ite, target of exploitation. Besides that, garbage signs (cans, plastics, etc) from tourist activities were ob-served only in the rocky shrublands (25%). The situation found in the study area, regarding fencing system and presence of tracks is presented in the figure 8 shows. Those indicators contribute to vegetation degradation, since they potentially increase the accessibility of livestock and humans to the natural vegetation areas. From the 47 sampled areas 87% showed the presence of tracks, and 81% the absence of fences.
R2 = 0.848
0
1
2
3
4
5
0 20 40 60 80 100 120
Vegetation Degradation Scores (PCA)
Vege
tatio
n D
egra
datio
n C
lass
es

ASSESSMENT OF HUMAN AND PHYSICAL FACTORS INFLUENCING SPATIAL DISTRIBUTION OF VEGETATION DEGRADATION -ENVIRONMENTAL PROTECTION AREA CACHOEIRA DAS ANDORINHAS, BRAZIL
35
Figure 11: Occurrence of the damage activities (fire, Figure 12: Distribution of the indicators tracks grazing, cutting, mining, tourism) in the different ve-getation types, in the sample plots
and fences according to their presence and ab-sence in the sample plots investigated
The distribution of the classified observation points according to vegetation degradation levels is pre-sented in the Map 2. An attempt was made to map the spatial distribution of the different degradation classes. The low number of not degraded situations to limit the spatial distribution of the degraded areas, made unfeasible the task to extrapolate the degradation situation for the whole vegetation areas. More-over, an analysis of the vegetation degradation classes in the GIS environment showed a weak clustering capability for most of the classes, similarities in the spectral characteristics, and consequent overlapping in some classes (Figures 13 to 16). The spatial distribution map was consequently generated only for the extremely degraded scrub areas, that showed a distinctive spectral response and clustering in relation to the other categories (Map 3), and was obtained during the procedures of supervised classification of the land cover.
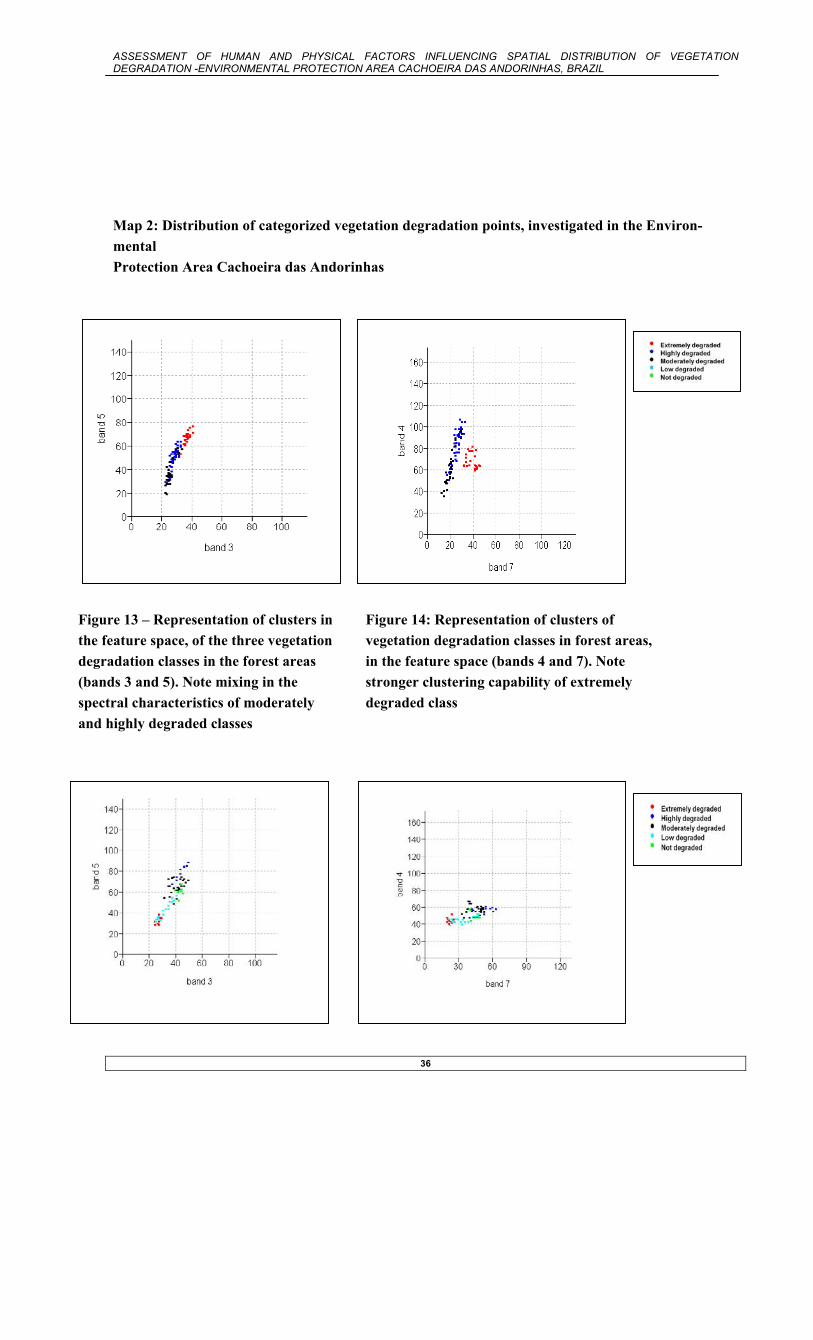
ASSESSMENT OF HUMAN AND PHYSICAL FACTORS INFLUENCING SPATIAL DISTRIBUTION OF VEGETATION DEGRADATION -ENVIRONMENTAL PROTECTION AREA CACHOEIRA DAS ANDORINHAS, BRAZIL
36
Map 2: Distribution of categorized vegetation degradation points, investigated in the Environ-mental Protection Area Cachoeira das Andorinhas
Figure 13 – Representation of clusters in Figure 14: Representation of clusters of the feature space, of the three vegetation vegetation degradation classes in forest areas, degradation classes in the forest areas in the feature space (bands 4 and 7). Note (bands 3 and 5). Note mixing in the stronger clustering capability of extremely spectral characteristics of moderately degraded class and highly degraded classes
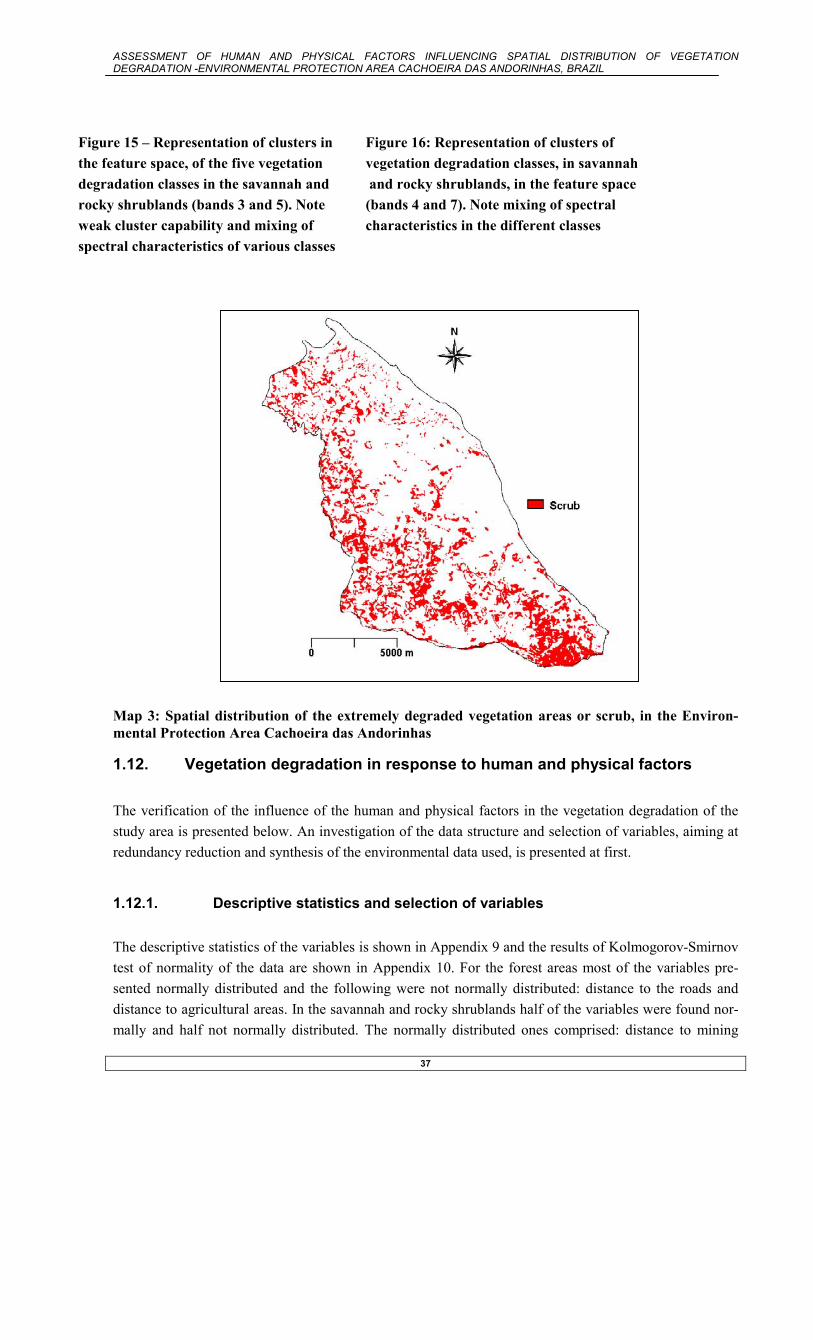
ASSESSMENT OF HUMAN AND PHYSICAL FACTORS INFLUENCING SPATIAL DISTRIBUTION OF VEGETATION DEGRADATION -ENVIRONMENTAL PROTECTION AREA CACHOEIRA DAS ANDORINHAS, BRAZIL
37
Figure 15 – Representation of clusters in Figure 16: Representation of clusters of the feature space, of the five vegetation vegetation degradation classes, in savannah degradation classes in the savannah and and rocky shrublands, in the feature space rocky shrublands (bands 3 and 5). Note (bands 4 and 7). Note mixing of spectral weak cluster capability and mixing of characteristics in the different classes spectral characteristics of various classes
Map 3: Spatial distribution of the extremely degraded vegetation areas or scrub, in the Environ-mental Protection Area Cachoeira das Andorinhas
1.12. Vegetation degradation in response to human and physical factors
The verification of the influence of the human and physical factors in the vegetation degradation of the study area is presented below. An investigation of the data structure and selection of variables, aiming at redundancy reduction and synthesis of the environmental data used, is presented at first.
1.12.1. Descriptive statistics and selection of variables
The descriptive statistics of the variables is shown in Appendix 9 and the results of Kolmogorov-Smirnov test of normality of the data are shown in Appendix 10. For the forest areas most of the variables pre-sented normally distributed and the following were not normally distributed: distance to the roads and distance to agricultural areas. In the savannah and rocky shrublands half of the variables were found nor-mally and half not normally distributed. The normally distributed ones comprised: distance to mining

ASSESSMENT OF HUMAN AND PHYSICAL FACTORS INFLUENCING SPATIAL DISTRIBUTION OF VEGETATION DEGRADATION -ENVIRONMENTAL PROTECTION AREA CACHOEIRA DAS ANDORINHAS, BRAZIL
38
sites, distance to agricultural areas, distance to the drainage, slope, geology and dead shrub percentage. The not normally distributed were: vegetation degradation scores, distance to the roads, distance to vil-lage/city/rural settlements, distance to tourist sites, invasive species cover and bare soil cover. The Principal Component Analysis (PCA) was used for the selection of independent variables (human and physical factors) target of investigation, in order to avoid redundancy. The results of the PCA in the forest and savannah areas are shown in the Appendices 10 and 11. In the forest areas the human factors variables selected were distance to village/city/rural settlements, distance to mining sites and distance to roads. In the Figure 17 it is shown the ordination of the variables along the first and second component axis. The human factors distance to agricultural areas and distance to tourist sites presented clustered to village/city/ rural settlements, with scores very close to zero, and were removed from the analysis. The distance between two points in the PCA diagram is an indication of the similarities between variables. The closeness to zero indicates less influence in the process under consideration.
Figure 17: Diagram of the human factors variables in the forest areas, showing the eigenvectors values along the first and the second component axis, and data redundancy expressed by clustering among distance to village/city rural settlements, distance to tourist sites and agricultural areas The physical variables distance to drainage, geology and slope presented apart from each other, and were all selected for the analysis in the forest areas (Figure 18).
T
-0.6
-0.4
-0.2
0
0.2
0.4
0.6
0.8
-0.6 -0.4 -0.2 0 0.2 0.4 0.6 0.8
First component
Seco
nd c
ompo
nent
Variables
M
R
AV
R- RoadsM- Mining sitesT- Tourist sitesA- Agricultural areasV- Villages

ASSESSMENT OF HUMAN AND PHYSICAL FACTORS INFLUENCING SPATIAL DISTRIBUTION OF VEGETATION DEGRADATION -ENVIRONMENTAL PROTECTION AREA CACHOEIRA DAS ANDORINHAS, BRAZIL
39
Figure 18: Diagram of the physical factors variables in the forest areas showing the eigenvectors values along the first and the second component axis, and distinct distribution of variables For the savannah and rocky shrublands formation the human factors variables selected were distance to tourist sites, distance to mining sites, distance to agricultural areas and distance to roads. The variable distance to village/city/ rural settlements was clustered to tourist sites, with value of the second compo-nent very close to 0 and was removed from the analysis (Figure 19).
Figure 19: Diagram of the human factors variables in the savannah and rocky shrublands areas, showing eigenvectors values along the first and the second component axis, and clustering of the variables distance to distance to village/city/rural settlements and distance to tourist sites
T-0.8
-0.6
-0.4
-0.2
0
0.2
0.4
0.6
0.8
-1 -0.8 -0.6 -0.4 -0.2 0 0.2 0.4 0.6 0.8 1
First component
Seco
nd c
ompo
nent
Variables
M
R
A
V
R- RoadsM- Mining sitesT- Tourist sitesA- Agricultural areasV- Villages
G
-1-0.8-0.6
-0.4-0.2
00.20.4
0.60.8
1
-1 -0.8 -0.6 -0.4 -0.2 0 0.2 0.4 0.6 0.8 1
First component
Seco
nd c
ompo
nent
Variables
S D
D- DrainageG- GeologyS- Slope
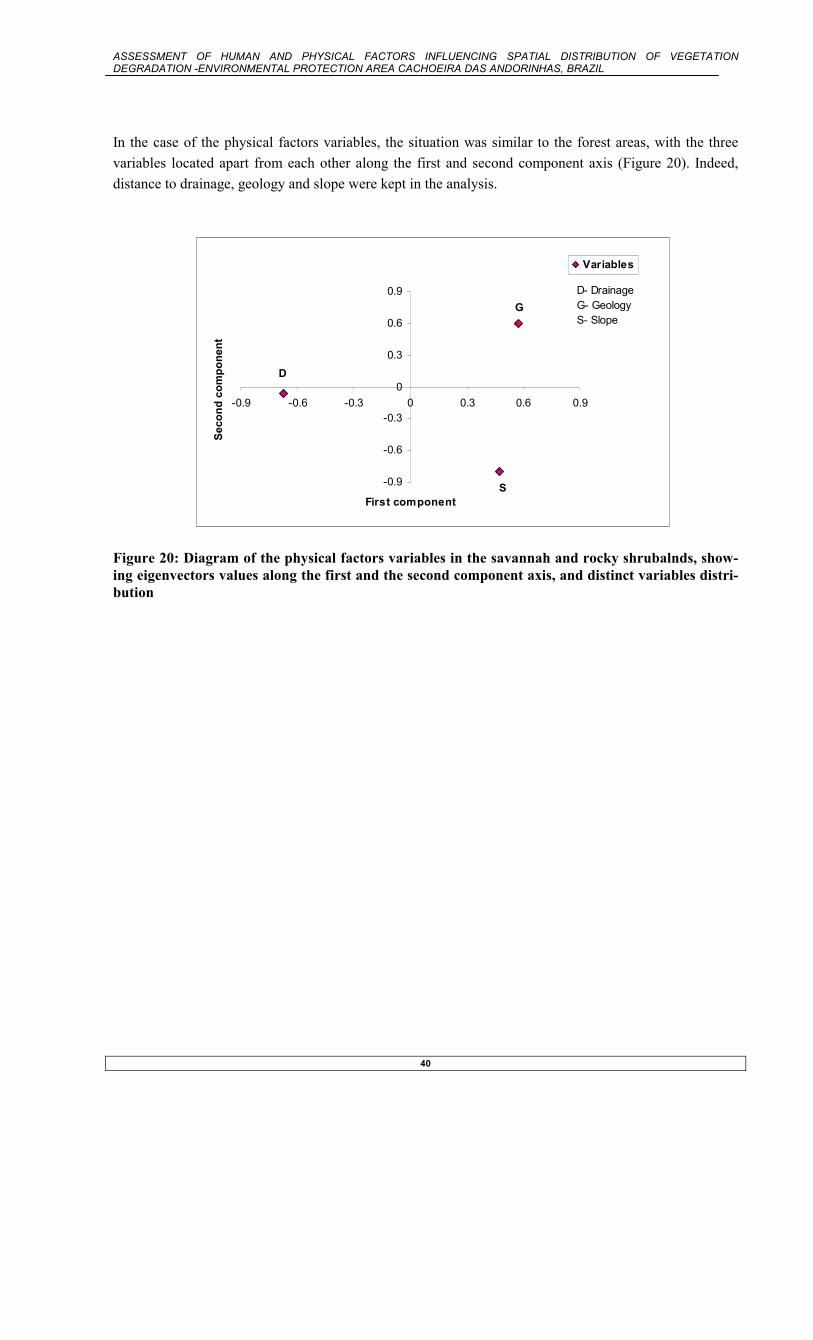
ASSESSMENT OF HUMAN AND PHYSICAL FACTORS INFLUENCING SPATIAL DISTRIBUTION OF VEGETATION DEGRADATION -ENVIRONMENTAL PROTECTION AREA CACHOEIRA DAS ANDORINHAS, BRAZIL
40
In the case of the physical factors variables, the situation was similar to the forest areas, with the three variables located apart from each other along the first and second component axis (Figure 20). Indeed, distance to drainage, geology and slope were kept in the analysis.
Figure 20: Diagram of the physical factors variables in the savannah and rocky shrubalnds, show-ing eigenvectors values along the first and the second component axis, and distinct variables distri-bution
G
-0.9
-0.6
-0.3
0
0.3
0.6
0.9
-0.9 -0.6 -0.3 0 0.3 0.6 0.9
First component
Seco
nd c
ompo
nent
Variables
S
D
D- DrainageG- GeologyS- Slope
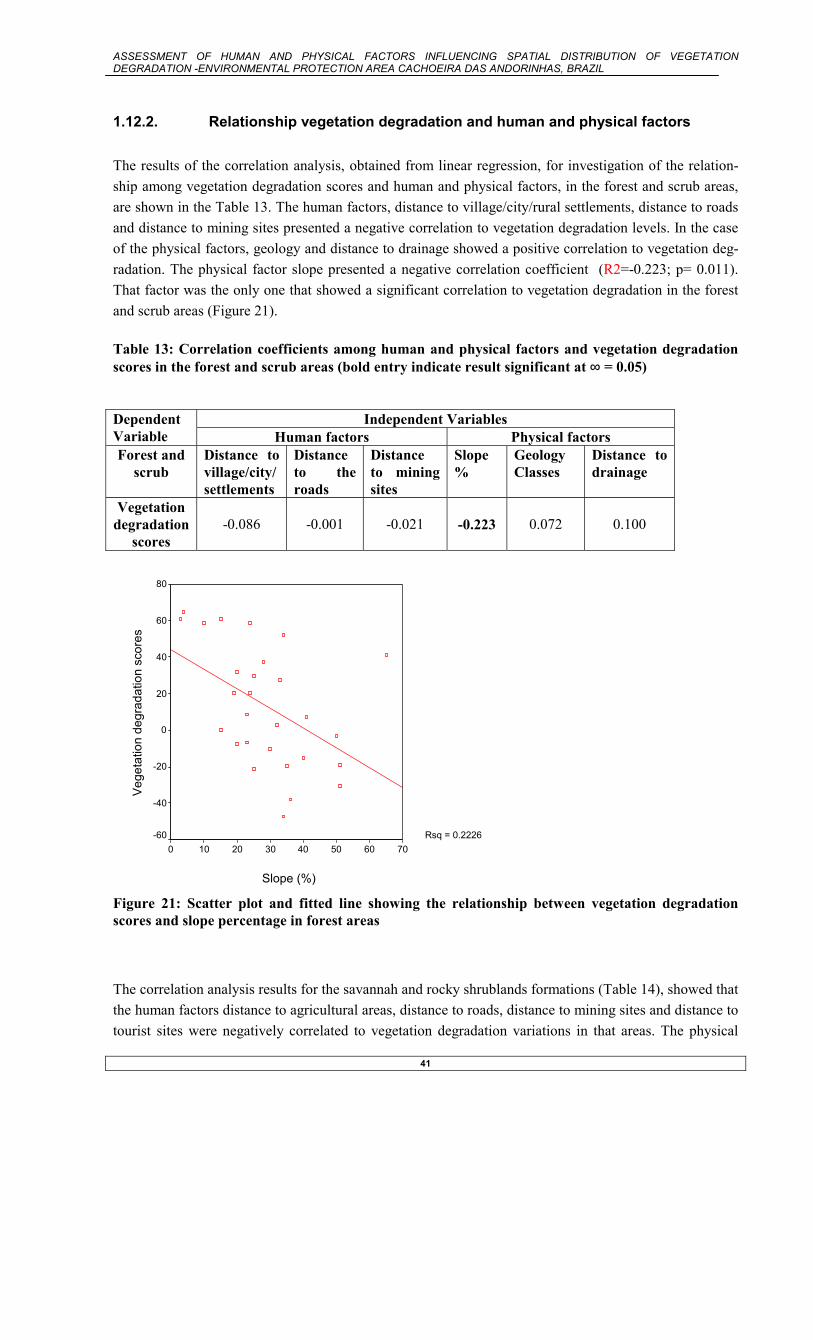
ASSESSMENT OF HUMAN AND PHYSICAL FACTORS INFLUENCING SPATIAL DISTRIBUTION OF VEGETATION DEGRADATION -ENVIRONMENTAL PROTECTION AREA CACHOEIRA DAS ANDORINHAS, BRAZIL
41
1.12.2. Relationship vegetation degradation and human and physical factors
The results of the correlation analysis, obtained from linear regression, for investigation of the relation-ship among vegetation degradation scores and human and physical factors, in the forest and scrub areas, are shown in the Table 13. The human factors, distance to village/city/rural settlements, distance to roads and distance to mining sites presented a negative correlation to vegetation degradation levels. In the case of the physical factors, geology and distance to drainage showed a positive correlation to vegetation deg-radation. The physical factor slope presented a negative correlation coefficient (R2=-0.223; p= 0.011). That factor was the only one that showed a significant correlation to vegetation degradation in the forest and scrub areas (Figure 21). Table 13: Correlation coefficients among human and physical factors and vegetation degradation scores in the forest and scrub areas (bold entry indicate result significant at ∞ = 0.05)
Independent Variables Dependent Variable Human factors Physical factors Forest and
scrub Distance to village/city/ settlements
Distance to the roads
Distance to mining sites
Slope %
Geology Classes
Distance to drainage
Vegetation degradation
scores
-0.086
-0.001
-0.021
-0.223
0.072
0.100
Slope (%)
706050403020100
Vege
tatio
n de
grad
atio
n sc
ores
80
60
40
20
0
-20
-40
-60 Rsq = 0.2226
Figure 21: Scatter plot and fitted line showing the relationship between vegetation degradation scores and slope percentage in forest areas The correlation analysis results for the savannah and rocky shrublands formations (Table 14), showed that the human factors distance to agricultural areas, distance to roads, distance to mining sites and distance to tourist sites were negatively correlated to vegetation degradation variations in that areas. The physical

ASSESSMENT OF HUMAN AND PHYSICAL FACTORS INFLUENCING SPATIAL DISTRIBUTION OF VEGETATION DEGRADATION -ENVIRONMENTAL PROTECTION AREA CACHOEIRA DAS ANDORINHAS, BRAZIL
42
factors slope, geology and distance to drainage were found negatively correlated to vegetation degrada-tion. The human factor distance to tourist sites was the one presented a significant correlation (R2=-0.250; p=0.029) to vegetation degradation (Figure 22). Table 14: Correlation coefficients among human and physical factors and vegetation degradation scores in the savannah and rocky shrublands (bold entry indicate result significant at ∞ = 0.05)
Independent Variables Dependent Variable Human factors Physical factors Savannah and Rocky shrublands
Distance to Agricul-tural areas
Distance to the roads
Distance to mining sites
Distance to tour-ist sites
Slope %
Geology Distance to drainage
Vegetation degradation scores
-0.069
-0.137
-0.056
-0.250
-0.181
-0.061
-0.001
Distance to tourist sites (m)
1000080006000400020000-2000
Vege
tatio
n de
grad
atio
n sc
ores
120
100
80
60
40
20
0
-20 Rsq = 0.2505
Figure 22: Scatter plot and fitted line showing the relationship between vegetation degradation scores and distance to tourist sites in the savannah and rocky shrublands formations
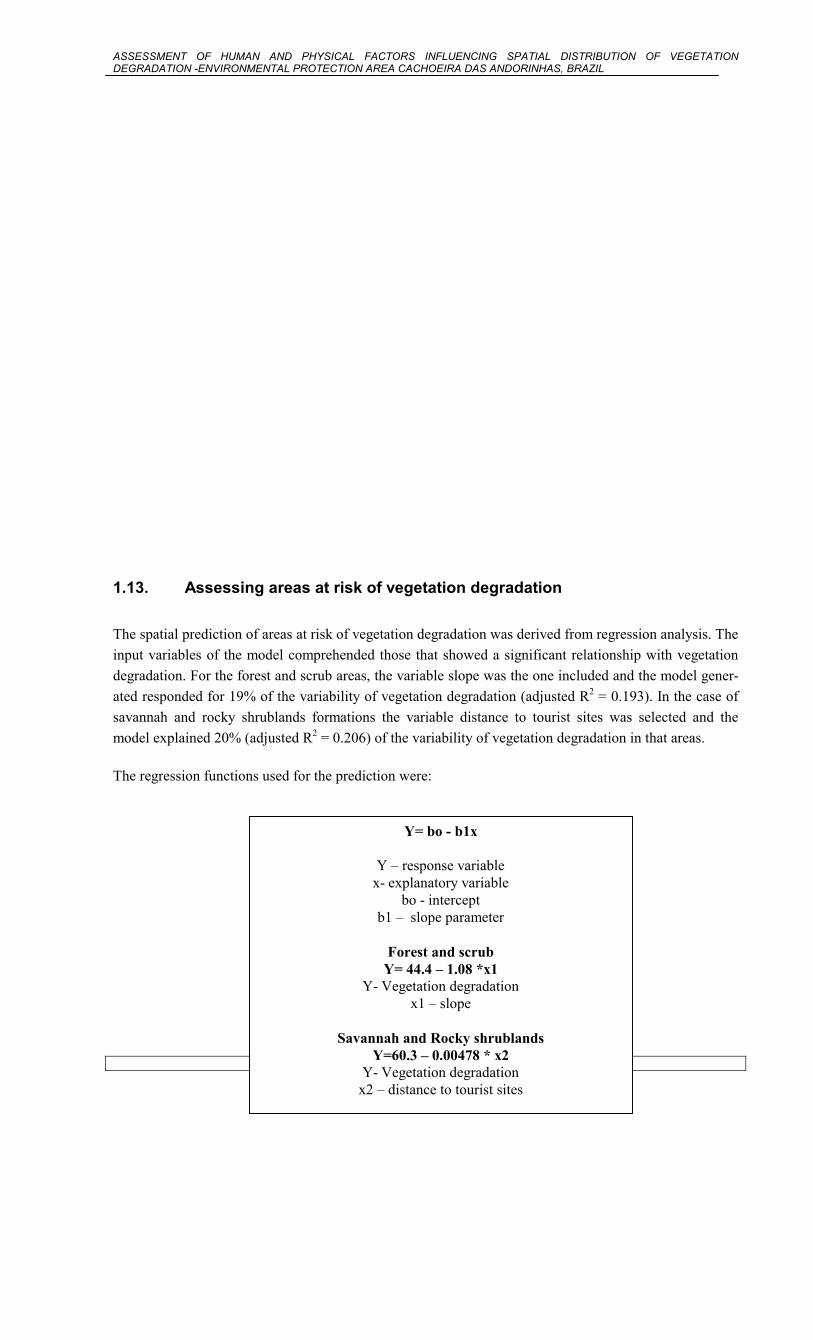
ASSESSMENT OF HUMAN AND PHYSICAL FACTORS INFLUENCING SPATIAL DISTRIBUTION OF VEGETATION DEGRADATION -ENVIRONMENTAL PROTECTION AREA CACHOEIRA DAS ANDORINHAS, BRAZIL
43
1.13. Assessing areas at risk of vegetation degradation
The spatial prediction of areas at risk of vegetation degradation was derived from regression analysis. The input variables of the model comprehended those that showed a significant relationship with vegetation degradation. For the forest and scrub areas, the variable slope was the one included and the model gener-ated responded for 19% of the variability of vegetation degradation (adjusted R2 = 0.193). In the case of savannah and rocky shrublands formations the variable distance to tourist sites was selected and the model explained 20% (adjusted R2 = 0.206) of the variability of vegetation degradation in that areas. The regression functions used for the prediction were:
Y= bo - b1x
Y – response variable x- explanatory variable
bo - intercept b1 – slope parameter
Forest and scrub
Y= 44.4 – 1.08 *x1 Y- Vegetation degradation
x1 – slope
Savannah and Rocky shrublands Y=60.3 – 0.00478 * x2
Y- Vegetation degradation x2 – distance to tourist sites
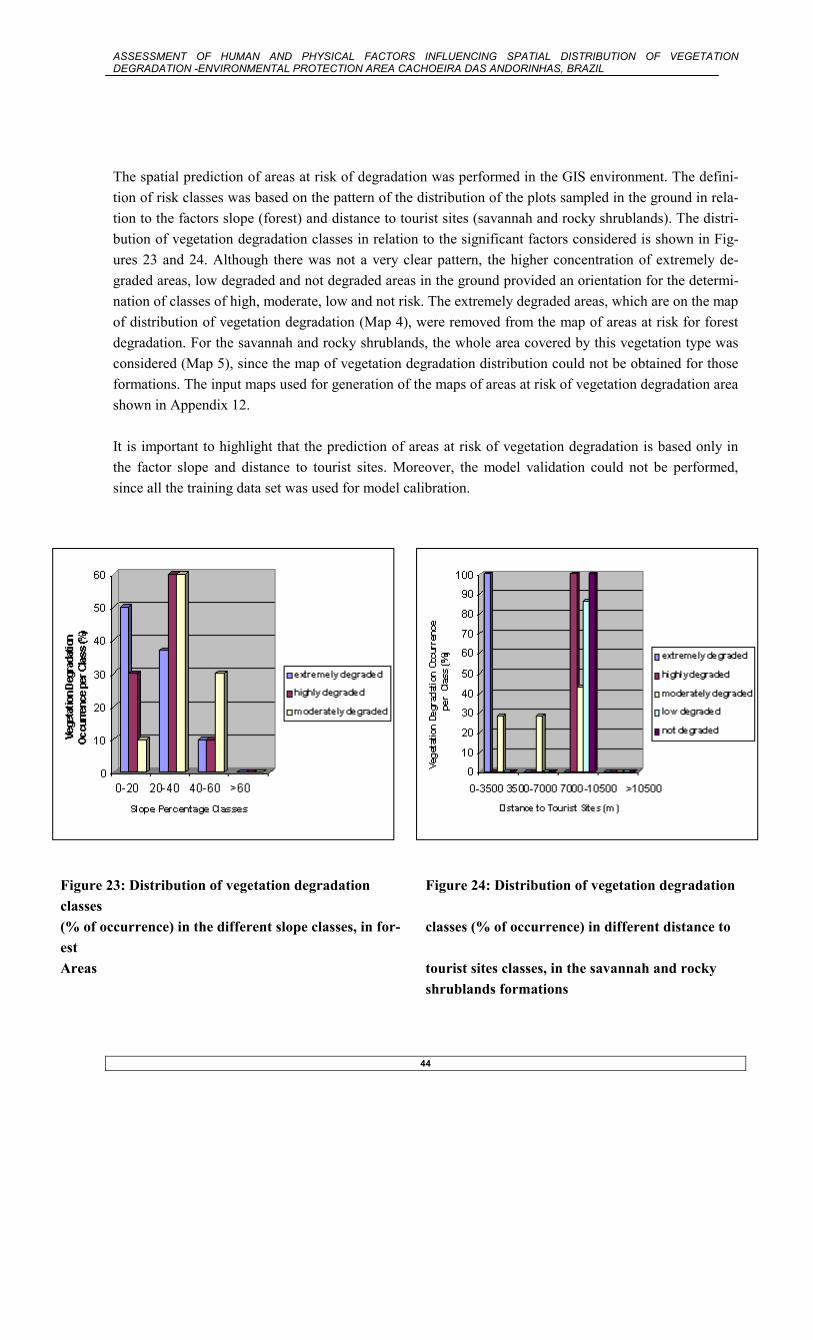
ASSESSMENT OF HUMAN AND PHYSICAL FACTORS INFLUENCING SPATIAL DISTRIBUTION OF VEGETATION DEGRADATION -ENVIRONMENTAL PROTECTION AREA CACHOEIRA DAS ANDORINHAS, BRAZIL
44
The spatial prediction of areas at risk of degradation was performed in the GIS environment. The defini-tion of risk classes was based on the pattern of the distribution of the plots sampled in the ground in rela-tion to the factors slope (forest) and distance to tourist sites (savannah and rocky shrublands). The distri-bution of vegetation degradation classes in relation to the significant factors considered is shown in Fig-ures 23 and 24. Although there was not a very clear pattern, the higher concentration of extremely de-graded areas, low degraded and not degraded areas in the ground provided an orientation for the determi-nation of classes of high, moderate, low and not risk. The extremely degraded areas, which are on the map of distribution of vegetation degradation (Map 4), were removed from the map of areas at risk for forest degradation. For the savannah and rocky shrublands, the whole area covered by this vegetation type was considered (Map 5), since the map of vegetation degradation distribution could not be obtained for those formations. The input maps used for generation of the maps of areas at risk of vegetation degradation area shown in Appendix 12. It is important to highlight that the prediction of areas at risk of vegetation degradation is based only in the factor slope and distance to tourist sites. Moreover, the model validation could not be performed, since all the training data set was used for model calibration.
Figure 23: Distribution of vegetation degradation classes
Figure 24: Distribution of vegetation degradation
(% of occurrence) in the different slope classes, in for-est
classes (% of occurrence) in different distance to
Areas tourist sites classes, in the savannah and rocky shrublands formations
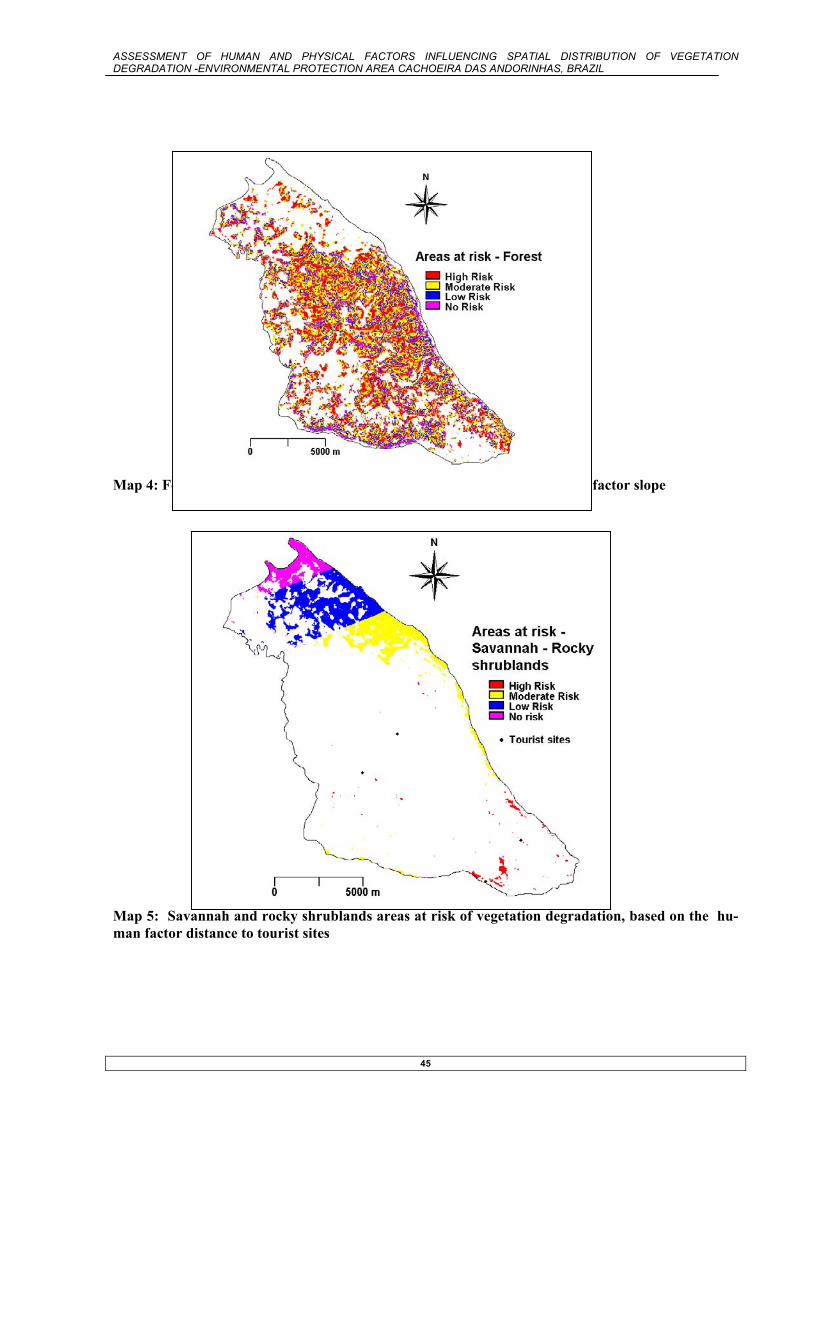
ASSESSMENT OF HUMAN AND PHYSICAL FACTORS INFLUENCING SPATIAL DISTRIBUTION OF VEGETATION DEGRADATION -ENVIRONMENTAL PROTECTION AREA CACHOEIRA DAS ANDORINHAS, BRAZIL
45
Map 4: Forest areas at risk of vegetation degradation, based on the physical factor slope
Map 5: Savannah and rocky shrublands areas at risk of vegetation degradation, based on the hu-man factor distance to tourist sites

ASSESSMENT OF HUMAN AND PHYSICAL FACTORS INFLUENCING SPATIAL DISTRIBUTION OF VEGETATION DEGRADATION -ENVIRONMENTAL PROTECTION AREA CACHOEIRA DAS ANDORINHAS, BRAZIL
46
ASSESSMENT OF HUMAN AND PHYSICAL FACTORS INFLUENCING SPATIAL DISTRIBUTION OF VEGETATION DEGRADATION -ENVIRONMENTAL PROTECTION AREA CACHOEIRA DAS ANDORINHAS, BRAZIL
47
DISCUSSION
1.14. Land cover and vegetation characterization
The accuracy assessment is a fundamental part of the process of image classification because it gives an idea of the validity of the results. The total number of sample plots collected can influence the accuracy (Jensen, 1996). Congalton (1991) suggested a minimum of 50 samples to be collected for each land cover class. In the present research, constraints of time and accessibility to the target areas limited the number of sample plots to a much lower value than the proposed one. However, the overall classification accu-racy obtained in the present study was 82%, which is slightly lower that proposed by Anderson (1976): 85 to 90% for land use and land cover assessment for planning and management purposes. The generaliza-tion of classes certainly contributed to improvements in the accuracy. Moreover, results of 100% in the user accuracy for the classes Eucaliptus plantation, rocky shrublands and pastures, with use of only 6, 8 and 14 sample plots respectively, can be seen as too optimistic and susceptible of errors. The fact that the use of few sample sites to characterize a study area can be a major source of error in remote sensing in-vestigations is referred to by Brogaard & Ólafsdóttir (1997). The authors recommended a sample size lar-ger than 30 sample plots per class aiming to reduce errors. Thus, the judgment of the accuracy assessment results has to be considered together with constraints of sample size, when using the information for deci-sion making.
1.15. Variations and distribution of vegetation degradation
The results of categorization of vegetation in degradation classes showed that the majority of sampled sites were found degraded. The findings have certainly relation with the large amount of damaging activi-ties signs found in the sampled areas. Different authors refer to the contribution of activities such as graz-ing, cutting and fire to processes of vegetation degradation (Kakembo 2001; Dongmo 1998; TCM 1998; Grégroire et al 1998; Hofstad 1997; World Resources Institute 1996; De Pietri 1995; Kumar & Bhandari 1992; De Pietri 1992; Talbot 1986). Additionally, the absence of efficient fencing system as verified in the investigated areas, can bring about increase in grazing pressure and subsequent degradation processes. Kumar & Bhandari (1992) found higher degradation in unfenced areas in relation to the fenced ones, in a study of the impact of protection of areas from free grazing in sand dune vegetation. The forest areas presented higher levels of degradation while undisturbed and low degraded situations were found only in the savannah and rocky shrublands. The large availability of resources, especially wood for fuelwood and building materials in the forest areas (Arnold & Dewees 1997), can be a source of major attraction for damaging activities. In the savannah areas of the EPA the trees are short and occur in low proportion, sparsely distributed through the grass layer, and consequently they do not have the potential for cutting and charcoal produc-tion activities. The latter activity is characterized as the highest important disturbance pressure in most of the savannah areas in Brazil (Mistry 2000). Disturbances caused by fire, although can occur in savannah

ASSESSMENT OF HUMAN AND PHYSICAL FACTORS INFLUENCING SPATIAL DISTRIBUTION OF VEGETATION DEGRADATION -ENVIRONMENTAL PROTECTION AREA CACHOEIRA DAS ANDORINHAS, BRAZIL
48
areas in cases of accidental or criminal intensive burning, are not a major problem when that factor is kept in periodical lower frequencies (Coutinho 1990). Since fire is an old component of savannah ecosystems the vegetation has developed resistance and dependency on this factor (Mistry 2000; Coutinho 1990; Rizzini 1979). Among the beneficial effects of fire one can cite the stimulation of germination, resprout-ing, flowering, fruiting and nutrient recycling acceleration (Coutinho 1990). The rocky shrublands are attractive especially for mining activities, but the impacts, although large, are restricted to the mining location. Similarly, the impacts of tourist activity on the rocky shrublands are lim-ited to those areas close to waterfalls and cities. The use of ecological indicators provided an assessment of the vegetation conditions in the area. The in-dicator invasive species presented the highest weight in the definition of the degradation levels in forest areas, and showed positively correlated to the process. The increase of invasive species and introduced grasses in degraded areas is considered important by different authors (Joshi 2001; De Pietri 1991; TCM 1998; World Resources Institute, 1996). The understory cover and canopy cover presented similar levels of influence in the weighting process and showed negatively correlated to the vegetation degradation. According to De Pietri (1991) the decrease of shade tolerant species in the understory is one of characteristics of degradation in vegetation. Other modi-fications in the understory, as a result of degradation by grazing activities is the reduction of palatable plants and seedlings (TCM 1998; Hofstad 1997; Dongmo 1994). The thinning of the forest canopy cover was pointed out by De Pietri (1991), as a marked tendency in the vegetation degradation process. In stud-ies of forest degradation, areas with lower canopy cover (under 20%) are referred as indicating degrada-tion processes (Hargyono, 1993). In the areas under study the scrub areas presented the lowest canopy cover. According to Pedralli et al (1997) the scrub formations with dominance of Vanillosmopsis erythropappa is a characterisitc secondary succession in the Ouro Preto region, that develops after human disturbances over forest areas. The number of individuals of the species reduces gradually with the devel-opment of the forest into more advanced succession stages. For the savannah and rocky shrublands formations the indicators bare soil cover and invasive species showed higher influence in the vegetation degradation levels definition. Both variables were found posi-tively correlated to degradation what agrees with Dongmo (1994) and De Pietri (1991). The indicator dead shrub percentage had a lower contribution and showed positively correlated to vegetation degrada-tion, what is corroborated by TCM 1998. . The attempt of mapping spatial distribution of vegetation degradation using the Landsat TM image 2000 presented constraints, represented by the low number of undisturbed situations among the sample plots. Vegetation degradation is probably visualized and detected better through monitoring and spatio-temporal image analysis. The methodology developed by Arquero et al (2001), for example, for identification of natural degraded areas using dispersion diagrams of the spectral reflectance of features, relies on monitor-ing of the area under study, and knowledge of the previous state of the actual degraded areas. Other stud-ies using multi-spectral satellite data were undertaken according to multi-temporal map classification (Tanser & Palmer 2000) or in arid landscapes, where a large amount of areas denuded of vegetation was found (Viljoen et. al. 1993).
ASSESSMENT OF HUMAN AND PHYSICAL FACTORS INFLUENCING SPATIAL DISTRIBUTION OF VEGETATION DEGRADATION -ENVIRONMENTAL PROTECTION AREA CACHOEIRA DAS ANDORINHAS, BRAZIL
49
Other limitations to the spatial distribution mapping of variations in vegetation degradation the EPA Ca-choeira das Andorinhas was related to the mixing of spectral characteristics among different classes. In the forest areas, the variations in canopy cover were the best indicators that could be detected from satel-lite sensors and allow the mapping of the vegetation degradation classes. However, only the scrub areas, characterized as extremely degraded, presented a stronger canopy cover differentiation in relation to the others, having potential for mapping. In the savannah and rocky shrublands, the indicator bare soil cover could be the one best suited for detection from satellite sensors, but only three sample plots presented a higher amount of bare soil, enough for differentiation.
1.16. Vegetation degradation distribution in response to human and physical factors
The results of correlation analysis for the forest areas showed that slope is a significant physical factor influencing the vegetation degradation distribution in the EPA Cachoeira das Andorinhas. The negative association of this factor with forest degradation agrees with Mather (1992). This author argues that slope is a proximate factor that can increase accessibility of humans to forest areas. In the study area, activities of cutting and grazing might be hindered by the slope steepness, with presence of higher degradation lev-els in the areas with lower slopes. In the savannah and rocky shrublands formations the human factor ‘distance to tourist sites’ presented a significant negative correlation with vegetation degradation. The tourist visitation is higher in the south-ern part of the EPA, where Ouro Preto and the Andorinhas waterfall are located. In protected areas in Costa Rica and Belize, Farrell & Marion (2001) also found that intense tourist visitation can degrade natural resources and contribute to vegetation damage and loss. The authors argued that successful ecot-ourism and protected area management needs effective management of natural areas for visitor enjoyment and resource protection. There is not yet a planned ecotourism in the study area, with definition of special trails and recreation sites, what might worsen the situation. Marks of garbage (cans, plastics, etc) gener-ated by the activity could be found in the areas sampled. The rocky shrublands in the south portion of the area are the most jeopardized vegetation type by tourist activities. The savannah areas in the north are situated farther from the tourist sites and have been less affected by the activities. An important consid-eration to be made is that among the tourist sites, the most populated areas of the EPA were included (Ouro Preto neighborhoods and São Bartolomeu), what may have contributed for the findings of signifi-cant relationship between vegetation degradation and tourist sites. The human factor ‘distance to roads network’ did not present the expected significant negative relation-ship with vegetation degradation levels in the different vegetation types of the area. Roads network are equivalent to increase accessibility and human activities in the natural vegetation areas bringing about, among others: introduction of exotic species, enhancement of dispersal of particular species, changes in the composition of vegetation and chronic disturbance due to human activity and traffic (Saunders et al 2001). The EPA presents a considerably dense road network, but there is a higher concentration of roads and trails in the portions south and east of the area. According to Saunders et al (2001) the influence of

ASSESSMENT OF HUMAN AND PHYSICAL FACTORS INFLUENCING SPATIAL DISTRIBUTION OF VEGETATION DEGRADATION -ENVIRONMENTAL PROTECTION AREA CACHOEIRA DAS ANDORINHAS, BRAZIL
50
roads in the landscape change structure, for example, is more evident when the spatial distribution of roads is regular across the extent of the study area, and the resolution of the analysis is relatively broad. The fact that only a few spatially explicit factors were found significantly influencing the vegetation deg-radation levels in the study area may indicate that other factors are involved. Kakembo (2001) found land management practices that vary with land-tenure systems, as the main controlling factor to the spatial variations in vegetation degradation in South Africa. In the EPA Cachoeira das Andorinhas there are some indications that land ownership might be a factor influencing vegetation degradation. In the north of the area, conflicts of land ownership were reported during the interviews. The enterprise VDL Siderurgic claims the ownership of 5800 ha in the EPA, but small farmers plead the rights over some properties. Ac-cording to the farmers, the land, where they now live, was a donation made by their employer (previous owner - Queiroz Junior Siderurgic). Furthermore, the long time that they have been settled in the area could give them the rights. The VDL Siderurgic has maintained guards inside the properties to restrict the exploitation of natural resources, specially the cutting of trees (Vannilosmopsis erythropappa). The con-trol over some areas might be affecting the use and level of human disturbances in relation to the neighboring areas. Similarly, in the south of the area, close to Ouro Preto vicinity a patch of forest area (Mata da Brígida) belongs to the UFOP (Federal University of Ouro Preto) that keeps the fenced area as a source of academic research. However, further research is needed to evaluate accurately the influence of land ownership in the vegetation degradation processes in the EPA Cachoeira das Andorinhas. The low number of sample plots, especially in the savannah and rocky shrublands formation may have contributed to the low correlation coefficient and significance of the human and physical factors investi-gated. Assessing the areas at risk of vegetation degradation In the present research, the first step of the assessment of areas at risk of vegetation degradation was the verification of what and in which direction human and physical factors were influencing the spatial distri-bution of variations in vegetation degradation in the area. Regression analysis was performed and the sig-nificant variables were used as input in the spatial model, in the GIS environment. The generated output map of areas at risk of vegetation degradation in the forest areas was based on the physical factor slope. In the savannah and rocky shrublands formations the significant factor distance to the tourist sites was used. The expected validation of the model could not be performed due to the use of all sample units for model calibration. The evaluation or validation of a model is essential for determining how accurate the predictions are (Guisan & Zimmerman 2000). A rough idea of how good the variables explain the spatial variations of vegetation degradation in the area can be given by the resulted adjusted correlation coefficient. The variable slope responded for 19% of the vegetation degradation variability in the forest areas, and distance to tourist sites explained 20% of the variability of vegetation degradation in the savannah and rocky shrublands formations. Although the assessment of areas at risk can provide in-formation to support decision making and management improvement, the low participation of the consid-ered variables in the overall process has to be taken into consideration when using the information.
ASSESSMENT OF HUMAN AND PHYSICAL FACTORS INFLUENCING SPATIAL DISTRIBUTION OF VEGETATION DEGRADATION -ENVIRONMENTAL PROTECTION AREA CACHOEIRA DAS ANDORINHAS, BRAZIL
51
5. CONCLUSION AND RECCCOMENDATIONS
The study has presented an assessment of the spatial distribution of vegetation degradation in the Envi-ronmental Protection Area Cachoeira das Andorinhas and its relationship with human and physical fac-tors. Most of the factors investigated did not present a significant correlation with the variations in vege-tation degradation. However, vegetation degradation in the area was found significantly negatively influ-enced by the factor slope, in the forest areas, and significantly negatively associated to distance to the tourist sites, in the savannah and rocky shrublands formations. Those factors can facilitate accessibility and the development of human damaging activities in the site. The factors slope and distance to tourist sites could be used as input variables to assess the areas at risk of vegetation degradation in the EPA. However, the use of the information for conservation management strategies establishment has to take into consideration the low participation of the input variables in the overall vegetation degradation variability in the area. The combination of Remote Sensing, GIS and ground truth data provided means for the assessment of the spatial distribution of the extremely degraded forest areas, but not for the whole vegetation degradation variations. Landsat TM imagery probably provides better results through spatio - temporal investigations of vegetation degradation, where the previous undisturbed state is well known. The generated map of spa-tial distribution of extremely degraded forest areas (scrub) can provide valuable information for manage-ment improvements and regeneration strategies in the area. The importance of the vegetation of the EPA for watershed protection, representation of remnants of the highly threatened Atlantic Forest in Minas Gerais state, and the intense fragmentation of the vegetation in surrounding areas, bring about concerns about the consequences of persistence of degradation processes in a chronic manner. Effective interventions for land use development and biodiversity protection are needed, but depend on the fully involvement of local communities and stakeholders in the decisions for management strategy definition. Some recommendations for further research and management of the area are given following, based on the present study findings: - Investigation of vegetation degradation through permanent plots to track better the process dynamics - Investigation of the influence of other factors, such as, land ownership in the vegetation degradation
process - Investigation of intensity of damaging activities in the vegetation areas - Establishment of remote sensing monitoring system to track undesirable changes in the vegetation, in
the spatio-temporal context
ASSESSMENT OF HUMAN AND PHYSICAL FACTORS INFLUENCING SPATIAL DISTRIBUTION OF VEGETATION DEGRADATION -ENVIRONMENTAL PROTECTION AREA CACHOEIRA DAS ANDORINHAS, BRAZIL
52
- Elaboration of ecotourism plan that include the local communities and orientates visitors - Elaboration of general forest management plan for the whole area - Support to the communities for the establishment of effective fencing system and appropriate pas-
tures management, that exclude the grazing of livestock in the natural vegetation areas, specially in the lower slopes
ABSTRACT Most of the investigation of factors influencing vegetation degradation in the spatial context has been di-rected at arid landscapes or at degradation of temperate and tropical forests. This study examined the influence of human and physical factors in the spatial distribution of vegetation degradation in the Environmental Protection Area Cachoeira das Andorinhas (Brazil), characterized by subtropical moderately humid climate. The degradation affects forest, savannah and rocky shrublands formations. Remote Sensing, Geographic Information Systems (GIS) and statistical analysis techniques were used together with field data collection. Landsat TM image, topographic map, DEM and secondary data were used for generation of maps of the human and physical factors examined. Those factors comprised: dis-tance to the roads, distance to rural settlements/village/city, distance to tourist sites, distance to mining sites, distance to agricultural areas, distance to the drainage, slope and geology. The diagnosis of vegeta-tion degradation variations was made with utilization of five ecological indicators: invasive species cover, understory cover, canopy cover, bare soil cover and dead shrub percentage. The total of 47 sample plots was classified according to vegetation degradation variations. Principal Component Analysis was per-formed for generation of scores that represented numerically the levels of vegetation degradation. Regres-sion analysis was used to investigate the relationship between vegetation degradation and human and physical factors, and to select significant variables, used in the assessment of areas at risk of vegetation degradation. The factors slope and distance to tourist sites presented significantly negatively correlated to the vegeta-tion degradation in forest and savannah /rocky shrublands formations, respectively. The assessment of areas at risk of vegetation degradation was based on those factors that represented 20% and 19% respec-tively of the variability of the vegetation degradation variations in the area. The spatial variations of vege-tation degradation were mapped for the extremely degraded forest areas (scrub). The factors slope and distance to tourist sites can enhance accessibility of humans and livestock to natural vegetation areas which may increase intensity of damaging activities in areas of lower slope and shorter distance to tourist sites. The low significance of the factors used to assess areas at risk of vegetation deg-radation suggested limitations for further use of the information. The possibility of mapping spatial distri-bution of vegetation degradation only for extremely degraded areas suggested limitations of using remote sensing techniques to detect the degradation process when considering one single point in time, few un-disturbed situations and lower levels of degradation.

ASSESSMENT OF HUMAN AND PHYSICAL FACTORS INFLUENCING SPATIAL DISTRIBUTION OF VEGETATION DEGRADATION -ENVIRONMENTAL PROTECTION AREA CACHOEIRA DAS ANDORINHAS, BRAZIL
53
The information can contribute to improvements in conservation management strategies in the protection area, but the low influence of the factors in the overall vegetation degradation process has to be consid-ered. The low number of not degraded situations among the sampled units presented as a constraint for vegeta-tion degradation mapping, that is better detected through monitoring. The assessment of areas at risk of vegetation degradation presented constraints of low significance of the factors involved. This author argues that slope is a proximate factor that can increase accessibility of humans to forest ar-eas. In the study area, activities of cutting and grazing might be hindered by the slope steepness, with presence of higher degradation levels in the areas with lower slopes. The influence of the factors slope and distance to tourist sites can be seen as an expression of the underly-ing inappropriate use and management of the vegetation resources in the Environmental Protection Area Cachoeira das Andorinhas. Those factors can facilitate accessibility and the development of human dam-age activities in the site. Some recommendations for management are made following, based on the research findings and inter-views undertaken: Reccomm: futher research Investigation of other factors, land ownership Research using permanent plots for better investigstion of the process Intensity of damage in different areas Monitoring investigation of changes in a spatio-temporal context Implications for management People involvement, area of sutainable use: high proportion of damge activites

ASSESSMENT OF HUMAN AND PHYSICAL FACTORS INFLUENCING SPATIAL DISTRIBUTION OF VEGETATION DEGRADATION -ENVIRONMENTAL PROTECTION AREA CACHOEIRA DAS ANDORINHAS, BRAZIL
54
The findings of vegetation degradation reflected in the increase of invasive species, understory impover-ishment, canopy cover decrease, bare soil cover increase and increase of dead shrubs has an indication of vulnerability and risk of the ecosystems found inside the protection area. In the forest areas, 36% of the investigated sites presented moderately degraded, 36% highly degraded and 28% extremely degraded. In the savannah and rocky shrublands formations, 37% of the examined areas were found low degraded, 37% moderately degraded, 6% highly degraded, 10% extremely degraded and 10% not degraded. - Elaboration of zoning and management plan for the area with establishment of priority areas for con-
servation, management and use of natural resources - Elaboration of general forest management plan for the whole area - Elaboration of ecotourism plan that contemplates the local communities and orientates visitors - Establishment of remote sensing monitoring system to track undesirable changes in the environment - Improvement in the involvement of local communities, including awareness about implications of the
fact that the area is an EPA and education concerning fauna and flora conservation - Support to the communities for the establishment of effective fencing system and appropriate pas-
tures management, that exclude the grazing of livestock in the natural vegetation areas - Investigation and solution of land ownership conflicts - Support to the local communities regarding agriculture assistance, establishment of cooperatives for
small scale products sell and alternative activities for income generation - Support and orientation to miners that has the quartzite exploitation as a source of income, regarding
licensing procedures and recuperation plan
can be seen as an expression of the underlying inappropriate use and management of the vegetation re-sources in the Environmental Protection Area Cachoeira das Andorinhas, since they

ASSESSMENT OF HUMAN AND PHYSICAL FACTORS INFLUENCING SPATIAL DISTRIBUTION OF VEGETATION DEGRADATION -ENVIRONMENTAL PROTECTION AREA CACHOEIRA DAS ANDORINHAS, BRAZIL
55
The assessment of areas at risk using regression analysis and GIS modeling provided an indication of ar-eas of higher vulnerability to damage activities. The use of of use of integrated capabilities of There are variations in the levels of vegetation degradation, with forest areas presenting higher levels of degradation in realtion to this and that Remote sensing allowed this and this but not the mapping of the overall, with only scrub areas mapped The areas were assed for risk in relation to factors this and this, but represented low variabilita The use of integrated capabilities of Remote Sensing, GIS and ground truth data allowed the classification of the land cover and vegetation of the study area, tested in a Confusion Matrix. According to Johnston (1998) satellite imagery has many advantages as a source of GIS data: it can be obtained in digital form; provides frequent recurrence of coverage; allows cover of an extensive area and efficient image analysis. The author pointed out that Landsat Thematic Mapper imagery, resolution 30m, offers desirable charac-teristics for land cover, land use and ecological applications. According to Johnson (1988) risk can be defined as the probability of occurrence of a specific undesirable event. Due to the fact that nature is too complex and heterogeneous to be accurately predicted in every aspect of time and space (Guisan and Zimmerman 2000), the selection of relevant measurable variables that reflects the ecosystem state is fundamental in model simulation (Johnson 1988). The predictive geographical modeling in ecology is generally based on hypothesis on how environmental factors influences the distribution of communities (Guisan & Zimmermann 2000).

ASSESSMENT OF HUMAN AND PHYSICAL FACTORS INFLUENCING SPATIAL DISTRIBUTION OF VEGETATION DEGRADATION -ENVIRONMENTAL PROTECTION AREA CACHOEIRA DAS ANDORINHAS, BRAZIL
56
the situation as it of the question that if the degradation persist in chronic state the area can become as fragmented as the areas in the surroundings. The Environmental Area cachoeria das Andorinhas is a conservation category of sustainable use th repectively in the forest and savannah/rocky shrublands formation. Those factors can been seen of an expression of human activities in the area, through cutting, grazing, mining and fire activities. The high incidence of degradation levels in the forest, savannah and rocky shrublands found shows the vulnerability of that ecosystems and the necessity of establishment of management strategies to meliorate the situation presence of signs of damage activities and quantification of ecological indicators provided the inidcation that the vegetation in the area is target of degradation processes. Moreover, Coutinho (1990) and Mistry (2000) presented that presence of invasive species, principally Melinis minutiflora is an important threat for the native flora of the brazilian savannah, reducing biodi-versity of the herbaceous flora, increasing fire temperature and greater loss in nutrients. In the degraded savannah areas of the EPA Cachoeira das Andorinhas, that invasive species was also found.
ASSESSMENT OF HUMAN AND PHYSICAL FACTORS INFLUENCING SPATIAL DISTRIBUTION OF VEGETATION DEGRADATION -ENVIRONMENTAL PROTECTION AREA CACHOEIRA DAS ANDORINHAS, BRAZIL
57
The fact that activities such as grazing, cutting and fire contribute to processes of vegetation degradation is referred by different authors The results of the categorization of the 28 sample plots of the forest and scrub areas into vegetation deg-radation conditions are presented in the Table 7. The criteria, threshold values and original data used are shown in Appendices 5, 6 and 7. From the total areas sampled, 8 cases were classified as extremely de-graded (class four), 10 as highly degraded (class three), and 10 cases were found moderately degraded (class two). The forest intermediate stage presented 60% of the sample plots classified as highly degraded and 40% as moderately degraded. The forest advanced stage, otherwise, comprehended 40% of sample units classified as highly degraded and 60% as moderately degraded. The scrub areas were all classified
ASSESSMENT OF HUMAN AND PHYSICAL FACTORS INFLUENCING SPATIAL DISTRIBUTION OF VEGETATION DEGRADATION -ENVIRONMENTAL PROTECTION AREA CACHOEIRA DAS ANDORINHAS, BRAZIL
58
as extremely degraded. For the savannah and rocky shrublands formations (Table 8), in the totality of 19 sample plots, 2 cases were found extremely degraded (class four), 1 case highly degraded (class three), 7 moderately degraded (class two), 7 low degraded (class one) and 1 not degraded (class zero). The savan-nah had 9% of the sample plots classified as highly degraded, 46% as moderately degraded, 36% as low degraded and 9% as not degraded. The rocky shrublands comprehended 25% classified as extremely de-graded, 25% moderately degraded, 38% as low degraded and 12% as not degraded. The generation of maps of land cover, vegetation, and area at risk of vegetation degradation can bring about applications for management improvements in the area. Consideri
ASSESSMENT OF HUMAN AND PHYSICAL FACTORS INFLUENCING SPATIAL DISTRIBUTION OF VEGETATION DEGRADATION -ENVIRONMENTAL PROTECTION AREA CACHOEIRA DAS ANDORINHAS, BRAZIL
59
Considering the area under study, the closeness to Ouro Preto bring about other damage activities, includ-ing the quartzite exploitation in a river bed close to Cachoeira das Andorinhas waterfall and free grazing activities. research scope. Short term perspective what is more visible: bare soil cover, inv speceis and decrease of healthy shrubs .

ASSESSMENT OF HUMAN AND PHYSICAL FACTORS INFLUENCING SPATIAL DISTRIBUTION OF VEGETATION DEGRADATION -ENVIRONMENTAL PROTECTION AREA CACHOEIRA DAS ANDORINHAS, BRAZIL
60

ASSESSMENT OF HUMAN AND PHYSICAL FACTORS INFLUENCING SPATIAL DISTRIBUTION OF VEGETATION DEGRADATION -ENVIRONMENTAL PROTECTION AREA CACHOEIRA DAS ANDORINHAS, BRAZIL
61

ASSESSMENT OF HUMAN AND PHYSICAL FACTORS INFLUENCING SPATIAL DISTRIBUTION OF VEGETATION DEGRADATION -ENVIRONMENTAL PROTECTION AREA CACHOEIRA DAS ANDORINHAS, BRAZIL
62
6.

ASSESSMENT OF HUMAN AND PHYSICAL FACTORS INFLUENCING SPATIAL DISTRIBUTION OF VEGETATION DEGRADATION -ENVIRONMENTAL PROTECTION AREA CACHOEIRA DAS ANDORINHAS, BRAZIL
63
ACKNOWLEDGEMENTS
3.3- Vegetation degradation distribution in response to human and physical factors 3.4- Assessing areas at risk of vegetation degradation

ASSESSMENT OF HUMAN AND PHYSICAL FACTORS INFLUENCING SPATIAL DISTRIBUTION OF VEGETATION DEGRADATION -ENVIRONMENTAL PROTECTION AREA CACHOEIRA DAS ANDORINHAS, BRAZIL
64
7. References
Andrade, J.A. 2000. Diagnostico Geoambiental da Cabeceira do Rio das Velhas – APA Cachoeira das Andorinhas, Ouro Preto, Minas Gerais. Dissertacao de Mestrado. Universidade Federal de Ouro Preto, MG. Brasil. Van Duren, I. 2001. Biodiversity. Elective 9. ITC. IEF.1994. Processo no. 2394. Plano de Manejo Florestal Simplificado Simultaneo. Fazenda Cardoso (Evanir Alves Pinto), Ouro Preto, MG. Lorenzi, H. 1992. Arvores Brasileiras – manual de Identificacao e cultivo de plantas arboreas nativas do Brasil. Nova Odessa, SP: Edotora Plantarum. IBGE, 1991. Censo Demografico. Resultados do universo relativos as caracteristicas da populacao e dos domicilios. Numero 18 – Minas Gerais. IBGE ( Fundacao Instituto Brasileiro de Geografia e Estatistica, censo Demografico, Riode janeiro, p.1 –1037, IbGE/CDDI. Depto de Documentacao e Bibliotec – R.J. IBGE/93-20 IBGE 2001Sinopse preliminar do Censo demografico 2000 – volume 7 – 1. brasil – censo Demografico.1. IBGE.II. Recenseamento geral do Brasil. IBGE. CDDI. DEPTO de Documentacao e Biblioteca, RJ. IBGE 20001 –06-fev.
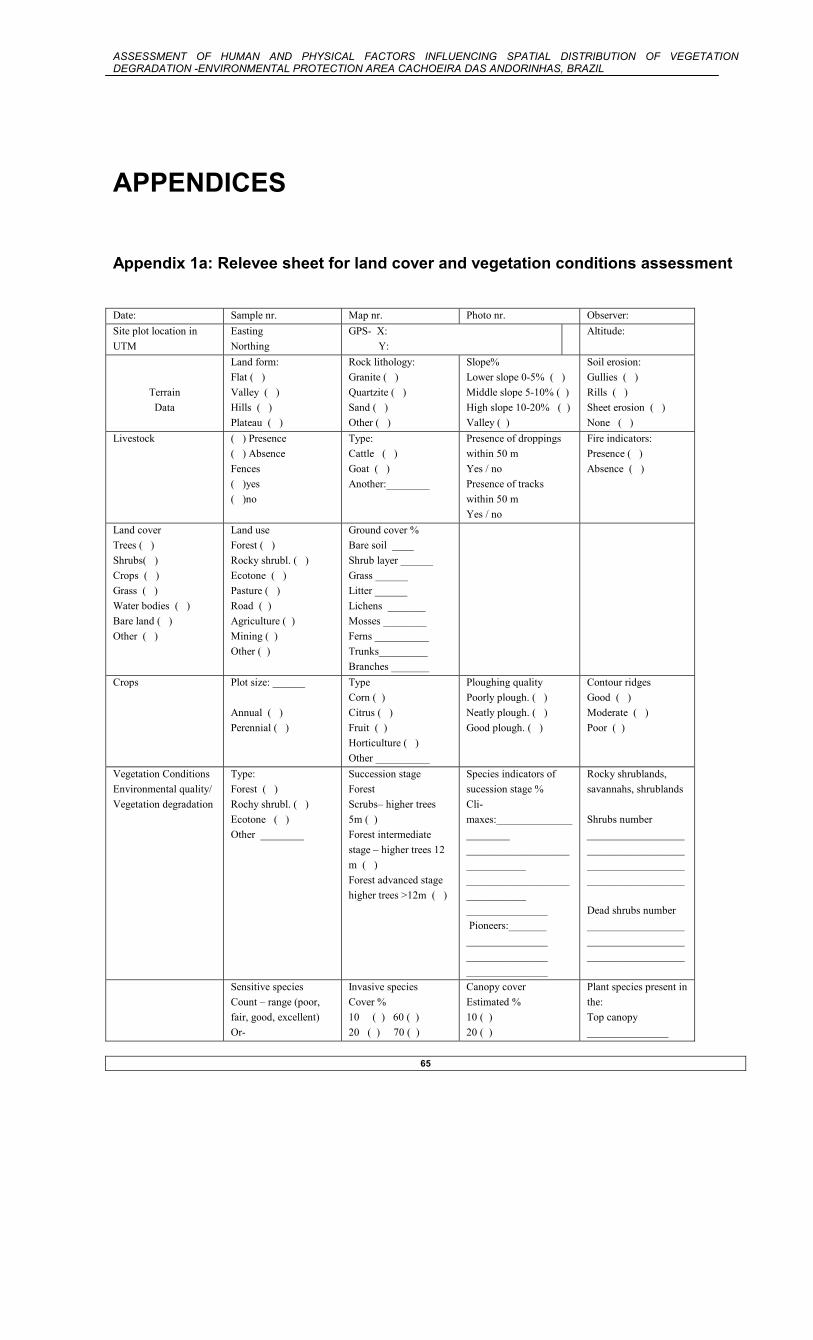
ASSESSMENT OF HUMAN AND PHYSICAL FACTORS INFLUENCING SPATIAL DISTRIBUTION OF VEGETATION DEGRADATION -ENVIRONMENTAL PROTECTION AREA CACHOEIRA DAS ANDORINHAS, BRAZIL
65
APPENDICES
Appendix 1a: Relevee sheet for land cover and vegetation conditions assessment
Date: Sample nr. Map nr. Photo nr. Observer: Site plot location in UTM
Easting Northing
GPS- X: Y:
Altitude:
Terrain Data
Land form: Flat ( ) Valley ( ) Hills ( ) Plateau ( )
Rock lithology: Granite ( ) Quartzite ( ) Sand ( ) Other ( )
Slope% Lower slope 0-5% ( ) Middle slope 5-10% ( ) High slope 10-20% ( ) Valley ( )
Soil erosion: Gullies ( ) Rills ( ) Sheet erosion ( ) None ( )
Livestock ( ) Presence ( ) Absence Fences ( )yes ( )no
Type: Cattle ( ) Goat ( ) Another:________
Presence of droppings within 50 m Yes / no Presence of tracks within 50 m Yes / no
Fire indicators: Presence ( ) Absence ( )
Land cover Trees ( ) Shrubs( ) Crops ( ) Grass ( ) Water bodies ( ) Bare land ( ) Other ( )
Land use Forest ( ) Rocky shrubl. ( ) Ecotone ( ) Pasture ( ) Road ( ) Agriculture ( ) Mining ( ) Other ( )
Ground cover % Bare soil ____ Shrub layer ______ Grass ______ Litter ______ Lichens _______ Mosses ________ Ferns __________ Trunks_________ Branches _______
Crops
Plot size: ______ Annual ( ) Perennial ( )
Type Corn ( ) Citrus ( ) Fruit ( ) Horticulture ( ) Other __________
Ploughing quality Poorly plough. ( ) Neatly plough. ( ) Good plough. ( )
Contour ridges Good ( ) Moderate ( ) Poor ( )
Vegetation Conditions Environmental quality/ Vegetation degradation
Type: Forest ( ) Rochy shrubl. ( ) Ecotone ( ) Other ________
Succession stage Forest Scrubs– higher trees 5m ( ) Forest intermediate stage – higher trees 12 m ( ) Forest advanced stage higher trees >12m ( )
Species indicators of sucession stage % Cli-maxes:______________________ ______________________________ ______________________________ _______________ Pioneers:_______ _______________ _______________ _______________
Rocky shrublands, savannahs, shrublands Shrubs number ________________________________________________________________________ Dead shrubs number ______________________________________________________
Sensitive species Count – range (poor, fair, good, excellent) Or-
Invasive species Cover % 10 ( ) 60 ( ) 20 ( ) 70 ( )
Canopy cover Estimated % 10 ( ) 20 ( )
Plant species present in the: Top canopy _______________
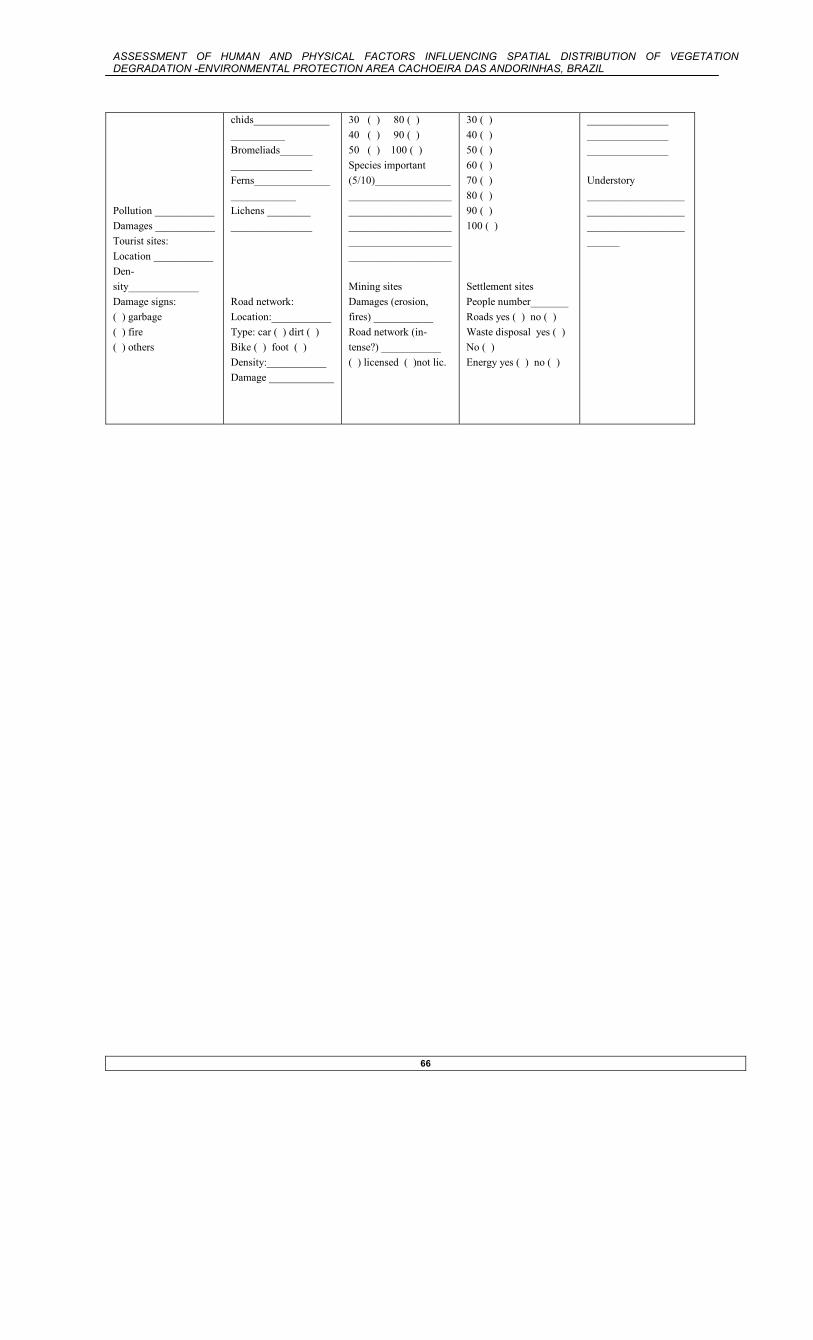
ASSESSMENT OF HUMAN AND PHYSICAL FACTORS INFLUENCING SPATIAL DISTRIBUTION OF VEGETATION DEGRADATION -ENVIRONMENTAL PROTECTION AREA CACHOEIRA DAS ANDORINHAS, BRAZIL
66
Pollution ___________ Damages ___________ Tourist sites: Location ___________ Den-sity_____________ Damage signs: ( ) garbage ( ) fire ( ) others
chids________________________ Bromeliads______ _______________ Ferns__________________________ Lichens ________ _______________ Road network: Location:___________ Type: car ( ) dirt ( ) Bike ( ) foot ( ) Density:___________ Damage ____________
30 ( ) 80 ( ) 40 ( ) 90 ( ) 50 ( ) 100 ( ) Species important (5/10)_____________________________________________________________________________________________________________ Mining sites Damages (erosion, fires) ___________ Road network (in-tense?) ___________ ( ) licensed ( )not lic.
30 ( ) 40 ( ) 50 ( ) 60 ( ) 70 ( ) 80 ( ) 90 ( ) 100 ( ) Settlement sites People number_______ Roads yes ( ) no ( ) Waste disposal yes ( ) No ( ) Energy yes ( ) no ( )
_______________ _______________ _______________ Understory ____________________________________________________________

ASSESSMENT OF HUMAN AND PHYSICAL FACTORS INFLUENCING SPATIAL DISTRIBUTION OF VEGETATION DEGRADATION -ENVIRONMENTAL PROTECTION AREA CACHOEIRA DAS ANDORINHAS, BRAZIL
67
Appendix 1b: Relevee sheet for forest structure data collection
Date: Sample no. Vegetation type:
Observer:
Point no Distance (tran-sect line)
DBH (≥ 10cm) Height Species
1 2 3 4 5 6 7 8 9 10 11 12 13 14 15 16 17 18 19 20 21 22 23 24 25 26 27 28 29

ASSESSMENT OF HUMAN AND PHYSICAL FACTORS INFLUENCING SPATIAL DISTRIBUTION OF VEGETATION DEGRADATION -ENVIRONMENTAL PROTECTION AREA CACHOEIRA DAS ANDORINHAS, BRAZIL
68
30 31 32 33 34 35

ASSESSMENT OF HUMAN AND PHYSICAL FACTORS INFLUENCING SPATIAL DISTRIBUTION OF VEGETATION DEGRADATION -ENVIRONMENTAL PROTECTION AREA CACHOEIRA DAS ANDORINHAS, BRAZIL
69
Appendix 2: Map of observation points
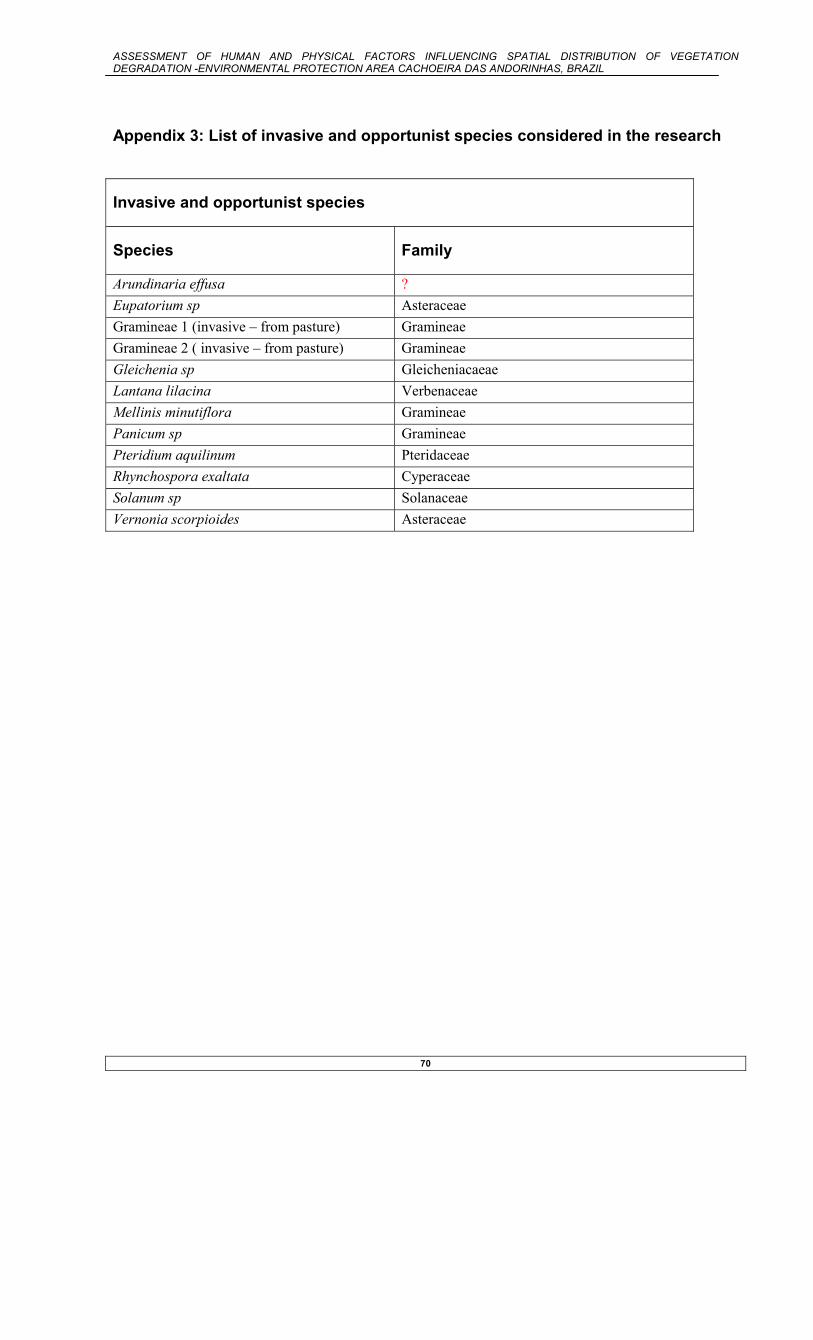
ASSESSMENT OF HUMAN AND PHYSICAL FACTORS INFLUENCING SPATIAL DISTRIBUTION OF VEGETATION DEGRADATION -ENVIRONMENTAL PROTECTION AREA CACHOEIRA DAS ANDORINHAS, BRAZIL
70
Appendix 3: List of invasive and opportunist species considered in the research
Invasive and opportunist species
Species Family
Arundinaria effusa ? Eupatorium sp Asteraceae Gramineae 1 (invasive – from pasture) Gramineae Gramineae 2 ( invasive – from pasture) Gramineae Gleichenia sp Gleicheniacaeae Lantana lilacina Verbenaceae Mellinis minutiflora Gramineae Panicum sp Gramineae Pteridium aquilinum Pteridaceae Rhynchospora exaltata Cyperaceae Solanum sp Solanaceae Vernonia scorpioides Asteraceae
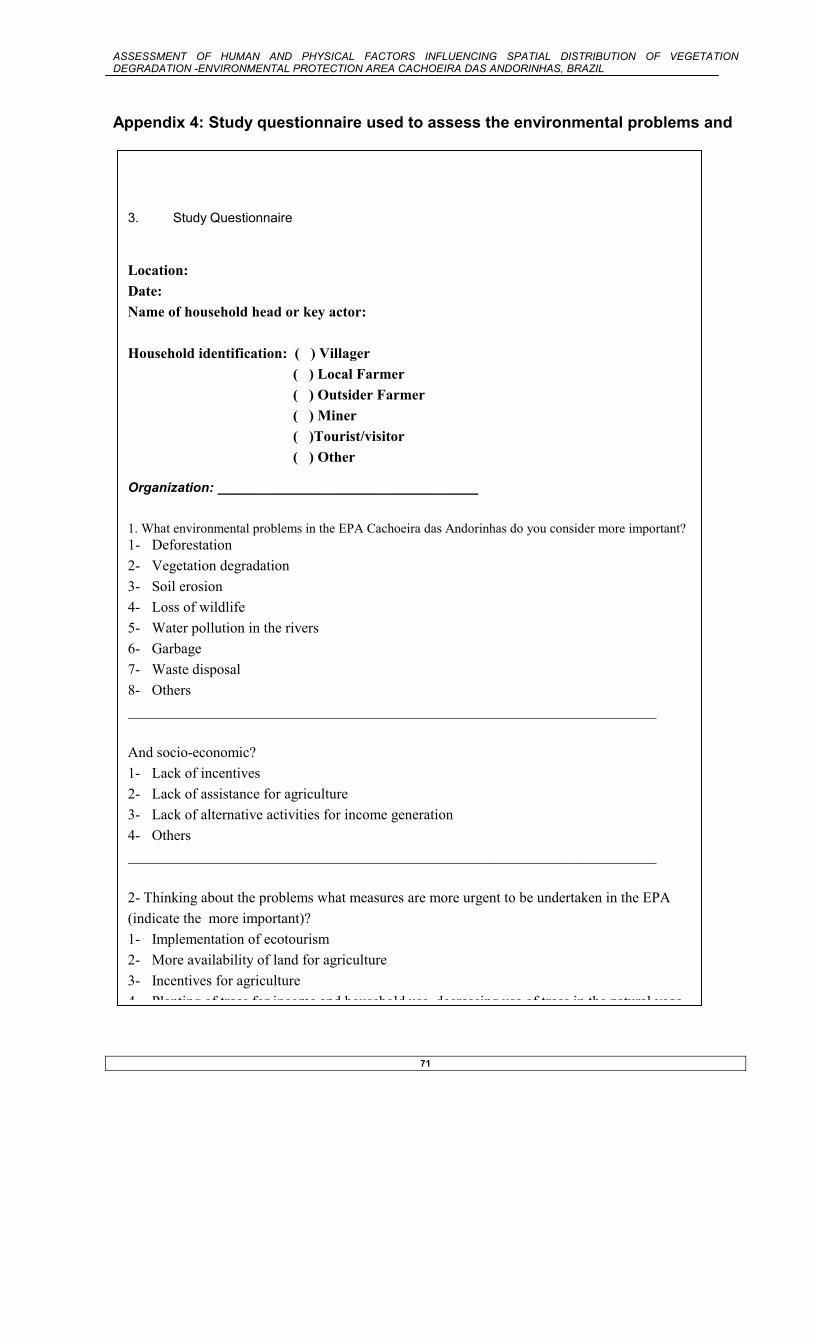
ASSESSMENT OF HUMAN AND PHYSICAL FACTORS INFLUENCING SPATIAL DISTRIBUTION OF VEGETATION DEGRADATION -ENVIRONMENTAL PROTECTION AREA CACHOEIRA DAS ANDORINHAS, BRAZIL
71
Appendix 4: Study questionnaire used to assess the environmental problems and
3. Study Questionnaire
Location: Date: Name of household head or key actor: Household identification: ( ) Villager ( ) Local Farmer ( ) Outsider Farmer ( ) Miner ( )Tourist/visitor ( ) Other
Organization: ________________________________ 1. What environmental problems in the EPA Cachoeira das Andorinhas do you consider more important? 1- Deforestation 2- Vegetation degradation 3- Soil erosion 4- Loss of wildlife 5- Water pollution in the rivers 6- Garbage 7- Waste disposal 8- Others ________________________________________________________________________ And socio-economic? 1- Lack of incentives 2- Lack of assistance for agriculture 3- Lack of alternative activities for income generation 4- Others ________________________________________________________________________ 2- Thinking about the problems what measures are more urgent to be undertaken in the EPA (indicate the more important)? 1- Implementation of ecotourism 2- More availability of land for agriculture 3- Incentives for agriculture 4 Planting of trees for income and household use decreasing use of trees in the natural vege

ASSESSMENT OF HUMAN AND PHYSICAL FACTORS INFLUENCING SPATIAL DISTRIBUTION OF VEGETATION DEGRADATION -ENVIRONMENTAL PROTECTION AREA CACHOEIRA DAS ANDORINHAS, BRAZIL
72
factors
Classes of vegetation degradation Ia – Invasive species cover Class nr. Classes Invasive species cover Classes 0 Not degraded 0 0 1 Low degraded 0.1 – 25% 1 2 Moderately degraded 25.1 – 50% 2 3 Highly degraded 50.1% - 75% 3 4 Extremely degraded > 75% 4 Ib –Understory cover Ic – Canopy cover Understory cover Classes Canopy cover classes Classes 0 4 0 4 0.1 – 25% 3 0 – 25% 3 25.1 – 50% 2 25.1 – 50% 2 50.1 – 75% 1 50.1 – 70% 1 > 75.1% 0 Id – Bare soil cover Ie – Relative percentage of dead
shrubs Bare soil cover Classes Dead shrubs % Classes 0 0 0 0 0.1 – 25% 1 0.1 – 10% 1 25.1 – 50% 2 10.1 – 20% 2 50.1 – 75% 3 20.1 – 30% 3 > 75% 4 > 30% 4
Appendix 5: Criteria and threshold values for categorization of vegetation degradation (I – Indicator)

ASSESSMENT OF HUMAN AND PHYSICAL FACTORS INFLUENCING SPATIAL DISTRIBUTION OF VEGETATION DEGRADATION -ENVIRONMENTAL PROTECTION AREA CACHOEIRA DAS ANDORINHAS, BRAZIL
73
Appendix 6: List of tree species assessed in the forest areas
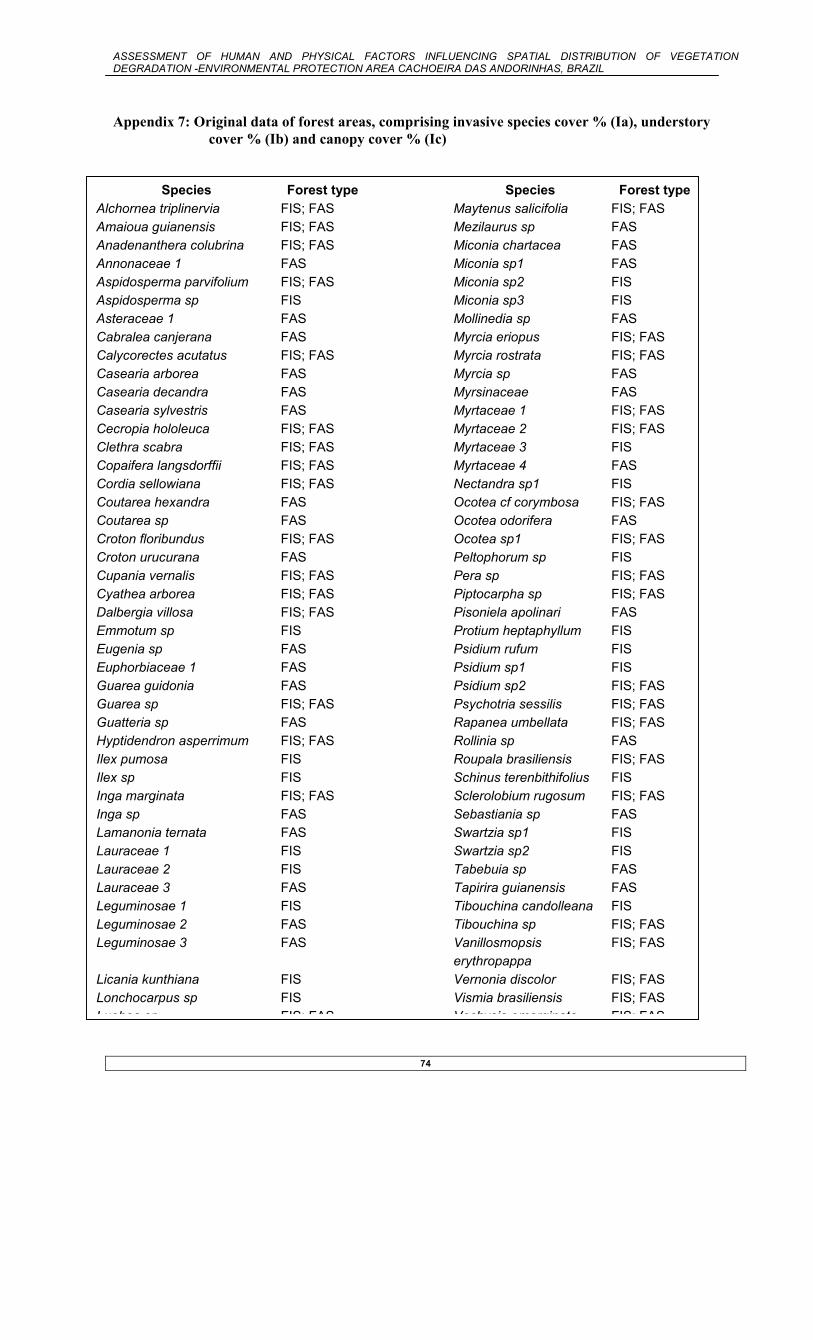
ASSESSMENT OF HUMAN AND PHYSICAL FACTORS INFLUENCING SPATIAL DISTRIBUTION OF VEGETATION DEGRADATION -ENVIRONMENTAL PROTECTION AREA CACHOEIRA DAS ANDORINHAS, BRAZIL
74
Appendix 7: Original data of forest areas, comprising invasive species cover % (Ia), understory cover % (Ib) and canopy cover % (Ic)
Species Forest type Species Forest typeAlchornea triplinervia FIS; FAS Maytenus salicifolia FIS; FAS Amaioua guianensis FIS; FAS Mezilaurus sp FAS Anadenanthera colubrina FIS; FAS Miconia chartacea FAS Annonaceae 1 FAS Miconia sp1 FAS Aspidosperma parvifolium FIS; FAS Miconia sp2 FIS Aspidosperma sp FIS Miconia sp3 FIS Asteraceae 1 FAS Mollinedia sp FAS Cabralea canjerana FAS Myrcia eriopus FIS; FAS Calycorectes acutatus FIS; FAS Myrcia rostrata FIS; FAS Casearia arborea FAS Myrcia sp FAS Casearia decandra FAS Myrsinaceae FAS Casearia sylvestris FAS Myrtaceae 1 FIS; FAS Cecropia hololeuca FIS; FAS Myrtaceae 2 FIS; FAS Clethra scabra FIS; FAS Myrtaceae 3 FIS Copaifera langsdorffii FIS; FAS Myrtaceae 4 FAS Cordia sellowiana FIS; FAS Nectandra sp1 FIS Coutarea hexandra FAS Ocotea cf corymbosa FIS; FAS Coutarea sp FAS Ocotea odorifera FAS Croton floribundus FIS; FAS Ocotea sp1 FIS; FAS Croton urucurana FAS Peltophorum sp FIS Cupania vernalis FIS; FAS Pera sp FIS; FAS Cyathea arborea FIS; FAS Piptocarpha sp FIS; FAS Dalbergia villosa FIS; FAS Pisoniela apolinari FAS Emmotum sp FIS Protium heptaphyllum FIS Eugenia sp FAS Psidium rufum FIS Euphorbiaceae 1 FAS Psidium sp1 FIS Guarea guidonia FAS Psidium sp2 FIS; FAS Guarea sp FIS; FAS Psychotria sessilis FIS; FAS Guatteria sp FAS Rapanea umbellata FIS; FAS Hyptidendron asperrimum FIS; FAS Rollinia sp FAS Ilex pumosa FIS Roupala brasiliensis FIS; FAS Ilex sp FIS Schinus terenbithifolius FIS Inga marginata FIS; FAS Sclerolobium rugosum FIS; FAS Inga sp FAS Sebastiania sp FAS Lamanonia ternata FAS Swartzia sp1 FIS Lauraceae 1 FIS Swartzia sp2 FIS Lauraceae 2 FIS Tabebuia sp FAS Lauraceae 3 FAS Tapirira guianensis FAS Leguminosae 1 FIS Tibouchina candolleana FIS Leguminosae 2 FAS Tibouchina sp FIS; FAS Leguminosae 3 FAS Vanillosmopsis
erythropappa FIS; FAS
Licania kunthiana FIS Vernonia discolor FIS; FAS Lonchocarpus sp FIS Vismia brasiliensis FIS; FAS Luehea sp FIS; FAS Vochysia emarginata FIS; FAS
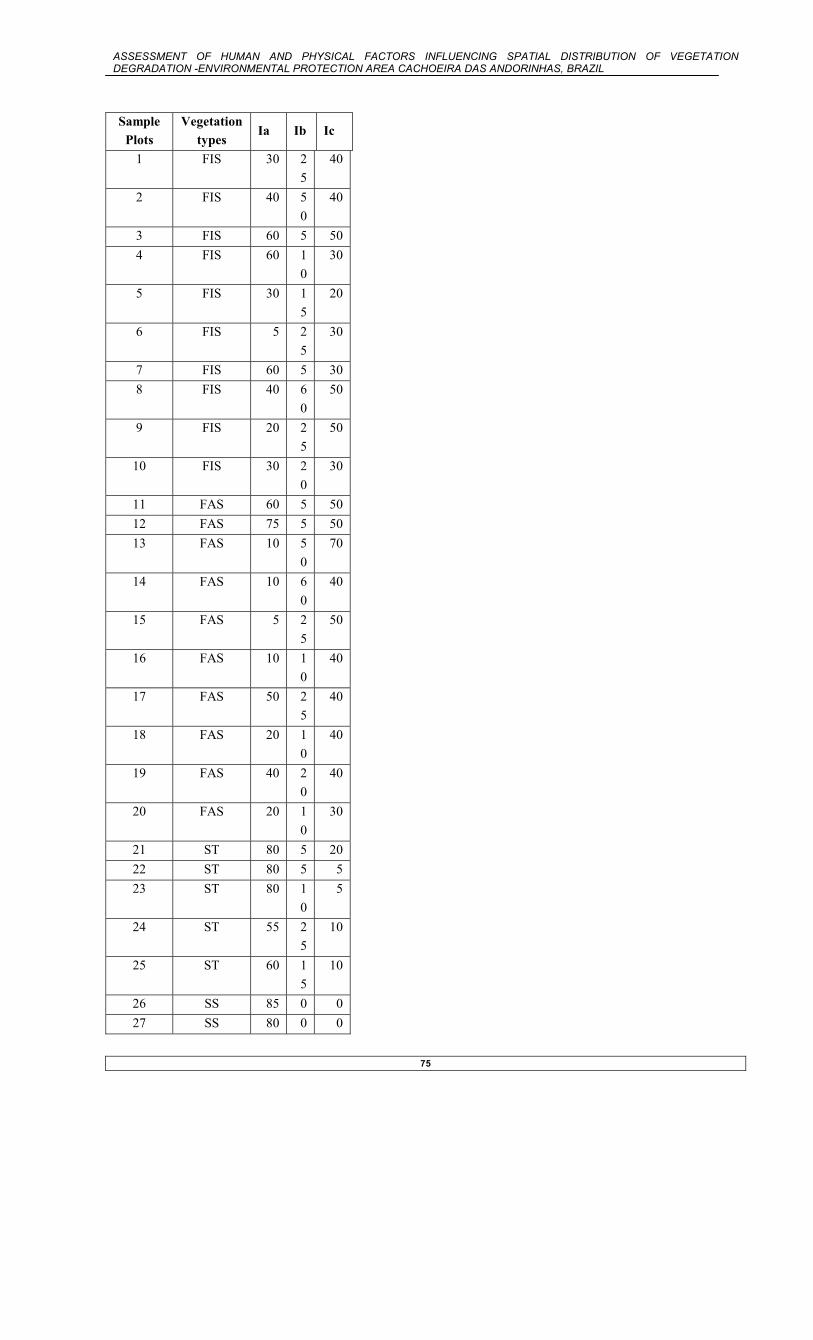
ASSESSMENT OF HUMAN AND PHYSICAL FACTORS INFLUENCING SPATIAL DISTRIBUTION OF VEGETATION DEGRADATION -ENVIRONMENTAL PROTECTION AREA CACHOEIRA DAS ANDORINHAS, BRAZIL
75
Sample Plots
Vegetation types
Ia Ib Ic
1 FIS 30 25
40
2 FIS 40 50
40
3 FIS 60 5 50 4 FIS 60 1
0 30
5 FIS 30 15
20
6 FIS 5 25
30
7 FIS 60 5 30 8 FIS 40 6
0 50
9 FIS 20 25
50
10 FIS 30 20
30
11 FAS 60 5 50 12 FAS 75 5 50 13 FAS 10 5
0 70
14 FAS 10 60
40
15 FAS 5 25
50
16 FAS 10 10
40
17 FAS 50 25
40
18 FAS 20 10
40
19 FAS 40 20
40
20 FAS 20 10
30
21 ST 80 5 20 22 ST 80 5 5 23 ST 80 1
0 5
24 ST 55 25
10
25 ST 60 15
10
26 SS 85 0 0 27 SS 80 0 0

ASSESSMENT OF HUMAN AND PHYSICAL FACTORS INFLUENCING SPATIAL DISTRIBUTION OF VEGETATION DEGRADATION -ENVIRONMENTAL PROTECTION AREA CACHOEIRA DAS ANDORINHAS, BRAZIL
76
28 SS 80 0 0 Appendix 8: Original data of savannah and rocky shrublands areas, comprising invasive species cover % (Ia), bare soil cover% (Ib) and dead shrubs % (Ic) Sample
Plots Vegetation
type Ia Id Ie
1 SA 60 40 15 2 SA 70 20 4 3 SA 0 0 25 4 SA 70 0 9 5 SA 40 5 0 6 SA 25 5 0 7 SA 0 30 5 8 SA 35 15 0 9 SA 0 0 10
10 SA 0 5 0 11 SA 0 0 0 12 RS 5 0 7 13 RS 0 0 19 14 RS 0 0 32 15 RS 0 0 0 16 RS 10 30 14 17 RS 20 30 15 18 RS 50 90 20 19 RS 50 80 20

ASSESSMENT OF HUMAN AND PHYSICAL FACTORS INFLUENCING SPATIAL DISTRIBUTION OF VEGETATION DEGRADATION -ENVIRONMENTAL PROTECTION AREA CACHOEIRA DAS ANDORINHAS, BRAZIL
77
Appendix 9 : Descriptive statistics
Variables N Minimum Maximum Mean Standard
deviation Standard
error Median
Forest and scrub
Distance toRoads
28 60 925 213.9286 210.2557 39.7346 161.0000
Distance to vil-lage, city, rural settlements
28 618 5522 2996.0714 1350.9411 255.3039 2913.5000
Distance to tourist sites
28 617 7175 2729.8929 1609.8224 304.2278 2339.0000
Distance to min-ing sites
28 760 12163 5901.3214 4008.9077 757.6123 5014.5000
Distance to ag-ricultural areas
28 60 1631 337.3214 361.1924 68.2589 245.5000
Slope 28 3 65 28.9286 14.4040 2.7221 26.5000 Geology 28 0 1 .1071 .3150 5.952E-02 .0000 Distance to drainage
28 17 308 127.9643 80.0187 15.1221 112.0000
Vegetation deg-radation scores
28 -47.22 64.91 13.0379 33.0668 6.2490 7.6855
Invasive species cover
28 5 85 45.5357 26.7824 5.0614 45.0000
Understory cover
28 0 60 16.4286 18.5521 3.5060 10.0000
Canopy cover 28 0 70 31.0714 18.8737 3.5668 35.0000 Savannah and Rocky shrublands
Distance to roads
19 60 1764 328.1053 466.4415 107.0090 167.0000
Distance to vil-lage, city, rural settlements
19 1177 6752 4006.6842 1861.7631 427.1177 4629.0000
Distance to tourist sites
19 76 9768 6418.0000 3387.2474 777.0878 7598.0000
Mining sites distance
19 255 6735 6735.00 1829.1771 419.6420 3670.0000
Distance to ag-ricultural areas
19 24 1147 419.1053 346.2586 79.4372 330.0000
Slope 19 0.3 49 18.5947 12.3188 2.8261 16.0000

ASSESSMENT OF HUMAN AND PHYSICAL FACTORS INFLUENCING SPATIAL DISTRIBUTION OF VEGETATION DEGRADATION -ENVIRONMENTAL PROTECTION AREA CACHOEIRA DAS ANDORINHAS, BRAZIL
78
Geology 19 0 1 .9474 .2294 5.263E-02 1.0000 Distance to drainage
19 53 413 212.8947 104.7950 24.0416 195.0000
Vegetation deg-radation scores
19 0 100.82 29.6368 32.3478 7.4211 22.1270
Invasive species cover
19 0 70 22.8947 26.2634 6.0252 10.0000
Bare soil cover 19 0 90 18.4211 26.9285 6.1778 5.0000 Dead shrubs % 19 0 32 10.2632 9.7914 2.2463 9.0000
Appendix 10: Kolmogorov-Smirnov Normality Test results Variables Forest areas Savannah and Rocky shrublands

ASSESSMENT OF HUMAN AND PHYSICAL FACTORS INFLUENCING SPATIAL DISTRIBUTION OF VEGETATION DEGRADATION -ENVIRONMENTAL PROTECTION AREA CACHOEIRA DAS ANDORINHAS, BRAZIL
79
P- Values Normality re-sults
P-Values Normality re-sults
Vegetation deg-radation scores
> 0.15 Normal distrib-uted
0.037 Not normal dis-tributed
Distance to roads < 0.01 Not normal dis-tributed
<0.01 Not normal dis-tributed
Distance to vil-lage/city/rural settlements
>0.15 Normal distrib-uted
0.127 Normal distrib-uted
Distance to tour-ist sites
0.098 Normal distrib-uted
<0.01 Not normal dis-tributed
Distance to min-ing sites
0.125 Normal distrib-uted
>0.15 Normal distrib-uted
Distance to agri-cultural areas
0.032 Not normal dis-tributed
>0.15 Normal distrib-uted
Slope >0.15 Normal distrib-uted
>0.15 Normal distrib-uted
Geology >0.15 Normal distrib-uted
>0.15 Normal distrib-uted
Distance to drainage
>0.15 Normal distrib-uted
>0.15 Normal distrib-uted
Invasive species cover
>0.15 Normal distrib-uted
0.013 Not normal dis-tributed
Understory cover
0.090 Normal distrib-uted
- -
Canopy cover >0.15 Normal distrib-uted
- -
Bare soil cover - - 0.027 Not normal dis-tributed
Dead shrubs % - - >0.15 Normal distrib-uted

ASSESSMENT OF HUMAN AND PHYSICAL FACTORS INFLUENCING SPATIAL DISTRIBUTION OF VEGETATION DEGRADATION -ENVIRONMENTAL PROTECTION AREA CACHOEIRA DAS ANDORINHAS, BRAZIL
80
Appendix 10: Results of the Principal Component Analysis for independent variables selection in the forest areas PCA scores First com-
ponent Second com-ponent
Third com-ponent
Fourth com-ponent
Fifth com-ponent
Human factors eigenvalues
Eigenvalues 2.2061
1.3726 0.7664 0.3670 0.2878
Proportion 0.441
0.275 0.153 0.073 0.058
Cumulative 0.441 0.716 0.869 0.942 1.000 Human factors variables eigenvectors
Distance to -0.255 0.668 -0.406 -0.560 -0.101
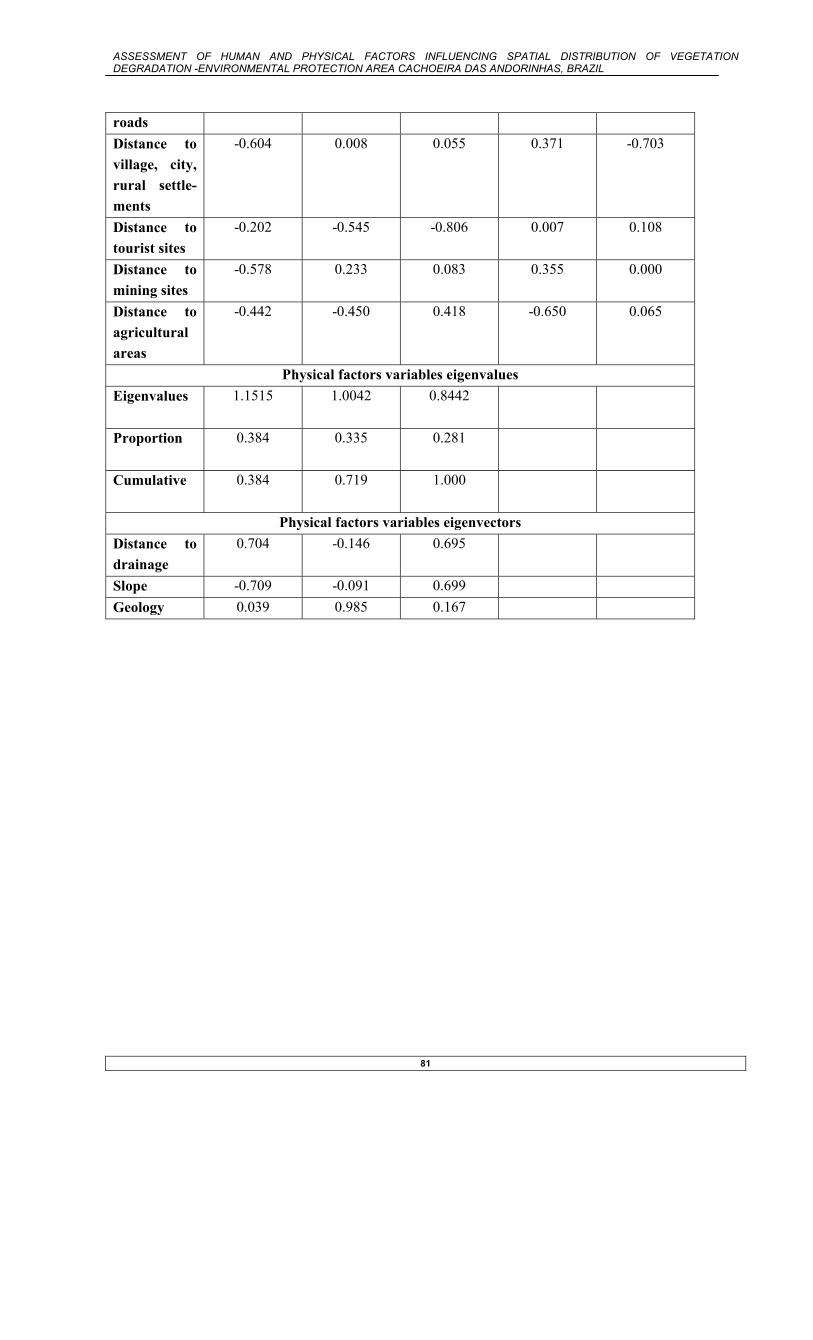
ASSESSMENT OF HUMAN AND PHYSICAL FACTORS INFLUENCING SPATIAL DISTRIBUTION OF VEGETATION DEGRADATION -ENVIRONMENTAL PROTECTION AREA CACHOEIRA DAS ANDORINHAS, BRAZIL
81
roads Distance to village, city, rural settle-ments
-0.604 0.008 0.055 0.371 -0.703
Distance to tourist sites
-0.202 -0.545 -0.806 0.007 0.108
Distance to mining sites
-0.578
0.233 0.083 0.355 0.000
Distance to agricultural areas
-0.442
-0.450 0.418 -0.650 0.065
Physical factors variables eigenvalues Eigenvalues 1.1515
1.0042 0.8442
Proportion 0.384
0.335 0.281
Cumulative 0.384
0.719 1.000
Physical factors variables eigenvectors Distance to drainage
0.704 -0.146 0.695
Slope -0.709 -0.091 0.699 Geology 0.039 0.985 0.167
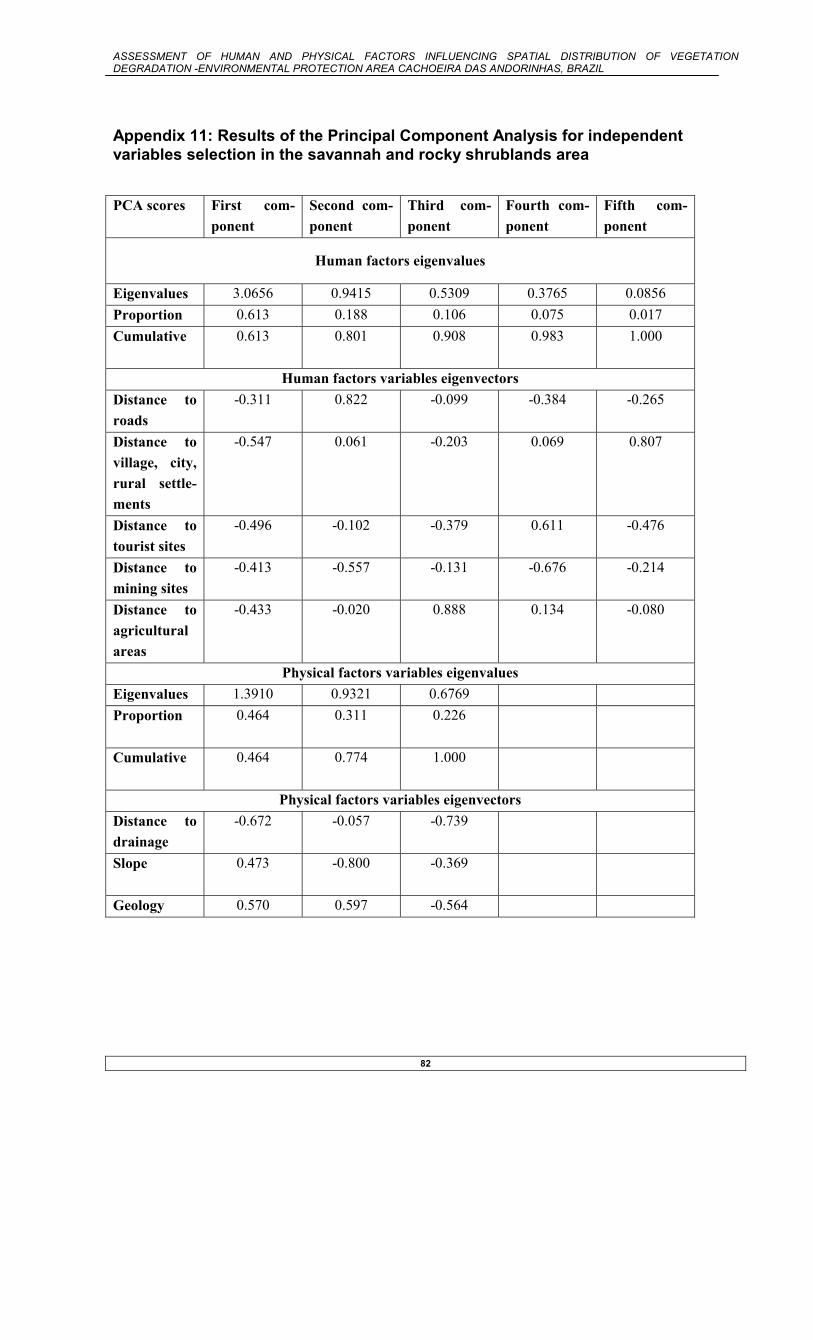
ASSESSMENT OF HUMAN AND PHYSICAL FACTORS INFLUENCING SPATIAL DISTRIBUTION OF VEGETATION DEGRADATION -ENVIRONMENTAL PROTECTION AREA CACHOEIRA DAS ANDORINHAS, BRAZIL
82
Appendix 11: Results of the Principal Component Analysis for independent variables selection in the savannah and rocky shrublands area
PCA scores First com-
ponent Second com-ponent
Third com-ponent
Fourth com-ponent
Fifth com-ponent
Human factors eigenvalues
Eigenvalues 3.0656 0.9415 0.5309 0.3765 0.0856 Proportion 0.613 0.188 0.106 0.075 0.017 Cumulative 0.613 0.801 0.908 0.983 1.000
Human factors variables eigenvectors
Distance to roads
-0.311 0.822 -0.099 -0.384 -0.265
Distance to village, city, rural settle-ments
-0.547 0.061 -0.203 0.069 0.807
Distance to tourist sites
-0.496 -0.102 -0.379 0.611 -0.476
Distance to mining sites
-0.413
-0.557 -0.131 -0.676 -0.214
Distance to agricultural areas
-0.433
-0.020 0.888 0.134 -0.080
Physical factors variables eigenvalues Eigenvalues 1.3910 0.9321 0.6769 Proportion 0.464
0.311 0.226
Cumulative 0.464
0.774 1.000
Physical factors variables eigenvectors Distance to drainage
-0.672
-0.057 -0.739
Slope 0.473
-0.800 -0.369
Geology 0.570 0.597 -0.564

ASSESSMENT OF HUMAN AND PHYSICAL FACTORS INFLUENCING SPATIAL DISTRIBUTION OF VEGETATION DEGRADATION -ENVIRONMENTAL PROTECTION AREA CACHOEIRA DAS ANDORINHAS, BRAZIL
83
Appendix 12 a – Roads map of the EPA Cachoeira das Andorinhas

ASSESSMENT OF HUMAN AND PHYSICAL FACTORS INFLUENCING SPATIAL DISTRIBUTION OF VEGETATION DEGRADATION -ENVIRONMENTAL PROTECTION AREA CACHOEIRA DAS ANDORINHAS, BRAZIL
84
Appendix 12 b: Drainage map of the EPA Cachoeira das Andorinhas
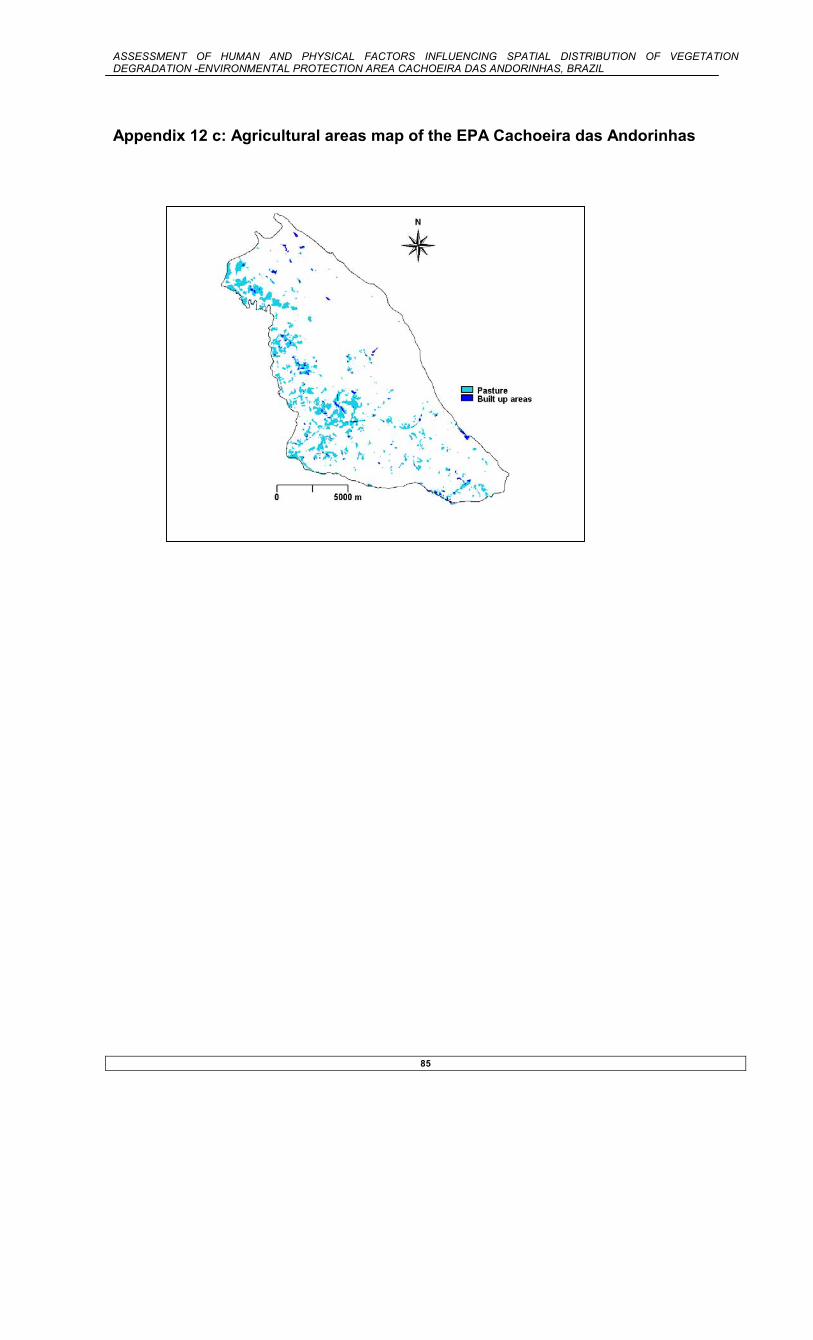
ASSESSMENT OF HUMAN AND PHYSICAL FACTORS INFLUENCING SPATIAL DISTRIBUTION OF VEGETATION DEGRADATION -ENVIRONMENTAL PROTECTION AREA CACHOEIRA DAS ANDORINHAS, BRAZIL
85
Appendix 12 c: Agricultural areas map of the EPA Cachoeira das Andorinhas
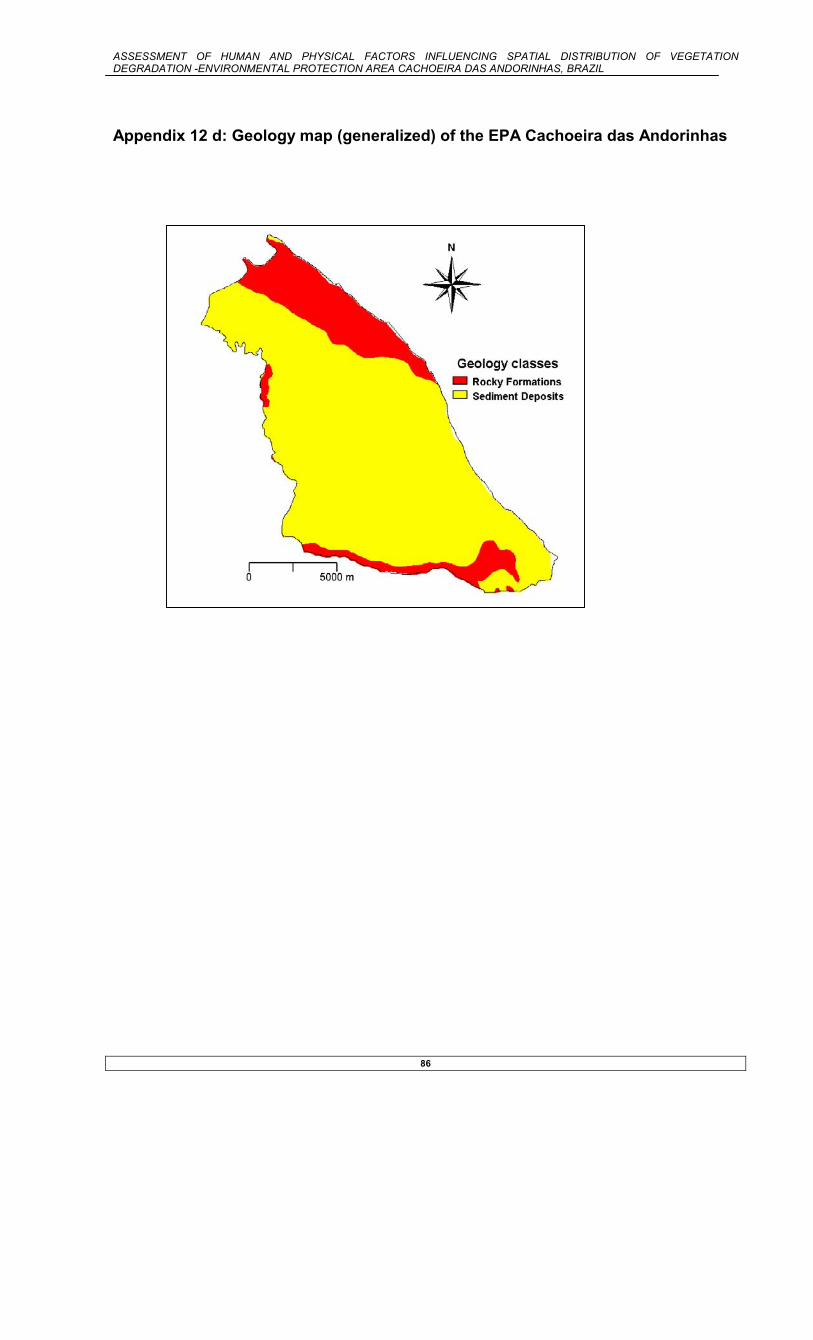
ASSESSMENT OF HUMAN AND PHYSICAL FACTORS INFLUENCING SPATIAL DISTRIBUTION OF VEGETATION DEGRADATION -ENVIRONMENTAL PROTECTION AREA CACHOEIRA DAS ANDORINHAS, BRAZIL
86
Appendix 12 d: Geology map (generalized) of the EPA Cachoeira das Andorinhas

ASSESSMENT OF HUMAN AND PHYSICAL FACTORS INFLUENCING SPATIAL DISTRIBUTION OF VEGETATION DEGRADATION -ENVIRONMENTAL PROTECTION AREA CACHOEIRA DAS ANDORINHAS, BRAZIL
87
Appendix 12 e: Slope classes map of the EPA Cachoeira das Andorinhas

ASSESSMENT OF HUMAN AND PHYSICAL FACTORS INFLUENCING SPATIAL DISTRIBUTION OF VEGETATION DEGRADATION -ENVIRONMENTAL PROTECTION AREA CACHOEIRA DAS ANDORINHAS, BRAZIL
88
Appendix 12 f: Map of village, city and rural settlements of the EPA Cachoeira das Andorinhas
Appendix 12 f: Map of tourist sites of the EPA Cachoeira das Andorinhas

ASSESSMENT OF HUMAN AND PHYSICAL FACTORS INFLUENCING SPATIAL DISTRIBUTION OF VEGETATION DEGRADATION -ENVIRONMENTAL PROTECTION AREA CACHOEIRA DAS ANDORINHAS, BRAZIL
89
Appendix 12 g: Map of mining sites of the EPA Cachoeira das Andorinhas

ASSESSMENT OF HUMAN AND PHYSICAL FACTORS INFLUENCING SPATIAL DISTRIBUTION OF VEGETATION DEGRADATION -ENVIRONMENTAL PROTECTION AREA CACHOEIRA DAS ANDORINHAS, BRAZIL
90
Appendix 12 f: Map of forest areas of the EPA Cachoeira das Andorinhas

ASSESSMENT OF HUMAN AND PHYSICAL FACTORS INFLUENCING SPATIAL DISTRIBUTION OF VEGETATION DEGRADATION -ENVIRONMENTAL PROTECTION AREA CACHOEIRA DAS ANDORINHAS, BRAZIL
91
Appendix 12 f: Slope percentage class map of the EPA Cachoeira das Andorinhas

ASSESSMENT OF HUMAN AND PHYSICAL FACTORS INFLUENCING SPATIAL DISTRIBUTION OF VEGETATION DEGRADATION -ENVIRONMENTAL PROTECTION AREA CACHOEIRA DAS ANDORINHAS, BRAZIL
92
Appendix 12 g: Map of the savannah and rocky shrublands areas of the EPA Cachoeira das Andorinhas

ASSESSMENT OF HUMAN AND PHYSICAL FACTORS INFLUENCING SPATIAL DISTRIBUTION OF VEGETATION DEGRADATION -ENVIRONMENTAL PROTECTION AREA CACHOEIRA DAS ANDORINHAS, BRAZIL
93
Appendix 12 h: Map of distance to tourist sites - EPA Cachoeira das Andorinhas
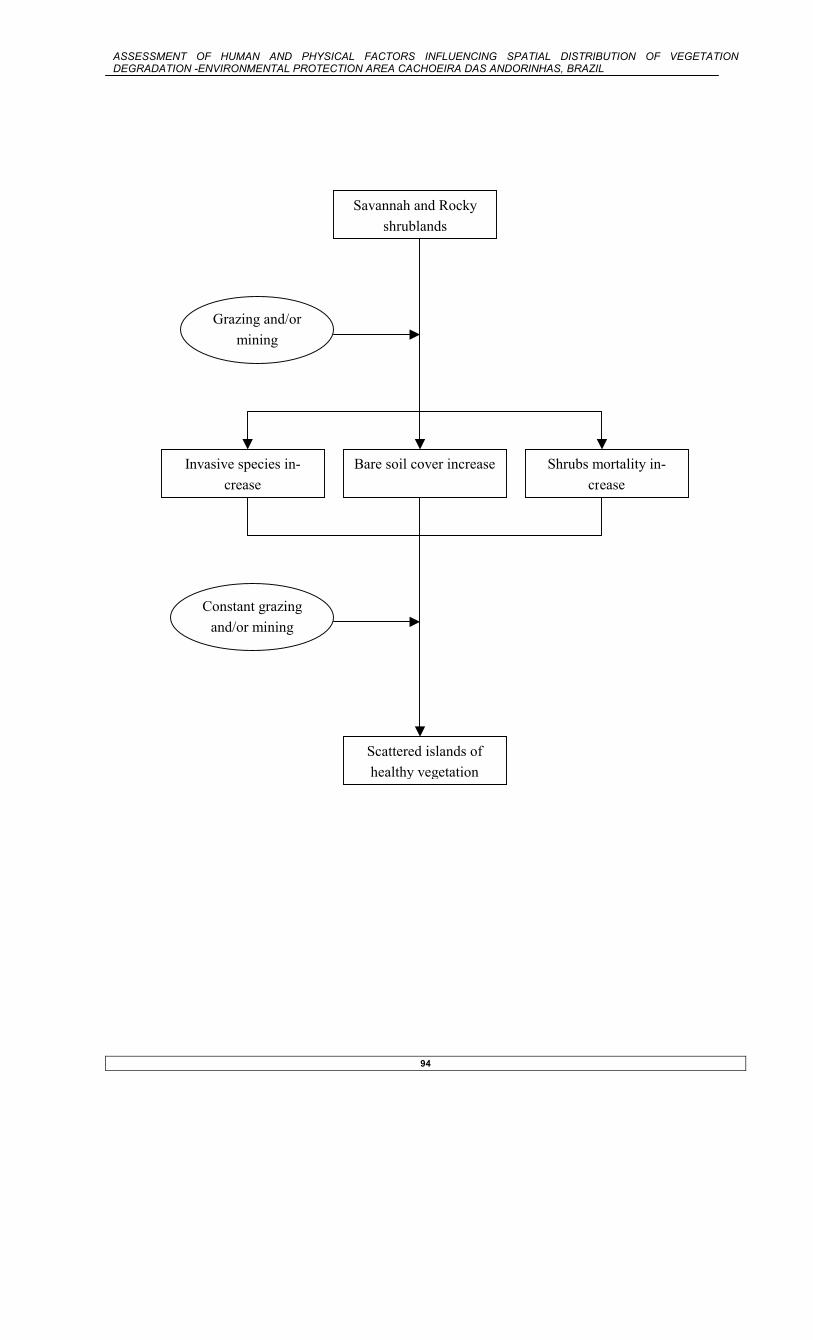
ASSESSMENT OF HUMAN AND PHYSICAL FACTORS INFLUENCING SPATIAL DISTRIBUTION OF VEGETATION DEGRADATION -ENVIRONMENTAL PROTECTION AREA CACHOEIRA DAS ANDORINHAS, BRAZIL
94
Grazing and/or mining
Savannah and Rocky shrublands
Invasive species in-crease
Shrubs mortality in-crease
Bare soil cover increase
Constant grazing and/or mining
Scattered islands of healthy vegetation

ASSESSMENT OF HUMAN AND PHYSICAL FACTORS INFLUENCING SPATIAL DISTRIBUTION OF VEGETATION DEGRADATION -ENVIRONMENTAL PROTECTION AREA CACHOEIRA DAS ANDORINHAS, BRAZIL
95
0-20 20-40 40-60 >60 0-3500 3500-7000 7000-10500 >10500 The regression equation is degrscores = 60.3 - 0.00478 touris
Predictor Coef SE Coef T P Constant 60.31 14.47 4.17 0.001 touris -0.004779 0.002005 -2.38 0.029 S = 28.82 R-Sq = 25.0% R-Sq(adj) = 20.6% Analysis of Variance Source DF SS MS F P Regression 1 4717.6 4717.6 5.68 0.029 Residual Error 17 14117.2 830.4 Total 18 18834.9
The regression equation is newscores = 44.4 - 1.08 slope
Predictor Coef SE Coef T P Constant 44.37 12.78 3.47 0.002 slope -1.0832 0.3969 -2.73 0.011 S = 29.71 R-Sq = 22.3% R-Sq(adj) = 19.3% Analysis of Variance Source DF SS MS F P Regression 1 6572.6 6572.6 7.45 0.011 Residual Error 26 22949.6 882.7 Total 27 29522.2
During the variable selection procedure, the deviance reduction associated with each variable is tested for significance at a given confidence level (usually 0.05) Zimmerman
Acrescentar gr’aficos de distribution of veg degra – slope – tourist sites

ASSESSMENT OF HUMAN AND PHYSICAL FACTORS INFLUENCING SPATIAL DISTRIBUTION OF VEGETATION DEGRADATION -ENVIRONMENTAL PROTECTION AREA CACHOEIRA DAS ANDORINHAS, BRAZIL
96

ASSESSMENT OF HUMAN AND PHYSICAL FACTORS INFLUENCING SPATIAL DISTRIBUTION OF VEGETATION DEGRADATION -ENVIRONMENTAL PROTECTION AREA CACHOEIRA DAS ANDORINHAS, BRAZIL
97
The degradation process in the forest areas in a short-term perspective is summarized in Figure 23. The variations of thinning in canopy cover, understory impoverishment and invasive species increase are con-nected to the intensity and constancy of damage activities, that although not measured in the present
study, could be detected through marks, such as, livestock droppings and cutting signs. The presence of fire signals was found in very few plots and was not considered a major problem in the forest areas. The selective cut of trees species has leading to openings in the canopy cover, that increases growth and dominance of invasive and opportunist species in the understory. In cases where the opening is large, some of those species, for example Arundinaria effusa, trends to cover all over causing tree mortality and degeneration of the forest conditions. The higher availability of light promotes the increase of pioneer species, tolerant to that conditions. In the area, Vannilosmopsis erythropappa is one of the species that trends to spread over the disturbed areas, being the dominant species of the scrub areas. The grazing ac-
Forest complex structure
Constant cutting and
grazing
Cutting and grazing
Canopy cover thinning
Invasive species in-crease
Understory impover-ishment
Pioneer species in-crease
Forest simplified struc-ture (scrub)
ASSESSMENT OF HUMAN AND PHYSICAL FACTORS INFLUENCING SPATIAL DISTRIBUTION OF VEGETATION DEGRADATION -ENVIRONMENTAL PROTECTION AREA CACHOEIRA DAS ANDORINHAS, BRAZIL
98
tivities, sustained by the lack of efficient fencing system with neighboring agricultural areas, intensify the dominance of invasive species. The livestock may eliminate palatable species of the understory, including regenerating seedlings (TCM 1988), reducing the shrubs and herbs of the understory, and promoting in-crease of invasive and opportunist species. In the case of savannah and rocky shrublands formation the damage activities grazing, fire and mining are major threats, the latter one specific for the rocky shrublands. An overview of the vegetation degradation process in the area, in a short-term perspective, is shown in Figure 24. In the savannah areas, grazing and fire activities has been contributing to increase in the bare soil cover and spread of invasive species. Ac-cording to Coutinho (1990), one of the first savannah’s flora alteration symptoms in response to fire, in some areas in Brazil, is the invasion by exotic grasses, such as, Melinis minutiflora. In the rocky shrub-lands the bare soil cover and invasive species increase are mainly linked to mining activities, established for exploitation of the quartzite and itabirite substrates. The increase of dead shrubs and reduction of healthy shrub layer of those formations might been pronounced by fire and grazing activities.
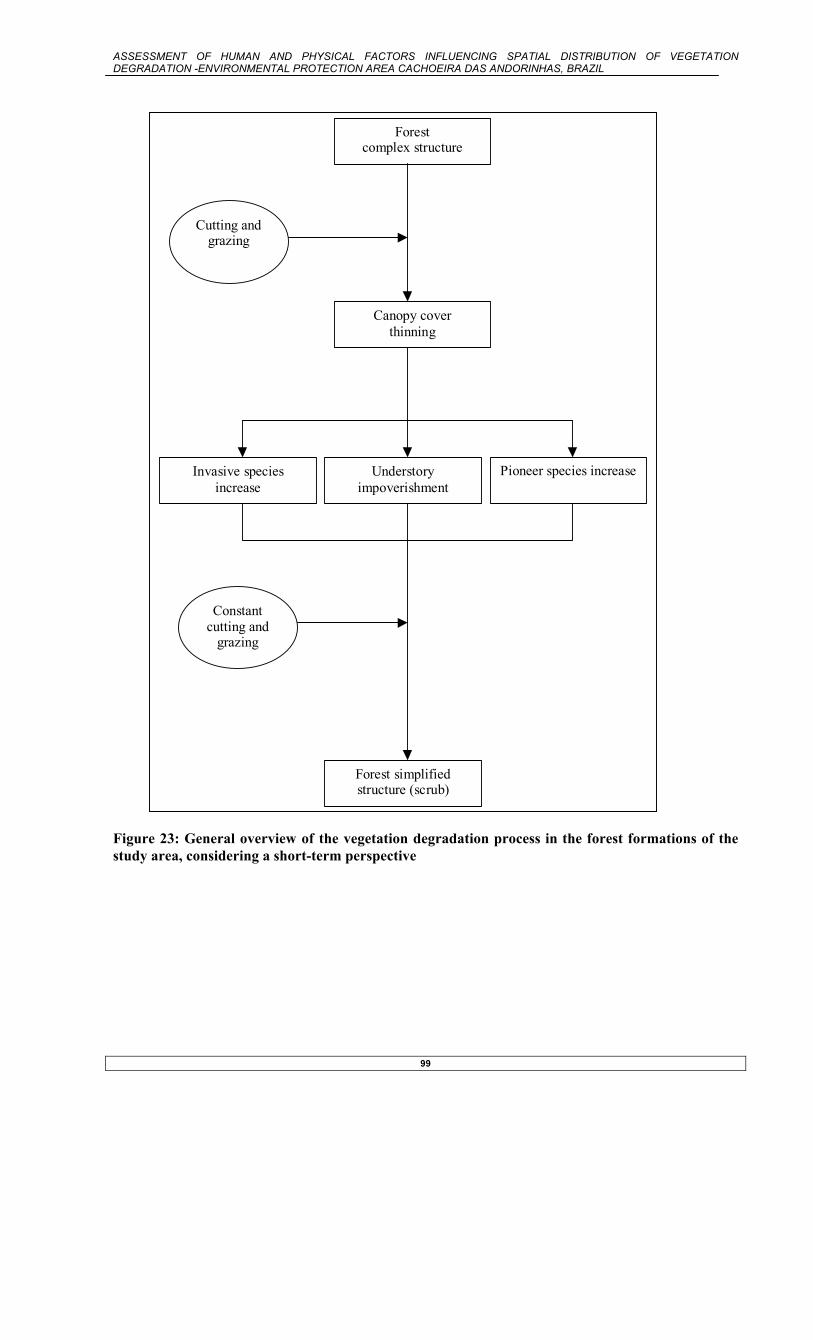
ASSESSMENT OF HUMAN AND PHYSICAL FACTORS INFLUENCING SPATIAL DISTRIBUTION OF VEGETATION DEGRADATION -ENVIRONMENTAL PROTECTION AREA CACHOEIRA DAS ANDORINHAS, BRAZIL
99
Figure 23: General overview of the vegetation degradation process in the forest formations of the study area, considering a short-term perspective
Forestcomplex structure
Constantcutting and
grazing
Cutting andgrazing
Canopy coverthinning
Invasive speciesincrease
Understoryimpoverishment
Pioneer species increase
Forest simplifiedstructure (scrub)
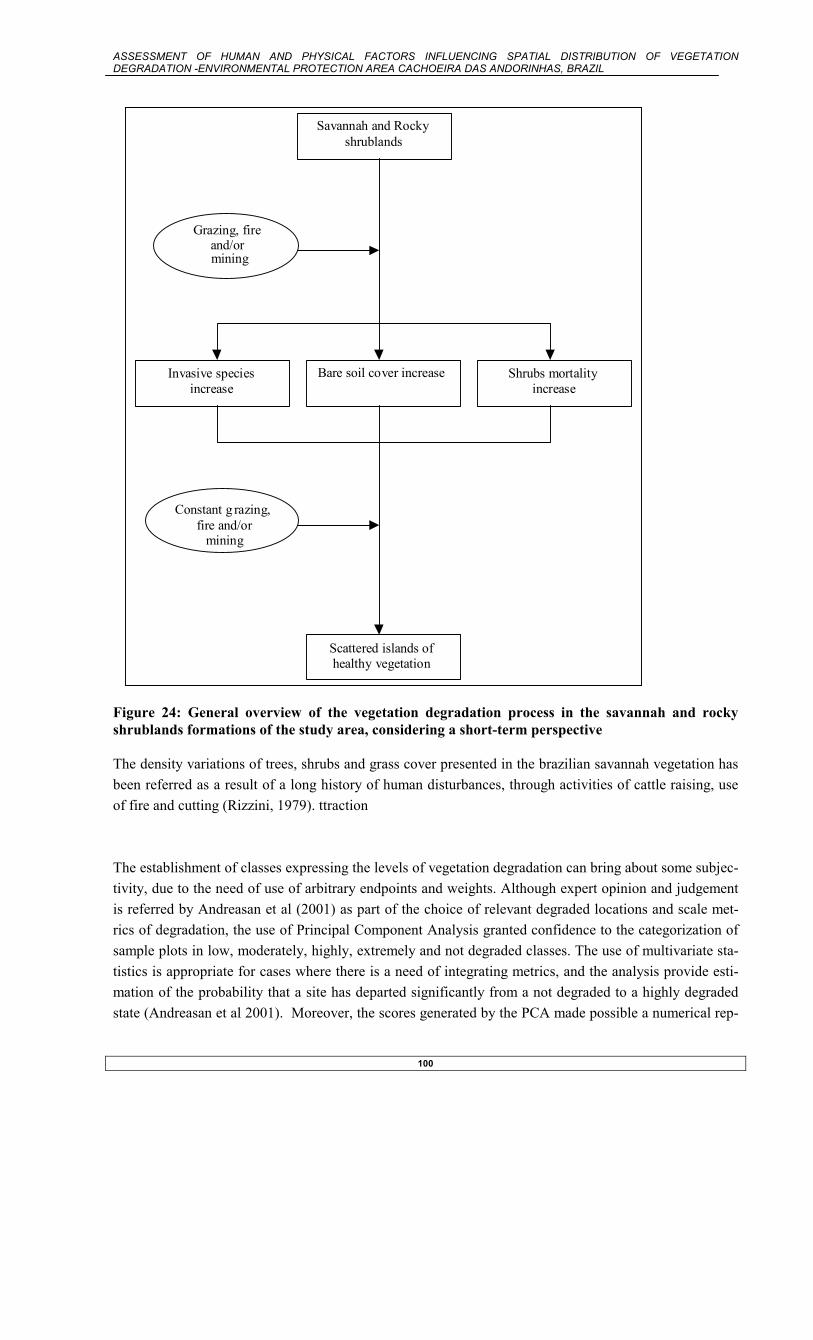
ASSESSMENT OF HUMAN AND PHYSICAL FACTORS INFLUENCING SPATIAL DISTRIBUTION OF VEGETATION DEGRADATION -ENVIRONMENTAL PROTECTION AREA CACHOEIRA DAS ANDORINHAS, BRAZIL
100
Figure 24: General overview of the vegetation degradation process in the savannah and rocky shrublands formations of the study area, considering a short-term perspective The density variations of trees, shrubs and grass cover presented in the brazilian savannah vegetation has been referred as a result of a long history of human disturbances, through activities of cattle raising, use of fire and cutting (Rizzini, 1979). ttraction The establishment of classes expressing the levels of vegetation degradation can bring about some subjec-tivity, due to the need of use of arbitrary endpoints and weights. Although expert opinion and judgement is referred by Andreasan et al (2001) as part of the choice of relevant degraded locations and scale met-rics of degradation, the use of Principal Component Analysis granted confidence to the categorization of sample plots in low, moderately, highly, extremely and not degraded classes. The use of multivariate sta-tistics is appropriate for cases where there is a need of integrating metrics, and the analysis provide esti-mation of the probability that a site has departed significantly from a not degraded to a highly degraded state (Andreasan et al 2001). Moreover, the scores generated by the PCA made possible a numerical rep-
Grazing, fireand/ormining
Savannah and Rockyshrublands
Invasive speciesincrease
Shrubs mortalityincrease
Bare soil cover increase
Constant g razing,fire and/or
mining
Scattered islands ofhealthy vegetation

ASSESSMENT OF HUMAN AND PHYSICAL FACTORS INFLUENCING SPATIAL DISTRIBUTION OF VEGETATION DEGRADATION -ENVIRONMENTAL PROTECTION AREA CACHOEIRA DAS ANDORINHAS, BRAZIL
101
resentation of the degradation levels and influenced the decision of the direction of influence of the eco-logical indicators used, in relation to the vegetation degradation process. The establishment of classes expressing the levels of vegetation degradation can bring about some subjec-tivity, due to the need of use of arbitrary endpoints and weights. Although expert opinion and judgement is referred by Andreasan et al (2001) as part of the choice of relevant degraded locations and scale met-rics of degradation, the use of Principal Component Analysis granted confidence to the categorization of sample plots in low, moderately, highly, extremely and not degraded classes. The use of multivariate sta-tistics is appropriate for cases where there is a need of integrating metrics, and the analysis provide esti-mation of the probability that a site has departed significantly from a not degraded to a highly degraded state (Andreasan et al 2001). De Pietri (1995) used discriminant analysis for the categorization of degra-dation levels. Moreover, the scores generated by the PCA made possible a numerical representation of the degradation levels and influenced the decision of the direction of influence of the ecological indicators used, in rela-tion to the vegetation degradation process. Ecological indicators are intended to represent key information about structure, function and composition of ecosystems (Dale & Beyeler 2001). De Pietri (1995) used five ecological indicators to diagnose vegeta-tion degradation in three vegetation types in Argentina (tall forest, low forest and grasslands) that ex-pressed three degradation levels: high, intermediate and moderate. In the present study invasive species represented the highest correlation. and The classes to be distinguished in an image classification need to have different spectral characteristics, and reliable results depend on the establishment of distinct clusters in the feature space (Janssen 2000). The existence of high percentage of bare soil cover is referred as a characteristic of the last stages of vegetation degradation. . Supervised image classification of in: low degraded, moderately degraded, highly degraded, extremely degraded and not degraded. The classified sample plots point map of the vegetation degradation classes was used for examination of the spatial distribution of degraded areas. digitizing Most of the revegetation degradation research has been directed at arid landscapes or at degradation of temperate and tropical forests. Chronic human disturbances lead to vegetation degradation and subsequent reduction of desirable charac-teristics of areas for nature conservation. The study provides information of factors influencing the vegetation degradation distribution in the pro-tected area. was significanIn the forest areas, 36% of the investigated sites presented moderately degraded, 36% highly degraded and 28% extremely degraded. In the savannah and rocky shrublands formations, 37% of the examined areas were found low degraded, 37% moderately degraded, 6% highly degraded, 10% ex-tremely degraded and 10% not degraded. The physical factor slope presented a negative correlation coefficient (-0.223). That factor was the only one that showed a significant correlation to vegetation degradation variations in the forest and scrub areas (Figure 21).

ASSESSMENT OF HUMAN AND PHYSICAL FACTORS INFLUENCING SPATIAL DISTRIBUTION OF VEGETATION DEGRADATION -ENVIRONMENTAL PROTECTION AREA CACHOEIRA DAS ANDORINHAS, BRAZIL
102
digital elevation model ( Investigation of vulnerability and degradation process of the vegetation inside protected areas There is a lack of studies of the human influence in protected areas, involving different types of vegetation. Al-though studies of degradation in forest areas and vegetation of arid landscapes exist, there is a lack of studies of the phenomenon in protected areas, involving different vegetation types. Remote sensing and Geographic Information Systems (GIS) are used coupled with field data collected. Most of the studies examining the influence of human and physical factors in the vegetation degradation process has been directed at arid landscapes and forest areas lack considerations of the quality and quan-tity of vegetation conditions. Palo et al (1986) evidenced that a degraded forest, for example, is assumed to recover from the distur-bance within a period, but if the continuous situation of stress persist it may generate a deforestation con-dition.
ASSESSMENT OF HUMAN AND PHYSICAL FACTORS INFLUENCING SPATIAL DISTRIBUTION OF VEGETATION DEGRADATION -ENVIRONMENTAL PROTECTION AREA CACHOEIRA DAS ANDORINHAS, BRAZIL
103
dead shrubs, shrub layer, succession stage – literature? diagrama of vegetation degradation process Identified the natural forest degradation from the scrub area, because most of scrub area originally was natural forest. Concluded that, then the decrease of natural forest while the scrub took over is indicating forest degradation. Degradation process is marked by a tendency to De Pietri (1991) found three main indicators for vegetation degradation caused by cattle ranching in Ar-gentina: key species (icluding decreasers, increasers, and invaders); vegetal cover of exotic species, rela-tive ratio of perennial-annual species in summer, and relative cover of an specific species not used as for-age and vegetal biomass. presented some constraints. Although some of them were found in the literature, the difference in vegeta-tion type bring about the need of different indicators. In the case of forest areas scrub are usually seen as the most degraded areas .. succesion stage. Some subjectivity There is not standard criteria developed canpy cover invasive species Definition of tresholds in the area: need of knowledge of not degraded situation/ some subjectivity that need the not degraded situation Dale 2001 They can provide an early warning signal of changes in the environment, and they can be used to diag-nose the cause of an environmental problem. The purpose influences the choice of ecological indicators. The suite of indicators should represent key information about structure, function and composition. Have not knowledge history of the disturbance history in the area, although have indications of distur-bance Andreasan 2001 The location of a “degraded” reference condition may be based on expert opinion combined with histori-cal experience of drastic ecosystem changes.. Prudence would dictate that a margin of error be built into the degraded end of the metric to deal with uncertainty. There is a need of estimation of the potential scale of metrics, based on the history and long-term ecological research network. By having a “natural” or “sustainable” condition at one end of the scale for each metric and a degraded condition at the other hand, the total range of each metric can be specified. De Pietri 1991 If natural environmental conditions such as elevation, aspect and slope are similar, variation in vegetal communities in terms of structure and composition may be attributed mainly to different livestock man-agement. The existence or non-existence of certain species, increase or decrease of tohers, could be used as indicators of cattle ranching intensity.
ASSESSMENT OF HUMAN AND PHYSICAL FACTORS INFLUENCING SPATIAL DISTRIBUTION OF VEGETATION DEGRADATION -ENVIRONMENTAL PROTECTION AREA CACHOEIRA DAS ANDORINHAS, BRAZIL
104
Determined grazing degradation ecological indicators in Argentina, for environments of high evergreen forest, low forest and grassland. The ecological indicators found were key species, icluding decreasers (those that tend to disappear under livestock ranching pressure), increasers (those that increases or keep stable frequencies) and invaders ( those species not belonging to the original vegetal community that ap-pear in the area due to changes in micro-environmental features.; vegetal cover: exotic species relative cover, relative ratio of perennial-annual species in summer, and relative cover of an specific species; vegetal biomass : global vegetal biovolume and perennial cespitose, rhizomatose and stoloniferous. De Pietri 1995 5 representative physiognomic formations or vegetation types: tall forest; low forest; grasslands. She used five ecological indicators to diagnose the degradation state in twenty-eight sampling sites. A grid was obtained for each indicator discriminating 3 degrees of degradation: low, intermediate and high. The five ecological indicators: relative cover of Rumex acetosella (perennial species of no foriage value); relative cover of annual species; total biomass; biomass of clonal species; relative cover of exotic species. The mapping of degraded vegetation areas expected in all categories was limited to the scrub areas. The use of remote sensing techniques for vegetation degradation detection has been made. Author used spot multiespectral bands…… found the spectral diagrams… in both cases however the differentiation of de-grade and not were permited by the monitoring or……….. In the present research the insuffient number of not degrade situation for all vegetation types……. Landsat TM showed also application for discrimination of forest areas conditions allowing the mapping of the scrub areas or areas of recent regeneration and succession stage. However, limitations were found for discrimination of forest intermediate and advanced stage. This can happened because although the structural differences exist they are subtle and the canopy cover is not very different among the two types. Assessment of forest succession stages and stand condition is commonly made with the utilization of ae-rial photographs and Landsat Thematic Mapper has been commonly used for land cover and land use purposes. The The Landsat TM images have seven spectral bands, three in the visible spectrum, one near-infrared band, two mid-infrared, and one termal-infrared band. Generalization: The results for the overall accuracy, average accuracy and average reliability were found satisfactory, but some limitations to include more classes identified in the field occurred. In the case of forest intermediate and advanced stage, although differences in the structure were revealed the overlap in the reflectance response limited the stratification of the forest areas. Succession stage detection and map-ping for forest areas are usually identified better using other sources and tech-niques…………………………….. In the case of crops, limitations on the size of the crop areas and proximity to other units made unfeasi-ble…… Savannah although the influecne of fire and human acivities can influence the variation in the amount of trees and grasses found it seems this process is seen in a ont time scale, out of the The decision of the direction of influence of the ecological indicators used in relation to the vegetation degradation process was made through the use of Principal Component Analysis, that also provide the

ASSESSMENT OF HUMAN AND PHYSICAL FACTORS INFLUENCING SPATIAL DISTRIBUTION OF VEGETATION DEGRADATION -ENVIRONMENTAL PROTECTION AREA CACHOEIRA DAS ANDORINHAS, BRAZIL
105
information of how good each variable explain the process (Jongman 1995). Moreover, the scores gener-ated by the PCA made possible a measurement of the degradation levels and. The subjectivity generated by the weighting process was reduced with the use of the method (Kent & Coker 1992). The use of key species and establishment of treshold values for the degradation categories depend on the characteristics of the area under study and vegetation types involved. According to Andreasan (2001) the choice of a relevant degraded location require judgement and expert opinion. The cited author mentioned that the scale metrics needs a “natural” or “sustainable” condition at one end of the scale and a “de-graded” condition at the other end, to specify the total range of each metric The high occurrence of damage signs in the sample plots in forest, scrub, svannah and rocky shrublands formations of damage activities the natural disturbances that can be also influencing the indicators are not included. The inexistence of strong natural disturbance in the are such as geophysical eruprions , cyclonic storms in the short time scale assuming that the highest variations in the indicators is a response of human disturbance.assuming that even if they are taking place is in lower proportion in relation to man made The Principal Component Analysis viabilized direction of the influence of each of the indicators in the vegetation degradation scores and classes were and many times have preference The different responses given by the different vegetation types to anthropogenic disturbance results of the categorization of the different vegetation types sampled in vegetation degradation classes resulted in the majority of sample units classified as degraded, and only in the savannah and rocky shrub-lands formations the not degraded situation was detected. what can be corroborated by the large amount of damage activities signs found in the areas sampled. Moreover, the absence of efficient fencing system and the presence of tracks can bring about potential increase in the susceptibility of the areas for degrada-tion. The use of indicators for the categorization of vegetation degradation made possible a discrimination of degradation levels in the area. In this study some constraints were found for the establishment of threshold values regarding the degrada-tion indicators of forest areas, since any of the investigated locations showed a not degraded or preserved situation, bringing about some subjectivity and uncertainty for the treshold definition. The finding of different succession stages can be associated to the land use dynamics of the area in the past that continues in the present time. In the two of the areas sampled, old ovens for charcoal production were found, as a testimony of the activity. According to Pedralli et al (1997) the succession of the forest formations is mainly associated with climatic changes, geologic changes and human intervention. Although the research on vegetation degradation processes have presented a number of related alterations on the structure, composition and vegetation environment, not much has been done considering quantita-tive measurements. Among the alterations referred one has: reduction of biomass (Hargyono 1993); change in species composition (Hargyono 1993, Kakembo 2001); reduction of vegetal cover (Kakembo

ASSESSMENT OF HUMAN AND PHYSICAL FACTORS INFLUENCING SPATIAL DISTRIBUTION OF VEGETATION DEGRADATION -ENVIRONMENTAL PROTECTION AREA CACHOEIRA DAS ANDORINHAS, BRAZIL
106
2001); soil degradation (Dongmo 1994; Hargyono 1993); reduction of tree growth (Dongmo 1994); in-crease of bare soil cover (Dongmo 1994), increase of cultivated plants (Dongmo 1994); increase of weeds and cultivated grasses (TCM 1998); elimination of seedlings (TCM 1998); decrease of palatable plants (Dondmo 1994; Hofastad 1997). Table 7: Human and physical factors classes (independent variables)
Classses Variables One Two Three Four Five Six
Roads dis-tance
0-100m 100-200m 200-300m 300-400m 400-500m >500m
Rural settle-ments, village/city distance
0-1000m 1000-2000m 2000-3000m 3000-4000m >4000m -
Tourist/mining sites distance
0-1000m 1000-2000m 2000-3000m 3000-4000m >4000m -
Agricultural areas distance
0-250m 250-500m 500-750m 750-1000m >1000m -
Slope 0-20 20-40 40-60 >60% - - Geology Rocky
forma-tions
Not rocky (Sediment deposits)
- - - -
Drainage dis-tance
0-100m 100-200m 200-300m 300-400m - -
The prolonged absence of fires can contribute even to the invasion of exotic species, since the competi-tive force of the native species of the lower layer is diminished, by delaying nutrient cycling or by de-crease in reproductive capacity