Assessment of Genetic Diversity in Nepalese Populations...
12
American Journal of Plant Sciences, 2013, 4, 1617-1628 http://dx.doi.org/10.4236/ajps.2013.48196 Published Online August 2013 (http://www.scirp.org/journal/ajps) Assessment of Genetic Diversity in Nepalese Populations of Swertia chirayita (Roxb. Ex Fleming) H. Karst Using RAPD-PCR Technique J. K. Chhipi Shrestha 1,2 , T. Bhattarai 2 , J. Sijapati 1 , N. Rana 1 , J. Maharjan 1 , D. S. Rawal 1 , B. B. Raskoti 3 , S. Shrestha 1* 1 Molecular Biotechnology Research Unit, Nepal Academy of Science and Technology, Lalitpur, Nepal; 2 Central Department of Bio- technology, Tribhuvan University, Kathmandu, Nepal; 3 Institute of Botany, Chinese Academy of Sciences (CAS), Beijing, China. Email: * [email protected] Received June 2 nd , 2013; revised July 2 nd , 2013; accepted July 19 th , 2013 Copyright © 2013 J. K. Chhipi Shrestha et al. This is an open access article distributed under the Creative Commons Attribution License, which permits unrestricted use, distribution, and reproduction in any medium, provided the original work is properly cited. ABSTRACT Owing to the high demand, Swertia chirayita populations in the wild are being depleted beyond its regeneration capac- ity. S. chirayita is one of the most valuable medicinal plants of Nepal in trade. Present Molecular investigation was un- dertaken to understand the level of genetic diversity in five S. chirayita populations of Nepal using Polymerase Chain Reaction (PCR)-based Random amplified polymorphic DNA (RAPD) technique. Thirty four accessions of S. chirayita along with six outlier accessions were analyzed using 26 arbitrary primers. Of the total 285 amplified bands scored for S. chirayita, 263 bands (92.28%) were polymorphic. Two major clusters were revealed in the phenogram generated from cluster analysis using NTSYS-PC software (version 2.21i) for the geographic populations under study. Principal Coor- dinate Analysis further substantiated the results of the phenograms. Swertia chirayita populations from Sankhuwasabha and Terathum were found to be genetically closest (68%, similar) whilst Nagarjun and Terathum were found to be most distant (33%, similar).The high genetic polymorphism reflected in S. chirayita populations indicates the good survival potentiality and adaptability in changing environmental scenario. The results thus produced might be helpful to plant breeders for elite cultivar development. The RAPD-PCR technique is found to be the rapid and effective tool for genetic diversity assessment in S. chirayita populations and generated insights for the formulation of conservation strategy of this vulnerable species together with its phytochemical distinctiveness. Keywords: PCR; DNA Fingerprinting; Molecular Marker; Genetic Diversity; Polymorphism 1. Introduction Nepal is very rich in medicinal plants and their associ- ated traditional knowledge. Over 1950 medicinal plants have so far been reported [1]. Medicinal plants of Nepal are increasingly depleting and threats to these high value resources are from land fragmentation, degradation, over- exploitation as well as prevailing climate change. S. chi- rayita has been listed as one of the top priority medicinal plants of Nepal as well as of Asia [2]. Swertia, member genus of the family Gentianaceae is widely distributed globally and is represented by over 135 species distributed in temperate areas of Asia, Africa, Europe, North America and Madagascar [3,4]. Owing to diverse physiographic zones, climatic contrasts and alti- tudinal gradients, Nepal possesses a rich diversity of Swertia species and boasts thirty species distributed from east to west and from tropical to alpine zones ranging from 600 m to 5600 m asl [5,6]. Swertia chirayita (Roxb. Ex Fleming) H. Karst, a leg- endary medicinal plant species of Nepal is reported to be distributed in 54 districts of Nepal [7]. Due to its highly potent and superior medicinal properties, it is highly de- manded in national and international markets and plays a dominant role in trade. Along with S. chirayita, eight other allied species having medicinal properties are also traded viz. S. angustifolia Buch.-Ham. Ex D. Don, S. ciliata (D. Don ex G. Don) B. L. Burtt, S. dilatata C. B. Clarke, S. multicaulis D. Don, S. racemosa (Griseb) C. B. Clark, S. tetragona Edgew, S. alata (Royle ex D. Don) C. B. Clarke and S. nervosa (G. Don) C. B. Clarke [8,9]. * Corresponding author. Copyright © 2013 SciRes. AJPS
Transcript of Assessment of Genetic Diversity in Nepalese Populations...

American Journal of Plant Sciences, 2013, 4, 1617-1628 http://dx.doi.org/10.4236/ajps.2013.48196 Published Online August 2013 (http://www.scirp.org/journal/ajps)
Assessment of Genetic Diversity in Nepalese Populations of Swertia chirayita (Roxb. Ex Fleming) H. Karst Using RAPD-PCR Technique
J. K. Chhipi Shrestha1,2, T. Bhattarai2, J. Sijapati1, N. Rana1, J. Maharjan1, D. S. Rawal1, B. B. Raskoti3, S. Shrestha1*
1Molecular Biotechnology Research Unit, Nepal Academy of Science and Technology, Lalitpur, Nepal; 2Central Department of Bio- technology, Tribhuvan University, Kathmandu, Nepal; 3Institute of Botany, Chinese Academy of Sciences (CAS), Beijing, China. Email: *[email protected] Received June 2nd, 2013; revised July 2nd, 2013; accepted July 19th, 2013 Copyright © 2013 J. K. Chhipi Shrestha et al. This is an open access article distributed under the Creative Commons Attribution License, which permits unrestricted use, distribution, and reproduction in any medium, provided the original work is properly cited.
ABSTRACT
Owing to the high demand, Swertia chirayita populations in the wild are being depleted beyond its regeneration capac- ity. S. chirayita is one of the most valuable medicinal plants of Nepal in trade. Present Molecular investigation was un- dertaken to understand the level of genetic diversity in five S. chirayita populations of Nepal using Polymerase Chain Reaction (PCR)-based Random amplified polymorphic DNA (RAPD) technique. Thirty four accessions of S. chirayita along with six outlier accessions were analyzed using 26 arbitrary primers. Of the total 285 amplified bands scored for S. chirayita, 263 bands (92.28%) were polymorphic. Two major clusters were revealed in the phenogram generated from cluster analysis using NTSYS-PC software (version 2.21i) for the geographic populations under study. Principal Coor- dinate Analysis further substantiated the results of the phenograms. Swertia chirayita populations from Sankhuwasabha and Terathum were found to be genetically closest (68%, similar) whilst Nagarjun and Terathum were found to be most distant (33%, similar).The high genetic polymorphism reflected in S. chirayita populations indicates the good survival potentiality and adaptability in changing environmental scenario. The results thus produced might be helpful to plant breeders for elite cultivar development. The RAPD-PCR technique is found to be the rapid and effective tool for genetic diversity assessment in S. chirayita populations and generated insights for the formulation of conservation strategy of this vulnerable species together with its phytochemical distinctiveness. Keywords: PCR; DNA Fingerprinting; Molecular Marker; Genetic Diversity; Polymorphism
1. Introduction
Nepal is very rich in medicinal plants and their associ- ated traditional knowledge. Over 1950 medicinal plants have so far been reported [1]. Medicinal plants of Nepal are increasingly depleting and threats to these high value resources are from land fragmentation, degradation, over- exploitation as well as prevailing climate change. S. chi- rayita has been listed as one of the top priority medicinal plants of Nepal as well as of Asia [2].
Swertia, member genus of the family Gentianaceae is widely distributed globally and is represented by over 135 species distributed in temperate areas of Asia, Africa, Europe, North America and Madagascar [3,4]. Owing to diverse physiographic zones, climatic contrasts and alti-
tudinal gradients, Nepal possesses a rich diversity of Swertia species and boasts thirty species distributed from east to west and from tropical to alpine zones ranging from 600 m to 5600 m asl [5,6].
Swertia chirayita (Roxb. Ex Fleming) H. Karst, a leg- endary medicinal plant species of Nepal is reported to be distributed in 54 districts of Nepal [7]. Due to its highly potent and superior medicinal properties, it is highly de- manded in national and international markets and plays a dominant role in trade. Along with S. chirayita, eight other allied species having medicinal properties are also traded viz. S. angustifolia Buch.-Ham. Ex D. Don, S. ciliata (D. Don ex G. Don) B. L. Burtt, S. dilatata C. B. Clarke, S. multicaulis D. Don, S. racemosa (Griseb) C. B. Clark, S. tetragona Edgew, S. alata (Royle ex D. Don) C. B. Clarke and S. nervosa (G. Don) C. B. Clarke [8,9]. *Corresponding author.
Copyright © 2013 SciRes. AJPS

Assessment of Genetic Diversity in Nepalese Populations of Swertia chirayita (Roxb. Ex Fleming) H. Karst Using RAPD-PCR Technique
1618
Nepal is reported to trade more than 45% of the world’s total volume of S. chirayita [10] of which only 1% is being used locally and the rest is being exported to India, China, Malaysia, Singapore, Germany, Italy, France, Swit- zerland, Sri Lanka, Bangladesh, Pakistan and USA to fulfill the demand of various medicinal plant based in- dustries [11].
Swertia chirayita is a multifaceted medicinal plant containing diverse bioactive chemical compounds and properties. Early studies documented the presence of sev- eral chemical compounds in S. chirayita such as chira- tinin, gentianine, amarogentin, amaroswerin, and several flavonoids, xanthones, terpenoids, iridoids and secoiri- doid glycosides [12-14]. These bioactive compounds and their derivatives are reported to have anti inflammatory, antidiabetic, antihepatotoxic, antileishmanial, anticarci- nogenic, antiviral and antihelmithic properties [15-18].
Due to versatile medicinal properties of S. chirayita, it is suffering from indiscriminate and unscientific harvest- ing from its natural habitats to fulfill national and inter- national demands [2]. This has rendered S. chirayita to be listed as critically endangered in India and vulnerable in Nepal by CITES and IUCN [19]. Therefore, an urgent need has been felt to conserve the existing diversity of this valuable germ plasm of Nepal and protect its habitats from further destruction, for its long term and sustainable utilization. As the survival index of a species is greatly determined by the existing polymorphisms and gene flow between populations, assessing genetic diversity and na- tural distribution pattern are considered vital for formu- lating conservation strategies of vulnerable species such as S. chirayita [20]. For a species to survive against en- vironmental pressures, the availability of a pool of gene- tic diversity is an essential prerequisite. Extinction would appear inevitable in its absence [21]. Phytochemical dis- tinctiveness is also linked to the genetic diversity [22].
An understanding of the breeding system (self or cross) is fundamental to any genetic improvement program. Regarding S. chirayita, few works have so far been car- ried out on cytology, genetics and reproductive biology. It was reported to be a cross pollinated species [23] with- out any field experiment. Recent work with open and bagging experiments also showed that the probable mode of pollination is cross pollination although selfing is also present [24].
Various molecular marker (protein and nucleic acid- based) techniques have been widely used in genetic stud- ies of wild plant populations. Such techniques enable re- searchers to answer questions pertinent to speciation, wi- thin and between population genetic diversity, gene flow and level of outcrossing [25]. Although co-dominant markers such as isozymes, Restriction Fragment Length Fragments (RFLPs) and Simple Sequence Repeats (SSRs)
are particularly useful in wild populations, dominant markers such as RAPD and Amplified Fragment Length Polymorphism (AFLP) have also been applied widely and efficiently [26]. In the present study, RAPD marker system has been employed because of its simplicity, ra- pidity, low cost and non-requirement of sequence infor- mation for primer design [27,28]. RAPDs have been used in the genetic diversity analyses and diagnostic marker development for species or population of various food crops, weeds, medicinal and aromatic plants [29-33] as well as in gene tagging of disease resistant genes and Marker assisted selection [30,34].
Genetic architecture of population is generally be- lieved to be the resultant of breeding system, gene flow within and between population, isolation mechanism and continued selection by various natural and artificial forces [35]. Genetic variation in any taxon is not uniformly dis- tributed throughout the geographic area, where it is cur- rently growing and populations growing in areas wide by geographical separation are expected to accumulate enor- mous genetic diversity. Therefore, for the assessment of genetic diversity, genotypes collected from different geo- graphical locations have to be considered which enables capturing of all sorts of allelic diversity of a particular taxon.
So far, no molecular approaches have been employed to assess the level of genetic diversity in S. chirayita populations from different geographical locations of Ne- pal. Present investigation was undertaken to assess ge- netic diversity of S. chirayita populations representing East, Central and Western development regions of Nepal using genome-based RAPD technique.
2. Material and Methods
2.1. Plant Materials
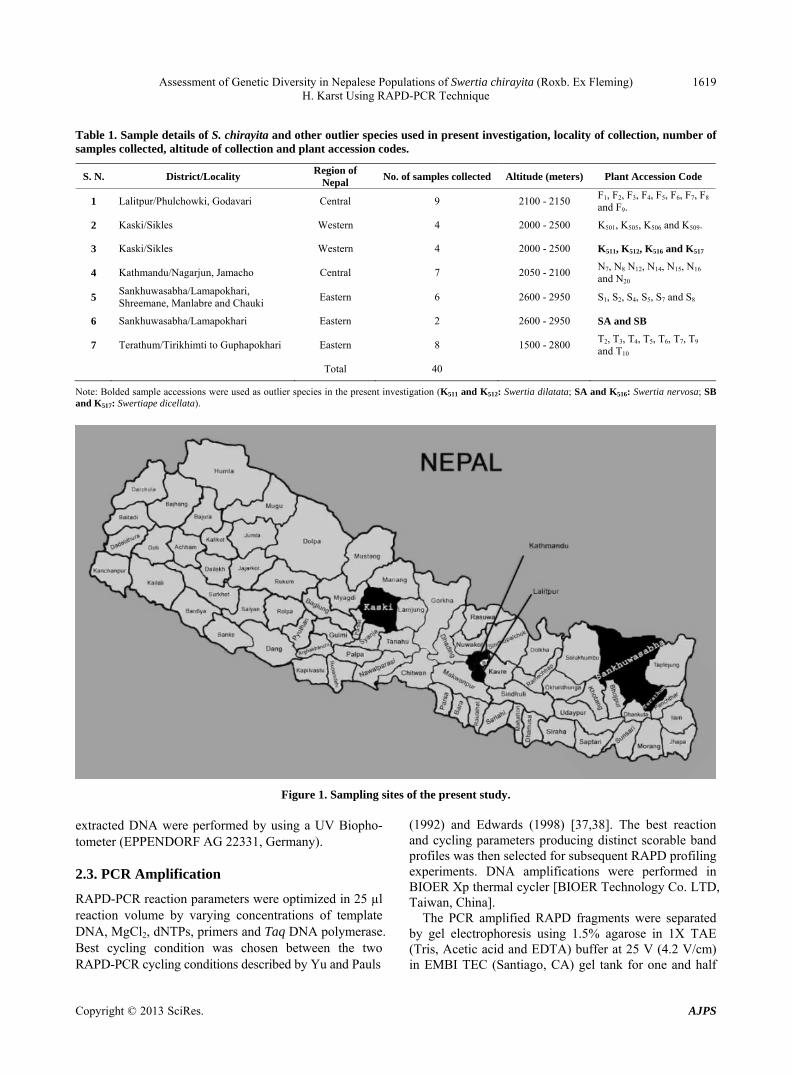
DNA samples of 34 accessions of S. chirayita and 6 out- lier species were collected in Silica gel from their natural habitats of five districts representing eastern, central and western development regions of Nepal (Table 1 and Fig- ure 1). Herbarium specimens of all these samples were also collected for their taxonomic identification.
Each herbarium and DNA sample was designated with accession code with respect to the site of collections and the collected samples were brought to the Molecular Biotechnology Laboratory of Nepal Academy of Science and Technology (NAST) for DNA extraction and subse- quent molecular analysis.
2.2. DNA Extraction and Quantification
Genomic DNA from various samples were extracted by using Hexadecyltrimethyl Ammonium Bromide (CTAB) method [36]. Quantification and purity assessments of
Copyright © 2013 SciRes. AJPS
Assessment of Genetic Diversity in Nepalese Populations of Swertia chirayita (Roxb. Ex Fleming) H. Karst Using RAPD-PCR Technique
Copyright © 2013 SciRes. AJPS
1619
Table 1. Sample details of S. chirayita and other outlier species used in present investigation, locality of collection, number of samples collected, altitude of collection and plant accession codes.
S. N. District/Locality Region of
Nepal No. of samples collected Altitude (meters) Plant Accession Code
1 Lalitpur/Phulchowki, Godavari Central 9 2100 - 2150 F1, F2, F3, F4, F5, F6, F7, F8
and F9.
2 Kaski/Sikles Western 4 2000 - 2500 K501, K505, K506 and K509.
3 Kaski/Sikles Western 4 2000 - 2500 K511, K512, K516 and K517
4 Kathmandu/Nagarjun, Jamacho Central 7 2050 - 2100 N7, N8 N12, N14, N15, N16 and N20
5 Sankhuwasabha/Lamapokhari, Shreemane, Manlabre and Chauki
Eastern 6 2600 - 2950 S1, S2, S4, S5, S7 and S8
6 Sankhuwasabha/Lamapokhari Eastern 2 2600 - 2950 SA and SB
7 Terathum/Tirikhimti to Guphapokhari Eastern 8 1500 - 2800 T2, T3, T4, T5, T6, T7, T9 and T10
Total 40
Note: Bolded sample accessions were used as outlier species in the present investigation (K511 and K512: Swertia dilatata; SA and K516: Swertia nervosa; SB and K517: Swertiape dicellata).
Figure 1. Sampling sites of the present study.
(1992) and Edwards (1998) [37,38]. The best reaction and cycling parameters producing distinct scorable band profiles was then selected for subsequent RAPD profiling experiments. DNA amplifications were performed in BIOER Xp thermal cycler [BIOER Technology Co. LTD, Taiwan, China].
extracted DNA were performed by using a UV Biopho- tometer (EPPENDORF AG 22331, Germany).
2.3. PCR Amplification
RAPD-PCR reaction parameters were optimized in 25 µl reaction volume by varying concentrations of template DNA, MgCl2, dNTPs, primers and Taq DNA polymerase. Best cycling condition was chosen between the two RAPD-PCR cycling conditions described by Yu and Pauls
The PCR amplified RAPD fragments were separated by gel electrophoresis using 1.5% agarose in 1X TAE (Tris, Acetic acid and EDTA) buffer at 25 V (4.2 V/cm) in EMBI TEC (Santiago, CA) gel tank for one and half

Assessment of Genetic Diversity in Nepalese Populations of Swertia chirayita (Roxb. Ex Fleming) H. Karst Using RAPD-PCR Technique
1620
hour. The gel were then stained in TAE buffer containing 35 µL of Ethidium bromide (10 mg/mL solution, PRO- MEGA Co.) for 45 min followed by 15 mins destaining in water prior to gel documentation using Gel Doc sys- tem (IN GENIUS, Syngene Bioimaging, UK).
2.4. RAPD Profiling
Initially, 100 decamer primers (from UBC primer set-1, University of British Columbia, Oligonucleotide Synthe- sis Laboratory, Vancouver, British Columbia, Canada) were screened against fresh genomic DNA of Swertia chirayita from Kaski district. Twenty six UBC primers (Table 2) that gave reproducible and scorable amplifica- tions were finally selected for the RAPD-PCR profiling involving all 40 accessions under study. All the acces- sions under study were screened with each of the 26 ran- dom primers to generate banding profiles for the genetic diversity study.
RAPD profiles generated by all 26 primers were used for the band scoring and binary data matrix creation. All polymorphic and monomorphic bands were scored. Mar- kers were scored visually as discrete variables (“1” for presence and “0” for absence). Amplification failure was scored as “9”, which was designated in the analysis pro- cedure as an indicator of missing data [39]. Molecular size of the PCR products was determined by comparing the position of bands with Gene rulerTM 100 bp plus DNA ladder (FERMENTAS company).
2.5. Data Analysis
The binary data matrix created was analysed using MS- Excel 2007 for the estimation of the banding characteris- tics namely: 1) Total number of bands (TNB), 2) number of polymorphic bands (NPB), 3) Percent Polymorphism (PP), 4) Polymorphic Information Content (PIC), 5) Band Informativeness (IB), and 6) Resolving Power (RP) for each primer used, which are defined by, PP =
NPB/TNB generated by each primer; 2
ijPIC 1 P ,
where Pij is the frequency of the ith pattern revealed by the jth primer summed across all patterns revealed by the primers [40]; , where P is the proportion of accessions containing the band. RP was calculated as [41].
BI 1 2 0.5 P
R I
P B
Within and between population genetic diversity esti- mation was computed using NTSYS (Numerical Tax- onomy and Multivariate System, version 2.21i, Exeter software; Setauket, New York, USA). Similarity indices were calculated applying a similarity for qualitative data (SIMQUAL) computer algorithm using NTSYS-PC. From these similarity indices, sequential, agglomerative, heirarchial and nested (SAHN) clustering was performed
using the unweighted pair group method of arithmetic averages algorithm (UPGMA) [42]. Estimates of similar- ity were computed based on three different measures: 1)
simple Matching coefficient (SM) [43], ij
a d
a b dS
c
;
2) Dice’s coefficient of similarity(D) [44], ij
2a
2 bS
a c
;
3) Jaccard’s coefficient (J) [45], ij
a
a bS
c
where,
Sij = the similarity between two individuals, i and j; a = the number of bands present in both i and j; b is the number of bands present in i and absent in j; c is the number of bands present in j and absent in i, and d is the number of bands absent from both i and j.
Original matrices of SM, J and D coefficients were compared by Mantel test [46] using MXCOMP option in NTSYS program. Similarly, the correlation between the similarity matrices and its corresponding phenograms were estimated with the cophenetic correlation test. The estimated correlation matrices show the goodness of fit of cluster analysis in accordance with similarity matrix. Also, the phenograms generated from different coeffi- cients were compared by consensus fork Index (CIc) that estimates the dendogram similarities and measure how well resolved the tree is [47]. Best fitted coefficient of similarity matrix was employed for the diversity assess- ment. Relationships among the S. chirayita individuals were also studied using a Principal Coordinate Analysis (PCoA) using Multivariate statistical package (MVSP 3.2).
3. Results
The optimized RAPD-PCR reaction parameters consisted of DNA (25 ng), MgCl2 (3.0 mM), 10X Taq polymerase reaction buffer [2.5 µl; 100 mM Tris-HCl (pH 8.8 at 25˚C), 500 mM KCl, 0.8% (v/v) Nonidet P40], Taq DNA polymerase (1U, MBI FERMENTAS company), dNTPs (0.2 mM each) and primer (0.4 µM) in 25 µl PCR reac- tion volume.
PCR cycling conditions described by Edwards (1998) produced best banding profile for S. chirayita and hence selected for subsequent PCR amplifications. Program consisted of an initial denaturation step at 95˚C for 2 min followed by 45 cycles of 95˚C for 20 s, 37˚C for 60 s and 72˚C for 60 s and final extension of 72˚C for 10 min.
3.1. RAPD Analysis
Primer screening involving 100 decamer primers resulted into 26 primers (Table 2) that produced scorable, repro-ducible and unambiguous polymorphic bands. The 26
Copyright © 2013 SciRes. AJPS

Assessment of Genetic Diversity in Nepalese Populations of Swertia chirayita (Roxb. Ex Fleming) H. Karst Using RAPD-PCR Technique
Copyright © 2013 SciRes. AJPS
1621
Table 2. Primer sequences, Total Number of Bands (TNB), Number of Polymorphic Bands (NPB), Percentage Polymorphism (PP), amplicon size range, PIC, IB and RP values of the 26 RAPD primers used to generate RAPD profiles of Swertia chirayita accessions.
Primer code Primer Sequence ( 5'-3') TNB NPB PP Amplicon size range (bp) PIC IB RP
UBC 2 CCTGGGCTTG 13 13 100.00 400 - 2500 0.90 0.95 13.29
UBC 3 CCTGGGCTTA 15 15 100.00 350 - 2800 0.90 0.68 10.18
UBC 6 CCTGGGCCTA 13 13 100.00 300 - 2100 0.91 1.20 16.28
UBC 51 CTACCCGTGC 7 4 57.14 500 - 2500 0.67 1.0 5.0
UBC 85 GTGCTCGTGC 9 6 66.67 450 - 1900 0.84 0.90 8.12
UBC 18 GGGCCGTTTA 9 9 100.00 200 - 2000 0.84 0.96 8.65
UBC 74 GAGCACCTGA 8 8 100.00 450 - 200 0.83 0.99 7.94
UBC 76 GAGCACCAGT 11 11 100.00 400 - 2150 0.89 0.79 9.53
UBC 23 CCCGCCTTCC 11 8 72.73 500 - 2400 0.84 0.95 8.59
UBC 43 AAAACCGGG 13 13 100.00 450 - 3600 0.85 0.74 9.65
UBC 65 AGGGGCGGGA 14 14 100.00 400 - 2700 0.86 0.63 8.82
UBC 97 ATCTGCGAGC 13 13 100.00 500 - 2000 0.84 0.47 6.06
UBC 86 GGGGGGAAGG 9 9 100.00 350 - 2400 0.86 0.81 8.06
UBC 4 CCTGGGCTGG 10 8 80.00 450 - 1900 0.84 1.10 9.94
UBC 73 GGGCACGCGA 10 10 100.00 600 - 2000 0.81 0.55 5.53
UBC 67 GAGGGCGAG 9 6 66.67 400 - 2000 0.81 0.94 7.53
UBC 15 CCTGGGTTTG 12 12 100.00 450 - 2500 0.87 0.64 8.35
UBC 16 GGTGGCGGGA 12 10 83.33 400 - 2000 0.87 1.01 11.06
UBC 54 GTCCCAGAGC 11 11 100.00 550 - 2600 0.87 0.76 9.18
UBC 66 GAGGGCGTGA 11 9 81.82 400 - 1700 0.82 0.70 7.65
UBC 71 GAGGGCGAGG 11 10 90.91 300 - 1800 0.89 1.22 13.41
UBC 88 CGGGGGATGG 10 9 90.00 400 - 3000 0.87 1.02 10.18
UBC 96 GGCGGCATGG 12 10 83.33 450 - 1600 0.89 1.09 11.06
UBC 92 CCTGGGCTTT 13 13 100.00 350 - 2700 0.90 0.38 4.94
UBC 55 TCCCTCGTGC 14 14 100.00 550 - 2000 0.90 0.52 7.29
UBC 17 CCTGGGCCTC 5 5 100.00 600 - 2200 0.74 0.40 2.41
Total 285 263 Average 0.85 0.82 8.8
primers generated a total of 285 RAPD loci across 34 S. chirayita accessions, with an average amplification of ≈11 bands per primer (Figure 2). Of these, 263 (92.28%) bands were polymorphic. Individually, polymorphic bands produced by each primer ranged from 57.14% to 100%. Sixteen out of twenty six primers furnished 100% poly- merphic bands (Table 2). The number of scorable bands produced per primer ranged from 5 to 15 with amplicon size ranging from 200 bp to 3600 bp.
PIC score for each primer ranged from 0.67 (UBC 51) to 0.91 (UBC 6) with an average of 0.85 (Table 2). The primers scoring PIC value more than 0.85 were UBC: 6, 2, 3, 92, 55, 96, 71, 76, 54, 16, 15, 86, 65 and 43 in de-creasing order of their values. The average Band Infor-mativeness (IB) of the 26 primers was 0.82 and it ranged from 0.38 (for UBC 92) to 1.22 (UBC 71). The RP of the 26 RAPD primers ranged from 2.41 for primer UBC 17 to 16.28 for primer UBC 6 with an average of 8.80. UBC

Assessment of Genetic Diversity in Nepalese Populations of Swertia chirayita (Roxb. Ex Fleming) H. Karst Using RAPD-PCR Technique
1622
primers 2, 3, 16, 71, 88 and 96 furnished RP values more than 10 (Table 2).
3.2. Genetic Diversity Assessment among Different Populations of S. chirayita
The varied ranges of similarity were obtained, using SM (0.65 - 0.96), J (0.26 - 0.89) and D (0.42 - 0.94) with an average similarity coefficient value of 0.81,0.58 and 0.68 respectively. The results from Mantel test of original ma- trices showed that the correlation between Jaccard and Dice similarity matrices was the highest and significant (0.92224) (Table 3).
Cophenetic correlations between the genetic similarity matrices and cophenetic matrices are shown (Table 4). UPGMA clustering for Jaccard coefficient had the high- est cophenetic correlation value of 0.85012 compared to Dice and Simple Matching coefficients. Because of the highest correlation value, Jaccard’s coefficient of simi- larity is evaluated to be the best for deducing the genetic
(a)
(b)
(c)
Figure 2. RAPD profile generated by primer UBC 6. Lanes marked with M are 100bp plus molecular weight markers. [A] Lanes F1 - F9 are S. chirayita accessions from Phul- chowki, K501 - K509 are S. chirayita from Kaski, K512 is S. dilatata and K516 is Swertia nervosa from Kaski [B] S1 - S8 are S. chirayita accessions from Sankhuwasbha; T2 - T10 are S. chirayita accessions from Terathum; N7 is S. chirayita accession from Nagarjun [C] N8 - N20 are S. chirayita acces- sions from Nagarjun; K511 is S. dilatata; K517 and SB are S. pedicellata and SA is Swertia nervosa.
relationship among various S. chirayita accessions using UPGMA algorithm.
Also, the results obtained from consensus indices showed that consensus fork index was the highest (CIC = 0.9063) for Jaccard and Dice coefficients (Table 5).
From all the comparisons made for similarity coeffi- cients, Jaccard’s coefficient was finally chosen as the best to interpret the results of genetic diversity among S. chirayita accessions. On the basis of Jaccard’s similarity matrix, genetic similarities (%) were estimated between the S. chirayita populations. From the pairwise compari- sons, S. chirayita accessions from Terathum: T2 and T3 were observed to be closest (89%, genetic similarity) and the accessions from Terathum (T4) and Nagarjun (N8) were revealed to be the most distant with genetic similar- ity value of 26%. The overall average genetic similarity value based on pairwise comparisons of 34 S. chirayita accessions was 49% (data not shown). Swertia chirayita populations from Sankhuwasabha and Terathum were found to be closest with 68% of mean genetic similarity (MGS) whilst accessions from Nagarjun and Terathum were found to be most distant with only 33% of MGS (Table 6).
3.3. Phenogram and PCoA Based Cluster Analysis
Figure 3 represents the phenogram constructed for 34 Table 3. Correlation coefficients from mantel test of origi- nal similarity matrices.
Simple Matching Jaccard Dice
Simple Matching *****
Jaccard 0.07056 *****
Dice 0.31292 0.92224 *****
Table 4. Cophenetic correlation coefficients obtained for si- milarity matrices and cophenetic matrices of clusters com- puted by UPGMA module using MXCOMP (matrix com- parisons) option of NTSYS.
Clustering modules of similarity
Simple matching
Dice Jacard
UPGMA 0.43580 0.84315 0.85012
Table 5. Consensus fork indices among the phenograms (UPGMA) produced by similarity coefficients among S. chirayita accessions by RAPD marker.
Jaccard Dice Simple Matching
Jaccard ***** 0.90625 0.71875
Dice ***** 0.71875
Simple Matching *****
Copyright © 2013 SciRes. AJPS

Assessment of Genetic Diversity in Nepalese Populations of Swertia chirayita (Roxb. Ex Fleming) H. Karst Using RAPD-PCR Technique
Copyright © 2013 SciRes. AJPS
1623
accessions of S. chirayita and 6 outlier accessions. Thirty four S. chirayita individuals were found separated into two major sub-clusters at the similarity coefficient of 0.37. The first sub-cluster contained 20 accessions from Phulchowki, Kaski and Nagarjun populations and the second sub-cluster contained 14 accessions from Sank- huwasabha and Terathum populations. In the first sub- cluster, Phulchowki and Kaski populations were shown genetically closer to each other than to Nagarjun popula- tion. Nagarjun populations were found separated from
Phulchowki and Kaski populations at similarity coeffi- cient of 0.44. In the phenogram, all five populations of S. chirayita under study clustered distinctly according to geographical distribution. The S. chirayita individuals within a population were clustered into a group at differ- ent similarity coefficient levels, viz. Phulchowki popula- tions at 0.61, Kaski at 0.73, Nagarjun at 0.56, Sankhu- wasabha at 0.78 and Terathum at 0.65. On the contrary, clear delineation between S. chirayita and different out- liers were visible in the phenogram (Figure 3).
Table 6. Mean genetic similarity (GS) of the S. chirayita accessions from five different populations based on RAPD similarity matrix (J).
Populations Phulchowki Kaski Sankhuwasabha Terathum Nagarjun
Phulchowki 57% 41% 38% 45%
Kaski 38% 38% 45%
Sankhuwasabha 68% 34%
Terathum 33%
Nagarjun
Cluster I
0.61
0.44
0.56
F1
0.78
0.65
0.37
Cluster II
0.19 0.37 0.54 0.71 0.89 Coefficient of Similarilty (Jaccard’s)
Population of S. chirayita accessions
Phulchowki Latitpur
Kaski/Sikles
Nagarjun/kathmandu
Sankhuwasabha
Terathum
outliers
F2 F3 F8
F6 F4 F7 F9
F5
K506 K509 K505 K501
N16 N20 N15 N14 N12 N8 N7
S8 S7 S5 S2 S4 S1
T7 T9 T4 T6 T5 T3 T2 T10
SA SB K517 K511 K512 K516
Figure 3. Phenogram generated for 34 Swertia chirayita accessions and six outlier accessions as revealed by UPGMA cluster analysis using Jaccard’s similarity coefficient. Binary data matrix created for 386 RAPD loci generated by 26 primers was
sed for the analysis. Two main clusters in S. chirayita are labeled as I and II. u

Assessment of Genetic Diversity in Nepalese Populations of Swertia chirayita (Roxb. Ex Fleming) H. Karst Using RAPD-PCR Technique
1624
In order to substantiate the genetic relationships among
the samples collected, a PCoA analysis based on the Eu- clidean matrix was carried out (Figure 4). The first (Ei- gen value = 29.537; percentage of variance = 38.3%) and second (Eigen value = 11.827; percentage of variance = 15.3%) axis with a cumulative variance of 53.6% was observed. Plots of the first two coordinates were used for generating a PCoA graph (Figure 4) which supports the result of phenogram by clustering the individuals ac- cording to their geographical locations. Swertia chirayita from Sankhuwasabha and Terathum grouped together in one cluster whereas from phulchowki, Kaski and Nagar- jun samples grouped into another cluster.
4. Discussion
All present day crop germplasms are products of domes- tication from the wild, long term selection and breeding for the improvement of desirable agronomic traits. Do- mestication followed by continued breedings selection for elite germplasms is an integral part of present day plant breeding [48]. Recently, developed molecular mar- ker techniques have greatly complemented conventional breeding for crop improvement. Genetic diversity as- sessments using molecular tools help to analyze genetic variability among populations, select parental materials
for hybridization for making new genetic recombination, select inbred parents for maximizing heterotic responses and identify materials that should be maintained for pre- servation of maximum genetic diversity in germplasm collections [49]. For all these applications, a simple and cost effective method for determination of genetic diver- sity relationships based on comparisons involving entire genomes is needed. In recent decades, a variety of mo- lecular techniques and genetic markers have been exten- sively developed to estimate genetic diversity, but no sin- gle technique is universally ideal and each available tech- nique exhibits both strengths and weaknesses. Therefore, the choice of technique is often a compromise that de- pends on the research question pursued and the genetic resolution needed [25]. Although it has been held, domi- nant marker like RAPD is not suitable for genetic analy- ses necessitating information on allele frequencies, they are appropriate in cases where allele frequency data are not needed. RAPD-marker system is a valuable tool for addressing genetic diversity, population genetics and plant breeding issues [50]. RAPD detects polymorphisms at DNA sequence level and has been widely applied in va- rious disciplines [29,30,32,34]. RAPD provides a power- ful tool to discriminate the closely related species even down to the level of subspecies [51].
PCO case scores (Euclidean)
K511
SO
SA
K517
K512
6.3
5.5
4.7
3.9
3.2
2.4
1.6
0.8-0.8
-1.6
-2.4
-3.2
-3.9
-4.7
-5.5
Axis 1
Axi
s 2
-0.8-1.6 -2.4 -3.2-3.9 -5.5 3.2 3.9 4.7 5.5 6.32.4
K516
0.8
N7
F7F4
F5
F2 F3 F6 F8
F1
F91.6
Figure 4. Principle coordinate analysis of 40 accessions of Swertia using MVSP 3.2.
Copyright © 2013 SciRes. AJPS

Assessment of Genetic Diversity in Nepalese Populations of Swertia chirayita (Roxb. Ex Fleming) H. Karst Using RAPD-PCR Technique
1625
Swertia chirayita being one of the most important me-
dicinal plants of Nepal having high demand in national/ international markets, natural populations of this species have become vulnerable. Although its domestication has started at various locations, scientific studies aiming at assessing genetic diversity of various populations and as- sessment of superior genotypes in terms of their chemical properties are still lacking. In this context, information on genetic diversity assessment of germplasm has several important applications for plant biologists, plant breeders, biotechnologists, chemists and conservationists [2,25,49, 50].
4.1. RAPD Analysis
The genetic polymorphism observed in the present RAPD investigation for S. chirayita is very high (i.e. 92.28%) in comparison to the value observed for Indian S. chirayita using ISSR marker. The genetic diversity study carried out in S. chirayita from temperate Himalaya of India in- volving ISSR markers indicated only 42.5% of polymor- phic bands [52]. In the similar study of intra-specific ge- netic variation pattern in endangered endemic species, Swertia przewalskii of Qinghai-Tibet plateau, the genetic polymorphism was observed to be 52% for RAPD and 56% for ISSR marker [53].Genetic polymorphism shown with RAPD analysis was 56% for Brassica carinata [54]; 82.61% for Anisodus tanguticus [55] and 52.85% for Tri- gonellafoenum-graecum [56].
The study reports that some of the primers were more useful than others for distinguishing accessions. Higher the PIC, IB and RP values, superior is the discriminating power of primer used [54,57]. PIC value higher than 0.5 indicates a highly polymorphic locus [40]. Amplification profiles for most of the UBC primers (6, 2, 3, 92, 55, 96, 71, 76, 54, 16, 15, 86, 65 and 43) gave a PIC score greater than 0.85 suggesting that these primers are espe- cially useful for RAPD based analyses of genetic diver- sity in S. chirayita. Band informativeness (IB) and the primer resolving power (RP) provide quantitative data allowing direct comparisons between primers [41]. RP of the 26 RAPD primers ranged from 2.41 for the primer UBC 17 to 16.28 for the primer UBC 6 with average es- timate of 8.8 (Table 2). As compared to values reported for other plants, mean PIC score (0.85) and RP score (8.8) in this study were comparatively higher [22,54,58].
4.2. Genetic Diversity Assessment and Cluster Analysis
It was suggested when the marker data are “allelic non- informative”, the estimates of coefficients between OTUs under consideration can be calculated by one of the three coefficients, based on the absence or presence of ob-
served bands viz. Dice’s similarity coefficient (D) is equi- valent to Nei-Li coefficient [60]; Jaccard’s similarity co- efficient (J) [45] and Simple matching similarity coeffi- cient (SM) [43] after examining 10 similarity coefficients are widely used in germplasm surveys [59]. In contrast to SM, both J and D do not involve shared absence of DNA bands. Thus, comparisons of these three similarity coef- ficient matrices and clustering methods seem imperative to find out the most fitted matrix for the discrimination of genetic diversity using RAPD profiles. Similarity matri- ces based on J and D were highly correlated (r > 0.92) according to Mantel matrix correspondence test together with the high correlation of their phenograms as given by Consensus index (r > 0.9). Comparing Cophenetic corre- lations between the genetic similarity matrices and co- phenetic matrices, UPGMA clustering for J had the high- est cophenetic correlation value (r > 0.85) than D and SM coefficients. According to Rohlf (2009), if the cophenetic correlation values, r is such that 0.8 ≤ r < 0.9, the similar- ity coefficient is interpreted as good fit for determination of genetic variability. Because of the highest correlation value, Jaccard’s coefficient of similarity is evaluated as the best for deducing the genetic relationship among va- rious S. chirayita accessions using UPGMA module and hence this has been employed for diversity assessment. In a similar study of Sesamum indicum L. using RAPD technique [61], presence of high genetic diversity was observed with Jaccard’s coefficient ranging from 0.19 to 0.89. The present study also revealed the similar range of Jaccard’s similarity coefficient of0.26 to 0.89 reflecting the high genetic diversity within S. chirayita accessions coming from various geographical populations. This is in contrary to the low diversity observed with ISSR marker based similarity values of Jaccard’s coefficient (i.e. 0.68 to 0.97) among S. chirayita accessions from temperate Himalaya of India [52].
Among the five populations investigated, the mean ge- netic similarity among the S. chirayita populations varied from 33% (for Nagarjun and Terathum) to 68% (for San- khuwasabha and Terathum) (Table 6). Lower the MGS, higher is the genetic diversity between those accessions. Higher the genetic distance, more ideal will be the acces- sions to be used as parents in hybridization, to develop improved new elite varieties [62]. The considerably high genetic diversity observed might be the synergistic con- sequences of cross pollination between the individuals in the population and act of evolutionary forces (natural se- lection, genetic drift and mutation) in the global climate change perspective [63]. This may be reflecting the good survival potential of the species in the existing environ- ment and also demonstrating fine degree of adaptability and acclimatization in the new selection pressure brought about by environmental changes. In addition to disease
Copyright © 2013 SciRes. AJPS

Assessment of Genetic Diversity in Nepalese Populations of Swertia chirayita (Roxb. Ex Fleming) H. Karst Using RAPD-PCR Technique
1626
resistance, greater genetic diversity leads to greater pro- ductivity in plant communities, greater nutrient retention as well as ecosystem stability [64]. The knowledge thus generated on the genetic diversity among S. chirayita ac- cessions can play a crucial role towards their conserva- tion and elite cultivar development.
In conclusion, the present molecular study based on RAPD highlighted that the high levels of genetic diver- sity are still maintained among S. chirayita accessions in different populations. Despite its vulnerable status, it has got the potential to adapt in its existing environment if the over encroachment by human is controlled. All these populations need to be judiciously conserved ex situ (e.g. in seed banks) as well as in situ in their natural habitats and sustainable harvesting practices must be followed for long term survival of this species. Furthermore, relevant laws should be strictly enforced to restrict the rampant exploitation of the species beyond its regeneration capac- ity that is still threatening many populations of valuable species in their natural habitats.
The genetic diversity estimates generated from the pre- sent study on the basis of RAPD data have not only high- lighted the inherent genetic relationship among five po- pulations under study but also produced data on intras- pecific polymorphic nature of S. chirayita accessions. Present investigation has opened up new avenues of aca- demic research in the field of high value germplasm cha- racterization, documentation, conservation and sustain- able utilization in Nepal.
5. Acknowledgements
Authors would like to acknowledge Ministry of Science and Technology, Government of Nepal for providing ne- cessary funds to run this project. Authors would also like to thank Nepal Academy of Science and Technology (NAST) for supporting this project.
REFERENCES [1] S. K. Ghimire, “Medicinal Plants in the Nepal Himalaya:
Current Issues, Sustainable Harvesting, Knowledge Gaps and Research Priorities,” In: P. K. Jha, S. B. Karmacharya, M. K. Chhetri, C. B. Thapa and B. B. Shrestha, Eds., Me- dicinal Plants in Nepal: Anthology of Contemporary Re- search, Ecological Society (ECOS), Kathmandu, Nepal, 2008, pp. 25-42.
[2] DPR, “Prioritized Medicinal Plants of Nepal for Research and Cultivation,” Department of Plant Resources Publica- tion, Ministry of Forests and Soil Conservation, Govern- ment of Nepal, 2005.
[3] L. Struwe and V. A. Albert, “Gentianaceae—Systematics and Natural History,” Cambridge University Press, Cam- bridge, 2002.
[4] K. Joshi, “Molecular Differentiation and Phylogeny of
Swertia (Gentianaceae) of the Himalayan Region, Nepal,” International Journal of Biotechnology and Biochemistry, Vol. 7, No. 2, 2011, pp. 265-277.
[5] J. R. Press, K. K. Shrestha and D. A. Sutton, “Annotated Checklist of the Flowering Plants of Nepal,” The Natural History Museum, London, 2000, pp. 117-119.
[6] D. P. Rijal, “Taxonomic Study of Some Medicinally Im- portant Species of Swertia L. (Gentianaceae) in Nepal,” Botanica Orientalis—Journal of Plant Science, Vol. 6, 2009, pp. 18-24.
[7] T. P. Barakoti, T. Chapagain, Y. Thapa and C. Bhusal, “Chiraito Conservation and Cultivation Workshop and Achievement,” Nepal Agriculture Research Centre, Pak- hribas, 1999.
[8] T. P. Barakoti, “Commercial Cultivation and Production Management of Chiraito: Scheme Guide,” ARS Pakhribas, Nepal Agricultural Research Council, Nepal, 2002, pp. 1- 50.
[9] K. Joshi and A. Joshi, “Swertia L. (Gentianaceae) in Ne- pal Himalaya: Checklist, Phytogeography, Ethnobotany and Conservation Status,” Ethnobotanical Leaflets, Vol. 12, 2008, pp. 361-372.
[10] T. P. Barakoti, “Attempts Made for Domestication, Con- servation and Sustainable Development of Chiretta (Swer- tiachirayita),” Nepal Agriculture Research Centre (NA- RC), Dhankuta, 2004.
[11] S. Phoboo, P. K. Jha and P. C. Bhowmik, “Biology and Phytochemistry of Swertiachirayita,” In: P. K. Jha, S. B. Karmacharya, M. K. Chhetri, C. B. Thapa and B. B. Shres- tha, Eds., Medicinal Plants in Nepal: Anthology of Con- temporary Research, Ecological Society (ECOS), Kath- mandu, 2008, pp. 203-211.
[12] M. B. Bajpai, R. K. Asthana, N. K. Sharma, S. K. Chat- terji and S. K. Mukherjee, “Hypoglycemic Effect of Swer- chirin from the Hexane Fraction of Swertia chirayita,” Planta Medica, Vol. 57, No. 2, 1991, pp. 102-104. doi:10.1055/s-2006-960041
[13] N. Pant, D. C. Jain and R. S. Bhakuni, “Phytochemicals from Genus Swertia and Their Biological Activities,” In- dian Journal of Chemistry, Vol. 39, 2000, pp. 565-586.
[14] P. Joshi and V. Dhawan, “Swertia chirayita—An Over- view,” Current Science, Vol. 89, No. 4, 2005, pp. 635- 640.
[15] P. Saha, S. Mandal, A. Das, P. C. Das and S. Das, “Evaluation of Anti-carcinogenic Activity of Swertia chi-rata Buch. Ham, an Indian Medicinal Plant on DMBA- Induced Mouse Skin Carcinogenesis Model,” Phytother-apy Research, Vol. 18, No. 5, 2004, pp. 373-378. doi:10.1002/ptr.1436
[16] H. Verma, P. R. Patil, R. M. Kolhapure and V. Gopal- krishna, “Antiviral Activity of the Indian Medicinal Plant Extract, Swertia chirata against Herpes Simplex Virus: A Study by in Vitro and Molecular Approach,” Indian Jour- nal of Medical Microbiology, Vol. 26, No. 4, 2008, pp. 322-326. doi:10.4103/0255-0857.43561
[17] S. Phoboo and P. K. Jha, “Trade and Sustainable Conser- vation of Swertia chirayita (Roxb. Ex Fleming) H. Karst
Copyright © 2013 SciRes. AJPS

Assessment of Genetic Diversity in Nepalese Populations of Swertia chirayita (Roxb. Ex Fleming) H. Karst Using RAPD-PCR Technique
1627
in Nepal,” Nepal Journal of Science and Technology, Vol. 11, 2010, pp. 125-132.
[18] S. Phoboo, M. D. S. Pinto, A. C. L. Barbosa, D. Sarkar, P. C. Bhowmik, P. K. Jha, et al., “Phenolic-Linked Bio- chemical Rationale for the Anti-Diabetic Properties of Swertia chirayita (Roxb. Ex Flem) Karst,” Phytotherapy Research, Vol. 27, No. 2, 2012, pp. 227-235.
[19] IUCN, “National Register of Medicinal and Aromatic Plants,” IUCN Nepal Publication, 2004.
[20] B. Y. Wang, L. Shi, Z. Y. Ruan and J. Deng, “Genetic Diversity and Differentiation in Dalbergiasissoo (Faba- ceae) as Revealed by RAPD,” Genetics and Molecular Research, Vol. 10, No. 1, 2011, pp. 114-120. doi:10.4238/vol10-1gmr995
[21] O. H. Frankel, “The Place of Management in Conserva- tion,” In: C. M. Schonewald-Cox, S. M. Chambers, B. MacBryde and L. Thomas, Eds., Genetics and Conserva- tion: A Reference Manual for Managing Wild Animals and Plant Populations, Benjamin/Cummings, Menlo Park, 1993, pp. 1-14.
[22] V. Arya, S. Yadav and J. P. Yadav, “Intra-Specific Ge- netic Diversity of Different Accessions of Cassia occi- dentalis by RAPD Markers,” Genetic Engineering and Biotechnology Journal, Vol. 22, 2011, pp. 1-8.
[23] T. N. Khoshoo and S. R. Tandon, “Cytological, Morpho- logical and Pollination Studies on Some Himalayan Spe- cies of Swertia,” Caryologia, Vol. 16, 1963, pp. 445-477.
[24] S. Chakraborty, D. Mukherjee and T. Dasgupta, “Cyto- logical Study on Chromosome Behaviour and New Re- port on Nature of Mode of Pollination of Swertia chiray- ita, a High Value Endangered Medicinal Plant of North Eastern Himalayan Region,” Caryologia, Vol. 62, No. 1, 2009, pp. 43-52.
[25] J. C. Avise, “Molecular Markers Natural History and Evolution,” 2nd Edition, Sinauer Associates Inc. Publish- ers, Sunderland, 2004.
[26] K. Weising, H. Nybom, K. Wolff and G. Kahl, “DNA Fingerprinting in Plants Principles, Methods and Applica- tions,” 2nd Edition, Taylor & Francis Group, Boca Raton, London, New York, Singapore, 2005. doi:10.1201/9781420040043
[27] J. G. K. Williams, A. R. Kubelik, K. J. Livak, J. A. Rafalski and S. V. Tingey, “DNA Polymorphisms Ampli- fied by Arbitrary Primers Are Useful as Genetic Mark- ers,” Nucleic Acids Research, Vol. 18, No. 22, 1990, pp. 6531-6535. doi:10.1093/nar/18.22.6531
[28] T. E. Dowling, C. Moritz, J. D. Palmer and L. H. Riese- berg, “Nucleic Acids III: Analysis of Fragments and Re- striction Sites,” In: D. M. Hillis, C. Moritz and B. K. Ma- ble, Eds., Molecular Systematic, 2nd Edition, Sinauer As- sociates Inc., Sunderland, 1996, pp. 249-282.
[29] J. P. Clapp, “Species Diagnostics Protocols PCR and Other Nucleic Acid Methods,” Humana Press, Totowa, 1996, pp. 25-38.
[30] K. Joshi, P. Chavan, D. Warude and B. Patwardhan, “Mo- lecular Markers in Herbal Drug Technology,” Current Science, Vol. 87, No. 2, 2004, pp. 159-165.
[31] S. Shrestha, S. W. Adkins, G. C. Graham and D. S. Loch, “An Identification Tool for the Australian Weedy Sporo- bolus Species Based on Random Amplified Polymorphic DNA (RAPD) Profiles,” Australian Journal of Agricul- tural Research, Vol. 56, No. 2, 2005, pp. 157-167. doi:10.1071/AR04180
[32] H. H. Salem, B. A. Ali, T. H. Huang, D. N. Qin, X. M. Wang and Q. D. Xie, “Use of Random Amplified Poly- morphic DNA Analysis for Economically Important Food Crops,” Journal of Integrated Plant Biology, Vol. 49, No. 12, 2007, pp. 1670-1680. doi:10.1111/j.1744-7909.2007.00582.x
[33] N. J. Sucher and M. C. Carles, “Genome Based Ap- proaches to the Authentication of Medicinal Plants,” Planta Medica, Vol. 74, No. 6, 2008, pp. 603-623. doi:10.1055/s-2008-1074517
[34] S. S. Sandhu, C. Colombo, C. R. Bastos and W. J. Siqueira, “DNA Tagging of Blast Resistant Gene(s) in Three Bra- zilian Rice Cultivars,” Genetics and Molecular Biology, Vol. 26, No. 4, 2003, pp. 473-477. doi:10.1590/S1415-47572003000400011
[35] K. P. S. Chandel and B. S. Joshi, “Multivariate Analysis in Green-Seeded Pea,” Indian Journal of Agricultural Sci- ence, Vol. 53, No. 4, 1983, pp. 198-200.
[36] G. C. Graham, P. Mayers and R. J. Henry, “A Simplified Method for the Preparation of Fungal Genomic DNA for PCR and RAPD Analysis,” BioTechniques, Vol. 16, No. 1, 1994, pp. 48-50.
[37] K. Yu and K. P. Pauls, “Optimisation of the PCR Pro- gram for RAPD Analysis,” Nucleic Acids Research, Vol. 20, No. 10, 1992, p. 2606. doi:10.1093/nar/20.10.2606
[38] K. J. Edwards, “Randomly Amplified Polymorphic DNAs (RAPDs),” In: A. Karp, P. G. Isaac and D. S. Ingram, Eds., Molecular Tools for Screening Biodiversity—Plants and Animals, Chapman and Hall, London, 1998, pp. 171- 179. doi:10.1007/978-94-009-0019-6_34
[39] D. K. Transue, D. J. Fairbanks, L. R. Robison and W. R. Andersen, “Species Identification by RAPD Analysis of Grain Amaranth Genetic Resources,” Crop Science, Vol. 34, No. 5, 1994, pp. 1385-1389. doi:10.2135/cropsci1994.0011183X003400050044x
[40] D. Botstein, R. L. White, V. Skolnick and V. Davis, “Construction of a Genetic Linkage Map in Man Using Restriction Fragment Length Polymorphisms,” American Journal of Human Genetics, Vol. 32, No. 3, 1980, pp. 314-331.
[41] A. Prevost and M. J. Wilkinson, “A New System of Com- paring PCR Primers Applied to ISSR Fingerprinting of Potato Cultivars,” Theoretical and Applied Genetics, Vol. 98, No. 1, 1999, pp. 107-112.
doi:10.1007/s001220051046
[42] P. H. A. Sneath and R. R. Sokal, “Numerical Taxonomy, the Principle and Practice of Numerical Classification, W H Freeman and Co., San Francisco, 1973.
[43] R. R. Sokal and C. D. Michener, “A Statistical Method for the Evaluating Systematic Relationships,” University of Kansas, Kansas, 1958.
Copyright © 2013 SciRes. AJPS

Assessment of Genetic Diversity in Nepalese Populations of Swertia chirayita (Roxb. Ex Fleming) H. Karst Using RAPD-PCR Technique
Copyright © 2013 SciRes. AJPS
1628
[44] L. R. Dice, “Measures of the Amount of Ecologic Asso- ciation between Species,” Ecology, Vol. 26, No. 3, 1945, pp. 297-302. doi:10.2307/1932409
[45] P. Jaccard, “Nouvelles Recherché sur la Distribution Flo- rale. Bulletin,” Societe Vaudoise Sciences Naturelles, Vol. 44, 1908, pp. 223-270.
[46] N. A. Mantel, “The Detection of Disease Clustering and a Generalized Regression Approach,” Cancer Research, Vol. 27, No. 2, 1967, pp. 209-220.
[47] R. R. Sokal, “Ecological Parameters Inferred from Spa- tial Correlograms,” In: G. P. Patil and M. Rosenzweig, Eds., Contemporary Quantitative Ecology and Related Econometrics, ICPH, 1979, pp. 167-196.
[48] B. D. Singh, “Plant Breeding-Principle and Metods,” Kal- yani Publishers, Ludhiana, 2000.
[49] C. E. Thormann and T. C. Osborn, “Use of RAPD and RFLP Markers for Germplasm Evaluation,” In: Applica- tions of RAPD Technology to Plant Breeding, Joint Plant Breeding Symposia Series, Minneapolis, 1992, pp. 9-11.
[50] A. Arif, M. A. Bakir, H. A. Khan, A. H. Al Farhan, A. A. Al Homaidan, A. H. Bahkali, et al., “Application of RAPD for Molecular Characterization of Plant Species of Medicinal Value from an Arid Environment,” Genetics and Molecular Research, Vol. 9, No. 4, 2010, pp. 2191- 2198. doi:10.4238/vol9-4gmr848
[51] W. C. Black, “Statistical Analysis of Arbitrarily Primed PCR Patterns in Molecular Taxonomic Studies,” In: J. P. Clapp, Ed., Species Diagnostic Protocols: PCR and Other Nucleic Acid Methods, Humana Press Inc., Totowa, 1996, pp. 39-56.
[52] P. Joshi and V. Dhawan, “Analysis of Genetic Diversity among Swertia chirayita Genotypes,” Biologia Planta- rum, Vol. 51, No. 4, 2007, pp. 764-768. doi:10.1007/s10535-007-0156-z
[53] D. Zhang, S. Chen, S. Hen, D. Zhang and Q. Gao, “Pat- terns of Genetic Variation in Swertia przewalskii, an En- dangered Endemic Species of the Qinghai-Tibet Plateau,” Biochemical Genetics, Vol. 45, No. 1-2, 2007, pp. 33-50.
[54] A. Teklewold and H. C. Becker, “Geographic Pattern of Genetic Diversity among 43 Ethiopian Mustard (Brassica carinata A. Braun) Accessions as Revealed by RAPD Analysis,” Genetic Resources and Crop Evolution, Vol. 53, No. 6, 2006, pp. 1173-1185.
doi:10.1007/s10722-005-2011-4
[55] W. Zheng, L. Wang, L. Meng and J. Liu, “Genetic Varia-
tion in the Endangered Anisodus tanguticus (Solanaceae), an Alpine Perennial Endemic to the Qinghai-Tibetan Pla- teau,” Genetica, Vol. 132, No. 2, 2008, pp. 123-129. doi:10.1007/s10709-007-9154-5
[56] S. Sundaram and S. Purwar, “Assessment of Genetic Diversity among Fenugreek (Trigonella foenum-graecum L.), Using RAPD Molecular Markers,” Journal of Me- dicinal Plants Research, Vol. 5, No. 9, 2010, pp. 1543- 1548.
[57] C. Luce, J. L. Noyer, D. Tharreau, N. Ahmadiand and H. Feyt, “The Use of Microsatellite Markers to Examine the Genetic Markers to Examine the Genetic Resources of Rice (Oryza sativa L.) Adapted to European Condi- tions,” Acta Horticulturae, Vol. 546, 2001, pp. 221-234.
[58] V. A. Sebastian, L. D. Cruz, R. B. Subramanian and V. J. Braganza, “Assessment of Genetic Diversity within and among Populations of Tylophora rotundifolia Using RAPD Markers,” Gene Conserve, Vol. 9, No. 37, 2010, pp. 94-117.
[59] J. C. Rief, A. E. Melchinger and M. Frisch, “Genetical and Mathematical Properties of Similarity and Dissimi- larity Coefficients Applied in Plant Breeding and Seed Bank Management,” Crop Science, Vol. 45, No. 1, 2005, pp. 1-7. doi:10.2135/cropsci2005.0001
[60] M. Nei and W. H. Li, “Mathematical Model for Studying Genetic Variation in Terms of Restriction Endonucl- eases,” Proceedings of the National Academy of Sciences of the United States of America, Vol. 76, No. 10, 1979, pp. 5269-5273.doi:10.1073/pnas.76.10.5269
[61] K. V. Bhat, P. B. Prashant and S. Lakhanpaul, “Study of Genetic Diversity in Indian and Exotics Sesame (Sesa- mum indicum L.) Germplasm Using Random Amplified Polymorphic DNA (RAPD) Markers,” Euphytica, Vol. 110, No. 1, 1999, pp. 21-33.
doi:10.1023/A:1003724732323
[62] S. P. J. Prakash, K. R. Biji, S. M. Gomez, K. G. Murthy and R. C. Babu, “Genetic Diversity Analysis of Sorghum (Sorghum bicolor L. Moench) Accessions Using RAPD Markers,” Indian Journal of Crop Science, Vol. 1, No. 1-2, 2006, pp. 109-112.
[63] M. Slatkin, “Gene Flow and Geographic Structure of Natural Populations,” Science, Vol. 236, No. 4803, 1987, pp. 787-792. doi:10.1126/science.3576198
[64] D. Tilman, “Causes, Consequences and Ethics of Biodi- versity,” Nature, Vol. 405, 2000, pp. 208-211. doi:10.1038/35012217