Assessment of financing needs of SMEs in the Western...
42
Assessment of financing needs of SMEs in the Western Balkans countries Synthesis Report August 2016
Transcript of Assessment of financing needs of SMEs in the Western...

Assessment of financing needs of SMEs in the Western Balkans countries
Synthesis ReportAugust 2016


August 2016
BFC Max-Högger-Strasse 6 Phone: +41 44 784 22 22 [email protected] CH-8048 Zurich, Switzerland Fax: +41 44 784 23 23 www.bfconsulting.com
Assessment of financing needs of SMEs in the Western Balkans countries
Synthesis Report

Acknowledgements We would like to acknowledge the support of BFC – Business and Financing Consulting for all their work in conducting the country scoping missions and reports. Without their work, this study would not have been possible. We would also like to thank all of those who participated in interviews, including regula-tors, donors, providers and other stakeholders across the all involved countries. Finally, the European Investment Bank and Western Balkans Enterprise Development and Innovation Facility (EDIF) would like to extend special thanks to the authors; Peter Hauser, Tatyana Dolgaya, Sorin Revenko, Michael Kortenbusch and to the editors for their contributions; Luca Gattini and Dragan Soljan. This document has been produced with the financial support of Western Balkans Enterprise Develop-ment and Innovation Facility (EDIF), and managed by the European Investment Bank. BFC consultans EIB Editors Peter Hauser Luca Gattini Tatyana Dolgaya Dragan Soljan Sorin Revenko Michael Kortenbusch EIB’s Economics Department: The mission of the EIB’s Economics Department is to provide economic analyses and studies to support the Bank in its operations and in its positioning, strategy and policy. The Department, a team of 30 economists and assistants, is headed by Debora Revoltella, Director of Eco-nomics. Disclaimer The views expressed in this document are those of the authors and do not necessarily reflect the position of the European Investment Bank or its shareholders. The authors take full responsibility for the contents of this report. The opinions expressed do not necessarily reflect the view of the European Investment Bank.

Table of contents About this report ................................................................................................................... 5
1 Demand analysis ............................................................................................................. 6 1.1 Number of SMEs ..........................................................................................................................6 1.2 Contribution to the economy ......................................................................................................7 1.3 Characteristics of MSMEs ............................................................................................................7 1.4 Regulatory and institutional issues ..............................................................................................9 1.5 Demand for finance .................................................................................................................. 11
2 Supply analysis ............................................................................................................. 13 2.1 Type of intermediary ................................................................................................................ 13 2.2 Type of funding instruments ..................................................................................................... 14 2.3 Characteristics of funding recipients ........................................................................................ 18 2.4 Institutional and regulatory issues ............................................................................................ 19 2.5 Funding of intermediaries ......................................................................................................... 20
3 Conclusion: Gaps in private sector financing .................................................................. 22 3.1 Gaps by product type ................................................................................................................ 22 3.2 Gaps by type SME ..................................................................................................................... 24
4 Recommendations and strategy options........................................................................ 27 4.1 Loan gap .................................................................................................................................... 29 4.2 Leasing gap ................................................................................................................................ 30 4.3 Equity gap ................................................................................................................................. 31 4.4 Trade finance gap...................................................................................................................... 31 4.5 Micro and very small enterprise gap ........................................................................................ 31 4.6 Agriculture gap .......................................................................................................................... 32 4.7 Startup gap ................................................................................................................................ 33 4.8 Regional gap .............................................................................................................................. 33 4.9 Informal enterprise gap ............................................................................................................ 33 4.10 TA project sizes ......................................................................................................................... 34 4.11 Summary of key recommendations .......................................................................................... 35
Annex 1: Macroeconomic indicators .................................................................................... 37
Annex 2: Banking sector indicators....................................................................................... 38

List of Acronyms
BEEPS Business Environment and Enterprise Performance Survey
BFC Business and Finance Consulting CA Central Asia
CAR Capital Adequacy Ratio
CPI Consumer Price Index
DFI Development Finance Institution
EBRD European Bank for Reconstruction and Development
EDIF Enterprise Development & Innovation Facility EE Eastern Europe
EFSE European Fund for Southeast Europe
EIB European Investment Bank
EU European Union
EUR Euro (currency)
FBiH Federation of Bosnia and Herzegovina FDI Foreign Direct Investment
GDP Gross Domestic Product
IFI International Financial Institution
KfW German Development Bank
MFI Micro-Finance Institution
MSME Micro, Small and Medium Enterprises NPL Non-Performing Loan
OECD Organisation for Economic Co-operation and Development
PE Private Equity
RS Republika Srpska
SEE South-eastern Europe
SIDA Swedish International Development Cooperation Agency SME Small and Medium Enterprise
TA Technical Assistance
USAID United States Agency for International Development
USD United States Dollar (currency)
VAT Value Added Tax
VC Venture Capital

BFC. Assessment of financing needs of SMEs in Western Balkans countries. Synthesis Report
5
About this report This report is one of a series of reports produced by Business & Finance Consulting GmbH (BFC) for European Investment Bank (EIB) as part of the project “Assessment of financing needs of SMEs in Western Balkans countries.” The series of reports includes individual reports on Albania, Bosnia and Herzegovina, Kosovo1, Macedonia, Montenegro, and Serbia as well as a synthesis report that consid-ers the results of all six reports. The purpose of the project is to assess the financing needs of SMEs in the Western Balkans and identify market failures that prevent SME access to finance. The project was carried out from October 2015 to April 2016 by a team of three experts from BFC. Onsite visits were conducted for each country in order to meet with representatives from financial institutions, development institutions, government organizations, and other relevant experts who can provide insights into the SME sector. The authors take full responsibility for the contents of this report. The opinions expressed do not necessarily reflect the view of the European Investment Bank. Unless otherwise noted, the term SME is meant to include micro enterprises throughout this report.
1 For the sake of convenience, Kosovo is referred to as a “country” in this document, but the authors take no position as to the legal recognition of Kosovo as a sovereign state. This designation is without prejudice to positions on status, and is in line with UNSCR 1244/1999 and the ICJ Opinion on the Kosovo declaration of independence. Full country names are also shortened for the sake of simplicity (e.g. Former Yugoslav Republic of Macedonia is shortened to Macedonia in the text).

BFC. Assessment of financing needs of SMEs in Western Balkans countries. Synthesis Report
6
1 Demand analysis Key findings: • There are an average of 39 SMEs per 1,000 inhabitants across the region, just below the EU av-
erage • The contribution of SMEs to employment, turnover and value added is, in most cases, higher
than the EU average and is especially high in Montenegro and Macedonia • The most common economic sectors in which SMEs can be found are trade and services; there
are very few in the agriculture sector based on official statistics, since many small farms are un-registered
• The business environment, including the regulatory framework, is generally improving gradually over time; Macedonia, Montenegro and Serbia tend to be rated the highest among the six coun-tries
• On average across the region, practices of the informal sector, tax rates, access to finance, and political instability are rated as the biggest constraints, although there is great variety from country to country
1.1 Number of SMEs The density of SMEs per inhabitant is just below the EU average The number of SMEs (including microenterprises) in the target region for this study totals 717,973, equivalent to 39 enterprises for every 1,000 inhabitants. This average density is not far behind the EU average of about 44 enterprises per 1,000 inhabitants2. The frequency varies from a low of 25.5 enterprises per 1,000 inhabitants in Kosovo to a high of 48.7 in Bosnia and Herzegovina. Table 1. Number of SMEs ALB BOS3 KOS MAC MON SER TOTAL SMEs 111,509 186,341 45,985 70,453 22,351 281,334 717,973 Population (millions) 2.9 3.8 1.8 2.1 0.62 7.2 18.4 SMEs per 1,000 pop. 38.5 48.7 25.5 33.6 35.9 39.3 39.0 Data year 2014 2015 2013 2014 2012 2013 Number of employees <50 <250 Source: Local statistical agencies One factor that could at least partly explain the gap between SME density in the Western Balkans and the EU is the high unemployment rate (averaging 25% in the six countries), particularly the un-employment rate among young people (averaging 47%). The unwillingness or inability of the unem-ployed to start a business is an important constraint to economic development in the region. The local statistics agencies use 250 employees as the upper boundary for the definition of an SME, except in Albania where the boundary is 50. The statistics for Albania, therefore, effectively repre-sent the number of micro and small enterprises (based on the EU definition) rather than the number of SMEs. The statistics in all countries exclude unregistered businesses, overlooking what is reported to be a large informal economy. In Serbia and Kosovo, the number includes all registered SMEs, while in the other countries, only the number of active enterprises – those that submitted financial reports in the most recent period – are counted.
2 European Commission. Annual Report on European SMEs 2014/2015. November 2015. 3 The figures for Bosnia and Herzegovina include an estimate for the number of sole proprietorships, which may be over-stated, resulting in the very high density per 1,000 inhabitants

BFC. Assessment of financing needs of SMEs in Western Balkans countries. Synthesis Report
7
1.2 Contribution to the economy SMEs play a major role in the regional economy, contributing more than half of employment and value added The number of SMEs as a share of the total number of enterprises is generally consistent throughout the region, varying from 99.7% to 99.9% (except in Albania, where the number of medium enterpris-es is unknown), in line with the EU average of 99.8%. In Kosovo, Macedonia and Serbia, the contribu-tion of SMEs to total employment is above the EU average of 67%, while it is roughly the same in Bosnia and Herzegovina (and not available in Albania and Montenegro). SMEs in Bosnia and Herze-govina, Macedonia, and Montenegro exhibit a contribution to value added which is higher than the EU average, although Serbia’s contribution is below average, mainly because Serbia has a more suc-cessful large corporate sector than the other countries. Table 2. Contribution of SMEs to the economy ALB* BOS KOS MAC MON SER EU # of enterprises 98.7% 99.8% 99.9% 99.7% 99.8% 99.8% 99.8% Employment 60.3% 66.3% 80.7% 75.6% - 70.4% 66.9% Value added 50.0% 61.6% - 65.5% 67.2% 53.0% 57.8% Turnover 55.5% 71.7% - 67.7% 76.6% - - * For Albania, the contribution is for micro and small enterprises only
1.3 Characteristics of MSMEs 1.3.1 Size Micro enterprises make up 95% of the total, followed by small (3–4%) and medium (1–2%) Most of the countries are consistent with each other in terms of the share of enterprises in each size range. Micro enterprises comprise about 95% of the total, small in the 3–4% range, and medium around 1%. The only exception is Macedonia, where the share of small and medium enterprises is noticeably higher at the expense of a lower share of micro enterprises. Table 3. Share of number of enterprises by size grouping (based on number of employees) ALB BOS KOS MAC MON SER Micro (0–9) 94.6% 95.6% 95.0% 90.8% 98.7% 95.9% Small (10–49) 4.1% 3.2% 4.2% 7.0% 3.2% Medium (50–249) 1.3% 1.1% 0.7% 1.8% 1.1% 0.7% Large (250+) 0.2% 0.1% 0.3% 0.2% 0.2% For Montenegro, there is no breakdown available between micro and small, and in Albania, as men-tioned above, there is no breakdown between medium and large.
1.3.2 Sector Trade and services are the most popular sectors for SME activity SMEs tend to be most active in the trade and service sectors and less so in manufacturing and agri-culture. The very low share of agricultural enterprises in the table below reflects that most small farming households are not registered and thus not included in the official statistics. The trading sec-tor represents from roughly 30% to 50% of all SMEs in the region, above the average of 28% for SMEs in the EU. Although manufacturing only accounts for 9% to 16% of SMEs, several of the coun-tries analyzed exceed the EU average of 9%, with Serbia and Bosnia and Herzegovina having the highest percentages. In all countries in the target region, the percentage of SMEs engaged in con-struction is well below the EU average. Most of the “other” category in the table below is accounted for by the service sector.

BFC. Assessment of financing needs of SMEs in Western Balkans countries. Synthesis Report
8
Table 4. Sector analysis: number of registered SMEs by sector
Notes: for Bosnia, figures exclude sole proprietorships; for Kosovo and Montenegro, figures include large enterprises
1.3.3 Regional distribution Enterprise concentration in the capital city is moderate overall, but varies by country The target countries tend to have a moderate to high concentration of enterprises in the capital city and surrounding area. In Albania, the concentration around Tirana is especially high at 44%, whereas Kosovo, Montenegro and Serbia have lower concentrations of 24%, 32% and 31%, respectively. Table 5. Concentration of enterprises by number in capital city ALB BOS KOS MAC MON SER Share of enterprises 44% n/a 24%4 38% 32% 31% For the sake of comparison, the same indicator is provided for a number of selected countries in Eastern and Southeastern Europe. These peer countries demonstrate a wide range of values, with the target countries falling in between the highest and lowest extremes. Concentration of enterprises by number in capital city (peer countries) Country Concentration Country Concentration Romania 23.5% Lithuania 40.6% Bulgaria 28.3% Latvia 55.5% Slovenia 20.7% Estonia 25.9% Moldova 65.7% Sources: National bureaux of statistics
1.3.4 Age of owners Young people comprise a small share of business owners throughout the region. In Serbia, for exam-ple, just 7.7% of self-employed persons are under 30 years old, and just 3.6% are under 25. The ma-
4 In the absence of other data, the share of newly registered enterprises in the second half of 2015 is reported
41%
31%
51%
35%
39%
30%
28%
2%
2%
4%
1%
2%
9%
14%
13%
11%
9%
16%
9%
4%
6%
7%
6%
9%
7%
14%
44%
48%
30%
44%
42%
44%
49%
0% 10% 20% 30% 40% 50% 60% 70% 80% 90% 100%
ALB
BOS
KOS
MAC
MON
SER
EU
Trade Agriculture Manufacturing Construction Other

BFC. Assessment of financing needs of SMEs in Western Balkans countries. Synthesis Report
9
jority – just over 50% of all self-employed persons – are 50 years old or above.5 This is a particular concern for a country with a youth unemployment rate of 49.5%6. Although data on the age of own-ers is not available for all countries in the region, the situation is likely to be similar, as confirmed by interviews with local experts.
1.4 Regulatory and institutional issues Practices of the informal sector, tax rates, access to finance, and political instability are rated as significant constraints In the World Bank’s Doing Business rankings for 2016, Macedonia ranks very highly, at 12th out of 189 economies, with Albania and Bosnia and Herzegovina ranked relatively poorly. Macedonia’s ex-cellent performance overall is highlighted by a rank of second in the world in terms of starting a busi-ness, and the country is also in the top ten for paying taxes and getting construction permits. Across the region, the topics of construction permits, getting electricity, and paying taxes rank poorly on av-erage, whereas getting credit, trading across borders, and protecting investors are ranked highly. Table 6. Doing Business rankings
ALB BOS KOS MAC MON SER AVG Ease of doing business 2016 97 79 66 12 46 59 60 Starting a business 58 175 47 2 59 65 68 Dealing with construction permits 189 171 136 10 91 139 123 Getting electricity 162 119 124 45 163 63 113 Registering property 107 97 32 50 79 73 73 Getting credit 42 42 28 42 7 59 37 Protecting investors 8 66 57 14 36 81 44 Paying taxes 142 154 67 7 64 143 96 Trading across borders 37 28 71 26 42 23 38 Enforcing contracts 96 66 48 26 43 73 59 Resolving insolvency 42 38 163 37 36 50 61 Source: World Bank, Doing Business 2016; Green = Better than average; Red = Worse than average All countries in the region fall roughly in the middle third of Transparency International’s Corruption Perceptions Index for 2015, although Montenegro’s rank of 61 is appreciably better than Kosovo’s rank of 103. Table 7. Corruption perceptions index ALB BOS KOS MAC MON SER Rank (out of 168 countries) 88 76 103 66 61 71 Source: Transparency international In the OECD Policy Index, Serbia and Macedonia have the highest average scores (the scale is 1 to 5, with 5 representing the highest score), while Bosnia and Herzegovina and Kosovo trail the other countries. On average, the region tends to score highly on the topics of operational environment for SMEs and regulatory framework but scores poorly with regard to green economy, innovation policy, and entrepreneurial learning and women’s entrepreneurship.
5 Suzana Stefanovic, Daniela Stosic (2012), “Age and Education as Determinants of Entrepreneurship”. Facta Universitatis. Vol.9, No.3, pp. 327-339. 6 ILO estimate for ages 15-24.

BFC. Assessment of financing needs of SMEs in Western Balkans countries. Synthesis Report
10
Table 8. OECD SME Policy Index ratings ALB BOS KOS MAC MON SER AVG 2.54 1.79 1.81 2.40 2.54 2.35 2.24 Entrepreneurial learning and women’s entrepreneurship 3.20 3.13 2.99 3.40 3.64 2.76 3.19
Bankruptcy and second chance for SMEs 3.55 2.16 2.59 3.74 3.75 4.00 3.30 Regulatory framework for SME policy making 4.32 2.02 3.08 4.11 3.62 4.00 3.53 Operational environment for SMEs 2.48 2.39 1.88 2.61 2.94 3.47 2.63 Support services for SMEs and startups 3.17 2.67 2.83 3.50 3.33 3.00 3.08 Public procurement 3.04 3.09 2.17 2.96 3.07 3.83 3.03 Access to finance for SMEs 3.06 2.63 2.56 3.88 2.81 3.88 3.14 Standards and technical regulations 3.13 2.31 3.06 3.38 2.69 2.94 2.92 Enterprise skills 2.51 1.89 1.37 2.42 2.02 3.25 2.24 Innovation policy for SMEs 1.86 1.29 1.57 2.50 2.29 2.79 2.05 SMEs in a green economy 3.21 2.21 2.14 3.79 3.29 4.21 3.14 Internationalization of SMEs 3.01 2.30 2.34 3.22 3.00 3.37 2.87 Source: OECD SME Policy Index; Green = Better than average; Red = Worse than average Respondents to the World Bank Enterprise Surveys are asked to indicate the biggest constraint on their business. On average across the region, practices of the informal sector, tax rates, access to finance, and political instability are rated as the biggest constraints. However, there is great variety from country to country. Practices of the informal sector are most frequently identified as the main constraint in Albania, Kosovo and Macedonia while political instability is the main constraint in both Bosnia and Herzegovina and Serbia. Tax rates are by far rated as the main constraint in Montenegro. Table 9. Top constraints as % of respondents in World Bank Enterprise Surveys Indicator ALB BOS KOS MAC MON SER AVG Access to finance 14.3 15.5 16.3 21.5 9.1 9.7 14.4 Access to land 6.6 0.9 2.0 1.3 1.2 0.9 2.2 Business licensing and permits 1.4 3.9 1.4 0.4 0.4 1.3 1.5 Corruption 7.0 8.1 10.9 1.6 1.2 11.7 6.8 Courts 0.3 3.4 1.5 5.1 0.2 4.5 2.5 Crime, theft and disorder 1.6 1.9 2.4 1.1 2.5 1.3 1.8 Customs and trade regulations 1.1 7.9 9.4 2.0 9.1 3.3 5.5 Electricity 15.0 1.6 7.8 6.6 2.6 0.2 5.6 Inadequately educated workforce 2.1 2.0 7.0 6.8 2.7 6.1 4.5 Labor regulations 0.1 6.8 0.4 0.7 4.3 0.1 2.1 Political instability 5.3 31.4 4.0 10.2 6.9 28.7 14.4 Practices of the informal sector 18.8 4.3 26.0 30.1 18.0 10.6 18.0 Tax administration 12.9 1.3 4.3 2.7 2.6 5.2 4.8 Tax rates 10.8 8.2 5.5 8.7 38.0 16.1 14.6 Transportation 3.0 2.9 1.0 1.2 1.0 0.4 1.6 Source: World Bank Enterprise Surveys, Green = Minor constraint; Red = Major constraint The EBRD BEEPS data is consistent with the result of the Enterprise Surveys. As shown in the follow-ing table, respondents in three countries rated informal sector competition as the top barrier. The number in the cells represents the rank in terms of severity of the given constraint. A “1” means that the given constraint was rated the most severe constraint, a “2” means that the given constraint was rated the second most severe constraint, and so on. Blank cells indicate that the given constraint was not among the top three in that country. There were other constraints included in the survey (such as transport and crime), but none of the other constraints received a top 3 ranking in any

BFC. Assessment of financing needs of SMEs in Western Balkans countries. Synthesis Report
11
country and thus are not included in the table below. Enterprises in Bosnia and Herzegovina and Serbia both rated political instability as the top constraint. Access to finance and access to electricity were also consistently rated as major constraints. Table 10. Top constraints by rank in the BEEPS data ALB BOS KOS MAC MON SER Informal sector 2 3 1 1 1 Access to finance 2 2 2 3 Electricity 1 2 3 3 Corruption 3 3 Political instability 1 1 Tax administration 2 Source: EBRD The fact that access to finance is rated as a major constraint in the surveys but gets good scores in the Doing Business study and SME Policy Index reflects the differing research methods. The Doing Business study and SME Policy Index are rating the regulatory and institutional environment, where-as the respondents to the surveys are also taking into account other factors, such as service quality and product conditions.
1.5 Demand for finance 1.5.1 Demand estimate Annual loan demand ranges from 13% to 24% of GDP across the region The annual demand for loan funding from SMEs is estimated to range from EUR 560 million in Mon-tenegro to EUR 4.5 billion in Serbia. As a share of GDP, demand is lowest in Kosovo (13.2%) and highest in Bosnia and Herzegovina (23.7%)7. Table 11. Rough estimate of SME loan demand ALB BOS KOS MAC MON SER Number of SMEs 111,059 186,341 45,985 70,453 22,313 280,845 Average loan size demanded 35,668 34,409 30,507 45,052 47,519 25,753 % needing a loan per year 36.0% 51.5% 52.2% 40.1% 52.8% 61.8% TOTAL demand (EUR millions) 1,426 3,302 731 1,273 560 4,470 Demand as % of GDP 14.3% 23.7% 13.2% 14.9% 16.2% 13.9% This calculation is only intended to give a general sense of the level of demand in the region. It is based on a number of assumptions and estimates that have a significant degree of uncertainty. The average loan size demanded is the average disbursed loan size issued by a number of banks that re-sponded to a survey request. The disbursed loan amount is used as a proxy for the amount demand-ed in the absence of other data. The share of enterprises that need a loan is taken from the World Bank Enterprise Surveys.8
1.5.2 Demand by type of instrument Demand for non-loan financial products is limited by lack of awareness and low financial literacy Loans account for the vast majority of demand for finance among SMEs in the region. Although this is true for any country, demand for non-loan products such as leases, letters of credit, and equity
7 As mentioned in an earlier footnote, the number of enterprises in Bosnia and Herzegovina may be overstated, leading to the unusually high ratio of demand to GDP. 8 The World Bank reports the share of enterprises that did not need a loan in the previous year. This report assumes that the rest did want a loan.

BFC. Assessment of financing needs of SMEs in Western Balkans countries. Synthesis Report
12
products is especially low in the Western Balkans. The preference for loan funding is mainly a func-tion of the familiarity of SMEs with loan products and the financial institutions that offer them. Most entrepreneurs are familiar with the content of a loan contract and the average interest rates and maturities which are being offered to similar businesses, so there is less risk that they will be taken advantage of. Furthermore, entrepreneurs generally know which lending institutions are the most reputable, at least based on word of mouth. By contrast, they usually have less information about leasing companies or private equity firms and less information about the contractual conditions on such products. The fact that loan products and lending institutions tend to be more strictly regulated and supervised than other types of products and institutions may also provide additional incentive for SMEs to prefer loans. In most of the countries, SMEs do not have a strong preference for certain currencies, either because the country has adopted the Euro (Kosovo and Macedonia) or because the central bank has successfully maintained exchange rate stability in recent years. Only Serbia has experienced exchange rate fluctuations (in 2012 and 2014), leading some clients to prefer local cur-rency. Within the category of trade finance, loans are by far the preferred instrument for SMEs despite the fact that many banks offer unfunded products such as guarantees and letters of credit. When un-funded trade finance products are demanded, it is most commonly guarantees that are requested rather than letters of credit. Demand for equity and quasi-equity from formal institutions is low in the region. Cultural factors may play a role, as businesspeople may be averse to cooperating with outsiders and sharing a part of their business with strangers. Lack of awareness of the availability of equity products and lack of fa-miliarity with the products themselves (such as a standard term sheet) also negatively affect de-mand. Although most countries in the region have at least some venture capital ecosystem in the form of incubators, business centers, academic programs, and others, they tend to be small in scale and not well known among the SME community. This ecosystem could be the best source for provid-ing information to SMEs about equity products and helping build demand. Based on anecdotal evidence, the level of demand for SME financing has been increasing at a very slow rate in the region over the past five for all types of products. This is in line with slow economic growth and low growth in the total number of SMEs. In the most recent periods, however, particu-larly in 2015, there has been a notable acceleration in the demand for credit. The EIB’s CESEE Survey of Bank Lending confirms this, with five consecutive semesters of positive results recorded as of the end of 2015.9
9 European Investment Bank. CESEE Bank Lending Survey – H2 2015.

BFC. Assessment of financing needs of SMEs in Western Balkans countries. Synthesis Report
13
2 Supply analysis Key findings: • Most financial institutions in the region work with SMEs, partly due to the limited number of
large corporations • The banking sector is very competitive; however, several countries have small leasing and micro-
finance sectors in terms of the number of intermediaries, and three countries have no institu-tions providing equity funding
• Loan portfolio growth has been slow in recent years, consistent with slow economic growth and slow growth in the number of SMEs
• Credit growth accelerated in 2015 in most countries and is expected to be strong in 2016 • High NPL rates have led to conservative lending practices, notably strict collateral requirements,
limited loan amounts relative to the requested loan size, and strict documentation requirements • The supply of credit to the agriculture sector is low, well below the contribution of agriculture to
GDP • The regulatory and supervisory framework for banks is generally good; non-bank financial insti-
tutions are more likely to face constraints that hinder their ability to serve SMEs
2.1 Type of intermediary Most financial intermediaries work with SMEs, but in some countries there are few microfinance institutions, leasing companies or equity funds Overall, there are a significant number of financial intermediaries providing funding to SMEs in the target region. Banks, in particular, are numerous, and nearly all of them lend to SMEs. However, in some locations, the number of microfinance institutions, leasing companies or equity funds is lim-ited. The table below shows the total number of relevant intermediaries in each country that can poten-tially provide financing to SMEs. In practice, nearly all of these institutions do provide financing to SMEs to some degree. As a result of the relatively limited number of large corporate clients in each country, a bank that only lends to large businesses and individuals would have a difficult time main-taining a stable portfolio size. All the microfinance institutions are lending to SMEs but generally only at the micro level – in several target countries, a loan size cap is in place for microfinance institu-tions. Leasing companies are also working with SMEs in significant volumes, with more than two thirds of the leasing portfolio estimated to be disbursed to SMEs in several countries.

BFC. Assessment of financing needs of SMEs in Western Balkans countries. Synthesis Report
14
Table 12. Number of financial intermediaries by type
Aside from these institutions, there are private equity or venture capital firms operating in all coun-tries except Montenegro, where no such investments have been identified. The number of banks in each location is moderate to high in relation to the size of the population. The number of microfinance institutions, however, varies greatly by country. Bosnia and Herze-govina and Kosovo are characterized by a highly competitive microfinance institution sector, while Serbia has just two microfinance institutions. Serbia has a large leasing sector, with 16 companies. Kosovo has just one leasing company, and the others countries have a moderate number. However, in some locations, such as Bosnia and Herzegovina and Montenegro, not all of the leasing companies are actively issuing new contracts, as they are focusing on the recovery of past-due accounts. Unlike the other types of financial intermediaries, the number of private equity and venture capital firms is generally not tracked by the central bank or other official sources. However, in all countries except Montenegro, at least one fund or investment firm is known to have made an equity invest-ment in a local SME.10 In Bosnia and Kosovo, the only known investments are quite recent (early 2016) and were made by EDIF. By contrast, in Serbia, Macedonia and Albania, multiple investments have been made by more than one fund or firm. Other intermediaries that provide funding directly to SMEs include special programs supported by the government or international institutions, but the overall volume of such funding is low.
2.2 Type of funding instruments 2.2.1 Loans Bank’s lending policies tend to be conservative, influenced by a legacy of high NPLs Loans are the primary financing instrument for SMEs and are widely available in a diverse spectrum of products, including overdrafts, credit lines, credit cards, working capital loans and investment loans, among others. The total supply of loans to all types of customers (not only SMEs) is shown in the following table. The highest levels of financial intermediation, measured as the ratio of loans to GDP, are seen in Bosnia and Herzegovina and Macedonia, while Albania and Kosovo have the lowest levels.
10 Some regional funds have a mandate to invest in a given location but have not done so in the past – such funds are not counted here
16
27
10
15
14
29
8
19
18
7
6
2
6
8
1
8
4
16
0 10 20 30 40 50
ALB
BOS
KOS
MAC
MON
SER
Banks MFIs Leasing companies

BFC. Assessment of financing needs of SMEs in Western Balkans countries. Synthesis Report
15
Table 13. Gross loan portfolios (EUR millions at year-end 2014) ALB BOS KOS MAC MON SER Total loans 4,435 9,034 2,107 4,215 2,076 15,790
Bank loans 4,247 8,774 2,019 4,122 2,030 15,772 Other loans 188 260 87 42 45 18
Loans to GDP (%) 44.4% 64.8% 38.2% 49.4% 60.0% 48.7% Source: Central banks of respective countries Although the volume of SME lending is not tracked by the central banks of the countries in the re-gion, the following table shows a rough estimate of the supply of SME loans based on a survey of several institutions in each country. The share of SME loans in financial institutions’ total loan portfo-lio, based on the survey data, is multiplied by the total volume of loans in the previous table to get the SME portfolio.11 Based on these estimates, Serbia has the highest share of SME loans to total loans, by far the largest SME portfolio in absolute volume, and the highest ratio of SME loans to GDP. Table 14. Estimate of SME loan portfolio ALB BOS KOS MAC MON SER Share of total loans 28.6% 23.6% 42.8% 34.2% 26.6% 43.6% SME loans 1,269 2,130 901 1,442 552 6,882 SME loans to GDP 12.7% 15.3% 16.3% 16.9% 16.0% 21.2% Source: BFC survey The growth rate of the loan portfolio has been slow in recent years in the region, consistent with slow economic growth and slow growth in the number of SMEs. Only Macedonia has experienced strong loan growth in both 2013 and 2014. Serbia’s loan growth was high in 2014, but this followed a sharp drop in the previous year. Table 15. Total loan portfolio growth rate
2014 2013 Average Albania 4.9% –1.8% 1.6% Bosnia and Herzegovina 2.9% 3.4% 3.2% Kosovo 4.8% 1.8% 3.3% Macedonia 10.0% 6.4% 8.2% Montenegro –1.9% 3.1% 0.6% Serbia 12.8% –7.4% 2.7% Average 5.6% 0.9% 3.3% Source: Central banks of respective countries Although the growth rate for SME loans is not known, most financial institutions report that SME loan portfolios are generally growing slowly, at about the same pace as the overall portfolio. Howev-er, supply conditions show signs of easing in 2015, and expectations for 2016 are optimistic. The EIB’s CESEE Survey of Bank Lending indicates that supply of SME finance is increasing in the second half of 2015, and bank managers expect further improvement in 2016. The data for overall business loan growth (SME and large corporations) shows significant year-over-year fluctuations, as seen in the chart below. Much of that volatility is attributable to large enterprises, since the SME loan growth is reportedly more stable.
11 Please see the individual country reports for more details on the methodology of calculation

BFC. Assessment of financing needs of SMEs in Western Balkans countries. Synthesis Report
16
Table 16. Business loan growth of banks by year
Notes: MAC, SER – 2015 data are up to Q3; KOS –data are from Q2 of the respective year Banks in the target region tend to take a conservative approach to lending to SMEs. This conserva-tive approach is reflected in a number of areas:
• Tough collateral requirements in terms of the value of collateral (significantly more than the loan amount), the type of collateral (usually real estate), and the size of the loan for which collateral is required (relatively small sizes)
• A cautious approach to setting loans amounts relative to financial capacity, often resulting in an approved loan amount which is less than that requested by the client
• Tough eligibility requirements such as the minimum period a business must be operating be-fore it can apply for a loan
In many cases, the written policies of the bank may be quite flexible, but, in practice, the credit committees or underwriters take decisions that are much more conservative than what is required by policy. The conservative approach of banks is largely a response to high NPLs, which ranged from a low of 8.3% in Kosovo to a high of 22.8% in Albania at the end of 2014. The high NPL ratios are mostly a legacy of the crisis period of 2008–2010 and are decreasing gradually over time. The histor-ical development of NPL ratios (see the table in Annex 2) is consistent across the region in showing an increase (i.e. worsening portfolio quality) from 2011 to 2013, then a decline in 2014. Although data is not available for year-end 2015 for all countries, the improvement in NPL ratios is reportedly continuing in 2015, which should spur increased lending in the future. The problem of high NPLs is compounded by modest recovery rates on defaulted loans, averaging from 30.3% in Serbia to 48.3% in Montenegro. These figures are in line with the average of 38.3% in Europe and Central Asia, but are well below the 72.3% average for high-income OECD countries.12 Aggressive loan restructuring to some extent conceals the severity of the problem with portfolio quality – for example, the ratio of restructured to total loans is 8.7% in Macedonia and a very high 19.4% in Montenegro at year end 2014 (see table below for details). Arrears from government organizations and state-owned enter-prises to SMEs reportedly contributes to the problem of high NPLs, although the economic turbulence of earlier years and over-extension of credit which preceded are by far the most important contribu-tors. According to respondents in the World Bank Enterprise Surveys, banks in four of six locations require the value of collateral to cover the loan amount by more than 200% and are well above the average for the Eastern Europe and Central Asia region. Only Serbia and Bosnia and Herzegovina have collat- 12 World Bank. 2016. Doing Business 2016: Measuring Regulatory Quality and Efficiency. Washington, DC: World Bank.
-20.0%
-15.0%
-10.0%
-5.0%
0.0%
5.0%
10.0%
15.0%
20.0%
20152014201320122011
ALB BOS KOS MAC MON SER

BFC. Assessment of financing needs of SMEs in Western Balkans countries. Synthesis Report
17
eral coverage ratios below 200%, and those ratios are not especially low at 150% and 190%, respec-tively. With the exception of Montenegro, reported rejection rates are low and well below the East-ern Europe and Central Asia average of 8.5%. Of course, many SMEs that believe they will not qualify for loans, such as those with little to offer as collateral, do not apply in the first place and are thus not reflected in the rejection rate. Table 17. Selected lending indicators ALB BOS KOS MAC MON SER EE/CA* NPL ratio 22.8% 14.0% 8.3%13 11.3% 19.0% 21.4% - Restructured loan ratio 5.4% 0.9% n/a 8.7% 19.4% n/a - Collateral/loan amount 255.2% 190.1% 299.3% 275.5% 243.4% 149.8% 206.7% Recent rejection rate 3.9% 3.8% 4.0% 1.0% 11.6% 2.4% 8.5% FX loans/total loans 62% 61.6% 0.3% 49.4% 1.6% 70.0% - Recovery rate 42.3% 36.3% 37.7% 44.6% 48.3% 30.3% 1438.3% Loans to wages15 3.8 1.6 1.5 1.6 2.1 1.2 -
Source: Central banks, World Bank Enterprise Surveys, World Bank Doing Business; * Eastern Europe/Central Asia average Interest rates on loans have been declining over the past two years, by as much as 1–2% on average throughout the region, as deposit growth has led to a lower cost of funding for banks. The average rate of deposit growth in the six target countries was 7.6% in 2014, with strong growth also ob-served in 2015. Typical interest rates for SME loans in Euro from banks range from roughly 4% to 10% throughout the region. A few banks offer SMEs a faster, simpler application process and charge higher rates (more than 10%) in return for these advantages. Foreign currency lending is close to zero in Kosovo and Montenegro, which have adopted the Euro. In the other countries, the share of lending denominated in or indexed to foreign currency (mostly the Euro) is high and ranges from about 50% in Macedonia to 70% in Serbia, with Bosnia and Albania both at 62%. A significant (but unknown) proportion of these foreign currency borrowers earn their revenues in Euro, so the indirect credit risk, while significant, is not quite as severe as it would ap-pear from these figures.
2.2.2 Non-loan products The leasing supply has contracted in recent years, and there are a limited number of suppliers of equity funding The supply of leases is small in comparison to loans – as the following table demonstrates, the out-standing portfolio of loans dwarfs that of leases by many times. In many countries in the region, leasing volumes decreased dramatically from 2009 onwards for the next several years, with the de-cline in leasing much sharper than the decline in loans. Since most leasing companies were subsidiar-ies of banks, and most banks considered leasing as a non-core product, the leasing companies were quick to lose support from their parent companies. Leasing companies tend to focus on vehicle fi-nancing and engage in a very limited amount of equipment financing. There is not much product va-riety, with most leases structured as finance leases and relatively few operating leases. Leasing com-panies generally have small branch networks, making it inconvenient for clients not located near the largest cities. Nevertheless, on average, a large share of the leasing portfolio is disbursed to SMEs, a much larger share than for the loan portfolio. Table 18. Leasing supply estimate ALB BOS KOS MAC MON SER Total leases (EUR millions) 51 185 22 51 116 465
13 The relatively low NPL ratio for Kosovo can be explained by the relatively smaller credit boom in Kosovo in the 2000s, resulting in lower levels of indebtedness. 14 For recovery rates, the figure is for all of Europe and Central Asia, not just Eastern Europe and Central Asia 15 The ratio of total gross loans to total wages of employed persons

BFC. Assessment of financing needs of SMEs in Western Balkans countries. Synthesis Report
18
ALB BOS KOS MAC MON SER Share of SMEs16 28.3% 85.0% 46.5% 35.0% 62.0% 70.0% Leases to SMEs (EUR mlns) 15 157 10 18 72 326 Total loans/total leases 88.7 48.8 95.8 82.6 17.9 34.0 SME loans/SME leases 87.5 13.6 90.1 80.1 7.7 21.1 Equity financing is generally in very limited supply, but the situation varies from country to country. In Montenegro, there are no known venture capital or private equity investments in SMEs by formal institutions, although it is possible there have been a few small investments from angel investors. In Bosnia and Kosovo, the total supply is estimated to be less than EUR 1 million in each country, con-sisting of just one or two transactions per country. In Serbia, Macedonia and Albania, the total sup-ply of such financing is higher than the other three countries but still at a very low level relative to GDP, as shown in the following table. Table 19. Private equity and venture capital supply estimate ALB BOS KOS MAC MON SER Equity supply (EUR millions) n/a17 <1 <1 9 0 66 Equity supply to GDP n/a 0.0% 0.0% 0.1% 0.0% 0.2% The stock markets are not a meaningful source of equity financing for SMEs. Equity turnover on the markets is low overall and is reportedly almost entirely generated by the trading of large corpora-tions. Only Bosnia and Herzegovina has total annual turnover exceeding 1% of GDP. Albania and Ko-sovo have no functioning stock markets. The following table shows the turnover in equity securities in 2014 on the exchanges in each country. Table 20. Stock market equity turnover in 2014 ALB BOS KOS MAC MON18 SER Equity turnover (EUR millions) 0 326 0 32 12 133 Equity turnover to GDP 0.0% 2.3% 0.0% 0.4% 0.4% 0.4%
2.3 Characteristics of funding recipients The trading, services and manufacturing sectors all constitute a significant share of loan funding The trading sector accounts for the largest share of lending to SMEs, exceeding 30% of total SME lending, except in Serbia where manufacturing is the largest. Bosnia and Herzegovina and Macedo-nia also have healthy levels of lending to the manufacturing sector at 25%. Lending to agriculture is quite limited in Bosnia and Herzegovina, Macedonia and Montenegro, with a share (less than 5% in each) that is well below the share of agriculture in GDP. Only Kosovo demonstrates a relatively high proportion of agricultural lending at 21%. Since the data are based on a survey of banks, the inclu-sion of microfinance institutions would boost the share of agriculture, but probably not by a large degree since the microfinance sector is quite small compared to the banking sector. Sector breakdown of SME loan portfolios of selected banks19 Sector ALB BOS KOS MAC MON SER AVG Trade 35% 40% 31% 35% 35% 26% 34% Services 17% 15% 27% 20% 21% 19% 20%
16 The share is a rough estimate based on interviews with a few leasing companies. 17 There is supply of equity in Albania, but it could not be reliably estimated, because some of the suppliers are not willing to make their portfolio volumes public 18 The Montenegro statistics only include non-block trades on the “free market”, where SMEs would be most likely to be listed. There is also an “official market”, but only large corporations are listed there. 19 In Kosovo, the survey includes data from one microfinance institution

BFC. Assessment of financing needs of SMEs in Western Balkans countries. Synthesis Report
19
Sector ALB BOS KOS MAC MON SER AVG Manufacturing 13% 25% 11% 25% 11% 33% 20% Agriculture 10% 4% 21% 3% 3% 13% 9% Other 25% 17% 10% 17% 30% 10% 18% Total 100% 100% 100% 100% 100% 100% 100% Source: BFC survey
2.4 Institutional and regulatory issues The regulatory environment is good and improving, but there are a number of important con-straints The regulatory environment for financial institutions is generally good in the region and has been improving as a whole in the last decade, partly spurred by increased adoption of EU practices. How-ever, there are some constraints (summarized in the table below) related to the supply of funding in each country. These constraints were identified primarily through interviews with financial sector experts in each country and, therefore, reflect subjective impressions about which constraints are most problematic. Table 21. Key regulatory and institutional constraints Country Constraints Albania • Given the small size of savings and loan associations, the cap on exposure to a sin-
gle borrower of 12% of capital makes it difficult for them to reach enterprises larg-er than the micro level
Bosnia and Herzegovina
• Separate supervisors and regulations for each entity (FBiH and RS) complicate the process of operating on a national scale
• Strict requirements for documentation of loans, which is especially burdensome for micro and small enterprises
• Maximum loan size caps for microfinance institutions (about EUR 5,100 or EUR 25,200, depending on the form of incorporation) prevent them from increas-ing their outreach
• Leasing has a pricing disadvantage in comparison to loans since VAT must be charged on leasing finance charges but is not charged on interest on loans
Kosovo • Difficulties in collateral enforcement through the legal system encourage lenders to institute strict collateral requirements (the recent introduction of private arbitra-tors should help to mitigate this problem)
• Accounts receivable cannot be legally registered as collateral, preventing the issu-ance of loans against accounts receivable
• Microfinance institutions face a maximum loan size cap of EUR 25,000, restricting their potential target market
Macedonia • Savings houses face strict requirements for the minimum capital adequacy ratio (20%) and the maximum value of deposits they can accept (double their capital)
• The law on leasing does not cover operational leasing, discouraging the develop-ment of this product
• Leasing faces a double property transfer tax, making it more expensive compared to loans
Montenegro • Maximum loan size caps for microfinance institutions of EUR 30,000 to repeat cli-ents and EUR 10,000 to new clients prevent them from increasing their outreach

BFC. Assessment of financing needs of SMEs in Western Balkans countries. Synthesis Report
20
Country Constraints Serbia • Policies to encourage local currency lending have resulting in high foreign currency
reserve requirements and dinar liquidity problems • Government interest rate subsidies spur demand, but the sporadic availability of
the subsidies creates sharp increases and decreases in demand, such as a decline in 2015 when many clients waited for the next tranche of subsidies
• There is no law on microfinance institutions, discouraging the creation of such insti-tutions – as a result, there are only two microfinance institutions in Serbia
2.5 Funding of intermediaries Funding needs are low now but should increase in 2016 Most financial institutions interviewed for this study report that lack of funding does not represent a constraint to financing of SMEs. Strong deposit growth in recent years combined with weak credit growth has reduced banks’ dependence on their parent banks (if applicable) or borrowing from in-ternational institutions. However, the interviews were primarily conducted with the largest banks in each country; smaller banks, particularly locally owned ones, and non-bank financial institutions tend to demonstrate a greater need for external funding, and a few of them have experienced fund-ing difficulties in recent years. If economic growth and credit growth accelerate in 2016, as many are predicting, institutions of all types will increasingly look for external funding. The most active IFIs lending to banks and microfinance institutions in the region are EIB (the largest by volume), EBRD, KfW, and EFSE. Table 22. Bank funding indicators Sector ALB BOS KOS MAC MON SER Net loans/Deposits 55.9% 109.8% 74.2% 88.3% 102.6% 101.6% Capital adequacy ratio 16.8% 16.3% 17.8% 15.7% 16.2% 20.0% The high capital adequacy ratios for all countries indicates that banks have substantial capacity to take on more debt. However, the ratio of loans to deposits in Bosnia, Montenegro and Serbia is high, which may act as restraint on borrowing for the purposes of loan portfolio expansion. The currency in which funding is obtained is generally not a major issue, since most of the countries are either using the Euro or have historically had very stable exchange rates managed by the central bank. Only in Serbia, where there have been exchange rate fluctuations in recent years, is there a more pronounced need for local currency funding, although it is not yet at a critical level. The typical maturities of four to five years at which local banks are borrowing from international institutions is appropriate for on-lending to SMEs. Funding of SMEs is facilitated by guarantee programs throughout the region with varying degrees of success. IFIs such as USAID and KfW offer portfolio guarantees, which are in demand and have good utilization rates on average. Government-established guarantee funds, by contrast, usually provide guarantees on behalf of individual SME borrowers and thus involve more paperwork and bureaucra-cy. The situation for each country is briefly summarized below:
• Albania: There are several guarantee schemes in Albania, including the Albanian Guarantee Fund (EUR 2.5 million, within the Italian-Albanian Program for SME Development since 2009), Rural Credit Guarantee Fund (EUR 4 million, supported by KfW), USAID's Loan Portfo-lio Guarantee Agreements with commercial banks, and the National Fund of Guarantee for Agriculture and Rural Development (a new governmental financing program in collaboration with the EBRD, launched in 2015 and not yet operational).

BFC. Assessment of financing needs of SMEs in Western Balkans countries. Synthesis Report
21
• Bosnia and Herzegovina: There are no national or entity-level guarantee funds that have been established or supported by the government, but there are a number of very small guarantee funds that have been established by municipal governments. There is a portfolio guarantee scheme launched by USAID and SIDA.
• Kosovo: A national credit guarantee fund, supported by USAID and KfW, will soon be estab-lished in Kosovo. The law to establish the fund was passed in December 2015. The fund will have between EUR 12 million and EUR 15 million in capital to start.
• Macedonia: The state-owned Macedonian Bank for Development Promotion operates a guarantee scheme with 11 partner banks. Two private guarantee facilities used to be pre-sent but closed due to low demand.
• Montenegro: There are no guarantee funds at the national level in Montenegro. A few mu-nicipalities have established guarantee funds, providing guarantees directly to SMEs, but they are very small in scale and do not have a meaningful impact on the market as a whole.
• Serbia: There is no fund at the national scale, but the government does support a guarantee scheme for agricultural loans in the Vojvodina region, which had around EUR 10 million of guaranteed loans outstanding in 2013.
In addition to these country-specific funds, the EDIF’s guarantee facility operates across the region.

BFC. Assessment of financing needs of SMEs in Western Balkans countries. Synthesis Report
22
3 Conclusion: Gaps in private sector financing Key findings: • The loan gap in the region is small to moderate and is generally the consequence of conservative
lending practices of financial institutions • Although overall leasing demand is low relative to loans, there is a significant financing gap, as
the supply of leasing has contracted in recent years • There is a gap for funding through equity products, since three of the target countries have no
formal institutions providing equity finance and the supply in the other countries is very small. The stock markets of the region generally do not act as a funding source for SMEs
• The gap for unfunded trade finance products such as guarantees and letters of credit is very small, since guarantees are readily available and there is little demand for letters of credit
• There tends to be a higher funding gap for micro and small enterprises than for medium enter-prises except in countries with a very active and competitive microfinance market, in which case microenterprises have good access to credit
• Agricultural enterprises face a large funding gap, as most financial institutions consider them risky and expensive to serve
• Startup enterprises have difficulty accessing funding since many lending institutions will not grant loans to them or will only do so in very small amounts
The supply of funding to SMEs in the Western Balkans region is reasonably good overall, but there are gaps that affect certain types of enterprises and certain product categories. In the discussion be-low these gaps are classified by product type and by type of SME.
3.1 Gaps by product type The loan gap is largest in absolute size, but the leasing and equity gap is high relative to demand
3.1.1 Loans SMEs in the Western Balkan have moderate to good access to loan financing, although certain types of SMEs have more difficulty than others in getting loans, as described in the next section. The whole region has experienced poor portfolio quality in recent years resulting from the crisis period of 2008–2010. This legacy of bad loans and the associated weak profitability have led banks to take a conservative approach to lending, reflected in tough eligibility requirements and strict approaches to taking collateral, setting loan amounts, and setting other product conditions such as maturity. SMEs with a low risk profile and plenty of assets to offer as collateral usually have no difficulty getting funding at reasonable terms. By contrast, SMEs will less than ideal characteristics may struggle to obtain financing. In some cases, SMEs may be approved for loans but not on terms that are accepta-ble to the SME – such situations are further evidence of a lending gap. Microfinance institutions tend to have less strict lending guidelines than banks, since loan sizes are much smaller, but are pricing their loans at much higher interest rates than banks.
3.1.2 Leases The leasing sectors are generally not as healthy as the banking sectors of the target region. In several of the countries, the size of the leasing sector has contracted significantly in recent years, and some leasing companies have stopped actively issuing leases to new clients as they deal with problem loans. Leasing companies tend to focus on vehicle financing, and their small branch networks limit their outreach. Despite these problems with the supply environment, the absolute size of the leasing funding gap is not very large, since demand for leases is very low relative to loan demand. This low demand is partly the result of a lack of awareness and familiarity with leasing products and the com-panies that issue them. Nevertheless, for those SMEs that would benefit from leasing (such as SMEs

BFC. Assessment of financing needs of SMEs in Western Balkans countries. Synthesis Report
23
with little collateral to offer for a loan), the supply side weakness is an important barrier in access to credit.
3.1.3 Equity Three of the target countries (Bosnia and Herzegovina, Kosovo and Montenegro) have no formal in-stitutions providing equity financing to SMEs, indicating that there is a gap for equity financing. As with leasing, the absolute size of the gap is not large, since demand is at a low level. The low level of demand is associated with a lack of awareness and familiarity with equity finance products and a lack of comfort with the idea of sharing the business ownership with strangers. Private equity and venture capital funds generally have very high standards for investees in terms of the quality of management, financial reporting and growth potential that many enterprises cannot meet. In prin-cipal, the region’s stock markets could act as an equity financing source (except in Albania and Koso-vo, which do not have functioning stock exchanges), but very low turnover ensures that few SMEs would ever consider this option. Despite the fact that the equity funding gap may be small relative to the loan gap, equity financing arguably plays an outsized role in terms of supporting innovation; therefore, the presence of even a small equity gap should be a major concern.
3.1.4 Trade finance products Trade finance guarantees are available to SMEs from most banks in the region, but only some banks offer letters of credit to SMEs. The funding gap for trade finance products is small overall since guar-antees are readily available and demand for letters of credit is at a very low level. Several of the ex-isting trade finance programs are reportedly experiencing reduced demand in recent years, as inter-national banks are increasingly willing to work with banks in the Western Balkans without additional risk protection or are simply obtaining parent bank guarantees. 3.1.5 Loan Guarantees Loan guarantees that partly compensate lenders for client defaults have a major influence on the size of the loan gap. At first glance, there is very little explicit demand for loan guarantees in the re-gion. SMEs want the loans, not the guarantee per se, and they are often unaware of loan guarantee programs that operate in their country. However, there is high implicit demand for guarantees, since guarantees would make it possible for some of the SMEs that are being rejected for loans to be ap-proved. Similarly, for SMEs that are approved for loans but on conditions that are unacceptable or inconvenient (such as high collateral or documentation requirements), the presence of guarantees could encourage the lenders to offer more attractive terms to these clients. In the case of portfolio guarantees, the immediate source of demand is the financial institutions rather than the SMEs. Fi-nancial institutions in the region, particularly banks, demonstrate a high level of demand for portfo-lio guarantees. In section 3.2 below, the types of SMEs that could benefit most from guarantees are identified.
3.1.6 Gap size by product type The following figure represents the size of the gaps graphically by mapping the gap size in absolute terms (i.e. the Euro value) against the size of the gap relative to the level of demand (i.e. among the SMEs that demand the product, the proportion can actually obtain it). A demand survey was not conducted as part of this research, so the gaps cannot be measured quantitatively, because the level of demand is unknown. Therefore, the gaps are shown in relative terms to each other, and their se-verity is judged based on a combination of partial statistical data and the qualitative expertise of lo-cal financial sector experts.

BFC. Assessment of financing needs of SMEs in Western Balkans countries. Synthesis Report
24
Figure 1. Gap size by product type
In absolute terms, the gap for loan products is by far the largest, whereas the gap for the other products is considerably smaller. However, relative to the level of demand, the equity gap is most severe, followed by the leasing gap, loan gap and finally the trade finance gap. Practically speaking, there are many more SMEs that want loans than want equity financing. However, among those SMEs that do want equity financing, only a small proportion can access it. By contrast, many SMEs want loan funding, and the majority of them can access it. Since the demand for loans dwarfs the demand for other products by a large factor, the absolute loan gap remains much larger, despite the fact that a reasonably high proportion of SMEs can get a loan. The gap for loan guarantees is shown as part of the gap for loans. This reflects that the SMEs want the loans, not the guarantee itself, so the gap for loan guarantees is a portion of the overall loan gap. To the extent that loan guarantees are available, they have the potential to reduce the size of the loan gap. Although not shown in this figure, a similar argument could be applied to trade finance guarantees from an international institution to local financial institution, which have the potential to reduce the trade finance gap. Aside from the gap between demand and supply of finance, there is also a gap in customer satisfac-tion across the region. Although an SME may receive a loan in the desired amount, it may have had to pledge more collateral than it would like, or spend more time preparing documents, or pay a higher interest rate than it considers appropriate, or simply may have received poor customer ser-vice. Although such gaps are impossible to quantify, they represent an important part of the finan-cial services landscape.
3.2 Gaps by type SME Micro-sized SMEs, agricultural producers, informal enterprises and startups tend to face the great-est gaps in access to funding
3.2.1 Enterprise size Although there are variations across the region, on average, medium-sized enterprises tend to have better access to finance than small and micro enterprises. Since the large corporate sector consists of a relatively small number of enterprises, medium enterprises are treated like large, corporate cli-ents, attracting the attention of all the banks and giving medium enterprises the opportunity to ne-gotiate advantageous loan conditions. As the size of the enterprise decreases, enterprises usually

BFC. Assessment of financing needs of SMEs in Western Balkans countries. Synthesis Report
25
have weaker accounting systems, making them more difficult for banks to analyze; the profit per loan in absolute terms also decreases with the size of the enterprise, making smaller clients less at-tractive to banks. In some countries, such as Bosnia, the microfinance sector is well-developed, and micro enterprises small enough to be served by microfinance institutions may actually have better access to finance than small enterprises that need more than microfinance institutions can disburse. Even in such cases, however, the interest rates on loans from microfinance institutions are much higher than for micro loans from banks, and so loans from microfinance institutions may not appeal to some micro enterprises.
3.2.2 Sector Enterprises engaged in agricultural production tend to have greater difficulty accessing financing than enterprises in other sectors. The agriculture gap is generally smaller for microenterprises than it is for small enterprises, since many microfinance institutions consider farmers to be one of their key target segments. With a few exceptions, however, banks are mostly consistent across the region in asserting that the agriculture sector is riskier and less profitable than other sectors, and they some-times acknowledge that their staff lack the knowledge and experience to properly evaluate agricul-tural enterprises. The weaknesses in the leasing sector (mentioned above) are particularly relevant to agriculture, because many farmers need agricultural equipment but lack the collateral for a large enough loan to purchase the equipment. Aside from agriculture, no other sectors or activities face a significant gap in access to credit.
3.2.3 Stage of operations Startup enterprises face a significant gap in access to funding in the region. The limited availability of equity funding options in some countries (Kosovo, Bosnia and Herzegovina, and Macedonia) takes away one important funding channel. The majority of banks and microfinance institutions do not grant loans to startup companies, making it difficult to access loan funding. Although some banks and microfinance institutions do permit lending to startups, it is often only in very small amounts and at unattractive conditions such as above-average interest rates and short maturities. Some countries have government-sponsored or donor-established programs that offer loans or grants to startups, but the volume of such financing is small. The issue of startup financing is of particular im-portance due to the high unemployment rate (averaging 25%) in the region, as lack of financing is reportedly one several key factors that reduce incentives for the unemployed to attempt to start a business. In particular, the extremely high unemployment rate among young people (averaging 47%) could be alleviated through better access to startup finance for the purpose of business creation. 3.2.4 Degree of formality Informality is present both in the form of unregistered enterprises and enterprises that are regis-tered but do not report all of their income to the tax authorities. Unregistered micro enterprises may be able to access financing from microfinance institutions, but unregistered enterprises above the micro size generally cannot get bank loans. Banks typically will not consider undeclared income in their financial analysis, meaning that the many enterprises that understate their revenues and profits have reduced access to finance. Of course, these enterprises have made the deliberate deci-sion to gain the benefits of tax avoidance at the cost of reduced access to finance, so their struggles to obtain a loan are not necessarily unfair.
3.2.5 Geography Enterprises in remote areas face gaps, though the gaps are relatively small in absolute and relative terms The countries studied are generally small and have a high population density, but some countries have areas that are relatively remote or economically under-developed, with below-average in-

BFC. Assessment of financing needs of SMEs in Western Balkans countries. Synthesis Report
26
comes and above-average unemployment rates. There is anecdotal evidence that banks have a ten-dency to give less attention to these areas, resulting in a financing gap for the enterprises located there. In addition, the tendency of venture capital funds and leasing companies to be located only in the largest cities means that enterprises in these more remote areas have more difficulty accessing non-loan products. However, the gap is believed to be small overall since the high level of competi-tion in the banking and microfinance sectors and the limited number of large enterprises encourages institutions to expand their outreach to all parts of the country. Furthermore, the supply of finance from banks and microfinance institutions is often supplemented by government and donor-funded programs targeting these vulnerable areas.
3.2.6 Gap size by type of SME The following figure represents the size of the gaps graphically by mapping the gap size in absolute terms against the size of the gap relative to the level of demand. The approach is the same as that for the figure on gap size by product above.
Figure 2. Gap size by type of SME
Informal enterprises comprise the largest gap in absolute terms, mainly because there are so many enterprises under-reporting their income for tax purposes. However, their access to credit in relative terms is moderate, as most of these enterprises can get funding, but usually not in the desired amount. The gap for agricultural and micro enterprises are moderate in absolute terms, but in rela-tive terms it is generally more difficult for agricultural enterprises to get funding than for microen-terprises. The gap for startups and enterprises in remote regions is smaller than for the other groups, to a large extent simply because there are fewer enterprises fitting these categories. The gap for startups is very large in relative terms, since it is very difficult for startups to get bank loans and equity financing. By contrast, enterprises in remote areas can usually get a loan, provided they are willing to travel to a location with branches of financial institutions present in order to apply for a loan.

BFC. Assessment of financing needs of SMEs in Western Balkans countries. Synthesis Report
27
4 Recommendations and strategy options The funding needs and, even more so, the technical assistance needs of the Western Balkans are immense, and there are a variety of strategies which IFIs could pursue to further fill in the financing gaps. This section of the report outlines some of these strategic options for funding and technical assistance. The options are organized according to the main gaps identified in the previous section. The following table summarizes the main funding options and rates them on five criteria: ticket size (potential average transaction sizes), risk20, additionality (to what extent the given intervention would duplicate existing IFI programs), and demand (to what extent financial intermediaries need funding). The rating system consists of just three options: high/large (up arrow), moderate/medium (sideways arrows), or low/small (down arrow). Further details are provided in the sections that fol-low. Table 23. Options for funding support to mitigate gaps in access to finance
Ticket size Risk Additionality Demand
Senior loans to top-tier banks ↑ ↓ ↔ ↔ Senior loans to second-tier banks ↔ ↔ ↔ ↑ Loans to microfinance institutions ↓ ↔ ↓ ↔ Subordinated loans to top-tier banks ↔ ↔ ↔ ↔ Loans to leasing companies ↓ ↑ ↑ ↑ Guarantee funds ↔ ↔ ↔ ↑ Investment in venture capital and accelerator funds ↓ ↑ ↑ ↑
Sector-specific credit lines
Agriculture sector ↔ ↔ ↔ ↔ Underserved regions ↔ ↔ ↔ ↔ Micro and small clients ↔ ↔ ↔ ↑ Startup enterprises ↓ ↑ ↑ ↓ Informal enterprises ↓ ↔ ↑ ↓ The next two tables present a summary of options for technical assistance. Table 24. TA options related to product gaps Gap Beneficiary TA option Demand Impact Loans Banks Customized – various topics, based on banks’ needs ↓/↔ ↔
MFIs Partly customized, with emphasis on risk management, opera-tional efficiency, staff training, and upscaling ↑ ↑
Leases Leasing cos. Partly customized, with emphasis on equipment leasing ↑ ↔
20 A down arrow indicates low risk, which is good, hence the color of the down arrow is green. An up arrow indicates high risk, and so is colored red.

BFC. Assessment of financing needs of SMEs in Western Balkans countries. Synthesis Report
28
Gap Beneficiary TA option Demand Impact Regulator Remove regulatory barriers, such as tax disadvantages (BOS,
SER) and missing regulation (e.g. operational leasing in MAC) ↓ ↔
SMEs Educational and financial literacy programs, awareness-building programs ↓ ↔
Equity Eco-system University programs to promote entrepreneurship; train-ing/management handholding support for incubators; build/strengthen angel networks
↑ ↑
Trade finance
Banks Partly customized, with emphasis on product design and staff training ↔ ↔
SMEs Educational and financial literacy programs, awareness-building programs ↓ ↔
Table 25. TA options related to sector-specific gaps Gap Beneficiary TA option Demand Impact Very small enterprises
FIs Banks: simplification of procedures, increased flexibility MFIs: upscaling to serve larger micro and small enterprises ↔ ↔
Regulator Support raising of maximum loan cap for MFIs ↓ ↑ Agriculture FIs Technical tools and methods for risk and financial analysis
(e.g. crop maps); facilitate cooperation between banks and MFIs
↑ ↔
Farms Encourage and facilitate registration of informal farms; train-ing in accounting and financial management ↔ ↑
Startups SMEs Financial literacy and awareness-building programs; training for new entrepreneurs in business planning, accounting, marketing, etc.
↑ ↑
Remote regions
SMEs Feasibilities studies for certain activities; Business support services and training about such activities ↔ ↔
Aside from the specific topics and target beneficiaries of TA, the programs themselves must be properly designed and implemented in order to generate positive impact. TA programs must be sus-tainable in the sense that the knowledge and tools that are presented to beneficiaries continue to be applied and maintained after the program itself is complete. Key principles which should be ob-served when designing TA programs for financial institutions are:
• Coordination among different IFIs is important in order to take advantage of IFI-specific competencies and experience, as well as to maximize efficiency by avoiding duplication of efforts. EDIF is a good example of how such coordination is enhancing outreach and impact.
• Long term TA projects for FIs which have not participated in IFI-funded projects previously face a higher risk of failure. IFIs may wish to test the receptiveness of new FIs to consulting by starting with smaller, short-term projects. However, for FIs which demonstrate an ability to cooperate with consultants, long-term projects are usually more beneficial.
• Cost-sharing provides an important incentive for funding recipients to implement recom-mendations of consultants. IFIs should require that TA recipients contribute some portion of the total cost of the services to be provided, although they should take a flexible approach to setting the percentages.
• Set low quantitative targets for the first year of TA for a given institution. It is better to focus on quality than quantity in the early stages of TA cooperation.
• Ensure economies of scale for consulting firms by building pipelines of the same types of projects. This creates enough critical volume for the selected firms to invest in their own staff and service quality.

BFC. Assessment of financing needs of SMEs in Western Balkans countries. Synthesis Report
29
4.1 Loan gap The loan gap should be addressed through a combination of portfolio guarantees, credit lines, and TA Portfolio guarantees to banks: For those banks with sufficient liquidity to fund portfolio growth, guarantee funds are an effective means to boost lending, especially to marginal clients – more detail on such marginal clients is given starting from section 4.5 below. Although guarantee funds are al-ready present in the region, there is substantial need for additional investment in existing funds or creation of new funds. Many of the existing funds are small in size, operate in limited geographic areas, or are operationally inefficient and bureaucratic, reducing the incentives for financial institu-tions and SMEs to utilize them. Senior loans to top-tier banks: Senior loans for general SME lending will always be in demand, and this type of funding should continue to serve as a core part of IFIs’ assistance to the region. Strong deposit growth in the region in recent years means that the level of demand for such borrowings is below its typical level at the time of writing, but this product should continue to be successful over the longer term. The need for technical assistance to accompany generic funding to top-tier banks is minimal. Banks have reasonably good capacity to serve typical SME clients. Although each bank has its own weak-nesses and would benefit in some way from technical assistance, BFC believes that technical assis-tance would be better targeted to more specific areas, as described throughout the remainder of this section. Senior loans to second-tier banks: Smaller banks in the region, many of which are locally owned, tend to have a greater need for and interest in borrowing from IFIs, since it is more difficult for them to access funding. Ticket sizes would be smaller than to the top tier banks, and the level of risk is somewhat higher on average (due to the absence of strong shareholders in the form of international banking groups). The benefit of such a strategy is that it can lead to a greater diversity of SME lend-ing approaches and services. Many of the smaller banks do not have the benefit of a well-known brand name and show a greater willingness to offer atypical services to client segments that may be less interesting to the top-tier banks (e.g. farmers, micro enterprises, informal businesses, and startups). Investments in such banks, therefore, can have an above-average impact on the sub-borrowers despite the smaller ticket sizes relative to the largest banks. To mitigate the issue of small ticket sizes, IFIs could consider the establishment of apex structures through the local central bank or other government institutions. Compared to the top-tier banks, there is a much greater interest in and need for technical assistance among the second-tier banks. The type of assistance should be customized based on the needs of each bank that receives funding. However, as described in more detail below, there are certain top-ics that would benefit certain segments of SMEs that face above-average constraints in access to finance. These topics include: simplification and standardization of procedures to reduce costs and the use of technical tools and IT solutions to better measure risk and assess repayment capacity. Microfinance funding: One option would be to consider lending to microfinance institutions. The largest microfinance institutions in each country had the following amount of total assets at the end of 2014: Albania – EUR 58 million, Bosnia and Herzegovina – EUR 97 million, Kosovo – EUR 20 mil-lion, Macedonia – EUR 29 million, Montenegro – EUR 31 million, and Serbia – EUR 16 million. These figures are presented to give a general sense of the scale of the institutions and, thus, their potential borrowing capacity. In Kosovo, Macedonia, Montenegro and Serbia, even the largest institutions may be too small to absorb a loan in an amount that would be meaningful for some of the largest IFIs. In Albania and Bosnia and Herzegovina, there is a better potential for cooperation. Considering

BFC. Assessment of financing needs of SMEs in Western Balkans countries. Synthesis Report
30
that microfinance institutions tend to serve enterprises that are traditionally considered less banka-ble, such as farmers, startup businesses, informal businesses, and businesses with minimal collateral, the impact of such interventions has the potential to be high. On the other hand, there are many development finance institutions providing credit to microfinance institutions in the region already, so additionality would not be high. The need for technical assistance among microfinance institu-tions is high overall and could potentially cover a variety of different topics. For example, improving operational efficiency through the application of technology and standardized processes is a broad topic that appears to be relevant across the region. TA could be customized individually for each in-stitution depending on its specific needs, an approach that is already applied by a number of IFIs. Subordinated debt: IFIs could consider offering subordinated debt to banks in the region in addition to senior loans. Many banks in the region already have subordinated debt on their balance sheets, often from their parent banks, and they have shown a healthy appetite for this product. Capital ade-quacy ratios throughout the region are high on average, however, limiting the overall usefulness of subordinated debt. The average total capital adequacy ratios in 2014 ranged from a low of 15.7% in Montenegro to a high of 20.0% in Serbia. For those institutions that do face some capital pressures limiting their loan growth, however, this could be an interesting option. This product should have good long-term potential, as capital adequacy ratios gradually decline following their buildup after the financial crisis. Targeted sector-specific or segment-specific credit lines is another option which is practiced exten-sively by other IFIs. Although ticket sizes tend to be small to moderate, the impact can be higher by directing credit to the clients who need it most. Some ideas for such targeted lending are presented below (starting from section 4.5) as a means to address segment-specific gaps.
4.2 Leasing gap Many leasing companies have experienced reduced support from their parent companies in recent years, and the supply of leasing finance has declined sharply in some countries. IFIs have shown min-imal interest in filling the gap so far, with only a few loans provided to leasing companies in recent years. Any support to the leasing companies would therefore have a high degree of additionality. On the other hand, there are good reasons why IFIs have been hesitant to provide support. Profitability for the sector has been low overall and NPLs are high; supervision and regulation of the sector is not as strong as it is for the banking sector, and there are anecdotal reports that the managerial and technical capacities of the employees of leasing companies are not as strong as in the banking sec-tor. Ticket sizes would also be relatively small, further reducing the attractiveness of this option to large IFIs. The largest leasing companies in Bosnia and Herzegovina and Serbia, for example, have total assets of EUR 72 million and EUR 64 million respectively, permitting them to absorb loans of a moderate size at best. The need for technical assistance is critical and encompasses many aspects of the environment for leasing. Most countries have weaknesses in the regulatory and supervisory environment for leasing, so TA could be directed to this area. For example, leasing companies in Bosnia and Herzegovina and Macedonia face disadvantages in tax administration that make it difficult to compete with traditional lenders. The leasing companies themselves require direct technical assistance in a variety of areas. One type of TA that would be appropriate for most leasing companies is related to the development of equipment leasing, since vehicle leasing is by far the dominant type of product available. Finally, low financial literacy among potential SME customers limits demand for leasing products. TA could be directed towards educational and financial literacy programs to increase the awareness and knowledge about these products.

BFC. Assessment of financing needs of SMEs in Western Balkans countries. Synthesis Report
31
4.3 Equity gap More (or bigger) funds and TA to develop the ecosystem would be beneficial The equity gap can be addressed through investment in existing funds or the creation of new funds. The choice of creating a new fund versus existing in existing funds partly depends on the target country or countries. In Serbia, Macedonia and Albania, where there is a higher degree of current fund activity, investment in existing funds is a more viable option. In Kosovo, Montenegro and Bos-nia, where fund activity is comparatively limited, the establishment of new funds would be more beneficial. Target funds could include both traditional venture capital funds and accelerator funds, the latter tending to provide more rigorous, structured training to portfolio companies over a con-crete time period. Launchhub (http://launchhub.com) is an example of one such accelerator fund operating in the SEE region With regard to technical assistance, there are a number of options which should be considered. There is a great need for development of the venture capital ecosystem in the region, which would require grant funding. A number of different types of institutions could be the target of such assis-tance, including:
• Universities: programs to promote entrepreneurship among students, provide them with the tools and knowledge to start a business, and provide basic skills in management and ac-counting that would be needed by entrepreneurs. Particular ideas that have proven success-ful in other regions are:
o The setup of accelerators inside the university itself, which would ensure the in-volvement of potential young entrepreneurs.
o Business plan competitions for students, ideally coordinated with angel investors or VC funds to offer seed financing
o The establishment or strengthening of university courses on entrepreneurship • Incubators, accelerators, business centers, and similar organizations: although many of
these organizations offer some structured training and mentoring to the enterprises they support, the frequency, scope and quality of such trainings could be improved through tech-nical assistance. This would typically take the form of external consultants carrying out train-ing and mentoring of incubatees while working with the staff of the incubators themselves to ensure that the training/mentoring techniques can be replicated by staff (similar to a training of trainers approach).
• Angel investors: programs to establish or strengthen angel investor networks and connect them to enterprises in need of funding would be beneficial
Such TA interventions would contribute to the business creation and development, benefiting all the funds in the region.
4.4 Trade finance gap The trade finance gap is small and should not be an immediate priority The severity of the trade finance gap is judged to be low, and several IFIs already have trade finance programs operating in the region, so there is not much need for additional contribution. Several of the existing trade finance programs are reportedly experiencing a reduced demand in recent years. Support in the region, therefore, would be better directed to other areas.
4.5 Micro and very small enterprise gap Micro enterprises are more constrained than medium enterprises The finance gap tends to increase in severity as the size of the enterprises declines. Targeted credit lines to banks with a maximum loan amount to sub-borrowers (of perhaps EUR 50,000 to

BFC. Assessment of financing needs of SMEs in Western Balkans countries. Synthesis Report
32
EUR 75,000) are one potential funding tool to address this gap. Since banks have a propensity to ap-ply similar policies and procedures for collateral, documentation, and depth of financial analysis to all SMEs, regardless of size, the loan agreement between IFIs and the banks should encourage the banks to adopt simpler, more flexible policies and procedures, perhaps even establishing concrete conditions for what types of collateral, documentation and other conditions are acceptable for sub-loans. Along the same lines, technical assistance for the financial institutions would be particularly important in order to teach them methods and tools for simplifying their financial analysis and mak-ing their terms and conditions more flexible without exposing them to excessive risk. Finally, en-couraging the local regulators to increase the maximum loan size cap for microfinance institutions would give them the opportunity to upscale and better reach the missing middle of small businesses that are too big for microfinance institutions to serve but too small to be of interest to the big banks.
4.6 Agriculture gap The agriculture gap is a major concern, requiring both funding and TA solutions The agriculture gap is one of the most severe gaps in the region – it affects each country to a signifi-cant degree, and its impact is felt by a large share of the population. Although there are many pro-jects of governments and various international institutions targeting this gap, there remains a tre-mendous opportunity for additional investment in the form of funding and technical assistance. On the funding side, the most obvious option to consider would be guarantee funds, which would boost lending by allaying lenders’ concerns about the high perceived risk of working with the agriculture sector. Another option is agriculture-specific credit lines to local financial institutions. Although such lines are already being provided by other IFIs, more funding in this area would nevertheless be bene-ficial. Naturally, loan sizes to individual institutions for agricultural on-lending would be relatively small compared to general SME credit lines. In the case of agriculture, technical assistance is arguably much more important than funding. Most banks attribute their concerns about the agriculture sector to the characteristics of the agricultural enterprises, but, at the same time, banks acknowledge their own lack of capacity to properly evalu-ate and serve those enterprises. Banks are in need of technical tools to make it easier for staff to calculate the repayment ability of agricultural enterprises and analyze the degree of risk. For exam-ple, crop maps21 are an increasingly popular tool for simplifying and standardizing the calculation of the production cost of crops. Since microfinance institutions tend to be much stronger in agricultural lending than banks, programs which facilitate the cooperation between the two could lead to the improved capacity of banks. In particular, microfinance institution staff are knowledgeable about the growing cycle and production costs of particular crops and livestock, which would be beneficial knowledge to banks even if they work with larger clients on average. TA for the agricultural enterprises themselves is also much needed. Programs designed to encourage and facilitate registration of informal farms has the potential to increase the overall supply of agri-cultural credit since most banks will not consider lending to unregistered enterprises. Training in ac-counting and financial management would also make farms more bankable by giving lenders more confidence in the accuracy of financial data used to analyze the business. There are already IFI pro-grams engaging in such work, but there is still considerable room for more funding to such programs or the creation of new programs.
21 This refers not to geographical maps but to a structured tool for analysis, usually designed in Excel or integrated into the core IT system

BFC. Assessment of financing needs of SMEs in Western Balkans countries. Synthesis Report
33
4.7 Startup gap Guarantee funds, venture capital and accelerator funds combined with TA for entrepreneurs are needed Guarantee funds are a promising tool for reducing the startup gap. The primary reason that banks avoid lending to startups is the high perceived level of risk, so guarantees provide the risk mitigation mechanism that can spur greater bank lending. IFIs could also consider offering sector-specific credit lines for on-lending to startup enterprises, although there is likely to be low demand among banks for such products in the absence of accompanying risk mitigation instruments. Aside from boosting lending with guarantee funds, the startup gap can be addressed with equity products, such as ven-ture capital funds and accelerator funds. These options are discussed in more detail in section 4.3 above. In terms of technical assistance, there are a number of possibilities for approaching this problem. On the demand side, financial literacy and promotional programs designed to make entrepreneurs aware of the opportunities to access finance that are available and how to better position them-selves to obtain such financing would help stimulate demand. While financial literacy programs have been implemented already – for example, as a component of the IFC’s Project Microfinance in Bos-nia – their impact on the startup gap could be enhanced by customizing the training to address the issues and concerns of new entrepreneurs and young entrepreneurs. Such entrepreneurs often also require training in basic skills such as business planning, accounting, financing management, market-ing, and sector-specific knowledge. Although such programs exist throughout the region, they are often small in scale, have a limited duration, or address a limited spectrum of topics, so further in-vestment is needed. Where feasible, IFIs can coordinate their efforts in training with existing institu-tions that carry out similar functions, such as incubators, accelerators and business hubs. However, in countries with weaker ecosystems, the creation of new, stand-alone programs may be the best option.
4.8 Regional gap Region-specific credit lines and TA for specific high-potential activities are possible interventions Several countries in the region have under-developed areas within their country that face greater difficulty in access to finance. Providing support to these areas, whether through funding or tech-nical assistance, would require a strong knowledge of local conditions that is only likely to be attain-able with locally-based staff. Therefore, the targeting of the regional funding gaps would be best ad-dressed by those IFIs that have local offices. IFIs without local offices, however, could consider coop-eration with another development institution that has such local expertise if a suitable project aris-es. The main funding options are credit lines intended for SME loans disbursed in the disadvantaged areas or guarantee funds offering risk mitigation to FIs that start working in those areas. Technical assistance for enterprises in such areas could be directed towards feasibility studies (i.e. research studies) and promotional and training programs about specific business activities that have good potential there. For example, feasibility studies may reveal that certain types of crops have high po-tential in a rural area but are currently not being grown on a large scale; the study would be fol-lowed by training to farmers to explain the opportunity and provide technical advice on how to grow those crops.
4.9 Informal enterprise gap The sensitive nature of this topic limits funding and TA options Although the funding gap for informal enterprises is significant, IFIs should be cautious about sup-porting enterprises whose lack of access to finance is, in most cases, the consequence of their efforts to avoid taxation. Any assistance to the segment should be directed towards increasing the degree

BFC. Assessment of financing needs of SMEs in Western Balkans countries. Synthesis Report
34
of formality of the enterprises, which would, in turn, increase their access to finance. One possibility would be to offer a credit line for on-lending to unregistered enterprises under the condition that the enterprises would register shortly after receiving their loan, perhaps with the interest rate being reduced or the loan commission fee being partly refunded upon confirmation of registration. The partner lending institution should provide basic technical assistance to the applicants in the form of instructions to help them register. The feasibility of such an arrangement should be discussed in ad-vance with the supervisory body in each country.
4.10 TA project sizes The matrices below present a tool for estimating the potential project budget size of various pro-posed TA interventions. This tool is provided only as a general guideline based on a rough concept of the form of the TA. The actual budgets should be set based on a more thorough plan of the details of the TA. Different types of TA are rated along two dimensions – intensity and complexity. Intensity refers to the depth and duration of the TA. A project would be considered to have high intensity if it lasts a long time (2 or more years) and involves at least several experts providing long term and short term input. A project would have low intensity if it is short (up to six months) and involved just one or two experts providing infrequent support. Complexity refers to the degree to which the pro-ject is difficult to organize because it involves a large number of beneficiaries or stakeholders, a di-verse range of areas of input, or is otherwise very difficult to coordinate. In general, programs which involve training of SMEs are not very intense (since entrepreneurs don’t have much time to devote) but are complex (because many entrepreneurs are participating, as well as various other stakehold-ers). TA for lending institutions should be sufficiently intense to be effective – TA consultants should spend a lot of time with the institution to support the execution of recommended changes – but is usually not complex, since the TA is provided by a few experts to a limited number of institutions. In the figure below, a scale of 1 to 4 is used, where 4 represents a high degree of intensity or complexi-ty, and a 1 indicated a low degree. Figure 3. TA project size matrix
Intensity
4
3
2
1
1 2 3 4
Complexity
A
B
C
D E K N
F G H
I
J
L
M
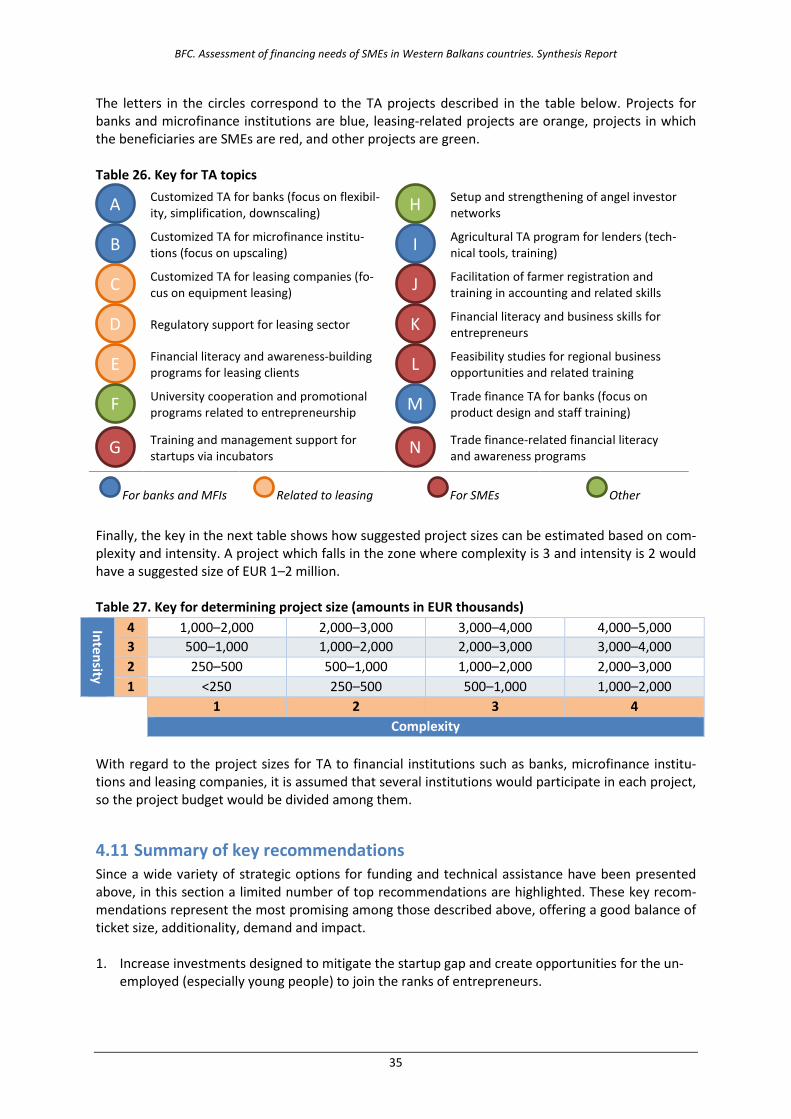
BFC. Assessment of financing needs of SMEs in Western Balkans countries. Synthesis Report
35
The letters in the circles correspond to the TA projects described in the table below. Projects for banks and microfinance institutions are blue, leasing-related projects are orange, projects in which the beneficiaries are SMEs are red, and other projects are green. Table 26. Key for TA topics
Customized TA for banks (focus on flexibil-ity, simplification, downscaling)
Setup and strengthening of angel investor networks
Customized TA for microfinance institu-tions (focus on upscaling)
Agricultural TA program for lenders (tech-nical tools, training)
Customized TA for leasing companies (fo-cus on equipment leasing)
Facilitation of farmer registration and training in accounting and related skills
Regulatory support for leasing sector
Financial literacy and business skills for entrepreneurs
Financial literacy and awareness-building programs for leasing clients
Feasibility studies for regional business opportunities and related training
University cooperation and promotional programs related to entrepreneurship
Trade finance TA for banks (focus on product design and staff training)
Training and management support for startups via incubators
Trade finance-related financial literacy and awareness programs
For banks and MFIs Related to leasing For SMEs Other
Finally, the key in the next table shows how suggested project sizes can be estimated based on com-plexity and intensity. A project which falls in the zone where complexity is 3 and intensity is 2 would have a suggested size of EUR 1–2 million. Table 27. Key for determining project size (amounts in EUR thousands)
Intensity
4 1,000–2,000 2,000–3,000 3,000–4,000 4,000–5,000 3 500–1,000 1,000–2,000 2,000–3,000 3,000–4,000 2 250–500 500–1,000 1,000–2,000 2,000–3,000 1 <250 250–500 500–1,000 1,000–2,000
1 2 3 4 Complexity
With regard to the project sizes for TA to financial institutions such as banks, microfinance institu-tions and leasing companies, it is assumed that several institutions would participate in each project, so the project budget would be divided among them.
4.11 Summary of key recommendations Since a wide variety of strategic options for funding and technical assistance have been presented above, in this section a limited number of top recommendations are highlighted. These key recom-mendations represent the most promising among those described above, offering a good balance of ticket size, additionality, demand and impact. 1. Increase investments designed to mitigate the startup gap and create opportunities for the un-
employed (especially young people) to join the ranks of entrepreneurs.
A H
B I
C J
D K
E L
F M
G N

BFC. Assessment of financing needs of SMEs in Western Balkans countries. Synthesis Report
36
a. The best approach to achieve this is through increased investment in guarantee funds to mitigate the risks for banks of working with these customers.
b. Increasing the availability of venture capital funding would also be beneficial for innova-tive and potentially high-growth startups.
c. At the same time, greater availability of technical assistance in the form of financial lit-eracy and business skills training (accounting, business planning, etc.) would be neces-sary to provide new entrepreneurs with a solid foundation for accessing financing.
2. Address the agriculture gap by increasing the availability of funding, risk mitigation mechanisms, and technical assistance.
a. On the funding side, portfolio guarantees would be attractive to lenders to reduce what they perceive to be the high risk of agricultural lending.
b. Sector-specific credit lines are also needed c. TA is especially important and should focus more on helping financial institutions reduce
the cost of serving agricultural enterprises. 3. Contribute to mitigating the loan gap by increasing the availability of portfolio guarantee prod-
ucts and lending to second-tier banks; accompany financial measures with TA targeted towards flexibility of lending processes, simplification of procedures, and increasing efficiency with the goal of cost reduction.

BFC. Assessment of financing needs of SMEs in Western Balkans countries. Synthesis Report
37
Annex 1: Macroeconomic indicators Main macroeconomic indicators (2014) Indicator ALB BOS KOS MAC MON SER GDP (nominal, EUR millions) 9,994 13,938 5,518 8,530 3,458 32,409 Population (millions) 2.9 3.8 1.8 2.1 0.62 7.2 GDP (nominal) per capita (EUR) 3,435 3,642 3,065 4,126 5,561 4,524 Inflation rate (CPI, annual average) 1.6% –0.9% 0.4% –0.3% –0.7% 2.1% Exchange rate (EUR, end of period) 140.14 1.95583 n/a 61.4814 n/a 120.6 Change in exchange rate 0.0% 0.0% n/a –0.1% n/a 5.5% Unemployment rate 17.5% 27.9% 35.3% 28.0% 18.0% 22.2% Youth unemployment rate22 29.2% 57.5% 55.9% 50.8% 39.5% 49.5% Poverty rate (national) 14.3%23 17.9%24 n/a 24.2%25 8.6%26 - Current account balance (% of GDP) –12.9% –7.7% –8.0% –0.8% –15.3% –6.0% Trade balance (% of GDP) –18.9% –27.6% –31.1 –20.7% –19.8% –12.4% Net FDI (% of GDP) 8.1% 2.7% 2.7% 2.3% 10.8% 3.7% Public debt (% of GDP) 70.2% 30.1% 10.6% 46.0% 59.9% 79.3% Fiscal balance (% of GDP) –5.2% –2.0% –2.4% –4.2% –3.0% –6.7% Note: Data is from 2014 unless otherwise noted. Contribution of selected sectors to GDP in 2014 ALB BOS KOS MAC27 MON SER Agriculture 22.9% 7.0% n/a 11.5% 10.0% 8.4% Manufacturing 5.5% 12.9% n/a 11.4% 4.8% 25.4% Construction 10.6% 4.7% n/a 8.2% 4.2% 5.7% Trade 12.7% 15.9% n/a 15.6% 14.2% n/a Others 48.3% 59.5% n/a 53.3% 66.8% n/a TOTAL 100% 100% 100% 100% 100% 100% Real GDP growth rates 2014 2013 2012 2011 Average Albania 2.0% 1.1% 1.4% 2.6% 1.8% Bosnia and Herzegovina 0.8% 2.5% –0.9% 0.9% 0.8% Kosovo 2.7% 3.4% 2.8% 4.4% 3.3% Macedonia 3.5% 2.9% –0.5% 2.3% 2.1% Montenegro 1.8% 3.5% –2.7% 3.2% 1.5% Serbia –1.8% 2.6% –1.0% 1.4% 0.3% Average 1.5% 2.7% –0.2% 2.5% 1.6%
22 Modeled ILO estimate for ages 15-24 23 2012 data 24 2011 data 25 2013 data 26 2013 data 27 2013 data

BFC. Assessment of financing needs of SMEs in Western Balkans countries. Synthesis Report
38
Annex 2: Banking sector indicators Banking sector indicators for 2014 Indicator ALB BOS KOS MAC MON SER Structure of the banking sector Number of banks 16 27 10 15 12 29 5-bank concentration ratio 73.8% 52.3% - 74.8% 68.4% 53.5 Bank branches per 100k population 17.2 17.3 20.9 21.0 - 30.3 Financial indicators (EUR millions) Total assets 9,231.6 24,468.5 3,187 6,510.6 3,136.3 24,610.3 Total net loans 3,596.9 15,903.0 1,882 3,633.8 2,356.2 - Total deposits 7,597.1 15,376.1 2,538 4,667.7 2,308.1 15,519.9 Total equity 791.9 3,422.6 323 704.4 444.0 5,089.5 Total regulatory capital 832.6 2,777.0 - 736.9 - 2,812.6 Total net profit 79.9 159.1 60 51.2 23.8 29.0 Financial ratios Capital adequacy: Total CAR 16.8% 16.3% 17.8% 15.7% 16.2% 20.0% Equity to total assets 8.6% 14.0% 10.1% 10.8% 14.2% 20.7% Liquidity: Net loans to customer deposits 55.9% 109.8% 74.2% 88.3% 102.6% 101.6% Growth rate of deposits 5.0% 7.9% 3.6% 10.7% 10.0% 8.4% Profitability: Return on average assets 0.9% 0.7% 1.9% 0.8% 0.8% 0.1% Return on average equity 10.4% 4.7% 20.2% 7.4% 5.7% 0.6% Asset quality: Growth rate of net loan portfolio 4.9% 2.9% 4.8% 10.0% –1.9% 12.8% NPL ratio* 22.8% 14.0% 8.3% 11.3% 19.0% 21.4% Restructured loans to total loans 5.4% 0.9% n/a 8.7% 19.4% n/a Recovery rate 42.3% 36.3% 37.7% 44.6% 48.3% 30.3% Others: Foreign currency loans to total 62% 61.6% 0.3% 49.4% 1.6% 70.0% Growth rate of total assets 4.8% 4.4% 4.5% 8.3% 6.0% 4.3% Bank assets to fin. sector assets 90.7% 87.3% n/a 86.8% 91.4% n/a *Main quantitative criterion is 90 or more days late Historical development of NPL ratios 2015 2014 2013 2012 2011 Albania 20.9%Q2 22.8% 23.5% 22.5% 18.8% Bosnia and Herzegovina n/a 14.0% 15.1% 13.5% 11.8% Kosovo 6.2% 8.3% 8.7% 6.5% 5.7% Macedonia 11.7%Q2 11.3% 11.5% 10.5% 9.9% Montenegro n/a 19.0% 20.7% 17.6% 15.5% Serbia 22.0%Q3 21.4% 21.5% 18.6% n/a


Economics DepartmentU [email protected]/economics
Information Desk3 +352 4379-220005 +352 4379-62000U [email protected]
European Investment Bank98-100, boulevard Konrad AdenauerL-2950 Luxembourg3 +352 4379-15 +352 437704www.eib.org
© EIB 08/2016 EN © EIB GraphicTeam