Assessment of energy and economic effectiveness of ... · Alessandra Di Gangi* Dipartimento...
12
Assessment of energy and economic effectiveness of photovoltaic systems operating in a dense urban contest Maurizio Cellura Dipartimento dell’Energia University of Palermo, Palermo, Italy e mail: [email protected] Alessandra Di Gangi * Dipartimento dell’Energia University of Palermo, Palermo, Italy e mail: [email protected] Aldo Orioli Dipartimento dell’Energia University of Palermo, Palermo, Italy e mail: [email protected] ABSTRACT A methodology that permits to test the level of integration of the photovoltaic technology in urban areas is presented. The percentage of coverage of the electricity demand and the economic feasibility of grid-connected photovoltaic systems installed on the roofs of buildings were investigated in a district of the city of Palermo (Sicily). After classifying roofs according to their shape, orientation and pitch by means of satellite images provided by Google EarthTM, the ratio of the productivity of the PV systems and the consumption of electricity of the households was analysed considering all economic aspects. As a result, it can be always identified the number of floors in correspondence of which the size of the PV system that may be installed, and the consequent production of electricity, does not recover the costs for installation and maintenance of the system. INTRODUCTION The European Union (EU) set a series of climate and energy targets to be meet by 2020, known as the "20-20-20" targets. With the Directive 2009/28/EC, the EU stated for each Member State the national overall target for the share of energy from renewable sources. For Italy the share of energy from renewable sources in gross final consumption of energy in 2020 would be at least 17%. To achieve the latter target the solar energy could plays the main role in urban contests. The problem involves different aspects that do not only concern the energy performances but also economic effects. It means that, according to the actual generation of electricity, the PV systems have to be a feasible economic investment. To attain and test these results it is basic to consider the size of the studied system. . Actually, when they refer to a specific PV system analysed such as one-family detached house, every single aspect of the problem can be considered (panels, inverters, orientation, pitch, obstructions, economic analysis) but the data * Corresponding author
Transcript of Assessment of energy and economic effectiveness of ... · Alessandra Di Gangi* Dipartimento...

Assessment of energy and economic effectiveness of
photovoltaic systems operating in a dense urban contest
Maurizio Cellura
Dipartimento dell’Energia
University of Palermo, Palermo, Italy
e mail: [email protected]
Alessandra Di Gangi*
Dipartimento dell’Energia
University of Palermo, Palermo, Italy
e mail: [email protected]
Aldo Orioli
Dipartimento dell’Energia
University of Palermo, Palermo, Italy
e mail: [email protected]
ABSTRACT
A methodology that permits to test the level of integration of the photovoltaic technology in
urban areas is presented. The percentage of coverage of the electricity demand and the
economic feasibility of grid-connected photovoltaic systems installed on the roofs of
buildings were investigated in a district of the city of Palermo (Sicily). After classifying roofs
according to their shape, orientation and pitch by means of satellite images provided by
Google EarthTM, the ratio of the productivity of the PV systems and the consumption of
electricity of the households was analysed considering all economic aspects. As a result, it can
be always identified the number of floors in correspondence of which the size of the PV
system that may be installed, and the consequent production of electricity, does not recover
the costs for installation and maintenance of the system.
INTRODUCTION
The European Union (EU) set a series of climate and energy targets to be meet by 2020,
known as the "20-20-20" targets. With the Directive 2009/28/EC, the EU stated for each
Member State the national overall target for the share of energy from renewable sources. For
Italy the share of energy from renewable sources in gross final consumption of energy in 2020
would be at least 17%. To achieve the latter target the solar energy could plays the main role
in urban contests.
The problem involves different aspects that do not only concern the energy performances but
also economic effects. It means that, according to the actual generation of electricity, the PV
systems have to be a feasible economic investment. To attain and test these results it is basic
to consider the size of the studied system. . Actually, when they refer to a specific PV system
analysed such as one-family detached house, every single aspect of the problem can be
considered (panels, inverters, orientation, pitch, obstructions, economic analysis) but the data
* Corresponding author

of predictions cannot be used to extrapolate the results of the analysis to a whole city or
region [1], [2], [3]. On the other hand, when the purpose of the study is analysing the energy
potential of a nation, or even a continent, it is impossible to consider all details of the problem
[4], [5], [6], [7]. The potential of solar electricity generation was assessed for areas whose
surface varied from an apartment [8] to a whole city [9] or a continent [10]. To evaluate the
roof collecting surfaces, Vardimon [11] considered that, for slanted roofs, 18-24% of the area
was available, while flat roofs had an availability ratio of 50-70%. Ordóñez et Al. [12]
estimated availability ratios of 79-98% for pitched roofs and of 65-80% for flat roofs,
depending on the typology.
Many researchers have investigated the effectiveness of supporting measures for the
production of electricity by PV systems. Papadopoulos et A. [13] discussed a quantitative
assessment of the feed-in tariff (FIT) introduced in Greece. Campoccia et Al. [14] compared
the supporting measures adopted by France, Germany, Italy and Spain. Dusonchet et Al. [15],
[16] extended the comparison to 17 western and 10 eastern European Union countries.
THE METHODOLOGY
The proposed methodology considers many aspects of the problem including the energy and
economic ones. Actually, even if it is important to evaluate the energy cover factor of a PV
system, could happen that the PV system does not harvest economic advantage from the
operational phase. The joined analysis of energy and economic aspects is of basic importance
for evaluating real outcomes of investments. To reach this result the proposed methodology
follows the following steps:
Architectonic aspects:
- identification of buildings roof surfaces (flat and slanted);
- estimation of number of floors for each building;
- shape classification of roofs.
Energy aspects:
- estimation of the electricity produced by the PV systems as regards to each floor;
- estimation of the electricity consumed by the homeowners;
- estimation of the energy cover factor.
Economic aspects
- evaluation of costs of the PV systems (investment costs and costs for maintenance,
servicing and insurance against damage) and benefits due to the gains for the avoided
bill costs, the incentives and the sold electricity;
- analysis of cash flows;
- evaluation of the economically effective and ineffective roofs;
- estimation of the energy cover factor related to the results of the economic analysis;
- sensitivity analysis for the most significant physical and economic parameters.
THE STUDY-ZONE
The methodology has been applied to the city of Palermo (Sicily) (Fig.1) and in particular to
a district characterized by regular square layout of streets, well ordered orientation of
buildings (117° East of South and 153° West of South) (Fig.2), and almost constant pitch of
slanted roofs (about 25° above the horizontal).
Architectonic aspects
Identification of buildings roof surfaces The maps of Google EarthTM
were used to identify
and measure the roofs of the analysed district (Figs.1-2).

Figure 1. The city of Palermo
The district area occupied by buildings measures 109,207 m2
(Fig.3), i.e. 40% of the whole
district’s surface and it is subdivided into the following parts:
- slanted roofs : 60,145 m2
(55.07 %)
- flat roofs : 37,902 m2 (34.71 %)
- terraces : 11,017 m2 (10.09 %)
- others : 143 m2 (0.13 %)
Figure 2. The analysed district

Estimation of number of floors of each building The amount of roof surface that is available
for any co-owner of the building to install a PV system derives from the number of floors of
building. The figure 3 was determined by using the Street View function (technology featured
in Google MapsTM
and Google EarthTM
that provides panoramic views from various positions
along many streets in the world).
Most of roofs areas cover buildings of four floors. Moreover most of the slanted roofs belong
to buildings of four floors whereas most of the flat floors cover buildings with eight floors.
This distribution disagreement is due to the different ages of buildings, and consequently to
the different technologies used to build them.
The slanted roofs typically cover old stone buildings traditionally made with massive walls,
with a thickness varying from 30 to 60 cm. In these buildings, which were built before Second
World War without using reinforced concrete frame, for structural stability, two opposite
thick walls cannot be more distant than about 4.5 metres; besides, because each room has at
least a window, each building has a standard depth of about 9 metres. Buildings contain
residential apartments that are regularly made with an entrance hall, a corridor, 5-6 rooms, a
kitchen and bathrooms; for each apartment can be estimated a gross surface of about 150-170
m2.
Figure 3. The area of district occupied by buildings
Classification of slanted roofs With the aim of classifying the roofs in the district it was
necessary to study the disposition of the urban context. The roof of many buildings looks like
a complex composition of different elementary roof shapes such as gable, hip and skillion.
Some buildings have roofs orthogonally joined; besides, the roofs have different orientations.
In order to classify the slanted roofs, the 16 types of shapes reported in Table 1 have been
identified. The roof of each building was subdivided in parts similar to the roof types of Table
1; all parts were catalogued by assigning the corresponding roof type, the surface area and the

identification code of the building. The prevalent roof shapes are the simple gable roofs (T1:
14% - T2: 21%).
Table 1. Classification of roof shapes
T1
(8162 m²)
T2
(12901 m²)
T3
(2690 m²)
T4
(2031 m²)
T5
(2144 m²)
T6
(2219 m²)
T7
(1582 m²)
T8
(2880 m²)
T9
(2296 m²)
T10
(1683 m²)
T11
(3298 m²)
T12
(2906 m²)
T13
(3787 m²)
T14
(3765 m²)
T15
(3618 m²)
T16
(4183 m²)
Classification of flat roofs To classify flat roofs, which have different characteristics in
comparison with the slanted roofs, a different criterion was used. Five classes containing
almost the same number of buildings were identified. Once evaluated the area mean value for
each class, five regularly shaped buildings, with a roof area near to the class mean values
were selected to represent the five groups of buildings.
Table 2. Classification of flat roofs
FR1
265 m²
FR2
387 m²
FR3
482 m²
FR4
717 m²
FR5
1394 m²
As it is shown in Fig. 4, most of the slanted roofs belong to buildings of four floors whereas
most of the flat roofs cover buildings with eight floors

Figure 4. Distribution of roof areas versus number of floors.
Energy aspects
Estimation of the electricity produced by the PV systems in slanted roofs as regards to each
floor The electricity generation produced by PV systems of each floor was calculated using
the software PVsyst 5.06 [17] which includes monthly data of the global irradiation,
temperatures and wind velocity (Meteonorm, versions 4-5).
It was assumed that:
- each type of roof in Table 1 had a standard surface of 162 m2 and a fixed dimension (width
or length) of 9 metres;
- the commercial PV panel used (Kyocera KD210GH-2P) had dimensions 1.50 x 0.99 metres;
- PV panels were considered to be collocated with the same pitch of the roof surface.
In Tables 3 some results of the energy estimation are resumed.
Tab.3. Electricity produced by slanted roofs
number of
floors
Total roofs area
(m²)
Electricity produced
(KWh)
1 64 5,266.96
2 934 41,300.53
3 5,923 149,476.55
4 23,316 512,594.78
5 10,947 163,643.40
6 8,320 784,56.53
7 2,658 224,70.96
8 5,158 44,347.64
9 2,825 10,223.05
Total 60,145 1,027,780.40
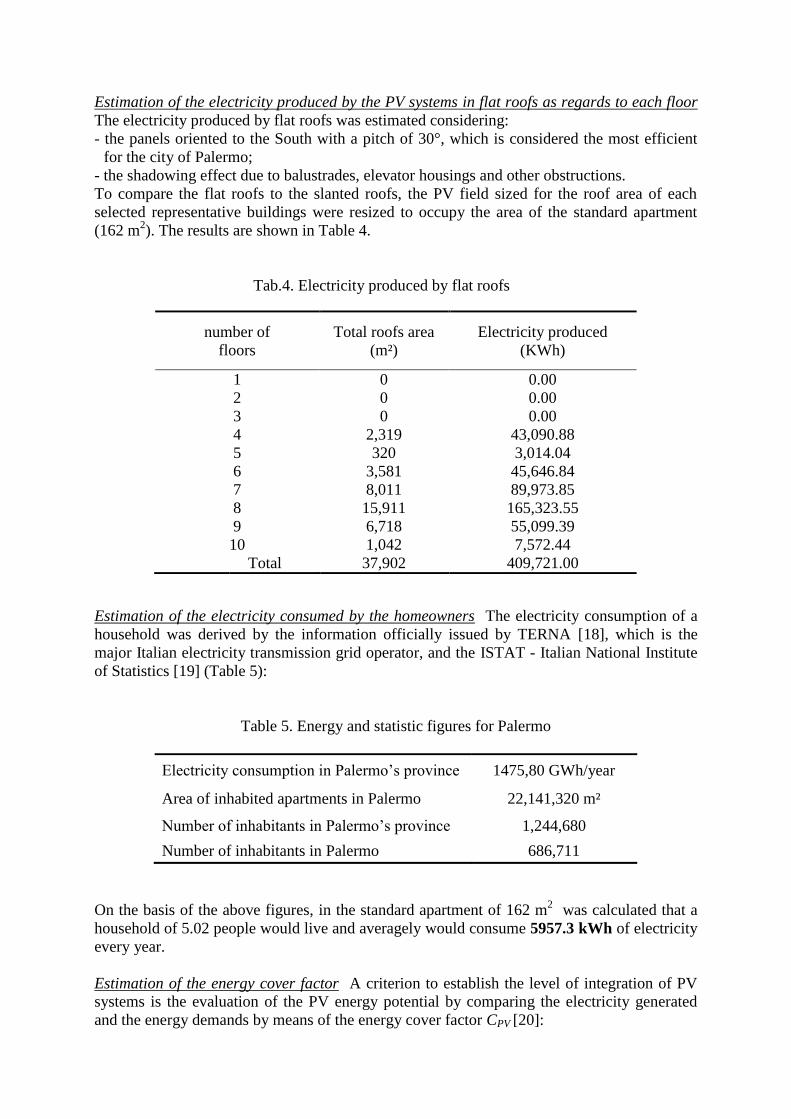
Estimation of the electricity produced by the PV systems in flat roofs as regards to each floor
The electricity produced by flat roofs was estimated considering:
- the panels oriented to the South with a pitch of 30°, which is considered the most efficient
for the city of Palermo;
- the shadowing effect due to balustrades, elevator housings and other obstructions.
To compare the flat roofs to the slanted roofs, the PV field sized for the roof area of each
selected representative buildings were resized to occupy the area of the standard apartment
(162 m2). The results are shown in Table 4.
Tab.4. Electricity produced by flat roofs
Estimation of the electricity consumed by the homeowners The electricity consumption of a
household was derived by the information officially issued by TERNA [18], which is the
major Italian electricity transmission grid operator, and the ISTAT - Italian National Institute
of Statistics [19] (Table 5):
Table 5. Energy and statistic figures for Palermo
Electricity consumption in Palermo’s province 1475,80 GWh/year
Area of inhabited apartments in Palermo 22,141,320 m²
Number of inhabitants in Palermo’s province 1,244,680
Number of inhabitants in Palermo 686,711
On the basis of the above figures, in the standard apartment of 162 m2 was calculated that a
household of 5.02 people would live and averagely would consume 5957.3 kWh of electricity
every year.
Estimation of the energy cover factor A criterion to establish the level of integration of PV
systems is the evaluation of the PV energy potential by comparing the electricity generated
and the energy demands by means of the energy cover factor CPV [20]:
number of
floors
Total roofs area
(m²)
Electricity produced
(KWh)
1 0 0.00
2 0 0.00
3 0 0.00
4 2,319 43,090.88
5 320 3,014.04
6 3,581 45,646.84
7 8,011 89,973.85
8 15,911 165,323.55
9 6,718 55,099.39
10 1,042 7,572.44
Total 37,902 409,721.00

100PVPV
Total
EC
D (1)
in which EPV represents the electricity produced by the PV system and DTotal is the electrical
energy demand. Taking account of the available areas and the number of floors, the actual PV
energy potential of all roofs of the district was computed. As it is shown in Fig.5, both slanted
and flat roofs buildings seem to be adequate to produce enough electricity to meet the "20-20-
20"targets. PV systems cover 35.8% of the district electricity demand; the energy production
is mainly due to the sloped roofs covering buildings of four floors.
The results shown in Fig.5 are too optimistic because no shading and technical
malfunctioning or unforeseeable solar energy unavailability were considered. Moreover, it
may exist a problem related to the mismatch that happens when there is not an instantaneous
generation and consumption of electricity. To describe opportunely the matter, we have to
examine two conditions:
1) the PV system is undersized to cover the energy demands DTotal and consequently the
electricity generated EPV is less than the demand;
2) the PV system is not undersized but the generation does not fully covers the energy
demand DTotal for lack of contemporaneousness.
Figure 5. Yearly energy cover factors for the whole district, versus the number of floors.
First of all, both of conditions have been analysed by computing the night energy demand
Dnight which is always covered by the grid. It was assumed that the following users were
working in the standard apartment [21], [22], [23], [24] during the night:
- Lamp 85 W from Ti to 23:00 – from 07.00 to Tf
- Refrigerator : 90 W from Ti to 24:00 – from 00.00 to Tf
- Television + P.C. : 75 W from Ti to 23:00 – from 07.00 to Tf
-
where Ti was assumed one hour before sunset time and Tf one hour after dawn time. It was
calculated Dnight = 716.5 kWh/year and consequently the day energy demand Dday = 5240.8
kWh/year.
When a significant amount of electricity is generated by a great number of PV systems the
surplus of produced energy can be a complex problem for the public grid managers. The
surplus also represents an economic disadvantage for the self-producers because the purchase
0%
2%
4%
6%
8%
10%
12%
14%
1 2 3 4 5 6 7 8 9 10Number of floors
Energy cover factors for the whole district
Tot. Slanted roofs = 25.6%
Tot. Flat roofs = 10.2%
Tot. Slanted+Flat roofs = 35.8%

price is generally higher than the selling price. Moreover, as it will be shown by the economic
assessment, the disadvantage related to the difference between purchase and selling prices is a
reason why the households may decide do not install PV systems on their roofs.
Economic aspects
When the aim of an investment is to install PV systems on building roofs, the main problem is
to define a criterion that permits to assess the actual feasibility of the project. The benefits are
related to the gain for the avoided bill cost, for incentives and for selling electricity. The
disbursements are due to the costs for investments, system devices replacement, maintenance
and management, and insurance.
The electricity bills were calculated considering the difference between the bills
corresponding to the electricity demand DTotal and those referred to the difference between
DTotal and Econs, which is the energy consumed while the PV systems are producing electricity.
The electricity tariffs issued by the AEEG - Italian Authority for electricity and gas for
domestic consumers with an electricity capacity of 3 kW were used. For the incentives, the
values of FIT given by the decree issued in 2011 by the Ministry for the Economic
Development were assumed. For the first four-month period of 2011 incentives varying from
0.402 to 0.333 €/kWh are paid, depending on the rated power of the PV system. For the gain
in selling electricity, which was calculated on the basis of the exported PV generation EPV –
Econs, a mean selling price of 0.102 €/kWh was used. The net gain in selling the exported PV
electricity was calculated charging an income tax of 30.22 %, which was estimated on the
basis of the average income of the inhabitants of Palermo.
The costs of the investment were obtained from the market prices of components, considering
the cost for labour and fitter’s gain.
All above factors are connected to the cash flows that permit to assess the effectiveness of
installing PV systems on building through the evaluation of the net present value (NPR), the
internal rate of return (IRR) and the pay-back periods. The cash flows were calculated for 20
years, which is the time when incentives are provided in Italy. The economic analysis was
performed by considering:
the decreasing of the efficiency of the PV panels every year of 1% of the nominal initial
value:
the maintenance and management costs, estimated to be 2% of the investment cost every
year;
the replacement of 1 % of the PV panels every year and of all inverters every five years;
the yearly increasing of 5.2 % in the price of electricity;
the effect of inflation, assumed equal to 2.1 %, as deduced by the data issued by the
ISTAT;
the current value of 4.36 % of the weighted average cost of capital.
RESULTS
In order to evaluate the actual values of the energy cover factor CPV of the district, the results
obtained from the energy assessment were filtered by using the results of the economic
analysis. For this reason only the PV electricity generated by PV systems, whose installation
had resulted economically convenient, was considered useful to cover the demand of the
district.
Fig.6 shows the yearly energy cover factors filtered to take account of the economic
assessment; the shading coefficient was set equal to zero. The comparison with Fig.5 shows
the significant reduction of the energy cover factors due to the assessment of the economic

convenience of PV installations; the energy cover factor of the district lowers from 35.8 % to
24.1 %, with a percentage decrement of 32.7 %. The PV systems installed on modern
buildings with flat roofs cover only 3.4 % of the district demand; they passed from 28.5 % of
the global PV production to only 14.1 %. About 50% of the global PV electricity is generated
by the PV systems installed on the slanted roofs of buildings with four floors. Because the
contribution of the building with a number of floors greater than five is only 3 %, one may
think that the PV systems on those buildings are not worth installing.
Figure 6. Yearly energy cover factors for the whole district, filtered by the
economic assessment, versus the number of floors.
As it is shown in Fig.7, the reduction of the energy cover factors is even severer if the effects
of shading are considered.
Figure 7. Yearly energy cover factors for the whole district, filtered by the economic
assessment, at various values of the shading coefficient versus the number of floors.
Although the shadowing coefficient produces a reduction of the generated PV electricity that
is directly proportional to its value, the effect on the cover factor is quite not proportional.
With a reduction of 5 % in the electricity generated by the PV systems, the cover factor of the
district changes from 24.1 % to 20.6 %, which is a reduction of 14.5 %. The reduction is even
greater with higher values of the shading coefficient; a reduction of 10 % of the electrical
0%
2%
4%
6%
8%
10%
12%
14%
1 2 3 4 5 6 7 8 9 10Number of floors
Filtered energy cover factors for the whole district
Tot. Slanted roofs = 20.7%
Tot. Flat roofs = 3.4%
Tot. Slanted+Flat roofs = 24.1%
0%
2%
4%
6%
8%
10%
12%
14%
1 2 3 4 5 6 7 8 9 10Number of floors
Filtered energy cover factors for the whole district
Shadowing coeff. = 0%
Shadowing coeff. = 5%
Shadowing coeff. = 10%
CPV= 24.1%CPV= 20.6%CPV= 15.0%

generation due to the shadowing causes a decrement of 37.8 in the energy cover factor of the
district.
CONCLUSION
The evaluation of the real energy and economic effectiveness of the PV systems for reaching
ambitious targets of the European Union in the energy field is of paramount importance for
addressing decision makers towards different options of financial supports. In the meantime
scientists have developed much experience in the above field but still now it misses a simple
methodology for assessing the effectiveness of the PV systems in urban contests, where the
complexity of the problem has to cope with the need to simulate PV systems in reliable, fast
and effective ways. The shown methodology has the above requested features and permits to
test the level of integration of the photovoltaic technology in urban areas. The methodology
was applied in a district of the city of Palermo (Italy) and the percentage of coverage of the
electricity demand and the economic feasibility of grid-connected photovoltaic systems
installed on the roofs of buildings were investigated. The obtained results showed the difficult
to size in a proper and effective way the PV systems in big urban contests, and point out the
suitability of the tool for energy planning of the above systems. Considering energy and
economic parameters the cover factor varies 35.8 % to 24.1 %. The possibility to identify
situations where the economic feasibility of investments is not convenient is an important
feature of the method that can help decision makers to select effective alternatives in energy
planning procedures.
NOMENCLATURE
CPV Energy cover factor [%]
EPV Electricity produced by PV system [kWh]
DTotal Electrical energy demand [kWh]
Ddayl Day energy demand [kWh]
Dnight Night energy demand [kWh]
REFERENCES
[1] Celik A. N., 2006. Present status of photovoltaic energy in Turkey and life cycle techno-
economic analysis of a grid-connected photovoltaic-house. Renewable and Sustainable
Energy Reviews 10, 370–387.
[2] Muñoz F.J., Echbarthi I., Nofuentes G., Fuentes M., Aguilera J., 2009. Estimation of the
potential array output charge in the performance analysis of stand-alone photovoltaic
systems without MPPT (Case study: Mediterranean climate). Solar Energy 83, 1985–
1997.
[3] Mavromatakis F., Makrides G., Georghiou G., Pothrakis A., Franghiadakis Y., Drakakis
E., Koudoumas E., 2010. Modeling the photovoltaic potential of a site. Renewable
Energy 35, 1387–1390.
[4] Mardaljevic J., Rylatt M., 2003. Irradiation mapping of complex urban environments: an
image-based approach. Energy and Buildings 35, 27–35.
[5] Compagnon R., 2004. Solar and daylight availability in the urban fabric. Energy and
Buildings 36, 321–328.
[6] Robinson D., Stone A., 2004. Solar radiation modelling in the urban context. Solar Energy
77, 295–309.

[7] Robinson D., 2006. Urban morphology and indicators of radiation availability. Solar
Energy 80, 1643-1648.
[8] Al-Salaymeh A., Al-Hamamre Z., Sharaf F., Abdelkader M.R., 2010. Technical and
economical assessment of the utilization of photovoltaic systems in residential buildings:
The case of Jordan. Energy Conversion and Management 51, 1719–1726.
[9] Hofierka J., Kaňuk J., 2009. Assessment of photovoltaic potential in urban areas using
open-source solar radiation tools. Renewable Energy 34, 2206–2214.
[10] Šúri M., Huld T.A., Dunlop E.D., Ossenbrink H.A., 2007. Potential of solar electricity
generation in the European Union member states and candidate countries. Solar Energy
81, 1295–1305.
[11] Vardimon R., 2011. Assessment of the potential for distributed photovoltaic electricity
production in Israel. Renewable Energy 36, 591-594.
[12] Ordóñez J., Jadraque E., Alegre J., Martínez G., 2010. Analysis of the photovoltaic solar
energy capacity of residential rooftops in Andalusia (Spain). Renewable and Sustainable
Energy Reviews 14, 2122–2130.
[13] Papadopoulos A.M., Karteris M.M., 2009. An assessment of the Greek incentives
scheme for photovoltaics. Energy Policy 37, 1945–1952.
[14] Campoccia A., Dusonchet L., Telaretti E., Zizzo G., 2009. Comparative analysis of
different supporting measures for the production of electrical energy by solar PV and
Wind systems: Four representative European cases. Solar Energy 83, 287–297.
[15] Dusonchet L., Telaretti E., 2010. Economic analysis of different supporting policies for
the production of electrical energy by solar photovoltaics in western European Union
countries. Energy Policy 38, 3297–3308.
[16] Dusonchet L., Telaretti E., 2010. Economic analysis of different supporting policies for
the production of electrical energy by solar photovoltaics in eastern European Union
countries. Energy Policy 38, 4011–4020.
[17] PVsyst, Software for photovoltsic sysytems, University of Geneva ISE - Group Energy,
FOREL Battelle, bât. D7, route de Drize CH-1227 Carouge Switzerland
[18]“Dati Statistici sull'energia elettrica in Italia”, Terna S.p.A.,
www.terna.it/default/Home/SISTEMA_ELETTRICO/statistiche/dati_statistici.aspx
[19]“Dati statistici ISTAT: Popolazione residente - Censimento 2001 - Superficie delle
abitazioni occupate da persone residenti”, ISTAT, Italian National Institute of Statistics,
dawinci.istat.it/MD/dawinciMD.jsp
[20] B. Verbruggen, R. De Coninck, R. Baetens, D. Saelens, L. Helsen, J. Driesen, “Grid
impact indicators for active building simulation”, IEEE PES Innovation Smart
Technologies Conference, Anaheim, USA, 17-19 January 2011.
[21] Project EURECO “Demand-Side Management, End-use metring campaign in 400
households of the European Community, Assessment of the potential electricity savings”,
(2002).
[22] eERG, end-use Efficiency Research Group, Politecnico di Milano, MICENE “ Misure
dei consumi di energia elettrica in 110 abitazioni italiane, curve di carico dei principali
elettrodomestici e egli apparecchi di illuminazione, (2004).
[22] IES, Institute for Environment and sustainability – JRC, Joint Research Centre -
European Commission, “Electricity consumption and efficiency trends in the enlarged
European Union”, Status Report (2006).
[24] IEA, International Energy Agency, “Final report of Annex 42 – Energy conservation in
buildings and community system programme”, (2008).