Assessment of Electrodialysis Water Desalination …gwri-ic.technion.ac.il/pdf/IDS/82.pdf32...
23
32 Assessment of Electrodialysis Water Desalination Process Costs H. Strathmann, Institute of Chemical Engineering, University of Stuttgart, Germany Abstract: Electrodialysis has been one of the first commercially available large scale water desalination processes based on membranes and is still widely used all over the world. However, in spite of long term reliable operation experience and clear technical advantages of electrodialysis in brackish water desalination and waste water treatment the process is replaced more and more by reverse osmosis and nanofiltration in recent years. The main reason for the decreasing use of electrodialysis in the production of potable water are the overall process costs. In this presentation the fundamentals of electrodialysis are briefly described and the various parameters determining the process costs are analyzed. As result it is shown that in addition to the investment related costs, energy consumption is the dominating factor determining the economics of the process. In electrodialysis both investment as well as the energy costs depend strongly on the feed water salt concentration. By comparing the costs of various desalination processes the range of feed and product water concentration, in which electrodialysis has a clear advantage over the competing processes in terms of the overall costs including pre- and post-treatment procedures, has been identified. The assessment indicates that electrodialysis can be most effectively used for the production of potable water from feed waters with concentrations between 1000 to 10 000 ppm total dissolved salts. For sea water desalination electrodialysis can presently not compete in terms of overall process costs with reverse osmosis. Key words: Electrodialysis, water desalination, ion-exchange membranes, desalination costs
Transcript of Assessment of Electrodialysis Water Desalination …gwri-ic.technion.ac.il/pdf/IDS/82.pdf32...

32
Assessment of Electrodialysis Water Desalination Process Costs
H. Strathmann, Institute of Chemical Engineering, University of Stuttgart, Germany
Abstract: Electrodialysis has been one of the first commercially available large scale water
desalination processes based on membranes and is still widely used all over the world. However, in spite of long term reliable operation experience and clear technical advantages of electrodialysis in brackish water desalination and waste water treatment the process is replaced more and more by reverse osmosis and nanofiltration in recent years. The main reason for the decreasing use of electrodialysis in the production of potable water are the overall process costs.
In this presentation the fundamentals of electrodialysis are briefly described and the various parameters determining the process costs are analyzed. As result it is shown that in addition to the investment related costs, energy consumption is the dominating factor determining the economics of the process.
In electrodialysis both investment as well as the energy costs depend strongly on the feed water salt concentration. By comparing the costs of various desalination processes the range of feed and product water concentration, in which electrodialysis has a clear advantage over the competing processes in terms of the overall costs including pre- and post-treatment procedures, has been identified. The assessment indicates that electrodialysis can be most effectively used for the production of potable water from feed waters with concentrations between 1000 to 10 000 ppm total dissolved salts. For sea water desalination electrodialysis can presently not compete in terms of overall process costs with reverse osmosis.
Key words: Electrodialysis, water desalination, ion-exchange membranes, desalination costs

33
1. Introduction
Electrodialysis has been the first membrane based water desalination process based on membranes which became commercially available more than 40 years ago and is still widely used all over the world for the production of potable water from brackish water. The world-wide installed capacity of electrodialysis plants for brackish water desalination is well in excess of 106 m3 d-1. The majority of these plants is operated in reversed polarity mode which is referred to as electrodialysis reversal. In water desalination, electrodialysis is competing directly with distillation, with reverse osmosis and more recently with nano-filtration. However, in a certain range of feed water salt composition electrodialysis has a clear economic advantage over other desalination processes. Electrodialysis is mainly used in small to medium size plants with capacities of less than a few 100 m3 d-1 to more than 20 000 m3 d-1 and brackish water salinity of 1000 to 5000 mg L-1 total dissolved solids. Since in electrodialysis both the energy consumption and the required membrane area are strongly increasing with increasing feed water concentration reverse osmosis is considered to have an economic advantage for the desalination of saline water with total dissolved salts in excess of 10 000 mg L-1. Nevertheless, electrodialysis has been used successfully to desalinate well water with a total salt concentration of 36 000 mg L-1. The advantages of electrodialysis compared to reverse osmosis and nanofiltration are:
� high water recovery rates even for raw water with high sulfate content, � long useful life of membranes due to higher chemical and mechanical stability, � operation at elevated temperatures up to 50oC possible, � less membrane fouling or scaling due to process reversal, � less raw water pretreatment, � ion-exchange membranes tolerate higher level of chlorine and extreme pH-values, � the process can easily be adjusted to varying feed water quality, � easy start-up and shut-down of the process for intermittent operation.
The desalination of brackish water by electrodialysis has also several disadvantages compared to reverse osmosis or nanofiltration because neutral toxic components such as viruses or bacteria are not removed by electrodialysis. Therefore, a post-treatment may be required prior to the use as potable water. Furthermore, the generation of chlorine gas at the anode can lead to corrosion problems in the surrounding of the plant if the venting is insufficient. In spite of the fact that electrodialysis reversal is significantly less sensitive to membrane fouling than reverse osmosis some pretreatment of the feed water is required to achieve trouble free operation. Brackish water desalination plants used for the production of potable water can be rather different in size. Container mounted units with a capacity of 50 to 300 m3d-1 are often used to supply isolated hotels, small islands or the labor force in camps in isolated dessert areas with potable water. Larger installations with capacities between 10,000 to 30,000 m3d-1 are used for municipal water supply or in industrial applications.
2. Electrodialysis Processes Operating Principle and Fundamentals The principle of electrodialysis is illustrated in Figure 1 which shows a schematic diagram of
a typical electrodialysis cell arrangement consisting of a series of anion- and cation-exchange membranes arranged in an alternating pattern between an anode and a cathode to form individual cells. If an ionic solution such as an aqueous salt solution is pumped through these cells and an

34
electrical potential is established between the anode and cathode, the positively charged cations migrate towards the cathode and the negatively charged anions towards the anode. The cations pass easily through the negatively charged cation-exchange membrane but are retained by the positively charged anion-exchange membrane. Likewise, the negatively charged anions pass through the anion-exchange membrane, and are retained by the cation-exchange membrane. The overall result is an increase in the ion concentration in alternate compartments, while the other compartments simultaneously become depleted. The depleted solution is referred to as the diluate and the concentrated solution as the brine or the concentrate. The driving force for the ion transport in the electrodialysis process is the applied electrical potential between the anode and cathode. The total space occupied by the diluate and the concentrated solutions, i.e. the concentrate and diluate cells, and the contiguous anion- and cation-exchange membranes make up a cell pair. The cell pair is a repeating unit in an electrodialysis stack. An actual electrodialysis unit which is referred to as a stack may have a few hundreds of cell pairs. Although there are many different components necessary for the proper and efficient operation of an electrodialysis plant such as the electrical power supply, pumps, and control and monitoring devices, the stack is the key element. There are various stack design concepts described in the literature [1]. In praxis only two different stack designs are used on a large scale. One is the so-called sheet-flow and the other the tortuous path-flow concept. Both stack designs will be discussed in more detail later.
--------------
--------------
+++++++++
+++++++++
feed solution
+ -+ -
+-+-+-
anode cathode
+-
+-
+-
diluateconcentrate concentrate
+ -
cell unit
Fig.1 Schematic diagram illustrating the principle of desalination by electrodialysis in a stack of
cation- and anion-exchange membranes in alternating series.
3. The Ion-Exchange Membranes, their Properties and Structures Ion-exchange membranes are key properties in electrodialysis. They consist of highly
swollen gel-type polymer structures carrying positive or negative charged groups. Membranes which contain negatively charged groups fixed to the polymer matrix are referred to as cation-exchange membranes and those containing positively charged groups are referred to as anion-exchange membranes. In a cation-exchange membrane, the fixed anions are in electrical

35
equilibrium with mobile cations in the interstices of the polymer, as indicated in Figure 2, which shows schematically the matrix of a cation-exchange membrane with fixed negative charges and mobile cations, the latter are referred to as counter-ions. The mobile anions are called co-ions and are more or less completely excluded from the polymer matrix because of their electrical charge which is identical to that of the fixed ions. Due to the exclusion of the co-ions, a cation-exchange membrane is preferentially permeable to cations. Anion-exchange membranes carry positive charges fixed on the polymer matrix. They therefore exclude cations more or less completely and are preferentially permeable to anions. To which extent the co-ions are excluded from an ion-exchange membrane depends on membrane as well as on solution properties. Furthermore, cation- and anion-exchange membranes are classified as strong acid and strong base or weak acid and weak base membranes depending on the degree of dissociation of the charged group. Strong acid membranes contain sulfonic acid as charged groups. In weak acid membranes carboxylic acid is the charge carrying group. Quaternary and tertiary amines are the fixed charges in strong and weak base cation-exchange membranes, respectively [2].
−
+
+
+ +
+
+
+
+ +
+
+
+ +
−−
−
−
−
−− −
−
−
−
−
−−
−
−
−
−
−
−
−
−
− −
−
−−
−
−
−+ + +
++
+ +
+
+
++
+
+
++
+
++
++ −
−
−
−
+
fixed ions counter-ions co-ions
polymer matrix
Fig. 2 Schematic drawing illustrating the structure of a cation-exchange membrane.
The properties of ion-exchange membranes are determined by different parameters, such as the density of the polymer network, the hydrophobic or hydrophilic character of the matrix polymer and the type and concentration of the charges in the polymer, and the morphology of the membrane itself [3]. The most desired properties of ion-exchange membranes are:
� High permselectivity � Low electrical resistance � Good mechanical and form stability � High chemical and thermal stability Many of today's available ion-exchange membranes meet most of these requirements.

36
4. Mass Transfer in Electrodialysis The mass transfer in electrodialysis is determined by the driving forces acting on the
individual components of the solution and by the friction which the components have to overcome when being moved in the solution and the ion-exchange membranes. The driving forces acting on the components of a system can be expressed by gradients in their electrochemical potential. The friction or the resistance that has to be overcome by the driving force to achieve the transport of the component can be expressed by a mobility, i.e. a diffusion coefficient or by the electrical resistance of the electrolyte and the membranes. To describe mass transport phenomena in electrodialysis the extended Nernst-Planck equation can be applied [4].
iCvdzd
RTFCz
Ddz
dCDJ k
iii
iii ����
� (1)
Here J is flux, D is the diffusion coefficient, C is the concentration, j is the electrical potential, vk is the convective flow, z is the charge number, F is the Faraday constant, R is the gas constant, and T is the absolute temperature, and dz is a directional coordinate; the subscript i refers to a component.
The Nernst-Planck equation considers three modes of mass transport: (1) diffusion, (2) migration, and (3) convection.
The first term dz
dCD i
i in Equation 1 represents the diffusion due to a concentration gradient,
the second term dzd
RTFCz
D iii
� the migration due to an electrical potential gradient, and the third
term vkCi the convection due to a pressure gradient which is less important in electrodialysis and generally neglected.
The Nernst-Planck flux equation is a very convenient approach to describe the transport of ions in ion-exchange membranes. It must, however, be realized that a series of assumptions has been made such as the activity coefficients � 1 which in practical ion-exchange membrane separation processes are not always applicable.
4.1. Electrical Current and Ion Fluxes
In electrodialysis it is assumed that the total current through the membrane is carried by ions only, thus is:
���i
ii JzFAI
i (2)
Here i is the current density, I is the current, A is the membrane surface, F is the Faraday constant, J is the flux, z is the charge number, and x is a directional coordinate; the subscript i refers to cations and anions.
The current density i can be related to the specific conductivity �by:
dzd�i
�� (3)

37
Here � is the specific conductivity, � the electrical potential, and z is the directional coordinate.
The specific conductivity � can be expressed by the specific electrical resistance, the equivalent conductivity, the ion migration velocity, or the ion diffusivity:
�� ���i
iii
iiii RT
DCzF�Cz
�� 21
(4)
Here is the specific resistance, C is the concentration, F is the Faraday constant, � is the equivalent conductivity, D is the ion diffusion coefficient, R is the gas constant, T the absolute temperature, and the subscript i refers to anions and cations.
Introducing the Nernst-Planck Equations into Equation 2 and neglecting the convection term leads to:
��
����
��� � dzdz
dCF
RTRT
DFi ii �d
CzC
ziii
i2i
2 (5)
The application of Equations 1 and 5 for determining the ion fluxes or the current in electrolyte solutions, however, is restricted by the electroneutrality requirement and the conservation of charges which must be fulfilled on a macroscopic scale at all times. For a system consisting of a membrane and solutions the electroneutrality condition requires for the solution:
0��i
iiCz (6)
and for a membrane:
0��� mfixfix
i
mii CzCz (7)
Here the superscript m refers to ions in an ion-exchange membrane, the subscript fix refers to charges fixed to the membrane matrix, the subscript i refers to cations and anions.
4.2. The Transport Number and Membrane Permselectivity
In an electrolyte solution the current is carried by both ions. However, cations and anions usually carry different portions of the overall current. In ion-exchange membranes the current is carried preferentially by the counterions. The fraction of the current that is carried by a certain ion is expressed by the ion transport number [4] which is given by:
�
�
jjj
iii
Jz
JzT (8)
Here Ti is the transport number of the component i, Ji is its flux, and zi its valence, the subscript j refers to all ions involved in the charge transport.
The transport number Ti indicates the fraction of the total current that is carried by the ion i, the sum of the transport number of all ions in a solution is 1.

38
The membrane permselectivity is an important parameter for determining the performance of a membrane in a certain ion-exchange membrane separation process. It describes the degree to which a membrane passes an ion of one charge and retains an ion of the opposite charge. The permselectivity of cation- and anion-exchange membranes can be defined by the following relations [3]:
a
ccm
ccm
TTT
��
� and c
aam
aam
TTT
��
� (9)
Here � is the permselectivity of a membrane, T is the transport number, the superscripts cm and am refer to cation- and anion-exchange membranes, and the subscripts c and a refer to cation and anion, respectively.
The permselectivity of an ion-exchange membrane relates the transport of electric charges by a specific counterion to the total transport of electric charges through the membrane and the transport number of the ion in the solution. An ideal permselective cation-exchange membrane would transmit positively charged ions only, i.e. for a transport number of a counterion in an cation-exchange membrane is cm
cT = 1 and the permselectivity 1cm �� . The permselectivity approaches zero when the transport number within the membrane is identical to that in the electrolyte solution, i.e. for cm
cT = Tc is 0cm �� . For the anion-exchange membrane holds the corresponding relation.
The transport number of a certain ion in the membrane is proportional to its concentration in the membrane which again is a function of its concentration in the solutions in equilibrium with the membrane phase, due to the Donnan exclusion [3]. For a monovalent salt and a dilute salt solution and assuming the activity coefficients of the salt in the membrane and the solution to be 1 the co-ion concentration is given to a first approximation by:
fix
2
ss
com
CC
C � (10)
Here C is the concentration, the subscripts co, s and fix refer to co-ion, salt and fixed ion of the membrane, the superscripts s and m refer to membrane and solution.
Equation 10 indicates that the co-ion concentration in the membrane is decreasing with increasing salt concentration in the solution and will vanish when the salt concentration in the solution is identical to the fixed ion concentration of the membrane.
5. Processes Effecting the Efficiency of Electrodialysis
In practical application electrodialysis is effected by concentration polarization, by incomplete current utilization and by osmotic and electroosmotic water transport through the membranes. Especially the two first phenomena influence the efficiency of the process.

39
5.1. Concentration Polarization and Limiting Current Density An electric current passing through an electrodialysis cell pair is carried in the solution by
both cat- and anions according to their transport numbers which are in aqueous solutions not very different for cat- and anions. In the ion-exchange membranes, however, the current is carried mainly by the counterions. The differences in the transport numbers of ions in the solution and in the ion-exchange membranes results in a depletion of counter-ions at the surface of the ion-exchange membranes facing the diluate solution, and a concentration gradient is established in the solution between the membrane surface and the well mixed bulk. This concentration gradient results in a diffusive electrolyte transport. A steady state situation is obtained when the additional ions that are needed to balance those removed from the interface due to the faster transport rate in the membrane are supplied by the diffusive transport. The other side of the ion-exchange membrane is facing the concentrate solution. Here, an accumulation of ions occurs, because more ions are transferred through the membrane that can be carried away by the electric current due to the lower transport numbers in the solution than in the membrane. Thus, a concentration gradient of the salt is established in the solution which results in an additional diffusive salt flux from the membrane into the solution. The concentration gradients and thus the diffusive flux are limited to a thin boundary layer at the membrane surface due to turbulent mixing of the bulk solution. The process of concentration polarization is illustrated in Figure 3 which shows the profiles of the salt concentration in the solutions near the surface of the cation-exchange membrane under steady state conditions and the fluxes of salt, cation and anion. In the membranes cations are transported mainly by migration indicated by mig
cJ . Anions are more or less completely excluded from the cation-exchange membrane and their flux through the membrane by migration and diffusion in opposite direction is very small. It is expressed in the current utilization as will be discussed later. In the boundary layers at the membrane surfaces both cations and anions are also transported by migration, however, in opposite directions and thus, generating a concentration gradient leading to a diffusion of salt diff
sJ . In the diluate side of the membrane the diffusive flux is towards the membrane and at the concentrate side it is towards the bulk solution following the concentration gradients in the boundary layers. The different fluxes lead to a depletion of salt at the membrane surface in the diluate solution and an increase of the salt concentration at the membrane surface in the concentrate solution. In Figure 3 the symbols J and C denote the flux and the concentration, the superscripts mig and diff refer to migration and diffusion, the superscripts d and c refer to diluate and concentrate solution, and the superscripts b and m refer to bulk phase and membrane surface, respectively, the subscripts a and c refer to anion and cation.
________________
cathode anode
laminar boundary layer
bulk solution bulk solution
sJdiff
sJdiff
Jcmig
Jmig
Jcmig
Jcmig
JmigcbCs
a
a
Cds
m
csCm
dCsb
sJdiff
Fig. 3 Schematic drawing illustrating concentration profiles of a salt in the boundary layer on both sides
of a cation-exchange membrane and the fluxes of cations and anions in the boundary layer, and in the membrane.

40
The concentration polarization occurring in electrodialysis, i.e. the concentration profiles at the membrane surface can be calculated by a mass balance taking into account all fluxes in the boundary layer and the hydrodynamic conditions in the flow channel between the membranes. To a first approximation, however, concentration polarization phenomena in electrodialysis can be treated by applying the so-called Nernst film model which assumes that the solution in a cell between two membranes can be divided into a bulk phase between two laminar boundary layers at the membrane surfaces. The bulk solution between the laminar boundary layers is well mixed and has a uniform concentration, whereas the concentration in the boundary layers changes over the thickness. It is assumed that under steady state conditions in the bulk phase the electrical potential gradient is the only driving force for the flux of ions in the direction towards the membranes while in the boundary layer the concentration and electrical potential gradients perpendicular to the membrane surfaces are causing the mass transport. A mass balance taking into account the diffusion and migration of ions in the boundary layer leads to:
Fzi
Tdz
dCD
Fzi
TJJJi
si
di
ii
mi
mi
migi
diffi ������ (11)
Here J is the flux, D is the diffusion coefficient, T is the transport number, F is the Faraday constant, z is the valence, and dz is a directional coordinate, the subscript i refers to cat- or anions; the superscripts mig and diff refer to ion migration and ion diffusion, respectively, and the superscripts s, m and d refer to the solution, membrane, and diluate. Rearranging gives the current through an ion-exchange membrane as a function of the ion concentration gradient in the solution, i.e. in the boundary layer, the diffusion coefficient in the solution, and the transference numbers of the ion in the membrane and in the solution:
� � � � �zCC
TTzF D
dzdC
TTzF D
idi
mdi
b
im
ii
idi
im
ii
i �
��
�� (12)
Here �z is the boundary layer thickness, d
imd
ib CC and are the concentrations in the diluate in
the bulk and the membrane surface. Thus, Equation 12 relates the current density to the concentration gradient in the boundary
layer. 5.2. The Limiting Current Density, Causes and Consequences The consequences of concentration polarization in electrodialysis are twofold. In the diluate
containing cell the salt concentration at the membrane surface is decreased and in the concentrate containing cell increased. Both effects impair the technical feasibility and the economics of the process. When, due to concentration polarization, the salt concentration in the concentrate cell exceeds the solubility limits of the solution constituents, precipitation of salts occurs. When, due to concentration polarization, in the diluate containing cell the salt concentration at the membrane surface is reduced to zero there are no more salt ions available to carry the electric current. Thus, the voltage drop across the boundary layer increases drastically resulting in a higher energy consumption and in an electric field enhanced water dissociation. The consequence of the water dissociation is a loss of current utilization and drastic pH-value shifts, with an increase of the pH-value at the surface of the anion-exchange membrane in the concentrate containing cell and a decrease of the pH-value at the surface of the cation-exchange membrane. The increase in the

41
pH-value can lead to a precipitation of multivalent ions on the membrane surface. Thus, in a practical application of electrodialysis the concentration polarization effects should be minimized and especially water dissociation should be avoided. For a given cell design diluate concentration and flow conditions concentration polarization is determined by the current density. When the hydrodynamic flow conditions are kept constant the current density is limited. This maximum current density is reached when the salt concentration at the membrane surface in the diluate cell becomes 0. This current density is referred to as the limiting current density. Thus i = ilim for
0Csm � :
� � ��
����
�
���
zC
TTzFD
ids
b
cm
cc
slim (13)
The limiting current density can be determined by Equation 13 by assuming that the limiting
current density is reached when the salt concentration at the membrane surface in the diluate cell goes towards zero. Generally the thickness of the laminar boundary layer in an electrodialysis cell is difficult to measure experimentally. Therefore, in praxis generally an empirically derived expression is used to describe the limiting current density as a function of the feed flow velocity in the electrodialysis stack [5]. The limiting current density is expressed by:
ds
b Cua i lim � (14) Here d
sC is the concentration of the solution in the diluate cell, u is the linear flow velocity of the solution through the cells parallel to the membrane surface, and a and b are characteristic constants for a given stack design and must be determined experimentally. This is done in practice by measuring the limiting current density in a given stack configuration and constant feed solution salt concentrations as a function of the feed flow velocity.
Since the laminar boundary layers in a cell are very thin the concentration in the diluate cell is to a first approximation equal to the bulk concentration. Thus is d
sC � ds
b C .
The limiting current density can be determined by measuring the current as a function of the applied voltage across a membrane. The procedure is illustrated in Figure 4 which shows the current density measured through a cation-exchange membrane.
0
1
2
3
4
5
6
0 0.2 0.4 0.6 0.8 1 1.2
voltage drop [V]
curr
ent d
ensi
ty [
mA
cm
-2]
voltage drop [V]
limiting current density
curr
ent d
ensi
ty [m
A c
m -
2 ]
Fig. 4 Experimentally determined current versus voltage curve measured with a cation-exchange
membrane (CMX of Tokuyama Soda) in a 0.05 molar NaCl-solution [5].

42
The slope of the curve is inverse proportional to the electrical resistance of the solutions in the boundary layers at the membrane surfaces. The current versus voltage curve shows a more ore less linear increase of the current with an increase of the applied voltage up to a certain voltage drop and then the slope of the curve decreases drastically because of a drastic increase in the boundary layer resistance which is result of the depletion of the salt at the membrane surface. The current at the point is referred to as the limiting current density.
By measuring the limiting current density in a given stack design and diluate concentration the constants a and b can be determined from the slope of the curve which is obtained by plotting the limiting current density versus the solution flow velocity.
The measurement of the current versus voltage curve shown in Figure 4. is carried out with a single membrane in a laboratory type test cell. Measurements in a multi-cell stack often do not show such a clear indication of the change in the resistance when the limiting current density is exceeded. Therefore, Cowan and Brown [6] devised another analytical procedure for determining the limiting current density by plotting the overall resistance versus the reciprocal current density.
Additionally, a change in the pH-value in the diluate solution can be used to determine the limiting current density. When the limiting current density is exceeded a sharp drop in the pH-value of the diluate solution is observed.
5.3. The Current Utilization
In any practical electrodialysis process not all of the current flowing through the stack can be utilized for desalting the feed solution. Several factors may contribute to incomplete current utilisation in an electrodialysis stack: (1) the membranes are not perfectly selective, (2) there may be parallel current paths through the stack manifold, (3) there iswater transfer across the membranes due to osmosis and electroosmosis. The ratio of the salt transported through a membrane from a feed to a concentrate stream in reality to the theoretical current requirement is referred to as current efficiency which is given by:
wlmswFtot ������ �� (15)
Here � is an efficiency term, and the superscripts tot, F, ms, l, and w refer to total efficiency, Faraday efficiency, membrane permselectivity, current leakage through the manifold, and water transport through the membranes. The efficiency terms �ms, �l, and �w
are all defined in such a way that under ideal conditions they approach 1.
The total efficiency is the product of Faraday efficiency which is given by the membrane selectivity and current leakage through the manifold, and the water transport due to osmosis and electroosmosis.
The total current utilization in an electrodialysis stack is expressed by the net removal of salt from a feed volume and the water transport efficiency. It is given by:
� � � �� �ds
fsw
cmw
amw
amcm
celltot CCVTTN �����
����
� �� 1
2� l
��� (16)

43
Here cm� and am� are the permselectivities and cmwT and am
wT the transport numbers of the
cation- and anion membranes, wV and fsC and d
sC are the partial molar volume of water and the salt concentrations in the feed and diluate.
For relatively dilute feed solutions, i.e. fsC < 0.1 mol L-1, the efficiency loss due to water
transfer is very low, i.e. �w � 1. However, for higher feed solution salt concentration the water transfer may effect the efficiency of electrodialysis quite significantly.
The current leakage through the manifold system depends on the difference between the diluate and concentrate salt concentration and on the stack design. In a well designed stack and for concentration differences between the concentrate and the diluate of less than a factor of 10 the efficiency loss due to current leakage can be neglected, i.e. �l � 1.
6. Electrodialysis process design
In addition to the actual stack and the power supply, an electrodialysis plant consists of several other components essential for a proper operation, such as pumps, process monitoring and control devices, and feed solution pretreatment equipment. Again, as in the design of the electrodialysis stack, there are several operating modes for the electrodialysis process. Depending on the feed solution composition and the product requirements electrodialysis units may be operated in a batch-type, in a continuous, or in a feed-and-bleed mode with partial recycle of the diluate and concentrate streams. Independent of the mode of operation there are two basic concepts of using electrodialysis in large scale applications. The first concept is referred to as the unidirectional electrodialysis[4] and the second as electrodialysis reversal [7].
In an unidirectional operated electrodialysis stack the electric field is permanently applied in one direction and the diluate and concentrate cells are also permanently fixed over the period of operation. Unidirectionally operated electrodialysis plants are rather sensitive to membrane fouling and scaling and often require a substantial feed solution pre-treatment and stack cleaning procedures in form of periodical rinsing of the stack with acid or detergent solutions. The unidirectional operating concept is no longer used in the desalination of brackish waters. Here generally electrodialysis reversal is applied which allows a good control of membrane fouling.
In the electrodialysis reversal operating mode which has been developed by Ionics Incorporated [7] the polarity of the electric field applied to the electrodialysis stack as the driving force for the transport of ions is reversed in certain time intervals. Simultaneously the flow streams are reversed, i.e. the diluate cell becomes the concentrate cell and vice versa with the result that matter that has been precipitated at the membrane surface will be redisolved and removed with the flow stream passing through the cell.
6.1. The Electrodialysis Stack and Process Design
An electrodialysis stack is composed of a multitude of cells placed in parallel between two electrodes as illustrated in Figure 5.

44
feed inlet
product outlet
feed inlet
product outleta)
b)
feed inlet
product outlet
feed inlet
product outlet
feed inlet
product outleta)
b)
electrode rinse solution
feed solution
diluate
concentrate
spacer
ion-exchangemembrane electrode
cell
electrode
feed solution
diluate cellconcentrate cell
Fig. 5 Schematic drawing illustrating the construction of a sheet-flow electrodialysis stack.
The different cells are separated by ion-exchange membranes. In alternating cells a feed
solution is concentrated and desalinated, respectively. A spacer-gasket arrangement separates the membranes and contain the manifolds to distribute the process fluids in the different compartments. A proper electrodialysis stack design should provide a maximum effective membrane area per unit stack volume and ensure equal and uniform flow distribution in each compartment. The spacer screen should provide a maximum of mixing of the solutions at the membrane surfaces and should cause a minimum in pressure loss. In praxis, two different stack types are used on a large scale. One is the so-called sheet-flow and the other the tortuous path-flow stack. In a sheet-flow electrodialysis stack the solution flow is in a straight path from the entrance to the exit ports, which are located on opposite sides in the gasket as indicated in Figure 6 a). In the tortuous path flow stack, the membrane spacer gaskets have a long serpentine cut-out which defines a long narrow channel for the fluid path which provides higher residence times of the solution in the cells even at high flow velocities. A sheet flow and a tortuous path flow spacer gasket are shown schematically in Figure 6 b).
Fig. 6 Concept of a a) sheet-flow and b) tortuous path flow electrodialysis spacer gasket.

45
The distance between the membrane sheets, i.e. the cell thickness, should be as small as possible to keep the energy consumption due to electrical resistance of the solutions as low as possible. In industrial-size electrodialysis stacks, membrane distances are typically between 0.3 to 2 mm. A spacer is introduced between the individual membrane sheets to support the membrane and to control the solution flow distribution.
Solution flow velocities in sheet-flow stacks are typically 3 to 10 cm s-1, whereas in tortuous path flow stacks the solution flow velocities are 15 to 50 cm s-1. Because of higher flow velocities and longer flow paths, higher pressure drops in the order of 2 to 3 bars are obtained in stacks with tortuous path flow spacers than in sheet-flow systems where pressure drops are between 0.5 and 2 bars. In a practical electrodialysis system, 200 to 1,000 cation- and anion-exchange membranes are installed in parallel to form an electrodialysis stack providing 100 to 500 cell pairs. At each end of a stack there is an end-plate that contains the electrodes. Depending on the feed solution composition and the product requirements electrodialysis units may be operated in a batch-type, in a continuous, or in a feed-and-bleed mode with partial recycle of the diluate and concentrate streams.
In practical applications two basic concepts of electrodialysis are used. One is referred to as the unidirectional electrodialysis and the other as electrodialysis reversal. In an unidirectional operated electrodialysis stack the electrical potential gradient across the stack is permanently applied in one direction and the diluate and concentrate cells are also permanently fixed over the period of operation. Unidirectionally operated electrodialysis plants are rather sensitive to membrane fouling and scaling and often require frequent stack cleaning procedures. In electrodialysis reversal the change of the electric potential across the stack is accompanied with a reversal of the flow streams, i.e. the diluate becomes the concentrate and vice versa as shown in the flow scheme of Figure 7.
In this operating mode, the polarity of the current is changed at specific time intervals ranging from a few minutes to several hours and the hydraulic flow streams are reversed simultaneously, i.e. the diluate cell will become the brine cell and vice versa.
The advantage of the reversed polarity operating mode is that precipitation in the brine cells will be redesolved when the brine cell becomes the diluate cell in the reverse operating mode. During the reversal of the polarity and the flow streams there is a brief period when the concentration of the desalted product exceeds the product quality specification. Thus, in electrodialysis reversal there is always a certain amount of the product lost to the waste stream.
product
off-spec product
electrode waste
electrode waste
concentrate blowdown
concentrate recycle
electrode feed
concentrate
feed inletfeed
FI
FI
CI
CIstack
CIinlet ���������
������������������
Fig. 7 Flow scheme of electrodialysis reversal in a continuous operating mode with the feed solution also
used as electrode rinse.

46
The main advantage of electrodialysis reversal is that suspended matters, polyelectrolytes, and multivalent salts that are precipitated on the membrane surfaces are removed when the polarity and the flow streams are reversed.
The degree of desalination that can be achieved in passing the feed solution through a stack is a function of the solution concentration, the applied current density, and the residence time of the solution in the stack which determines the process path length. If in a single process path the required product concentrations are not achieved electrodialysis can be operated as a multi-stage process, or a process with feed and bleed in which the diluate or the concentrate or both are partially recycled.
6.2. Mass Transport in an Electrodialysis Stack
The degree of desalination in electrodialysis can be expressed by a material balance between the feed, the concentrate, and the diluate solutions. It is a function of the residence time of the different solutions in the cells, i.e. the flow velocities of the solutions, the membrane area in a cell pair, and the applied current density. Calculation of the complete mass balance between the diluate and concentrate flow stream can be rather complex for multi-component solutions and high ion concentrations, which means high osmotic pressures and activity coefficients that deviate largely from 1 and the two flow streams having different flow velocities and directions. However, in many electrodialysis applications, e.g. in the desalination of brackish water the concentrate and diluate cells have identical geometries and flow conditions, i.e. the flow rate in both cells is co-current and of identical velocity. The transfer of ions in such a cell arrangement is illustrated in Figure 8 which shows a cell pair of an electrodialysis stack containing a diluate and concentrate flow stream parallel to the membrane surface in x-direction. The geometry of both cells are identical and the two flow streams have the same flow velocity. It is assumed that the concentration potential between the two flow streams due to different concentrations in the diluate and concentrate solutions is negligibly low compared with voltage drops due to the resistance of the solutions, and changes in the resistance of the solutions due to the boundary layer effects are also negligible. Finally it is assumed that all diffusion processes between the two flow streams can be neglected and the only driving force for the transport is the electrical potential gradient which is constant over the entire cell length.
Under the above stated assumption the degree of desalination of a given feed solution, i.e. the changes in the ion concentration in the diluate and concentrate cells in an area element expressed in equivalents can be calculated as a function of the solution properties, the applied voltage and the stack design by:
ss�c
sds JC ddCdC ���� (17)
Furthermore is: cellcell
s dAFQ
i �J � , YdxdAcell � , and � � cmam
ds
css
ds
cs
cell
rrCC�CC�
Ui
���
� (18)
Here i is the current density, F is the Faraday constant, � is the current utilization, Ucell is the applied voltage across the cell pair, dAcell is a cell pair area element, � is the thickness of the cell, �s is the equivalent conductivity of the solution, ram and rcm are the resistances of the anion- and
cation-exchange membranes, and dCsd and dCs
c are the concentration changes in a volume

47
element of the diluate and concentrate cell, d sC� is the concentration change in a volume element of the diluate and concentrate cell due to the ion flux through the membrane, Qcell is the flow stream in the diluate or concentrate cell, Y is the cell width, and dx is a distance change in direction of the flow stream parallel to the membrane surface, and �s is an average value for the
� �
concentratediluate
cell pair
(C , Q )fc cs
(C , Q )d ds
(C , Q )fd ds
(C , Q )c cs
amam cm
feed solution feed solution
x+dx x+dx
x xCs
�
x
y
z
Fig. 8 Schematic drawing illustrating the flow of a diluate and concentrate stream parallel to the membrane surface in a cell pair of an electrodialysis stack and the concentration change between diluate
and concentrate solution sC� due to the ion flux through the membrane.
Introducing Equation 17 into Equation 18 and integrating over the cell length leads to:
� �� �
��
��
cell
cellsds
fds
cmams
fcs
ds
fds
cs
FQYXUCCrr
CCCC
ln�
���
� (19)
Here fdsC and fc
sC are the concentrations of the diluate and the concentrate at the cell inlet, dsC
and csC are the concentrations of the diluate and the concentrate at the cell outlet, Y X and � are
the cell width, length and thickness.
The total flow of the diluate or concentrate solution through a stack is given by:
YuNQNQ cellst ��� (20)
Here Qst is the total solution flow of the diluate, respectively, the concentrate through the entire stack, Qcell is the flow through one cell, N is the number of cells in the stack, � is the thickness and Y the width of a cell, and u is the linear flow velocity in the cell.
The total voltage across the stack Ust is given by:

48
cellst NUU � (21)
Equations 19 to 21 give the relations between the various stack construction data such as cell length, cell width, and cell thickness, the solution properties such as the concentrations of the feed, the concentrate and the product, and their conductivity, the flow velocity in the cells and the applied voltage. But to design an electrodialysis stack for a certain plant capacity it must be taken into consideration that the current density cannot exceed the limiting current density.
Introducing the limiting current density and multiplying with the number of cell pairs in the stack gives the maximum voltage applied to the stack Ust,lim that should be exceeded in electrodialysis:
� ���
��
!���� cmam
dss
cs
ds
slimlim,st rr
CCCN
iU�
���
1 (22)
Here Ust,lim is the limiting applied voltage across a stack, ilim is the limiting current density dsC and d
sC are the concentrations in the diluate and concentrate solution, �s is the equivalent conductivity of the salt solution, ram and rcm are the area resistances of the anion- and cation-exchange membrane, � is the cell thickness, and " is the number of cell pairs in a stack.
Combination of Equations 20, 21 and 22 and rearranging gives the required membrane area of the complete stack as function of the applied voltage and the feed, the diluate and the concentrate solution, the cell geometry, the solution flow velocities
� �� �
� � lim
ds
cmamdss
cs
ds
ds
fds
cmams
fcs
ds
fds
cs
cellst� i
Yu�u�
rr�
C�CC
�
CCrr�
CCCC
ln
NA
��
��
!���
��
��
! ���
�
1
(23)
Here Ast is the total cell pair area installed in the stack, and Ncell is the number of cell pairs in the stack, fd
sC and fcsC are the concentrations of the diluate and the concentrate at the cell inlet,
dsC and c
sC are the concentrations of the diluate and the concentrate at the cell outlet, �s is the
equivalent conductivity of the salt solution, ram and rcm are the area resistances of the anion- and cation-exchange membrane, � is the cell thickness, i.e. the distance between the cation- and anion-exchange membrane, Y is the cell width, u is the linear flow velocity, F is the Faraday constant, ilim is the limiting current density, and � is the current utilization.
From the cell pair area required for a certain capacity plant and the cell dimensions the process path length can be determined by:
YA
L cellpp � (24)
Here is Lpp the process path length for a given plant capacity and cell dimensions. It becomes identical with the cell length X when desalination is achieved in one path through the cell.
49
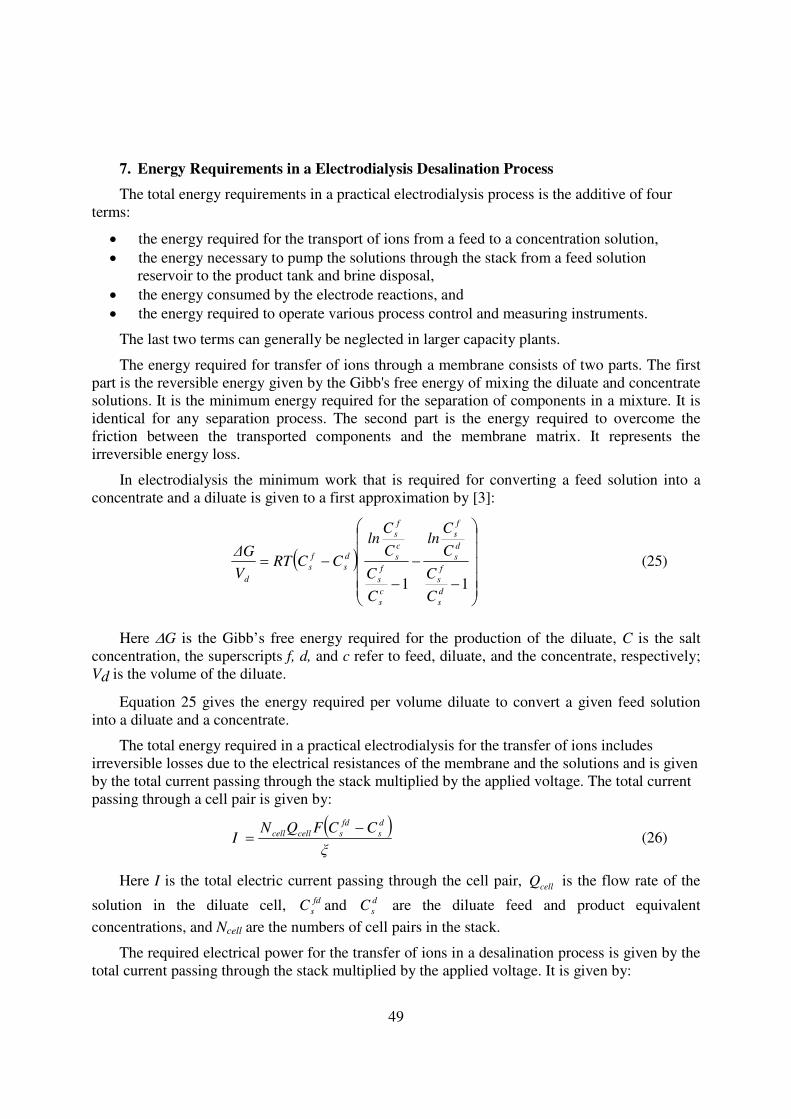
7. Energy Requirements in a Electrodialysis Desalination Process
The total energy requirements in a practical electrodialysis process is the additive of four terms:
� the energy required for the transport of ions from a feed to a concentration solution, � the energy necessary to pump the solutions through the stack from a feed solution
reservoir to the product tank and brine disposal, � the energy consumed by the electrode reactions, and � the energy required to operate various process control and measuring instruments.
The last two terms can generally be neglected in larger capacity plants.
The energy required for transfer of ions through a membrane consists of two parts. The first part is the reversible energy given by the Gibb's free energy of mixing the diluate and concentrate solutions. It is the minimum energy required for the separation of components in a mixture. It is identical for any separation process. The second part is the energy required to overcome the friction between the transported components and the membrane matrix. It represents the irreversible energy loss.
In electrodialysis the minimum work that is required for converting a feed solution into a concentrate and a diluate is given to a first approximation by [3]:
� ������
�
�����
�
�
�
�
�
��
11ds
fs
ds
fs
cs
fs
cs
fs
ds
fs
d
CC
CC
ln
CC
CC
lnCCRT
V�G
(25)
Here �G is the Gibb’s free energy required for the production of the diluate, C is the salt
concentration, the superscripts f, d, and c refer to feed, diluate, and the concentrate, respectively; Vd is the volume of the diluate.
Equation 25 gives the energy required per volume diluate to convert a given feed solution into a diluate and a concentrate.
The total energy required in a practical electrodialysis for the transfer of ions includes irreversible losses due to the electrical resistances of the membrane and the solutions and is given by the total current passing through the stack multiplied by the applied voltage. The total current passing through a cell pair is given by:
� ��
CCFQNI
ds
fdscellcell �
� (26)
Here I is the total electric current passing through the cell pair, cellQ is the flow rate of the
solution in the diluate cell, fdsC and d
sC are the diluate feed and product equivalent concentrations, and Ncell are the numbers of cell pairs in the stack.
The required electrical power for the transfer of ions in a desalination process is given by the total current passing through the stack multiplied by the applied voltage. It is given by:

50
� �
cellcell
ds
fdscell
cellcelldes UN�
CCFQIUNP
��� (27)
Introducing Equations 18 and 19 into Equation 27 and rearranging gives the power requirements for the desalination process in a stack:
� �� � 2
��
��
! �
����
�
�
����
!
���
���
CCFQrr
CC�
CC
CC
ln�
AN
IUNPds
fds
dcellcmam
ds
fdss
ds
cs
fcs
fds
cell
cellcellcelldes (28)
Multiplying the power requirements with the time of operation gives the energy required for the amount of product obtained in this time:
� �� � 2
��
��
! �
����
�
�
����
!
���
���
CCFQrr
CC�
CC
CC
ln�
AtN
t IUNEds
fds
dcellcmam
ds
fdss
ds
cs
fcs
fds
cell
cellcellcelldes (29)
Thus, the specific energy required for an unit volume product is:
� �� � 2
��
��
! �
����
�
�
����
!
���
���
CCFQrr
CC�
CC
CC
ln�
QAN
Q IUN
Eds
fds
dcellcmam
ds
fdss
ds
cs
fcs
fds
stcell
cell
st
cellcelldes/spec. (30)
Here Edes and Edes/spec are the desalination costs for the desalination in electrodialysis and the cost per unit volume product, I is the total current and Ucell the voltage per cell, Ncell is the number of cell pairs in a stack, t is the time of operation; fd
sC and fcsC are the equivalent concentrations of
the diluate and the concentrate at the cell inlet, dsC and c
sC are the concentrations of the diluate and the concentrate at the cell outlet, �s is equivalent conductivity of the salt solution, ram and rcm are the area resistances of the anion- and cation-exchange membrane, � is the cell thickness, � is the current utilization, and Qcell and Qst are the diluate flow velocities in a cell and in the entire stack, respectively, Acell is the cell pair area. The energy needed to pump the various flow streams through the stack is given by:
� �d
eeccdd
d
pspec/p Q
pQpQpQtQ
EE
��� ���� effk (31)
Here Ep/spec is the total energy per unit diluate water for pumping the diluate, the concentrate, and the electrode rinse solution through the stack, keff is an efficiency term for the pumps, and Qd, Qc, and Qe are the volume flow rates of the diluate, the concentrate, and the electrode rinse solution through the stack.
The energy consumed by the electrode reaction and required for the operation of the control and measuring instruments are generally neglected or taken as a fixed item which is between 1 and 3% of the energy used for the ion transfer and pumping of the solutions

51
8. Electrodialysis Processes Costs The total production costs in electrodialysis are the sum of fixed charges associated with
amortization of the plant investment costs and of operating costs such as energy and maintenance requirements.
The investment costs include non-depreciable items such as land and depreciable items such as the electrodialysis stacks, pumps, electrical equipment, monitoring and control devices, and membranes. The required membrane area for a given capacity plant is inverse proportional to the current density and is direct proportional to the quantity and quality of the product from a given feed solution.
The total operating costs of the electrodialysis plant include energy and maintenance costs and all pre- and post-treatment procedures. They are also a function of the membrane properties, feed and product composition, and several process and equipment design parameters such as stack construction. A dominant role in electrodialysis process costs plays the applied current density since it effects the investment costs as well as the energy costs directly. The required membrane area is decreasing with increasing current density while the consumed energy is increasing with the current density as shown in Equations 22 and 23. Thus, the total product costs which are the sum of energy costs, amortization and maintenance costs are a function of the current density and will reach a minimum at a certain current density. This is schematically shown in Figure 9. Here, the total process costs, the energy costs, the amortization on membrane and hardware investment, and the maintenance costs are shown as function of the applied current density. The optimum operating current density in electrodialysis depends to a large extent on the equipment, and especially on the membrane costs and life, and on the cost of energy. The current density to be applied in electrodialysis is determined by the limiting current density.
applied current density
membrane investment costs
energy costs
total process costs
cost
s
maintenance costs
Fig. 9 Schematic diagram illustrating the process costs in electrodialysis as a function of the applied current density.
In many applications, electrodialysis competes with other separation processes such as
reverse osmosis. Although the theoretically required minimum energy is identical in both processes, the irreversible energy dissipation differs considerably. The irreversible energy loss in reverse osmosis is caused by hydraulic resistance of the membrane to the water flux and is thus independent of the feed salt concentration. In electrodialysis the irreversible energy loss is caused

52
by the electrical resistance of the ions flux through the membrane, it is thus for a given product water concentration directly proportional to the feed water concentration. For feed solutions with low salt concentrations the energy requirements are therefore generally lower in electrodialysis than in reverse osmosis; with feed solutions having a high salt concentration the situation is reversed.
8.1. Calculation of an Electrodialysis Plant
The calculation procedure for designing an electrodialysis plant is based on a number of input parameters which consist of values related to a given stack geometry, solution properties, and operating strategies. The total process path length as calculated by Equation 24 is related to the path length of a given stack by:
ststprac NLL � (32)
Here are Lprac and Lst the practical process path length and the length of a stack, and Nst is the number of stacks in series in a plant.
The length of a stack is given by the manufacturer. The number of stacks in series Nst is 1 or a positive integer. This means that Equation 32 generally does not balance when the practical process path length is used. Therefore, the practical process path length must be adjusted to meet the requirements of Equation 32. The practical process path length is related to the product concentration, the feed concentration, the concentrate concentrations, the linear flow velocity, the limiting current density, etc. However, this relation cannot be solved for a desired product concentration and process path length explicitly, and an iteration must be executed based on an assumed value of the product concentration and length of the stack or the stacks in series.
Another important parameter for the design of a plant is the recovery rate applied in the process. The recovery rate determines which fraction of a feed solution is obtained as product, i.e.:
fprac
pprac
Q
Q� � (33)
Here � is the recovery rate, and ppracQ and f
pracQ are the flow rates of the product and the two feed solutions of the diluate and concentrate cell.
The recovery � rate has a value between 0 and 1. If in a stack, where the diluate and concentrate cells have identical geometries the recovery rate is 0.5, the product flow rate is identical to that of the concentrate. For any other recovery rate product and concentrate flow rates are different, and one flow stream must be operated in a feed and bleed mode to obtain identical linear flow velocities in the diluate and concentrate cells.
The concentrations of diluate and concentrate are related to the recovery rate by a mass balance. If identical flow velocities of the diluate and concentrate streams are assumed the required concentrations of the concentrate feed solution and the final concentration of the concentrate for a given diluate feed concentration and required product concentration are given by:

53
�
���
-1C C
Cds
fdsc
s and � � � �
�
���
�
���
1 2C1CC
cs
fdsfc
s (34)
The calculation procedure for the construction of a typical brackish water electrodialysis desalination plant is illustrated in the flow scheme of Figure 10.
number of stacks integer?
yes no
round up/downnumber of stacks
basic output data
corrected output data(path length, membrane area,number of cell pairs,flow velocity,voltage, current, current densityenergy consumption)
stack voltage and currentpower supply for desalination
feed and product concentration current efficiencyproduction raterecovery rateflow velocity
stack related input data
brine concentrationrequired cell pair areaprocess path lengthnumber of cell pairsvoltage and current density energy consumption
basic output data
solution propertiesmembrane propertiesstack geometry design parameters (#$%)limiting current constants(a,b,s)
operation relatedinput data
Fig. 10 Flow sheet illustrating the calculation procedure for an electrodialysis desalination plant.
The input data consist of values related to the plant hardware components such as the
membrane properties, the electrodialysis stack geometry including safety factors taking into account the current utilization and the effect of the spacer on the cell volume or the flow distribution, the feed and product solution concentrations, and the operating strategies such as feed flow velocities and recovery rate. Output data are the process path length, the number of stacks in series or in parallel, the total required membrane area, the limiting current density, the applied voltage, and the energy consumption. For the cost analysis energy required for pumping the solutions through the stack must be calculated and charges related to the total investment and operation must be estimated.

54
00.20.40.60.8
11.2
0 0.2 0.4 0.6 0.8
feed concentration [eq L-1]
spec
ific
cos
ts [U
S $
m-3]
total costs
desalting costs
membrane related costs
8.2. Product Water Costs The product water costs in the above described example calculation are made under certain
assumptions in terms of feed and product water quality, and equipment and energy costs. These items may vary substantially depending on feed water composition, plant capacity and location, etc. However, some general relations are true for all electrodialysis applications. The water production costs are increasing with the feed water salinity assuming a given product water quality as indicated in Equation 23 which relates the required membrane area to the feed solution concentration and Equation 29 which gives a relation between the desalination energy and the feed solution concentration. Pumping energy requirements and investment for equipment such as pumps, piping and control devices are independent of the feed solution concentration. The product water costs as function of the feed solution concentration assuming a constant product concentration are illustrated in Figure 11 which shows schematically the operating costs which also include the energy costs and the membrane area and other investment related costs as well as total desalination costs as function of the feed water concentration.
Fig. 11 Schematic diagram illustrating the electrodialysis desalination costs as function of the feed solution concentration assuming constant product concentration [5].
Figure 11 shows that both the operating and the investment related costs and thus the total product costs are strongly increasing with the feed solution concentration when the product concentration and all other parameters are kept constant. The absolute cost values are subject to plant capacity and location, costs of hardware components, labor costs, etc. Costs of water produced in a commercial electrodialysis desalination plant can vary significant, i.e. more than 50% from that given in the Figure 11.
References
1. Schaffer, L.H., Mintz, M.S. , 1966. Electrodialysis, in: Principles of desalination, edt.: Spiegler, K.S., pp. 3-20, Academic Press, New York.
2. Bergsma, F., Kruissink, CH.A., 1961. Ion-exchange membranes, Fortschr. Hochpolym.- Forsch., 21: 307-362.
3. Strathmann, H., 2004. Ion-exchange Membrane Separation Processes, Elsevier, Amsterdam 4. Spiegler, K.S., Laird, A.D.K., edts., 1980. Principles of desalination, 2nd edition, Academic
Press, New York. 5. Lee, H.J., Safert, F. Strathmann, H., Moon, S.H., 2002. Designing of an electrodialysis
desalination plant, Desalination, 142: 267-286. 6. Wilson, J.R., edt., 1960. Demineralization by electrodialysis, Butterworth Scientific
Publications, London. 7. Katz, W.E., 1979. The electrodialysis reversal (DER) process, Desalination,, 28: 31-40.