ASSESSMENT OF CLIMATE INDICES IN DRYLANDS … classification using Bagnouls - Gaussen..... 92 Table...
123
ASSESSMENT OF CLIMATE INDICES IN DRYLANDS OF COLOMBIA Fredy Hernando NEIRA MENDEZ
Transcript of ASSESSMENT OF CLIMATE INDICES IN DRYLANDS … classification using Bagnouls - Gaussen..... 92 Table...
ASSESSMENT OF CLIMATE INDICES IN DRYLANDS OF COLOMBIA
Fredy Hernando NEIRA MENDEZ
“Con el apoyo del Programa Alßan, Programa de becas de alto nivel de la Unión Europea para América Latina, beca nº E04M034769CO”
“Supported by the Programme Alßan, the European Union Programme of High Level Scholarships for Latin America,
scholarship No.(E04M034769CO)”.
Al artífice de mi existencia,
A Mery y Ricardo los Autores de mis días
A Ada, Julian y Juan
ACKNOWLEDGEMENTS
This work has been possible thanks to the contributions of many people.
First I owe my special gratitude to the ALBAN programme for the funding to develop
this Master Programme in Europe. I wish to gratefully acknowledge the invaluable help of
my promoter Prof. Dr. ir. Donald Gabriels for his guidance and supervision and his interest in
study desertification in Latin America.
I want to give special thanks to the IDEAM, University of Valle in Colombia and the
PHI-LAC project for supporting me with data of meteorological stations. Specially thanks to
Yesid Carvajal and Martha Liliana in Cali, Colombia.
I also want to give my thanks to my friends Wim Verstraete and Vernon Dabalos for
their help and support.
The support, love and sacrifice of my family and friends from Colombia.

ABSTRACT
Climate indices are used to determine drylands in seven different geographical zones
of Colombia. These zones are selected from previous studies as the areas with land
degradation and desertification problems. With secondary information of 391 stations the
following indices are evaluated: Lang (1915), Thornthwaite (1948), De Martonne (1926),
Emberger (1930), UNEP (1997) and Bagnouls-Gaussen (1957). From those, only the Lang,
UNEP and Thornthwaite indices show drylands in Colombia although all of them result in
different classification for each region.
Aggressivity of rainfall is evaluated using the Modified Fournier Index (MFI)
(Arnoldus, 1980). The Caribbean, Magdalena, Santanderes and Nariño are the zones with
higher aggressivity of rainfall. The Guajira zone however has index values between low and
very low aggressivity.
Seasonality of rainfall is evaluated using the Precipitation Concentration Index (PCI)
(Oliver, 1980). For almost all the zones, the areas with high seasonality are those classified as
dry lands, and the areas with low seasonality are the more humid ones.
The Erosivity index (ErIn) is estimated using the CORINE (1995) methodology. The
Caribbean zone shows a high erosivity index. Santanderes, Nariño and Magdalena zones have
moderate to high values. The Guajira and Cauca zones have dominant moderate values and the
Cundiboyacense between low to moderate erosivity.
SAMENVATTING
Klimaatindexen worden gebruikt voor het bepalen van ‘droge gebieden’ in
verschillende geografische zones van Colombia. Deze zones werden geselekteerd uit
vroegere studies als gebieden onderhevig aan landdegradatie en desertificatie problemen. Met
meteorologische gegevens van 391 weerstations worden de volgende indexen berekend:
Lang (1915), Thornthwaite (1948), De Martonne (1926), Emberger (1930), UNEP (1997) en
Bagnouls-Gaussen (1957). Enkel de Lang, UNEP en Thornthwaite indexen toonden de
‘droge gebieden’ in Colombia aan, alhoewel met al de indexen verschillende ariditeitsklassen
werden bekomen.
De aggresiviteit van de neerslag werd geëvalueerd met de ‘Aangepaste Fournier
Index (Modified Fournier Index MFI) (Arnoldus, 1980). De Caribbean, Magdalena,
Santanderes en Nariño zijn de zones met de hoogste neerslagaggressiviteit. De Guarjira zone
heeft evenwel een lage tot zeer lage neerslagaggressiviteit.
De seizoensverdeling van de neerslag werd geëvalueerd door middel van de Neerslag
Concentratie Index (Precipitation Concentration Index PCI) (Oliver, 1980). Voor nagenoeg al
de zones werden de gebieden met de hoogste seizoensverdeling geklasseerd als ‘droge
gebieden’, de zones met weinig (laag) seizoensverdeling zijn dan meer humied.
De erosiviteitsindex (ErIn) werd bepaald volgens de CORINE (1995) methode. De
Caribbean zone heeft een hoge erosiviteitsindex. Santanderes, Nariño en Magdalena hebben
middelmatige tot hoge waarden. Ook de Guajira en Cauca zones hebben overwegend
middelmatige waarden terwijl in de Cundiboyacense zone er een laag tot middelmatige
erosivitiet heerst.

i
ILLUSTRATIONS
LIST OF FIGURES
Figure 1. Location of Colombia in South America................................................................. 15
Figure 2. Main Natural Regions of Colombia (IGAC, 1999) ................................................ 15
Figure 3. Micro Regions of Colombia (IGAC, 1999)............................................................ 16
Figure 4. Lang climate classification of Colombia (IDEAM, 2001) ..................................... 21
Figure 5. De Martonne classification of Colombia (IDEAM, 2001) ..................................... 22
Figure 6. Thornthwaite classification of Colombia (IDEAM, 2001)..................................... 23
Figure 7. Average Annual Precipitation Distribution in Colombia (IDEAM, 2001) ............. 24
Figure 8. Land use and cover in Colombia (IGAC, 2003)..................................................... 28
Figure 9. Main processes of soil degradation in Colombia (IDEAM 2001)........................... 29
Figure 10. Zones with potential of desertification in Colombia (IDEAM, 2001). ................ 32
Figure 11. Location of the study zones................................................................................... 34
Figure 12. Location of meteorological stations and precipitation distribution in the Guajira
zone ................................................................................................................................. 43
Figure 13. Location of climate stations and precipitation distribution in the Caribbean
plateaus ........................................................................................................................... 45
Figure 14. Precipitation distribution and meteorological stations in the Santanderes and Cesar
zone ................................................................................................................................. 46
Figure 15. Precipitation distribution and climate stations in the Cundiboyacense high plateau
......................................................................................................................................... 47
Figure 16. Precipitation distribution and meteorological stations in the High Magdalena River
basin ................................................................................................................................ 48
Figure 17. Precipitation distribution and meteorological stations in the Cauca valley .......... 49
Figure 18. Precipitation distribution and climate stations in Nariño and Popayan high
plateaus ........................................................................................................................... 50

ii
Figure 19. Climate classifications of the Guajira peninsula .................................................. 52
Figure 20. Omberothermic curves for the Guajira peninsula ................................................ 54
Figure 21. Climate classifications of the Caribbean plateaus ................................................ 58
Figure 22. Bagnouls - Gaussen Index distribution in the Caribbean plateaus ....................... 59
Figure 23. Omberothermic curves for some stations of the Caribbean plateaus ................... 60
Figure 24. Climate classifications of the Santanderes and Cesar zone................................. 63
Figure 25. Bagnouls - Gaussen Index distribution in the Santanderes and Cesar zone......... 64
Figure 26. Omberothermic curves different stations in the Santanderes and Cesar .............. 65
Figure 27. Climate classifications of the Cundiboyacense high plateau ............................... 68
Figure 28. Bagnouls - Gaussen Index distribution in the Cundiboyacense High plateau...... 69
Figure 29. Omberothermic curves for the Cundiboyacense high plateau.............................. 70
Figure 30. Tatacoa named “desert”........................................................................................ 73
Figure 31. Climate zones of the High Magdalena River basin .............................................. 74
Figure 32. Bagnouls - Gaussen Index distribution in the High Magdalena River basin ....... 75
Figure 33. Omberothermic curves for the Magdalena river basin ......................................... 76
Figure 34. Climate classifications of the Cauca valley.......................................................... 78
Figure 35. Bagnouls - Gaussen Index distribution in the Cauca valley................................. 79
Figure 36. Omberothermic curve for the Cauca valley.......................................................... 80
Figure 37. Climate classifications of the Nariño and Popayan high plateaus........................ 83
Figure 38. Bagnouls - Gaussen Index of Nariño and Popayan ............................................. 84
Figure 39. Omberothermic curves for the Nariño and Popayan high plateaus ...................... 85
Figure 40a -40b. Linear relationship between PCI1 and PCI2 in the study zones ............... 87
Figure 41. Seasonal and Temporal Rainfall Distribution of the Guajira peninsula............... 88
Figure 42. Seasonal and Temporal Rainfall Distribution in the Caribbean plateaus............. 89
Figure 43. PCI Distribution in the Santanderes and Cesar zone............................................ 90
Figure 44. PCI Distribution in the Cundiboyacense high plateau ......................................... 90
Figure 45. PCI Distribution in the High Magdalena River Basin.......................................... 91
Figure 46. Distribution of the PCI in the Cauca valley.......................................................... 91
Figure 47. Distribution of the PCI in the Nariño and Popayan high plateaus ....................... 92
Figure 48. Linear relationship between MFI1 and MFI2 for all the regions ........................ 93
Figure 49. Distribution of the MFI in the Guajira peninsula .................................................. 94

iii
Figure 50. Distribution of the MFI in the Caribbean plateaus............................................... 95
Figure 51. Distribution of the MFI in the Santanderes and Cesar zone................................ 95
Figure 52. Distribution of the MFI in the Cundiboyacense high plateau ............................ 96
Figure 53. Distribution of the MFI in the High Magdalena River Basin............................... 96
Figure 54. Distribution of the MFI in the Cauca valley.......................................................... 97
Figure 55. Distribution of the MFI in the Nariño and Popayan high plateaus...................... 97
Figure 56. Distribution of “ErIn” for the Guajira and Caribbean zones................................ 99
Figure 57. Distribution of “ErIn” for the Santanderes and Magdalena zones ....................... 99
Figure 58. Distribution of “ErIn” for the Cundiboyacense and Cauca zones...................... 100
Figure 59. Distribution of “ErIn” for the Nariño and Popayan high plateaus ..................... 100
LIST OF FIGURES
Table 1. Distribution of Soil Orders in Colombia (IGAC, 2000). ........................................ 27
Table 2. Percentage of area affected by erosion in Colombia (IDEAM, 2001).................... 30
Table 3. Degree of land degradation by aridity and erosion in Colombia (MinAmbiente,
2000) ............................................................................................................................... 31
Table 4. Climate types proposed by Richard Lang (1915) .................................................... 36
Table 5. Climate types proposed by De Martonne (1923).................................................... 37
Table 6. Climate types of Emberger (1932).......................................................................... 38
Table 7. Thornthwaite climate classification (1948) ........................................................... 38
Table 8. UNEP (1997) Climate classification....................................................................... 39
Table 9. BGI climate classification (1952) .......................................................................... 40
Table 10. Precipitation Concentration Index classification .................................................. 41
Table 11. Modified Fournier Index scale............................................................................. 41
Table 12. Variability class of Modified Fournier Index ....................................................... 42
Table 13. Aridity class of BGI.............................................................................................. 42
Table 14. Erosivity Index (ErIn) ........................................................................................... 42
Table 15. Aridity indices of Guajira peninsula..................................................................... 51
Table 16. Bagnouls - Gaussen climate classification for the Guajira peninsula.................. 54
iv
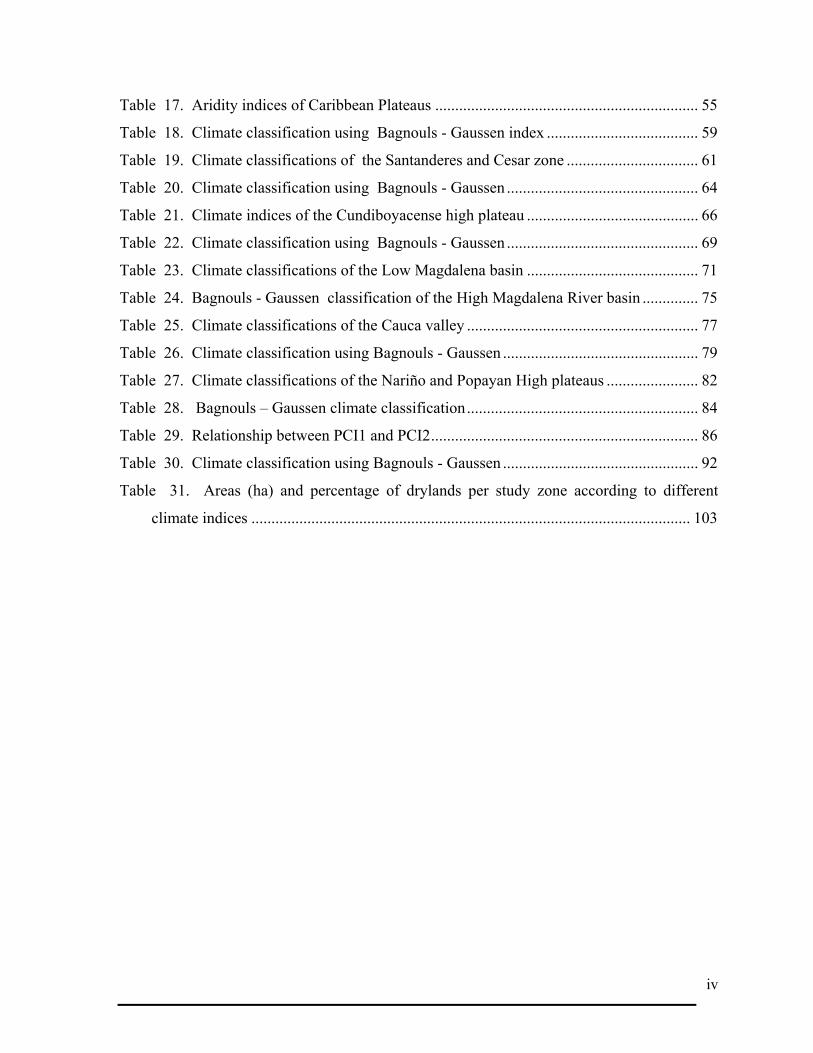
Table 17. Aridity indices of Caribbean Plateaus .................................................................. 55
Table 18. Climate classification using Bagnouls - Gaussen index ...................................... 59
Table 19. Climate classifications of the Santanderes and Cesar zone ................................. 61
Table 20. Climate classification using Bagnouls - Gaussen ................................................ 64
Table 21. Climate indices of the Cundiboyacense high plateau ........................................... 66
Table 22. Climate classification using Bagnouls - Gaussen ................................................ 69
Table 23. Climate classifications of the Low Magdalena basin ........................................... 71
Table 24. Bagnouls - Gaussen classification of the High Magdalena River basin .............. 75
Table 25. Climate classifications of the Cauca valley .......................................................... 77
Table 26. Climate classification using Bagnouls - Gaussen ................................................. 79
Table 27. Climate classifications of the Nariño and Popayan High plateaus ....................... 82
Table 28. Bagnouls – Gaussen climate classification.......................................................... 84
Table 29. Relationship between PCI1 and PCI2................................................................... 86
Table 30. Climate classification using Bagnouls - Gaussen ................................................. 92
Table 31. Areas (ha) and percentage of drylands per study zone according to different
climate indices .............................................................................................................. 103

v
TABLE OF CONTENTS
1. INTRODUCTION 1
1.1. OBJECTIVES 2
1.2. LIMITATIONS 3
2. LITERATURE REVIEW 4
2.1. DRYLANDS 4
2.1.1. Hyperarid environments 5
2.1.2. Arid areas 6
2.1.3. Semiarid areas 6
2.1.4. Dry Subhumid areas 6
2.2. EROSION 7
2.2.1. Types of soil erosion 8
2.2.2. Universal Soil Loss Equation (USLE) 9
2.2.3. Erosivity indices 12
3. GENERAL DESCRIPTION OF COLOMBIA 14
3.1. NATURAL REGIONS OF COLOMBIA 14
3.1.1. Caribe Region 17
3.1.2. Pacific Region 18
3.1.3. Andes Region 18
3.1.4. Orinoquia Region 19
3.1.5. Amazonas region 19
3.1.6. Insular region 19
3.2. CLIMATE OF COLOMBIA 20
3.3. SOILS OF COLOMBIA 25
3.4. LAND USE 27
3.5. LAND DEGRADATION IN COLOMBIA 28
3.5.1. Erosion 29
vi
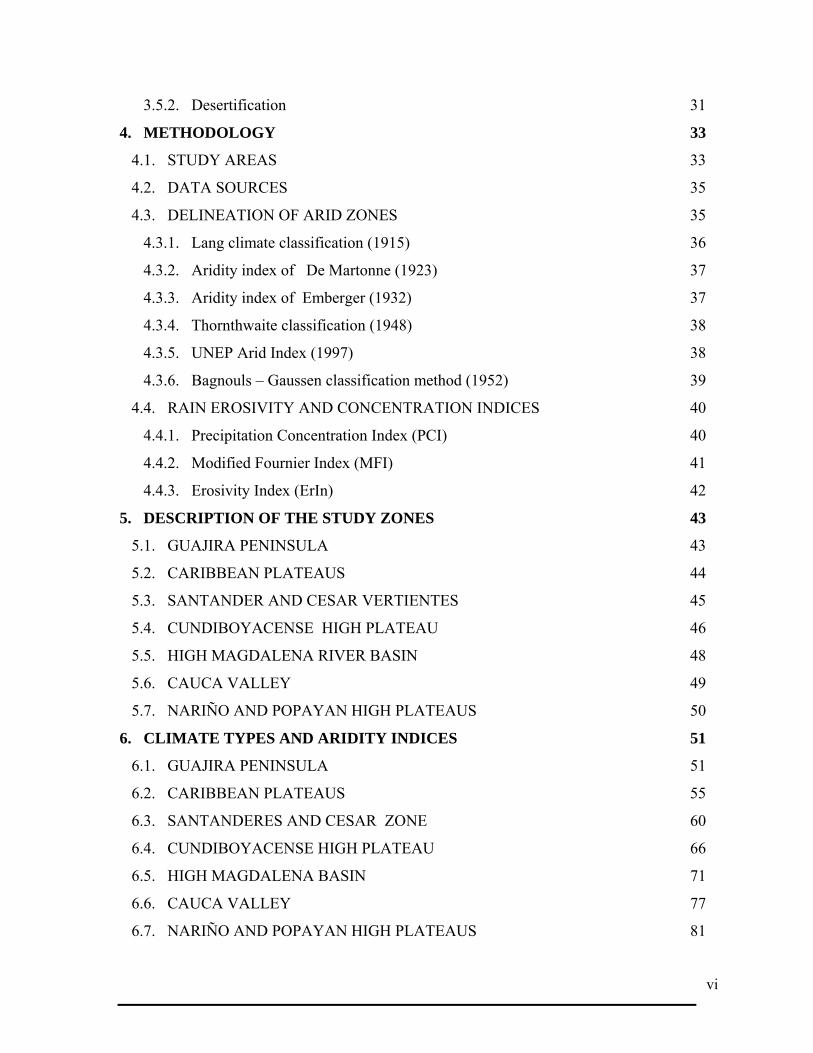
3.5.2. Desertification 31
4. METHODOLOGY 33
4.1. STUDY AREAS 33
4.2. DATA SOURCES 35
4.3. DELINEATION OF ARID ZONES 35
4.3.1. Lang climate classification (1915) 36
4.3.2. Aridity index of De Martonne (1923) 37
4.3.3. Aridity index of Emberger (1932) 37
4.3.4. Thornthwaite classification (1948) 38
4.3.5. UNEP Arid Index (1997) 38
4.3.6. Bagnouls – Gaussen classification method (1952) 39
4.4. RAIN EROSIVITY AND CONCENTRATION INDICES 40
4.4.1. Precipitation Concentration Index (PCI) 40
4.4.2. Modified Fournier Index (MFI) 41
4.4.3. Erosivity Index (ErIn) 42
5. DESCRIPTION OF THE STUDY ZONES 43
5.1. GUAJIRA PENINSULA 43
5.2. CARIBBEAN PLATEAUS 44
5.3. SANTANDER AND CESAR VERTIENTES 45
5.4. CUNDIBOYACENSE HIGH PLATEAU 46
5.5. HIGH MAGDALENA RIVER BASIN 48
5.6. CAUCA VALLEY 49
5.7. NARIÑO AND POPAYAN HIGH PLATEAUS 50
6. CLIMATE TYPES AND ARIDITY INDICES 51
6.1. GUAJIRA PENINSULA 51
6.2. CARIBBEAN PLATEAUS 55
6.3. SANTANDERES AND CESAR ZONE 60
6.4. CUNDIBOYACENSE HIGH PLATEAU 66
6.5. HIGH MAGDALENA BASIN 71
6.6. CAUCA VALLEY 77
6.7. NARIÑO AND POPAYAN HIGH PLATEAUS 81

vii
7. RAINFALL AGGRESSIVITY INDICES 86
7.1. PRECIPITATION CONCENTRATION INDEX (PCI) 86
7.2. MODIFIED FOURNIER INDEX (MFI) 92
7.3. EROSIVITY INDEX of CORINE (1995) 98
8. CONCLUSIONS 101
9. REFERENCES 106

Introduction
1
1. INTRODUCTION
In Colombia drylands have been estimated using different climate classifications.
Most of them have been applied in different latitudes and are very accurate for temperate
regions. As Colombia is located in the equatorial and tropical zones it is necessary to
evaluate the most accurate indices to determine drylands in this latitudes.
Drylands are related to land degradation processes which make them susceptible to
desertification. When erosion occurs in drylands becomes into desertification, which can be
a serious problem due to the irreversibility of the process. Water erosion is the main soil
degradation process in Colombia, reducing the productive capacity of the soils and the
irreversible loss of other natural resources.
The magnitude of the erosion problem and the degree of development depends of
factors such as slope, soil cover, management practices and soil type and rainfall which
determine erodibility and erosivity respectively.
This study is done in order to analyse relationships between different arid indices
applied for Colombia, using meteorological data of some of the main areas considered
“dry” by the National Institute of Meteorology and Environment “IDEAM”. Drylands
differ from one to another classification system, but in most of them cover approximately
one fourth of the country as drylands. For this study seven zones are selected from those
which are declared “in process of desertification” by the Ministry of Environment in
Colombia. The study zones are “The Guajira Peninsula”, “The Caribbean plateaus”,
“Santander and Cesar”, “The Cundiboyacense high plateau”, “The High Magdalena river
basin”, “The Cauca valley” and ·the Nariño and Popayan high plateaus”.
Climate data of those regions was collected from secondary studies, using 391
meteorological stations from the years 1971 to 2000.

Introduction
2
The climate indices used to determine drylands are: Lang (1915), Thornthwaite
(1948), De Martonne (1923), Emberger (1932), UNEP (1997) and Bagnouls - Gaussen
(1952).
Aggressivity of rainfall or erosivity will be evaluated using the Modified Fournier
Index (MFI). The Precipitation Concentration Index (PCI) will be used to estimate the
temporal variation of the monthly rainfall.
Finally, the Erosivity index will be estimated using CORINE methodology (1995),
which is based on the Modified Fournier Index and the Bagnouls - Gaussen Index.
1.1. OBJECTIVES
The main objective of this study is to determine an arid index showing the best
representation for different regions in Colombia.
A comparison is made between the climate indices of De Martonne (1923), UNEP
(1997), Thornthwaite (1948), Lang (1915), Emberger (1932) and Bagnouls-Gaussen (1952)
for delineating the climate zones.
An evaluation is made of the erosivity of the rainfall using the Modified Fournier
Index (MFI), the rain distribution using the Precipitation Concentration Index (PCI) and the
erosivity index proposed by the CORINE project (1995) methodology.
A delineation of drylands prone to desertification is made at a regional level in
Colombia using different aridity indices.
Introduction
3
1.2. LIMITATIONS
Although there are more climate data available, only the meteorological stations
that record data from three decades were used. Different events as El Niño and La Niña
were not analyzed.
Drylands in Colombia are not really delineated. Several studies show different areas
which are considered dry but all of them vary according to the methodology or the
classification system used. In this study the boundaries of the drylands were selected from
the micro regions study, which was done at a national scale, and those regions are not
completely homogeneous in climate characteristics.
Delineation of climate has been done using an interpolation method but the effect of
relief and winds over precipitations is not studied.
Literature review
4
2. LITERATURE REVIEW
2.1. DRYLANDS
The term “drylands” refers to lack of water or water deficit in the soil to support
primary production and nutrient cycling. The definition implies that the moisture input
given by precipitation is lower than the moisture losses through evapotranspiration during
one part of the year or even all the year around and in successive years.
Drylands can experience large in between-year variability in precipitation and they
are not uniform. They differ in degree of moisture limitation and in the period they
experience. Drylands can be classified based on climate and environmental attributes but
their boundaries are neither static nor abrupt due to the high inter-annual variability in
mean rainfall and to the occurrence of droughts that can last for several years (Gabriels,
2006).
The United Nations Convention to Combat Desertification UNCCD approach
recognized four drylands subtypes: dry-subhumid, semiarid, arid and hyperarid drylands,
based on an increasing level of aridity or moisture deficit. The level of aridity is given by
the ratio of the mean annual precipitation to the mean annual potential evapotranspiration
which is the amount of moisture that, if it were available, would be removed from a given
land area by evaporation and transpiration. The long-term mean of this ratio is termed the
"Aridity Index" (AI). Drylands are areas with an AI value of less than 0.65 (UNEP, 1997).
Susceptible drylands are those other than polar and sub polar with an AI between
0.05 and 0.65 which are arid, semiarid and dry-subhumid areas susceptible to
desertification (Gabriels, 2006).
Literature review
5
Drylands occurs in 40 percent of the earth’s surface with 20 percent of the global
population (UNEP, 1997). Drylands are vulnerable to degradation and to natural droughts
which induce stresses on plant, animal and human population. Land degradation processes
occurring in drylands, induced by both human activities and climate changes, called
“desertification”.
In Latin America, the population living in drylands, as reported by UNDP/UNSO in
1997 was about 120 million or 29% of the total population. The same source reports for
that time 103 million ha classified as arid (5%); 285 million ha as semiarid (14%) and 150
million ha as dry subhumid (7.5%) of a total of 538 million ha (26.5%) classified as
drylands.
For Latin America, Dregne (1991) reports a total area of 306 million ha affected by
desertification, which is approximately 17% of the total land area and around 72% of all
used drylands. For the same sub-continent, the project UNEP/GLASOD reports in 1997
that about 79 million ha of drylands are affected by human-induced soil degradation, 4.5%
of total Latin American land area.
2.1.1. Hyperarid environments
These zones are considered “the true deserts” and are not considered prone to
desertification, with a very limited and highly variable rainfall amounts (up to 100%) on a
monthly basis without seasonal inter annual rainfall regime. Those areas have year-long
periods without rainfall. The aridity index (P/ETP) is less than 0.05 (AI<0.05). The annual
precipitation in winter rainfall is less than 50 mm and in summer rainfall less than 100 mm.
Perennial vegetation is largely confined to river beds, with some growth of annual plants in
favourable sites. Grazing is severely restricted or impossible and irrigation must be
practiced.
Literature review
6
2.1.2. Arid areas
Those areas are characterized by a mean annual precipitation between 50 - 200 mm
per year in winter rainfall areas and 100 - 300 mm in summer rainfall areas. Inter annual
variability is between 50 to 100 % range. Use of underwater resources is highly susceptible
to climate variability and pastoralism is possible but without mobility (AI = 0.03-0.2). The
vegetation includes woody shrubs, succulents, some perennial grasses and many annual
grasses. Grazing and irrigation is practiced, rainfed cropland does not occur.
2.1.3. Semiarid areas
Those areas have high seasonal rainfall regimes and mean values up to 600 mm in
summer rainfall areas and 500 mm in winter regimen. Interannual variability is between 25
to 50 %. Grasslands and sedentary agriculture are susceptible to seasonal and inter annual
moisture deficiency. AI = 0.2 – 0.5. The main land use is grazing, extensive rainfed
cropland in wetter parts. Typical coverage are grasslands, shrubs and woodlands.
2.1.4. Dry Subhumid areas
Areas with highly seasonal rainfall regimes and with less than 25% of inter annual
variability. Those areas are also susceptible to degradation caused by seasonality of the
rainfall, drought periods and intensive with human use. AI = 0.2 – 0.65. Typical
vegetations are grasslands, savannahs, woodlands, with rainfed cropland and grazing. Mean
precipitation values of 500-850 during winter rainfall and from 600 to 1000 in the summer
rainfall.

Literature review
7
2.2. EROSION
Soil erosion is the detachment and movement of soil particles by the erosive forces
of wind or water. Soil detached and transported away from one location is often deposited
at some other place. While soil erosion can be controlled, it is almost impossible to stop
completely. The process may be natural or accelerated by human activity. Depending on
the local landscape and weather conditions, erosion may be very slow or very rapid (Soil
Survey Staff, 1993).
Soil erosion can be natural or of human origin. Erosion that takes place naturally,
without the influence of human activity, is termed geological or natural erosion (Brady,
2002). Accelerated erosion is largely the consequence of human activity. The primary
causes are tillage, grazing, and cutting of timber.
Water erosion results from the removal of soil material by flowing water. A part of
the process is the detachment of soil material by the impact of raindrops. The soil material
is suspended in runoff water and carried away. Four kinds of accelerated water erosion are
commonly recognized: sheet, rill, gully, and tunnel (piping).
The mechanics of soil erosion by water occurs in three steps (Brady, 2002):
- Detachment of soil particles from the soil mass by raindrop impact
- Transportation of the detached particles downhill by floating, rolling, dragging and
splashing.
- Deposition of the transported particles at some lower place in the landscape.

Literature review
8
2.2.1. Types of soil erosion
Natural erosion
Natural erosion is a process that transforms soils into sediment. Soil erosion that
takes place naturally, without the influence of human activity, is termed geological erosion
(Brady, 2002). It is a natural levelling process. Natural erosion has sculptured landforms on
the uplands and built landforms on the lowlands. Its rate and distribution in time controls
the age of land surfaces and many of the internal properties of soils on the surfaces.
Accelerated erosion
Accelerated erosion is largely the consequence of human activity. The primary
causes are tillage, grazing, and cutting of timber. The rate of erosion can be increased by
activities other than those of humans. Fire that destroys vegetation and triggers erosion has
the same effect. The spectacular episodes of erosion, such as the soil blowing on the Great
Plains of the Central United States in the 1930s, have not all been due to human habitation.
Frequent dust storms were recorded on the Great Plains before the region became a grain-
producing area. "Natural" erosion is not easily distinguished from "accelerated" erosion on
every soil. A distinction can be made by studying and understanding the sequence of
sediments and surfaces on the local landscape, as well as by studying soil properties
(USDA, 1993).
Erosion can be accelerated through the activities of human beings such as the
removal of surface vegetation and residue cover in agricultural cultivation, forest
harvesting, rangeland grazing, surface mining, urban and highway construction. Tillage

Literature review
9
implements, forest harvesting equipment, mining activities, and construction equipment all
disturb the soil structure, which can also reduce the soil's resistance to detachment.
2.2.2. Universal Soil Loss Equation (USLE)
Several methods and equations to estimate and predict soil erosion by water have
been proposed. Most common worldwide applied is the Universal Soil Loss Equation
(USLE). The equation development started with Zing’s equation (1940), and the final form
was defined by Wischmeier and Smith (1978). This equation was modified into the
Revised Universal Soil Loss Equation (Renard, 1997). This equation is a model to predict
sheet and rill erosion based on six major factors: rainfall erosivity (R), soil erodibility (K),
slope length factor (L), the slope steepness (S) and the erosion control practices (P). The
product of those factors is equal to the total soil loss (A) written in the equation:
A = R x K x L x S x C x P
Where soil loss (A) is expressed in tons per hectares.
The Rainfall Erosivity Factor (R)
R is defined as the aggressivity of the rainfall to induce soil erosion or the potential
ability of rain to cause erosion. R is equal to the product of kinetic energy (E) of a
rainstorm. Raindrops parameters necessary to quantify rainfall erosivity are the size,
distribution and terminal velocity of individual raindrops (Gabriels, 2006).
Wischmeier and Smith (1958), based in an extensive statistical analysis that the best
correlation with soil loss is given by a storm’s maximum intensity of 30 minute duration
(EI30). The factor R is the calculated by the equation:
R = EI30
Where R = Erosion index of the storm (MJ.mm/ha.h)
E = total kinetic energy of the storm (MJ/ha)
I30= Maximum intensity during 30 min of the storm (mm/h)

Literature review
10
The erosive power of the raindrops is determined by the kinetic energy of the
rainfall, which is determined by the distribution and the fall velocity of the raindrops
(Poessen, 1992).
Kinetic Energy (E)
The energy supplied by falling drops to produce erosion is the kinetic energy (E),
calculated by Morgan (1980) as follows: 2
21 mvKE =
Where m = mass of the falling raindrops (kg)
V = terminal velocity of the falling raindrops (ms-1)
Kinetic energy is considered the major factor initiating soil detachment (Lal, 1988)
and the other soil erosion process depend on the rate of particle detachment which
increases with heavy rains, large drops and kinetic energy.
Rainfall intensity (I)
Rainfall intensity is defined as the instantaneous rate of rainfall occurring at a point.
Precipitation intensity is defined by WMO as the amount of precipitation, collected per unit
time interval. According to this definition, precipitation intensity data can be derived by the
measurement of precipitation amount using an ordinary precipitation gauge.
The Soil Erodibility Factor (K)
K is the soil erodibility factor which represents susceptibility of soil to erosion
measured under a standard unit plot condition. Main soils properties influencing this factor
are: texture, organic matter, soil structure and permeability of the soil profile.

Literature review
11
The Topographic Factor (LS)
L is the slope length factor, representing the effect of slope length on erosion. It is
the ratio of soil loss from the field slope length to that from a 22.1 meter length on the same
soil type and gradient. Slope length is the distance from the origin of overland flow along
its flow path to the location of either concentrated flow or deposition. Fortunately,
computed soil loss values are not especially sensitive to slope length and differences in
slope length of more or less 10% are not important on most slopes, especially flat
landscapes.
S represents the effect of slope steepness on erosion. Soil loss increases more
rapidly with slope steepness than it does with slope length. It is the ratio of soil loss from
the field gradient to that from a 9% slope under otherwise identical conditions. The relation
of soil loss to gradient is influenced by density of vegetative cover and soil particle size.
The Crop Management Factor (C)
C is the cover-management factor. The C-factor is used to reflect the effect of
cropping and management practices on erosion rates. It is the factor used most often to
compare the relative impacts of management options on conservation plans. The C-factor
indicates how the conservation plan will affect the average annual soil loss and how that
soil-loss potential will be distributed in time during construction activities, crop rotations or
other management schemes.
The Conservation Practice Factor (P)
P is the support practice factor. The RUSLE P-factor reflects the impact of support
practices and the average annual erosion rate. It is the ratio of soil loss with contouring
and/or strip-cropping to that with straight row farming up-and-down slope. P-factor

Literature review
12
differentiates between cropland and rangeland or permanent pasture. Both options allow for
terracing or contouring, but the cropland option contains a strip-cropping routine whereas
the rangeland/permanent-pasture option contains an "other mechanical disturbance" routine
(Renard et al 1995).
2.2.3. Erosivity indices
The EI30 index has been used in many places but for tropical conditions it is not
entirely satisfactory. Lal (1976) reported that this index might underestimate the kinetic
energy of tropical storms and Hudson & Jackson (1959) found in Zimbabwe that this index
was not efficient.
As a result, other indices have been proposed by different authors. Erosivity indices
are used to assess a storm or the rainfall pattern which describes its capacity to erode soil
from unprotected field (Wischmeier, 1959).
Hudson (1971) defined the KE > 1 index as the sum of the kinetic energies in
storms with intensities greater than 1 in.h-1 (25.4 min.h-1). This index was based on the
concept that there is a threshold value of intensity at which rain starts soil erosion. This
index could be more adequate for tropical soils with well structured profiles and high
infiltration rates.
Lal (1976) proposed the AIm index to assess rainfall erosivity. The AIm index is
defined as the product of total rainfall (A) in cm and maximum intensity (Im) in cm.h-1 for
a minimum duration of 7.5 minutes.
Fournier (1960) defined a rainfall distribution index (FI), as the ratio between main
rainfall for the wettest month of the year (pm) and the annual precipitation (P) using the
formulae:
PpFI m
2=
Literature review
13
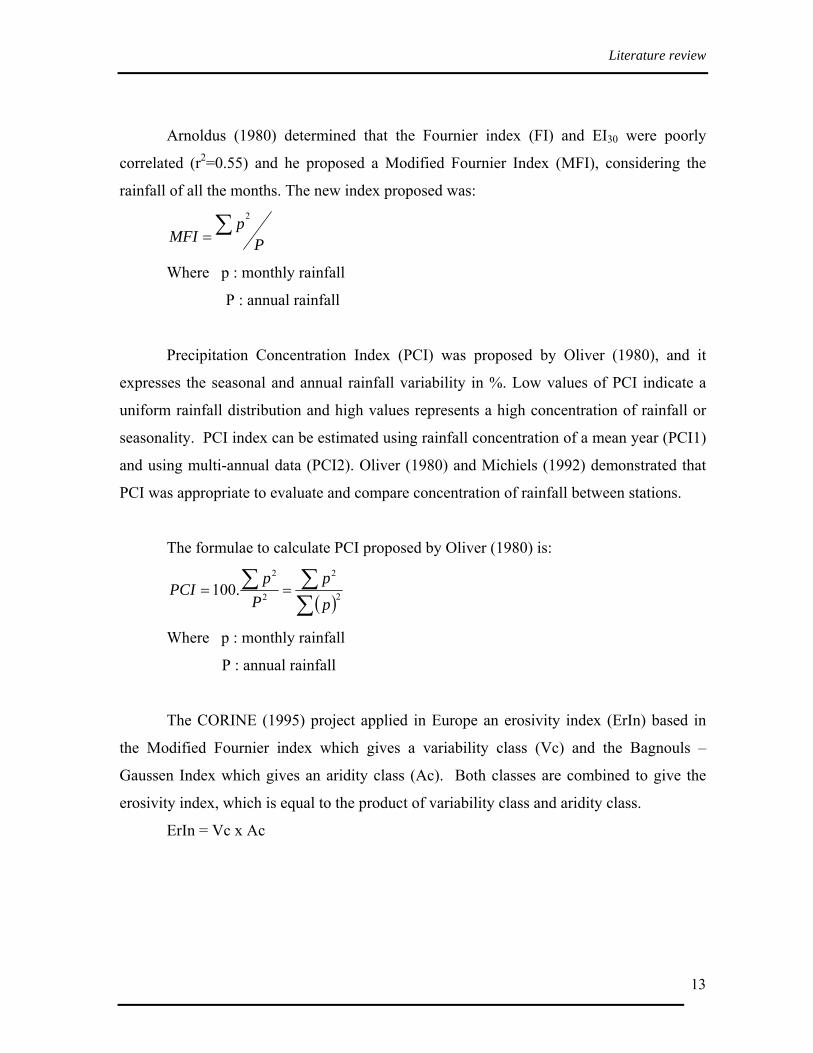
Arnoldus (1980) determined that the Fournier index (FI) and EI30 were poorly
correlated (r2=0.55) and he proposed a Modified Fournier Index (MFI), considering the
rainfall of all the months. The new index proposed was:
Pp
MFI2∑=
Where p : monthly rainfall
P : annual rainfall
Precipitation Concentration Index (PCI) was proposed by Oliver (1980), and it
expresses the seasonal and annual rainfall variability in %. Low values of PCI indicate a
uniform rainfall distribution and high values represents a high concentration of rainfall or
seasonality. PCI index can be estimated using rainfall concentration of a mean year (PCI1)
and using multi-annual data (PCI2). Oliver (1980) and Michiels (1992) demonstrated that
PCI was appropriate to evaluate and compare concentration of rainfall between stations.
The formulae to calculate PCI proposed by Oliver (1980) is:
( )22
2
2
.100∑∑∑ ==
p
pP
pPCI
Where p : monthly rainfall
P : annual rainfall
The CORINE (1995) project applied in Europe an erosivity index (ErIn) based in
the Modified Fournier index which gives a variability class (Vc) and the Bagnouls –
Gaussen Index which gives an aridity class (Ac). Both classes are combined to give the
erosivity index, which is equal to the product of variability class and aridity class.
ErIn = Vc x Ac
General Description of Colombia
14
3. GENERAL DESCRIPTION OF COLOMBIA
Colombia is located in the Northwest of South America, on the equatorial line with
most of its land in the Northern hemisphere, between latitudes 12°26’46” N in the Guajira
peninsula and 4° 12’30” S in the Amazon river and within 60° 50’54” W longitude on the
Island of San José in the Negro river, limit between Colombia, Brazil and Venezuela and
79° 02’33” W longitude in Cabo Manglares in the Pacific Ocean (figure 1). The
continental surface area of the country is 1141748 km2.
Colombia has no seasons, but due to its geographic location in the equatorial and
tropical latitudes and topographic characteristics, Colombia has several kinds of climates.
The temperature varies with altitude, from very hot in the lowlands to very cold in the high
mountains. Moisture condition varies also from hyperarid in the Guajira desert to hyper
humid regions in the Pacific region. Rainfall precipitation varies from less than 500 mm per
year in the Guajira peninsula to more than 11000 mm in the Pacific region.
Colombia has also extra territories as the archipelagos of San Andrés, San Bernardo
and El Rosario scattered in the Caribbean Sea, the islands of Barú and Tierra, in the
Caribbean sea, and the islands of Malpelo, Gorgona and Gorgonilla in the Pacific Ocean.
3.1. NATURAL REGIONS OF COLOMBIA
Geographical, topographical and climate conditions make of Colombia a very
heterogeneous country. Those differences are marked in six main natural regions: The
Caribe, Pacific, Andes, Orinoquia, Amazonas and Insular (figure 2).

General Description of Colombia
15
Figure 1. Location of Colombia in South America
Figure 2. Main Natural Regions of Colombia (IGAC, 1999)
ColombiaColombia
1 Caribe
2 Pacific
3 Andes
4 Orinoquia
5 Amazonas
6 Insular
2
5
4
5
3
1
2
6
6
1 Caribe
2 Pacific
3 Andes
4 Orinoquia
5 Amazonas
6 Insular
2
5
4
5
3
1
2
6
6
General Description of Colombia
16
Figure 3. Micro Regions of Colombia (IGAC, 1999)
6
48
8
4045
7
5450
26
46
34
27
38
47
39
24
4
14
13 36
3
37
22
44
25
43
5
9
2912
52
17
11
49
33
51
28
31
15
42
21
23
32
1
18
30
35
41
2
REGION MICRO REGIONS1 San Andres archipelagoINSULAR2 Pacific cays and islands
3 Guajira Peninsula4 Sierra Nevada de Santa Marta5 Magdalena river delta6 Caribean Savannahs7 Sinu and San Jorge Valleys8 Mompox depression
CARIBE
9 Uraba golf
10 Northwest of Western Andes11 Southwest of Western Andes12 Baudo serrania13 Atrato and San Juan Valeys
PACIFICO
14 Pacific plateaus36 Piedemonte llanero37 Llanuras dedesborde piedemonte38 Llanuras del rio Meta39 Llanuras del rio Orinoco40 Llanuras rios Meta Guaviare41 Pantanos del rioArauca
ORINOQUIA
42 Serrania dela Macarena
43 Piedemonte Amazonico44 Llanuras del rio Caqueta45 Llanuras Guaviare - Inirida4647
Putumayo CaquetaPenillanuras sur pto Inirida
48 Llanuras Inirida -Yari49 Amazonas meridional50 LlanurasdeIgaraParana Putumayo51 ConfluenciaApaporis Caqueta52 Serranias y montes isla53 Llanuras guaviare Inirida enOrinoco
AMAZONAS
54 Llanuras deCaqueta,Yari,Miriti y Parana
REGION MICROREGIONS
15 Nariño high plateau16 Fosa del Patia17 NororienteCordOcc18 AltiplanodePopayan19 Cauca valley20 Cauca canyon21 MacizoColombiano22 CordCentralmeridional23 MacizoVolcanico24 Montaña Antioquegna25 Alto Magdalena26 Magdalena medio27 VertMagdalenense C Or28 Altiplano Cundiboyacense29 Montaña Santandereana30 Fosa Suarez y Chicamocha31 Macizode Santurban32 Catatumbo33 Serrania Motilones34 Vert Llanera Cord Or
ANDES
35 Vert Amazonica Cord Or
REGION MICROREGIONS
General Description of Colombia
17
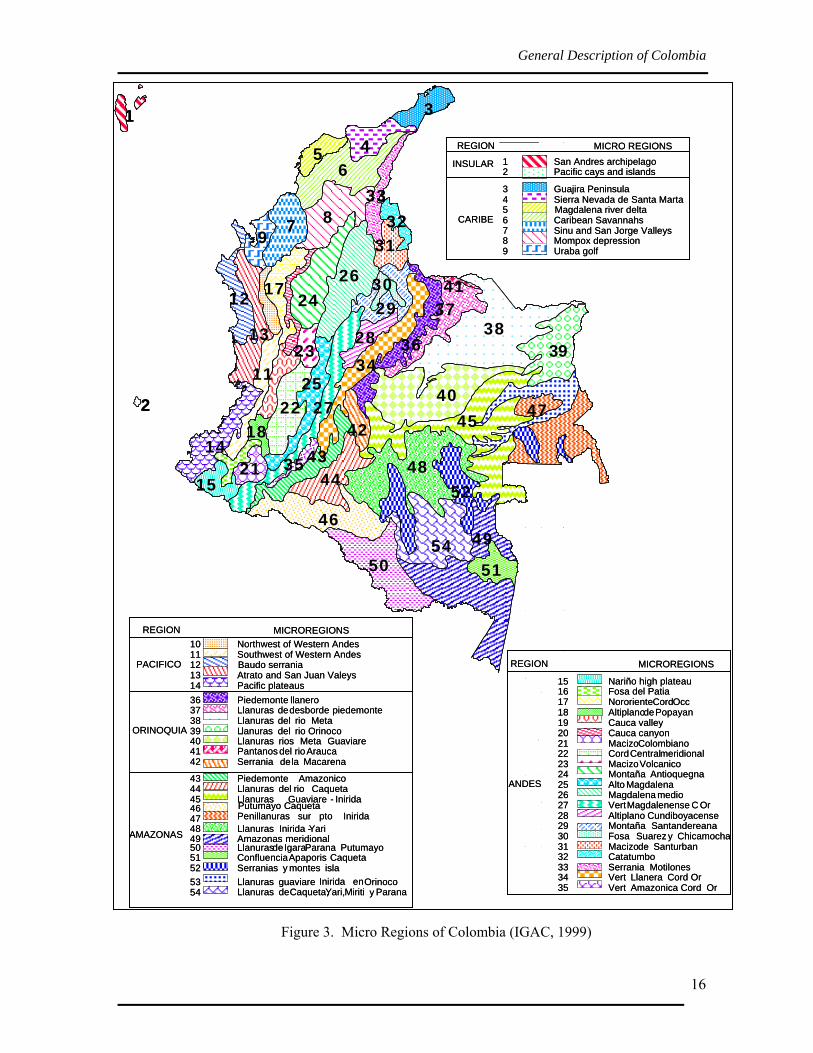
The main regions are divided in micro regions with topographic and climate
characteristics. Figure 3 shows the 54 micro regions differentiated in Colombia by the
Colombian Institute of Geography Agustin Codazzi (IGAC). From those, the driest micro
regions will be selected in order to evaluate the arid indices using information of
meteorological stations. The selected areas will be described later.
3.1.1. Caribe Region
The Caribe region with approximately 11 millions hectares is located in the North
zone of the country to the Atlantic Ocean, from the Guajira peninsula to the Urabá gulf.
This is a level region, crossed by main rivers as Magdalena, Cauca, San Jorge and Sinú,
which form near the coast wetlands and marshy areas. This region with 1400 km of coast
border, between Venezuela and Panama, presents varied geographic features as gulfs, bays
and river deltas. The climate is very warm (27°C), with six months of rain and six dry
months. Mostly 20% of the national population is located in this region (DANE, 2001)
which makes this region as the second important in the country.
The Caribe region presents micro regions with very contrasting characteristics: the
Guajira desert with less than 500 mm of water per year; the Mompox wetlands, under the
sea level; the hills, savannah, the both marine and fluvial plateaus, with 1000 to 2000 mm
of water per year (IDEAM, 2001); and finally the Sierra Nevada de Santa Martha, a group
of mountains separated from the Andes but from the same genesis, characterized for high
slope lands, different climate levels, from hot (24°C) to perpetual snow, and precipitations
from 1000 to 3000 mm per year (IDEAM, 2001). In the driest zones the soils are neutral to
slightly alkaline and the more humid zones soils are dominantly acid. The main activities
are livestock and crops such as banana, sugar cane, cotton, tobacco and some fruits.
The Caribbean region is composed by the micro regions: Guajira peninsula, Sierra
Nevada de Santa Marta, Magdalena River Delta, Caribbean Savannahs, Sinú and High San
Jorge valleys, Momposina depression and Urabá golf.

General Description of Colombia
18
3.1.2. Pacific Region
Between the borders of Panama and Ecuador, with approximately 101000 km2 (10.1
millions ha) limited by the Pacific Ocean and the Western mountain range of the Andes,
this region is a long plain interrupted to the north by small mountainous areas, crossed by
infinity of rivers of torrential character, short, due to the proximity to the sea of the
mountain range. The warm climate and the high rainfall amount make of this region a
promise in flora subject and fauna. The population is very low due to the unfavourable
healthy conditions caused by high temperature and rainfall.
This region is characterized by high precipitation with values from 4000 mm per
year in the South to more than 11000 mm in the North (IDEAM, 2001). Although almost
all the region still with native forest, the colonization processes in the latest years, due to
the social internal conflict of the country, is changing the land use from native forest to
agricultural lands in the southern part and wood extraction in the North.
3.1.3. Andes Region
This region occupies around 313000 km2 (31.3 millions ha), equal to 27.4% of the
total area of the country. It is formed by three mountain ranges including plateaus and
valleys. Geologically, it is formed by volcanic material, sedimentary and metamorphic
rocks and quaternary sediments. Due to the variation of elevation, this region has different
temperature levels, from the hottest valleys (Magdalena and Cauca) to the Paramus and
Glaciers (more than 4800 meters above sea level). The precipitation is variable along this
region, from 500 to 5000 mm per year (IDEAM, 2001).
The Andes is the main region of the country, with almost 70% of the population
living there in activities as agriculture, livestock and industry. In the valleys of the rivers
Cauca and Magdalena, with the warm climate and typically tropical vegetation, the
agriculture is extensive. In the mountain ranges with tempered climate there is agricultural

General Description of Colombia
19
development with coffee and plantain culture. The high plateaus with more fresh climate,
are very favourable to the development of human activity, with abundant cattle, cereals,
horticulture and potato.
3.1.4. Orinoquia Region
With 300263 km2, (26.3% of the national territory) and a density of 3.3 inhabitants
by km2, it occupies a vast zone to the East of the Andes mountain range. It is an immense
plateau, crossed by several rivers flowing to the Orinoco. The climate is warm and dry,
with original natural savannah vegetation with grass. The flooding system caused by the
rivers in the wet season made of this a very rich region in fauna. The population is low and
the majority is dedicated to the livestock with low productivity. In the recent years new
crops have been introduced such as oil palm. The precipitation in this region is from 2000
to 3000 mm per year with homogeneous temperatures around 27°C.
3.1.5. Amazonas region
Located in the South East of Colombia with 327315 km2 (almost 30% of the
country). The Amazonas region consists of an immense plain, slightly to moderate
undulated. The density of population is 0.6 inhabitants per km2, indicative of an
uninhabited extension. Although its vegetation is mainly typical tropical rainforest, some
crops have been introduced by the recently colonization process. This region presents
precipitation values between 2500 and 5000 mm per year. The Amazonas region is
considered a very fragile ecosystem.
3.1.6. Insular region
This region represents a complex of archipelagos, islands and cays in the Caribbean
Sea and in the Pacific Ocean.

General Description of Colombia
20
3.2. CLIMATE OF COLOMBIA
Some climate classifications have been made for Colombia by the Institute of
Meteorology and Environment “IDEAM”. The most common used are Caldas – Lang
(1915), De Martonne (1928) and Thornthwaite (1948).
Using the Lang classification, Colombia shows all the climate types from desert to
very humid. Desert occurs mainly in the North (in the Guajira peninsula) and some other
small areas that are not shown at this scale. The arid areas are located mostly in the Caribe
region: one part in the south of the Guajira peninsula and the other part to the west of Sierra
Nevada de Santa Marta. The semiarid climate zone is mainly in a great part of the Caribe
region and in part of the Andes, spread out in different localities. The semi humid climate
is presented in a great part of the Andes and in the Orinoquia regions with the southern belt
of the Caribe region and the Insular areas. Those four climate types are considered dry and
they included more than 25% of the country as is shown in figure 4. The Amazonas region
is completely humid and the Pacific region is between humid and very humid.
Using the classification of De Martonne, the country appears to be more humid. The
desert climate is restricted to less than 1% of the country in the North, in one small plot of
the Guajira peninsula, which in this case is the only arid region of the country. The
semiarid climate corresponds almost to all the rest of the Caribe region and in some areas
in the Andes, occupying 10% of its surface. The rest of the Andes, the Orinoquia, the
Amazonas and the Insular regions are between humid and very humid and the Pacific
region is very humid with no seasonal variation during the year. According to this
classification, drylands in Colombia are reduced to almost 10 % of the country, mainly in
the Caribe and small spots in the Andes (figure 5).
The classification of Thornthwaite climate classification based in water deficit and
excess in mm per year is shown in figure 6. Although this classification does not show

General Description of Colombia
21
desert regimes, it differs from de Martonne and is more similar with Lang for dry climates.
The Guajira climate varies from arid to Semiarid, most of the Caribe region, Part of the
Andes and the Insular region are considered dry.
Figure 4. Lang climate classification of Colombia (IDEAM, 2001)
0 100 200 Km
12ºN
10ºN
8ºN
6ºN
4ºN
2ºN
0º
2ºS
4ºS69º71º73º75º77º79º
69º71º73º75º77º
12ºN
10ºN
8ºN
6ºN
4ºN
2ºN
0º
DeserticAridSemiaridSemi HumidHumidVery Humid
< 2020 – 4040 – 60
60 – 100100 – 160
> 160
Climatic class Lang FactorP/T
0 100 200 Km0 100 200 Km
12ºN
10ºN
8ºN
6ºN
4ºN
2ºN
0º
2ºS
4ºS69º71º73º75º77º79º
69º71º73º75º77º
12ºN
10ºN
8ºN
6ºN
4ºN
2ºN
0º
DeserticAridSemiaridSemi HumidHumidVery Humid
< 2020 – 4040 – 60
60 – 100100 – 160
> 160
Climatic class Lang FactorP/T
DeserticAridSemiaridSemi HumidHumidVery Humid
< 2020 – 4040 – 60
60 – 100100 – 160
> 160
Climatic class Lang FactorP/T

General Description of Colombia
22
Figure 5. De Martonne classification of Colombia (IDEAM, 2001)
0 100 200 Km
12ºN
10ºN
8ºN
6ºN
4ºN
2ºN
0º
2ºS
4ºS69º71º73º75º77º79º
69º71º73º75º77º
10ºN
8ºN
6ºN
4ºN
2ºN
0º
AridSemiaridSub HumidHumidVery HumidExtremely Hum
< 55 – 10
10 – 2020 – 3535 – 100
> 100
Climatic class Arid index
0 100 200 Km0 100 200 Km
12ºN
10ºN
8ºN
6ºN
4ºN
2ºN
0º
2ºS
4ºS
12ºN
10ºN
8ºN
6ºN
4ºN
2ºN
0º
2ºS
4ºS69º71º73º75º77º79º 69º71º73º75º77º79º
69º71º73º75º77º 69º71º73º75º77º
10ºN
8ºN
6ºN
4ºN
2ºN
0º
10ºN
8ºN
6ºN
4ºN
2ºN
0º
AridSemiaridSub HumidHumidVery HumidExtremely Hum
< 55 – 10
10 – 2020 – 3535 – 100
> 100
Climatic class Arid index
AridSemiaridSub HumidHumidVery HumidExtremely Hum
< 55 – 10
10 – 2020 – 3535 – 100
> 100
Climatic class Arid index

General Description of Colombia
23
Figure 6. Thornthwaite classification of Colombia (IDEAM, 2001)
The precipitation in Colombia is determined by spatial and temporal variations of
the Inter Tropical Convergence Zone joining the general circulation of the tropical and
0 100 200 Km
12ºN
10ºN
8ºN
6ºN
4ºN
2ºN
0º
2ºS
4ºS69º71º73º75º77º79º
69º71º73º75º77º
10ºN
8ºN
6ºN
4ºN
2ºN
0º
> 1000500 – 1000
0 – 500
AridSemiaridDryHumidSlightly HumidMod HumidVery HumidExtremely Humid
Climatic class Water deficit (mm/ year)
0 – 500500 – 1000
1000 – 15001500 – 2000
> 2000
Water excess(mm/ year)
0 100 200 Km0 100 200 Km
12ºN
10ºN
8ºN
6ºN
4ºN
2ºN
0º
2ºS
12ºN
10ºN
8ºN
6ºN
4ºN
2ºN
0º
2ºS
4ºS69º71º73º75º77º79º
4ºS69º71º73º75º77º79º
69º71º73º75º77º 69º71º73º75º77º
10ºN
8ºN
6ºN
4ºN
2ºN
0º
10ºN
8ºN
6ºN
4ºN
2ºN
0º
> 1000500 – 1000
0 – 500
AridSemiaridDryHumidSlightly HumidMod HumidVery HumidExtremely Humid
Climatic class Water deficit (mm/ year)
0 – 500500 – 1000
1000 – 15001500 – 2000
> 2000
Water excess(mm/ year)
General Description of Colombia
24
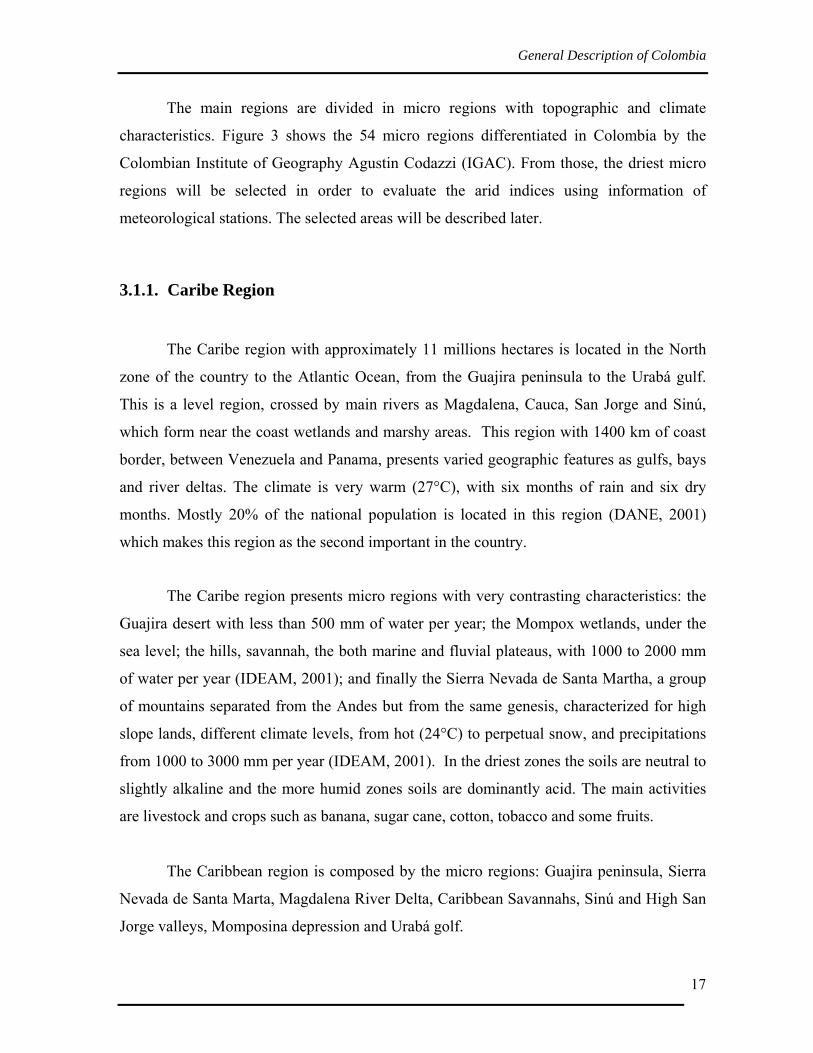
subtropical winds and the interaction of these factors with the relief of the country. The
distribution of the precipitation is heterogeneous and complex. In some regions the dry
season is more predominant (more than six months) than the rainy season. Other regions
have two dry and two rainy seasons during the year: In some areas as in the Pacific, the
rainy season cover almost the whole year in contrast with the arid and desert zones with a
dry season for almost the whole year around. Figure 7 shows the average annual
precipitation distribution in Colombia (IDEAM, 2001).
Figure 7. Average Annual Precipitation Distribution in Colombia (IDEAM, 2001)
General Description of Colombia
25
3.3. SOILS OF COLOMBIA
Colombia has a great diversity of soils due to the different climate, geology,
topography and vegetation but most of the soils are not suitable for agriculture. 50% of the
soils of the country should be preserved in forest or natural reserve: the Paramus in the
Andes region which play an important role in the maintenance and regulation of water
resource for the population (Cortez, 1994). 30% of the soils are located on steep slopes
with serious limitations for agriculture in the Andes region. Almost all the Amazonas and
Pacific regions should be kept in forest due to the susceptibility of their soils to erosion and
the high rainfall values, above 4000 mm of water per year (Malagón, 2003). Part of the
Orinoquia and Caribe wetlands which act as water flooding regulators and also play an
important role in the natural productivity of local fauna and migrating birds, which come
from the northern part of America to the South in the winter season (Aguilera and Neira,
1998). Another restriction for agricultural use of the lands are water limitation as the
Guajira desert and the presence of very acid and old soils with high aluminium content in
the Orinoquia and Amazonas (IDEAM, 2001).
The fertile soils for agriculture use occupies only around 20% of the total area of the
country, located mainly in the inter Andes valleys (Cauca and Magdalena rivers) and part
in the Caribe and in the High Plateaus of the Andes regions (IDEAM, 2001).
Nowadays, Colombia is confronting serious problems of soil degradation, due to the
deforestation, mismanagement, over grazing and pollution as main factors involved in the
erosion and acidification of the soils. In mangroves and wetlands ecosystems oxidation
problems occurs due to drainage practices.
In the Andes region the dominant soils are formed by volcanic ash. Those Andisols
are present in slope lands and are characterized by moderate to good fertility but with very
high susceptibility to soil erosion and landslides.
General Description of Colombia
26
In the Amazonas region (around 80% of the undulate landscape) and part of the
Orinoquia (the well drained high plateau), the main soils are Ultisols and Oxisols,
characterized by the high acidity. These soils have a poor fertility level, mainly Ultisols and
Oxisols, with high aluminium contents being toxic for most crops.
The Amazonas is characterized by high temperatures and high precipitation well
distributed along the year which determine the kind of ecosystem: tropical rain forest. In
the Orinoquia, where the temperature is also high but the precipitation is distributed in one
part of the year, the type of ecosystem is a tropical savannah with common occurrence of
petroferric horizons. The Amazonas has high biomass productivity and the Orinoquia has
very low biomass productivity (Malagón, 2003). The Orinoquia floodplain soils,
originating from quaternary sediments and variable floods with aeolian influence is
classified mainly as Spodosols.
The Caribe region is in contrast with the other three regions in climate, parent
material and vegetation type. Soils in this region have 2/1 shrinking and swelling clays
such as Vertisols, Mollisols, suitable for agriculture and livestock production and Aridisols
in the Guajira peninsula, limited by the presence of salts and sodium. The natural savannah,
with acid soils is also present in the western part of this region.
Entisols, Inceptisols and Alfisols occur all over the country in few amounts.
Entisols occur predominantly in river floodplains and erosional landscapes, while the
Inceptisols are in more slightly slopes and the Alfisols in high alluvial terraces.
Histosols occur in two main micro regions in the Andes zone: the Cucunuba
lacustrae valley and the high Putumayo, in the South of the country.

General Description of Colombia
27
Table 1. Distribution of Soil Orders in Colombia (IGAC, 2000).
ORDER Hectares % of the country Entisols 22567734 19.8
Inceptisols 33624988 26.5 Mollisols 2741320 2.4 Alfisols 2534637 2.2 Andisols 8954567 7.8 Histosols 3041274 2.7 Vertisols 1615033 1.4 Ultisols 24613701 21.6 Oxisols 10879165 12.5
Aridisols 651248 0.6 Spodosols 718725 0.6
Others (water) 2232408 2.0
3.4. LAND USE
The IGAC (Geographic Institute Agustin Codazzi) reports for the year 2003 the
coverage and land use in Colombia: forest land covers 50.7% of the total area of the
country, grasslands 26.6% and savannah 10.8% (both used for cattle and livestock),
agricultural lands 3.7%, lagoons and wetlands 2.6% and Paramus 1.9%.
According to IGAC, grassland is the land use which tends to increase while forest
lands are decreasing considerably in the last fifty years.
The actual land use is affecting the biodiversity, the agricultural productivity and
the environment producing erosion, affecting the quality of the natural resources and
increasing socio economical conflicts (figure 8).

General Description of Colombia
28
Figure 8. Land use and cover in Colombia (IGAC, 2003)
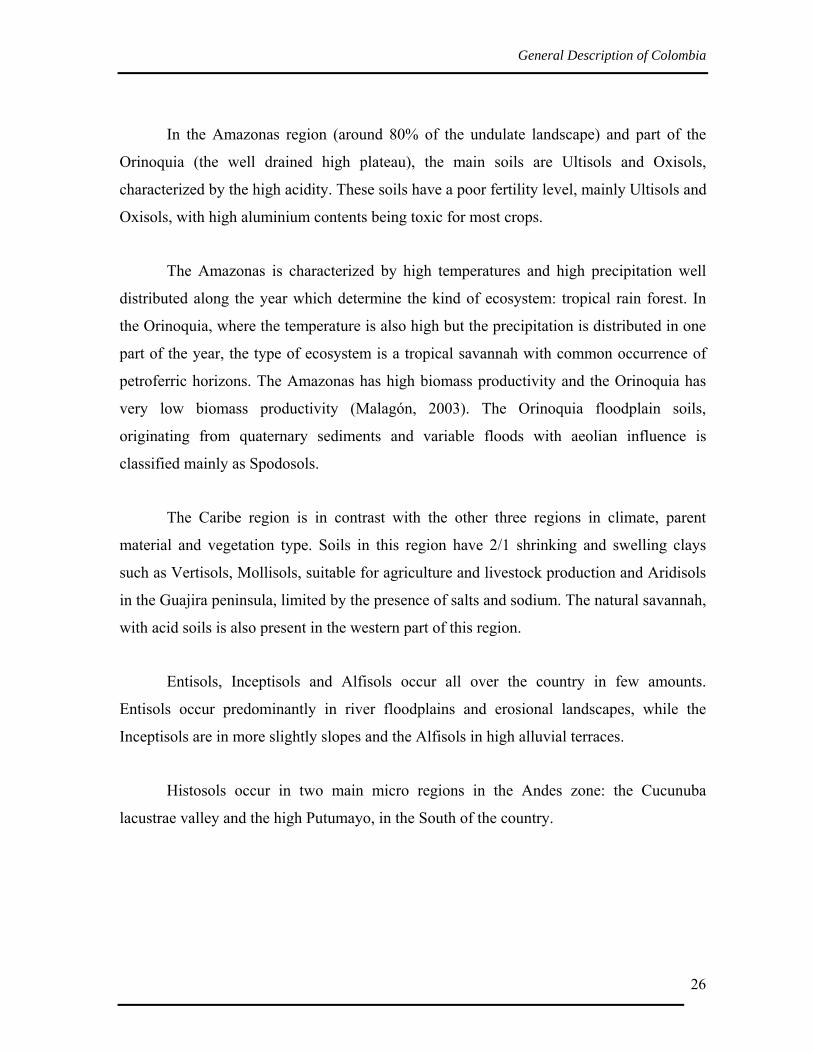
3.5. LAND DEGRADATION IN COLOMBIA
There are several processes that express land degradation. Some of them are
physical which refer to the loss of vegetal coverage, soils and water by deforestation,
erosion or desertification. Others involve biochemical processes that reduce the quality of
the resources in considerable way, such as the slow depletion of soil fertility through the
loss of organic matter and micro organisms, compaction or nutrients lixiviation.
In Colombia, activities such as deforestation, burning, overgrazing, use of
pesticides, excessive use of soluble fertilizers, mismanagement of irrigation water,
excessive tillage with inadequate machinery, use of mono cultures, clean agricultural
systems, among others are some factors that favours the development of land degradation
processes. One of the main degradation processes is the soil erosion, which is the most
dangerous and related with the decrease of quality level of the population involved (Leon,
2003). Erosion is also the most common degradation process due to the relief of the
country, agricultural activities and human settlements which are located mainly in the
Andes region. Other land degradation problems in Colombia are: desertification, mass
movements, sedimentation, coastal and glacier erosion (IDEAM, 2001).
General Description of Colombia
29
Figure 9. Main processes of soil degradation in Colombia (IDEAM 2001)
3.5.1. Erosion
In Colombia, erosion has been estimated by three institutions. The National Institute
of Natural Renewable Resources - INDERENA (former Ministry of Environment) made
the first estimation in 1977. The IGAC made two studies, in 1987 using aerial photographs
and in 1998 through satellite images. The IDEAM (Institute of Environmental Studies)
made two estimations, in 1998 and in 2000 using models. Table 2 shows the erosion degree
levels reported and the volume in hectares of soils affected.
DEGRADATION PROCESSES
Erosion by mining andconstructions
Complex erosion
Aeolian erosion
Gully Erosion
River bed erosion
Sheet erosion
Karstic erosion
Marine Erosion
Sedimentation
Meteorization
Mass movement
No
DEGRADATION PROCESSES
Erosion by mining andconstructions
Complex erosion
Aeolian erosion
Gully Erosion
River bed erosion
Sheet erosion
Karstic erosion
Marine Erosion
Sedimentation
Meteorization
Mass movement
No
General Description of Colombia
30
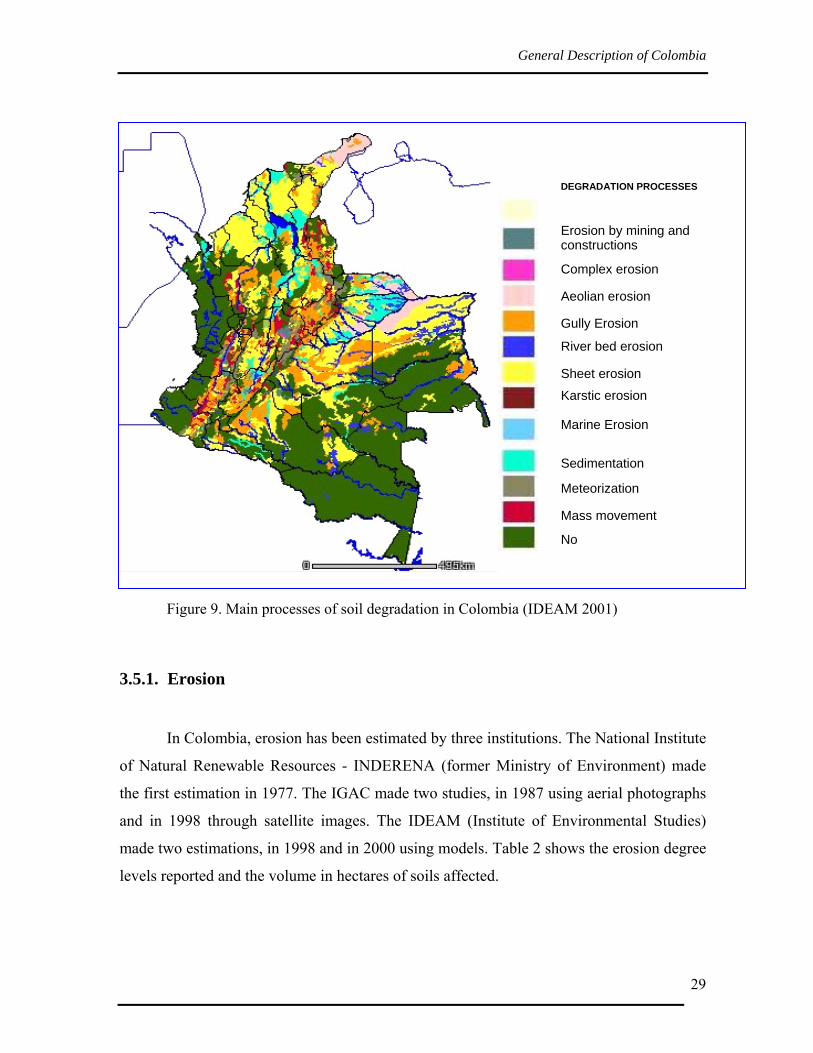
Table 2. Percentage of area affected by erosion in Colombia (IDEAM, 2001)
Degree of erosion
INDERENA1977
IGAC 1987
IDEAM 1998
IGAC 1998
IDEAM 2000
Without erosion 24.8 48.5 0 14.7 52 Not perceived 44.9 4.6
Slight 36.4 28.0 45.5 19.5 9.5 Moderate 12.8 12.9 11.1 11.3 8.9
Severe 0.6 7.8 7.8 3.3 10.8 Bad Lands 1.6 0.7 0.5 14.2
Others 23.8 2.1 35.6 5.8 TOTAL 100 100 100 100 100
The differences in the degrees of erosion calculated by these institutions may look
confusing. This can be explained by the detail level of every study and the methodologies
used. The IGAC determines the actual erosion using aerial photographs or satellite images.
Depending on the scale and the time, the erosion evidences can not be shown in the remote
sense images. The IDEAM, which is the official institution in charge of the meteorology
and climatology affairs, has made some estimations or predictions using the precipitation
data and soil characteristics.
While IDEAM reports for 2000 around 25% of the lands with severe erosion, the
IGAC shows for the same year around 4% with the same erosion degree. Same
divergences appears are shown for the slight class (19.5 % by IGAC and 9.5% by IDEAM)
or zones without erosion (14.7% by IGAC and 52% by IDEAM).
In Colombia more than 2300000 hectares are affected by accelerated erosion
because of land mismanagement, with an erosion rate higher than 1.8 tons per hectar per
year.
General Description of Colombia
31
3.5.2. Desertification
Desertification is considered as a process of loss of the soil productivity in dry
subhumid, semiarid and arid regions. The UNECCD (United Nation Convention to
Combat Desertification and Drought) proposed an aridity index between 0.05 and 0.65 to
delineated arid, semi arid and dry subhumid zones, defined as the ratio between total
precipitation and potential evapotranspiration. A sample of 1409 meteorological stations
was taken for this.
In Colombia, the areas with higher aridity index (AI), are La Guajira with the
minimal AI value of 0.17 in Uríbia; Magdalena with AI of 0.29 in Santa Marta; Atlántico
with AI 0.38 in Barranquilla; Bolivar with AI of 0.48 in Cartagena; all of them in the
Caribe region. In the North Andes, close to Venezuela Norte de Santander with AI of 0.51
in Cúcuta; Santander with AI of 0.53 in Cepitá (Chicamocha river basin); Cundinamarca
with AI of 0.54; Huila with AI of 0.60 in Baraya; Sucre with AI of 0.61 in San Pedro;
Cesar with AI of 0.61 in Valledupar; Valle with 0.65 in Cali and Boyacá with AI of 0.65 in
Villa de Leiva. The first report from the Ministry of Environment about desertification in
Colombia appeared in 2000 using salinity and erosion in dry lands as indicators of
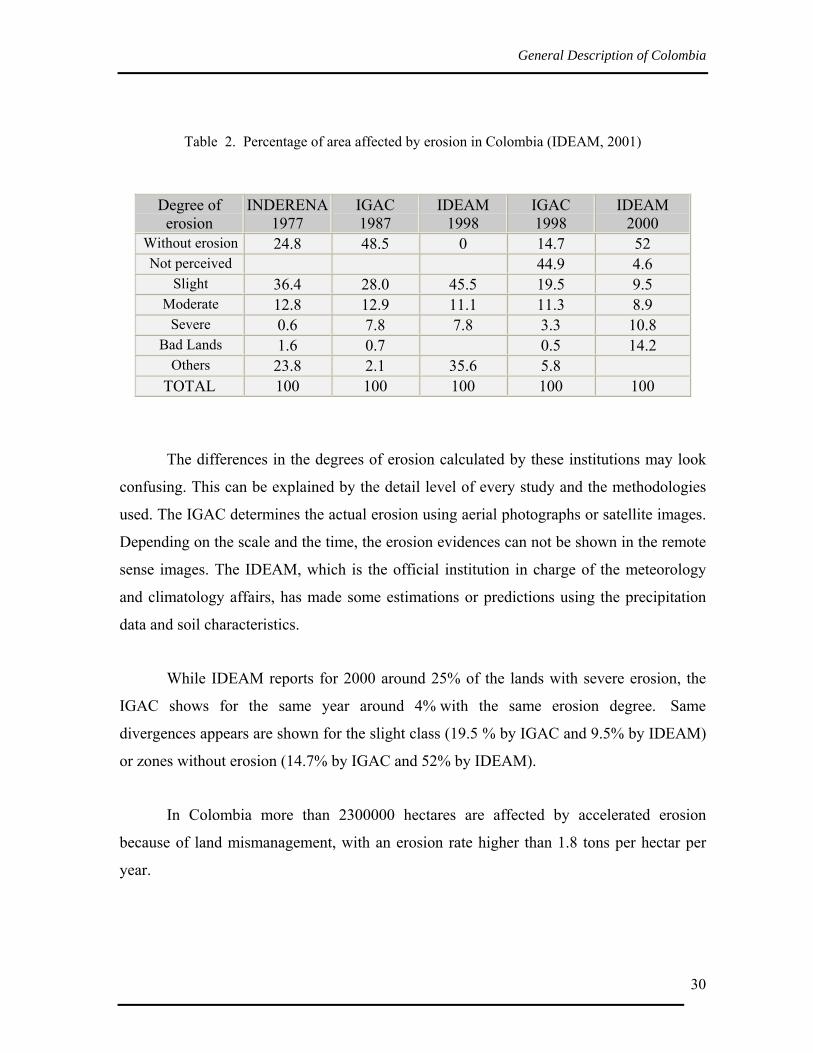
desertification. In this report, 56.4% of the dry lands are affected with very high level of
aridity and erosion.
Table 3. Degree of land degradation by aridity and erosion in Colombia (MinAmbiente, 2000)
Degree of aridity and erosion Area Km2 % of dry lands
affected Very high 39677 20.5
High 69537 35.9 Moderate 50606 26.2
Low 33689 17.4 Total dry land
affected 193510 16.9 of the country
The main areas in Colombia affected by current desertification processes are
Guajira, Santander, Boyacá, Norte de Santander, Cauca, Nariño, Huila, Tolima, Atlántico,
General Description of Colombia
32
Magdalena, Sucre and Cesar, with around 4828875 affected hectares (4.1% of the country).
From those 0.45% is very high, 0.19% high, 0.73% moderate, 1.77% low and 1.12% very
low. This study suggests other 0.7% in desertification process (Leon, 2003).
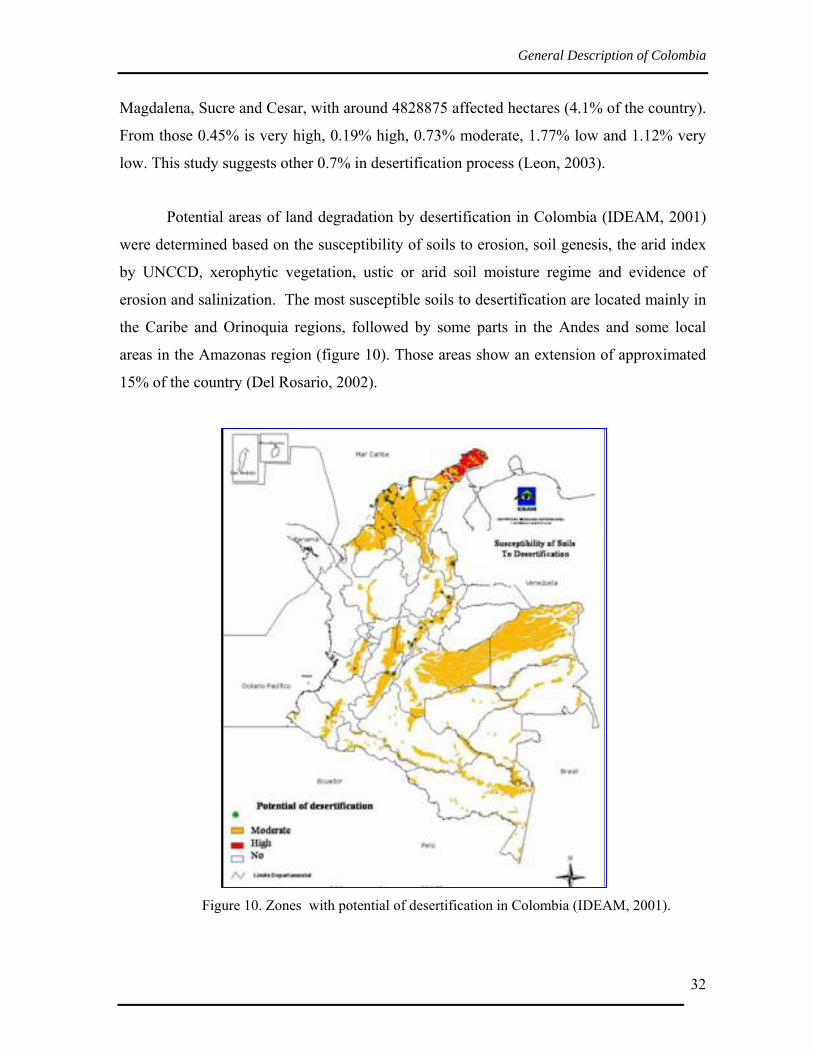
Potential areas of land degradation by desertification in Colombia (IDEAM, 2001)
were determined based on the susceptibility of soils to erosion, soil genesis, the arid index
by UNCCD, xerophytic vegetation, ustic or arid soil moisture regime and evidence of
erosion and salinization. The most susceptible soils to desertification are located mainly in
the Caribe and Orinoquia regions, followed by some parts in the Andes and some local
areas in the Amazonas region (figure 10). Those areas show an extension of approximated
15% of the country (Del Rosario, 2002).
Figure 10. Zones with potential of desertification in Colombia (IDEAM, 2001).

Methodology
33
4. METHODOLOGY
4.1. STUDY AREAS
The areas selected in this study are based on the results obtained by the Colombian
Ministry of Environment and the report of Colombia for the UNCCD (IDEAM, 2001 and
MinAmbiente, 2002). Those studies show the actual and potential land degradation and
desertification areas in Colombia. Different maps were produced such as the erosion map,
the actual and the potential desertification maps. Those maps were obtained from climate
data, soil surveys, satellite images and vegetation maps.
The maps show the main areas that can be considered as dry, integrating not only
climate but also criteria as vegetation, relief, soil and use. Although all of them are quite
similar in the regions that are classified either dry or with desertification or with land
degradation problems, it was necessary to select common areas, with similar conditions of
relief and altitude which are also parameters influencing the weather conditions. Due to the
complexity of environments in Colombia, the definition of micro regions by the IGAC was
used to select and delineate the zones were land degradation and desertification of drylands
at national scale were reported. In this way, the boundaries of the zones selected are natural
allowing assess rainfall in more or less homogeneous geographic conditions of Colombia,
with several climate regimes in terms of precipitation, moisture and temperature.
In total, seven study zones were selected. Two of them were selected from the
Caribe natural region: the Guajira peninsula and the Caribbean plateaus, because they are
geographically a mountainous micro region (Sierra Nevada de Santa Marta) dividing the
two sectors, which is a prolongation of the Andes structure in the North of the country.
Five zones were selected from the Andes natural region: two of them are located in
lowlands and belong to the valleys of Cauca and Magdalena rivers. One zone is located at

Methodology
34
the northeast of the country in a typical landscape of middle and high mountains “the
Santanderes and Cesar Mountainous zone”. The other two are high plateaus, one in the
centre of the country named “Cundiboyacense high plateau” and the other in the south
“Nariño and Popayan high plateaus” including a deep valley of the Patía River and steep
mountains. The figure 11 shows the location of the selected study zones. The selected
zones are not completely drylands but include the most important areas with precipitation
deficits and desertification processes such as land degradation and erosion with influence
of human activities (mainly agricultural).
Figure 11. Location of the study zones
1
2
3
45
7
6
12345
Guajira PeninsulaCaribbean plateausSantander and CesarCundiboyacense High plateauHigh Magdalena River Basin
67
Cauca valleyNariño andPopayan High plateaus
1
2
3
45
7
6
12345
Guajira PeninsulaCaribbean plateausSantander and CesarCundiboyacense High plateauHigh Magdalena River Basin
Guajira PeninsulaCaribbean plateausSantander and CesarCundiboyacense High plateauHigh Magdalena River Basin
67
Cauca valleyNariño andPopayan High plateaus

Methodology
35
4.2. DATA SOURCES
Meteorological information was obtained from secondary information from FAO,
CAZALAC, WMO database and from the programme PHI-LAC (Programa de Hidrología
Internacional para Latino America y el Caribe) of the UNESCO in cooperation with
CAZALAC (Centro para el Agua en Zonas Aridas y Semiáridas en Latino América y el
Caribe). Information used was only multitemporal annual average values. All the
information belongs to stations of the National Institute of Environmental Studies
(IDEAM). Information of 391 meteorological stations covering the study zones was used,
from 1971 to 2000. Missing data of precipitation and temperature was estimated using the
multi-annual average for the same month. Additionally, multitemporal values of PCI and
MFI were obtained from the project The list of the meteorological stations used is
presented in the appendices.
4.3. DELINEATION OF ARID ZONES
Arid zones can be delineated using an Index of Moisture Deficit or Aridity Index.
To calculate the aridity index it is necessary to determine the moisture loss or potential
evapotranspiration (PET). This can be done in three ways: first, using lysimeters or
evapotranspiration pans to obtain direct measurements. Although this is the most accurate
procedure, at a global scale is impractical. Second, using Penman-Monteith (1948)
empirical formula, but these calculations require a large input of direct meteorological data,
which at a global scale is also impractical due to the lack of available data. The final and
most practical approach is the Thornthwaite method (1948), based in the relationship
between mean monthly temperatures and average number of daylight hours per month.
This is more practical but also less accurate due to the underestimation of PET for drylands
and overestimation for humid and cold environments.
To determine differences in climate types, five indices are used: Lang (1915), De
Martonne (1923), Thornthwaite (1948) “Precipitation Effectiveness” and Emberger (1932).
Methodology
36
These indices require only the two general available climate parameters for almost all the
meteorological stations: precipitation and temperature. Bagnouls-Gaussen classification
method (1952) was used determining the number of dry and wet months, based also in
monthly precipitation and temperature.
Spatial distribution for every region was determined with the “Inverse Distance
Weighted” (IDW) interpolator method, using Arc/view software. This method assumes that
each input point has a local influence that diminishes with distance. It weights the points
closer to the processing cell than those farther away. A specified number of points, or
optionally all points within a specified radius, can be used to determine the output value for
each location. The climate zones were delineated using the boundary classes for each
climate index and the surface area was calculated using the software Arc/view version 3.2.
4.3.1. Lang climate classification (1915)
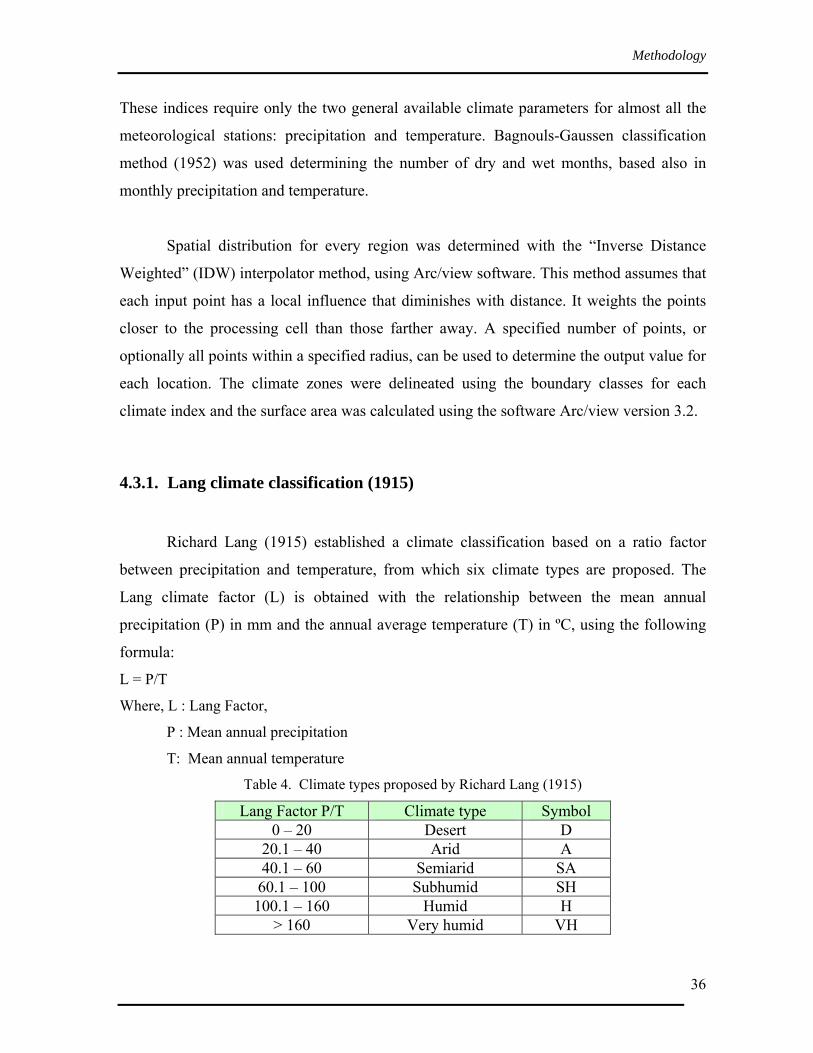
Richard Lang (1915) established a climate classification based on a ratio factor
between precipitation and temperature, from which six climate types are proposed. The
Lang climate factor (L) is obtained with the relationship between the mean annual
precipitation (P) in mm and the annual average temperature (T) in ºC, using the following
formula:
L = P/T
Where, L : Lang Factor,
P : Mean annual precipitation
T: Mean annual temperature
Table 4. Climate types proposed by Richard Lang (1915)
Lang Factor P/T Climate type Symbol 0 – 20 Desert D
20.1 – 40 Arid A 40.1 – 60 Semiarid SA 60.1 – 100 Subhumid SH 100.1 – 160 Humid H
> 160 Very humid VH
Methodology
37
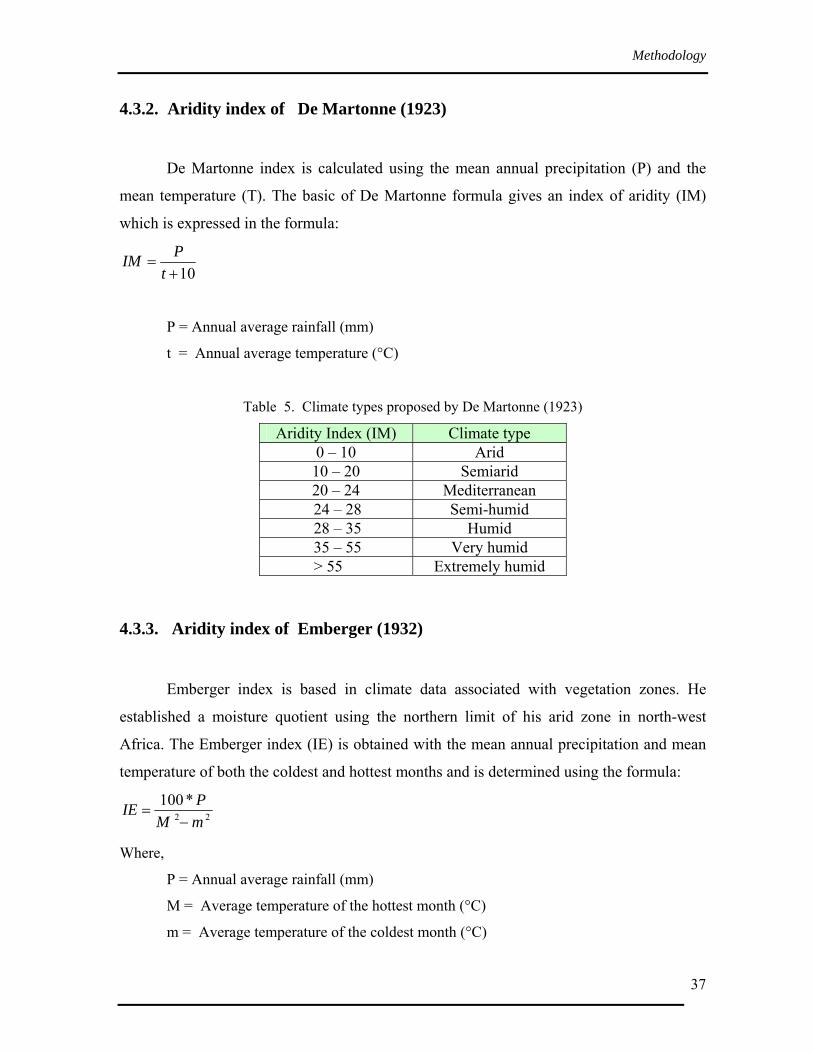
4.3.2. Aridity index of De Martonne (1923)
De Martonne index is calculated using the mean annual precipitation (P) and the
mean temperature (T). The basic of De Martonne formula gives an index of aridity (IM)
which is expressed in the formula:
10+=
tPIM
P = Annual average rainfall (mm)
t = Annual average temperature (°C)
Table 5. Climate types proposed by De Martonne (1923)
Aridity Index (IM) Climate type 0 – 10 Arid 10 – 20 Semiarid 20 – 24 Mediterranean 24 – 28 Semi-humid 28 – 35 Humid 35 – 55 Very humid > 55 Extremely humid
4.3.3. Aridity index of Emberger (1932)
Emberger index is based in climate data associated with vegetation zones. He
established a moisture quotient using the northern limit of his arid zone in north-west
Africa. The Emberger index (IE) is obtained with the mean annual precipitation and mean
temperature of both the coldest and hottest months and is determined using the formula:
22*100mMPIE
−=
Where,
P = Annual average rainfall (mm)
M = Average temperature of the hottest month (°C)
m = Average temperature of the coldest month (°C)

Methodology
38
Table 6. Climate types of Emberger (1932)
Aridity Index (IE) Climate type > 90 Humid
50 – 90 Subhumid 30 – 50 Semiarid
< 30 Arid
4.3.4. Thornthwaite classification (1948)
Thornthwaite (1948) precipitation effectiveness index PE is based on temperature
and precipitation, defined by the formula:
∑=
⎟⎟⎠
⎞⎜⎜⎝
⎛
−=
12
1
9/10
10115
n
TPxPE
where, P = Monthly precipitation (inches)
T = Temperature (°F), n = months = 12
Table 7. Thornthwaite climate classification (1948)
PE Index Climate type < 16 Arid
16 – 31 Semiarid 32 – 63 Subhumid 64 – 127 Humid
> 127 Wet
4.3.5. UNEP Arid Index (1997)
UNEP (1997) has defined the aridity index as the ratio of precipitation (P) to
potential evapotranspiration (ETo). ETo is determined by the Thornthwaite formula:
a
ITmNmETo )10(16 ×
××=
where: ETo= monthly potential evapotranspiration (mm).
Tm = mean monthly temperature (° C).

Methodology
39
Nm = adjustment factor related to hours of daylight.
I = Heat annual index. This is calculated for every month (i):
∑=
=12
1
514.1)5/(i
TmI
a is a parameter calculated using the equation:
49239.001792.0000071.0000000675.0 23 +×+×−×= IIIa
Four climate types have been defined according to the annual ratio P/PET.
Table 8. UNEP (1997) Climate classification
Index P/PET Climate type < 0.05 Hyper-arid zone
0.05 – 0.2 Arid 0.2 – 0.5 Semiarid 0.5 – 0.65 Dry subhumid 0.65 - 1 Subhumid
> 1 Humid
4.3.6. Bagnouls – Gaussen classification method (1952)
This classification is based on the average monthly temperature and precipitation. It
gives more precise climate classification and the climate identification is obtained by
determining separately the numbers of dry and wet months. The Gaussen common aridity
index is defined in the way as the dry, or arid month, corresponds to the month having the
ratio between precipitation (P) and temperature (T) less than two. These two parameters are
plotted as an omberothermic chart on the same graph doubling the values on the scale of
precipitation. The dry months are those which the mean temperature curve is higher than
the precipitation one. The Bagnouls-Gaussen Aridity index (BGI) is calculated as
∑=
−=12
1*)2(
iiii kptBGI
Where t is the average monthly air temperature, k is a coefficient indicating the
number of months in which 2t>p and pi is the average rainfall of the month i (i=1 to 12).
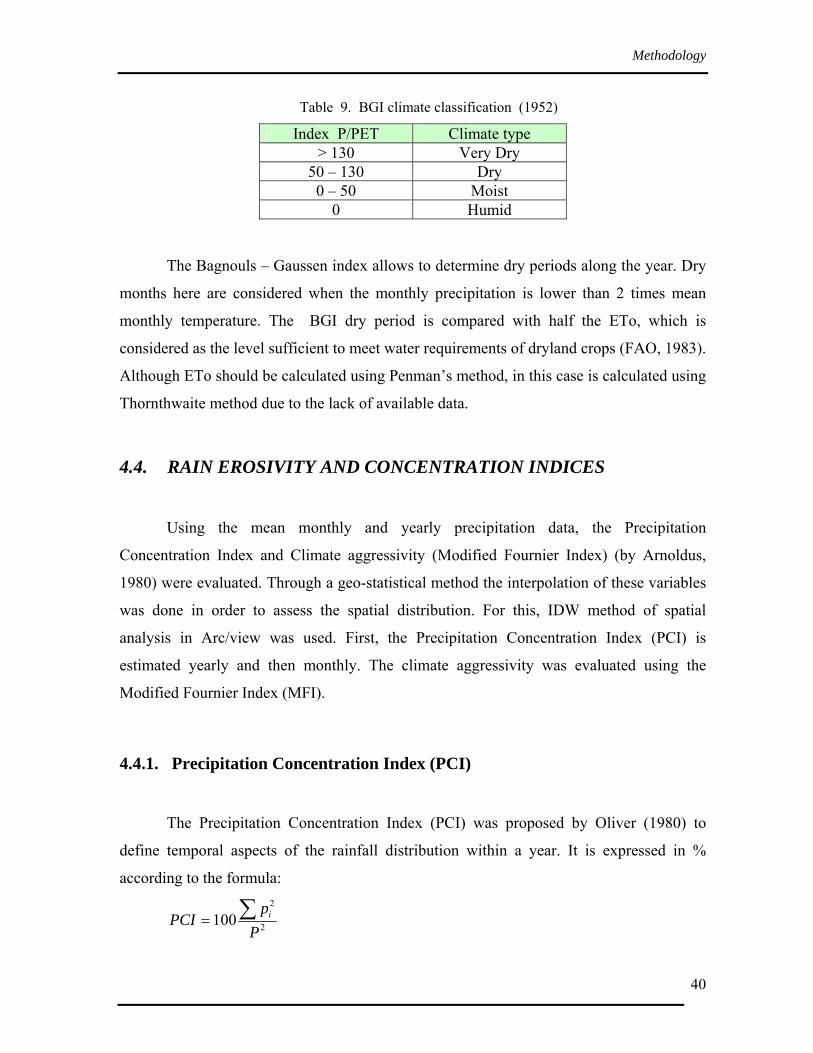
Methodology
40
Table 9. BGI climate classification (1952)
Index P/PET Climate type > 130 Very Dry
50 – 130 Dry 0 – 50 Moist
0 Humid
The Bagnouls – Gaussen index allows to determine dry periods along the year. Dry
months here are considered when the monthly precipitation is lower than 2 times mean
monthly temperature. The BGI dry period is compared with half the ETo, which is
considered as the level sufficient to meet water requirements of dryland crops (FAO, 1983).
Although ETo should be calculated using Penman’s method, in this case is calculated using
Thornthwaite method due to the lack of available data.
4.4. RAIN EROSIVITY AND CONCENTRATION INDICES
Using the mean monthly and yearly precipitation data, the Precipitation
Concentration Index and Climate aggressivity (Modified Fournier Index) (by Arnoldus,
1980) were evaluated. Through a geo-statistical method the interpolation of these variables
was done in order to assess the spatial distribution. For this, IDW method of spatial
analysis in Arc/view was used. First, the Precipitation Concentration Index (PCI) is
estimated yearly and then monthly. The climate aggressivity was evaluated using the
Modified Fournier Index (MFI).
4.4.1. Precipitation Concentration Index (PCI)
The Precipitation Concentration Index (PCI) was proposed by Oliver (1980) to
define temporal aspects of the rainfall distribution within a year. It is expressed in %
according to the formula:
2
2
100P
pPCI i∑=

Methodology
41
Where, p = Monthly precipitation (mm)
P = Annual precipitation (mm)
The PCI permits grouping of data sets according to the derived value, with
increasing values indicating increasing monthly rainfall concentration
Table 10. Precipitation Concentration Index classification
PCI Concept 8.3 – 10 Uniform 10 – 15 Moderately seasonal 15 – 20 Seasonal 20 – 50 Highly seasonal 50 - 100 Irregular
4.4.2. Modified Fournier Index (MFI)
Arnoldus (1980) modified the (FI) index into a Modified Fournier Index (MFI)
considering the rainfall amounts of all months in the year.
∑=
=12
1
2
i Pp
MFI
p is monthly precipitation and P is annual precipitation.
Table 11. Modified Fournier Index scale
MFI Description Class < 60 Very low 1
60 – 90 Low 2 90 –120 Moderate 3 120-160 High 4
> 160 Very high 5
For every Index a linear and quadratic relationship was evaluated between the
monthly average and the index estimated for the average yearly value.
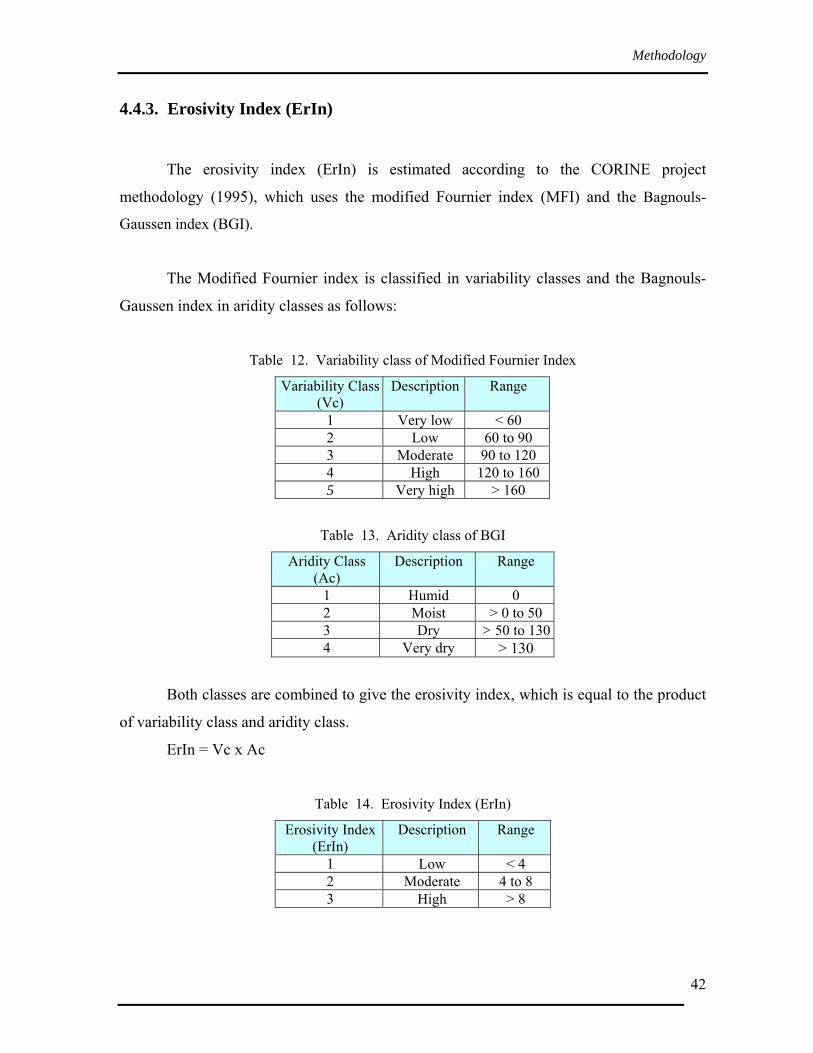
Methodology
42
4.4.3. Erosivity Index (ErIn)
The erosivity index (ErIn) is estimated according to the CORINE project
methodology (1995), which uses the modified Fournier index (MFI) and the Bagnouls-
Gaussen index (BGI).
The Modified Fournier index is classified in variability classes and the Bagnouls-
Gaussen index in aridity classes as follows:
Table 12. Variability class of Modified Fournier Index
Variability Class(Vc)
Description Range
1 Very low < 60 2 Low 60 to 90 3 Moderate 90 to 120 4 High 120 to 160 5 Very high > 160
Table 13. Aridity class of BGI
Aridity Class (Ac)
Description Range
1 Humid 0 2 Moist > 0 to 50 3 Dry > 50 to 1304 Very dry > 130
Both classes are combined to give the erosivity index, which is equal to the product
of variability class and aridity class.
ErIn = Vc x Ac
Table 14. Erosivity Index (ErIn)
Erosivity Index (ErIn)
Description Range
1 Low < 4 2 Moderate 4 to 8 3 High > 8
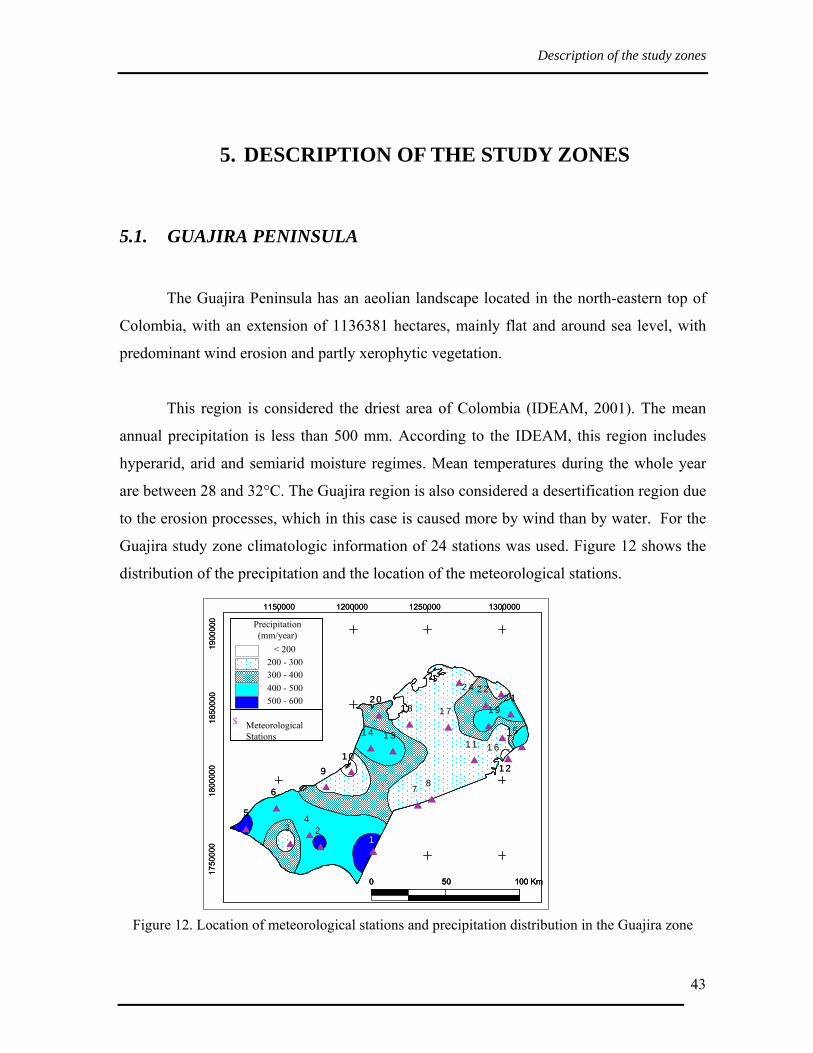
Description of the study zones
43
5. DESCRIPTION OF THE STUDY ZONES
5.1. GUAJIRA PENINSULA
The Guajira Peninsula has an aeolian landscape located in the north-eastern top of
Colombia, with an extension of 1136381 hectares, mainly flat and around sea level, with
predominant wind erosion and partly xerophytic vegetation.
This region is considered the driest area of Colombia (IDEAM, 2001). The mean
annual precipitation is less than 500 mm. According to the IDEAM, this region includes
hyperarid, arid and semiarid moisture regimes. Mean temperatures during the whole year
are between 28 and 32°C. The Guajira region is also considered a desertification region due
to the erosion processes, which in this case is caused more by wind than by water. For the
Guajira study zone climatologic information of 24 stations was used. Figure 12 shows the
distribution of the precipitation and the location of the meteorological stations.
Figure 12. Location of meteorological stations and precipitation distribution in the Guajira zone
1150000 1200000 1250000 1300000
1750
000
1800
000
1850
000
1900
000
MeteorologicalStations
$
Precipitation(mm/year)
< 200200 - 300300 - 400400 - 500500 - 600
0 50 100 Km
$$$$
$
$ $$
$
$$ $
$$ $$
$$ $$ $
$$
$
123
45
6 7 89
1 01 1
1 2
1 31 4 15
1 6
1 71 8 1 92 0 2 1
2 22 4
1150000 1200000 1250000 1300000
1750
000
1800
000
1850
000
1900
000
MeteorologicalStations
$
Precipitation(mm/year)
< 200200 - 300300 - 400400 - 500500 - 600
MeteorologicalStations
$
Precipitation(mm/year)
< 200200 - 300300 - 400400 - 500500 - 600
Precipitation(mm/year)
< 200200 - 300300 - 400400 - 500500 - 600
0 50 100 Km0 50 100 Km
$$$$
$
$ $$
$
$$ $
$$ $$
$$ $$ $
$$
$
123
45
6 7 89
1 01 1
1 2
1 31 4 15
1 6
1 71 8 1 92 0 2 1
2 22 4
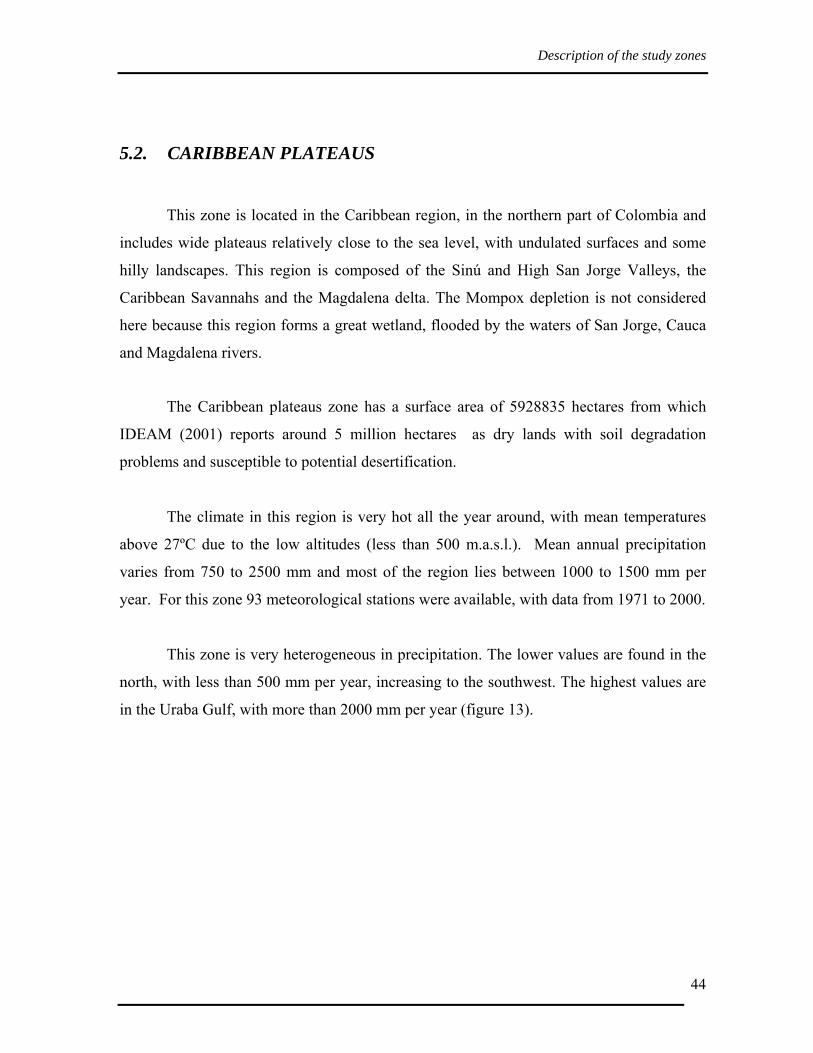
Description of the study zones
44
5.2. CARIBBEAN PLATEAUS
This zone is located in the Caribbean region, in the northern part of Colombia and
includes wide plateaus relatively close to the sea level, with undulated surfaces and some
hilly landscapes. This region is composed of the Sinú and High San Jorge Valleys, the
Caribbean Savannahs and the Magdalena delta. The Mompox depletion is not considered
here because this region forms a great wetland, flooded by the waters of San Jorge, Cauca
and Magdalena rivers.
The Caribbean plateaus zone has a surface area of 5928835 hectares from which
IDEAM (2001) reports around 5 million hectares as dry lands with soil degradation
problems and susceptible to potential desertification.
The climate in this region is very hot all the year around, with mean temperatures
above 27ºC due to the low altitudes (less than 500 m.a.s.l.). Mean annual precipitation
varies from 750 to 2500 mm and most of the region lies between 1000 to 1500 mm per
year. For this zone 93 meteorological stations were available, with data from 1971 to 2000.
This zone is very heterogeneous in precipitation. The lower values are found in the
north, with less than 500 mm per year, increasing to the southwest. The highest values are
in the Uraba Gulf, with more than 2000 mm per year (figure 13).

Description of the study zones
45
Figure 13. Location of climate stations and precipitation distribution in the Caribbean plateaus
5.3. SANTANDER AND CESAR VERTIENTES
This zone is located in the northeast of the Andes Cordillera in Colombia. Formed
by dry deep valleys, badlands and eroded high plateaus in mountain areas of the micro
regions of Catatumbo, Suarez and Chicamocha Canyons, Santurban Macizo, Motilonia
Serrania and Meseta of Bucaramanga with an area of 3680000 hectares from which around
587.400 are in desertification process. Severe erosion problems are present in some areas
such as the Chicamocha valley and Bucaramanga mesa.
The precipitation varies from less than 1000 up to 2000 mm per year and the mean
temperature varies with the altitude and lies between 27ºC in the lowest lands to around
14ºC in the highest lands. The 67 meteorological stations used are shown in the figure 14.
700000 800000 9000000 100000 1100000
1300
000
1400
000
1500
000
1600
000
1700
000
Precipitation(mm/year)
500 - 750750 - 1000
1000 - 15001500 - 20002000 - 2500
$$
$
$
$
$
$
$ $
$
$
$
$
$
$
$
$$
$
$$
$
$
$
$
$
$
$
$
$$
$ $
$$$ $$
$$$$
$ $$
$
$$$
$$ $$ $
$
$$ $$$ $
$$ $
$
$$ $$ $
$
$
$
$$$$
$$
$
$
$$ $$ $
$ $
$ $
2526
27
28
29
3031
32 33
34
35
36
37
38
40
41
43
44
46
47
48
49
50
52
53
54
56 57
60 6162
636465
66
67 6870
72
7376
7778 7980 81
82
83
85868788 89
9194 9596 97 98
99
100 101
103104
106
107
108
109
110 111113
115
116
3942
45
51
555859
74
84
90
92
3
102
105
112114
70 50 100 Km
Climatic stations$
700000 800000 9000000 100000 1100000700000 800000 9000000 100000 1100000
1300
000
1400
000
1500
000
1600
000
1700
000
Precipitation(mm/year)
500 - 750750 - 1000
1000 - 15001500 - 20002000 - 2500
Precipitation(mm/year)
500 - 750750 - 1000
1000 - 15001500 - 20002000 - 2500
$$
$
$
$
$
$
$ $
$
$
$
$
$
$
$
$$
$
$$
$
$
$
$
$
$
$
$
$$
$ $
$$$ $$
$$$$
$ $$
$
$$$
$$ $$ $
$
$$ $$$ $
$$ $
$
$$ $$ $
$
$
$
$$$$
$$
$
$
$$ $$ $
$ $
$ $
2526
27
28
29
3031
32 33
34
35
36
37
38
40
41
43
44
46
47
48
49
50
52
53
54
56 57
60 6162
636465
66
67 6870
72
7376
7778 7980 81
82
83
85868788 89
9194 9596 97 98
99
100 101
103104
106
107
108
109
110 111113
115
116
3942
45
51
555859
74
84
90
92
3
102
105
112114
70 50 100 Km0 50 100 Km0 50 100 Km
Climatic stations$
Description of the study zones
46
Figure 14. Precipitation distribution and meteorological stations in the Santanderes and Cesar zone
5.4. CUNDIBOYACENSE HIGH PLATEAU
This region is located in the central Andes Cordillera. Although the name is high
plateau, it includes also hills and Island Mountains. The surface area of the zone selected is
around 1061600 ha. Altitudes in this zone are between 1500 up to 3000 meters which result
in moderate temperatures between 13 up to 21ºC. Precipitation in general is very
1000000 1100000 1200000 1300000
12
00
00
013
00
00
01
40
000
01
50
00
00
160
00
00
17
00
00
0
Precipitation(mm/year)
500-750750-10001000-15001500-20002000-2500
<500
�
�
�
��
�� �
�
�
�
�
�
��
�� ���
��
� ����
� ��� � ������ � �� �� �� �
����
�� ���� ��
�
�
�
�
�
�
�
��
118
120
121
122
124
126
127
128
129
130
131
134 135137
138139
140141142
143145
150154
155159
162 163165 166
167170172
173
174 176177178
179
180
181
182
183
184175
119
123125
132133136
144146147148149 151152153156 157158 160 161
164
169171
168
� Climatic stations
1000000 1100000 1200000 1300000
12
00
00
013
00
00
01
40
000
01
50
00
00
160
00
00
17
00
00
0
1000000 1100000 1200000 1300000
12
00
00
013
00
00
01
40
000
01
50
00
00
160
00
00
17
00
00
0
Precipitation(mm/year)
500-750750-10001000-15001500-20002000-2500
<500
Precipitation(mm/year)
500-750750-10001000-15001500-20002000-2500
<500
�
�
�
��
�� �
�
�
�
�
�
��
�� ���
��
� ����
� ��� � ������ � �� �� �� �
����
�� ���� ��
�
�
�
�
�
�
�
��
118
120
121
122
124
126
127
128
129
130
131
134 135137
138139
140141142
143145
150154
155159
162 163165 166
167170172
173
174 176177178
179
180
181
182
183
184175
119
123125
132133136
144146147148149 151152153156 157158 160 161
164
169171
168
� Climatic stations
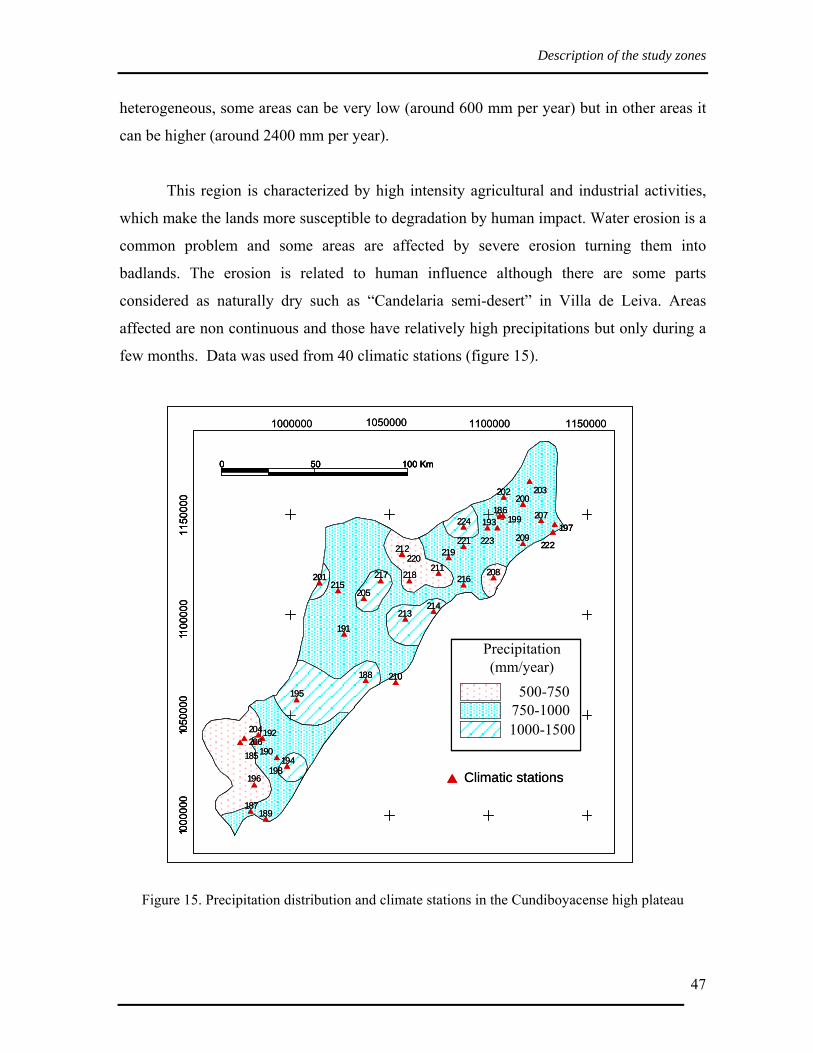
Description of the study zones
47
heterogeneous, some areas can be very low (around 600 mm per year) but in other areas it
can be higher (around 2400 mm per year).
This region is characterized by high intensity agricultural and industrial activities,
which make the lands more susceptible to degradation by human impact. Water erosion is a
common problem and some areas are affected by severe erosion turning them into
badlands. The erosion is related to human influence although there are some parts
considered as naturally dry such as “Candelaria semi-desert” in Villa de Leiva. Areas
affected are non continuous and those have relatively high precipitations but only during a
few months. Data was used from 40 climatic stations (figure 15).
Figure 15. Precipitation distribution and climate stations in the Cundiboyacense high plateau
1000
000
1050
000
1 100
000
1150
000
1000000 1050000 1100000 1150000
Precipitation(mm/year)
500-750750-10001000-1500
Climatic stations$
0 50 100 Km
$
$
$
$
$
$
$
$
$
$
$
$
$
$
$
$
$
$
$
$
$
$
$
$
$$
$$$ $
$$$
$$$ $$
$
$
185
186
187
188
189
190
191
192
193
194
195
196198
201
202
204
205
207
208
209
210
211
212
213214
215 216217 218
219220
221 222223
224 199
200203
206
197
1000
000
1050
000
1 100
000
1150
000
1000
000
1050
000
1 100
000
1150
000
1000000 1050000 1100000 1150000
Precipitation(mm/year)
500-750750-10001000-1500
Precipitation(mm/year)
500-750750-10001000-1500
Climatic stations$
0 50 100 Km0 50 100 Km0 50 100 Km
$
$
$
$
$
$
$
$
$
$
$
$
$
$
$
$
$
$
$
$
$
$
$
$
$$
$$$ $
$$$
$$$ $$
$
$
185
186
187
188
189
190
191
192
193
194
195
196198
201
202
204
205
207
208
209
210
211
212
213214
215 216217 218
219220
221 222223
224 199
200203
206
197
$
$
$
$
$
$
$
$
$
$
$
$
$
$
$
$
$
$
$
$
$
$
$
$
$$
$$$ $
$$$
$$$ $$
$
$
185
186
187
188
189
190
191
192
193
194
195
196198
201
202
204
205
207
208
209
210
211
212
213214
215 216217 218
219220
221 222223
224 199
200203
206
197
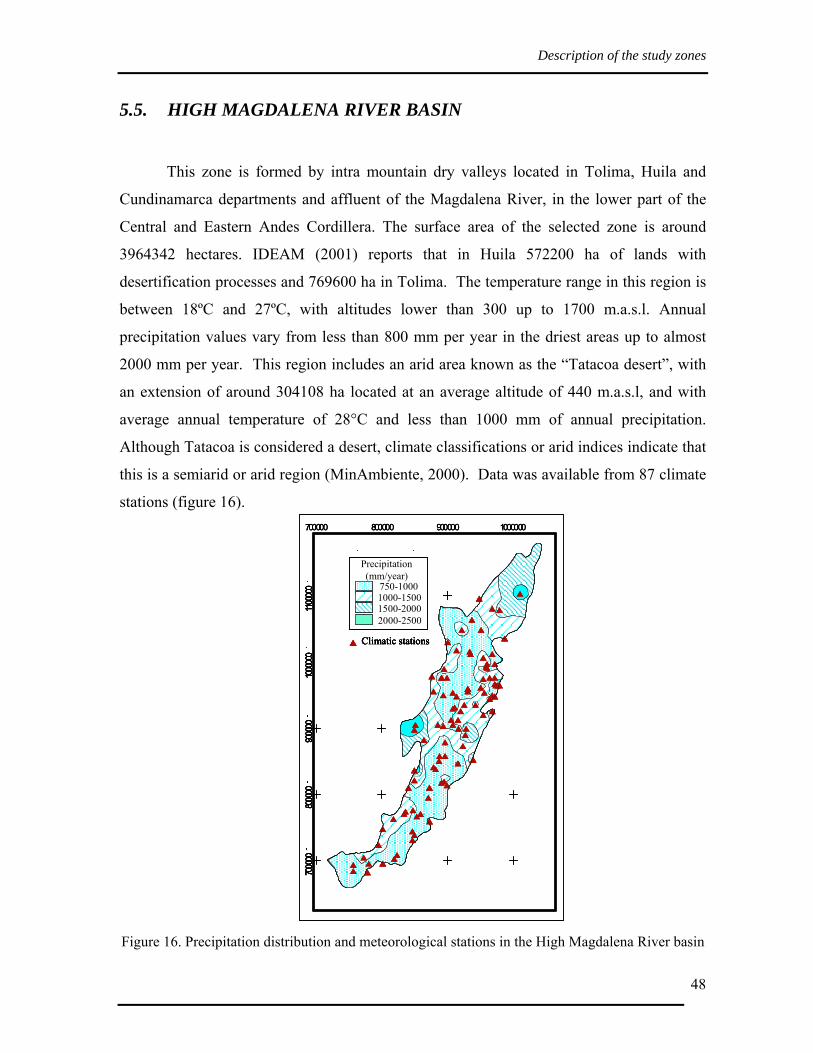
Description of the study zones
48
5.5. HIGH MAGDALENA RIVER BASIN
This zone is formed by intra mountain dry valleys located in Tolima, Huila and
Cundinamarca departments and affluent of the Magdalena River, in the lower part of the
Central and Eastern Andes Cordillera. The surface area of the selected zone is around
3964342 hectares. IDEAM (2001) reports that in Huila 572200 ha of lands with
desertification processes and 769600 ha in Tolima. The temperature range in this region is
between 18ºC and 27ºC, with altitudes lower than 300 up to 1700 m.a.s.l. Annual
precipitation values vary from less than 800 mm per year in the driest areas up to almost
2000 mm per year. This region includes an arid area known as the “Tatacoa desert”, with
an extension of around 304108 ha located at an average altitude of 440 m.a.s.l, and with
average annual temperature of 28°C and less than 1000 mm of annual precipitation.
Although Tatacoa is considered a desert, climate classifications or arid indices indicate that
this is a semiarid or arid region (MinAmbiente, 2000). Data was available from 87 climate
stations (figure 16).
Figure 16. Precipitation distribution and meteorological stations in the High Magdalena River basin
Precipitation(mm/year)
750-10001000-15001500-20002000-2500
Climatic stations$$
$
$
$
$
$
$$$
$
$
$
$$
$$
$
$$
$
$
$
$
$$
$$
$
$
$
$$
$
$
$
$
$
$$
$
$
$
$$
$
$
$$
$
$
$
$
$
$$
$
$
$
$
$
$
$
$
$
$
$$$
$
$
$
$
$
$
$
$
$
$$
$
$
$
$
$
$
$
$
$ $
$
$$
$
$
$
$
$$
700000 800000 900000 1000000
7000
0080
0000
9000
0010
0000
011
0000
0
Precipitation(mm/year)
750-10001000-15001500-20002000-2500
Climatic stations$$
$
$
$
$
$
$$$
$
$
$
$$
$$
$
$$
$
$
$
$
$$
$$
$
$
$
$$
$
$
$
$
$
$$
$
$
$
$$
$
$
$$
$
$
$
$
$
$$
$
$
$
$
$
$
$
$
$
$
$$$
$
$
$
$
$
$
$
$
$
$$
$
$
$
$
$
$
$
$
$ $
$
$$
$
$
$
$
$$
Precipitation(mm/year)
750-10001000-15001500-20002000-2500
Climatic stations$
Precipitation(mm/year)
750-10001000-15001500-20002000-2500
Climatic stations$
Precipitation(mm/year)
750-10001000-15001500-20002000-2500
Climatic stations$$
$
$
$
$
$
$$$
$
$
$
$$
$$
$
$$
$
$
$
$
$$
$$
$
$
$
$$
$
$
$
$
$
$$
$
$
$
$$
$
$
$$
$
$
$
$
$
$$
$
$
$
$
$
$
$
$
$
$
$$$
$
$
$
$
$
$
$
$
$
$$
$
$
$
$
$
$
$
$
$ $
$
$$
$
$
$
$
$$
$
$
$
$
$
$
$$$
$
$
$
$$
$$
$
$$
$
$
$
$
$$
$$
$
$
$
$$
$
$
$
$
$
$$
$
$
$
$$
$
$
$$
$
$
$
$
$
$$
$
$
$
$
$
$
$
$
$
$
$$$
$
$
$
$
$
$
$
$
$
$$
$
$
$
$
$
$
$
$
$ $
$
$$
$
$
$
$
$$
700000 800000 900000 1000000
7000
0080
0000
9000
0010
0000
011
0000
0
700000 800000 900000 1000000
7000
0080
0000
9000
0010
0000
011
0000
070
0000
7000
0080
0000
8000
0090
0000
9000
0010
0000
010
0000
011
0000
011
0000
0
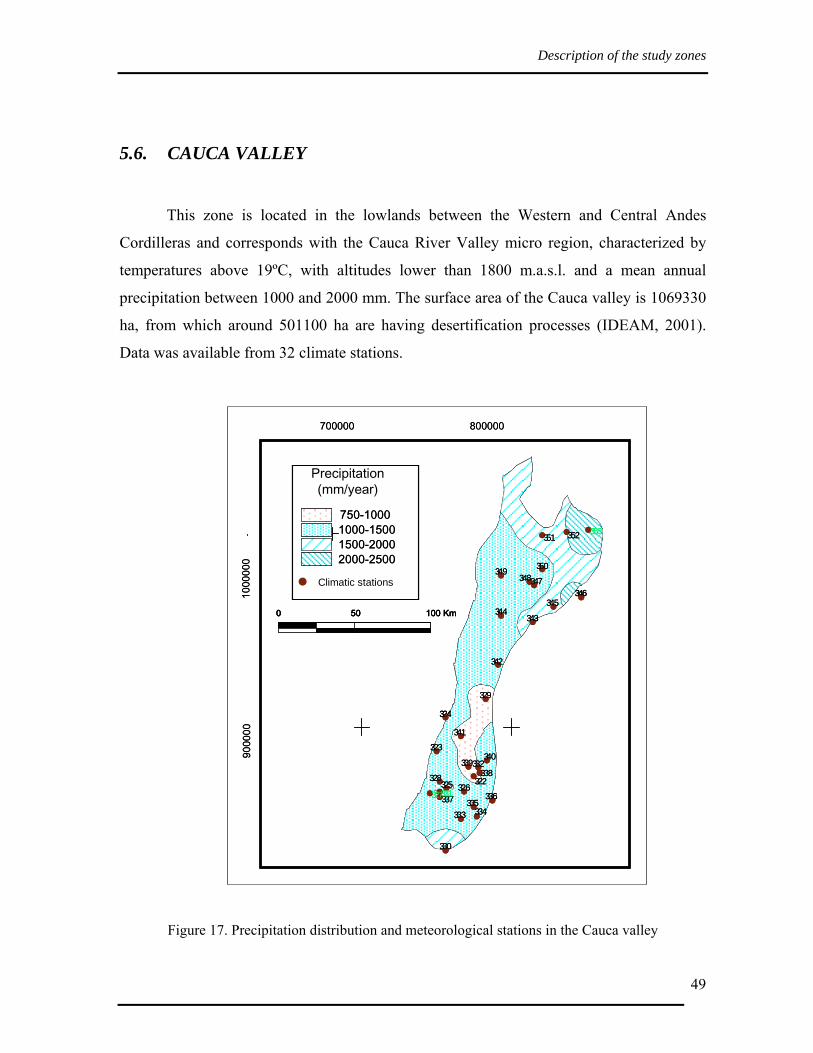
Description of the study zones
49
5.6. CAUCA VALLEY
This zone is located in the lowlands between the Western and Central Andes
Cordilleras and corresponds with the Cauca River Valley micro region, characterized by
temperatures above 19ºC, with altitudes lower than 1800 m.a.s.l. and a mean annual
precipitation between 1000 and 2000 mm. The surface area of the Cauca valley is 1069330
ha, from which around 501100 ha are having desertification processes (IDEAM, 2001).
Data was available from 32 climate stations.
Figure 17. Precipitation distribution and meteorological stations in the Cauca valley
700000 800000
9000
0010
0000
0
Precipitation(mm/year)
750-10001000-15001500-20002000-2500
# Climatic stations
0 50 100 Km
#
#
#
# ##
#
#
#
#
#
# ##
##
##
#
#
#
##
##
###
#
# # #
322
323
324
325 326328
329
330
332
333 334335
336337
338339
340
341
342
343344
345346
347348349 350
351 352
327331
353
700000 800000
9000
0010
0000
0
Precipitation(mm/year)
750-10001000-15001500-20002000-2500
# Climatic stations
Precipitation(mm/year)
750-10001000-15001500-20002000-2500
750-10001000-15001500-20002000-2500
# Climatic stations
0 50 100 Km0 50 100 Km0 50 100 Km
#
#
#
# ##
#
#
#
#
#
# ##
##
##
#
#
#
##
##
###
#
# # #
322
323
324
325 326328
329
330
332
333 334335
336337
338339
340
341
342
343344
345346
347348349 350
351 352
327331
353
#
#
#
# ##
#
#
#
#
#
# ##
##
##
#
#
#
##
##
###
#
# # #
322
323
324
325 326328
329
330
332
333 334335
336337
338339
340
341
342
343344
345346
347348349 350
351 352
327331
353
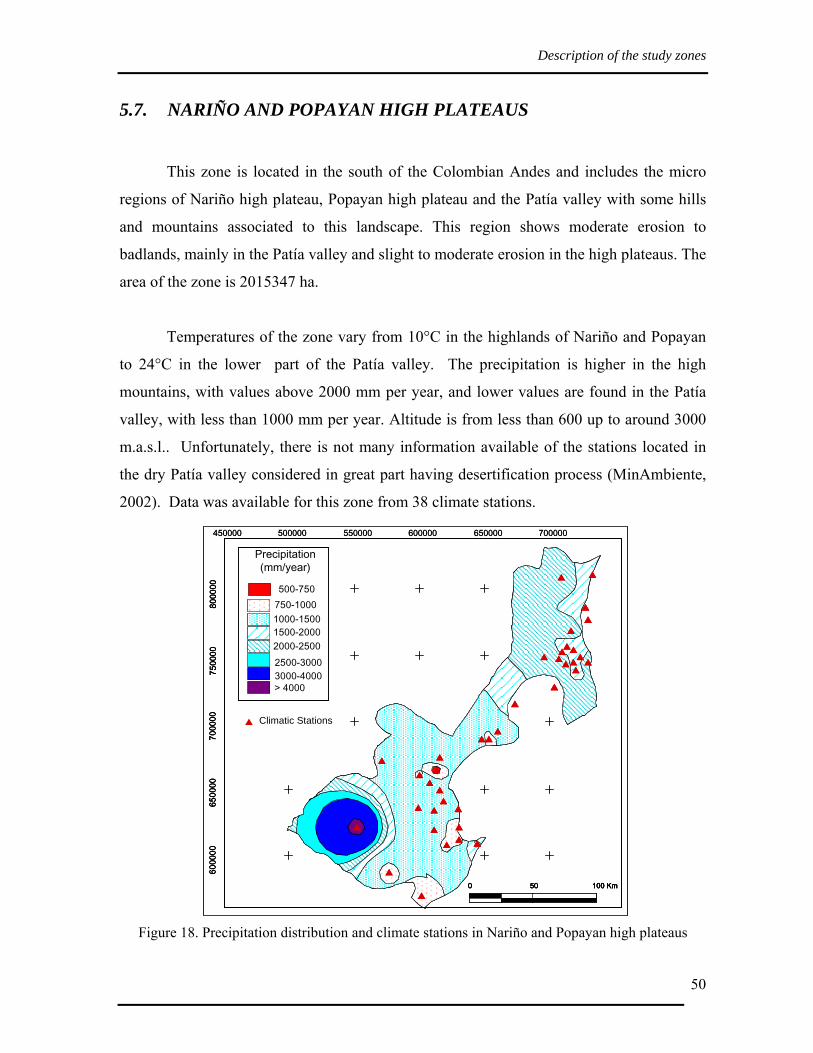
Description of the study zones
50
5.7. NARIÑO AND POPAYAN HIGH PLATEAUS
This zone is located in the south of the Colombian Andes and includes the micro
regions of Nariño high plateau, Popayan high plateau and the Patía valley with some hills
and mountains associated to this landscape. This region shows moderate erosion to
badlands, mainly in the Patía valley and slight to moderate erosion in the high plateaus. The
area of the zone is 2015347 ha.
Temperatures of the zone vary from 10°C in the highlands of Nariño and Popayan
to 24°C in the lower part of the Patía valley. The precipitation is higher in the high
mountains, with values above 2000 mm per year, and lower values are found in the Patía
valley, with less than 1000 mm per year. Altitude is from less than 600 up to around 3000
m.a.s.l.. Unfortunately, there is not many information available of the stations located in
the dry Patía valley considered in great part having desertification process (MinAmbiente,
2002). Data was available for this zone from 38 climate stations.
Figure 18. Precipitation distribution and climate stations in Nariño and Popayan high plateaus
6000
0065
0000
7000
0075
0000
8000
00
450000 500000 550000 600000 650000 700000
Precipitation(mm/year)
750-10001000-15001500-20002000-25002500-30003000-4000
500-750
> 4000
$
$
$
$
$
$
$
$
$
$
$
$
$
$
$
$
$
$
$
$ $$ $
$$$$
$$ $
$
$$
$
$
$ $
$
Climatic Stations$
0 50 100 Km
6000
0065
0000
7000
0075
0000
8000
0060
0000
6500
0070
0000
7500
0080
0000
450000 500000 550000 600000 650000 700000
Precipitation(mm/year)
750-10001000-15001500-20002000-25002500-30003000-4000
500-750
> 4000
$
$
$
$
$
$
$
$
$
$
$
$
$
$
$
$
$
$
$
$ $$ $
$$$$
$$ $
$
$$
$
$
$ $
$
$
$
$
$
$
$
$
$
$
$
$
$
$
$
$
$
$
$
$
$ $$ $
$$$$
$$ $
$
$$
$
$
$ $
$
Climatic Stations$
0 50 100 Km0 50 100 Km0 50 100 Km
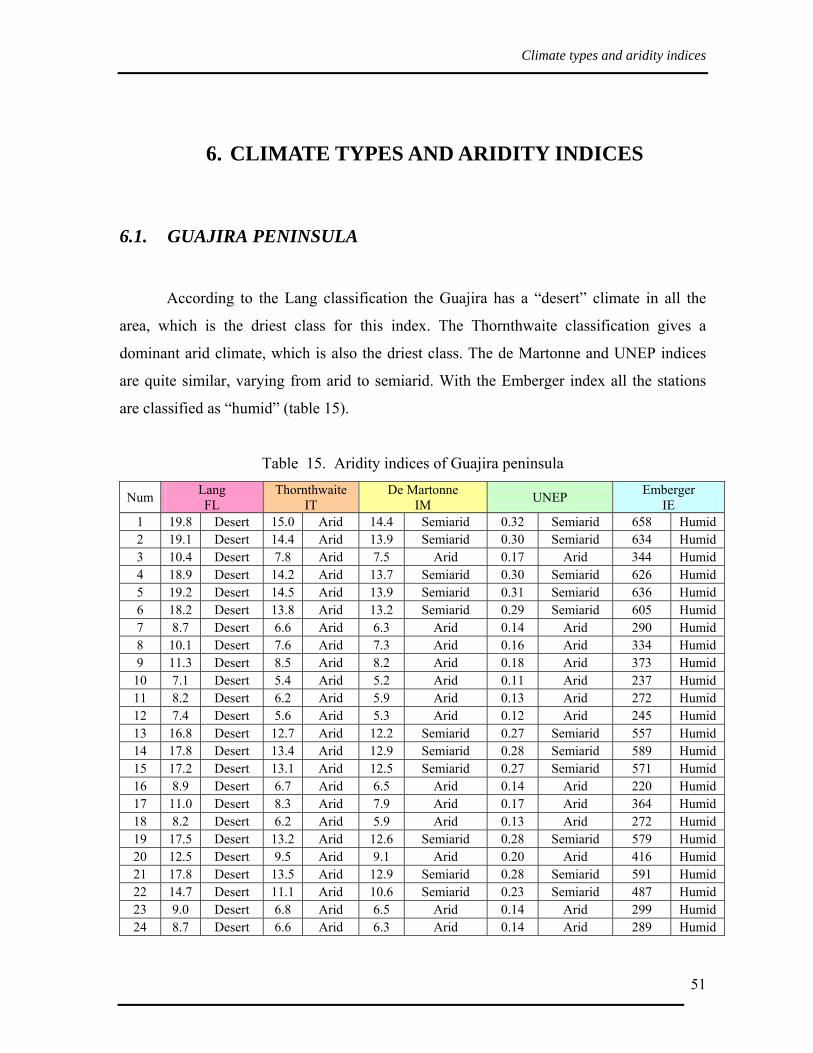
Climate types and aridity indices
51
6. CLIMATE TYPES AND ARIDITY INDICES
6.1. GUAJIRA PENINSULA
According to the Lang classification the Guajira has a “desert” climate in all the
area, which is the driest class for this index. The Thornthwaite classification gives a
dominant arid climate, which is also the driest class. The de Martonne and UNEP indices
are quite similar, varying from arid to semiarid. With the Emberger index all the stations
are classified as “humid” (table 15).
Table 15. Aridity indices of Guajira peninsula
Num Lang FL
Thornthwaite IT
De Martonne IM UNEP Emberger
IE 1 19.8 Desert 15.0 Arid 14.4 Semiarid 0.32 Semiarid 658 Humid 2 19.1 Desert 14.4 Arid 13.9 Semiarid 0.30 Semiarid 634 Humid 3 10.4 Desert 7.8 Arid 7.5 Arid 0.17 Arid 344 Humid 4 18.9 Desert 14.2 Arid 13.7 Semiarid 0.30 Semiarid 626 Humid 5 19.2 Desert 14.5 Arid 13.9 Semiarid 0.31 Semiarid 636 Humid 6 18.2 Desert 13.8 Arid 13.2 Semiarid 0.29 Semiarid 605 Humid 7 8.7 Desert 6.6 Arid 6.3 Arid 0.14 Arid 290 Humid 8 10.1 Desert 7.6 Arid 7.3 Arid 0.16 Arid 334 Humid 9 11.3 Desert 8.5 Arid 8.2 Arid 0.18 Arid 373 Humid
10 7.1 Desert 5.4 Arid 5.2 Arid 0.11 Arid 237 Humid 11 8.2 Desert 6.2 Arid 5.9 Arid 0.13 Arid 272 Humid 12 7.4 Desert 5.6 Arid 5.3 Arid 0.12 Arid 245 Humid 13 16.8 Desert 12.7 Arid 12.2 Semiarid 0.27 Semiarid 557 Humid 14 17.8 Desert 13.4 Arid 12.9 Semiarid 0.28 Semiarid 589 Humid 15 17.2 Desert 13.1 Arid 12.5 Semiarid 0.27 Semiarid 571 Humid 16 8.9 Desert 6.7 Arid 6.5 Arid 0.14 Arid 220 Humid 17 11.0 Desert 8.3 Arid 7.9 Arid 0.17 Arid 364 Humid 18 8.2 Desert 6.2 Arid 5.9 Arid 0.13 Arid 272 Humid 19 17.5 Desert 13.2 Arid 12.6 Semiarid 0.28 Semiarid 579 Humid 20 12.5 Desert 9.5 Arid 9.1 Arid 0.20 Arid 416 Humid 21 17.8 Desert 13.5 Arid 12.9 Semiarid 0.28 Semiarid 591 Humid 22 14.7 Desert 11.1 Arid 10.6 Semiarid 0.23 Semiarid 487 Humid 23 9.0 Desert 6.8 Arid 6.5 Arid 0.14 Arid 299 Humid 24 8.7 Desert 6.6 Arid 6.3 Arid 0.14 Arid 289 Humid
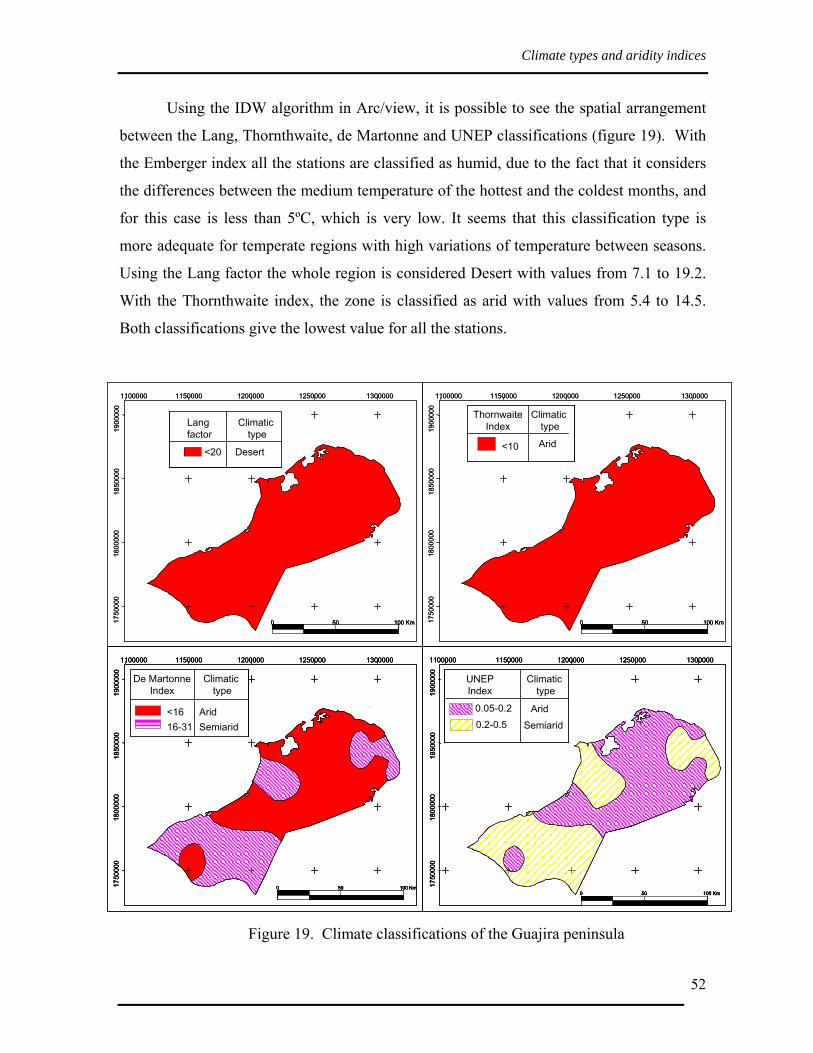
Climate types and aridity indices
52
Using the IDW algorithm in Arc/view, it is possible to see the spatial arrangement
between the Lang, Thornthwaite, de Martonne and UNEP classifications (figure 19). With
the Emberger index all the stations are classified as humid, due to the fact that it considers
the differences between the medium temperature of the hottest and the coldest months, and
for this case is less than 5ºC, which is very low. It seems that this classification type is
more adequate for temperate regions with high variations of temperature between seasons.
Using the Lang factor the whole region is considered Desert with values from 7.1 to 19.2.
With the Thornthwaite index, the zone is classified as arid with values from 5.4 to 14.5.
Both classifications give the lowest value for all the stations.
Figure 19. Climate classifications of the Guajira peninsula
5 5 0 i s
1100000 1150000 1200000 1250000 1300000
1750
000
1800
000
1850
000
1900
000
Climatictype
<20 Desert
Lang factor
0 50 100 Km 0 50 100 Km
1100000 1150000 1200000 1250000 1300000
1750
000
1800
000
1850
000
1900
000
<10 Arid
Climatictype
ThornwaiteIndex
1100000 1150000 1200000 1250000 1300000
1750
000
1800
000
1850
000
1900
000
Climatictype
De MartonneIndex
<16 Arid16-31 Semiarid
0
0 50 100 Km
K l t r
Climatictype
UNEPIndex
0.2-0.5 Semiarid0.05-0.2 Arid
1100000 1150000 1200000 1250000 1300000
1750
000
1800
000
1850
000
1900
000
0 50 100 Km
5 5 0 i s
1100000 1150000 1200000 1250000 1300000
1750
000
1800
000
1850
000
1900
000
Climatictype
<20 Desert
Lang factor
Climatictype
<20 Desert
Lang factor
0 50 100 Km0 50 100 Km 0 50 100 Km0 50 100 Km
1100000 1150000 1200000 1250000 1300000
1750
000
1800
000
1850
000
1900
000
<10 Arid
Climatictype
ThornwaiteIndex
<10 Arid
Climatictype
ThornwaiteIndex
1100000 1150000 1200000 1250000 1300000
1750
000
1800
000
1850
000
1900
000
Climatictype
De MartonneIndex
<16 Arid16-31 Semiarid
0
0 50 100 Km
1100000 1150000 1200000 1250000 1300000
1750
000
1800
000
1850
000
1900
000
Climatictype
De MartonneIndex
<16 Arid16-31 Semiarid
Climatictype
De MartonneIndex
<16 Arid16-31 Semiarid
0
0 50 100 Km0 50 100 Km
K l t r
Climatictype
UNEPIndex
0.2-0.5 Semiarid0.05-0.2 Arid
1100000 1150000 1200000 1250000 1300000
1750
000
1800
000
1850
000
1900
000
0 50 100 Km
K l t r
Climatictype
UNEPIndex
0.2-0.5 Semiarid0.05-0.2 Arid
Climatictype
UNEPIndex
0.2-0.5 Semiarid0.05-0.2 Arid
1100000 1150000 1200000 1250000 1300000
1750
000
1800
000
1850
000
1900
000
0 50 100 Km0 50 100 Km
Climate types and aridity indices
53
With the de Martonne index, part of the region (59 %) is considered as the lower
class “Arid” and the rest as “Semiarid”. The UNEP index is less marginal and considers
56% of the zone as “Arid”, which is not the lowest class for this Index. The remaining part
is classified as Semiarid. The Lang and Thornthwaite indices are quite similar and differ
from the de Martonne and the UNEP indices which are also similar between them. The
Guajira zone is considered completely as “Dry-Land” due to the fact that all stations have
been classified among the categories below the “subhumid” class for Lang, Martonne,
Emberger and UNEP indices, except for the Emberger index which considers the region
totally as Humid.
Using Bagnouls - Gaussen classification method the stations show in general a long
dry season from nine to eleven dry months per year and a very short rainy season from less
than three months in this zone. The driest months of the Guajira peninsula are from
December to August and in almost half of the stations from November to September.
October is the most humid month and September and November vary from arid to humid.
In almost all the stations at least 9 months are considered arid. With the calculated annual
BGI, all the stations are classified as “Moist”, even the station number 10 that has values of
precipitation lower than 2 times temperature (2T) during all the year.
Table 16 resumes the results of the monthly classification comparing the
precipitation value and the temperature. The months with mean monthly precipitation (in
mm), lower than two times temperature (in °C) are represented as arid (A). Semihumid (S)
are those with precipitation values between two and three times the temperature and humid
(H) are those with precipitation values higher than three times the temperature.
Figure 20 shows the monthly relationship between precipitation and temperature for
some stations of the Guajira zone. 0.5 ETo is showing that in all the stations, the level for
dry period (DP) is higher than the calculated with BGI.

Climate types and aridity indices
54
Table 16. Bagnouls - Gaussen climate classification for the Guajira peninsula
Code JAN FEB MAR APR MAY JUN JUL AUG SEP OCT NOV DEC BGI DESCRIPTION1 A A A A S A A A H H H A 23 Moist 2 A A A A S A A A H H S A 26 Moist 3 A A A A A A A A A H A A 33 Moist 4 A A A A H A A A H H S A 25 Moist 5 A A A A S A A A H H S A 24 Moist 6 A A A A A A A A H H S A 28 Moist 7 A A A A A A A A A H A A 36 Moist 8 A A A A A A A A S H A A 34 Moist 9 A A A A A A A A A H A A 32 Moist
10 A A A A A A A A A A A A 37 Moist 11 A A A A A A A A A S A A 37 Moist 12 A A A A A A A A A S A A 37 Moist 13 A A A A A A A A S H S A 24 Moist 14 A A A A A A A A S H H A 26 Moist 15 A A A A A A A A A H H H 28 Moist 16 A A A A A A A A A S S A 35 Moist 17 A A A A A A A A A H S A 34 Moist 18 A A A A A A A A A S A A 36 Moist 19 A A A A A A A A S H H S 26 Moist 20 A A A A A A A A S H A A 31 Moist 21 A A A A A A A A A H H A 27 Moist 22 A A A A A A A A S H H S 29 Moist 23 A A A A A A A A A S S A 35 Moist 24 A A A A A A A A A S A A 36 Moist
A = Arid, S = Semihumid, H = Humid
Figure 20. Omberothermic curves for the Guajira peninsula
0
20
40
60
80
100
120
Jan Feb Mar Apr May Jun Jul Aug Sep Oct Nov Dec
Months
Prec
ipita
tion
(mm
)
0
10
20
30
40
50
60
Tem
p°C
0
20
40
60
80
100
120
Jan Feb Mar Apr May Jun Jul Aug Sep Oct Nov Dec
Months
Prec
ipita
tion
(mm
)
0
10
20
30
40
50
60
Tem
p°C
Station 18
Station 12
0.5 ETo
2TP
0.5 ETo
2T
P
BGI
BGI
DP
DP
Station 22
0
20
40
60
80
100
120
Jan Feb Mar Apr May Jun Jul Aug Sep Oct Nov Dec
Months
Prec
ipita
tion
(mm
)
0
10
20
30
40
50
60
Tem
p°C
2T
P
BGI
DP0.5 ETo
Station 11
0
20
40
60
80
100
120
Jan Feb Mar Apr May Jun Jul Aug Sep Oct Nov Dec
Months
Prec
ipita
tion
(mm
)
0
10
20
30
40
50
60
Tem
p°C
P
BGI
2TDP0.5 ETo
0
20
40
60
80
100
120
Jan Feb Mar Apr May Jun Jul Aug Sep Oct Nov Dec
Months
Prec
ipita
tion
(mm
)
0
10
20
30
40
50
60
Tem
p°C
0
20
40
60
80
100
120
Jan Feb Mar Apr May Jun Jul Aug Sep Oct Nov Dec
Months
Prec
ipita
tion
(mm
)
0
10
20
30
40
50
60
Tem
p°C
Station 18
Station 12
0.5 ETo
2TP
0.5 ETo
2T
P
BGI
BGI
DP
DP
Station 22
0
20
40
60
80
100
120
Jan Feb Mar Apr May Jun Jul Aug Sep Oct Nov Dec
Months
Prec
ipita
tion
(mm
)
0
10
20
30
40
50
60
Tem
p°C
2T
P
BGI
DP0.5 ETo
Station 22
0
20
40
60
80
100
120
Jan Feb Mar Apr May Jun Jul Aug Sep Oct Nov Dec
Months
Prec
ipita
tion
(mm
)
0
10
20
30
40
50
60
Tem
p°C
2T
P
BGI
DP0.5 ETo
Station 11
0
20
40
60
80
100
120
Jan Feb Mar Apr May Jun Jul Aug Sep Oct Nov Dec
Months
Prec
ipita
tion
(mm
)
0
10
20
30
40
50
60
Tem
p°C
P
BGI
2TDP0.5 ETo
Station 11
0
20
40
60
80
100
120
Jan Feb Mar Apr May Jun Jul Aug Sep Oct Nov Dec
Months
Prec
ipita
tion
(mm
)
0
10
20
30
40
50
60
Tem
p°C
P
BGI
2TDP0.5 ETo
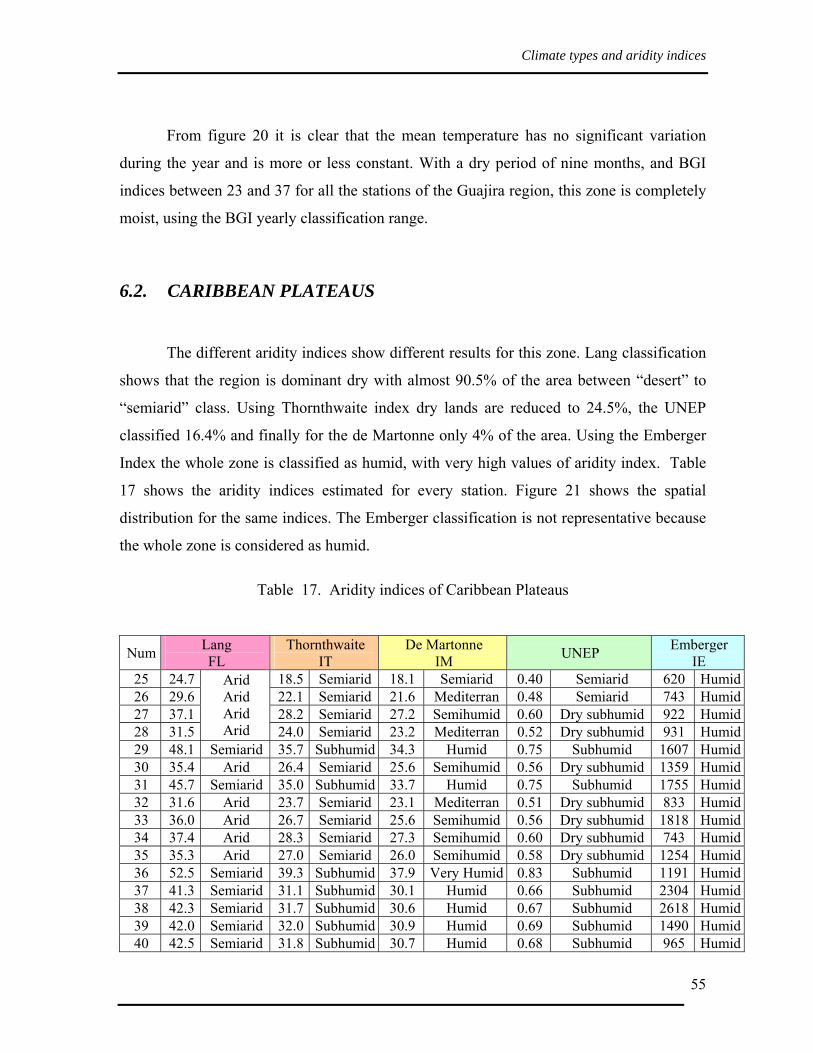
Climate types and aridity indices
55
From figure 20 it is clear that the mean temperature has no significant variation
during the year and is more or less constant. With a dry period of nine months, and BGI
indices between 23 and 37 for all the stations of the Guajira region, this zone is completely
moist, using the BGI yearly classification range.
6.2. CARIBBEAN PLATEAUS
The different aridity indices show different results for this zone. Lang classification
shows that the region is dominant dry with almost 90.5% of the area between “desert” to
“semiarid” class. Using Thornthwaite index dry lands are reduced to 24.5%, the UNEP
classified 16.4% and finally for the de Martonne only 4% of the area. Using the Emberger
Index the whole zone is classified as humid, with very high values of aridity index. Table
17 shows the aridity indices estimated for every station. Figure 21 shows the spatial
distribution for the same indices. The Emberger classification is not representative because
the whole zone is considered as humid.
Table 17. Aridity indices of Caribbean Plateaus
Num Lang FL
Thornthwaite IT
De Martonne IM UNEP Emberger
IE 25 24.7 18.5 Semiarid 18.1 Semiarid 0.40 Semiarid 620 Humid26 29.6 22.1 Semiarid 21.6 Mediterran 0.48 Semiarid 743 Humid27 37.1 28.2 Semiarid 27.2 Semihumid 0.60 Dry subhumid 922 Humid28 31.5
Arid Arid Arid Arid 24.0 Semiarid 23.2 Mediterran 0.52 Dry subhumid 931 Humid
29 48.1 Semiarid 35.7 Subhumid 34.3 Humid 0.75 Subhumid 1607 Humid30 35.4 Arid 26.4 Semiarid 25.6 Semihumid 0.56 Dry subhumid 1359 Humid31 45.7 Semiarid 35.0 Subhumid 33.7 Humid 0.75 Subhumid 1755 Humid32 31.6 Arid 23.7 Semiarid 23.1 Mediterran 0.51 Dry subhumid 833 Humid33 36.0 Arid 26.7 Semiarid 25.6 Semihumid 0.56 Dry subhumid 1818 Humid34 37.4 Arid 28.3 Semiarid 27.3 Semihumid 0.60 Dry subhumid 743 Humid35 35.3 Arid 27.0 Semiarid 26.0 Semihumid 0.58 Dry subhumid 1254 Humid36 52.5 Semiarid 39.3 Subhumid 37.9 Very Humid 0.83 Subhumid 1191 Humid37 41.3 Semiarid 31.1 Subhumid 30.1 Humid 0.66 Subhumid 2304 Humid38 42.3 Semiarid 31.7 Subhumid 30.6 Humid 0.67 Subhumid 2618 Humid39 42.0 Semiarid 32.0 Subhumid 30.9 Humid 0.69 Subhumid 1490 Humid40 42.5 Semiarid 31.8 Subhumid 30.7 Humid 0.68 Subhumid 965 Humid

Climate types and aridity indices
56
Num Lang FL
Thornthwaite IT
De Martonne IM UNEP Emberger
IE 41 42.6 Semiarid 32.5 Subhumid 31.3 Humid 0.69 Subhumid 1411 Humid42 31.8 Arid 23.9 Semiarid 23.1 Mediterran 0.51 Dry subhumid 562 Humid43 44.9 Semiarid 33.7 Subhumid 32.5 Humid 0.71 Subhumid 1019 Humid44 94.5 Subhumid 71.0 Humid 68.5 1.51 Humid 3982 Humid45 90.7 Subhumid 68.5 Humid 66.1 1.46 Humid 7568 Humid47 77.0 Subhumid 57.9 Subhumid 55.8
Extremely Humid 1.23 Humid 3245 Humid
46 35.8 Arid 26.9 Semiarid 25.9 Semihumid 0.57 Dry subhumid 812 Humid48 57.0 Semiarid 43.2 Subhumid 41.8 Very Humid 0.93 Subhumid 1417 Humid49 57.2 Semiarid 39.0 Subhumid 37.2 Very Humid 0.75 Subhumid 2358 Humid50 30.2 Arid 22.9 Semiarid 22.3 Mediterran 0.49 Semiarid 839 Humid51 17.2 Desert 12.6 Arid 12.1 Semiarid 0.26 Semiarid 955 Humid52 27.6 Arid 20.8 Semiarid 20.3 Mediterran 0.45 Semiarid 872 Humid53 31.7 Arid 23.7 Semiarid 22.9 Mediterran 0.50 Dry subhumid 720 Humid54 35.4 Arid 26.7 Semiarid 25.8 Semihumid 0.57 Dry subhumid 627 Humid55 46.8 Semiarid 35.2 Subhumid 34.0 Humid 0.75 Subhumid 828 Humid56 45.1 Semiarid 34.0 Subhumid 32.8 Humid 0.72 Subhumid 798 Humid57 42.0 Semiarid 31.4 Subhumid 30.3 Humid 0.67 Subhumid 953 Humid58 40.5 Semiarid 30.5 Semiarid 29.5 Humid 0.65 Dry subhumid 717 Humid59 54.0 Semiarid 40.6 Subhumid 39.3 Very Humid 0.87 Subhumid 956 Humid60 53.9 Semiarid 40.3 Subhumid 38.9 Very Humid 0.85 Subhumid 1222 Humid61 49.6 Semiarid 37.2 Subhumid 36.2 Very Humid 0.80 Subhumid 1308 Humid62 50.7 Semiarid 38.2 Subhumid 36.9 Very Humid 0.81 Subhumid 898 Humid63 44.5 Semiarid 33.4 Subhumid 32.5 Humid 0.72 Subhumid 1175 Humid64 45.1 Semiarid 34.0 Subhumid 32.8 Humid 0.72 Subhumid 799 Humid65 51.9 Semiarid 39.0 Subhumid 37.6 Very Humid 0.83 Subhumid 2186 Humid66 52.4 Semiarid 39.6 Subhumid 38.1 Very Humid 0.84 Subhumid 927 Humid67 45.7 Semiarid 35.1 Subhumid 33.8 Humid 0.75 Subhumid 1756 Humid68 37.4 Arid 28.1 Semiarid 27.2 Semihumid 0.60 Dry subhumid 662 Humid70 71.6 Subhumid 53.7 Subhumid 51.7 Very Humid 1.14 Humid 1624 Humid72 38.7 Arid 29.2 Semiarid 28.1 Humid 0.62 Dry subhumid 684 Humid73 47.4 Semiarid 35.5 Subhumid 34.2 Humid 0.75 Subhumid 1075 Humid74 61.6 Subhumid 46.8 Subhumid 45.2 Very Humid 1.00 Humid 1531 Humid76 64.3 Subhumid 49.2 Subhumid 47.5 Very Humid 1.05 Humid 2470 Humid77 47.7 Semiarid 35.8 Subhumid 34.5 Humid 0.76 Subhumid 1082 Humid78 50.3 Semiarid 38.0 Subhumid 36.9 Very Humid 0.82 Subhumid 1590 Humid79 55.2 Semiarid 41.8 Subhumid 40.3 Very Humid 0.89 Subhumid 1456 Humid80 41.3 Semiarid 31.6 Subhumid 30.5 Humid 0.68 Subhumid 1586 Humid81 47.6 Semiarid 36.3 Subhumid 34.9 Humid 0.77 Subhumid 1182 Humid82 33.0 Arid 24.5 Semiarid 23.5 Mediterran 0.51 Dry subhumid 1103 Humid83 41.6 Semiarid 31.3 Subhumid 30.1 Humid 0.66 Subhumid 944 Humid84 38.6 Arid 29.1 Semiarid 28.3 Humid 0.63 Dry subhumid 1219 Humid85 37.2 Arid 27.9 Semiarid 26.9 Semihumid 0.59 Dry subhumid 843 Humid86 31.4 Arid 23.7 Semiarid 23.1 Mediterran 0.51 Dry subhumid 994 Humid87 38.7 Arid 29.1 Semiarid 28.1 Humid 0.62 Dry subhumid 1633 Humid88 36.1 Arid 27.6 Semiarid 26.6 Semihumid 0.59 Dry subhumid 1385 Humid89 50.6 Semiarid 38.2 Subhumid 36.8 Very Humid 0.81 Subhumid 895 Humid

Climate types and aridity indices
57
Num Lang FL
Thornthwaite IT
De Martonne IM UNEP Emberger
IE 90 45.6 Semiarid 34.2 Subhumid 33.0 Humid 0.72 Subhumid 1035 Humid91 51.4 Semiarid 38.8 Subhumid 37.4 Very Humid 0.82 Subhumid 909 Humid92 43.6 Semiarid 32.3 Subhumid 31.0 Humid 0.68 Subhumid 1455 Humid93 42.4 Semiarid 32.0 Subhumid 30.8 Humid 0.68 Subhumid 751 Humid94 39.0 Arid 29.3 Semiarid 28.2 Humid 0.62 Dry subhumid 885 Humid95 39.8 Arid 30.1 Semiarid 29.0 Humid 0.64 Dry subhumid 705 Humid96 47.3 Semiarid 35.1 Subhumid 33.7 Humid 0.73 Subhumid 1581 Humid97 43.5 Semiarid 32.6 Subhumid 31.5 Humid 0.69 Subhumid 987 Humid98 23.3 Arid 17.5 Semiarid 16.9 Semiarid 0.37 Semiarid 984 Humid99 53.3 Semiarid 40.8 Subhumid 39.4 Very Humid 0.87 Subhumid 2048 Humid
100 53.5 Semiarid 40.0 Subhumid 38.6 Very Humid 0.85 Subhumid 1213 Humid101 52.2 Semiarid 40.0 Subhumid 38.6 Very Humid 0.86 Subhumid 2005 Humid102 62.9 Subhumid 47.1 Subhumid 45.5 Very Humid 1.00 Subhumid 1427 Humid103 62.6 Subhumid 46.9 Subhumid 45.3 Very Humid 0.99 Subhumid 1421 Humid104 50.5 Semiarid 38.7 Subhumid 37.3 Very Humid 0.83 Subhumid 1940 Humid105 56.4 Semiarid 42.5 Subhumid 41.0 Very Humid 0.90 Subhumid 998 Humid106 52.8 Semiarid 39.5 Subhumid 38.1 Very Humid 0.84 Subhumid 1197 Humid107 12.9 Desert 9.7 Arid 9.4 Arid 0.21 Semiarid 545 Humid108 32.6 Arid 24.3 Semiarid 23.4 Mediterran 0.51 Dry subhumid 1469 Humid109 58.4 Semiarid 44.7 Subhumid 43.1 Very Humid 0.96 Subhumid 2241 Humid110 54.3 Semiarid 41.0 Subhumid 39.9 Very Humid 0.88 Subhumid 1716 Humid111 59.4 Semiarid 44.6 Subhumid 42.9 Very Humid 0.94 Subhumid 1347 Humid112 45.4 Semiarid 34.6 Subhumid 33.5 Humid 0.74 Subhumid 1344 Humid113 56.5 Semiarid 42.7 Subhumid 41.5 Very Humid 0.92 Subhumid 1785 Humid114 60.9 Subhumid 46.0 Subhumid 44.3 Very Humid 0.98 Subhumid 1077 Humid115 45.6 Semiarid 34.2 Subhumid 33.0 Humid 0.72 Subhumid 1035 Humid116 40.5 Semiarid 30.7 Semiarid 29.5 Humid 0.65 Dry subhumid 718 Humid117 41.8 Semiarid 31.6 Subhumid 30.4 Humid 0.67 Subhumid 740 Humid
The Thornthwaite and the UNEP indices are quite similar. Using Lang index the
region is more dry and more humid using the de Martonne and the Emberger indices.
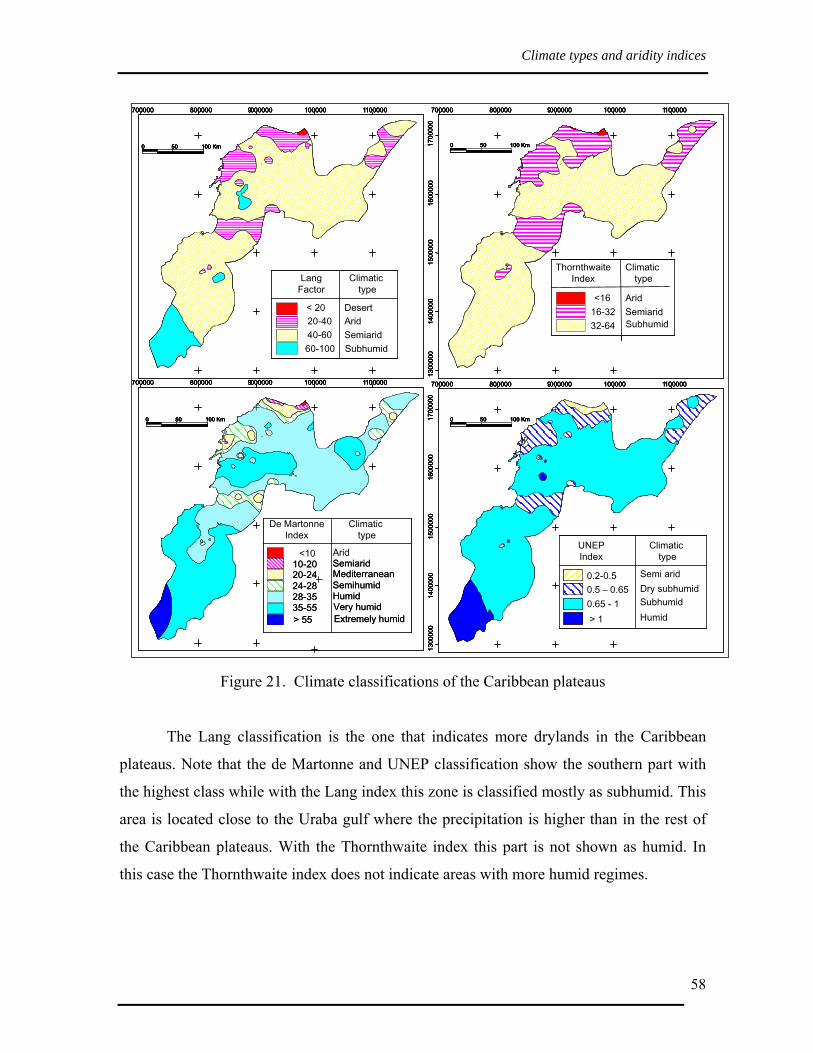
Climate types and aridity indices
58
Figure 21. Climate classifications of the Caribbean plateaus
The Lang classification is the one that indicates more drylands in the Caribbean
plateaus. Note that the de Martonne and UNEP classification show the southern part with
the highest class while with the Lang index this zone is classified mostly as subhumid. This
area is located close to the Uraba gulf where the precipitation is higher than in the rest of
the Caribbean plateaus. With the Thornthwaite index this part is not shown as humid. In
this case the Thornthwaite index does not indicate areas with more humid regimes.
700000 800000 9000000 100000 1100000
1300
000
1400
000
1500
000
1600
000
1700
000
Climatictype
UNEPIndex
0.65 - 1> 1
0.2-0.50.5 – 0.65
SubhumidHumid
Semi aridDry subhumid
0 50 100 Km
700000 800000 9000000 100000 1100000
Climatictype
< 20 Desert20-40 Arid40-60 Semiarid
Lang Factor
60-100 Subhumid
0 50 100 Km
700000 800000 9000000 100000 1100000
1300
000
1400
000
1500
000
1600
000
1700
000
Climatictype
ThornthwaiteIndex
<16 Arid16-32 Semiarid32-64 Subhumid
0 50 100 Km
700000 800000 9000000 100000 1100000
0 50 100 Km
Climatictype
De MartonneIndex
<10 Arid
35-55 Very humid
10-20 Semiarid20-24 Mediterranean24-28 Semihumid28-35 Humid
> 55 Extremely humid
700000 800000 9000000 100000 1100000
1300
000
1400
000
1500
000
1600
000
1700
000
Climatictype
UNEPIndex
0.65 - 1> 1
0.2-0.50.5 – 0.65
SubhumidHumid
Semi aridDry subhumid
0 50 100 Km
700000 800000 9000000 100000 1100000700000 800000 9000000 100000 1100000
1300
000
1400
000
1500
000
1600
000
1700
000
1300
000
1400
000
1500
000
1600
000
1700
000
Climatictype
UNEPIndex
0.65 - 1> 1
0.2-0.50.5 – 0.65
SubhumidHumid
Semi aridDry subhumid
Climatictype
UNEPIndex
0.65 - 1> 1
0.2-0.50.5 – 0.65
SubhumidHumid
Semi aridDry subhumid
0 50 100 Km0 50 100 Km0 50 100 Km
700000 800000 9000000 100000 1100000
Climatictype
< 20 Desert20-40 Arid40-60 Semiarid
Lang Factor
60-100 Subhumid
0 50 100 Km
700000 800000 9000000 100000 1100000700000 800000 9000000 100000 1100000
Climatictype
< 20 Desert20-40 Arid40-60 Semiarid
Lang Factor
60-100 Subhumid
Climatictype
< 20 Desert20-40 Arid40-60 Semiarid
Lang Factor
60-100 Subhumid
0 50 100 Km0 50 100 Km0 50 100 Km
700000 800000 9000000 100000 1100000
1300
000
1400
000
1500
000
1600
000
1700
000
Climatictype
ThornthwaiteIndex
<16 Arid16-32 Semiarid32-64 Subhumid
0 50 100 Km
700000 800000 9000000 100000 1100000700000 800000 9000000 100000 1100000
1300
000
1400
000
1500
000
1600
000
1700
000
1300
000
1400
000
1500
000
1600
000
1700
000
Climatictype
ThornthwaiteIndex
<16 Arid16-32 Semiarid32-64 Subhumid
0 50 100 Km0 50 100 Km0 50 100 Km
700000 800000 9000000 100000 1100000
0 50 100 Km
Climatictype
De MartonneIndex
<10 Arid
35-55 Very humid
10-20 Semiarid20-24 Mediterranean24-28 Semihumid28-35 Humid
> 55 Extremely humid
700000 800000 9000000 100000 1100000700000 800000 9000000 100000 1100000
0 50 100 Km0 50 100 Km0 50 100 Km
Climatictype
De MartonneIndex
<10 Arid
35-55 Very humid
10-20 Semiarid20-24 Mediterranean24-28 Semihumid28-35 Humid
> 55 Extremely humid
Climatictype
De MartonneIndex
<10 Arid
35-55 Very humid
10-20 Semiarid20-24 Mediterranean24-28 Semihumid28-35 Humid
> 55 Extremely humid35-55 Very humid
10-20 Semiarid20-24 Mediterranean24-28 Semihumid28-35 Humid
> 55 Extremely humid
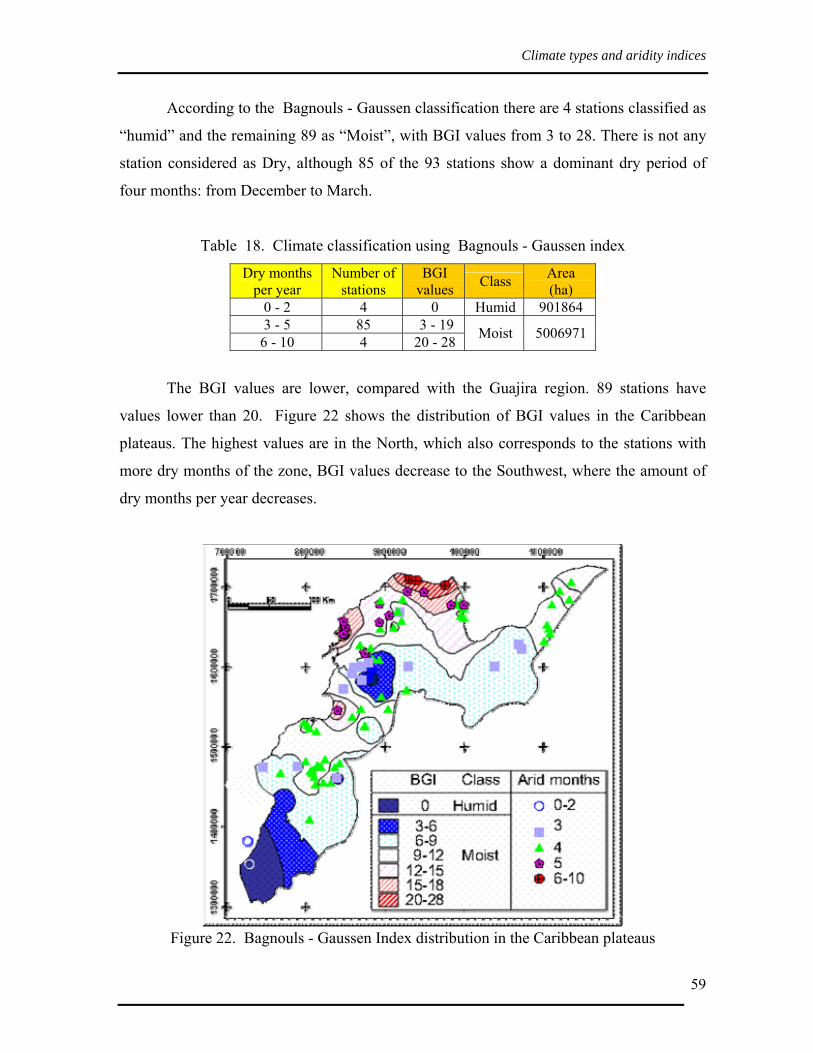
Climate types and aridity indices
59
According to the Bagnouls - Gaussen classification there are 4 stations classified as
“humid” and the remaining 89 as “Moist”, with BGI values from 3 to 28. There is not any
station considered as Dry, although 85 of the 93 stations show a dominant dry period of
four months: from December to March.
Table 18. Climate classification using Bagnouls - Gaussen index
Dry months per year
Number of stations
BGI values Class Area
(ha) 0 - 2 4 0 Humid 901864 3 - 5 85 3 - 19
6 - 10 4 20 - 28 Moist 5006971
The BGI values are lower, compared with the Guajira region. 89 stations have
values lower than 20. Figure 22 shows the distribution of BGI values in the Caribbean
plateaus. The highest values are in the North, which also corresponds to the stations with
more dry months of the zone, BGI values decrease to the Southwest, where the amount of
dry months per year decreases.
Figure 22. Bagnouls - Gaussen Index distribution in the Caribbean plateaus
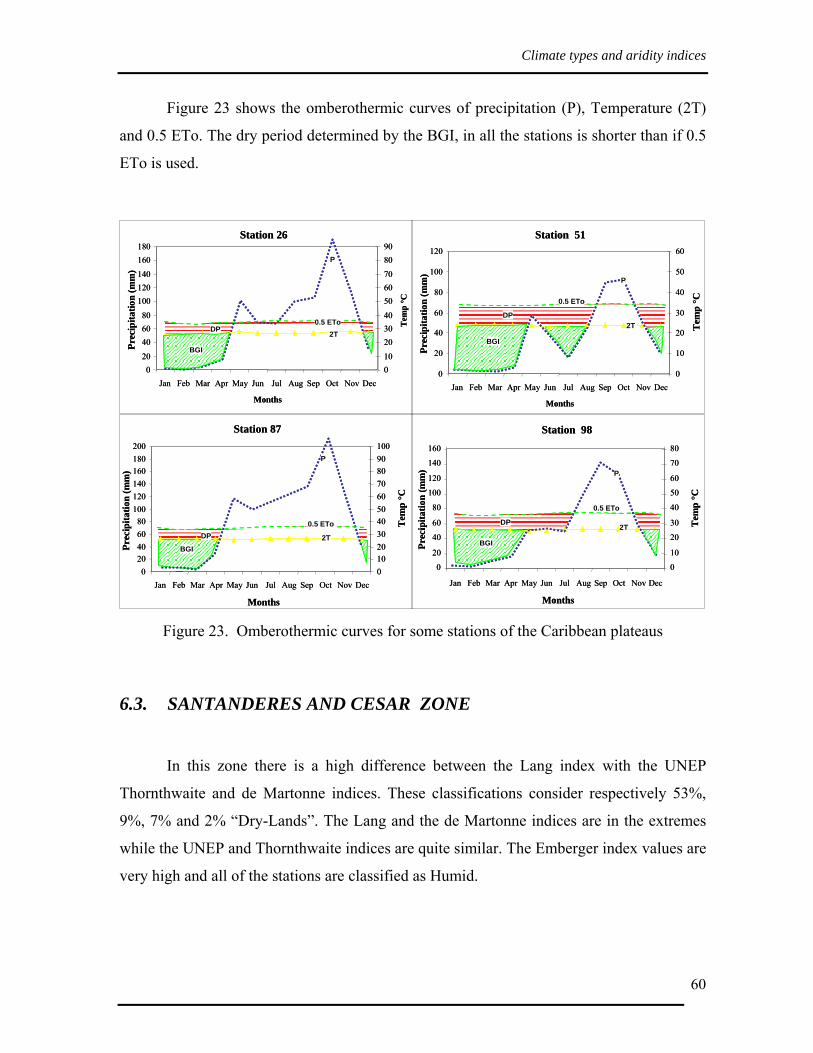
Climate types and aridity indices
60
Figure 23 shows the omberothermic curves of precipitation (P), Temperature (2T)
and 0.5 ETo. The dry period determined by the BGI, in all the stations is shorter than if 0.5
ETo is used.
Figure 23. Omberothermic curves for some stations of the Caribbean plateaus
6.3. SANTANDERES AND CESAR ZONE
In this zone there is a high difference between the Lang index with the UNEP
Thornthwaite and de Martonne indices. These classifications consider respectively 53%,
9%, 7% and 2% “Dry-Lands”. The Lang and the de Martonne indices are in the extremes
while the UNEP and Thornthwaite indices are quite similar. The Emberger index values are
very high and all of the stations are classified as Humid.
Station 98
Jan Feb Mar Apr May Jun Jul Aug Sep Oct Nov Dec
Months
Prec
ipita
tion
(mm
)
Tem
p°C
Station 87
020406080
100120140160180200
Jan Feb Mar Apr May Jun Jul Aug Sep Oct Nov Dec
Months
Prec
ipita
tion
(mm
)
0102030405060708090100
Tem
p°C
Station 26
020
406080
100120140
160180
Jan Feb Mar Apr May Jun Jul Aug Sep Oct Nov Dec
Months
Prec
ipita
tion
(mm
)
010
203040
506070
8090
Tem
p°C
Station 51
0
20
40
60
80
100
120
Jan Feb Mar Apr May Jun Jul Aug Sep Oct Nov Dec
Months
Prec
ipita
tion
(mm
)
0
10
20
30
40
50
60
Tem
p°C
0
20
40
60
80
100
120
140
160
0
10
20
30
40
50
60
70
80
2T
P
BGI
DP
2T
P
BGI
DP2T
P
BGI
DP
2T
P
BGI
DP0.5 ETo
0.5 ETo
0.5 ETo
0.5 ETo

Climate types and aridity indices
61
Table 19. Climate classifications of the Santanderes and Cesar zone
Num Lang FL
Thornthwaite IT
De Martonne IM UNEP Emberger
IE 118 57.1 Semiarid 38.9 Subhumid 37.6 Very Humid 0.76 Subhumid 2053 Humid119 35.8 Arid 26.4 Semiarid 25.3 Semihumid 0.55 Dry subhumid 1620 Humid120 28.8 Arid 20.5 Semiarid 19.6 Semiarid 0.41 Semiarid 1595 Humid121 76.1 Subhumid 52.6 Subhumid 50.4 Very Humid 1.03 Humid 2562 Humid122 57.7 Semiarid 39.7 Subhumid 38.1 Very Humid 0.78 Subhumid 1941 Humid123 31.0 Arid 23.3 Semiarid 22.5 Mediterran 0.50 Semiarid 775 Humid124 21.2 Arid 16.0 Arid 15.3 Semiarid 0.34 Semiarid 441 Humid125 33.7 Arid 25.3 Semiarid 24.4 Semihumid 0.54 Dry subhumid 765 Humid126 53.0 Semiarid 31.6 Subhumid 29.9 Humid 0.51 Dry subhumid 1931 Humid127 52.4 Semiarid 36.3 Subhumid 34.8 Humid 0.71 Subhumid 2915 Humid128 44.5 Semiarid 33.4 Subhumid 32.4 Humid 0.71 Subhumid 2232 Humid129 56.0 Semiarid 42.5 Subhumid 40.5 Very Humid 0.89 Subhumid 712 Humid130 32.6 Arid 24.8 Semiarid 23.8 Mediterran 0.53 Dry subhumid 606 Humid132 63.2 Subhumid 39.3 Subhumid 37.4 Very Humid 0.68 Subhumid 2140 Humid133 71.4 Subhumid 42.4 Subhumid 40.1 Very Humid 0.69 Subhumid 1448 Humid131 110.1 Humid 62.9 Subhumid 59.5 0.97 Subhumid 5624 Humid134 92.2 Subhumid 63.3 Humid 60.9 1.24 Humid 3103 Humid135 107.6 Humid 71.4 Humid 68.3 1.33 Humid 5331 Humid138 114.6 Humid 71.1 Humid 67.6
Extremely Humid
1.22 Humid 3859 Humid136 56.1 Semiarid 38.4 Subhumid 36.6 Very Humid 0.73 Subhumid 2005 Humid137 60.3 Subhumid 42.8 Subhumid 41.0 Very Humid 0.86 Subhumid 2144 Humid139 39.9 Arid 28.9 Semiarid 27.6 Semihumid 0.59 Dry subhumid 855 Humid140 86.8 Subhumid 59.6 Subhumid 57.0 1.15 Humid 4815 Humid142 92.0 Subhumid 61.0 Subhumid 58.3
Extremely Humid 1.14 Humid 4556 Humid
141 82.2 Subhumid 50.0 Subhumid 47.5 Very Humid 0.84 Subhumid 3167 Humid143 48.9 Semiarid 34.9 Subhumid 33.3 Humid 0.70 Subhumid 1001 Humid144 65.1 Subhumid 46.3 Subhumid 44.4 Very Humid 0.93 Subhumid 3610 Humid145 53.7 Semiarid 38.1 Subhumid 36.6 Very Humid 0.77 Subhumid 1440 Humid146 148.0 Humid 83.1 Humid 78.4 1.26 Humid 3785 Humid149 102.5 Humid 70.4 Humid 67.3
Extremely Humid 1.36 Humid 5689 Humid
147 57.7 Semiarid 41.0 Subhumid 39.3 Very Humid 0.83 Subhumid 3201 Humid148 46.3 Semiarid 33.1 Subhumid 31.7 Humid 0.67 Subhumid 1368 Humid150 72.9 Subhumid 44.5 Subhumid 42.1 Very Humid 0.74 Subhumid 2808 Humid151 57.3 Semiarid 33.4 Subhumid 31.2 Humid 0.52 Dry subhumid 1173 Humid152 83.1 Subhumid 55.0 Subhumid 52.7 Very Humid 1.03 Humid 4114 Humid153 46.3 Semiarid 32.7 Subhumid 31.4 Humid 0.66 Subhumid 977 Humid154 65.1 Subhumid 46.9 Subhumid 45.0 Very Humid 0.96 Subhumid 2502 Humid155 87.8 Subhumid 63.3 Humid 60.6 1.29 Humid 3373 Humid158 86.2 Subhumid 62.1 Subhumid 59.5
Extremely Humid 1.26 Humid 3312 Humid
156 66.0 Subhumid 47.6 Subhumid 45.6 Very Humid 0.97 Subhumid 2535 Humid157 46.1 Semiarid 28.3 Semiarid 26.7 Semihumid 0.47 Semiarid 1914 Humid159 75.3 Subhumid 42.7 Subhumid 40.6 Very Humid 0.66 Subhumid 3820 Humid160 53.9 Semiarid 37.0 Subhumid 35.4 Very Humid 0.72 Subhumid 2992 Humid

Climate types and aridity indices
62
Num Lang FL
Thornthwaite IT
De Martonne IM UNEP Emberger
IE 161 61.2 Subhumid 37.2 Subhumid 35.3 Very Humid 0.62 Dry subhumid 2356 Humid162 85.2 Subhumid 61.4 Subhumid 58.9 1.25 Humid 3275 Humid164 96.0 Subhumid 66.1 Humid 63.4
Extremely Humid 1.29 Humid 3229 Humid
163 47.6 Semiarid 32.7 Subhumid 31.2 Humid 0.63 Dry subhumid 2639 Humid165 74.2 Subhumid 56.0 Subhumid 54.1 Very Humid 1.19 Humid 1377 Humid166 85.3 Subhumid 61.4 Subhumid 58.9 1.25 Humid 2676 Humid167 98.3 Subhumid 70.9 Humid 67.8 1.44 Humid 3083 Humid170 81.7 Subhumid 58.2 Subhumid 55.7 1.17 Humid 4532 Humid182 81.3 Subhumid 61.6 Subhumid 58.7
Extremely Humid
1.29 Humid 1034 Humid168 24.0 Arid 18.0 Semiarid 17.5 Semiarid 0.39 Semiarid 1204 Humid169 32.6 Arid 24.8 Semiarid 23.8 Mediterran 0.53 Dry subhumid 606 Humid171 33.2 Arid 24.9 Semiarid 24.0 Mediterran 0.53 Dry subhumid 422 Humid172 70.0 Subhumid 47.8 Subhumid 46.0 Very Humid 0.93 Subhumid 2515 Humid173 69.2 Subhumid 47.5 Subhumid 45.4 Very Humid 0.92 Subhumid 3838 Humid174 75.4 Subhumid 51.8 Subhumid 49.5 Very Humid 1.00 Humid 4184 Humid175 37.8 Arid 28.8 Semiarid 27.3 Semihumid 0.60 Dry subhumid 481 Humid176 51.7 Semiarid 39.1 Subhumid 37.7 Very Humid 0.83 Subhumid 959 Humid177 67.6 Subhumid 51.4 Subhumid 48.8 Very Humid 1.07 Humid 860 Humid178 66.0 Subhumid 50.4 Subhumid 48.8 Very Humid 1.08 Humid 1849 Humid179 53.4 Semiarid 37.1 Subhumid 35.5 Very Humid 0.73 Subhumid 2972 Humid180 56.5 Semiarid 42.4 Subhumid 41.2 Very Humid 0.91 Subhumid 1050 Humid181 54.9 Semiarid 41.2 Subhumid 40.1 Very Humid 0.88 Subhumid 1020 Humid183 51.3 Semiarid 38.3 Subhumid 37.0 Very Humid 0.81 Subhumid 2360 Humid184 34.3 Arid 25.6 Semiarid 24.7 Semihumid 0.54 Dry subhumid 1577 Humid
Figure 24 demonstrates that dry lands are spread over the area and are not
continuous. For the Lang classification, the northern part is completely dry, with some
inclusions in the South. For the other indices, only a small part in the North is dry and other
small areas appear in the South. The non continuous distribution can be explained due to
this region is a complex of mountains and hills with different altitudes and intra-
mountainous valleys and canyons which gives a very heterogeneous and complex
distribution of wind and precipitation in this zone.
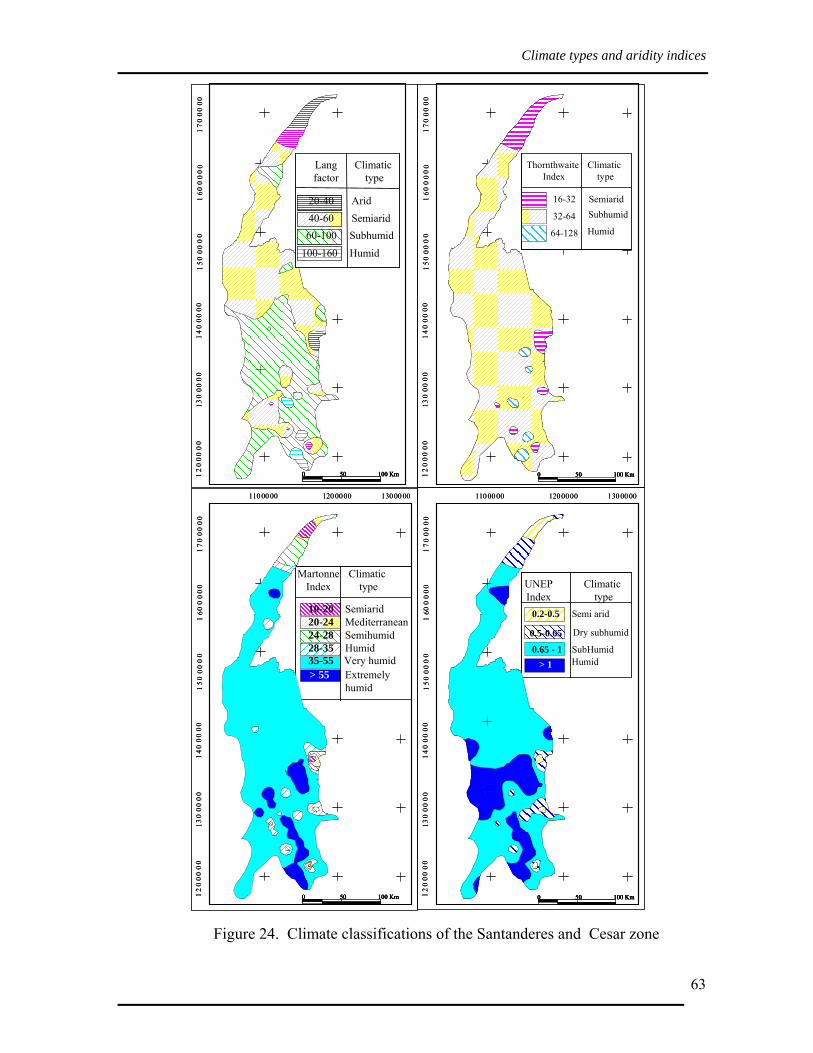
Climate types and aridity indices
63
Figure 24. Climate classifications of the Santanderes and Cesar zone
35-55 Very humid
10-20 Semiarid20-24 Mediterranean24-28 Semihumid28-35 Humid
Climatictype
MartonneIndex
> 55 Extremelyhumid
12
000
00
130
000
014
000
001
5000
00
160
00
00
17
000
00
Climatictype
20-40 Arid40-60 Semiarid
Lang factor
60-100 Subhumid100-160 Humid
12
00
00
013
000
00
140
0000
150
000
01
600
00
017
000
00
Climatictype
Thornthwaite Index
16-32 Semiarid
32-64
64-128
Subhumid
Humid
0 50 100 Km0 50 100 Km
Climatictype
UNEPIndex
0.2-0.5
0.65 - 1
Semi arid
SubHumid> 1 Humid
0.5-0.65 Dry subhumid
110 00 00 120 0000 1300000
12
000
00
130
0000
140
0000
150
000
01
600
00
017
000
00
1100000 1200000 1300000
12
000
00
130
000
014
000
001
5000
00
160
00
0017
000
00
0 50 100 Km0 50 100 Km
35-55 Very humid
10-20 Semiarid20-24 Mediterranean24-28 Semihumid28-35 Humid
Climatictype
MartonneIndex
> 55 Extremelyhumid
35-55 Very humid
10-20 Semiarid20-24 Mediterranean24-28 Semihumid28-35 Humid
Climatictype
MartonneIndex
> 55 Extremelyhumid
12
000
00
130
000
014
000
001
5000
00
160
00
00
17
000
00
Climatictype
20-40 Arid40-60 Semiarid
Lang factor
60-100 Subhumid100-160 Humid
12
00
00
013
000
00
140
0000
150
000
01
600
00
017
000
00
Climatictype
Thornthwaite Index
16-32 Semiarid
32-64
64-128
Subhumid
Humid
Climatictype
Thornthwaite Index
16-32 Semiarid
32-64
64-128
Subhumid
Humid
0 50 100 Km0 50 100 Km0 50 100 Km0 50 100 Km0 50 100 Km0 50 100 Km
Climatictype
UNEPIndex
0.2-0.5
0.65 - 1
Semi arid
SubHumid> 1 Humid
0.5-0.65 Dry subhumid
Climatictype
UNEPIndex
0.2-0.5
0.65 - 1
Semi arid
SubHumid> 1 Humid
0.5-0.65 Dry subhumid
110 00 00 120 0000 1300000
12
000
00
130
0000
140
0000
150
000
01
600
00
017
000
00
1100000 1200000 1300000
12
000
00
130
000
014
000
001
5000
00
160
00
0017
000
00
0 50 100 Km0 50 100 Km0 50 100 Km0 50 100 Km0 50 100 Km0 50 100 Km

Climate types and aridity indices
64
The Bagnouls - Gaussen Index gives a dominant “Moist” class with BGI values
lower than 16. Dry periods differ in this zone from 0 to 8 dry months per year. The BGI
index values vary from North to South with the highest values in the North and irregular
distribution in the central part. Figure 25 shows the BGI values and the distribution of dry
periods.
Table 20. Climate classification using Bagnouls - Gaussen
Dry months per year
Number of stations BGI values Area
(ha) 0 24 0 Humid 629654
1-2 20 1-4 3 - 5 19 5 - 12 6 - 8 4 12-16
Moist 3361407
Figure 25. Bagnouls - Gaussen Index distribution in the Santanderes and Cesar zone
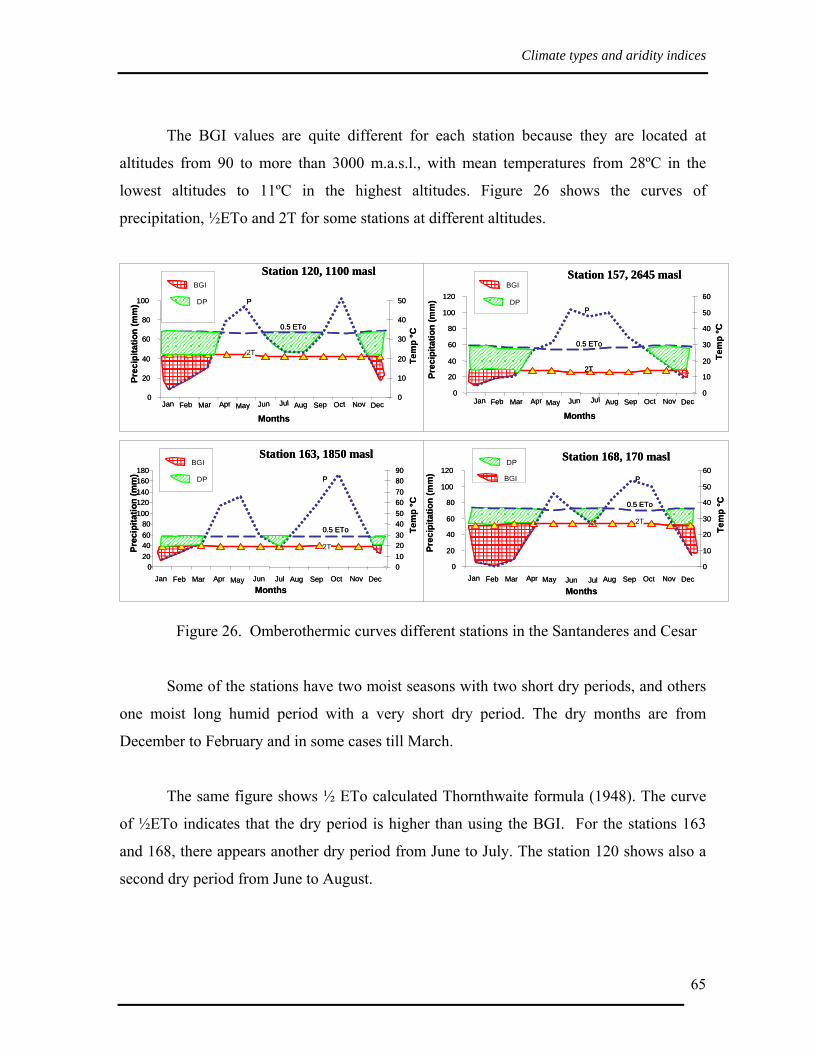
Climate types and aridity indices
65
The BGI values are quite different for each station because they are located at
altitudes from 90 to more than 3000 m.a.s.l., with mean temperatures from 28ºC in the
lowest altitudes to 11ºC in the highest altitudes. Figure 26 shows the curves of
precipitation, ½ETo and 2T for some stations at different altitudes.
Figure 26. Omberothermic curves different stations in the Santanderes and Cesar
Some of the stations have two moist seasons with two short dry periods, and others
one moist long humid period with a very short dry period. The dry months are from
December to February and in some cases till March.
The same figure shows ½ ETo calculated Thornthwaite formula (1948). The curve
of ½ETo indicates that the dry period is higher than using the BGI. For the stations 163
and 168, there appears another dry period from June to July. The station 120 shows also a
second dry period from June to August.
Station 120, 1100 masl
Station 168, 170 maslStation 163, 1850 masl
Jan Feb Mar Apr May Jun Jul Aug Sep Oct Nov DecMonths
020406080
100120140160180
Prec
ipita
tion
(mm
)
20
010
30405060708090
Tem
p°C
Station 157, 2645 masl
Prec
ipita
tion
(mm
)
Jan Feb Mar Apr May Jun Jul Aug Sep Oct Nov Dec
Months
0
20
40
60
80
100
120
0
10
20
30
40
50
60
Tem
p°C
Jan Feb Mar Apr May Jun Jul Aug Sep Oct Nov Dec
Months
0
20
40
60
80
100
Prec
ipita
tion
(mm
)
0
10
20
30
40
50
Tem
p°C
Prec
ipita
tion
(mm
)
Jan Feb Mar Apr May Jun Jul Aug Sep Oct Nov Dec
Months
0
20
40
60
80
100
120
0
10
20
30
40
50
60
Tem
p°C
P
2T
BGI
0.5 ETo
P
2T
BGI
0.5 ETo
P
2T
BGI
0.5 ETo
P
2T
BGI
0.5 ETo
DP DP
DP
DP

Climate types and aridity indices
66
6.4. CUNDIBOYACENSE HIGH PLATEAU
For this zone, the Lang and UNEP classifications are quite similar in surface area,
but not all the same stations are considered by both indices as Dry. The UNEP index
indicates that 45% of the zone is “Dry” given by 23 stations and the Lang index indicates
almost 44% with 20 stations. Table 21 shows the different stations and those classified as
“Dry” are highlighted. The Thornthwaite classification gives almost 13% of the zone as
“Dry”. With the de Martonne classification less than 1% and with the Emberger index all
the stations are classified as “Humid”.
Table 21. Climate indices of the Cundiboyacense high plateau
Num Lang FL
Thornthwaite IT
De Martonne IM UNEP Emberger
IE 185 39.3 Arid 24.3 Semiarid 23.1 Mediterran 0.42 Semiarid 3269 Humid186 50.7 Semiarid 30.8 Semiarid 29.3 Humid 0.52 Dry subhumid 2104 Humid187 56.7 Semiarid 33.9 Subhumid 32.3 Humid 0.56 Dry subhumid 3524 Humid188 56.0 Semiarid 38.2 Subhumid 36.4 Very Humid 0.73 Subhumid 2147 Humid189 62.1 Subhumid 37.2 Subhumid 35.4 Very Humid 0.61 Dry subhumid 3858 Humid190 54.1 Semiarid 33.2 Subhumid 31.7 Humid 0.57 Dry subhumid 2671 Humid191 51.7 Semiarid 32.2 Subhumid 30.7 Humid 0.56 Dry subhumid 1586 Humid192 58.8 Semiarid 35.0 Subhumid 33.4 Humid 0.58 Dry subhumid 2928 Humid193 60.8 Subhumid 37.1 Subhumid 35.4 Very Humid 0.63 Dry subhumid 2161 Humid194 82.5 Subhumid 49.4 Subhumid 46.9 Very Humid 0.81 Subhumid 5122 Humid195 99.7 Subhumid 57.4 Subhumid 54.5 Very Humid 0.90 Subhumid 7066 Humid196 43.0 Semiarid 26.8 Semiarid 25.5 Semihumid 0.46 Semiarid 1319 Humid197 77.2 Subhumid 44.5 Subhumid 42.2 Very Humid 0.70 Subhumid 5473 Humid198 66.3 Subhumid 40.5 Subhumid 38.6 Very Humid 0.68 Subhumid 4116 Humid199 63.1 Subhumid 38.3 Subhumid 36.5 Very Humid 0.64 Dry subhumid 2618 Humid200 72.4 Subhumid 43.3 Subhumid 41.2 Very Humid 0.71 Subhumid 4497 Humid201 76.6 Subhumid 46.5 Subhumid 44.3 Very Humid 0.78 Subhumid 3178 Humid202 69.2 Subhumid 41.4 Subhumid 39.4 Very Humid 0.68 Subhumid 4300 Humid203 67.6 Subhumid 42.1 Subhumid 40.2 Very Humid 0.73 Subhumid 2074 Humid204 52.8 Semiarid 32.4 Subhumid 30.9 Humid 0.55 Dry subhumid 2607 Humid205 46.5 Semiarid 44.8 Subhumid 27.3 Semihumid 0.76 Subhumid 2300 Humid206 46.1 Semiarid 28.5 Semiarid 27.1 Semihumid 0.49 Semiarid 3833 Humid207 57.3 Semiarid 34.8 Subhumid 33.1 Humid 0.58 Dry subhumid 2382 Humid208 48.2 Semiarid 30.0 Semiarid 28.6 Humid 0.52 Dry subhumid 1479 Humid209 61.1 Subhumid 37.1 Subhumid 35.4 Very Humid 0.62 Dry subhumid 2536 Humid210 50.0 Semiarid 34.1 Subhumid 32.5 Humid 0.65 Subhumid 2472 Humid211 48.0 Semiarid 28.7 Semiarid 27.3 Semihumid 0.47 Semiarid 2980 Humid212 50.6 Semiarid 30.7 Semiarid 29.3 Humid 0.52 Dry subhumid 2100 Humid213 73.0 Subhumid 45.7 Subhumid 43.4 Very Humid 0.79 Subhumid 2240 Humid
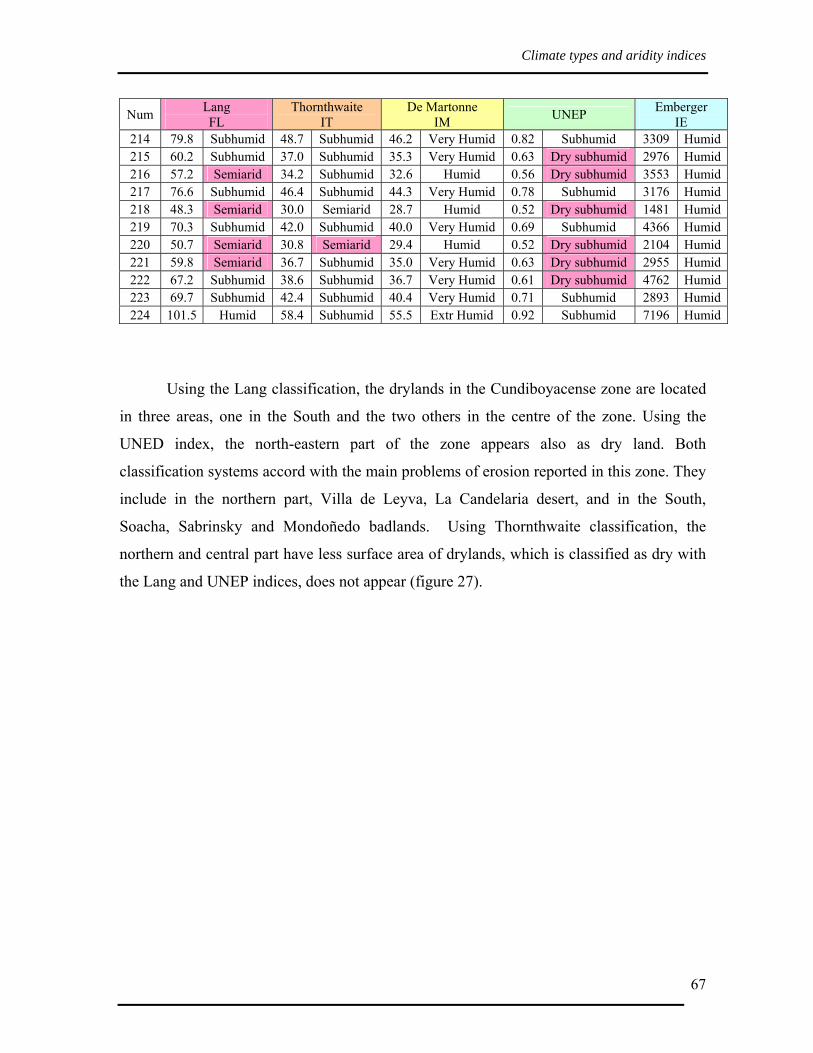
Climate types and aridity indices
67
Num Lang FL
Thornthwaite IT
De Martonne IM UNEP Emberger
IE 214 79.8 Subhumid 48.7 Subhumid 46.2 Very Humid 0.82 Subhumid 3309 Humid215 60.2 Subhumid 37.0 Subhumid 35.3 Very Humid 0.63 Dry subhumid 2976 Humid216 57.2 Semiarid 34.2 Subhumid 32.6 Humid 0.56 Dry subhumid 3553 Humid217 76.6 Subhumid 46.4 Subhumid 44.3 Very Humid 0.78 Subhumid 3176 Humid218 48.3 Semiarid 30.0 Semiarid 28.7 Humid 0.52 Dry subhumid 1481 Humid219 70.3 Subhumid 42.0 Subhumid 40.0 Very Humid 0.69 Subhumid 4366 Humid220 50.7 Semiarid 30.8 Semiarid 29.4 Humid 0.52 Dry subhumid 2104 Humid221 59.8 Semiarid 36.7 Subhumid 35.0 Very Humid 0.63 Dry subhumid 2955 Humid222 67.2 Subhumid 38.6 Subhumid 36.7 Very Humid 0.61 Dry subhumid 4762 Humid223 69.7 Subhumid 42.4 Subhumid 40.4 Very Humid 0.71 Subhumid 2893 Humid224 101.5 Humid 58.4 Subhumid 55.5 Extr Humid 0.92 Subhumid 7196 Humid
Using the Lang classification, the drylands in the Cundiboyacense zone are located
in three areas, one in the South and the two others in the centre of the zone. Using the
UNED index, the north-eastern part of the zone appears also as dry land. Both
classification systems accord with the main problems of erosion reported in this zone. They
include in the northern part, Villa de Leyva, La Candelaria desert, and in the South,
Soacha, Sabrinsky and Mondoñedo badlands. Using Thornthwaite classification, the
northern and central part have less surface area of drylands, which is classified as dry with
the Lang and UNEP indices, does not appear (figure 27).
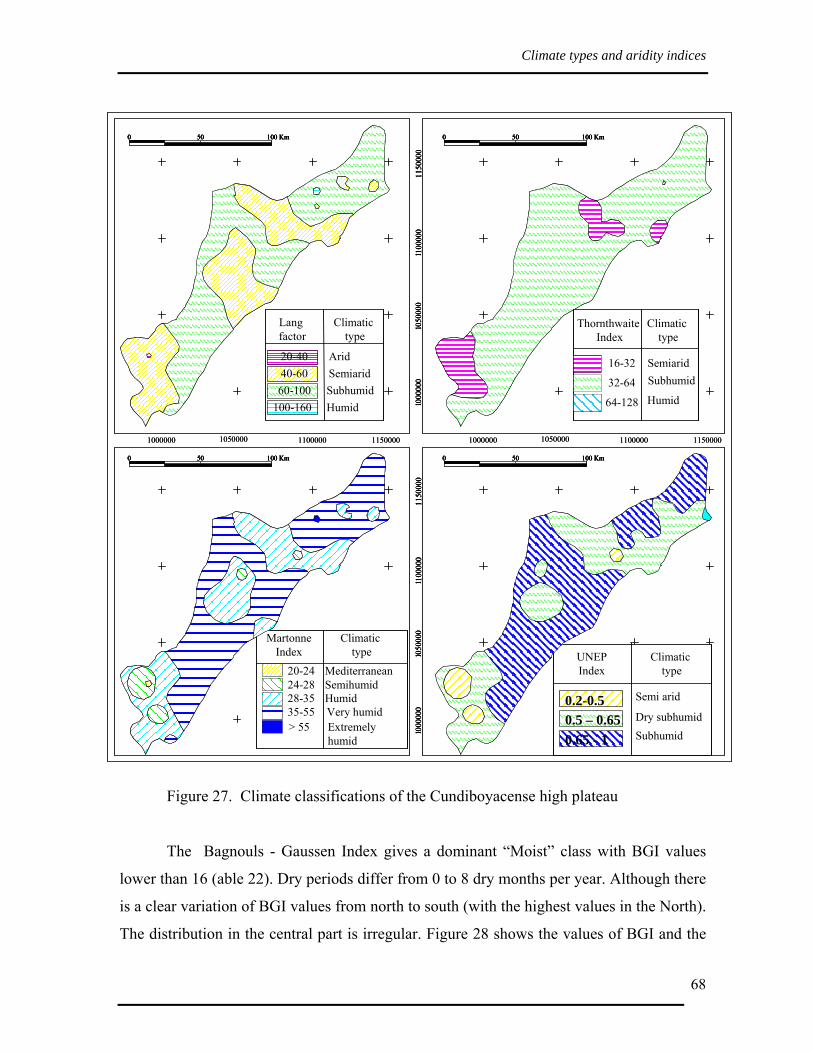
Climate types and aridity indices
68
Figure 27. Climate classifications of the Cundiboyacense high plateau
The Bagnouls - Gaussen Index gives a dominant “Moist” class with BGI values
lower than 16 (able 22). Dry periods differ from 0 to 8 dry months per year. Although there
is a clear variation of BGI values from north to south (with the highest values in the North).
The distribution in the central part is irregular. Figure 28 shows the values of BGI and the
Climatictype
UNEPIndex
0.65 - 1
0.2-0.50.5 – 0.65
Subhumid
Semi arid
Dry subhumid35-55 Very humid
20-24 Mediterranean24-28 Semihumid28-35 Humid
Climatictype
Martonne Index
> 55 Extremelyhumid
Climatictype
20-40 Arid40-60 Semiarid
Lang factor
60-100 Subhumid100-160 Humid 10
0000
010
5000
01 1
0000
011
5000
0
Climatictype
Thornthwaite Index
16-32 Semiarid
32-64
64-128
Subhumid
Humid
0 50 100 Km 0 50 100 Km
1000000 1050000 1100000 1150000
1000
000
1050
000
1 100
000
1150
000
1000000 1050000 1100000 1150000
0 50 100 Km 0 50 100 Km
Climatictype
UNEPIndex
0.65 - 1
0.2-0.50.5 – 0.65
Subhumid
Semi arid
Dry subhumid35-55 Very humid
20-24 Mediterranean24-28 Semihumid28-35 Humid
Climatictype
Martonne Index
> 55 Extremelyhumid
35-55 Very humid
20-24 Mediterranean24-28 Semihumid28-35 Humid
Climatictype
Martonne Index
> 55 Extremelyhumid
Climatictype
20-40 Arid40-60 Semiarid
Lang factor
60-100 Subhumid100-160 Humid 10
0000
010
5000
01 1
0000
011
5000
010
0000
010
5000
01 1
0000
011
5000
0
Climatictype
Thornthwaite Index
16-32 Semiarid
32-64
64-128
Subhumid
Humid
0 50 100 Km0 50 100 Km0 50 100 Km 0 50 100 Km0 50 100 Km0 50 100 Km
1000000 1050000 1100000 1150000
1000
000
1050
000
1 100
000
1150
000
1000
000
1050
000
1 100
000
1150
000
1000000 1050000 1100000 1150000
0 50 100 Km0 50 100 Km0 50 100 Km 0 50 100 Km0 50 100 Km0 50 100 Km
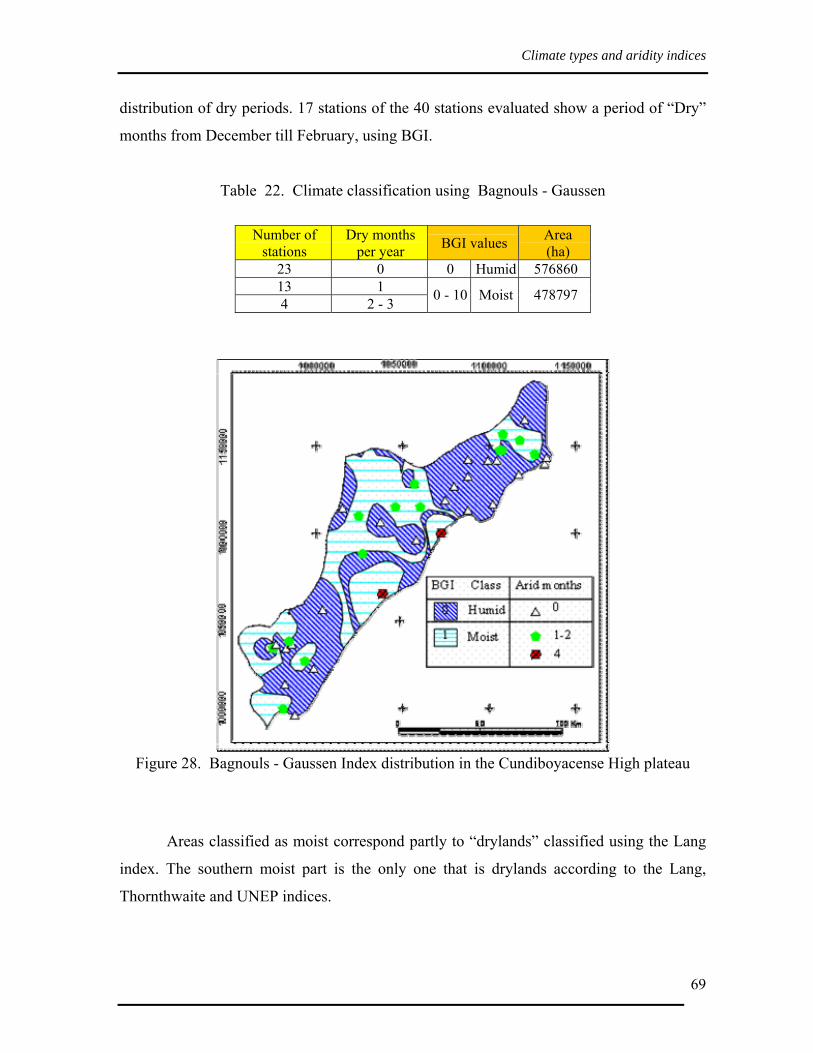
Climate types and aridity indices
69
distribution of dry periods. 17 stations of the 40 stations evaluated show a period of “Dry”
months from December till February, using BGI.
Table 22. Climate classification using Bagnouls - Gaussen
Number of
stations Dry months
per year BGI values Area (ha)
23 0 0 Humid 576860 13 1 4 2 - 3 0 - 10 Moist 478797
Figure 28. Bagnouls - Gaussen Index distribution in the Cundiboyacense High plateau
Areas classified as moist correspond partly to “drylands” classified using the Lang
index. The southern moist part is the only one that is drylands according to the Lang,
Thornthwaite and UNEP indices.

Climate types and aridity indices
70
Figure 29 shows the curves of precipitation (P), Temperature (2T) and ½ ETo of
some stations evaluated in the Cundiboyacense high plateau. Using the BGI classification,
dry periods are less than three months but if ½ ETo is used, the dry period increases and
some stations (i.e. 185 and 186) show a second dry period from June to September of
almost the same magnitude. BGI also seems to underestimate in this case the dry periods.
Figure 29. Omberothermic curves for the Cundiboyacense high plateau
Station 188 (Macheta), 2100 masl
Jan Feb Mar Apr May Jun Jul Aug Sep Oct Nov Dec
Months
20406080
100120140160180
Prec
ipita
tion
(mm
)
0102030405060708090
Tem
p°C
Station 186 (Duitama), 2532 masl
Jan Feb Mar Apr May Jun Jul Aug Sep Oct Nov Dec
Months
0
20
40
60
80
100
120
Prec
ipita
tion
(mm
)
Station 185 (Mosquera), 2550 masl
Jan Feb Mar Apr May Jun Jul Aug Sep Oct Nov Dec
Months
0
20
40
60
80
100
120
Prec
ipita
tion
(mm
)
0
10
20
30
40
50
60
Tem
p°C
Station 187 (El Hato), 3100 masl
Jan Feb Mar Apr May Jun Jul Aug Sep Oct Nov Dec
Months
0
20
40
60
80
100
120
Prec
ipita
tion
(mm
)
0
10
20
30
40
50
60
Tem
p°C
P
2T
BGI
½ ETo
BGI
P
2T
BGIBGI
0
10
20
30
40
50
60
Tem
p°C
DPDP
DPDP
½ ETo
P
2T½ ETo
0
P
2T
½ ETo

Climate types and aridity indices
71
6.5. HIGH MAGDALENA BASIN
In this zone, 33% of the area is considered “dry” according to the Lang Index. The
Thornthwaite and UNEP classifications result in only 1% and the de Martonne, and the
Emberger index considers all the area as humid. In this case there is a high difference
between Lang index and the remaining four indices.
Table 23. Climate classifications of the Low Magdalena basin
Num Lang FL
Thornthwaite IT
De Martonne IM UNEP Emberger
IE 225 45.7 Semiarid 34.6 Subhumid 33.5 Humid 0.74 Subhumid 2080 Humid226 41.3 Semiarid 31.7 Subhumid 30.5 Humid 0.68 Subhumid 934 Humid227 45.7 Semiarid 34.5 Subhumid 33.3 Humid 0.74 Subhumid 2518 Humid228 47.2 Semiarid 35.9 Subhumid 34.6 Humid 0.77 Subhumid 1683 Humid229 55.4 Semiarid 41.6 Subhumid 40.1 Very Humid 0.88 Subhumid 2775 Humid231 75.5 Subhumid 54.9 Subhumid 52.7 Very Humid 1.13 Humid 1627 Humid234 83.0 Subhumid 57.2 Subhumid 54.7 Very Humid 1.11 Humid 4626 Humid232 67.9 Subhumid 49.7 Subhumid 47.7 Very Humid 1.03 Humid 1245 Humid230 127.1 Humid 92.0 Humid 88.3 1.88 Humid 7086 Humid233 80.6 Subhumid 58.0 Subhumid 55.6 1.18 Humid 2515 Humid235 104.1 Humid 73.6 Humid 70.5 1.47 Humid 8712 Humid236 92.0 Subhumid 65.4 Humid 62.2 1.30 Humid 2878 Humid237 94.6 Subhumid 66.8 Humid 63.9 1.33 Humid 3365 Humid240 99.2 Subhumid 69.2 Humid 66.1 1.36 Humid 4498 Humid243 89.2 Subhumid 62.9 Subhumid 60.2 1.25 Humid 2217 Humid247 101.7 Humid 69.7 Humid 66.6
Extremely Humid
1.34 Humid 8501 Humid238 70.6 Subhumid 49.2 Subhumid 47.0 Very Humid 0.96 Subhumid 5049 Humid239 59.1 Semiarid 40.6 Subhumid 38.7 Very Humid 0.78 Subhumid 3278 Humid241 64.0 Subhumid 44.7 Subhumid 42.7 Very Humid 0.88 Subhumid 4589 Humid242 68.3 Subhumid 49.3 Subhumid 47.3 Very Humid 1.01 Humid 1207 Humid244 68.1 Subhumid 47.4 Subhumid 45.2 Very Humid 0.93 Subhumid 3792 Humid245 52.7 Semiarid 36.0 Subhumid 34.4 Humid 0.69 Subhumid 3768 Humid246 67.3 Subhumid 46.5 Subhumid 44.4 Very Humid 0.91 Subhumid 3391 Humid248 57.4 Semiarid 39.5 Subhumid 37.7 Very Humid 0.76 Subhumid 3185 Humid249 94.5 Subhumid 64.9 Humid 61.9 1.25 Humid 5246 Humid250 141.8 Humid 99.6 Humid 95.1 1.97 Humid 7915 Humid251 100.6 Humid 68.6 Humid 65.4 1.31 Humid 3379 Humid252 85.4 Subhumid 59.2 Subhumid 56.6
Extremely Humid
1.16 Humid 3050 Humid253 88.6 Subhumid 62.3 Subhumid 59.4 1.23 Humid 3164 Humid254 94.9 Subhumid 65.5 Humid 62.5 1.27 Humid 4362 Humid256 111.1 Humid 76.1 Humid 72.4
Extremely Humid 1.46 Humid 6199 Humid
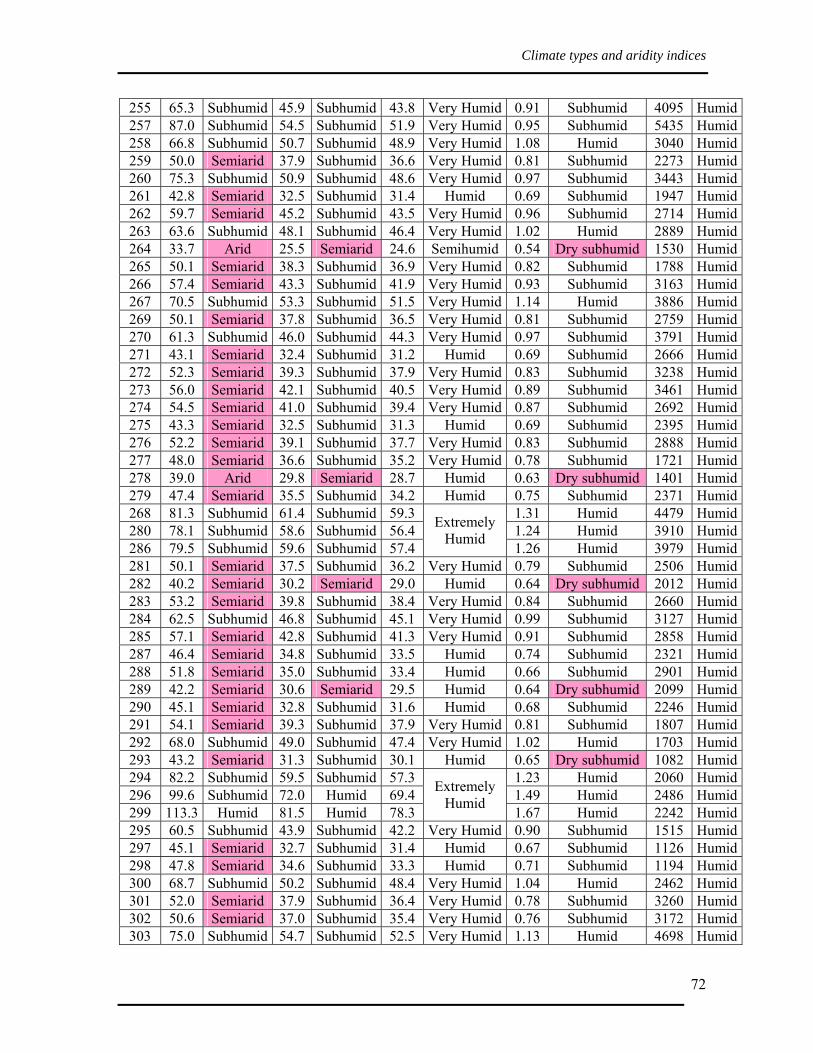
Climate types and aridity indices
72
255 65.3 Subhumid 45.9 Subhumid 43.8 Very Humid 0.91 Subhumid 4095 Humid257 87.0 Subhumid 54.5 Subhumid 51.9 Very Humid 0.95 Subhumid 5435 Humid258 66.8 Subhumid 50.7 Subhumid 48.9 Very Humid 1.08 Humid 3040 Humid259 50.0 Semiarid 37.9 Subhumid 36.6 Very Humid 0.81 Subhumid 2273 Humid260 75.3 Subhumid 50.9 Subhumid 48.6 Very Humid 0.97 Subhumid 3443 Humid261 42.8 Semiarid 32.5 Subhumid 31.4 Humid 0.69 Subhumid 1947 Humid262 59.7 Semiarid 45.2 Subhumid 43.5 Very Humid 0.96 Subhumid 2714 Humid263 63.6 Subhumid 48.1 Subhumid 46.4 Very Humid 1.02 Humid 2889 Humid264 33.7 Arid 25.5 Semiarid 24.6 Semihumid 0.54 Dry subhumid 1530 Humid265 50.1 Semiarid 38.3 Subhumid 36.9 Very Humid 0.82 Subhumid 1788 Humid266 57.4 Semiarid 43.3 Subhumid 41.9 Very Humid 0.93 Subhumid 3163 Humid267 70.5 Subhumid 53.3 Subhumid 51.5 Very Humid 1.14 Humid 3886 Humid269 50.1 Semiarid 37.8 Subhumid 36.5 Very Humid 0.81 Subhumid 2759 Humid270 61.3 Subhumid 46.0 Subhumid 44.3 Very Humid 0.97 Subhumid 3791 Humid271 43.1 Semiarid 32.4 Subhumid 31.2 Humid 0.69 Subhumid 2666 Humid272 52.3 Semiarid 39.3 Subhumid 37.9 Very Humid 0.83 Subhumid 3238 Humid273 56.0 Semiarid 42.1 Subhumid 40.5 Very Humid 0.89 Subhumid 3461 Humid274 54.5 Semiarid 41.0 Subhumid 39.4 Very Humid 0.87 Subhumid 2692 Humid275 43.3 Semiarid 32.5 Subhumid 31.3 Humid 0.69 Subhumid 2395 Humid276 52.2 Semiarid 39.1 Subhumid 37.7 Very Humid 0.83 Subhumid 2888 Humid277 48.0 Semiarid 36.6 Subhumid 35.2 Very Humid 0.78 Subhumid 1721 Humid278 39.0 Arid 29.8 Semiarid 28.7 Humid 0.63 Dry subhumid 1401 Humid279 47.4 Semiarid 35.5 Subhumid 34.2 Humid 0.75 Subhumid 2371 Humid268 81.3 Subhumid 61.4 Subhumid 59.3 1.31 Humid 4479 Humid280 78.1 Subhumid 58.6 Subhumid 56.4 1.24 Humid 3910 Humid286 79.5 Subhumid 59.6 Subhumid 57.4
Extremely Humid 1.26 Humid 3979 Humid
281 50.1 Semiarid 37.5 Subhumid 36.2 Very Humid 0.79 Subhumid 2506 Humid282 40.2 Semiarid 30.2 Semiarid 29.0 Humid 0.64 Dry subhumid 2012 Humid283 53.2 Semiarid 39.8 Subhumid 38.4 Very Humid 0.84 Subhumid 2660 Humid284 62.5 Subhumid 46.8 Subhumid 45.1 Very Humid 0.99 Subhumid 3127 Humid285 57.1 Semiarid 42.8 Subhumid 41.3 Very Humid 0.91 Subhumid 2858 Humid287 46.4 Semiarid 34.8 Subhumid 33.5 Humid 0.74 Subhumid 2321 Humid288 51.8 Semiarid 35.0 Subhumid 33.4 Humid 0.66 Subhumid 2901 Humid289 42.2 Semiarid 30.6 Semiarid 29.5 Humid 0.64 Dry subhumid 2099 Humid290 45.1 Semiarid 32.8 Subhumid 31.6 Humid 0.68 Subhumid 2246 Humid291 54.1 Semiarid 39.3 Subhumid 37.9 Very Humid 0.81 Subhumid 1807 Humid292 68.0 Subhumid 49.0 Subhumid 47.4 Very Humid 1.02 Humid 1703 Humid293 43.2 Semiarid 31.3 Subhumid 30.1 Humid 0.65 Dry subhumid 1082 Humid294 82.2 Subhumid 59.5 Subhumid 57.3 1.23 Humid 2060 Humid296 99.6 Subhumid 72.0 Humid 69.4 1.49 Humid 2486 Humid299 113.3 Humid 81.5 Humid 78.3
Extremely Humid 1.67 Humid 2242 Humid
295 60.5 Subhumid 43.9 Subhumid 42.2 Very Humid 0.90 Subhumid 1515 Humid297 45.1 Semiarid 32.7 Subhumid 31.4 Humid 0.67 Subhumid 1126 Humid298 47.8 Semiarid 34.6 Subhumid 33.3 Humid 0.71 Subhumid 1194 Humid300 68.7 Subhumid 50.2 Subhumid 48.4 Very Humid 1.04 Humid 2462 Humid301 52.0 Semiarid 37.9 Subhumid 36.4 Very Humid 0.78 Subhumid 3260 Humid302 50.6 Semiarid 37.0 Subhumid 35.4 Very Humid 0.76 Subhumid 3172 Humid303 75.0 Subhumid 54.7 Subhumid 52.5 Very Humid 1.13 Humid 4698 Humid

Climate types and aridity indices
73
304 63.0 Subhumid 46.0 Subhumid 44.1 Very Humid 0.95 Subhumid 3946 Humid305 59.0 Semiarid 42.7 Subhumid 41.0 Very Humid 0.88 Subhumid 3291 Humid307 65.2 Subhumid 47.4 Subhumid 45.6 Very Humid 0.98 Subhumid 1406 Humid308 75.4 Subhumid 54.9 Subhumid 52.7 Very Humid 1.13 Humid 1626 Humid306 115.5 Humid 83.6 Humid 80.2 1.71 Humid 6440 Humid309 79.5 Subhumid 58.2 Subhumid 55.8
Extremely Humid 1.20 Humid 1458 Humid
310 44.9 Semiarid 32.9 Subhumid 31.6 Humid 0.68 Subhumid 824 Humid311 76.9 Subhumid 54.4 Subhumid 52.0 Very Humid 1.09 Humid 2406 Humid312 66.9 Subhumid 46.6 Subhumid 44.6 Very Humid 0.92 Subhumid 3033 Humid313 67.9 Subhumid 47.5 Subhumid 45.3 Very Humid 0.93 Subhumid 3080 Humid314 64.5 Subhumid 45.0 Subhumid 43.0 Very Humid 0.88 Subhumid 2925 Humid315 59.6 Semiarid 41.5 Subhumid 39.7 Very Humid 0.82 Subhumid 2702 Humid316 69.5 Subhumid 48.2 Subhumid 46.1 Very Humid 0.94 Subhumid 5801 Humid317 53.8 Semiarid 37.6 Subhumid 35.9 Very Humid 0.74 Subhumid 3857 Humid318 106.0 Humid 73.7 Humid 70.4 1.44 Humid 5903 Humid319 82.2 Subhumid 57.6 Subhumid 55.1 1.14 Humid 5144 Humid320 93.1 Subhumid 65.2 Humid 62.4
Extremely Humid 1.29 Humid 5827 Humid
321 63.0 Subhumid 43.0 Subhumid 41.1 Very Humid 0.83 Subhumid 3514 Humid
The dry part in this zone is located along the Magdalena River in the centre of the
zone from North to South and includes the named Tatacoa desert. This part is delineated
using only the Lang index. The Tatacoa Desert (figure 31) and other areas with severe
erosion and xerophytes are not shown using the Thornthwaite or UNEP indices. In this case
the Lang index is the only one that is representing the dry lands for this zone. The Tatacoa
named “desert” (figure 30) is a dry ecosystem of badlands and xerophitic vegetation of
more than 300000 hectares delineated clearly using aerial photographs. The fact that this
region is not considered as dry land using the UNEP or Thornthwaite climate classification,
may be due to the lack of available stations.
Figure 30. Tatacoa named “desert”
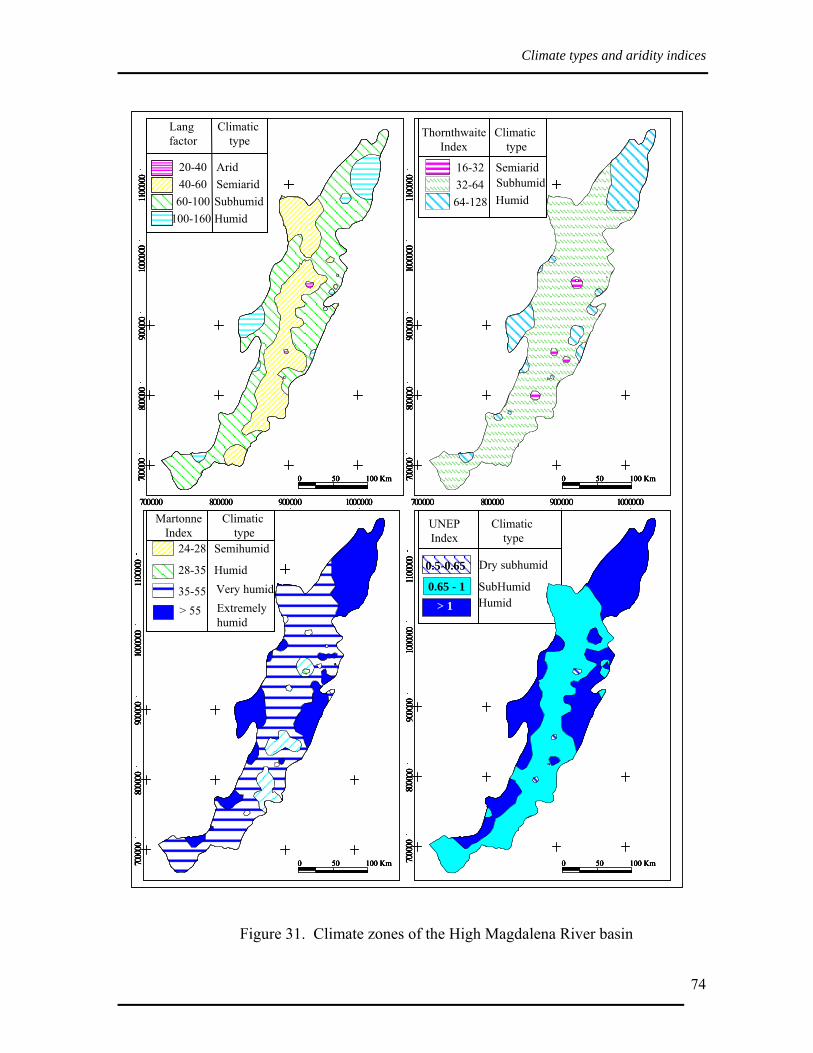
Climate types and aridity indices
74
Figure 31. Climate zones of the High Magdalena River basin
Climatictype
UNEPIndex
0.65 - 1 SubHumid> 1 Humid
0.5-0.65 Dry subhumid
Climatictype
20-40 Arid40-60 Semiarid
Lang factor
60-100 Subhumid100-160 Humid
7000
0080
000 0
9000
0010
0000
011
0000
0
7000
0080
0000
9000
0010
0000
011
0000
0
7000
0080
0000
9 000
001 0
0000
011
0000
0
700000 800000 900000 1000000
7000
0080
0 000
900 0
0010
0000
011
0000
0
Climatictype
ThornthwaiteIndex
16-32 Semiarid32-6464-128
SubhumidHumid
35-55 Very humid
24-28 Semihumid
28-35 Humid
Climatictype
MartonneIndex
> 55 Extremelyhumid
700000 800000 900000 1000000
0 50 100 Km0 50 100 Km
0 50 100 Km0 50 100 Km
Climatictype
UNEPIndex
0.65 - 1 SubHumid> 1 Humid
0.5-0.65 Dry subhumid
Climatictype
UNEPIndex
0.65 - 1 SubHumid> 1 Humid
0.5-0.65 Dry subhumid
Climatictype
20-40 Arid40-60 Semiarid
Lang factor
60-100 Subhumid100-160 Humid
Climatictype
20-40 Arid40-60 Semiarid
Lang factor
60-100 Subhumid100-160 Humid
7000
0080
000 0
9000
0010
0000
011
0000
070
0000
7000
0080
000 0
8000
0 090
0000
9000
0010
0000
010
0000
011
0000
011
0000
0
7000
0080
0000
9000
0010
0000
011
0000
070
0000
7000
0080
0000
8000
0090
0000
9000
0010
0000
010
0000
011
0000
011
0000
0
7000
0080
0000
9 000
001 0
0000
011
0000
070
0000
7000
0080
0000
8000
009 0
0000
9 000
001 0
0000
01 0
0000
011
0000
011
0000
0
700000 800000 900000 1000000700000 800000 900000 1000000
7000
0080
0 000
900 0
0010
0000
011
0000
070
0000
7000
0080
0 000
800 0
0090
0 000
900 0
0010
0000
010
0000
011
0000
011
0000
0
Climatictype
ThornthwaiteIndex
16-32 Semiarid32-6464-128
SubhumidHumid
35-55 Very humid
24-28 Semihumid
28-35 Humid
Climatictype
MartonneIndex
> 55 Extremelyhumid
35-55 Very humid
24-28 Semihumid
28-35 Humid
Climatictype
MartonneIndex
> 55 Extremelyhumid
700000 800000 900000 1000000700000 800000 900000 1000000
0 50 100 Km0 50 100 Km0 50 100 Km0 50 100 Km0 50 100 Km0 50 100 Km
0 50 100 Km0 50 100 Km0 50 100 Km0 50 100 Km0 50 100 Km0 50 100 Km

Climate types and aridity indices
75
Using the Bagnouls - Gaussen classification, the Magdalena zone is considered
between humid and moist. From the 97 stations, 54 are considered humid and 43 moist
with BGI values lower than 8. 23 stations show a dry period between 2 to 3 months and
only 4 have 4 months of dry period (table 24).
Table 24. Bagnouls - Gaussen classification of the High Magdalena River basin
Number of
stations Dry months
per year BGI values Area (ha)
54 0 0 Humid 2069781 16 1 23 2 - 3 1 - 6
4 4 7 - 8 Moist 1894561
Figure 32. Bagnouls - Gaussen Index distribution in the High Magdalena River basin

Climate types and aridity indices
76
Comparing the BGI and the ETo by Thornthwaite, values for determining dry
months are also lower if two times the temperature is used than if half of the ETo is used.
Figure 33 shows the precipitation values (P), half ETo, and temperature (2T) for some
stations of the Magdalena zone. From this figure dry periods using BGI occur only in
station 270 and it last only two months, between August and September, but using ½ ETo
the dry period appears in all stations and lasts for almost three months.
Figure 33. Omberothermic curves for the Magdalena river basin
Dry period in the Magdalena zone does not occur from December to February as is
common for the previous study zones, but here from June or July to September, which is
the second shortest dry period compared to the other zones.
Station 248, (1550 masl)
020406080
100120140160180200
Jan Feb Mar Apr May Jun Jul Aug Sep Oct Nov Dec
Months
Prec
ipita
tion
(mm
)
0102030405060708090100
Tem
p°C
P
2T
DP
0.5 ETo
DPBGI
Station 270 (370 masl)
020406080
100120140160180200220240
Jan Feb Mar Apr May Jun Jul Aug Sep Oct Nov Dec
Months
Prec
ipita
tion
(mm
)
0102030405060708090100
Tem
p°C
P
2T
0.5 ETo
Station 302 (1950 masl)
0
20
40
60
80
100
120
140
160
Jan Feb Mar Apr May Jun Jul Aug Sep Oct Nov Dec
Months
Prec
ipita
tion
(mm
)
0102030405060708090100
Tem
p°C
DP
Station 310 (1155 masl)
Months
Prec
ipita
tion
(mm
)
Tem
p°C
0
20
40
60
80
100
120
140
Jan Feb Mar Apr May Jun Jul Aug Sep Oct Nov Dec0102030405060708090100
P
2T
0.5 ETo
P
2T
0.5 EToDP
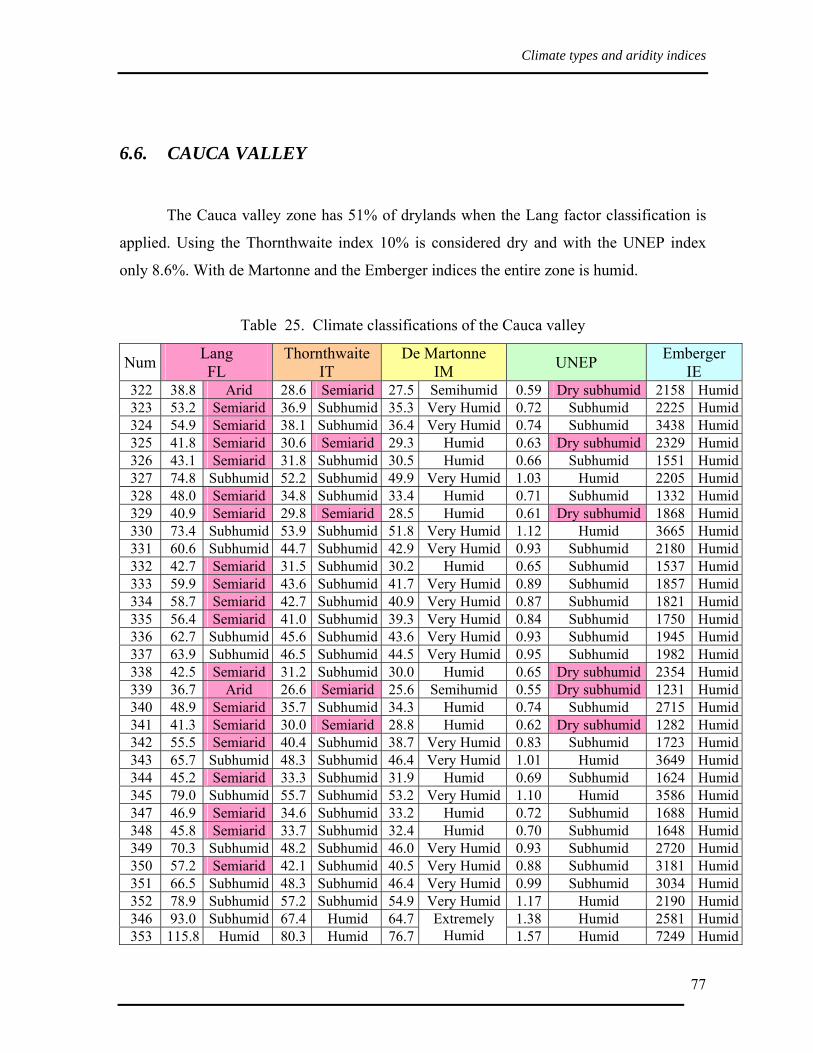
Climate types and aridity indices
77
6.6. CAUCA VALLEY
The Cauca valley zone has 51% of drylands when the Lang factor classification is
applied. Using the Thornthwaite index 10% is considered dry and with the UNEP index
only 8.6%. With de Martonne and the Emberger indices the entire zone is humid.
Table 25. Climate classifications of the Cauca valley
Num Lang FL
Thornthwaite IT
De Martonne IM UNEP Emberger
IE 322 38.8 Arid 28.6 Semiarid 27.5 Semihumid 0.59 Dry subhumid 2158 Humid323 53.2 Semiarid 36.9 Subhumid 35.3 Very Humid 0.72 Subhumid 2225 Humid324 54.9 Semiarid 38.1 Subhumid 36.4 Very Humid 0.74 Subhumid 3438 Humid325 41.8 Semiarid 30.6 Semiarid 29.3 Humid 0.63 Dry subhumid 2329 Humid326 43.1 Semiarid 31.8 Subhumid 30.5 Humid 0.66 Subhumid 1551 Humid327 74.8 Subhumid 52.2 Subhumid 49.9 Very Humid 1.03 Humid 2205 Humid328 48.0 Semiarid 34.8 Subhumid 33.4 Humid 0.71 Subhumid 1332 Humid329 40.9 Semiarid 29.8 Semiarid 28.5 Humid 0.61 Dry subhumid 1868 Humid330 73.4 Subhumid 53.9 Subhumid 51.8 Very Humid 1.12 Humid 3665 Humid331 60.6 Subhumid 44.7 Subhumid 42.9 Very Humid 0.93 Subhumid 2180 Humid332 42.7 Semiarid 31.5 Subhumid 30.2 Humid 0.65 Subhumid 1537 Humid333 59.9 Semiarid 43.6 Subhumid 41.7 Very Humid 0.89 Subhumid 1857 Humid334 58.7 Semiarid 42.7 Subhumid 40.9 Very Humid 0.87 Subhumid 1821 Humid335 56.4 Semiarid 41.0 Subhumid 39.3 Very Humid 0.84 Subhumid 1750 Humid336 62.7 Subhumid 45.6 Subhumid 43.6 Very Humid 0.93 Subhumid 1945 Humid337 63.9 Subhumid 46.5 Subhumid 44.5 Very Humid 0.95 Subhumid 1982 Humid338 42.5 Semiarid 31.2 Subhumid 30.0 Humid 0.65 Dry subhumid 2354 Humid339 36.7 Arid 26.6 Semiarid 25.6 Semihumid 0.55 Dry subhumid 1231 Humid340 48.9 Semiarid 35.7 Subhumid 34.3 Humid 0.74 Subhumid 2715 Humid341 41.3 Semiarid 30.0 Semiarid 28.8 Humid 0.62 Dry subhumid 1282 Humid342 55.5 Semiarid 40.4 Subhumid 38.7 Very Humid 0.83 Subhumid 1723 Humid343 65.7 Subhumid 48.3 Subhumid 46.4 Very Humid 1.01 Humid 3649 Humid344 45.2 Semiarid 33.3 Subhumid 31.9 Humid 0.69 Subhumid 1624 Humid345 79.0 Subhumid 55.7 Subhumid 53.2 Very Humid 1.10 Humid 3586 Humid347 46.9 Semiarid 34.6 Subhumid 33.2 Humid 0.72 Subhumid 1688 Humid348 45.8 Semiarid 33.7 Subhumid 32.4 Humid 0.70 Subhumid 1648 Humid349 70.3 Subhumid 48.2 Subhumid 46.0 Very Humid 0.93 Subhumid 2720 Humid350 57.2 Semiarid 42.1 Subhumid 40.5 Very Humid 0.88 Subhumid 3181 Humid351 66.5 Subhumid 48.3 Subhumid 46.4 Very Humid 0.99 Subhumid 3034 Humid352 78.9 Subhumid 57.2 Subhumid 54.9 Very Humid 1.17 Humid 2190 Humid346 93.0 Subhumid 67.4 Humid 64.7 1.38 Humid 2581 Humid353 115.8 Humid 80.3 Humid 76.7
Extremely Humid 1.57 Humid 7249 Humid

Climate types and aridity indices
78
From the 33 stations, 20 are classified as dry with the Lang index, 5 with the
Thornthwaite and 6 with the UNEP indices. Stations 322 and 339 are classified as arid
using Lang factor, which is after Desert the lower dry class, but using UNEP the same
stations are classified as dry subhumid or the higher dry class, closer to humid.
Figure 34. Climate classifications of the Cauca valley
Climatictype
20-40 Arid40-60 Semiarid
Lang factor
60-100 Subhumid100-160 Humid
700000 800000 700000 800000
9000
0010
0000
0
35-55 Very humid28-35 Humid
Climatictype
MartonneIndex
> 55 Extremelyhumid
0 50 100 Km
9000
0010
0000
0
Climatictype
UNEPIndex
0.65 - 1 SubHumid> 1 Humid
0.5-0.65 Dry subhumid
Climatictype
ThornthwaiteIndex
16-32 Semiarid
32-64
64-128
Subhumid
Humid
0 50 100 Km
0 50 100 Km 0 50 100 Km
Climatictype
20-40 Arid40-60 Semiarid
Lang factor
60-100 Subhumid100-160 Humid
Climatictype
20-40 Arid40-60 Semiarid
Lang factor
60-100 Subhumid100-160 Humid
700000 800000 700000 800000
9000
0010
0000
0
35-55 Very humid28-35 Humid
Climatictype
MartonneIndex
> 55 Extremelyhumid
35-55 Very humid28-35 Humid
Climatictype
MartonneIndex
> 55 Extremelyhumid
0 50 100 Km0 50 100 Km0 50 100 Km
9000
0010
0000
0
Climatictype
UNEPIndex
0.65 - 1 SubHumid> 1 Humid
0.5-0.65 Dry subhumid
Climatictype
UNEPIndex
0.65 - 1 SubHumid> 1 Humid
0.5-0.65 Dry subhumid
Climatictype
ThornthwaiteIndex
16-32 Semiarid
32-64
64-128
Subhumid
Humid
Climatictype
ThornthwaiteIndex
16-32 Semiarid
32-64
64-128
Subhumid
Humid
0 50 100 Km0 50 100 Km0 50 100 Km
0 50 100 Km0 50 100 Km0 50 100 Km 0 50 100 Km0 50 100 Km0 50 100 Km

Climate types and aridity indices
79
Using the BGI classification, this zone is considered from humid to moist. From the
32 stations, 15 show dry period of less than three months. Figure 35 shows the stations with
dry periods and the climate classes delineated using the BGI. The humid class corresponds
to the North of the zone and the Moist to the South.
Table 26. Climate classification using Bagnouls - Gaussen
Number of
stations Dry months
per year BGI values Area (ha)
17 0 0 Humid 709844 15 1 - 3 1 - 3 Moist 359494
Figure 35. Bagnouls - Gaussen Index distribution in the Cauca valley
The dry period determined by BGI occurs mainly during July to August, although
some stations show another dry period, shorter in January (station 322). If ½ETo is used to

Climate types and aridity indices
80
delineate dry periods, the first dry period occurs from June to September and the second is
evident in all the stations, occurring from December to January. Figure 36 demonstrates the
curves of monthly precipitation (P), mean temperature (2T) and monthly half ETo for some
stations of this zone. DP is the dry period using Thornthwaite ETo and BGI the monthly
arid index.
Figure 36. Omberothermic curve for the Cauca valley
Station 322, 965 masl
020406080
100120140160
Jan
Feb Mar AprMay Ju
n Jul
Aug Sep Oct Nov Dec
Months
Prec
ipita
tion
(mm
)
010203040506070
Tem
p°C
0.5 ETo
P
2T
P
0.5 ETo
Station 332, 975 masl
0
2040
60
80
100120
140
160
Jan Feb Mar Apr May Jun Jul Aug Sep Oct Nov Dec
Months
Prec
ipita
tion
(mm
)
0
1020
30
40
5060
70
Tem
p°C
2T
0
2040
60
80
100120
140
160
Jan Feb Mar Apr May Jun Jul Aug Sep Oct Nov Dec
Months
Prec
ipita
tion
(mm
)
0
1020
30
40
5060
Tem
p°C
P
2T
Station 338, 1041 masl
DP
BGI
0.5ETo
0
20
40
60
80
100
120
140
JanFeb Mar AprMay Jun Jul AugSep Oct NovDec
Months
Prec
ipita
tion
(mm
)
0
10
20
30
40
50
Tem
p°C
Station 339, 989 masl
2T
0.5ETo
P
DP
BGI
DP
BGI
DP
BGI
DP
BGI
DP
BGI
DP
BGI
DP
BGI
DP
BGI

Climate types and aridity indices
81
6.7. NARIÑO AND POPAYAN HIGH PLATEAUS
This is the zone with less area of drylands according to all classification systems
used. Lang factor gives an area of 8% of the zone, meanwhile De Martonne, UNEP and
Thornthwaite less than 1%.
Using the Lang factor, only 8 stations are classified as dry, 6 of them as semiarid
and 2 as arid that is the lower aridity class. The same two stations are classified as dry
when applying the Thornthwaite, de Martonne and UNEP indices. Both stations are located
in the Patía valley, one in Mercaderes and the other one in Policarpa (department of
Nariño). It is clear then that there is a small dry area in this zone but another area is also
classified as dry in Taminango. Other places of this zone do not appear as dry using those
classification systems. In this case, Lang is the only one that classifies those areas as dry.
Table 27 shows the values of the different indices for the stations of the Nariño and
Popayan high plateaus. Emberger index shows all the stations as humid. There is not any
difference because the mean monthly temperatures along the year are almost constant. The
difference between the mean maximum and mean minimum temperatures is less than three
degrees (3°C) for all the stations.
Figure 37 shows the climate classes according to the Lang, Thornthwaite, de
Martonne and UNEP indices.
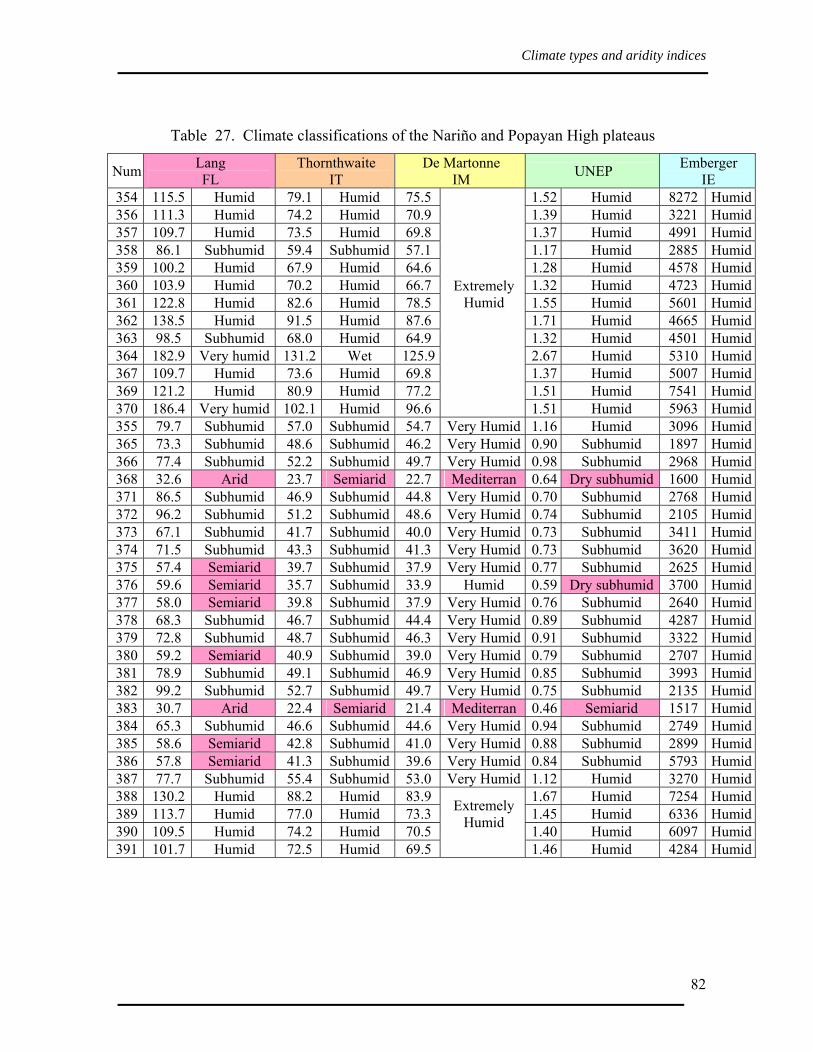
Climate types and aridity indices
82
Table 27. Climate classifications of the Nariño and Popayan High plateaus
Num Lang FL
Thornthwaite IT
De Martonne IM UNEP Emberger
IE 354 115.5 Humid 79.1 Humid 75.5 1.52 Humid 8272 Humid356 111.3 Humid 74.2 Humid 70.9 1.39 Humid 3221 Humid357 109.7 Humid 73.5 Humid 69.8 1.37 Humid 4991 Humid358 86.1 Subhumid 59.4 Subhumid 57.1 1.17 Humid 2885 Humid359 100.2 Humid 67.9 Humid 64.6 1.28 Humid 4578 Humid360 103.9 Humid 70.2 Humid 66.7 1.32 Humid 4723 Humid361 122.8 Humid 82.6 Humid 78.5 1.55 Humid 5601 Humid362 138.5 Humid 91.5 Humid 87.6 1.71 Humid 4665 Humid363 98.5 Subhumid 68.0 Humid 64.9 1.32 Humid 4501 Humid364 182.9 Very humid 131.2 Wet 125.9 2.67 Humid 5310 Humid367 109.7 Humid 73.6 Humid 69.8 1.37 Humid 5007 Humid369 121.2 Humid 80.9 Humid 77.2 1.51 Humid 7541 Humid370 186.4 Very humid 102.1 Humid 96.6
Extremely Humid
1.51 Humid 5963 Humid355 79.7 Subhumid 57.0 Subhumid 54.7 Very Humid 1.16 Humid 3096 Humid365 73.3 Subhumid 48.6 Subhumid 46.2 Very Humid 0.90 Subhumid 1897 Humid366 77.4 Subhumid 52.2 Subhumid 49.7 Very Humid 0.98 Subhumid 2968 Humid368 32.6 Arid 23.7 Semiarid 22.7 Mediterran 0.64 Dry subhumid 1600 Humid371 86.5 Subhumid 46.9 Subhumid 44.8 Very Humid 0.70 Subhumid 2768 Humid372 96.2 Subhumid 51.2 Subhumid 48.6 Very Humid 0.74 Subhumid 2105 Humid373 67.1 Subhumid 41.7 Subhumid 40.0 Very Humid 0.73 Subhumid 3411 Humid374 71.5 Subhumid 43.3 Subhumid 41.3 Very Humid 0.73 Subhumid 3620 Humid375 57.4 Semiarid 39.7 Subhumid 37.9 Very Humid 0.77 Subhumid 2625 Humid376 59.6 Semiarid 35.7 Subhumid 33.9 Humid 0.59 Dry subhumid 3700 Humid377 58.0 Semiarid 39.8 Subhumid 37.9 Very Humid 0.76 Subhumid 2640 Humid378 68.3 Subhumid 46.7 Subhumid 44.4 Very Humid 0.89 Subhumid 4287 Humid379 72.8 Subhumid 48.7 Subhumid 46.3 Very Humid 0.91 Subhumid 3322 Humid380 59.2 Semiarid 40.9 Subhumid 39.0 Very Humid 0.79 Subhumid 2707 Humid381 78.9 Subhumid 49.1 Subhumid 46.9 Very Humid 0.85 Subhumid 3993 Humid382 99.2 Subhumid 52.7 Subhumid 49.7 Very Humid 0.75 Subhumid 2135 Humid383 30.7 Arid 22.4 Semiarid 21.4 Mediterran 0.46 Semiarid 1517 Humid384 65.3 Subhumid 46.6 Subhumid 44.6 Very Humid 0.94 Subhumid 2749 Humid385 58.6 Semiarid 42.8 Subhumid 41.0 Very Humid 0.88 Subhumid 2899 Humid386 57.8 Semiarid 41.3 Subhumid 39.6 Very Humid 0.84 Subhumid 5793 Humid387 77.7 Subhumid 55.4 Subhumid 53.0 Very Humid 1.12 Humid 3270 Humid388 130.2 Humid 88.2 Humid 83.9 1.67 Humid 7254 Humid389 113.7 Humid 77.0 Humid 73.3 1.45 Humid 6336 Humid390 109.5 Humid 74.2 Humid 70.5 1.40 Humid 6097 Humid391 101.7 Humid 72.5 Humid 69.5
Extremely Humid
1.46 Humid 4284 Humid
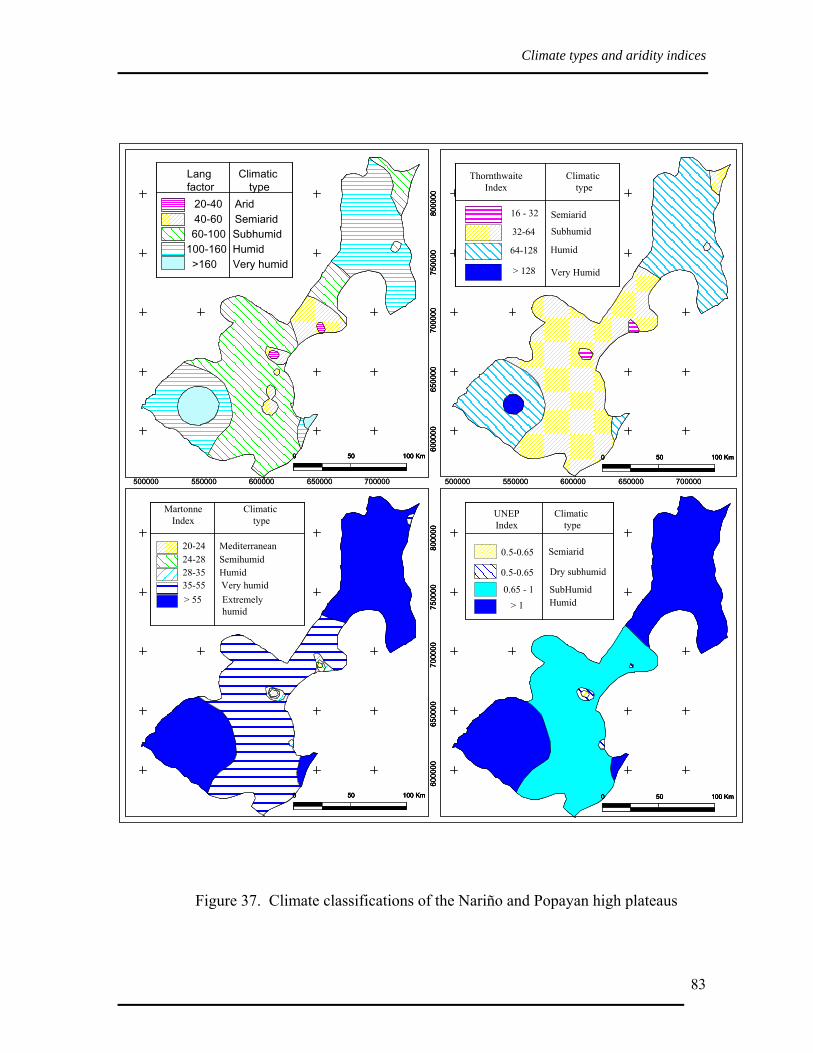
Climate types and aridity indices
83
Figure 37. Climate classifications of the Nariño and Popayan high plateaus
6000
0065
0000
7000
0075
0000
8000
00
500000 550000 600000 650000 700000
Climatictype
>160 Very humid
20-40 Arid40-60 Semiarid
Lang factor
60-100 Subhumid100-160 Humid
6000
0065
0000
7000
0075
0000
8000
00
35-55 Very humid
20-24 Mediterranean24-28 Semihumid28-35 Humid
Climatictype
MartonneIndex
> 55 Extremelyhumid
0 50 100 Km
500000 550000 600000 650000 700000
Climatictype
ThornthwaiteIndex
16 - 32 Semiarid
> 128 Very Humid
32-64
64-128
Subhumid
Humid
0 50 100 Km0 50 100 Km
Climatictype
UNEPIndex
0.5-0.65 Semiarid
0.65 - 1 SubHumid> 1 Humid
0.5-0.65 Dry subhumid
0 50 100 Km
6000
0065
0000
7000
0075
0000
8000
0060
0000
6500
0070
0000
7500
0080
0000
500000 550000 600000 650000 700000
Climatictype
>160 Very humid
20-40 Arid40-60 Semiarid
Lang factor
60-100 Subhumid100-160 Humid
Climatictype
>160 Very humid
20-40 Arid40-60 Semiarid
Lang factor
60-100 Subhumid100-160 Humid
6000
0065
0000
7000
0075
0000
8000
0060
0000
6500
0070
0000
7500
0080
0000
35-55 Very humid
20-24 Mediterranean24-28 Semihumid28-35 Humid
Climatictype
MartonneIndex
> 55 Extremelyhumid
35-55 Very humid
20-24 Mediterranean24-28 Semihumid28-35 Humid
Climatictype
MartonneIndex
> 55 Extremelyhumid
0 50 100 Km0 50 100 Km0 50 100 Km
500000 550000 600000 650000 700000
Climatictype
ThornthwaiteIndex
16 - 32 Semiarid
> 128 Very Humid
32-64
64-128
Subhumid
Humid
Climatictype
ThornthwaiteIndex
16 - 32 Semiarid
> 128 Very Humid
32-64
64-128
Subhumid
Humid
0 50 100 Km0 50 100 Km0 50 100 Km0 50 100 Km0 50 100 Km0 50 100 Km
Climatictype
UNEPIndex
0.5-0.65 Semiarid
0.65 - 1 SubHumid> 1 Humid
0.5-0.65 Dry subhumid
Climatictype
UNEPIndex
0.5-0.65 Semiarid
0.65 - 1 SubHumid> 1 Humid
0.5-0.65 Dry subhumid
0 50 100 Km0 50 100 Km0 50 100 Km
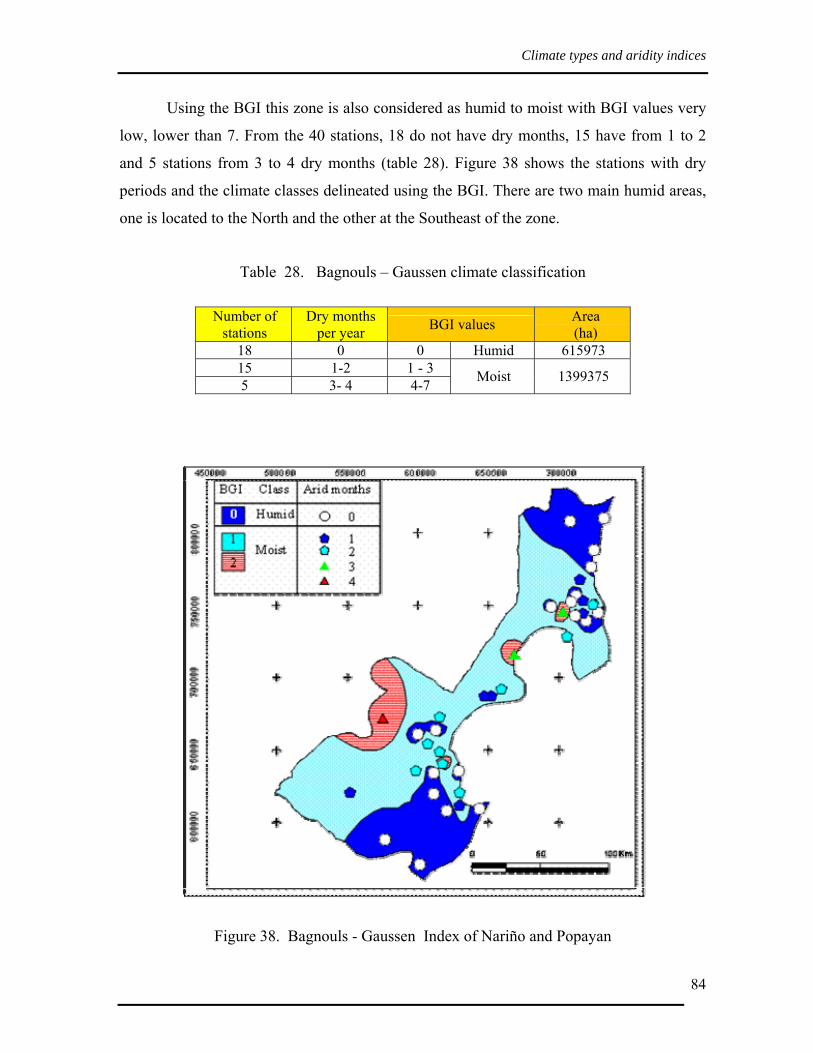
Climate types and aridity indices
84
Using the BGI this zone is also considered as humid to moist with BGI values very
low, lower than 7. From the 40 stations, 18 do not have dry months, 15 have from 1 to 2
and 5 stations from 3 to 4 dry months (table 28). Figure 38 shows the stations with dry
periods and the climate classes delineated using the BGI. There are two main humid areas,
one is located to the North and the other at the Southeast of the zone.
Table 28. Bagnouls – Gaussen climate classification
Number of
stations Dry months
per year BGI values Area (ha)
18 0 0 Humid 615973 15 1-2 1 - 3 5 3- 4 4-7 Moist 1399375
Figure 38. Bagnouls - Gaussen Index of Nariño and Popayan

Climate types and aridity indices
85
The dry period determined using BGI occurs in the middle of the year (July to
August). When using ½ETo to delineate dry periods, the dry period increases from June to
September and the stations of the driest places show another second dry period in January
and February (station 368, Mercaderes). This is the case only for the five stations with 4
dry months. Figure 39 shows the curves of monthly precipitation (P), mean temperature
(2T) and monthly half ETo for some stations of this zone. DP is the dry period using
Thornthwaite ETo and BGI the monthly arid index.
Figure 39. Omberothermic curves for the Nariño and Popayan high plateaus
Station 357 (Florida), 1850 masl
04080
120160200240280320
Jan Feb Mar AprMay Jun JulAugSep Oct NovDecMonths
Prec
ipita
tion
(mm
)
020406080100120140160
Tem
p°C
P
2T½ETo
DP
Station 366 (San Pablo), 1780 masl
020406080
100120140160180200220240
Jan Feb Mar Apr May Jun Jul Aug Sep Oct Nov Dec
Months
Prec
ipita
tion
(mm
)
0102030405060708090100110120
Tem
p°C
P
2T½ETo
DPBGI
Station 368 (Mercaderes), 580 masl
0
20
40
60
80
100
120
140
Jan Feb Mar Apr May Jun Jul Aug Sep Oct Nov Dec
Months
Prec
ipita
tion
(mm
)
0
10
20
30
40
50
60
70
Tem
p°C
P
2T
½ETo
BGI
DP
Station 373 (Nariño), 2440 masl
0
20
40
60
80
100
120
140
160
Jan Feb Mar Apr May Jun Jul Aug Sep Oct Nov Dec
Months
Prec
ipita
tion
(mm
)
0
10
20
30
40
50
60
70
80
Tem
p°C
P
2T
½EToDP
Station 357 (Florida), 1850 masl
04080
120160200240280320
Jan Feb Mar AprMay Jun JulAugSep Oct NovDecMonths
Prec
ipita
tion
(mm
)
020406080100120140160
Tem
p°C
P
2T½ETo
DP
Station 357 (Florida), 1850 masl
04080
120160200240280320
Jan Feb Mar AprMay Jun JulAugSep Oct NovDecMonths
Prec
ipita
tion
(mm
)
020406080100120140160
Tem
p°C
P
2T½ETo
DP
Station 366 (San Pablo), 1780 masl
020406080
100120140160180200220240
Jan Feb Mar Apr May Jun Jul Aug Sep Oct Nov Dec
Months
Prec
ipita
tion
(mm
)
0102030405060708090100110120
Tem
p°C
P
2T½ETo
DPBGI
Station 368 (Mercaderes), 580 masl
0
20
40
60
80
100
120
140
Jan Feb Mar Apr May Jun Jul Aug Sep Oct Nov Dec
Months
Prec
ipita
tion
(mm
)
0
10
20
30
40
50
60
70
Tem
p°C
P
2T
½ETo
BGI
DP
Station 368 (Mercaderes), 580 masl
0
20
40
60
80
100
120
140
Jan Feb Mar Apr May Jun Jul Aug Sep Oct Nov Dec
Months
Prec
ipita
tion
(mm
)
0
10
20
30
40
50
60
70
Tem
p°C
P
2T
½ETo
BGI
DP
Station 373 (Nariño), 2440 masl
0
20
40
60
80
100
120
140
160
Jan Feb Mar Apr May Jun Jul Aug Sep Oct Nov Dec
Months
Prec
ipita
tion
(mm
)
0
10
20
30
40
50
60
70
80
Tem
p°C
P
2T
½EToDP

Rainfall aggressivity indices
86
7. RAINFALL AGGRESSIVITY INDICES
7.1. PRECIPITATION CONCENTRATION INDEX (PCI)
Seasonal and Temporal precipitation Concentration Index are calculated for every
station. PCI1, (Seasonal) estimated with the mean monthly precipitation over a number of
years and PCI2 (Temporal) the average of annual PCI calculated with monthly data,
annually. For every region a linear and a quadratic regression is applied in order to
establish the best relationship between those two indices. Table 29 shows for each zone the
results of the linear and quadratic regressions together with the correlation coefficient (R 2)
which explains if linear or quadratic regressions fits better for the relationship PCI1-PCI2.
Table 29. Relationship between PCI1 and PCI2
Linear Regression Quadratic Regression STUDY ZONE Stations
PCI 2 = a PCI 1 + b R 2 PCI 2 = a PCI 1 b R 2 Guajira peninsula 24 y = 1.5384x + 6.8366 0.2195 y = 3.9545x0.7474 0.1924
Caribbean plateaus 93 y = 2.1518x - 10.118 0.7781 y = 0.3378x1.541 0.7794
Santanderes and Cesar 67 y = 1.7018x - 4.1765 0.6638 y = 0.6859x1.271 0.6847
Cundiboyacence 40 y = 1.9475x - 6.6883 0.1158 y = 0.494x1.4104 0.123
High Magdalena 97 y = 1.6414x - 3.7871 0.8105 y = 0.6189x1.3089 0.8089
Cauca valley 32 y = 1.8343x - 5.8133 0.7105 y = 0.3852x1.5126 0.704
Nariño and Popayan 38 y = 1.1035x + 1.3083 0.4168 y = 1.5242x0.9077 0.4279
There are not great differences between the linear and quadratic regression. Values
of R2 between the two methods are similar for every region but there are great differences
between the study zones. The best correlation is showed for the High Magdalena river
basin and for the Caribbean plateaus. Santanderes and Cesar zone and Cauca valley show
some correlation. For the Nariño and Popayan high plateaus the correlation is low and for
the Guajira and Cundiboyacense high plateau very low.
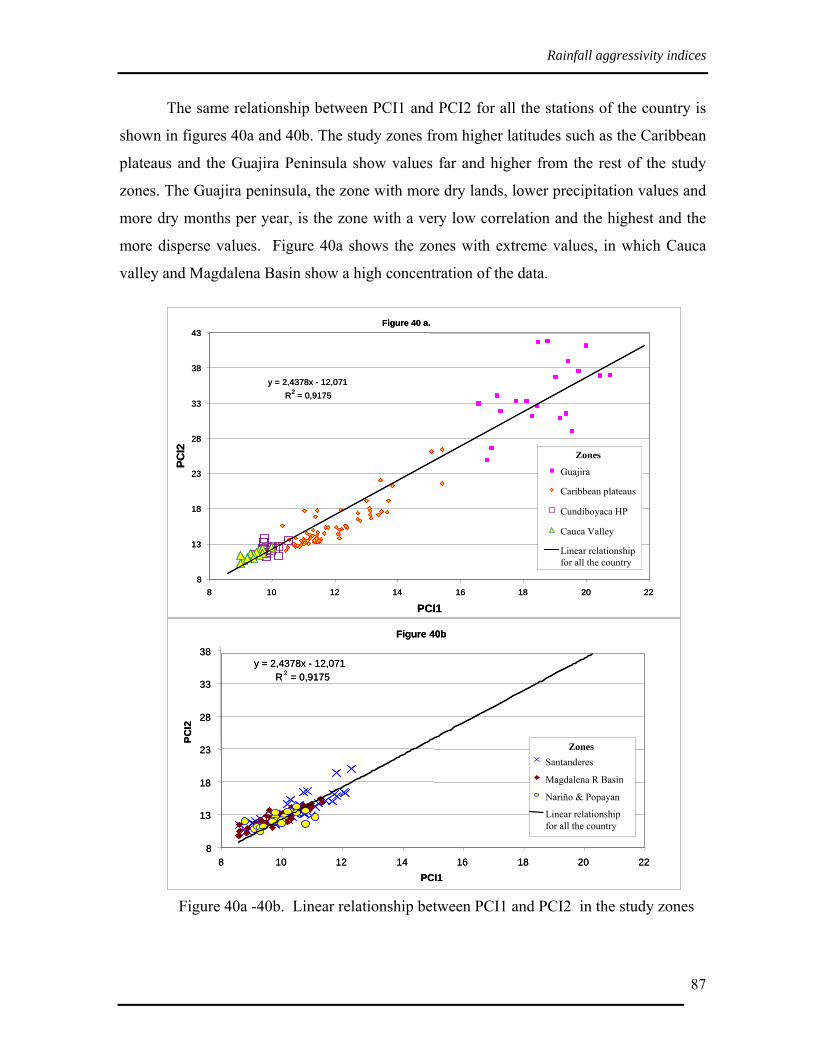
Rainfall aggressivity indices
87
The same relationship between PCI1 and PCI2 for all the stations of the country is
shown in figures 40a and 40b. The study zones from higher latitudes such as the Caribbean
plateaus and the Guajira Peninsula show values far and higher from the rest of the study
zones. The Guajira peninsula, the zone with more dry lands, lower precipitation values and
more dry months per year, is the zone with a very low correlation and the highest and the
more disperse values. Figure 40a shows the zones with extreme values, in which Cauca
valley and Magdalena Basin show a high concentration of the data.
Figure 40a -40b. Linear relationship between PCI1 and PCI2 in the study zones
Figure 40b
y = 2,4378x - 12,071R 2 = 0,9175
8
13
18
23
28
33
38
8 10 12 14 16 18 20 22PCI1
PCI2
ZonesSantanderes
Magdalena R Basin
Nariño & Popayan
Linear relationshipfor all the country
Figure 40b
y = 2,4378x - 12,071R 2 = 0,9175
8
13
18
23
28
33
38
8 10 12 14 16 18 20 22PCI1
PCI2
ZonesSantanderes
Magdalena R Basin
Nariño & Popayan
Linear relationshipfor all the country
Figure 40 a.
y = 2,4378x - 12,071R2 = 0,9175
8
13
18
23
28
33
38
43
8 10 12 14 16 18 20 22
PCI1
PCI2 Zones
Guajira
Caribbean plateaus
Cundiboyaca HP
Cauca Valley
Linear relationshipfor all the country
Figure 40 a.
y = 2,4378x - 12,071R2 = 0,9175
8
13
18
23
28
33
38
43
8 10 12 14 16 18 20 22
PCI1
PCI2 Zones
Guajira
Caribbean plateaus
Cundiboyaca HP
Cauca Valley
Linear relationshipfor all the country
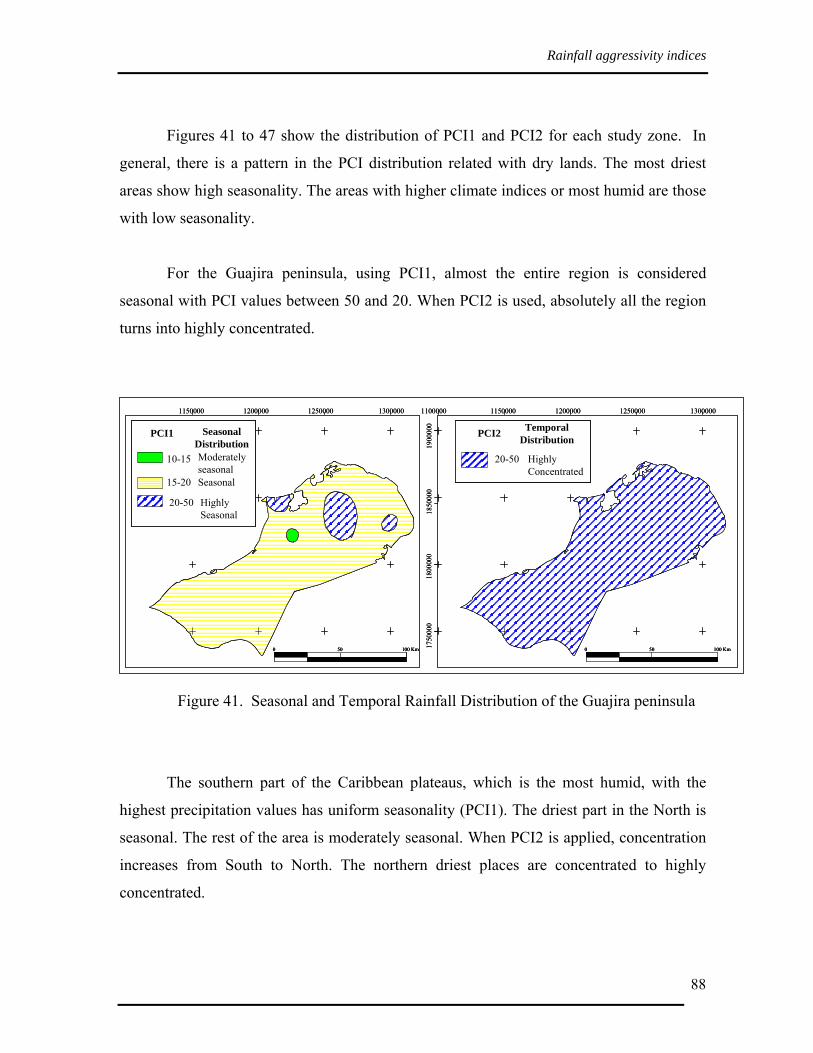
Rainfall aggressivity indices
88
Figures 41 to 47 show the distribution of PCI1 and PCI2 for each study zone. In
general, there is a pattern in the PCI distribution related with dry lands. The most driest
areas show high seasonality. The areas with higher climate indices or most humid are those
with low seasonality.
For the Guajira peninsula, using PCI1, almost the entire region is considered
seasonal with PCI values between 50 and 20. When PCI2 is used, absolutely all the region
turns into highly concentrated.
Figure 41. Seasonal and Temporal Rainfall Distribution of the Guajira peninsula
The southern part of the Caribbean plateaus, which is the most humid, with the
highest precipitation values has uniform seasonality (PCI1). The driest part in the North is
seasonal. The rest of the area is moderately seasonal. When PCI2 is applied, concentration
increases from South to North. The northern driest places are concentrated to highly
concentrated.
1150000 1200000 1250000 1300000
10-15
15-20
PCI1
ModeratelyseasonalSeasonal
SeasonalDistribution
20-50 HighlySeasonal
1100000 1150000 1200000 1250000 1300000
1750
000
1800
000
1850
000
1900
000
PCI2 TemporalDistribution
20-50 HighlyConcentrated
0 50 100 Km 0 50 100 Km
1150000 1200000 1250000 1300000
10-15
15-20
PCI1
ModeratelyseasonalSeasonal
SeasonalDistribution
20-50 HighlySeasonal
1100000 1150000 1200000 1250000 1300000
1750
000
1800
000
1850
000
1900
000
PCI2 TemporalDistribution
20-50 HighlyConcentrated
0 50 100 Km0 50 100 Km 0 50 100 Km0 50 100 Km

Rainfall aggressivity indices
89
In the Santanderes and Cesar region, when using PCI1, the zone is considered
uniform in the South, which is the most humid part. The rest of the area is moderately
seasonal. Using PCI2 the driest places in the North and in the centre have a concentrated
temporal rainfall distribution. The rest of the region has moderately concentrated rainfall
distribution.
The Cundiboyacense high plateau has seasonal rainfall distribution (PCI1) from
uniform to moderate seasonality and the temporal rainfall distribution (PCI2) if moderately
concentrated in almost all the area, except in the driest part which is concentrated.
The High Magdalena River Basin and the Nariño and Popayan high plateaus show
some uniformity seasonality in the most humid areas when PCI1 is applied but then they
turn into concentrated when PCI2 is used.
The Cauca valley has in almost all the stations uniform seasonality and concentrated
rainfall temporal distribution.
Figure 42. Seasonal and Temporal Rainfall Distribution in the Caribbean plateaus
700000 800000 9000000 100000 1100000
0 50 100 Km
10-15
15-20
ModeratelyseasonalSeasonal
< 10 Uniform
700000 800000 9000000 100000 1100000
1300
000
1400
000
1500
000
1600
000
1700
000
0 50 100 Km
10-15
15-20
ModeratelyconcentratedConcentrated
< 20 HighlyConcentrated
PCI1 SeasonalDistribution PCI2 Temporal
Distribution
700000 800000 9000000 100000 1100000700000 800000 9000000 100000 1100000
0 50 100 Km0 50 100 Km0 50 100 Km
10-15
15-20
ModeratelyseasonalSeasonal
< 10 Uniform
700000 800000 9000000 100000 1100000700000 800000 9000000 100000 1100000
1300
000
1400
000
1500
000
1600
000
1700
000
0 50 100 Km0 50 100 Km0 50 100 Km
10-15
15-20
ModeratelyconcentratedConcentrated
< 20 HighlyConcentrated
PCI1 SeasonalDistribution PCI2 Temporal
Distribution
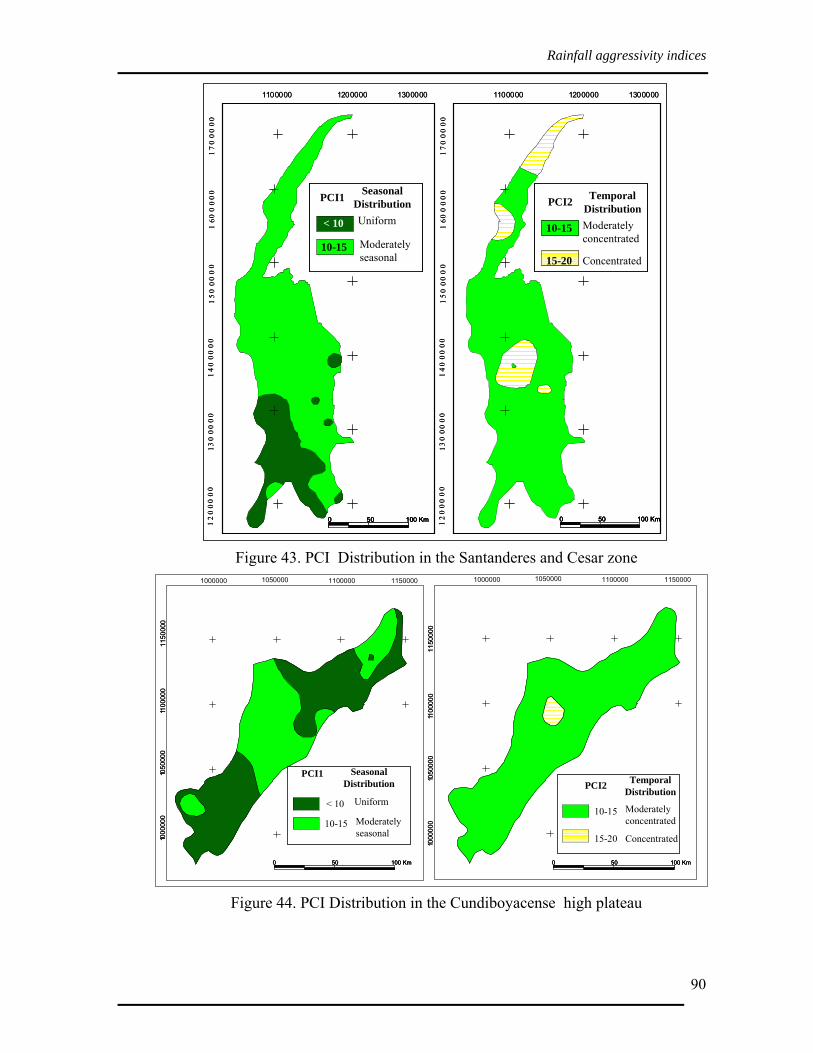
Rainfall aggressivity indices
90
Figure 43. PCI Distribution in the Santanderes and Cesar zone
Figure 44. PCI Distribution in the Cundiboyacense high plateau
1100000 1200000 1300000
12
00
00
013
000
00
14
00
00
01
50
00
00
160
00
00
17
00
00
0
10-15
15-20
Moderatelyconcentrated
Concentrated
0 50 100 Km 0 50 100 Km
10-15 Moderatelyseasonal
< 10 Uniform
1100000 1200000 1300000
12
00
00
013
00
00
01
40
00
00
15
00
00
01
600
00
01
70
00
00
PCI1 SeasonalDistribution PCI2 Temporal
Distribution
1100000 1200000 1300000
12
00
00
013
000
00
14
00
00
01
50
00
00
160
00
00
17
00
00
0
10-15
15-20
Moderatelyconcentrated
Concentrated
0 50 100 Km0 50 100 Km0 50 100 Km 0 50 100 Km0 50 100 Km0 50 100 Km
10-15 Moderatelyseasonal
< 10 Uniform
1100000 1200000 1300000
12
00
00
013
00
00
01
40
00
00
15
00
00
01
600
00
01
70
00
00
PCI1 SeasonalDistribution PCI2 Temporal
Distribution
1000
000
1050
000
1 100
000
1150
000
1000
000
1050
000
1 100
000
1150
000
1000000 1050000 1100000 1150000
10-15 Moderatelyseasonal
< 10 Uniform
1000
000
1050
000
1 100
000
1150
000
1000
000
1050
000
1 100
000
1150
000
1000000 1050000 1100000 1150000
10-15
15-20
Moderatelyconcentrated
Concentrated
0 50 100 Km0 50 100 Km0 50 100 Km 0 50 100 Km0 50 100 Km0 50 100 Km
PCI1 SeasonalDistribution PCI2 Temporal
Distribution

Rainfall aggressivity indices
91
Figure 45. PCI Distribution in the High Magdalena River Basin
Figure 46. Distribution of the PCI in the Cauca valley
10-15 Moderately seasonal
< 10 Uniform
700000 800000 900000 1000000
7000
008 0
0000
9 000
001 0
0000
011
0 000
0
700000 800000 900000 1000000
7000
008 0
0000
9000
0010
0000
011
0000
0
10-15Moderately concentrated
< 10 Uniform
0 50 100 Km 0 50 100 Km
PCI1 SeasonalDistribution PCI2
TemporalDistribution
10-15 Moderately seasonal
< 10 Uniform
700000 800000 900000 1000000
7000
008 0
0000
9 000
001 0
0000
011
0 000
070
0 000
700 0
008 0
0000
8 000
009 0
0000
9 000
001 0
0000
01 0
0000
011
0 000
011
0 000
0
700000 800000 900000 1000000
7000
008 0
0000
9000
0010
0000
011
0000
070
0 000
700 0
008 0
0000
8 000
0090
0000
9000
0010
0000
010
0000
011
0000
011
0000
0
10-15Moderately concentrated
< 10 Uniform
0 50 100 Km0 50 100 Km0 50 100 Km 0 50 100 Km0 50 100 Km0 50 100 Km
PCI1 SeasonalDistribution PCI2
TemporalDistribution
700000 800000
10-15 Moderatelyseasonal
< 10 Uniform
700000 800000
9000
0010
0000
0
10-15 Moderatelyconcentrated
0 50 100 Km0 50 100 Km
PCI1 SeasonalDistribution PCI2 Temporal
Distribution
700000 800000
10-15 Moderatelyseasonal
< 10 Uniform
700000 800000
9000
0010
0000
0
10-15 Moderatelyconcentrated
0 50 100 Km0 50 100 Km0 50 100 Km0 50 100 Km0 50 100 Km0 50 100 Km
PCI1 SeasonalDistribution PCI2 Temporal
Distribution
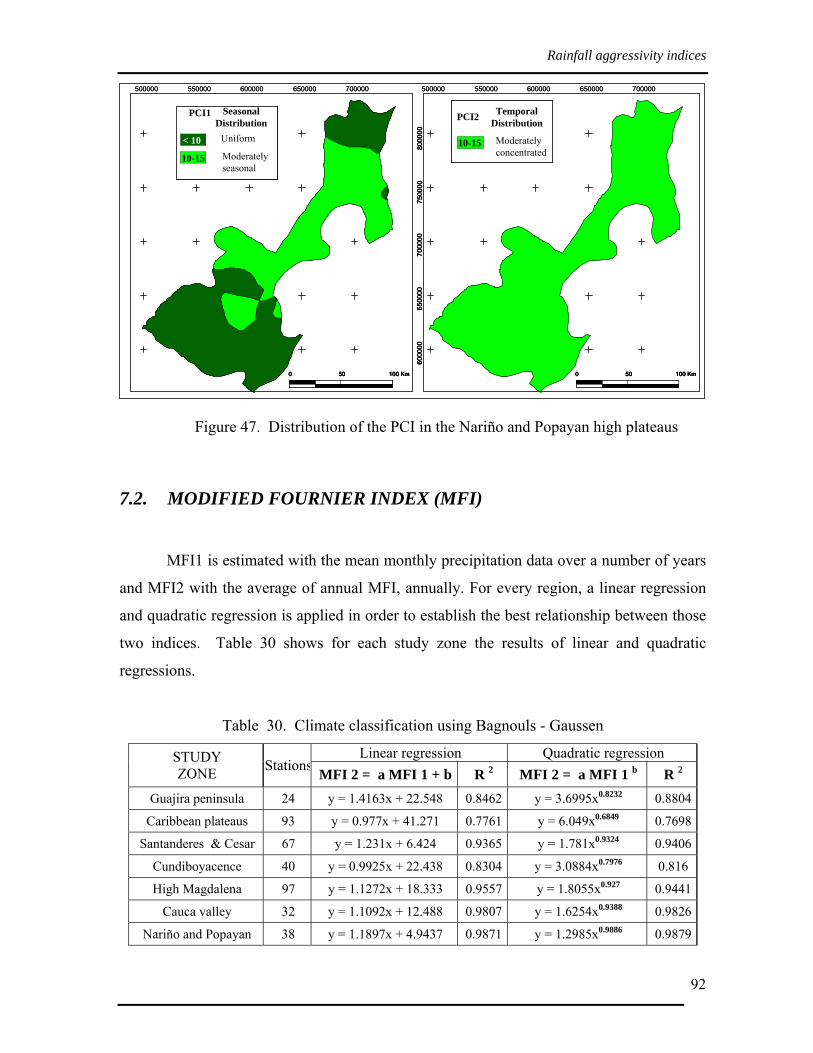
Rainfall aggressivity indices
92
Figure 47. Distribution of the PCI in the Nariño and Popayan high plateaus
7.2. MODIFIED FOURNIER INDEX (MFI)
MFI1 is estimated with the mean monthly precipitation data over a number of years
and MFI2 with the average of annual MFI, annually. For every region, a linear regression
and quadratic regression is applied in order to establish the best relationship between those
two indices. Table 30 shows for each study zone the results of linear and quadratic
regressions.
Table 30. Climate classification using Bagnouls - Gaussen
Linear regression Quadratic regression STUDY ZONE Stations MFI 2 = a MFI 1 + b R 2 MFI 2 = a MFI 1 b R 2
Guajira peninsula 24 y = 1.4163x + 22.548 0.8462 y = 3.6995x0.8232 0.8804
Caribbean plateaus 93 y = 0.977x + 41.271 0.7761 y = 6.049x0.6849 0.7698
Santanderes & Cesar 67 y = 1.231x + 6.424 0.9365 y = 1.781x0.9324 0.9406
Cundiboyacence 40 y = 0.9925x + 22.438 0.8304 y = 3.0884x0.7976 0.816
High Magdalena 97 y = 1.1272x + 18.333 0.9557 y = 1.8055x0.927 0.9441
Cauca valley 32 y = 1.1092x + 12.488 0.9807 y = 1.6254x0.9388 0.9826
Nariño and Popayan 38 y = 1.1897x + 4.9437 0.9871 y = 1.2985x0.9886 0.9879
500000 550000 600000 650000 700000
10-15 Moderatelyseasonal
< 10 Uniform
0 50 100 Km
6000
0065
0000
7000
0075
0000
8000
00
500000 550000 600000 650000 700000
10-15
0 50 100 Km
Moderatelyconcentrated
PCI1 SeasonalDistribution PCI2 Temporal
Distribution
500000 550000 600000 650000 700000
10-15 Moderatelyseasonal
< 10 Uniform
0 50 100 Km0 50 100 Km0 50 100 Km
6000
0065
0000
7000
0075
0000
8000
0060
0000
6500
0070
0000
7500
0080
0000
500000 550000 600000 650000 700000
10-15
0 50 100 Km0 50 100 Km0 50 100 Km
Moderatelyconcentrated
PCI1 SeasonalDistribution PCI2 Temporal
Distribution
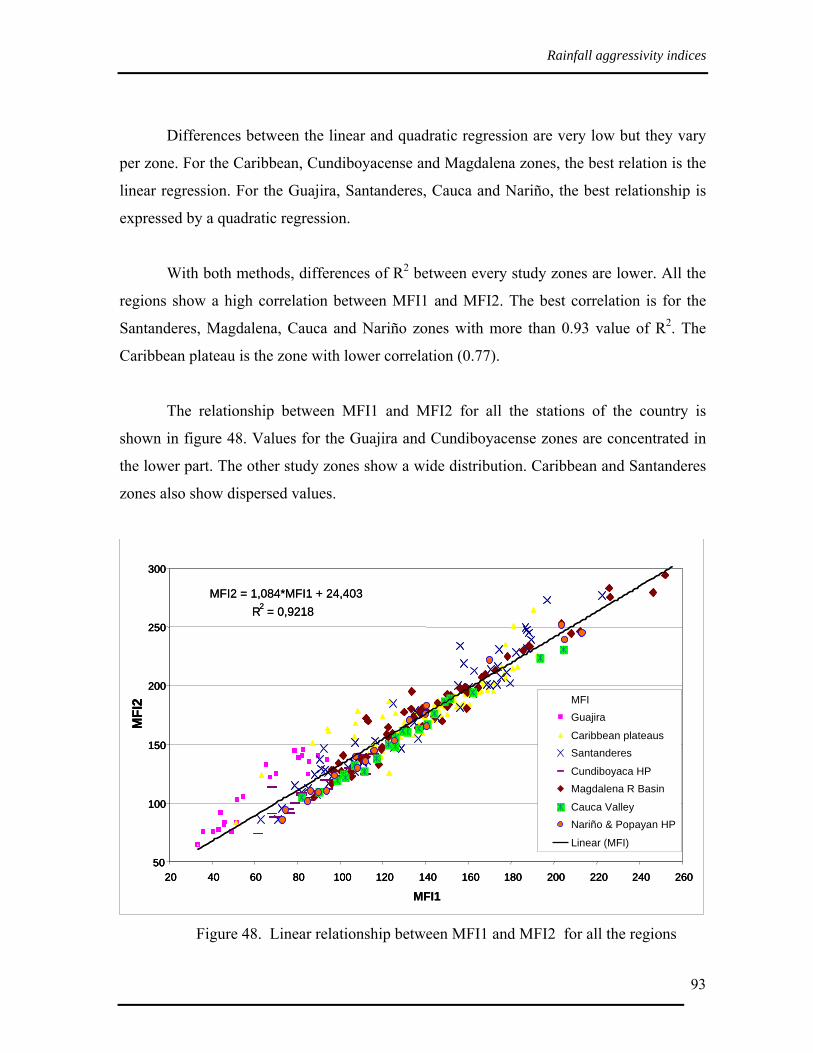
Rainfall aggressivity indices
93
Differences between the linear and quadratic regression are very low but they vary
per zone. For the Caribbean, Cundiboyacense and Magdalena zones, the best relation is the
linear regression. For the Guajira, Santanderes, Cauca and Nariño, the best relationship is
expressed by a quadratic regression.
With both methods, differences of R2 between every study zones are lower. All the
regions show a high correlation between MFI1 and MFI2. The best correlation is for the
Santanderes, Magdalena, Cauca and Nariño zones with more than 0.93 value of R2. The
Caribbean plateau is the zone with lower correlation (0.77).
The relationship between MFI1 and MFI2 for all the stations of the country is
shown in figure 48. Values for the Guajira and Cundiboyacense zones are concentrated in
the lower part. The other study zones show a wide distribution. Caribbean and Santanderes
zones also show dispersed values.
Figure 48. Linear relationship between MFI1 and MFI2 for all the regions
MFI2 = 1,084*MFI1 + 24,403R2 = 0,9218
50
100
150
200
250
300
MFI
2 MFIGuajira
Caribbean plateausSantanderes
Cundiboyaca HPMagdalena R Basin
Cauca ValleyNariño & Popayan HP
20 40 60 80 100 120 140 160 180 200 220 240 260
MFI1
Linear (MFI)
MFI2 = 1,084*MFI1 + 24,403R2 = 0,9218
50
100
150
200
250
300
MFI
2
50
100
150
200
250
300
MFI
2 MFIGuajira
Caribbean plateausSantanderes
Cundiboyaca HPMagdalena R Basin
Cauca ValleyNariño & Popayan HP
20 40 60 80 100 120 140 160 180 200 220 240 26020 40 60 80 100 120 140 160 180 200 220 240 260
MFI1
Linear (MFI)
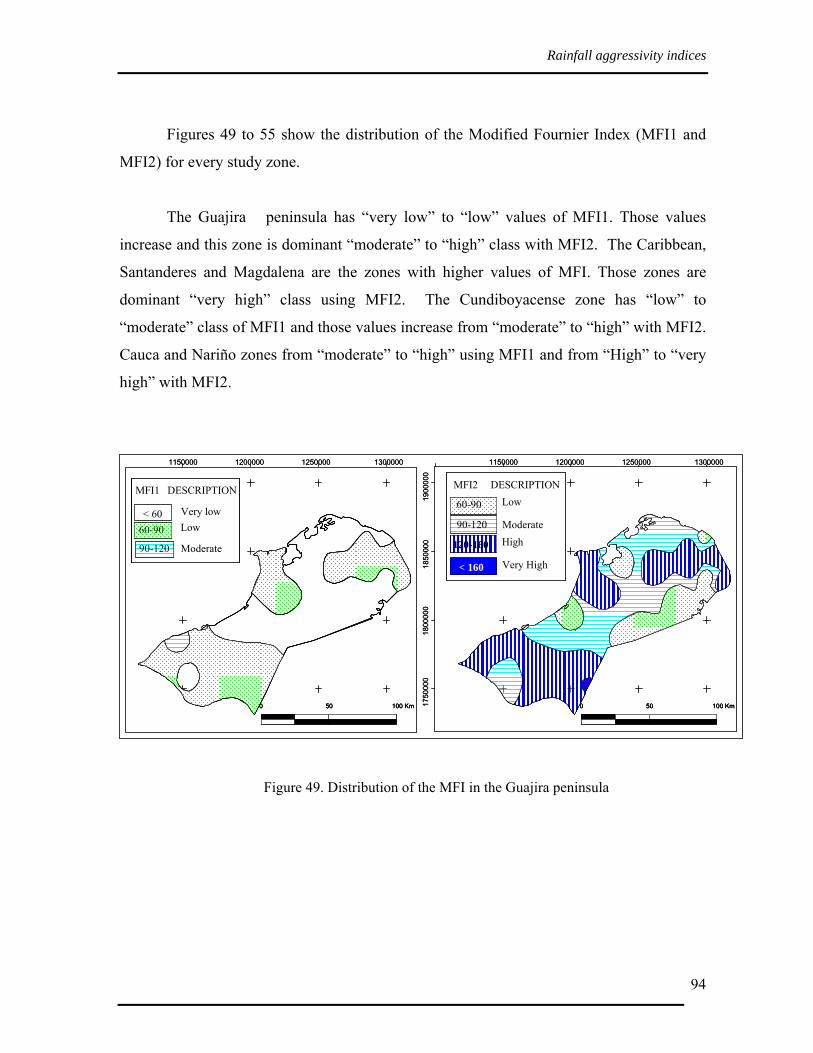
Rainfall aggressivity indices
94
Figures 49 to 55 show the distribution of the Modified Fournier Index (MFI1 and
MFI2) for every study zone.
The Guajira peninsula has “very low” to “low” values of MFI1. Those values
increase and this zone is dominant “moderate” to “high” class with MFI2. The Caribbean,
Santanderes and Magdalena are the zones with higher values of MFI. Those zones are
dominant “very high” class using MFI2. The Cundiboyacense zone has “low” to
“moderate” class of MFI1 and those values increase from “moderate” to “high” with MFI2.
Cauca and Nariño zones from “moderate” to “high” using MFI1 and from “High” to “very
high” with MFI2.
Figure 49. Distribution of the MFI in the Guajira peninsula
1150000 1200000 1250000 1300000
< 60
90-120
MFI1
Very low
Moderate
DESCRIPTION
60-90 Low
1150000 1200000 1250000 1300000
1750
000
1800
000
1850
000
1900
000
< 160
90-120
MFI2
Very High
Moderate
DESCRIPTION
60-90 Low
120-160 High
0 50 100 Km 0 50 100 Km
1150000 1200000 1250000 1300000
< 60
90-120
MFI1
Very low
Moderate
DESCRIPTION
60-90 Low< 60
90-120
MFI1
Very low
Moderate
DESCRIPTION
60-90 Low
1150000 1200000 1250000 1300000
1750
000
1800
000
1850
000
1900
000
< 160
90-120
MFI2
Very High
Moderate
DESCRIPTION
60-90 Low
120-160 High
< 160
90-120
MFI2
Very High
Moderate
DESCRIPTION
60-90 Low
120-160 High
0 50 100 Km0 50 100 Km 0 50 100 Km0 50 100 Km

Rainfall aggressivity indices
95
Figure 50. Distribution of the MFI in the Caribbean plateaus
Figure 51. Distribution of the MFI in the Santanderes and Cesar zone
700000 800000 9000000 100000 1100000
MFI1 DESCRIPTION
< 160
90-120
Very high
Moderate
60-90 Low
120-160 High
700000 800000 9000000 100000 1100000
1300
000
1400
000
1500
000
1600
000
1700
000
MFI2 DESCRIPTION
< 160
90-120
Very high
Moderate
120-160 High
0 50 100 Km 0 50 100 Km
700000 800000 9000000 100000 1100000700000 800000 9000000 100000 1100000
MFI1 DESCRIPTION
< 160
90-120
Very high
Moderate
60-90 Low
120-160 High
MFI1 DESCRIPTION
< 160
90-120
Very high
Moderate
60-90 Low
120-160 High
700000 800000 9000000 100000 1100000700000 800000 9000000 100000 1100000
1300
000
1400
000
1500
000
1600
000
1700
000
MFI2 DESCRIPTION
< 160
90-120
Very high
Moderate
120-160 High
MFI2 DESCRIPTION
< 160
90-120
Very high
Moderate
120-160 High
0 50 100 Km0 50 100 Km0 50 100 Km 0 50 100 Km0 50 100 Km0 50 100 Km
1100000 1200000 1300000
12
00
00
013
00
00
01
40
00
00
15
00
00
01
600
00
01
70
00
00
MFI1 DESCRIPTION
< 160
90-120
Very high
Moderate
60-90 Low
120-160 High
MFI2 DESCRIPTION
< 160
90-120
Very high
Moderate
60-90 Low
120-160 High
1100000 1200000 1300000
12
00
00
013
00
00
01
40
00
00
15
00
00
01
600
00
01
70
00
00
0 50 100 Km 0 50 100 Km
1100000 1200000 1300000
12
00
00
013
00
00
01
40
00
00
15
00
00
01
600
00
01
70
00
00
MFI1 DESCRIPTION
< 160
90-120
Very high
Moderate
60-90 Low
120-160 High
MFI1 DESCRIPTION
< 160
90-120
Very high
Moderate
60-90 Low
120-160 High
MFI2 DESCRIPTION
< 160
90-120
Very high
Moderate
60-90 Low
120-160 High
MFI2 DESCRIPTION
< 160
90-120
Very high
Moderate
60-90 Low
120-160 High
1100000 1200000 1300000
12
00
00
013
00
00
01
40
00
00
15
00
00
01
600
00
01
70
00
00
0 50 100 Km0 50 100 Km0 50 100 Km 0 50 100 Km0 50 100 Km0 50 100 Km

Rainfall aggressivity indices
96
Figure 52. Distribution of the MFI in the Cundiboyacense high plateau
Figure 53. Distribution of the MFI in the High Magdalena River Basin
1000
000
1050
000
1 100
000
1150
000
1000000 1050000 1100000 1150000
MFI1 DESCRIPTION
90-120 Moderate
60-90 Low
1000
000
1050
000
1 100
000
1150
000
1000000 1050000 1100000 1150000
0 50 100 Km 0 50 100 Km
MFI2 DESCRIPTION
90-120 Moderate
60-90 Low
120-160 High
1000
000
1050
000
1 100
000
1150
000
1000
000
1050
000
1 100
000
1150
000
1000000 1050000 1100000 1150000
MFI1 DESCRIPTION
90-120 Moderate
60-90 Low
MFI1 DESCRIPTION
90-120 Moderate
60-90 Low
1000
000
1050
000
1 100
000
1150
000
1000
000
1050
000
1 100
000
1150
000
1000000 1050000 1100000 1150000
0 50 100 Km0 50 100 Km0 50 100 Km 0 50 100 Km0 50 100 Km0 50 100 Km
MFI2 DESCRIPTION
90-120 Moderate
60-90 Low
120-160 High
MFI2 DESCRIPTION
90-120 Moderate
60-90 Low
120-160 High
700000 800000 900000 1000000
7000
0 080
0000
9000
0010
0000
011
000 0
0
MFI1 DESCRIPTION
< 160
90-120
Very high
Moderate
120-160 High
700000 800000 900000 1000000
7000
0 080
0000
9000
0010
0000
011
000 0
0
MFI2 DESCRIPTION
< 160
90-120
Very high
Moderate
120-160 High
0 50 100 Km 0 50 100 Km
700000 800000 900000 1000000
7000
0 080
0000
9000
0010
0000
011
000 0
0
700000 800000 900000 1000000
7000
0 080
0000
9000
0010
0000
011
000 0
070
000 0
7000
0 080
0000
8000
0090
0000
9000
0010
0000
010
0000
011
000 0
011
000 0
0
MFI1 DESCRIPTION
< 160
90-120
Very high
Moderate
120-160 High
MFI1 DESCRIPTION
< 160
90-120
Very high
Moderate
120-160 High
700000 800000 900000 1000000
7000
0 080
0000
9000
0010
0000
011
000 0
0
700000 800000 900000 1000000
7000
0 080
0000
9000
0010
0000
011
000 0
070
000 0
7000
0 080
0000
8000
0090
0000
9000
0010
0000
010
0000
011
000 0
011
000 0
0
MFI2 DESCRIPTION
< 160
90-120
Very high
Moderate
120-160 High
MFI2 DESCRIPTION
< 160
90-120
Very high
Moderate
120-160 High
0 50 100 Km0 50 100 Km0 50 100 Km 0 50 100 Km0 50 100 Km0 50 100 Km

Rainfall aggressivity indices
97
Figure 54. Distribution of the MFI in the Cauca valley
Figure 55. Distribution of the MFI in the Nariño and Popayan high plateaus
500000 550000 600000 650000 700000
MFI1 DESCRIPTION
< 160
90-120
Very high
Moderate60-90 Low
120-160 High
0 50 100 Km
6000
0065
0000
7000
0075
0000
8000
00
500000 550000 600000 650000 700000
MFI2 DESCRIPTION
< 160
90-120
Very high
Moderate
120-160 High
0 50 100 Km
500000 550000 600000 650000 700000
MFI1 DESCRIPTION
< 160
90-120
Very high
Moderate60-90 Low
120-160 High
MFI1 DESCRIPTION
< 160
90-120
Very high
Moderate60-90 Low
120-160 High
0 50 100 Km0 50 100 Km0 50 100 Km
6000
0065
0000
7000
0075
0000
8000
0060
0000
6500
0070
0000
7500
0080
0000
500000 550000 600000 650000 700000
MFI2 DESCRIPTION
< 160
90-120
Very high
Moderate
120-160 High
MFI2 DESCRIPTION
< 160
90-120
Very high
Moderate
120-160 High
0 50 100 Km0 50 100 Km0 50 100 Km
700000 800000
MFI1 DESCRIPTION
< 160
90-120
Very high
Moderate
120-160 High
60 - 90 Low
700000 800000
9000
0010
0000
0
MFI2 DESCRIPTION
< 160
90-120
Very high
Moderate
120-160 High
0 50 100 Km
0 50 100 Km
700000 800000
MFI1 DESCRIPTION
< 160
90-120
Very high
Moderate
120-160 High
60 - 90 LowMFI1 DESCRIPTION
< 160
90-120
Very high
Moderate
120-160 High
60 - 90 Low
700000 800000
9000
0010
0000
0
MFI2 DESCRIPTION
< 160
90-120
Very high
Moderate
120-160 High
MFI2 DESCRIPTION
< 160
90-120
Very high
Moderate
120-160 High
0 50 100 Km0 50 100 Km0 50 100 Km
0 50 100 Km0 50 100 Km0 50 100 Km

Rainfall aggressivity indices
98
7.3. EROSIVITY INDEX OF CORINE (1995)
The erosivity index (ErIn) estimated using the CORINE methodology is represented
for each study zone using the same interpolation method (IDW) in the figures 56 to 59.
The Guajira peninsula shows 82.7% of the area with moderate erosivity and 17.3%
with high values. Areas with higher values are spread out in the North and South.
The Caribbean plateaus zone has dominant high ErIn values. 93.1% of this zone has
high erosivity and only 6.9% moderate values. The zone with moderate values is located in
the driest North, and in the most humid southern zone. In this case the extreme values of
precipitation (the lowest and the highest) give lower values of erosivity.
The Santanderes and Cesar zone show values of erosivity from 4 to 10. 52% of the
zone consists of moderate values and 48% are high erosivity values. The areas with high
erosivity values are the northern part (except the extreme top) and the extreme Southwest.
The Magdalena river basin shows ErIn values from “low” to “high” class. The areas
with higher erosivity index (31%) are located in the middle of the region, from North to
South following the pattern of the lowest place of the valley. The rest of the area, which is
more mountainous and with higher altitudes, has moderate values of ErIn (67%).
The Cundiboyacense high plateau is the zone with lower erosivity values. Those
vary from 2 to 7. 26% of the zone presents low erosivity and 74% moderate. The areas with
lower erosivity ranges are the driest places.
The Cauca valley shows a dominant moderate ErIn values in 95% of the zone and
only 5% of its area, located to the Southeast, shows high erosivity values.
The Nariño and Popayan high plateaus have erosivity ranges from “low” to “high”.
In this case, there is no relationship between the ErIn values and the moisture regime.

Rainfall aggressivity indices
99
Figure 56. Distribution of “ErIn” for the Guajira and Caribbean zones
Figure 57. Distribution of “ErIn” for the Santanderes and Magdalena zones
1150000 1200000 1250000 130000017
5000
018
0000
018
5000
019
0000
0
0 50 100 Km
ErIn DESCRIPTION4-55-66-77-88-99-10
High
Moderate
1150000 1200000 1250000 130000017
5000
018
0000
018
5000
019
0000
0
0 50 100 Km0 50 100 Km
ErIn DESCRIPTION4-55-66-77-88-99-10
High
Moderate
700000 800000 9000000 100000 1100000
1300
000
1400
000
1500
000
1600
000
1700
000
0 50 100 Km
ErIn DESCRIPTION5-66-77-8
8-99-10
High
Moderate
700000 800000 9000000 100000 1100000700000 800000 9000000 100000 1100000
1300
000
1400
000
1500
000
1600
000
1700
000
0 50 100 Km0 50 100 Km0 50 100 Km
ErIn DESCRIPTION5-66-77-8
8-99-10
High
Moderate
ErIn DESCRIPTION5-66-77-8
8-99-10
High
Moderate
1100000 1200000 1300000
12
00
00
013
000
00
14
00
00
01
50
00
00
160
00
00
17
00
00
0
0 50 100 Km
ErIn DESCRIPTION
4-55-66-77-8
8-99-10
High
Moderate
1100000 1200000 1300000
12
00
00
013
000
00
14
00
00
01
50
00
00
160
00
00
17
00
00
0
0 50 100 Km0 50 100 Km0 50 100 Km
ErIn DESCRIPTION
4-55-66-77-8
8-99-10
High
Moderate
ErIn DESCRIPTION
4-55-66-77-8
8-99-10
High
Moderate5-66-77-8
8-99-10
High
Moderate
7000
0080
0000
9000
0010
0000
011
0000
0
700000 800000 900000 1000000
0 50 100 Km
ErIn DESCRIPTION
High
Moderate
3-4
4-55-66-77-88-99-10
Low
7000
0080
0000
9000
0010
0000
011
0000
070
0000
7000
0080
0000
8000
0090
0000
9000
0010
0000
010
0000
011
0000
011
0000
0
700000 800000 900000 1000000
0 50 100 Km
700000 800000 900000 1000000700000 800000 900000 1000000
0 50 100 Km0 50 100 Km0 50 100 Km
ErIn DESCRIPTION
High
Moderate
3-4
4-55-66-77-88-99-10
LowErIn DESCRIPTION
High
Moderate
3-4
4-55-66-77-88-99-10
Low
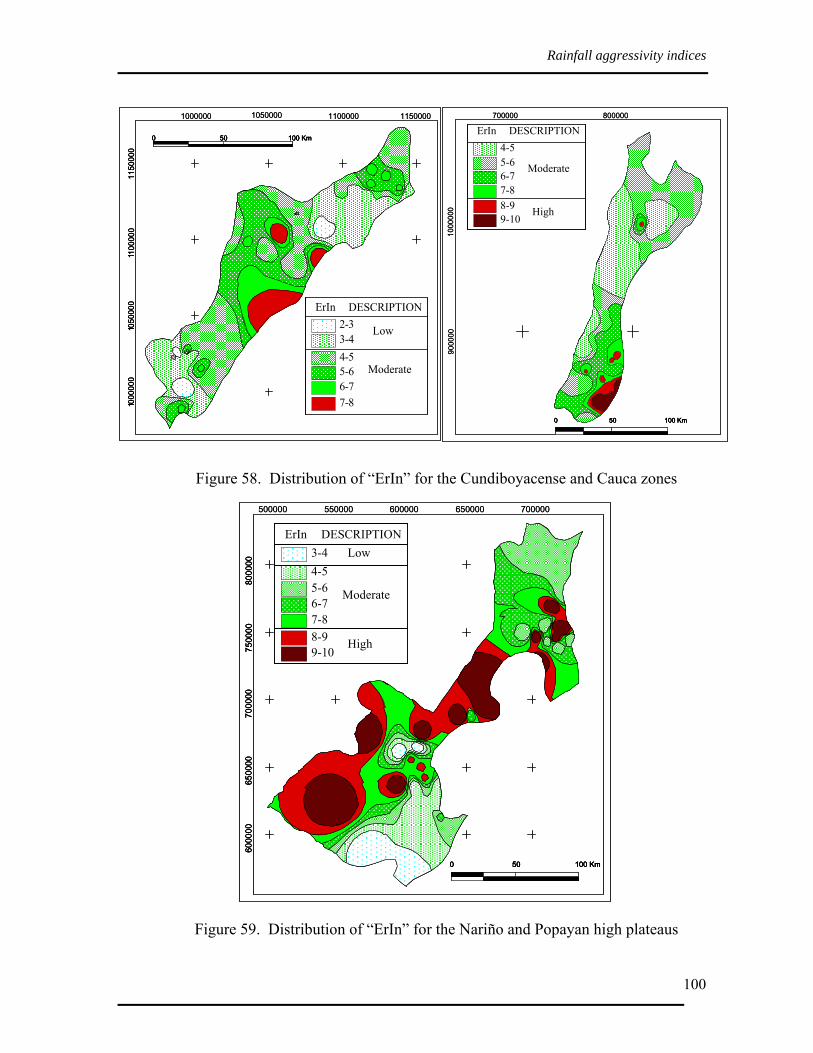
Rainfall aggressivity indices
100
Figure 58. Distribution of “ErIn” for the Cundiboyacense and Cauca zones
Figure 59. Distribution of “ErIn” for the Nariño and Popayan high plateaus
1000
000
1050
000
1 100
000
1150
000
1000000 1050000 1100000 1150000
0 50 100 Km
ErIn DESCRIPTION
Moderate
2-33-44-55-66-77-8
Low
1000
000
1050
000
1 100
000
1150
000
1000
000
1050
000
1 100
000
1150
000
1000000 1050000 1100000 1150000
0 50 100 Km0 50 100 Km0 50 100 Km
ErIn DESCRIPTION
Moderate
2-33-44-55-66-77-8
Low
ErIn DESCRIPTION
Moderate
2-33-44-55-66-77-8
Low
700000 800000
9000
0010
0000
0
0 50 100 Km
ErIn DESCRIPTION
High
Moderate
4-55-66-77-88-99-10
700000 800000
9000
0010
0000
0
0 50 100 Km0 50 100 Km0 50 100 Km
ErIn DESCRIPTION
High
Moderate
4-55-66-77-88-99-10
ErIn DESCRIPTION
High
Moderate
4-55-66-77-88-99-10
6000
0065
0000
7000
0075
0000
8000
00
500000 550000 600000 650000 700000
0 50 100 Km
ErIn DESCRIPTION
High
Moderate
3-44-55-66-77-88-99-10
Low
6000
0065
0000
7000
0075
0000
8000
0060
0000
6500
0070
0000
7500
0080
0000
500000 550000 600000 650000 700000
0 50 100 Km0 50 100 Km0 50 100 Km
ErIn DESCRIPTION
High
Moderate
3-44-55-66-77-88-99-10
LowErIn DESCRIPTION
High
Moderate
3-44-55-66-77-88-99-10
Low
Conclusions
101
8. CONCLUSIONS
CLIMATE INDICES
The five climate indices evaluated to delineate dry lands in Colombia, show
different results for every study zone. The Lang and the UNEP indices define a low class
of aridity named “desert” for Lang and “hyperarid” for UNEP. The next class is “arid”,
which is the first class for the other indices (de Martonne, Thornthwaite and Emberger).
The Bagnouls–Gaussen index does not use the term desert or arid but “dry”.
The Lang climate index tends to classify more areas as dry than the other indices.
Applying Lang, Colombia has the lowest class of climate types which is “desert”. This
desert climate is found in the whole Guajira zone (1,136.381 ha) and in the north of the
Caribbean plateaus (11.802 ha). If the Lang index is used, in each of the study zones appear
dry lands and this is related to the erosion and degradation processes reported by secondary
studies, in which other characteristics such as vegetation, erosion and soils are used to
delineate areas with desertification problems.
The Emberger index classifies absolutely all the stations of Colombia as “humid”,
which is the higher climate class. This index is not suitable in Colombia because it is based
on the differences between the mean temperatures of the hottest and the coldest months. In
the case of Colombia, those differences are very low due to the tropical and equatorial
location of the country. The mean temperatures over the year do not vary more than four
degrees. This index can be applied in seasonal latitudes where the difference of
temperatures in between summer and winter is very high.
The de Martonne index tends to classify every study zone as more humid in
comparison to the other indices, although the entire Guajira zone appears to be between

Conclusions
102
arid and semiarid. This index seems to classify only as dry lands the areas with extreme
low precipitation values.
The UNEP and Thornthwaite indices agree for the Guajira zone, with Lang and de
Martonne, when the whole Guajira zone is classified as dry. With the Thornthwaite index
the whole zone is classified as arid which is the lower class, with the UNEP index half of
the Guajira zone is arid and half is semiarid. In this case, Thornthwaite agrees with Lang,
but UNEP and Lang differ. The Thornthwaite and UNEP indices are also similar for the
Santanderes, Magdalena, Cauca and Nariño zones but they differ in the Caribbean and in
the Cundiboyacense zones. With the Thornthwaite index the Caribbean plateaus has 24.5%
of the area as dry and with the UNEP index only 16.6%. In the Cundiboyacense zone the
result is opposite. The UNEP index considers 44.5% of the area as dry, in contrast with the
Thornthwaite index where the result is only 13.2% dry.
Using the Bagnouls-Gaussen classification, based on 2 times temperature and
precipitation, there is a clear differentiation of dry monthly periods. But when the BGI is
calculated annually, all the zones are classified between humid and moist. The fact that
Bagnouls-Gaussen proposes only four categories, then the classification of drylands are
zones with extreme low or no rainfall values and with extremely high temperature. This is
not the case for the latitudes in which Colombia is located. Maximum temperatures in
Colombia are not more than 33ºC, while Mediterranean or subtropical zones report more
than 38ºC in the summer. Four classes are not enough to evaluate the climate differences at
regional level in equatorial latitudes.
Determination of dry months using BGI gives less dry periods than when half ETo
calculated with the Thornthwaite formula is used. As ETo by Thornthwaite underestimates
dry periods, then the estimated dry periods in this study should be even longer. In this case,
BGI is not very approximate to assess dry periods based on the temperature for these
latitudes.

Conclusions
103
DRY LANDS
Using the same interpolation method to delineate dry lands for different climate
indices, it is possible to estimate the dryland areas in each zone. Nevertheless it is
necessary to consider the effect of other factors such as relief and wind.
Table 31 shows the area in hectares and the percentage for each study zone according to
the Lang, UNEP, Thornthwaite and de Martonne climatic indices. The Guajira peninsula is the
only zone completely classified as dry by all indices. The other regions show contrasts between
the different indices.
Some areas known as very dry with badlands, like the “Tatacoa desert” (in the
Magdalena zone), with more than 300000 ha and the Taminango xerophitic ecosystem (in
Nariño) appear in those zone as dry lands only with the Lang climate classification. This is not
the case when other indices are used.
Table 31. Areas (ha) and percentage of drylands per study zone according to different
climate indices
LANG UNEP THORNTWAITE MARTONNE STUDY ZONE
(ha) % (ha) % (ha) % (ha) %
GUAJIRA 1136381 100.0 1136381 100.0 1136381 100.0 1136381 100.0
CARIBE 5365201 90.5 984341 16.6 1455292 24.5 223514 3.8
SANTANDERES 2121912 53.2 345175 8.6 270883 6.8 91073 2.3
CUNDBOY 463137 43.9 469598 44.5 139705 13.2 1287 0.1
MAGDALENA 1333399 33.6 18931 0.5 50617 1.3 0 0.0
CAUCA 544312 50.9 92224 8.6 103648 9.7 0 0.0
NARIÑO 157733 7.8 17117 0.8 16335 0.8 4954 0.2
Conclusions
104
The Lang climate classification gives more area as drylands than the other indices and
this may be due that it is considering mean annual temperature, which in the case of Colombia
is almost constant all the year.
The UNEP and Thornthwaite indices give less drylands than the Lang index. The
UNEP index is giving less dry lands area may be because the ETo was calculated by
Thornthwaite method, which according to the literature is underestimating ETo for dry periods
or overestimating for humid periods.
Another cause of the differences between the Lang, UNEP and Thornthwaite indices is
the fact that the boundaries for dry class are not the same.
RAINFALL AGRESSIVITY
Relationship between PCI1 and PCI2 varies for each study zone. The Magdalena and
the Caribbean zone show the best correlation (R2 values of 0.81 and 0.77 respectively), while
the Cundiboyacense and Guajira zones show the lower values (0.12 and 0.21). In the case of
Colombia, relation of PCI1 and PCI2 varies highly between zones.
For almost each study zones, PCI shows higher seasonality in the driest areas than in
the moist areas. Using PCI2, the entire Guajira zone is classified with high seasonality. The
class “seasonal” appears only in the driest places of the Caribbean, Santanderes and
Cundiboyacense zones. The rest of the areas are considered as moderated seasonal.
Differences between the MFI1 and MFI2 relationship in the different study is
relatively low. The Santanderes, Magdalena, Cauca and Nariño zones show coefficient
values of 0.94, 0.96, 0.98 and 0.99 respectively, which is very high. The lower value is
found in the Caribbean plateaus (0.77), still relatively acceptable.
Using the MFI2, in general for all the zones, more than 90% of the area is
considered between high to very high classes of aggressivity index. The zones with

Conclusions
105
relatively more area of very high aggressivity are the Caribbean (with 87% of the area),
Magdalena (83%), Santanderes (70%) and Nariño (64%). The Guajira peninsula is the zone
with less aggressivity index, with 57% of the area between low and very low and 43% as
moderate.
EROSIVITY
Using the CORINE methodology, the Caribbean plateaus are the zones with highest
erosivity index. 93% of the area shows values higher than 8. Santanderes, Nariño and
Magdalena zones show moderate to high values. The Guajira and Cauca zones have dominant
moderate values in almost all the area and the Cundiboyacense zone is between low to
moderate.
References
106
9. REFERENCES
Arnoldus, H. 1980. An approximation of the rainfall factor in the Universal Soil Loss Equation. In: De Boodt, M. and Gabriels, D. (Eds) Assessment of Erosion. John Wiley and sons. Bailey, R. G. 1996. Climate Classification of the Mid-Columbia Region Ecosystem Geography. Springer-Verlag, New York. Brady, C. N. 2002. The Nature and properties of soils. Pearson Education Asia. India. Bagnouls, F., Gaussen, H. 1952. L´indice xérothermique. Bulletin de l´association de Géographes français. Nº 222-223, jan.-févr., Paris. Bagnouls, F., Gaussen, H. 1952. Les climats biologiques et leur classification. Ann de Geogr. Nº 258. Paris. CORINE. 1995. Soil erosion risk and important land resources in the southern regions of the European Community. EUR 13233 EN. Cortes, L. A. 1981. Los Suelos del Anden Pacífico y su Aptitud de Uso. Subdirección Agrológica. Instituto Geográfico Agustín Codazzi. Bogotá. Cortes, L. A., Malagón D. C., 1984. Geografía de Suelos de Colombia. Universidad de Bogota Jorge Tadeo Lozano. Bogotá. Cortes, L. A. 1994. Suelos de Colombia: reguladores de recursos. Universidad de Bogota Jorge Tadeo Lozano. Bogotá. DANE. 2001. Estadísticas Nacionales. http://www.dane.gov.co/inf_est/series_proyecciones.htm De Martonne, E. 1923. Aridité et indices d´aridité. Académie des Sciences. Comptes Rendus, 182 (23) : 1935-1938.

References
107
Dengüz, O. 2005. Soil Erosion Risk Assessment of the Gölbaşi Environmental Protection Area and Its Vicinity Using the CORINE Model In: Turk Agriculture Journal. 29 439-448 T.BÜTAK Dregne, H., Hassan H. 1997. Natural Habitats And Ecosystems Management In Drylands: An Overview. Natural Habitats And Ecosystems Management Series. The World Bank. Paper No 51. Emberger, E. 1932. Su rune formule climatique et ses applications en botanique. La Météorologie. El-Swaify, S. A., Dangler, E. W., Armstrong, C. L. 1982. Soil erosion by water in the tropics. Research Extension Series 024. College of tropical Agriculture and Human Resources, Univ. of Hawaii. Environmental Systems Research Institute, IC. 2002. Arc/view version 3.2 User’s Guide. El-Swaify, S. A. 1977. Susceptibilities of certain tropical soils to erosion by water. In Greenland, D. and Lal, R. (Eds). Soil Conservation and Management in the Humid Tropics. FAO. 1983. Guidelines: Land Evaluation for Rainfed Agriculture. FAO Soils Bulletin, 52; FAO, Rome. Fajardo, R. Z, Guzmán, Ma del R. 2002. Segundo Informe Nacional de Implementación de la Convención de las Naciones Unidas de Lucha Contra la Desertificación y la Sequía – CCD. Ministerio Del Medio Ambiente. Bogotá, Colombia. Fournier, F. 1960. Climat et érosion: la relation entre l’érosion des sols par l’eau et les précipitations atmosphériques, Presses universitaires de France, Paris. Gabriels, D. 2000. Rain Erosivity in Europe In: ESSC III Int. Congress. Key Notes. Man and Soil at the Third Millenium. (Rubio, J. L., Asins, S, Andreu, V., de Paz, J. M., and Gimeno, E. eds.) Valencia. Pp 31.43. Gabriels, D. 2006. Water Erosion (lecture notes) Department of Soil and Management and Soil Care. Faculty of Bioengineering. Universiteit Gent. België. García, M., Carvajal, Y. 2006. Mapa regional de Zonas áridas, semiáridas y subhúmedas secas de de América Latina y El Caribe caso de estudio Colombia. Universidad del valle, Colombia. Gomez, A. 1987. La zona Andina Colombiana. Erosión y Conservación de Suelos. In: Congreso Colombiano de la Ciencia del Suelo, 4. Coloquio de la degradación de los suelos en Colombia. Neiva, Colombia
References
108
Gomez, A., Ramirez H., Cruz K., Rivera, P. 1992. Manejo y control integrado de malezas en cafetales y potreros de la Zona Cafetera. Chinchiná- Colombia), FEDERACAFE. Cenicafé.254 p. Gonzalez, W., Neira, F., Montañez, I. 1999. Levantamiento edafológico semidetallado de suelos en los ecosistemas estratégicos de la zona rural de Bogotá. DAMA - CORPOICA. IDEAM. 1996. Dinámica de los factores de la erosión y sedimentación en el país. Subdirección de Geomorfología y Suelos. Santa Fe de Bogotá. IDEAM. 1998. Estudio Nacional de Procesos Morfodinámicos. La erosión, la sedimentación y la estabilidad de la formación superficial en Colombia. Santa Fe de Bogotá, 1998. 1-32 p. IDEAM. 1999. Indicadores ambientales y sostenibilidad. Subdirección de Geomorfología y Suelos. Población y Asentamientos Humanos. Ecosistemas. Documento Interno. Santa Fe de Bogotá. 1-18 p. IDEAM - Ministerio Del Medio Ambiente. 2001. Degradación de suelos y tierras en Colombia y estado de la Desertificación. Bogotá, Colombia. IGAC. 2000. Mapa de suelos de Colombia. Instituto Geográfico Agustín Codazzi. Bogotá. Lal, R. 1988. Erodibility and Erosivity. In: Soil Erosion Research Methods. Edited by Lal R. Soil and Water Conservation Service. Wageningen, The Netherlands. Pp 141 – 160. Laflen, J., Moldenhauer, W. 2003. Pioneering Soil Erosion Prediction. The USLE Story. World Association of Soil & Water Conservation – WASWC. Special Publication No. 1. Leon, S. T. 2003. Relaciones Agricultura – Ambiente En La Degradación De Tierras En Colombia. IDEAN. Bogotá, Colombia. Malagón, D. C. 2003. Los Suelos de Colombia. SOCOLGEO. Bogotá. Colombia. Masahiro, M. 1995. Managing Water for Peace in the Middle East: Alternative Strategies. United Nations. University Press Tokyo. Zare, M. E. Gabriels, D. 2006. Estimation and Classification of Climatic Indices for Yazd Region (Iran). Department of Soil Management and Soil Care, International Centre for Eremology, Ghent University, Belgium Michiels, P., Gabriels, D., Hartmann, R. 1992. Using the Seasonal and Temporal precipitation concentration index for characterising the monthly rainfall distribution in Spain. Catena , Vol 19 43 - 58.

References
109
Neira, F. 2001. Caracterización de los procesos de degradación física de suelos en la región del Alto Patía. CORPOICA - INAT. Tibaitatá. Ojeda, O., Arias, R. 2000. Informe Nacional Sobre La Gestión Del Agua En Colombia Oliver, J.E. 1980. Monthly precipitation distribution: a comparative index. Professional Geographer, 32, 300 – 309. PHI-LAC. 2006. Guía metodológica para la elaboración del mapa de zonas áridas, semiáridas y subhúmedas secas de América Latina y el Caribe. Programa Hidrológico Internacional de la UNESCO para América Latina y el Caribe. PHI-VI / Documento técnico Nº 3. Poessen, J. 1992. Mechanisms of overland flow generation and sediment production on loamy and sandy soils with and without rock fragments. In Over-flow hydraulics and erosion mechanics, A.J. Parsons and A. D. Abrahams (Eds). Pérez, S. 2001. Modelo para evaluar la erosión hídrica en Colombia utilizando Sistemas de Información Geográfica. Universidad Industrial de Santander – IDEAM. Renard, K. 1995. Soil loss and runoff estimation. In: Soil Erosion, Conservation, and Rehabilitation. Edited by Door Menachem Agassi Rivera, P. J. 1999. Causas y consecuencias de la erosión de suelos de ladera colombiana. CENICAFE, Bogotá. Rivera, P. J. 2001. Susceptibilidad y predicción de la erosión en suelos de ladera de la zona Cafetera Colombiana. Universidad Nacional de Colombia. Medellín. Renard, K. G., Freimund, J. R. 1994. Using monthly precipitation data to estimate the R-factor in the revised USLE. Journal of Hydrology 157, 287-306. Suárez De Castro, F. 1951 Desyerbas con machete en los cafetales. Chinchiná (Colombia), Cenicafé, Campaña de Defensa y Restauración de Suelos. Suárez De Castro, F., Rodríguez, G. 1962. Investigaciones sobre la erosión y la conservación de los suelos en Colombia. Bogotá (Colombia), Federación Nacional de Cafeteros de Colombia. SYS, C., Van Ranst, E., Debaveye. J. 1991. Land Evaluation. Principles in Land Evaluation and Crop Production Calculations. Agricultural Publications Nº 7. General Administration for Development Cooperation. Brussels. Belgium.

References
110
Trisorio, L., Ladina, G., Todorovic, M. 2005. Identification of Areas Sensitive to Desertification in Semi-Arid Mediterranean Environments: The Case Study of the Abulia Region (Southern Italy). In: International Conference on: Water, Land and Food Security in Arid and Semi-Arid Regions. (Compiled by Atef Hamdy) Mediterranean Agronomic Institute. Valenzano, Bari-Italy. UNEP. 1997. United Nations Environment Programme. World Atlas of Desertification, 2nd edition. Edited by N. Middleton and D. Thomas. London: UNEP. 182pp. Uribe, H. 1971. Erosión y Conservación de suelos en café y otros cultivos. Cenicafé (Colombia). USDA. 1993. Soil Survey Manual. Soil conservation Service. United States Department of Agriculture. Washington, USA. Van Ranst, E., Verdoodt, A. 2005. Land Evaluation. Part III: Quantitative Methods in Land Evaluation. International Centre for Physical land Resources. Gent Universiteit. Belgium White, R., Nackoney, J. 2002. Drylands, People, And Ecosystem Goods And Services: A Web-Based Geospatial Analysis. World Resources Institute. Washington, DC. Wischmeier, W.H. 1976. 'Use and misuse of the universal soil loss equation', Joumal of Soil and Water Conservation 31, pp. 5-9. Wischmeier, W.H., Smith, D.D. 1965. 'Predicting rainfall-erosion losses from cropland east of the Rocky mountains', USDA Agricultural Handbook 282, Washington DC. Wischmeier, W.H., Johnson, C.B., Cross, B.V. 1971. 'A soil erodibility nomograph for farmland and construction sites', Joumal of Soil and Water Conservation 26.