ASSESSMENT OF A BIOLOGICAL NUTRIENT REMOVAL PROCESS FOR ... · ASSESSMENT OF A BIOLOGICAL NUTRIENT...
171
I I I I I I I I I I I I I I I ,I II .1 .1 ASSESSMENT OF A BIOLOGICAL NUTRIENT REMOVAL PROCESS FOR THE REMEDIATION OF EDIBLE OIL EFFLUENT SANDILE PSYCHOLOGY MKHIZE 2002
Transcript of ASSESSMENT OF A BIOLOGICAL NUTRIENT REMOVAL PROCESS FOR ... · ASSESSMENT OF A BIOLOGICAL NUTRIENT...
IIIIIIIIIIIIIII,III.1.1
ASSESSMENT OF A BIOLOGICALNUTRIENT REMOVAL PROCESS FOR THEREMEDIATION OF EDIBLE OIL EFFLUENT
SANDILE PSYCHOLOGY MKHIZE
2002
IIIIII'IIIIIIIIIIIIIII
ASSESSMENT OF A BIOLOGICAL NUTRIENT REMOVALPROCESS FOR THE REMEDIATION OF EDIBLE OIL
EFFLUENT
SANDILE PSYCHOLOGY MKHIZE
Dissertation submitted in compliance with the requirements of the Master's Degree inTechnology in the Department of Biotechnology, Technikon Natal, Durban
Supervisor:Mr. Faizal Bux
(M. TECH: BIOTECHNOLOGY, TECHNIKONNATAL)
Date
2002
IIIIIIIIIIIIIIIIIIIII
Declaration
I hereby declare that the dissertation is my own work, unless stated to the contrary in the text,and that it has not been submitted inpart, or in whole to any other TechnikonlUniversity.
~~April 2002
--.~
111

I I!
IIII Dedication
IIII THIS DISSERTATION IS DEDICATED TO MY FAMILY
IIIIIIIIII
lV
II

IIIIIIIIIIIIIIIIIIIII
I.
ABSTRACT
Eutrophication is a natural process that is greatly aggravated by the action of man in the
natural environment. Deterioration of South Africa's natural water resources results directly
or indirectly from the discharge of industrial effluent rich in nutrient nitrogen and
phosphorus. The South African edible oil refmeries generally discharge poor quality effluent
which impacts negatively on the water resources and wastewater treatment installations. The
main aim of this study was to assess the capacity of a laboratory scale effluent treatment
process that will produce final effluent of acceptable quality with regards to organic load and
phosphate concentration prior to its discharge into the municipal sewerage system. The study
was conducted in three stages: wastewater characterization, treatability studies, and
laboratory scale treatment investigations. After analysing various effluent parameters,
treatability studies were conducted using an aerobic-anaerobic sequencing batch reactor with
a total hydraulic retention time of 24 hours. The results showed an average of75 % reduction
of COD and more than 90 % removal of fats, oils and grease (FOG). Based on the results of
effluent characterisation and treatability studies, a laboratory scale activated sludge effluent
treatment process was designed and operated with two bioreactors (aerobic and anaerobic) in
series. The system was operated for a period of one-month resulting in 70 % removal of
COD and 4% reduction in phosphate (P04-P). After some structural and operational changes
from the original design configuration, the system was the operated continuously for the
duration of the study period. An optimum COD removal of 75 % and 107 mgll P04-P
reduction was achieved during the last operational phase of the system. More than 95 %
reduction in fats, oils and grease (FOG) had been achieved in both semi-continuously and
continuously operated systems.
v
IIIIIIIIIIIIIIIIIIIII
ACKNOWLEDGMENTS
I would like to specially thank my supervisor Mr. Faizal Bux for all the support and
encouragements during the difficult times towards completing this research project.
Special thanks goes to Mr. F. Swalaha and Dr. H. C. Kasan for the trust they had in me that I
was the suitable candidate for this project. Thanks to Mr. B. Atkinson for the assistance and
advise.
Thanks to Technikon Natal stuff at the Department of Biotechnology and my colleagues at
the Centre for Water and Wastewater Research. This work would not have been possible
without you.
This work was made possible through the financial assistant from the National Research
Foundation (NRF) end Technokon Natal's Centre for Water and Wastewater Research.
Thanks to Sea Lake Industries and their stuff for supplying the edible oil effluent samples for
this project.
Most of all, I would like to thank my Mom, Dad, two sisters, Nomfundo and Nelisiwe, and
all those special people close to me for their patience and support during trying times.
VI

IIIIIIIIIIIIIIIIIIIII
JOURNAL PUBLICATIONS
Part of the work presented in this report has been presented and published in National and
International Conferences and Journals.
Journal:
Title:
Authors:
Journal:
Title:
Authors:
Conference:
Venue:
Title:
Authors:
South African Journal of Science Vol. 97 (9/10) Sept./Octob.2001 (p 380-382)
Assessment of activated sludge to remediate edible-oil effluent.
Sandile P. Mkhize and Faizal Bux
Water SA. Vol. 26 (4) October 2000 (p 555-558)
Evaluation of a laboratory-scale biological process for the treatment of edible
oil effluent.
SP Mkhize, BW Atkinson and F Bux
Water Institute of South em Africa (WISA)
Sun City, 28 May -I June 2000
Evaluation of a laboratory-scale biological process for the treatment of edible
oil effluent.
SP Mkhize, BW Atkinson and F Bux
Vll

IIIIIIIIIIIIIIIIIIIII
TABLE OF CONTENTS
Page
Declaration
Dedication
Abstract
Acknowledgements
Journal Publications
List of Tables
List of Figures
Glossary of Terms
List of Symbols
111
IV
V
VI
VU
xu
Xlll
xv
XVI
CHAPTER!
1.0 JNTRODUCTION
1.1 The South African Edible Oil Industry
1.2 The Origins ofEffluentIWastewater
1.2.1 Refinery process and its effluents
1.2.1.1 Degumming
1.2.1.2 Chemical refining
(a) Neutralisation
(b) Bleaching
(c) Dewaxing
(d) Deodorising
1.2.1.3 Physical refilling
1.2.2 The acid oil plant and its effluent
1.2.3 The soap plant and its effluent
1.2.4 Wash down and miscellaneous effluents
1.3 On-site effluent treatment methods at Sealake Industries
1.3.1 pH correction
1.3.2 Dissolved air floatation (OAF)
1.4 The Effluent problem and Legislation
1
1
3
6
8
9
9
11
12
12
13
15
16
17
18
19
20
21
V111
IIIIIIIIIIIIIIIIIIIII
1.5 Project Aim and Objectives
CHAPTER 2
23
2.0 LITERATURE REVIEW
2.1 The Eutrophication problem
2.1.1 Source of nutrients (Phosphorus)
2.1.1.1 Diffuse source
2.1.1.2 Point source
2.2 Treatability of Edible Oil Effluents
2.2.1 Physical treatment
2.2.1.1 Gravity settling or Fat traps
2.2.1.2 Dissolved air floatation (DAP)
2.2.2 Chemical treatment
2.2.2.1 Advantage of chemical treatment
2.2.2.2 Disadvantages of chemical treatment
2.2.3 Biological treatment
2.2.3.1 Anaerobic treatment
2.2.3.2 The Activated Sludge treatment process
2.3 Biological Nutrient Removal treatment process
2.3.1 Carbonaceous energy (COD) removal
2.3.2 Nitrogen removal process
2.3.2.1 The Anoxic zone
2.3.3 Biological Phosphorus removal
2.3.4 Mechanisms of Biological excess P removal
2.3.4.1 The Anaerobic zone
2.3.4.2 The Aerobic zone/reactor
24
24
27
27
28
29
30
30
32
33
35
35
36
36
37
40
43
46
47
47
54
54
56
CHAPTER 3
3.0 WASTEWATER CHARACTERISATION AND TREATABfi.,ITY
STUDIES
3.1 Introduction
3.2 Materials and Methods
59
59
61
IX
IIIIIIIIIIIIIIIIIIIII
3.2.1 Sampling
3.2.1.1 Sample preservation
3.2.1.2 Sample analysis methods
3.3 Results
3.4 Treatability experiments
3.4.1 Results of treatability experiments
3.5 Discussion
61
61
62
63
64
66
68
CHAPTER 4
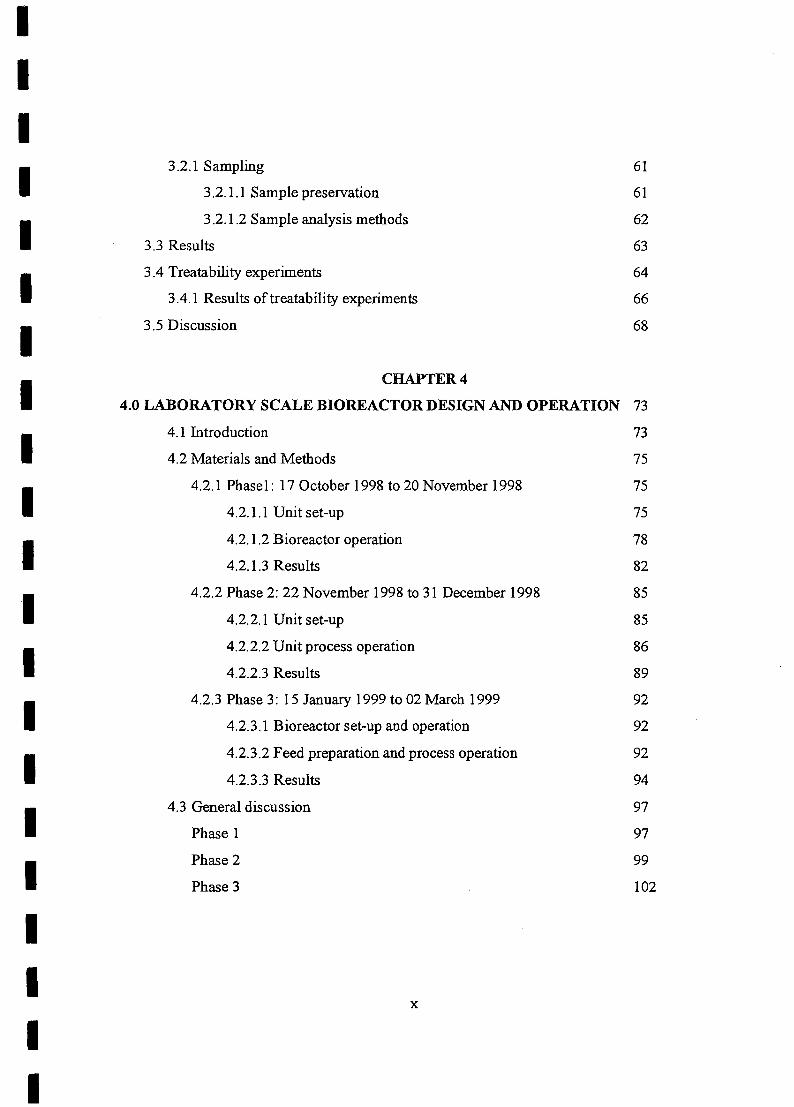
4.0 LABORATORY SCALE BIOREACTOR DESIGN AND OPERATION 73
4.1 Introduction
4.2 Materials and Methods
4.2.1 Phasel: 17 October 1998 to 20 November 1998
4.2.1.1 Unit set-up
4.2.1.2 Bioreactor operation
4.2.1.3 Results
4.2.2 Phase 2: 22 November 1998 to 31 December 1998
4.2.2.1 Unit set-up
4.2.2.2 Unit process operation
4.2.2.3 Results
4.2.3 Phase 3: 15 January 1999 to 02 March 1999
4.2.3.1 Bioreactor set-up and operation
4.2.3.2 Feed preparation and process operation
4.2.3.3 Results
4.3 General discussion
Phase 1
Phase 2
Phase 3
73
75
75
75
78
82
85
85
86
89
92
92
92
94
97
97
99
102
x

IIIIIIIIIIIIIIIIIIIII
CHAJPTER5
5.0 TREATMENT PROCESS OPTIMiSATiON (PHASE 4)
5.1 Introduction
5.1.1 Size of Anaerobic reactor
5.1.2 Number of Anaerobic reactors
5.1.3 Sludge age
5.1.4 Influent COD characteristics
5.2 Materials and Methods
5.2.1 Bioreactor lay-out and operation
5.3 Results
5.4 Discussion
106
106
107
108
108
109
110
110
113
116
CHAJPTER6
6.0 GENElRAL CONCLUSiONS AND RECOMMENDATiONS 121
REFERENCES 124
APPENDIX I AAPPENDIX 2 BAPPENDIX 3 CAPPENDIX 4 DAPPENDIX 5 EAPPENDIX 6 FAPPENDIX 7 GAPPENDIX 8 HAPPENDIX 9 JAPPENDIXIO LAPPENDIX II MAPPENDIXI2 NAPPENDIXI3 PAPPENDIXI4 R
Xl
III List of Tables
I No. Title Page
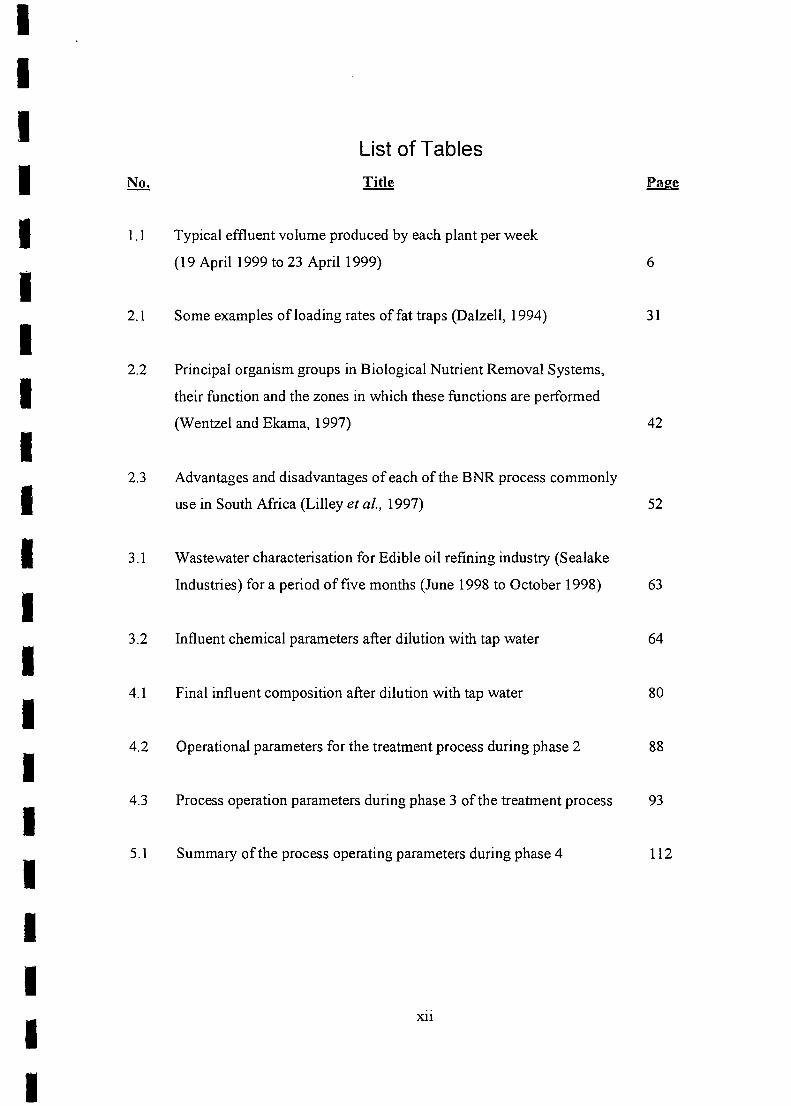
I 1.1 Typical effluent volume produced by each plant per week
(19 April 1999 to 23 April 1999) 6
I2.1 Some examples of loading rates of fat traps (Dalzell, 1994) 31
I2.2 Principal organism groups in Biological Nutrient Removal Systems,
I their function and the zones in which these functions are performed
(Wentzel and Ekama, 1997) 42
I2.3 Advantages and disadvantages of each of the BNR process commonly
I use in South Africa (Lilley et a/., 1997) 52
I 3.l Wastewater characterisation for Edible oil refining industry (Sealake
Industries) for a period of five months (June 1998 to October 1998) 63
I3.2 Influent chemical parameters after dilution with tap water 64
I4.1 Final influent composition after dilution with tap water 80
I4.2 Operational parameters for the treatment process during phase 2 88
I4.3 Process operation parameters during phase 3 of the treatment process 93
I5.1 Summary of the process operating parameters during phase 4 112
IIII
xu
I

IIIIIIIIIIIIIIIIIIIII
List of Figures
No.
1.1 Schematic representation of the layout of the five plants at Sealake
Industries and the effluents they produce 5
1.2 Physical and Chemical refining process for Edible oil 7
1.3 Schematic representation of the effluent treatment plant at
Sealake Industries 18
2.1 A diagrammatic representation of conventional completely mixed
activated sludge system with hydraulic control of sludge age and recycle 38
2.2 Division of Influent COD into its constituent fractions (Dold et al., 1991
as cited from Wentzel et al., 1995) 45
2.3 Configuration of commonly used Biological Nutrient Removal (BNR)
processes in South Africa (Lilley et al., 1997) 50
3.1 Sequencing Batch Reactor performance in terms of COD removal
over a period of7 days 66
3.2 Removal of FOG by the Sequencing Batch Reactor over a period
of7 days 67
4.1 Schematic diagram of modified 3 stage Phoredox Process for biological
nitrogen (N) and phosphorus (P) removal 75
4.2 Schematic representation of a 2-stage Modified Phoredox process for
biological (P) removal 76
Xlll

III 4.3a Influent and Effluent soluble COD profiles for a semi-continuously
I operated biological treatment process at F1M ratio of 1.0 (phase 1) 82
I4.3b Influent and Effluent soluble P profiles for semi-continuously operated
biological treatment process at F1M ratio of 1.0 (phase 1) 83
I 4.3c Influent and effluent FOG profiles during Phase 1 84
I4.4a Influent and Effluent soluble COD profiles for continuously operated
biological treatment process at FIM ratio of 1.5 (phase 2) 89
I 4.4b Influent and Effluent soluble P profiles for a continuously operated
I biological treatment process at FIM ratio of 1.5 (phase 2) 90
4.4c Influent and effluent FOG profiles during phase 2 91
I 4.5a Influent and Effluent soluble COD profiles for continuously operated
I biological treatment process at F1M ratio of O. 5 (phase 3) 94
4.5b Soluble influent and effluent orthophosphate profile for continuously
I operated biological treatment process at FIM ratio of 0.5 (phase 3) 95
I 4.5c Influent and Effluent FOG profiles during phase 3 96
5.1 Total influent and effluent COD profiles for continuously
I operated biological treatment process at 0.5 FIM ratio (Phase 4) 113
I 5.2 Soluble influent and effluent orthophosphate profile for continuously
operated biological treatment process at FIM ratio of 0.5 (phase 4) 114
I 5.3 Influent and Effluent FOG profiles during phase 4 115
IIII
XIV
I
IIIIIIIIIIIIIIIIIIIII
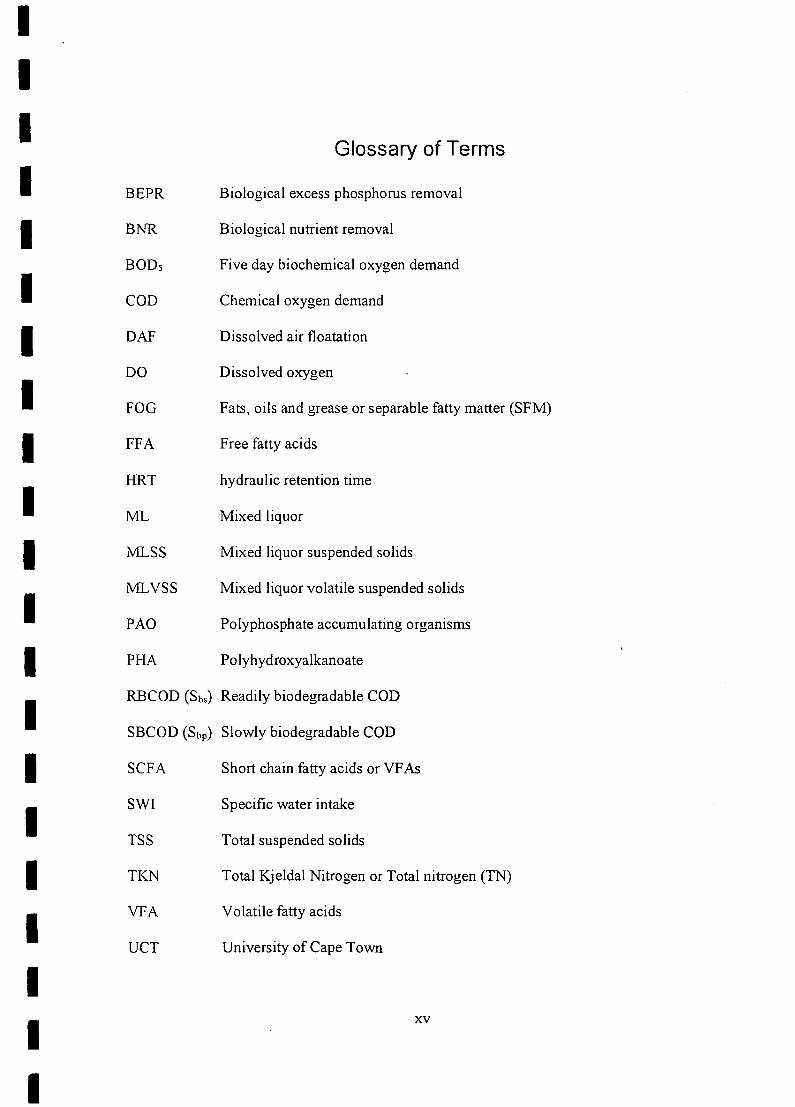
BEPR
BNR
BODs
COD
DAF
DO
FOG
FFA
HRT
ML
MLSS
MLVSS
Glossary of Terms
Biological excess phosphorus removal
Biological nutrient removal
Five day biochemical oxygen demand
Chemical oxygen demand
Dissolved air floatation
Dissolved oxygen
Fats, oils and grease or separable fatty matter (SFM)
Free fatty acids
hydraulic retention time
Mixed liquor
Mixed liquor suspended solids
Mixed liquor volatile suspended solids
PAO Polyphosphate accumulating organisms
PHA Polyhydroxyalkanoate
RBCOD (Sbs) Readily biodegradable COD
SBCOD (Sbp) Slowly biodegradable COD
SCF A Short chain fatty acids or VF As
SWI Specific water intake
TSS Total suspended solids
TKN Total Kjeldal Nitrogen or Total nitrogen (TN)
VF A Volatile fatty acids
OCT University of Cape Town
xv
IIIIIIIIIIIIIIIIIIIII
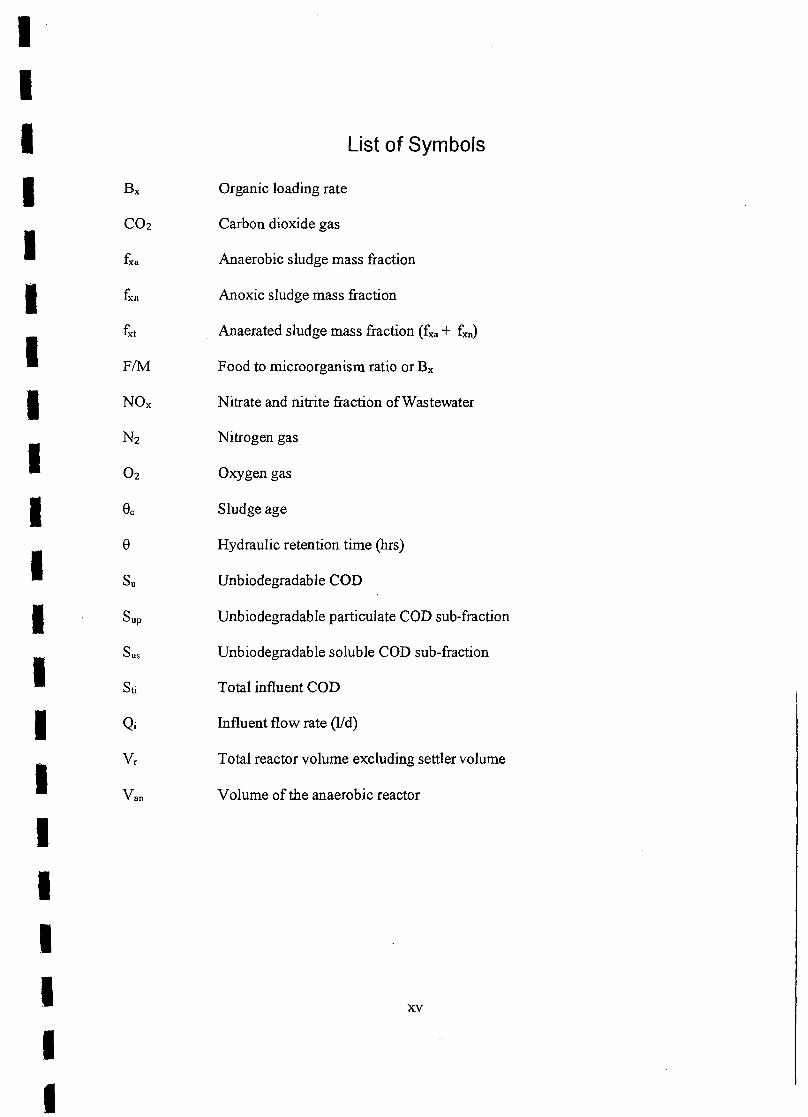
List of Symbols
fxa
fxn
Organic loading rate
Carbon dioxide gas
Anaerobic sludge mass fraction
Anoxic sludge mass fraction
Anaerated sludge mass fraction (fxa+ fxn)
Food to microorganism ratio or Bx
Nitrate and nitrite fraction of Wastewater
Nitrogen gas
Oxygen gas
Sludge age
Hydraulic retention time (hrs)
Unbiodegradable COD
Unbiodegradable particulate COD sub-fraction
Unbiodegradable soluble COD sub-fraction
Total influent COD
Influent flow rate (lId)
Total reactor volume excluding settler volume
Volume of the anaerobic reactor
fxt
e
xv
Van
IIIIIIIIIIIIIIIIIIIII
CHAPTER!
1INlflR oJI))1UC'fK oN
1.1 THE SOUTH AFRICAN EDmLE OIL lINDUSTRY
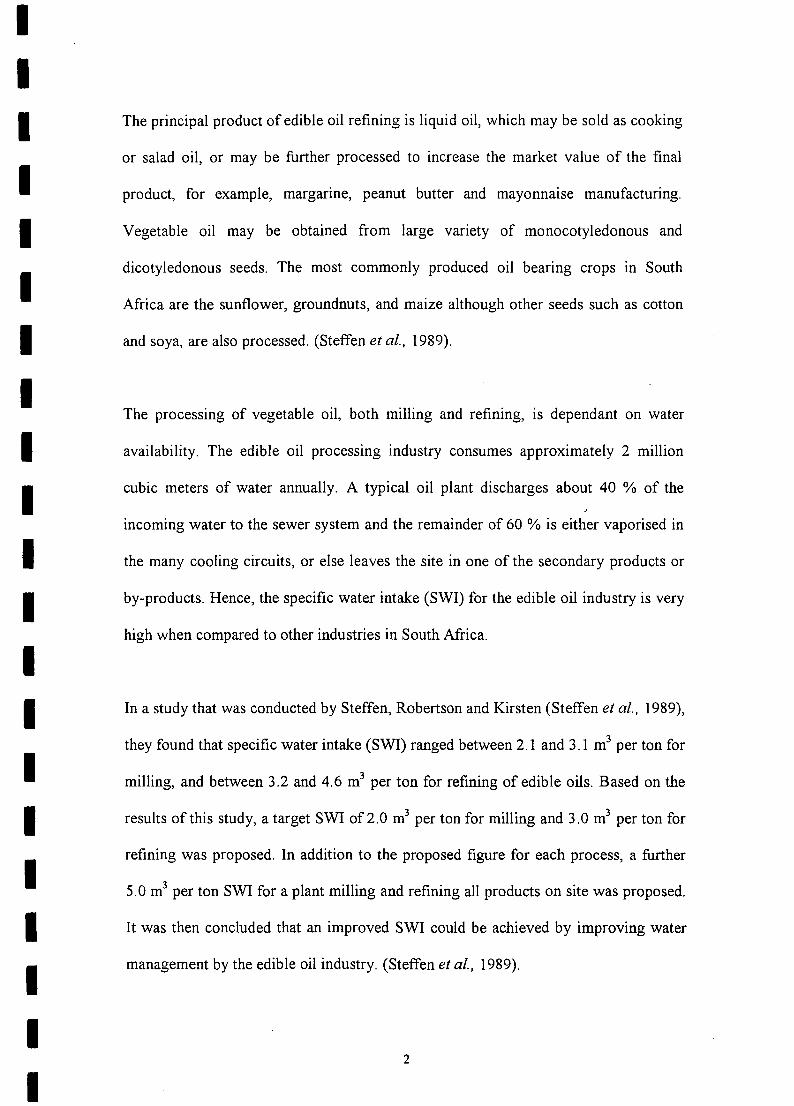
South Africa has about 16 edible oil processing plants that are managed by 10
separate groups. These industries refine an.d process approximately 300 000 tons of
crude vegetable oil per year, with production increasing annually by about 3 %. The
amount of oil that is produced locally depends very much on the climatic conditions.
Good rains lead to good maize, groundnut and sunflower crops, which results in good
oil seed production. However, drought has negative impact in the industry, resulting
in decline raw material production. To make up for the short fall in local oil
production, the balance of oil is imported, in crude form, to be refined in the South
African refineries (Steffen et al., 1989).
Vegetable oil production can be divided into two distinct stages, which are: crude oil
production in an oil mill, and crud oil processing which is conducted in a refinery.
Thus the vegetable oil industry can be divided into two main groups based on the
main production process being used. The milling industry produces crude oil from
raw materials such as seed, and the refining industry purchases and refines crude oil
into final products. In South Africa, the two stages of processing are usually
conducted on the same site. Marine oils and animal fats are purchased in crude form
and refined on site (Steffen et al., 1989).
1
IIIIIIIIIIIIIIIIIIIII
The principal product of edible oil refining is liquid oil, which may be sold as cooking
or salad oil, or may be further processed to increase the market value of the final
product, for example, margarine, peanut butter and mayonnaise manufacturing.
Vegetable oil may be obtained from large variety of monocotyledonous and
dicotyledonous seeds. The most commonly produced oil bearing crops in South
Africa are the sunflower, groundnuts, and maize although other seeds such as cotton
and soya, are also processed. (Steffen et al., 1989).
The processing of vegetable oil, both milling and refining, is dependant on water
availability. The edible oil processing industry consumes approximately 2 million
cubic meters of water annually. A typical oil plant discharges about 40 % of the
incoming water to the sewer system and the remainder of 60 % is either vaporised in
the many cooling circuits, or else leaves the site in one of the secondary products or
by-products. Hence, the specific water intake (SWI) for the edible oil industry is very
high when compared to other industries in South Africa.
In a study that was conducted by Steffen, Robertson and Kirsten (Steffen et al., 1989),
they found that specific water intake (SWI) ranged between 2.1 and 3.1 m3 per ton for
milling, and between 3.2 and 4.6 m3 per ton for refining of edible oils. Based on the
results of this study, a target SWI of2.0 m3 per ton for milling and 3.0 m3 per ton for
refining was proposed. In addition to the proposed figure for each process, a further
5.0 m3 per ton SWI for a plant milling and refining all products on site was proposed.
It was then concluded that an improved SWI could be achieved by improving water
management by the edible oil industry. (Steffen et al., 1989).
2
IIIIIIIIIIIIIIIIIIIII
1.2 'fEE OlRIGllNS OF EFFLUEN'fIW AS'fEW A'fER
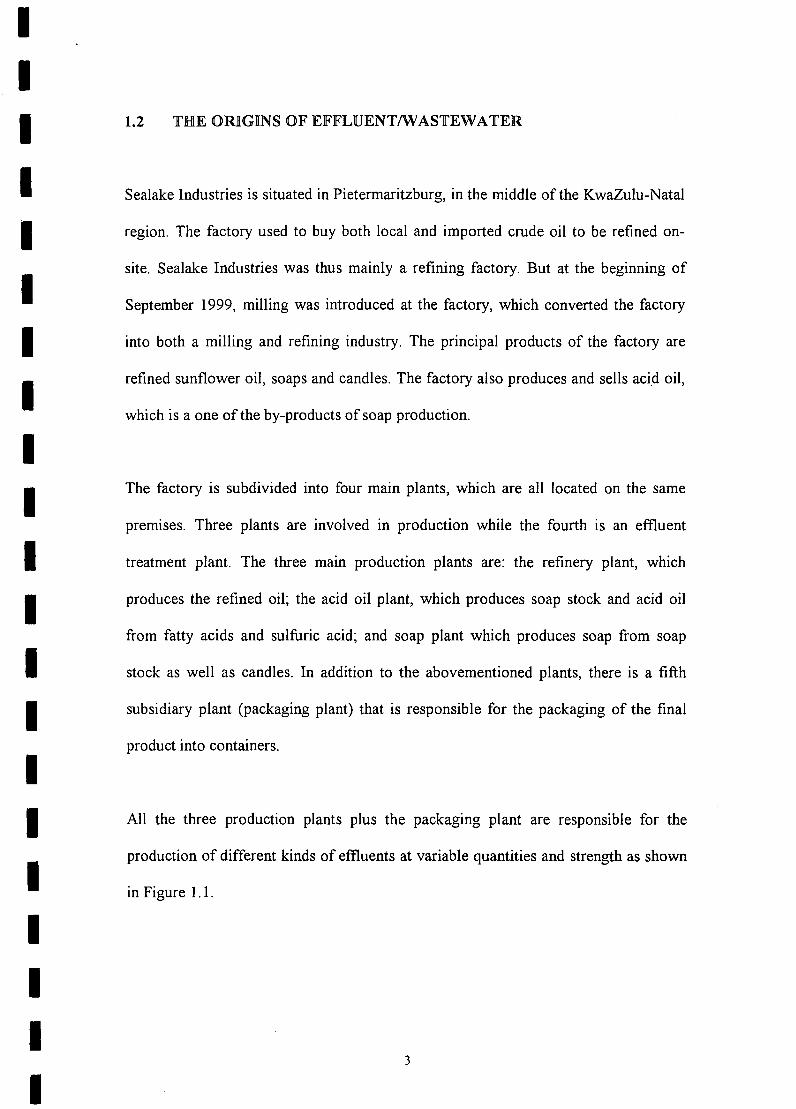
Sealake Industries is situated in Pietermaritzburg, in the middle of the KwaZulu-Natal
region. The factory used to buy both local and imported crude oil to be refined on-
site. Sealake Industries was thus mainly a refining factory. But at the beginning of
September 1999, milling was introduced at the factory, which converted the factory
into both a milling and refining industry. The principal products of the factory are
refined sunflower oil, soaps and candles. The factory also produces and sells acid oil,
which is a one of the by-products of soap production.
The factory is subdivided into four main plants, which are all located on the same
premises. Three plants are involved in production while the fourth is an effluent
treatment plant. The three main production plants are: the refinery plant, which
produces the refined oil; the acid oil plant, which produces soap stock and acid oil
from fatty acids and sulfuric acid; and soap plant which produces soap from soap
stock as well as candles. In addition to the abovementioned plants, there is a fifth
subsidiary plant (packaging plant) that is responsible for the packaging of the final
product into containers.
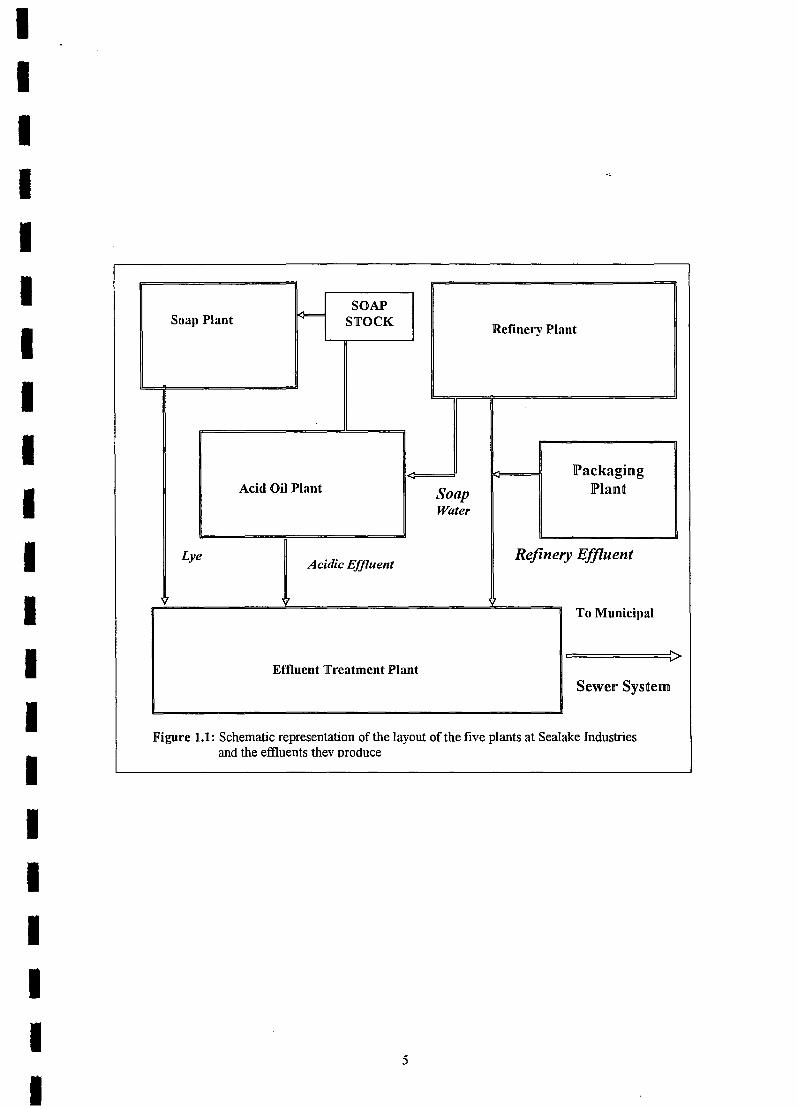
All the three production plants plus the packaging plant are responsible for the
production of different kinds of effluents at variable quantities and strength as shown
in Figure 1.1.
3
IIIIIIIIIIIIIIIIIIIII
The volumes of effluents produced per plant vary on weekly basis depending on the
refinery process employed as shown in Table 1.1. To understand the overall quality
and quantity of effluent produced by the factory, it is better to consider individually
the unit operations of each plant, its main products and effluents.
4
IIIIIIIIIIIIIII
Soap Plant
Lye
SOAPSTOCK
Acid Oil Plant
Acidic Ejjluent
SoapWater
Refinery Plant
Effluent Treatment Plant
<===" PackagingPlant
Refinery Effluent
To Municipal
Sewer System
Figure 1.1: Schematic representation of the layout of the five plants at Sealake Industriesand the effluents thev produce
...
IIIIII
5

III Table 1.1: Typical effluent volumes produced by each plant per week (19 April
1999 to 23 April 1999)
III
DAY REFINERY LYE ACID WATEREFFLUENT
(24 HOURS) (tons/day) (tons) (tons)
MONDAY 96 15 15
TUESDAY 96 10 15
WEDNESDAY 96 20 15
THURSDAY 96 7 15
FRIDAY NIL NIL 15
II
II 1.2.1 Refinery process and its effluents
III
The refinery is associated with the removal of phospholipids, colour bodies and other
soluble and insoluble impurities from crude oil. The production of refined vegetable
oil can be divided into two alternative processes or stages viz., chemical refining and
Iphysical refining. The two processes are different from each other and thus produce
effluents of different quality and character. Nevertheless, the product in both
I processes is similar in quality i.e. refined vegetable oil ready for commercial use.
IBoth the physical and the chemical refining processes for crude vegetable oil are
shown schematically in Figure 1.2 below.
IIIII
6

Figure 1.2: Physical and chemical refining process for Edible oil (Steffen et al.,1989).
IIIIIIIIIIIIIIIIIIIII
CRUIDfJE: 0 llL
!DEGUM
., Chemical" Refining
~ .
BLEND
DEODOlRISE
7
"Physical" Refining
BLEACH
STEAM Sl'RIIP
IIIIIIIIIIIIIIIIIIIII
1.2.1.1 Degumming
Degumming may be considered the first step in the refining process that is designed to
remove the phosphatides from the crude oil that interfere with subsequent processing.
Oils high in phosphorus such as soybean, corn and sunflower, may require
degumming prior to the refining process. But the degumming process is not always
necessary, as the phosphatides can generally be effectively removed in subsequent
processes. There are two types of gums viz. hydratable and the non-hydratable types.
The primary reason for degumming is to either provide crude degummed oil suitable
for storage or long transit; to prepare oil for physical refining; or to produce lecithins.
There are three main problems that are associated with the presence of gums in the
crude oil, which are:
(a) Decreased oil-water separation in the acidulation process, caused by the
emulsifying properties of phospholipids when released as soap stock,
resulting in product loss.
(b) The tendency of gums to impart deep brown colouring to finished oil
during the deodorising stages due to high temperature that are employed.
(c) Adverse impact on product stability due to formation of complex
compounds with certain trace metals.(Steffen et al., 1989).
Water degumming is effective only for water-hydratable phosphatides ie. those
having a great affinity for water phase existence then the remaining oil phase. The
addition of hot water and subsequent separation of the swollen insoluble gums in the
centrifuge equipment easily removes them. For non-hydratable gums, pretreatment of
8
IIIIIIIIIIIIIIIIIIIII
the oil with phosphoric acid or citric acid is required to render them hydratable. The
resultant hydratable gums are subsequently removed through addition of small
amounts of water followed by centrifugation or by use of an activated adsorbent
coupled with a filter. Many variations on this two-stage process exist. (Horan, 1991).
The effluent that is produced during the degumming stage tends to contain large
quantities of phospholipids, inorganic phosphates (from use of phosphoric acid) and
fats, oils and grease (FOG).
1.2.1.2 Chemical Refining
Chemical refining, also known as caustic refining, generally refers to the process
designed to neutralise free fatty acids present in the oil by introduction of an alkali,
followed by centrifugal separation of the heavy phase insoluble material. Caustic
neutralization is the traditional first step for edible oil processing if degumming is not
included as a pretreatment step. Caustic refining is made up of five inter-related
processes and each process produces its own unique effluent. The five processes are
neutralization, bleaching, hydrogenation, winterizing and deodorizing. The advantage
of caustic refining over the alternative method is that it is less sensitive to the type of
feedstock used.
(a) Neutralization
Crude oil naturally contains a percentage of free fatty acids (FF A). The free fatty
acids or carboxilic acids are a resultant product of natural degradation oftriglycerides.
9

IIIIIIIIIIIIIIIIIIIII
Dilute caustic soda solution of up to 4N strength is usually used for neutralisation.
The oil-alkali solution is thoroughly agitated to ensure intimate contact, normally
using an inline high-shear mixer. Both the oil and caustic soda should be cooled to
less then 38°C. A careful control of the operating conditions is required at this stage
because of the strong caustic soda used, which tends to saponify the neutral
triglyceride with the consequent loss of neutral oil (Hui, 1996).
The neutralisation process also helps with the removal of metals, particularly
magnesium (Mg) and calcium (Ca). Apart from saponification of free fatty acids in
the crude oil, caustic addition tends to be more effective in hydration of gums than
addition of hot water only. Thus it is possible for crude oil containing low gum
contents to be processed chemically without the need for the degumming pretreatment
step (Hui, 1996).
The immiscible soap or soapstock that is produced upon neutralisation is separated
from the neutralised oil using centrifuges or gravitational settling, depending whether
the operation is continuous, semi-continuous or batch process. Phosphoric acid may
be added in the wash water to reduce the residual soap in the refined oil, and to
provide a better split between the oil and the aqueous phase. The soapstock is further
treated in the acid oil plant (on-site) to produce acid oil (Steffen et a/., 1989; Hui,
1996).
Chemical refining with caustic soda gives rise to the most potent effluent generated at
an oil processing plant. The resultant effluent stream is known as soapy water and
10
IIIIIIIIIIIIIIIIIIIII
contains quantities of free fatty acids, free oils, gums or phospholipids, sodium ions
and phosphates (Eroglu et aI., 1990).
(b) Bleaching
Bleaching is the adsorptive process that is associated with edible oil refining process.
While the degumming operation is designed to remove phosphatides and caustic
refining converts water soluble free fatty acids into soluble soaps, adsorptive
bleaching provides the last practical opportunity to reduce the quantities of the
remaining impurities, especially colour and phospholipids, to acceptable levels. The
major colour pigments found in edible oil are chlorophyll (green) and caretenoids
(orange) (Hui, 1996).
Bleaching, like neutralisation process, may be conducted in a batch, semi-continuous
or continuous mode. This step in edible oil refining process is conducted under
vacuum at raised temperatures (Steffen et al., 1989). In practice, the oil to be bleached
may require pretreatment with acid (known as the dry degumming process for crude
oils), which may be followed by dosing with bleaching clay and/or other agents in a
slurry tank. The clay-oil mixture is agitated in a compartmentalised bleacher for
several minutes before it is filtered to remove solids. Sometimes clay may be added in
two stages, an inactivated clay is added first absorbs soaps whilst a more expensive
activated clay absorbs trace metals, pigments and various other products which would
otherwise cause reduced product shelf life. Bleaching produces the least effluent
compared to other stages in edible oil refining (Hui, 1996). The effluent that is
11
IIIIIIIIIIIIIIIIIIIII
produced at this stage is mainly acidic water from the acid pretreatment operation
(Steffen et al., 1989).
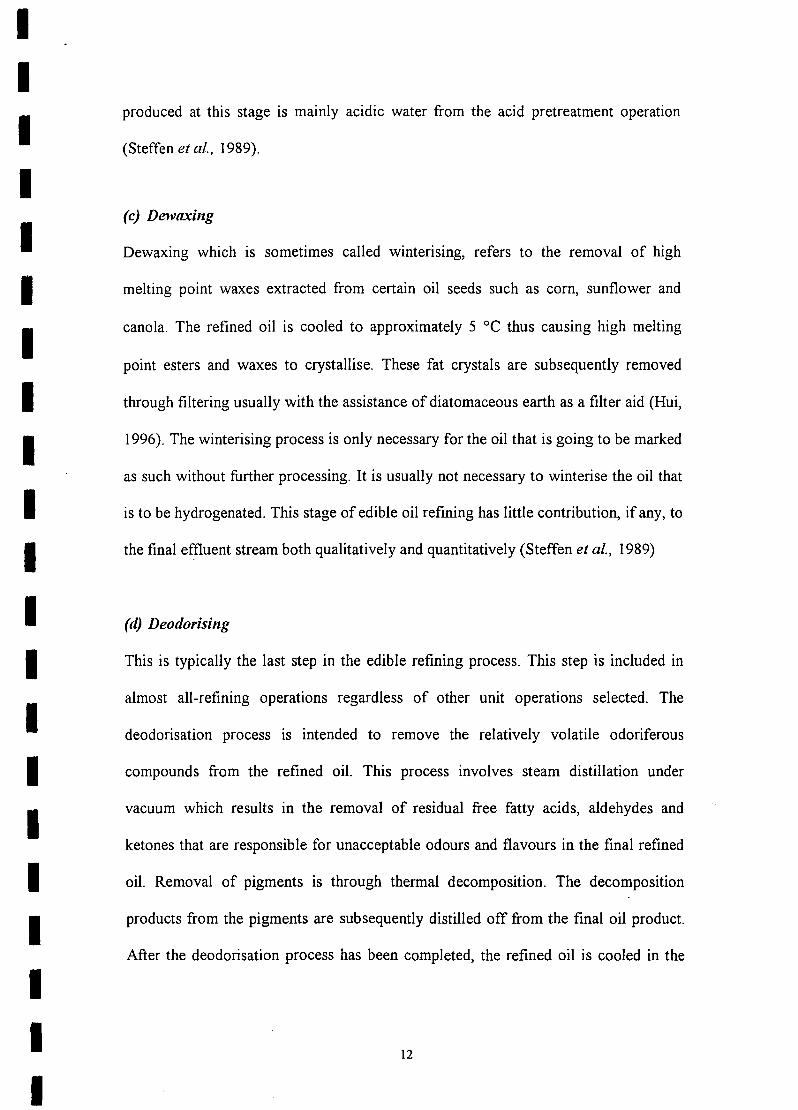
(c) Dewaxing
Dewaxing which IS sometimes called winterising, refers to the removal of high
melting point waxes extracted from certain oil seeds such as corn, sunflower and
canola. The refined oil is cooled to approximately 5 °C thus causing high melting
point esters and waxes to crystallise. These fat crystals are subsequently removed
through filtering usually with the assistance of diatomaceous earth as a filter aid (Hui,
1996). The winterising process is only necessary for the oil that is going to be marked
as such without further processing. It is usually not necessary to winterise the oil that
is to be hydrogenated. This stage of edible oil refining has little contribution, if any, to
the final effiuent stream both qualitatively and quantitatively (Steffen et ai., 1989)
(d) Deodorising
This is typically the last step in the edible refining process. This step is included in
almost all-refining operations regardless of other unit operations selected. The
deodorisation process is intended to remove the relatively volatile odoriferous
compounds from the refined oil. This process involves steam distillation under
vacuum which results in the removal of residual free fatty acids, aldehydes and
ketones that are responsible for unacceptable odours and flavours in the final refined
oil. Removal of pigments is through thermal decomposition. The decomposition
products from the pigments are subsequently distilled off from the final oil product.
After the deodorisation process has been completed, the refined oil is cooled in the
12

IIIIIIIIIIIIIIIIIIIII
lower tanks before being pumped for storage in the storage tanks. Small quantities of
citric acid may be added during the cooling stage as an anti-oxidant to prevent
oxidation of the cooled oil (Hui, 1996).
Deodorisation produces the second largest volume of effluent after the neutralisation
process. Most of the effluent which is produced at this stage is the distillate from oil
which contains volatile compounds responsible for the oil's characteristic odours as
well as any remaining free fatty acids. A large quantity of water is also used during
this stage for cooling purposes, which increases the specific water intake (SWI) of the
plant. Some of the stripping stream and the remaining free fatty acid water vapours
are mixed with the cooling water. After this has been recirculated over cooling
towers, it is then discharged down the drain to join the main effluent stream (Steffen
et al., 1989).
1.2.1.3 lPlEIIYS][CAlL REJFllNIN G
Physical refining refers to the process whereby the free fatty acids in the crude or
degummed oils are removed by evaporation rather than by being neutralised and
subsequently removed as soap stock as is done during an alkali refining process. In
design and operation, the deodoriser is very much like the physical refiner, with the
major exception being the higher load of free fatty acids removed in physical refining
process. Whilst some deodorising system designs can use carbon steel for certain non-
contacted parts, the high levels of fatty acids generally demand that a physical
refining system be made from stainless steel or other material not affected by contact
13

IIIIIIIIIIIIIIIIIIIII
with fatty acids to prevent corrosion. The physical refining technique has two primary
advantages over the conventional caustic refining route i.e. reduction in oil losses and
the elimination of soapstock and its associated treatment problems (Hui, 1996, Steffen
et al., 1989).
Physical refining process has, however, one very important requirement, which is that
the feedstock or crude oil should be rigorously pretreated to ensure it is free from
phosphatides, impurities, trace metals and earth-removable pigments. If these
impurities were allowed to remain in the oil, the high temperatures used in the process
would darken the oil and hence resulting in poor quality product. The extent of
pretreatment necessary depends on the particular oil type and its quality. Pretreatment
of high fatty acid containing oils such as maize and sunflower, prior to physical
refining, may comprise the addition of phosphoric acid or citric acid at temperatures
of approximately 70 °C followed by high speed centrifugation to remove the hydrated
gums. The centrifuged oil is then dried, bleached and winterised before physical
refining. Both continuous and semi-continuous units may be used for physical
refining (Hui, 1996).
The effluent streams that result from physical refining are similar in quality to those
produced during degumming and deodorizing stages of caustic refining. But the
quality and quantity of the effiuent thus produced is superior to that produced during
caustic refining due to the elimination of the neutralisation step and its associated
effiuent stream. Thus the final effiuent from chemical refining will contain
phospholipids or gums, inorganic phosphate from the pretreatment phase.: volatile
14
IIIIIIIIIIIIIIIIIIIII
organic compounds that are responsible for the oil's characteristic odours, as well as
any residual free fatty acids and oil.
1.2.2 l'HE ACID OXLlPLANl'AND Il'S EFFLUENl'S
The main product of the acid oil plant is the acid oil, which is produced from a
feedstock commonly known as soapstock. Soapstock is the byproduct of crude oil
neutralisation with caustic soda during chemical refining process. As a result both the
oil and the water phases have very high concentrations of fats, oils and grease (FOG),
total suspended solids (TSS), biological oxygen demand (BOD), chemical oxygen
demand (COD) loads, and including" potentially valuable glycerin and free fatty acid
sources, most processors include acidulation as part of the integrated facility. (Abou-
Elela and Zaher, 1998).
Acidulation is one of the least desirable processes in the integrated facility. The
process is rather difficult to perform effectively and it is generally the most cost
ineffective process since it has no significant financial returns. The acidulation system
is based on gravity separation that can be performed in either a continuous or a batch
operation. The process involves collecting soapstock into equalization or holding
tank. The mixture is heated and then treated with sulfuric acid (H2S04) at controlled
pH of about 2 to 2.2 units. After the reaction with the acid, the mixture enters a series
of holding and settling tanks where the oil and the aqueous phases separate. Acid oil
is skimmed from the top surface, which is followed by drying. The acid oil may be
sold as it is or may be passed through an evaporative heat exchanger to remove excess
15
IIIIIIIIIIIIIIIIIIIII
water. The product is sold as a feed ingredient or may also be used as a feedstock for
soap and other industrial applications (Hui, 1996).
The acid water that is produced during acidulation may be neutralized with lime or
other alkaline material prior to its discharge to the main effluent stream. This stream
(acid water stream) is heavily polluted, with high concentrations of COD, BOD, TSS
and sulfates. The concentrations of most of the contaminants in this stream far exceed
the municipal discharge standards.
1.2.3 THlE SOAP PlLANT AND ITS lEFFlLUENTS
At Sealake industries, the main product of the soap plant is bar soap. No powdered
soap is produce or manufactured on site. The soap manufacturing process may be
performed as either a batch or continuous operation. The acid oil, which contains fatty
acids from the acidulation phase, is neutralised using strong caustic hydroxide
solution. The free fatty acids that results from the acid oil reacts with excess sodium
hydroxide (NaOH) to form sodium salts which precipitate out of solution. After
centrifugation and further treatment, the soap is then molded into desired shapes
before being sold (Hui, 1996).
The effluent stream that is produced in this plant is generally known as lye water. It
usually contains quantities of oils, free fatty acids, sulfates, and some sodium salts of
free fatty acids. This stream is usually combined with acid oil water prior to its
discharge to the final effluent stream.
16

IIIIIIIIIIIIIIIIIIIII
1.2.4 WASH DOWN AND M][SCELLANEOUS EFFLUENTS
Wash-down effluents are those effluents that emanate from regular cleaning of the
edible oil factory. This cleaning is generally performed after a week's production or
between changes of feed stock. Batch equipment may be cleaned after each batch has
been processed. The cleaning of vessels is usually performed using live steam and hot
water, to ensure maximum use of steam and the reduction in effluent volumes. Floor
cleaning is conducted using hot water as necessary, which improves hygiene and
reduces manual labour. The fats and oil bearing effluent stream resulting from
cleaning is discharged to the main effluent stream via fat traps. The oil rich scum from
the fat traps is recovered and recycled for reworking (Hui, 1996).
The miscellaneous effluents, which are a bulk of the remaining effluent, in terms of
volume, emanate from the boiler house. Large volumes of effluent are generated from
the ion exchange water softening units that are used for steam generation purposes. A
considerable amount of effluent also comes from the return oil rich condensate from
various vessels in the oil-processing factory. These steams combine with cooling
tower blow down to form a significant volume of comparatively salty or saline
effluent (Hui, 1996).
17

IIIII
1.3 ON-SiTE EFFLUENT TREAMENT METHODS AT SEALAKE
iND USTRJ[ES
The three main effluent streams that are generated from the four main plants (see
Figure 1.1) are channeled to the on-site effluent treatment plant. This plant is for
II
treatment or pretreatment of incoming effluent prior to its discharge into the
municipal sewer system. The three main effluents are the effluent from the refinery
I and packaging plants; the acidic effluent from the acid oil plant; and lye from the soap
plant. The effluent plant comprises of two large holding tanks, pH correction tank,
II
dissolved air floatation (DAF) unit and two settling tanks which are operated in series
(Fig. l.3).
IIIIIIIII
LYE & SOAPWATERTANK
RElFllNERYEFlFLUENT
TANK
CapsuleTank
DAFFloatation
TANK
-.~
pHBALANCING
FINAL EFFLlJRNTFINAL SETTLING TANKS
NEUTRALISATIONPOINT
DAFPUMP
PUMP
Figure 1.3: Schematic representation of the effluent treatment plant at SealakeIndustries.
II
18

IIIIIIIIIIIIIIIIIIIII
Acidic effluents i.e. lye and acid water, are pumped and mixed together in the first
holding tank. This effluent has a low pH of about 1-2 and is highly aggressive to
concrete because of its sulfate content. On the other hand the refinery effluent has a
high pH content ranging between 12 and 13. This effluent is pumped to the second
holding tank. There are two processes for effluent treatment that are currently being
used at Sealake Industries. The two effluent treatment processes are pH correction and
physical separation of oil and grease using dissolved air floatation (DAF) method.
After OAF treatment, lime and/or ferric chloride (FeCh) is added to the effluent,
which is followed by settling in the two settling tanks in order to remove precipitated
particles. The resultant effluent is discharged to the sewer system to be treated by
Darvill Wastewater Works.
1.3.1 pH CORRECTKON
The effluents from the two holding tanks are mixed together into a single effluent
stream. Because of the pH differences in between the two effluent streams, the two
streams are mixed at different volume ratios by controlling the flow rates from the
two tanks such that the desired final pH of between 5.5 and 8.5 is archived in the final
combined effluent stream. This effluent is finally directed to the acid equalisation tank
for final pH adjustment. The effluent at this stage may be dosed with a polyelectrolite
such as lime or ferric chloride to coagulate fats and to precipitate phosphates. This
effluent is now ready for DAF treatment.
19
IIIIIIIIIIIIIIIIIIIII
1.3.2 Il)ISSOlLVEil) AlIR lFlLOA'fA 'fION (Il)AlF)
Dissolved air floatation process is a separation technique that employs the production
of micro size (10-100 urn diameter) air bubbles to separate solids from liquids. A
OAF system consist of three main unit processes, which are the pressurization system
in the capsule, the floatation tank and the recycle system (see Figure l.3).
The effluent from the pH correction tank is pumped into a capsule. Air is pumped into
the capsule tank at high pressure (typically 350-450 kPa) resulting in the liquid
becoming supersaturated with air. The supersaturated effluent is released to the
floatation tank at atmospheric pressure. The sudden drop in pressure results in micro
air bubbles being formed in water. The release of air bubbles is designed to take place
in the presence of solids to be floated. The released air bubbles attach themselves to
the oil particles imparting buoyancy, thus causing oil particles to rise to the surface of
the floatation tank. Surface scrapers are used to remove the surface scum that is
formed at the top of the floatation tank. People may mechanically or manually operate
the surface scrapers (Metcalf and Eddy, 1991). Most of the fats (FOG) and inorganic
phosphates are removed at this stage and hence reducing the organic and phosphorus
load of the final effluent steam that is discharged to the sewer system. The pretreated
effluent leaves the DAF system for final settling of the settleable solids in the two
settling tanks. When both tanks are full, the effluent is then discharged to the
20
IIIIIIIIIIIIIIIIIIIII
municipal sewer system for final treatment and disposal back to the water resource
(river).
1.4 THE EFFLUENT PROBLEM AND LEGISLATION
Out of an estimated total of 16 edible oil factories in South Africa, only one factory
was reported to be treating its effluent using only biochemical means. The rest of the
edible oil plants generally use dissolved air floatation (DAF) for physical removal of
oils and grease and pH correction (Steffen et al., 1989). Even after application of
these treatment processes, the remaining emulsified grease tends to clog the sewer
pipes and pumps. The high organic (BOD and COD) and phosphorus loads create
shock-loading problems for the receiving wastewater treatment installations (Eroglu
et al., 1990, Sokolovic et al., 1992).
At present the Department of Water Affairs and Forestry regulates water resources
pollution from point sources through legislation stipulating that the effluents from
industries must comply to uniform discharge standards that are set at technologically
attainable levels. These controls or regulations limit the rate of deterioration of the
receiving water bodies, and are set down in the National Water Act, 1998 (Act 36 of
1998). The National Water Act, 1998 (NW A) repeals the old Water Act, 1956 (Act 54
of 1956), and was motivated by the need for new legislation that would reflect
democratic principles and equitable access to water resources by al symbolised by the
21
IIIIIIIII.IIIIIIIIIIII
slogan "Some for all, Forever" (Department of Water Affairs and Forestry, 1997).
The Act provides for the compulsory purification of effluents by the user to specified
standards and its subsequent disposal in a manner that will make it available for reuse.
The local authorities (the Pietermaritzburg-Msunduzi Transitional Local Council in
this case) and the municipal sewage treatment plants (Darvill Wastewater Works)
have increased pressure on industries to increase the efficiency of in-house effluent
handling and treatment methods. Due to this increased pressure, Sealake Industries is
taking steps towards investigating viable biological treatment processes to be
implemented on-site to supplement the existing physico-chemical effluent treatment
methods.
22
IIIIIIIIIIIIIIIIIIIII
1.5 IPROJECT AllM AND OBJECTllVES
The aim of this study was to design and operate a laboratory scale activated sludge
treatment process that would produce the final effluent having a regulatory acceptable
COD and phosphate loads prior to its discharge to the municipal sewer system. The
study was guided by the following objectives:
1. To characterise the rnam pollution parameters m the edible oil final
effluent
2. To conduct a preliminary effluent treatment investigation
3. To design and operate a laboratory scale effluent treatment process
4. To optimise the system operation for COD and Phosphorus removal.
23
IIIIIIIIIIIIIIIIIIIII
C1HLAJPTJER 2
ILliTJElRA TUIRJE IRJEVliJEW
2.1 THE EUTROPHICATION PROBLEM
Eutrophication is a natural ageing process that occurs regularly in lakes over hundreds
of years and is usually limited to quiescent bodies of water such as lakes and
impoundments (Lilley et al., 1997). The natural eutrophication process results from
continuous enrichment of impoundments with nutrients, notably phosphorus (P) and
nitrogen (N). This natural process is however greatly accelerated by human activities
in the catchment areas of lakes and impoundments, through the increased input of
nutrients (Bolitho, 1976).
Gross eutrophication is marked by massive increase in algal growth in the catchment
area. This condition is met when the inorganic soluble nitrogen (N) and phosphorus
(P) loads to impoundments reaches concentrations in excess of 0.3 mgNIL and 0.05
mgP/I, respectively (Lilley et al., 1997). The algal species that are associated with
eutrophication can be divided into four broad groups, namely, the blue green algae
(Cyanobacteria), the green algae (Chlorophyta), the Diatoms, and the Flagellates.
These organisms may be taken as effective indicators of eutrophication when they
form the majority of species present (Rudd, 1979).
24
IIIIIIIIIIIIIIIIIIIII
The symptoms of eutrophication have vanous effects. Although algae forms an
essential part of the aquatic environment, their excessive growth is detrimental to the
aquatic ecosystem. When the alga blooms die in large numbers and decay, a large
pool of nutrients is released into the water body, which results in accelerated growth
of other organisms. Consequently the oxygen content of the water body is depleted
and the lower water (hypolimnion) becomes anaerobic due to thermal stratification.
As a result eutrophication may constitute a health hazard to vertebrate animals (Dillon
and Molot, 1996).
Studies on causes and control of eutrophication (Chutter, 1990; Dillon and Molot,
1996) have shown that eutrophication can be effectively controlled if the nutrient
loads to the receiving waters is strictly regulated. Because of the ability of some blue-
green algae to fix atmospheric nitrogen gas to support primary production, it is
therefore virtually impossible to control eutrophication by limiting nitrogen.
Therefore in most cases phosphorus has been shown to be the limiting nutrient
(Chutter, 1990; Dillon and Molot, 1996; Orhon and Artan, 1994; Wentzel et al.,
1990).
In South Africa the eutrophication problem is particularly serious due to the long
storage times of dams and reservoirs, with resultant accumulation of phosphate and
nitrate, and the high summer temperatures, which promote algal growth (Bolitho,
1976). Eutrophication is a major threat to South African water resources for various
reasons. These include a rapid increasing population, irregular rainfall often leading to
drought conditions, irrigation demands by agricultural industry, industrial
25

IIIIIIIIIIIIII
IIIIIIII
requirements, and loss of source supply due to degradation of rivers. The prime
example of the eutrophication problem in a South African context is the deterioration
of the Hartbeespoort Dam during the mid 1970' s, such that during 1977 to 1979,
R200 000 was spent by the Department of Water Affairs (DWA), which is responsible
for management and development of the national water resources of South Africa, on
various rehabilitation programs (Rudd, 1979). Joska and Bolton (1994) reported that
South Africa was spending approximately 400 thousand Rands anually for controlling
macro algae, especially in the former Transvaal region. Cladophora glomerata was
reported to the major problematic algal weed in South Africa (Joska and Bolton,
1994)
In 1980, a special standard was promulgated in South Africa limiting the soluble
ortho-phosphate (O-POl) concentration from point source discharge to less than 1
mg/L for certain sensitive catchment areas. A five years grace period was allowed
before enforcement, to allow for phosphorus removal technology to be developed and
implemented. This stimulated considerable research in South Africa towards the
understanding of the mechanisms that are involved in the biological phosphorus
removal process and towards further development and refining the technology for
practical implementation (Wentzel et al., 1990).
26

IIIIIIIIIIIIIIIIIIIII
2.1.1 Source of Nutrients (Phosphorus)
Nutrients that cause rapid eutrophication are introduced to the water environment by
human activity from both diffuse and point sources. In this study more attention was
focused on the nutrient phosphorus (P).
2.1.1.1 Diffuse Sources
Phosphorus is introduced to the environment in relatively small concentrations over
large areas due to run-offs from rural and urban areas. The widespread use of
agricultural fertilizers has a major contribution to this source of P pollution. In most
instances, control and treatment to remove P from this source is not economically
feasible, especially P originating from rural run-offs. For urban run-offs, natural and
artificial reed beds are used as systems for phosphorus removal from contaminated
water. In these systems the soluble P in waste stream is converted to P trapped in the
reeds that grows in the. beds. The entrapped P in reeds is removed when reeds are
harvested. Some soluble P is not removed from the reed beds but remains trapped in
the sediments lying at the bottom of the reed bed. This soluble P accumulates
continually in the sediments (Wentzel et al., 1990; Lilley et al., 1997)
27

IIIIIIIIIIIIIIIIIIII'I
2.1.1.2 Point Sources
This P pollution is mainly due to industrial and domestic effluent discharges. In South
Africa 80% to 90% of nutrients in water originate from point sources. These are
usually, but not always, the main contributors ofP pollution to the environment. This
type of P pollution is easy to control because pollutants from the residential and
industrial areas are concentrated to a point by means of sewers and treatment methods
are readily available (Wentzel, 1992).
The edible oil industry in South Africa is both a major water consumer and polluter
(Steffen et al., 1989). In anticipation of water shortages in South Africa the then
Water Act, (Act 54 of 1956), which was later replaced by the National Water Act,
1998 (Act 36 of 1998), made provision for the compulsory purification of effluents by
industries (including municipal wastewater treatment works) to specified standards
and its subsequent disposal in a manner that would make it available for reuse
(DW AF, 1997). To comply with the effluent discharge standard of 1 mgPIL, the
Darvill Wastewater Works (DWW) is increasing pressure on the industries in the
Pietermaritzburg area to implement cleaner production technologies and some form of
an in-house effluent treatment system prior to discharge to the sewer system. As a
result, the current study was initiated in conjunction with Sea-Lake industries to find a
biological solution to reduce the phosphorus load in the effluent, prior to its discharge
to Darvill Wastewater Treatment Works for final purification.
28
IIIIIIIIIIIIIIIIIIIII
2.2 Treatability of Edible ou Effluent
Food processing effluent including effluent from the edible oil processing industry are
a complex mixture of floating, settleable, suspended and dissolved materials.
Complete treatment of these effluents requires a combination of physical, chemical
and biological treatment processes (DalzeU, 1994). The physical nature of fatty
material is of great concern when considering any purification method. The fatty
contaminants in the edible oil eftluent can be characterized in three ways viz.: by
polarity, biodegradability and physical characteristics. Polar contaminants are usually
derived from animal and vegetable sources such as food industry operations,
including the edible oil processing industry. The non-polar contaminants are derived
from petroleum and mineral sources and are generaUy non-readily biodegradable
(Grant, 1980; McDermott, 1982; Sutton et al., 1994)
It used to be a common practice to group effluents from the edible oil processing
industry, which has polar and readily biodegradable fatty components, with effluents
originating from the petrochemical industry. This was because some pollution control
authorities failed to recognise that there is a difference between fatty effluents from
food industry and those from petrochemical industry (Grant, 1980; Tano-Debrah,
1999). As a result of this joint grouping of petrochemical effluents and the effluents
from the food industry, the vegetable oil processing industry has since been widely
perceived as problematic (Grant, 1980).
29
IIIIIIIIIIIIIIIIIIIII
2.2.1 Physical Treatment
The effluent from edible oil processing industry carries an appreciable quantity of
fatty material (or fats, oils and grease (FOG)). Prior to any form of treatment, it is
desirable to install an oil-water separation system as the first phase. This will reduce
the pollution load being discharged and also yield a recovery of potential usable fat.
The separation of water phase and the oily phase from the edible oil effluent can be
archived using two simple processes, which are gravity settling and dissolved air
floatation (DAF).
2.2.1.1 Gravity Settling or Fat Traps
The removal of separable fatty matter (SFM) or FOG from both domestic and
industrial effluents has for many years been archived through the use of fat traps. The
gravity fat trap is usually installed as standard equipment on all process effluent
steams and is the simplest form of physical treatment (Eroglu et aI., 1990). Fat traps
are designed to produce a slow and gentle uniform flow through a tank, which allows
density difference to bring the fatty material to the surface without disturbing any
accumulated scum and sludge. In the homemade interceptors, fat removal can be done
manually using surface scraping but it is important that a good platform access be
provided to allow easy performance of this task. Removable and adjustable retaining
baffles can also be hung on the walls of the tank. The purpose-built units, as oppose to
the homemade built tanks, normally include a moving scraper and an endless chain
with a trigger to activate a scum removal valve (Dalzell, 1994; Grant, 1980).
30
IIIIIIIIIIIIIIIIIIIII
Traditionally, settlement tanks have been built of reinforced concrete. The edible oil
effluent contains high sulfate concentrations, which makes it highly aggressive to
concrete even after neutralization. As a result gravity fat traps for the edible oil
effluent has to be constructed with a material that is resistant to the high sulfate
content (Eroglu et al., 1990). Fat traps are designed according to general settlement
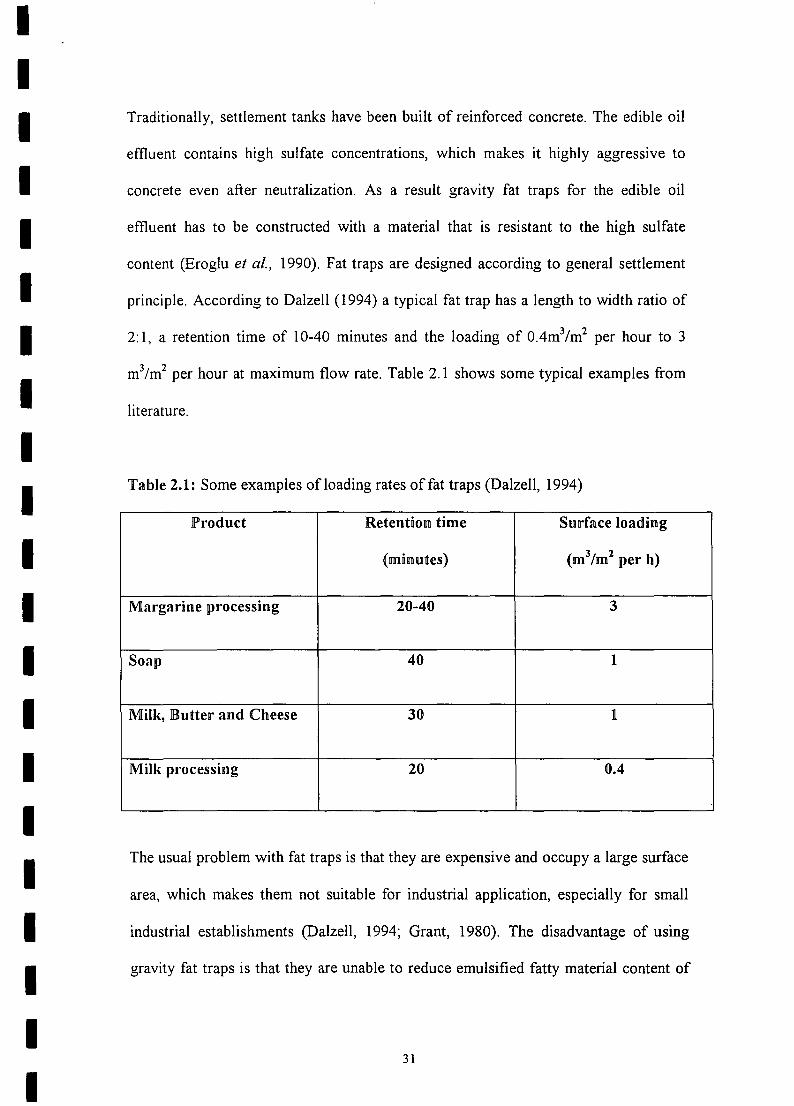
principle. According to Dalzell (1994) a typical fat trap has a length to width ratio of
2: 1, a retention time of 10-40 minutes and the loading of 0.4m3/m2 per hour to 3
m3/m2 per hour at maximum flow rate. Table 2.1 shows some typical examples from
literature.
'fable 2.1: Some examples ofloading rates of fat traps (Dalzell, 1994)
Product Retention time Surface loading
(minutes) (m3/m2 per h)
Margarine processing 20-40 3
Soap 40 1
Milk, Butter and Cheese 30 1
Milk processing 20 0.4
The usual problem with fat traps is that they are expensive and occupy a large surface
area, which makes them not suitable for industrial application, especially for small
industrial establishments (Dalzell, 1994; Grant, 1980). The disadvantage of using
gravity fat traps is that they are unable to reduce emulsified fatty material content of
31

IIIIIIIIIIIIIIIIIIIII
wastewater under 500mg/L, which is high to discharge to municipal sewer system
(Eroglu et al., 1990).
2.2.1.2 Dissolve Ail!"Floatation (DAlF)
The common problem with fat containing effluents is precipitation and emulsification
due to pH, temperature, pumping and detergents. Under such circumstances, gravity
separation with a simple fat trap rarely gives satisfactory results, as has been
mentioned before. The alternative to circumvent this problem is to use assisted
floatation, in this case, dissolved air floatation (DAF). DAF relies on the introduction
of supersaturated water into the effluent. Micron size (10-100 um) air bubbles are
produced from the release of gas (air) at atmospheric pressure from liquid that has
been supper saturated with air under pressure in a saturation vessel. (Lilley et al.,
1997; Oztark et aI., 1990)
The release of air bubbles is designed to take place in the presence of solids to be
floated fore example emulsified fat droplets. There is a hydrophobic mutual attraction
between the bubbles and the suspended oil particles that leads to the floatation of
solids through imparted buoyancy. This causes the sludge particles to rise to the
surface from where they can be removed by surface scrapers. The compaction of layer
upon layer of rising sludge forces the float above water surface (Dalzell, 1994; Lilley
et aI., 1997; Ozturk et al., 1990).
32
IIIIIIIIIIIIIIIIIIIII
The main advantage of using dissolved air floatation is its speed. Floatation rates are
usually two to three times those of gravity fat traps and the tank sizes are much
smaller, thus making it ideal for industrial application where space is of vital
importance. DAF also has the advantage of avoiding potential anaerobic conditions
that are common with gravity fat traps, which reduces the odor nuisance. The
efficiency of process like gravity separation is dependent on particle size, but is also
affected by bubble attachment and the efficiency of gas transfer (Dalzell 1994).
Dissolved air floatation is more difficult to operate when compared to the gravity fat
trap and therefore more skilled labour is required (Lilley et al., 1997). The other
disadvantage ofDAF is that it has higher operating cost than that of a simple gravity
fat trap and the relatively complex technology is not well suited to effluent with
variable characteristics (Dalzell, 1994). Several studies (Grant, 1980; Eroglu et aI.,
1990; Tunay et aI., 1998) have shown that a well-operated DAF system has a better
performance than the gravity fat trap. Eroglu et al., (1990) using a full scale DAF unit
at 6.6 hours hydraulic retention time (RR T), reported a fatty material removal of more
then 80% and FM recovery of 65kg/d, which is a valuable by-product that can be used
for soap production.
2.2.2 Chemical Treatment
Chemical treatment can improve the performance of most of the physical and
biological processes used in the effluent treatment. This involves subjecting industrial
wastewater to strong reducing or oxidizing agents. The most commonly used
33
IIIIIIIIIIIIIIIIIIIII
chemical methods for effluent treatment are pH correction and coagulation to improve
settlement rates by increasing particle size density (Dalzell 1994; Lilley et al., 1997;
Eroglu et al., 1990).
In South Africa, all but one edible oil manufacturers use chemical treatment as the
sole effluent treatment method to reduce pollution load prior to discharge to the
municipal sewer system or the river body (Steffen et al., 1989). Chemical treatment is
used mainly for carbonaceous material and phosphorus removal from wastewater.
Lime is the most widely used chemical coagulant for both COD and phosphorus
reduction (Lilley et al., 1997). Chemical phosphorus removal through phosphate
precipitation can also be achieved using iron (Fe3+) and aluminum (Ae+) salts such as
ferrous sulphate; ferric sulphate; ferric chloride; aluminum chloride; and aluminum
sulphate (Dalzell, 1994; Loots et aI., 1994; Wentzel et al., 1990; Lilley et al., 1997;
Grant, 1980).
At Sealake industries, lime and ferric chlorides are added to the neutralized effluent
up-stream of the DAP unit. Eroglu et al., (1990) reported that ferric chloride was the
most effective coagulant during physicochemical treatability studies, and that it
resulted in a BODs reduction of 36%. Dart (1974) (as cited from Ozturk et al., 1990)
reported a 60% BOD and 88% fats oils and grease (FOG) removal through lime
addition of 1500 mg/L, after pH adjustment to pH 10 by addition of sodium
hydroxide, for a water containing 1040 mgIL BODs and 800 mgIL FOG respectively.
But the study did not include chemical phosphorus removal.
34
IIIIIIIIIIIIIIIIIIIII
2.2.2.1 Advantages of Chemical Treatment
Chemical phosphorus removal in wastewater is reliable, and with proper control and
dosages, a consistently low effluent phosphorus concentration can be archived (Lilley
et al., 1997). Chemically bound phosphorus is not easily dissociated in water, which
prevents the release of the bound phosphorus back into the water body (Loots et ai.,
1994). When alum is used as a coagulant, it is possible to recover both aluminum and
fatty material from fat/alum flocks through acid splitting (Pope et ai., 1975 as cited
from Grant, 1980).
2.2.2.2 Disadvantages of Chemical Treatment
The chemicals that are used during chemical treatment are corrosive in nature (strong
oxidizing agents) and hence great care is required when handling them, which
necessitate the use of more expensive equipment that is resistant to corrosion (Lilley
et al., 1997). Chemical treatment of effluent is expensive due to high chemical costs.
According to Pitman (1988), estimated costs to the Johannesburg City Council at
1988 levels would be in the region of 10 million rands per annum, were they to persist
in using chemical treatment alone. The other problem associated with chemical usage
is increased mineralization of water through the release of ions. Chemical coagulants
usually contain chlorides or sulphates, which remain in solution thus increasing the
conductivity or the salinity of the receiving water body. This is of particular
importance in South Africa where water is reused several times before entering the
oceans (Wentzel et al., 1990). Paul, 1999 (personal communication) expressed a
35
IIIIIIIIIIIIIIIIIIIII
concern that there was increase pressure on Sealake Industries by the
Pietermaritzburg-Msunduzi Transitional local council to reduce the effluent
conductivity levels.
2.2.3 Biological Treatment
Biological treatment technology offers an efficient and a cost-effective means for
treating edible oil industrial wastewater. Biological treatment of edible oil effluent
may be carried out under either aerobic or anaerobic conditions, or a combination of
both (Hui, 1996; Eroglu et al., 1990; Grant, 1980; Seng, 1980).
2.2.3.1 Anaerobic Treatment Process
Anaerobic digestion has long been practiced as a stabilization process for waste
sewage treatment sludges, but the process has not been widely adopted for effluent
treatment, with only very high strength industrial effluent being seriously considered
(Grant, 1980). The effluent from the vegetable oil refining industry is loaded with
sulphates, fats and organic matter, which makes anaerobic treatment an attractive
alternative prior to any aerobic treatment process (Lens et al., 1995; Ozturk et al.,
1990; Eroglu et al., 1990). Studies by Eroglu et al., (1990) have shown that lime
addition and activated sludge treatment does not bring about appreciable decrease in
the sulphate concentration from acidic effluent.
36
IIIIIIIIIIIIIIIIIIIII
In the anaerobic digestion of high strength industrial waste containing high level of
sulphate, the two process of concern are sulphate reduction and methane production,
the latter being inhibited by the former (Eroglu et al., 1990). In their study, Eroglu et
al., 1990) reported a 60 % sulphate reduction in the anaerobic filter reactor with a
concurrent reduction of 60 % for COD. From this study the conclusion was that
anaerobic treatment of acidic effluent from the edible oil refining industry may be
used to replace chemical treatment as a pretreatment step.
2.2.3.2 The Activated Sludge Treatment Process
The activated sludge treatment is generally considered to have its ongin in the
aeration experiments which were carried out by Ardern and Lockett at Manchester in
1914 (Droste, 1997). The activated sludge treatment process is a suspended growth
system which could be defined as a suspension of microorganisms, both dead and
living, in wastewater (Aitken et al., 1994).
37
IIIIIIIIIIIIIIIIIIIII
WASTE SLUDGE
INFLUENT
SECONDARYSETTL][NG
TANK
AEROBICREACTOlR
EFFLUENT
SLUDGE RECYCLE
WASTE SLUDGE
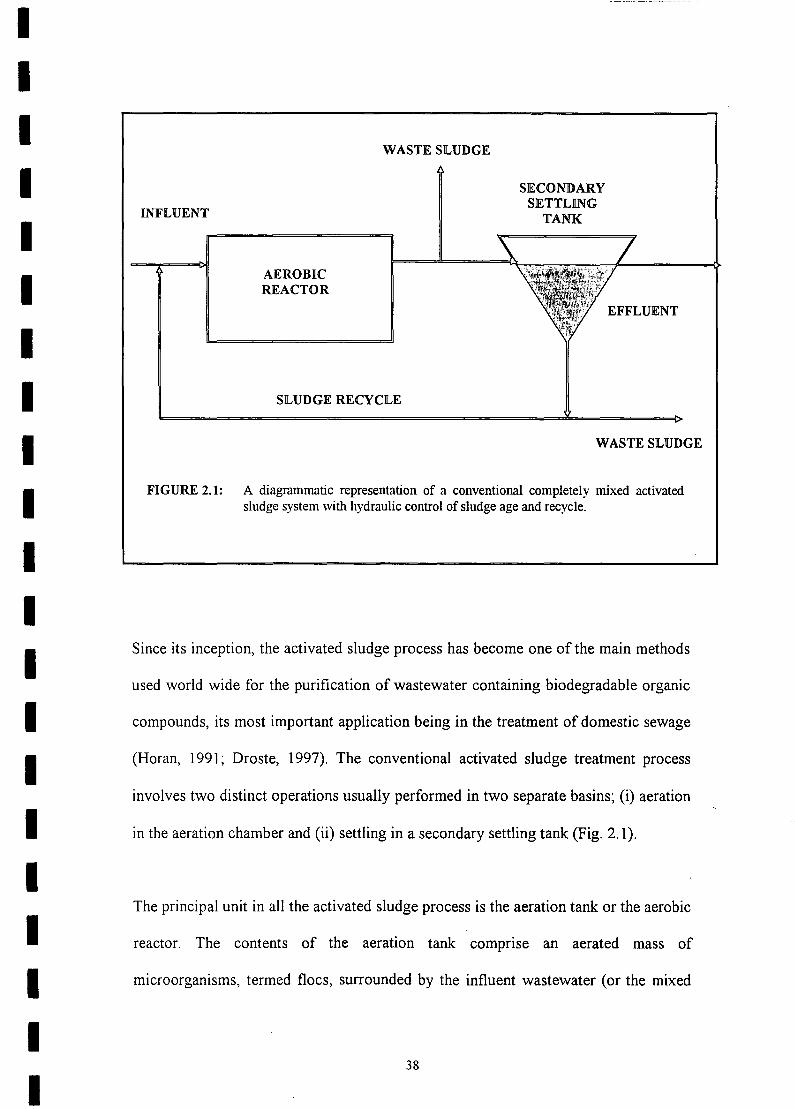
FIGURE 2.1: A diagrammatic representation of a conventional completely mixed activatedsludge system with hydraulic control of sludge age and recycle.
Since its inception, the activated sludge process has become one of the main methods
used world wide for the purification of wastewater containing biodegradable organic
compounds, its most important application being in the treatment of domestic sewage
(Horan, 1991; Droste, 1997). The conventional activated sludge treatment process
involves two distinct operations usually performed in two separate basins; (i) aeration
in the aeration chamber and (ii) settling in a secondary settling tank (Fig. 2.1).
The principal unit in all the activated sludge process is the aeration tank or the aerobic
reactor. The contents of the aeration tank comprise an aerated mass of
microorganisms, termed floes, surrounded by the influent wastewater (or the mixed
38
IIIIIIIIIIIIIIIIIIIII
liquor). The activated sludge floes are made up of aggregate of microorganisms,
inorganic and organic colloidal material and larger particulate matter, all held together
in a compact organic matrix. A large number of protozoa, free-swimming ciliates and
flagellates are found both in the mixed liquor and in the floc matrix (Horan, 1991).
The floes are mixed with incoming sewage in the presence of oxygen, which is
supplied through aeration. In the aeration basin, some of the substrate is completely
oxidized into harmless end products of CO2, H20, and other inorganic substances that
are required to proved energy for the growth of microorganisms (Horan, 1991; Bitton,
1994; Droste, 1997).
The second operation in the activated sludge treatment process is the separation of the
biomass and other suspended solids from the treated wastewater. This is accomplished
in a secondary settling tank. Under the quiescent conditions of the secondary settling
tank the activated sludge floes settle rapidly to yield the sludge with high solids
concentration. The settled sludge is pumped back to the aeration tank via a recycle
steam while some portion of it is removed from the system through wastage on
continuous or intermittent basis. Consistent wastage of sludge ensures that the
concentration of biomass in the aeration chamber remains constant within the desired
range (Droste, 1997; Horan, 1991). The clarified effluent at this stage is relatively
devoid of any suspended particles and may be discharged into a watercourse after
tertiary treatment, which may include chlorination or irradiation.
Proper operation of a conventional activated sludge process depends on the
manipulation of the three basic design parameters, which are: organic loading rate
39

IIIIIIIIIIIIIIIIIIIII
(Bx) (or the sludge age, (8s) as an alternative); the operating value of MLVSS; and
dissolved oxygen (DO) concentration in the mixed liquor (Horan, 1991). The organic
loading rate is frequently used in place of sludge age as a key design parameter, since
its use allows the determination of the required biomass without the need to make
reference to the process kinetic coefficients.
The choice of limiting values that may be assigned to the main design parameter to
archive a particular level of performance in the purification of a particular wastewater
is most reliably made through pilot plant operation. The quality of the treated effiuent
is always a key consideration in the design and operation of any activated sludge
process although other operational factors or parameters also influence the choice of
sludge age and organic loading rate. The more important factors are the desired
degree of stabilization of the sludge biomass and the need to produce a sludge
biomass with good settling properties (Horan, 1991)
2.3 lIUOLOGICAL NUTRIENT REMOVAL TREATMENT ]PROCESS
Biological nutrient removal refers to the removal of the primary nutrients (carbon,
nitrogen and phosphorus) from wastewater which cause eutrophication (Wentzel and
Ekama, 1997; Lilley et al., 1997). The activated sludge process configuration is
manipulated to create environmental conditions in the modified system favorable for
the optimal growth and activity of the microorganisms responsible for removal of
nutrients from wastewater (Wentzel and Ekama, 1997), in order to achieve maximum
efficiency. These modifications may include the addition of anoxic (no oxygen, but
40
IIIIIIIIIIIIIIIIIIIII
nitrate and nitrite present as electron acceptors) and anaerobic (no oxygen and no
nitrate or nitrite present) zones in the system.
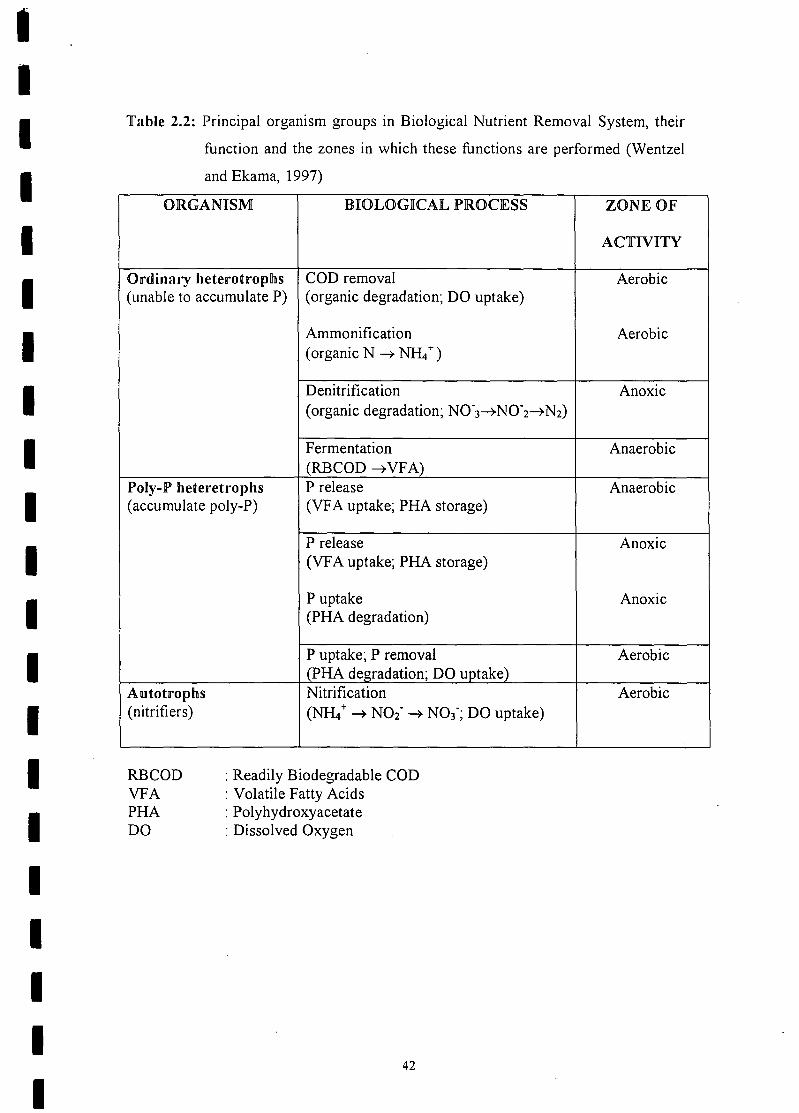
Biological nutrient removal is mediated by highly diverse mixed cultures that develop
in the modified activated sludge process. These mixed cultures work in sequence to
remove different nutrient components at different stages of the process (Wentzel and
Ekama, 1997). Table 2.2 summarises the activities that take place in different zones or
stages in a biological nutrient removal process.
41
II
II
Table 2.2: Principal organism groups in Biological Nutrient Removal System, their
function and the zones in which these functions are performed (Wentzel
and Ekama, 1997)
I
II
ORGANISM BIOLOGICAL PROCESS ZONE OF
ACTIVITY
Ordinary heterotrophs COD removal Aerobic(unable to accumulate P) (organic degradation; DO uptake)
Ammonification Aerobic(organic N ~ NR..,.)
Denitrification Anoxic(organic degradation; NO-3~NO-2~N2)
Fermentation Anaerobic(RBCOD ~ VF A)
Poly-P heteretrophs P release Anaerobic(accumulate poly-P) (VFA uptake; PHA storage)
P release Anoxic(VFA uptake; PHA storage)
P uptake Anoxic(PHA degradation)
P uptake; P removal Aerobic.(PHA degradation; DO uptake)
Autotrophs Nitrification Aerobic(nitrifiers) (NR.+ ~ N02- ~ N03-; DO uptake)
IIIIIII
II
RBCODVFAPHADO
: Readily Biodegradable COD: Volatile Fatty Acids: Polyhydroxyacetate: Dissolved Oxygen
IIIII
42

IIIIIIIIIIIIIIIIIIIII
2.3.1 Carbonaceous Energy (CO][) Removal
Carbon in wastewater streams occurs in organic and inorganic forms. Heterotrophic
organisms use organic compound for their metabolism while the inorganic
compounds are metabolized by a group of organisms collectively termed autotrophs.
Both forms of carbon are removed from wastewater through a series of oxidation and
reduction (redox) reactions, oxidizing the carbon source to carbon dioxide CO2 and
water (H20). The carbon dioxide then escapes to the atmosphere, thus removing
carbon from wastewater (Ubisi et al.,1997; Orhon and Artan, 1994).
In the bioreactor of the non-nitrifiying aerobic activated sludge systems the mixed
liquor organic suspended solids or biomass is made up of three components viz:
heterotrophic active biomass; endogenous residue; and inert material. In the nitrifying
aerobic and anoxic/aerobic activated sludge systems, a fourth mixed liquor organic
suspended solids component is included, which is the autotrophic active biomass.
During the biodegradation processes of COD removal and denitrification in the mixed
liquor component of the activated sludge, more heterotrophic organisms are produced
through the synthesis of living heterotrophic organisms on biodegradable organic
substrate (Ubisi et al., 1997).
The inert material or the unbiodegradable particulate orgamcs from the influent
wastewater, on entering to the bioreactor, are enmeshed in the mixed liquor organic
suspended solids, which are then removed from the system together with
heterotrophic biomass through sludge wastage from the aerobic reactor or from the
43

IIIIIIIIIIIIIIIIIIIII
return activated sludge underflow (Dold et al., 1991; Ubisi et al., 1997; Wentzel et al.,
1995).
The energy content of wastewater can be expressed USing common substrate
parameters, which are 5-day biological oxygen demand (BODs) and/or chemical
oxygen demand (COD) (Orhon et al., 1998; Lilley et al., 1997). The COD test is the
most popular monitoring method used at treatment works since it is quicker and gives
a more accurate reflection of the energy content of the system then the BODs test
(Ekama et al., 1984; Lilley et al., 1997). Because COD is a chemical test, biologically
undegradable fractions of the wastewater are included in the measurement, while the
(BODs) measures only the fraction which is biodegradable.
In a biological nutrient removal process, the carbonaceous material or the COD
content of system is divided into three main fractions viz: the unbiodegradable;
biodegradable; and heterotrophic active biomass (Wentzel et al., 1995; Orhon et al.,
1998; Dold et al., 1991). The unbiodegradable COD(Su) has two subfractions (Fig.
2.2), the unbiodegradable particulate (Sup) and the unbiodegradable soluble (Sus). The
biodegradable COD also has two subfractions, the slowly biodegradable (SBCOD) or
(Sbs), and the readily biodegradable RBCOD or (Sbs) fractions. Both the RBCOD and
SBCOD fractions are based wholly on the dynamic response observed in an activated
sludge system (Dold et al., 1980, as cited from Wentzel et al., 1995).
44

IIIIIIIIIIIIIIIIIIIII
Total COD(SI)
I IBiodegradable Unbiodegradable COD Active mass
COD (Su) COD(Sb)
II I I I
Soluble readily Particulate slowly Unbiodegradable Unbiodegradablebiodegradable biodegradable soluble particulate
(Sbs) (Sbp) (Sus) (Sup)
Figure 2.2: Division of influent COD into its constituent fractions (Dold et al., 1991as cited from Wentzel et al., 1995)
45
IIIIIIIIIIIIIIIIIIIII
2.3.2 Nitrogen Removal Process
Nitrogen in wastewater may be divided into two mam fractions: free & saline
ammonia and organically bound nitrogen (Ekama et al., 1984; Wanner, 1997). Like
the COD fractions, the organically bound nitrogen may be subdivided further into
non-biodegradable and biodegradable fractions, with both these fractions having
soluble and particulate sub-fractions (Lilley et ai"1997). Generally domestic
wastewater does not contain any nitrate (N03') or nitrite (N02,) in the influent, but
some industrial wastewater does contain appreciable quantities of nitrates and/or
nitrite, depending on the characteristic and nature of that particular effluent. Thus for
industrial wastewater it is important that, in addition to the Total Kjeldal Nitrogen
(TKN) test and free/saline ammonia test, the nitrate and nitrite test be conducted to
determine the quantity of each nitrogen fractions in the influent stream.
The first step in the nitrogen removal process is the nitrification stage. In this process,
free and saline ammonia, which results from the hydrolysis of organic nitrogen, is
oxidized first to nitrite (N02-) and thereafter to nitrate (N03-). The oxidation process
takes place in the presence of oxygen in an aeration reactor. The autotrophic bacteria
are responsible for the oxidation process (Ubisi et al. 1997). These organisms have
quite different behavioral characteristics when compared to the ordinary heterotrophs
(Lilley et al., 1997). There are two important autotrophs that are responsible for
nitrogen oxidation, which are: Nitrosomonas spp. which converts the free and saline
ammonia to nitrite (N02-); and the Nitrobacter spp. which converts nitrites to nitrates
(N03 -) (Ekama et aI., 1984; Lilley et al. 1997).
46

IIIIIIIIIIIIIIIIIIIII
2.3.2.1 The Anoxic ZOll1e
The anoxic zone is a zone or the bioreactor of the activated sludge process that is
virtually free of oxygen but which contains nitrates and nitrites or has a substantial
input of nitrates. The anoxic zone constitutes the second step in biological nutrient
removal. Nitrified mixed liquor (rich in NOx) is recycled from the aerobic reactor to
the anoxic reactor through the A-recycle. The A-recycle is a return flow line between
the aerobic and the anoxic reactor, which is responsible for returning oxidized mixed
liquor from the aerobic reactor to the anoxic reactor for denitrification (see Fig. 2.3).
In the anoxic zone, the absence of oxygen allows the none-poly-P organisms or the
ordinary heterotrophs to use the nitrates as a terminal electron acceptor during
respiration, thus reducing it to nitrogen gas in a process called denitrification (Ekama
and Wentzel, 1999; Wentzel et al., 1992, Pitman 1988; Pitman et al., 1991). The
elemental nitrogen thus formed escapes to the atmosphere, thus completing the
nitrogen removal process. The detailed mechanism of the biological nitrogen removal
is beyond the scope of this project and will not be discussed further.
2.3.3 Biological Phosphorus Removal
Biological phosphorus removal is a well-documented phenomenon that is applied to
reduce phosphorus in wastewater. Soluble ortho-phosphate in wastewater is converted
into stored phosphorus (trapped) in the biological sludge mass of the activated sludge
system. The stored phosphorus (P) is then removed from the system with the sludge
47

IIIIIIIIIIIIIIIIIIIII
that is wasted daily (Wentzel et al., 1990; Ekama et al., 1984; Bdrjanovic et al.,
1997).
Biological excess phosphorus removal (BEPR) process refers to the biological uptake
and subsequent removal of phosphorus (P) by the activated sludge in excess of the
amount that is removed by "normal" completely aerobic (or conventional) activated
sludge system. This process is as the result of cooperation of different groups of
bacteria, primarily fermentation bacteria, phosphorus accumulating bacteria (poly-P
bacteria), other heterotrophs and autotrophs in the same systems (Danesh and
Oleszkiewcz, 1997).
Traditionally, bacteria of the genus Acinetobacter spp. were considered to be mostly
responsible for the excess phosphorus removal process (Fuhs and Chen, 1975;
Buchan, 1980; Buchan 1983). Other studies (Lotter and Murphy, 1985; Sidat et al.,
1999; Atkinson, 1999) have shown that in addition to Acinetobacter spp., other
bacterial species including Gram-positives such as Pseudomonas spp., have the
propensity to accumulate phosphorus in excess of their metabolic needs.
To stimulate the growth and dominance of the poly-P orgamsms in an activated
sludge system to achieve excess biological phosphorus removal, two conditions are
required:
(a) An anaerobic-aerobic sequence of reactors
(b) Presence of volatile fatty acids (VF A) or short chain fatty acids
(SCF A) (e.g. acetic acid) in the anaerobic reactor (Comeau et al.,
48

IIIIIIIIIIIIIIIIIIIII
1986; Wentzel et al., 1986; 1991; Bdrjanovic et al., 1997; Lilley et al.,
1997).
Successful design and operation of an activated sludge plant for bio-P removal entails
creating conditions in the plant which favor propagation and proliferation of these
organisms over the organisms which do not have this propensity (Lilley et al., 1997).
For brevity these organisms will be referred to here as poly-P organisms as opposed to
non-poly-p organisms, which are unable to accumulate phosphorus beyond their
metabolic requirement.
A number of mainstream processes have been developed for both nitrogen and
phosphorus removal. These processes have evolved from the activated sludge process
through the incorporation of the unaerated sludge mass fraction (anaerobic and/or
anoxic zones) at the upstream end of the aerobic zone.
In South Africa, the 5 stage Bardenpho process, 3 stage Phoredox process, the
Johannesburg process, VCT process, and the Modified VCT processes are the
wastewater treatment process that are commonly used for domestic wastewater
treatment (Fig. 2.3) (Lilley et al., 1997). Table 2.3 summarises the advantages and
disad vantages of using each process for wastewater purification purposes. The general
mechanism of biological excess phosphorus removal process is discussed in detail in
the following section.
49
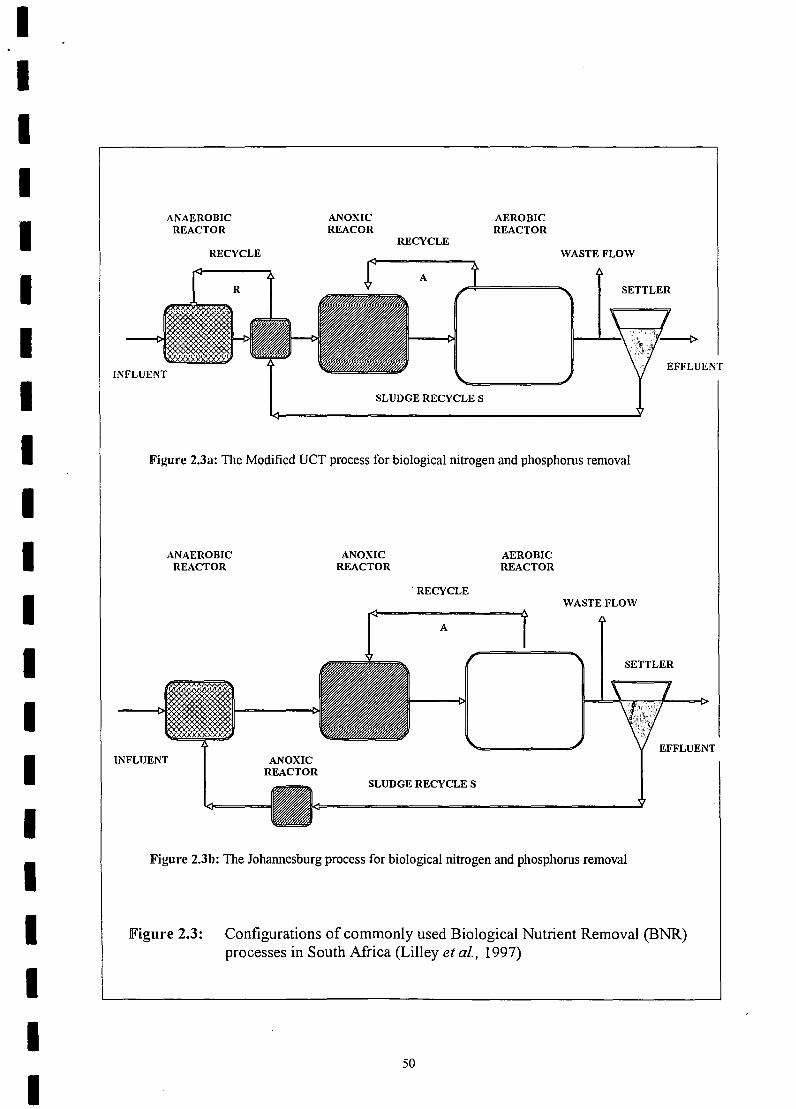
III
IIIIIIIIIIIIIIIII
ANOXICREACOR
ANAEROBICREACTOR
AEROBICREACTOR
RECYCLERECYCLE
A
SLUDGE RECYCLE S
WASTE FLOW
SETTLER
Figure 2.3a: The Modified VeT process for biological nitrogen and phosphorus removal
ANOXICREACTOR
ANAEROBICREACTOR
AEROBICREACTOR
'RECYCLE
A
INFLUENT ANOXICREACTOR
SLUDGE RECYCLE S
WASTE FLOW
SETTLER
EFFLUENT
Figure 2.3b: The Johannesburg process for biological nitrogen and phosphorus removal
Figure 2.3: Configurations of commonly used Biological Nutrient Removal (BNR)processes in South Africa (Lilley et al., 1997)
50
EFFLUENT

IIIIIIIIIIIIIIIIIIIII
ANAEROBICREACTOR
AEROBICREACTOR
SECONDARYANOXIC
REACTOR WASTE FLOW
PRIMARYANOXIC
REACTOR
MIXED LIQUOR RECYCLE
SETTLERINFLUENT
EFFLUENT
SLUDGE RECYCLE S
REAERATIONREACTOR
Figure 2.3c: The Phoredox process for biological nitrogen and phosphorus removal
ANOXIC REACTORAEROBICREACTR
WASTE FLOWANAEROBIC
REACOR RECYCLE
A SETTLER
INFLUENT
EFFLUENTSLUDGE RECYCLE S
Figure 2.3d: The 3 stage Phoredox process for biological nitrogen and phosphorus removal
ANAEROBICREACTOR
ANOXICREACTOR
AEROBICREACTOR
RECYCLE WASTE FLOW
A
SETTLER
TNFT ,1lENT
SLUDGE RECYCLE S
Figure 2.3c: The UCT process for biological nitrogen and phosphorus removal
51

IIII'IIIIIIIIIIIIIIIII
Table 2.3: Advantages and disadvantages of each of the BNR processes commonly
used in South Africa (Lilley et al... 1997)
ADVANTAGES DiSADVANTAGES
The R-recycle should be very low in The A-recycle rate must be
nitrate and oxygen and thus near carefully controlled so as not
optimal use of the anaerobic reactor is to overload the anoxic zone
achieved. with nitrate which will be
returned to the anaerobic
Because the sludge concentration in zone.
the anaerobic reactor is low for the
same unaerated volume the overall The introduction of a third
unaerated sludge mass fraction is less reclycle complicates the
than the Phoredox and Johannesburg operation of the plant.
processes, and is thus less likely to
develop a bulking sludge or lose Complete denitrification IS
nitrification in winter. not possible.
The same as for UCT system except The same as for the UCT
that the first anOXIC zone is process except by utilising
exclusively for denitrifying the S- the first anOXIC zone for
recycle. denitrifying the S-recycle the
overall plant ability to reduce
Careful control of the A-recycle IS nitrate is further reduced.
less critical.
PROCESS
Phoredox Optimal nitrogen removal due to
maximum use of the anoxic volume.
VCT
Modified vcr
52
The S-recycle discharges
directly into the anaerobic
zone and thus any nitrate in
the effluent will decrease the
effectiveness of the anaerobic
zone.

IIIIIIIIIIIIIIIIIIIII
Johannesburg The anoxic zone between the settler The anoxic volume available
and the anaerobic zone is exclusively for denitrification of the A-
for denitrifying the S-recycle. This recycle is reduced due to the
results m the return flow to the exclusivity of the underflow
anaerobic zone being very low m anOXICzone.
oxygen and nitrogen and near optimal
use of the anaerobic reactor IS
achieved.
The volume of the underflow anoxic
reactor is small.
53
As the S-recycle has a higher
solids concentration that the
reactor, the overall unaerated
mass fraction is increased for
the same overall volume.
This could increase the
propensity for developing a
bulking sludge and also
mcrease the chances of
nitrification loss in winter.
The denitrification rate of the
underflow in the anOXIC
reactor is low due to the lack
of readily available carbon.

IIIIIIIIIIIIIIIIIIIII
2.3.4 Mechanisms of Biological excess P removal
All the bio-P removal processes are based on the circulation of the activated sludge
biomass through a sequence of anaerobic and aerobic conditions or reactors (Kuba et
al., 1993). The exposure of the activated sludge to the alternating conditions stresses
the poly-P organisms such that their release and uptake of phosphorus is above the
normal levels required for metabolism. The phosphorus present in wastewater is not
only used for cell maintenance, synthesis, and energy transport, but is also store for
subsequent use by the poly-P organisms (Metcalf and Eddy, 1991).
2.3.4.1 The Anaerobic Zone
The anaerobic zone (or reactor) is that zone in the non-conventional activated sludge
process, which is deficient of nitrates, nitrites (NOx) and dissolved oxygen (DO)
(Ekama et al., 1994). The anaerobic reactor of the BEPR system serves two primary
functions, that is:
(i) To stimulate the conversion or readily biodegradable COD (RBCOD)
into volatile fatty acids (VF A) through fermentation by the non poly-P
(heterotrophs) organisms.
(ii) Enables the poly-P organisms to take up and store VFAs as
polyhydrxyalkanoate (PHA), a process termed sequestration.
The prerequisite for the BEPR process to take place is the presence or the introduction
ofVF As in the anaerobic reactor, up stream of the aerobic zone (Wentzel et al., 1988).
54
IIIIIIIIIIIIIIIIIIIII
In the normal municipal wastewater or sewage from South Africa, very few or no
VFAs are present, yet substantial biological phosphorus removal is achieved with this
influent (Wentzel et aI., 1990). Upon entering the anaerobic reactor, the RBCOD
fraction of the total influent COD is rapidly absorbed by the non-poly-P bacteria.
Because of the absence of the terminal electron acceptors (02 and NOx) in the
anaerobic zone, none poly-P organisms are unable to metabolize the absorbed
RBCOD to energy and for new cell synthesis. The RBCOD is then converted to VFAs
through a fermentation process, which provides the non-poly-P organisms with
enough energy to stay alive (Wentzel et al., 1990).
The released VF As (or the fermentation product) are then taken up by the poly-P
organisms and stored internally through the linkage of VF A into long chain carbon
molecules (polymer) called polyhydroxyalkanoate (pHA), specifically, the
polyhydroxybutyrate (PHB). Once store internally, this substrate is no longer
available to other heterotrophic organisms, but is reserved by the poly-P organisms
for their exclusive use in the subsequent aerobic reactor.
The energy for substrate transfer and storage is derived from the hydrolysis of the
energy rich polyphosphate (poly-P) bonds within the poly-P bacteria (stored-P). The
hydrolysis of the polyphosphate molecules leads to the release of phosphorus into the
environment (anaerobic zone). This phenomenon is known as P-release. The uptake
and storage of VF As with the subsequent P-release by the poly-P bacteria is called
sequestration. The phosphorus release associated with the transfer and storage of
'55
IIIIIIIIIIIIIIIIIIIII
VFAs is referred to as primary release, where as P-release that is not associated with
VFA uptake is called the secondary release (Danesh and Oleszkiewicz, 1997).
According to Wentzel et al., (1990), 1 mole of P is released per mole of VF A
sequestrated, that is, 0.5 mg P is released per mg VFA (as COD) sequestrated. Thus in
the anaerobic reactor, ordinary heterotrophic bacteria convert the RBCOD to VFAs,
which are then taken up by the poly-P bacteria to be stored in the form of PHB
(Wentzel et aI., 1990; Ekama and Wentzel, 1999, Banister and Pretorius, 1998).
2.3.4.2 The Aerobic Zone (Reactor)
In the subsequent aerobic reactor down stream of the anaerobic zone, the poly-P
organisms are unable to compete with non poly-P organisms for substrate (food
source) such as glucose or other saccharides. The inability of the non-poly-P
organisms to compete for food source in the aerobic zone/reactor is due to the
presence of the terminal electron acceptor (02) (Lilley et aI., 1997). The poly-P
organisms then use the stored PHB as a carbon and energy source for cell function
and for the generation of new cells. The stored PHB is also utilized by the poly-P
organisms as an energy source for taking up phosphate (P) from the bulk of the
solution. The uptake of phosphate helps to remanufacture the polyphosphate that was
broken down in the anaerobic zone and to make polyphosphate in the new cells that
are generated. This gives rise to the phenomenon known as excess P uptake, which
occurs in the aerobic environment.
56

IIIIIIIIIIIIIIIIIIIII
The uptake of P to manufacture cellular polyphosphate in the new cells generated
results in P being taken up in the aerobic reactor in excess of the P that was released
in the anaerobic reactor, thus resulting in the net P removal from the liquid phase to
the activated sludge biomass (Wentzel et aI., 1988; 1990; Ekama and Wentzel, 1999;
Mino et aI., 1998). Thus in the aerobic reactor, the PHB is metabolised by the poly-P
organisms and more P is taken up than required for the normal metabolic purposes
(net P removal).
The excessive uptake and storage of P by the poly-P bacteria at this stage does no
amount to P removal from the system, but a mere displacement of phosphorus (P)
from wastewater to the biomass. Phosphorus is finally removed from the system
through daily sludge wasting from the aerobic reactor or from the return sludge line
(Wentzel et aI., 1990). Wentzel et al., (1990) reported that at steady state, the biomass
ofpoly-P wasted per day equals the mass of new poly-P organisms generated per day.
Thus the mass of poly-P organisms in the biological system remains constant, which
implies that in the activated sludge process at steady state there is neither a build up
nor a loss ofpoly-P organisms (Wentzel et aI., 1990).
There are two factors of utmost importance in the design and operation of EBPR
system which are based on the discussed mechanism viz:
1. RBCOD, that is, the magnitude of phosphorus removal that can be
achieved is directly related to the amount of RBCOD present in the
influent.
2. Recycling of oxygen and NO" to the anaerobic zone.
57
IIIIIIIIIIIIIIIIIIIII
The introduction of oxygen and/or nitrates/nitrites to the anaerobic reactor through the
sludge recycle (S-recycle) should be avoided since the non-poly-P organisms tend to
rapidly metabolise the RBCOD 'in the presence of the terminal electron acceptor such
as oxygen, For every 1 mg 02 recycled to the anaerobic reactor, 3 mg COD as
RBCOD are consumed. The same applies for nitrogen, for every 1mg N as N03_
recycled, 8.6 mg COD as RBCOD is consumed by the non-poly-P organisms for
energy generation and new cell synthesis. This results in the RBCOD that is
consumed by heterotrophs being unavailable for conversion to VFAs during the
fermentation process. Hence the amount of VFAs generated and released to the
solution will be reduced by the same amount of RBCOD that was consumed by the
heterotrophic bacteria (Wentzel et al., 1990).
58

IIIIIIIIIIIIIIIIIIIII
CHAPTER 3
WAS'fJEWA'fJElR ClHIAlRAC'fJElRK§A'fKON ANID
'flRJEA 'rABKllJ'fY §'fUIDKJE§
3.1 ][NTRODUCTXON
Before a wastewater treatment plant can be designed for biological phosphorus
removal, it is necessary to characterise the effluent qualitatively and quantitatively.
For this purpose, extensive monitoring of the effluent production is required, which
includes the use of proper sampling techniques. Flow rates and water quality changes
continuously, and these changes may affect the ability of a wastewater treatment plant
to achieve consistent biological phosphorus removal.
Obtaining effluent samples that are representative of the effluent flow rate throughout
the months and years to come is difficult at its best. Periodic and diurnal fluctuations
occur in concentration and flow volume. Given the variable nature of the edible oil
effluent that results from the varying nature of edible oil refining process, and the
necessity of attaining consistent phosphorus removal, it is necessary to collect
samples that will represent "average" characteristics and approximate characteristics
under more extreme conditions (Steffen et al., 1989). According to Novotny (1998), a
desirable sampling method is to collect 3-4 hour composite samples. This would
59

IIIIIIIIIIIIIIIIIIIII
provide data that may be considered representative of average effluent characteristics
throughout the day. Usually a careful review of flow monitoring records and reports
generated by the effluent plant over the past couple of years, if present, tend to be
helpful in assessing the periodic and seasonal characteristics of wastewater throughout
the year (Novotny, 1998).
60
IIIIIIIIIIIIIIIIIIIII
3.2 MA TElRJlALS AND METHODS
3.2.1 SAMPLING
Composite wastewater samples were collected monthly over a period of five months
(June, 1998 to October, 1998) from Sealake Industries in Pietermaritzburg, about 92
km north west of Durban. The combined effluent samples (final effluent after pre-
treatment at the effluent treatment plant before final discharge to the municipal
sewerage system) were collected using 25 litre containers, which were then
transported to Technikon Natal for immediate analysis. The remainder of the samples
after analysis were stored in the cold room below 4 °C to prevent biological activity
that could result in the change of effluent quality. The stored effluent samples were
later used to conduct treatability studies.
3.2.1.1 Sample Preservation
The samples were always analysed immediately on arrival at the laboratory so that no
preservation was required. It is important that the samples are not allowed to
deteriorate from time of sampling. If it is not possible to analyse collected samples
immediately, the samples should be preserved according to generally accepted
methods (Standard Methods, 1989). Biological activity such as microbiological
respiration and reproduction, and the chemical activity such as precipitation or pH
changes, and the physical changes such as aeration and high temperatures should be
61
IIIIIIIIIIIIIIIIIIIII
kept to a rmrumum. Preservation methods may involve cooling, pH control, and
chemical addition. Freezing is usually not recommended (Novotny, 1998).
3.2.1.2 Sample Analysis Methods
The effluent samples were analysed for parameters considered necessary for
wastewater treatment purposes (see Table 3.1 for effluent samples analysis results).
Samples were first diluted to the desired concentration ranges with de-ionised water
prior to analysis. A colourimetric method, using spectrophotometer SQ 118 from
Merck, was used for measuring chemical oxygen demand (COD), ortho-phosphate
(P04-P), total nitrogen (TN), ammonium nitrogen (NRt +), nitrates N03- and sulphates
(SOl). All the samples were analysed in triplicate except for phosphate which was
done in duplicates (Appendix 1-6). The total suspended solids (TSS), Fats, oils and
grease (FOG), and alkalinity as CaC03 were all analysed using standard methods
(Standard Methods, 1989) (Appendix 7-9).
62

IIIIIIIIIIIIIIIIIIIII
3.3 RESULTS
Table 3.1: Wastewater characteristics from Edible oil refining industry (Sealake
Industries) for a period of five months (June 1998 to October 1998).
Parameter June July August September October
(mg/f
except Range Mean Range Mean Range Mean Range Mean Range MeanpH)
PH 4.95 5.55 8.76 9.8 5.71 6.5 7.1 7.7 7.61 8.6
5.89 10.6 6.99 8.05 9.93
COD 7590 7630 7550 8160 1025 1155 7240 7400 11 700 11 763
7680 8710 1270 7590 11 810
PO/- (-P) 500 550 910 1020 1640 1660 4320 4400 2110 2140
590 1 140 1680 4510 2 180
TKN (-N) 6.08 6.93 3.21 4.78 6.54 6.82 6.98 7.65 4.36 4.98
7.96 6.26 7.19 8.67 5.81
NH/ (-N) 0.98 1.25 0.41 0.6 1.39 2.0 l.09 1.15 2.09 2.69
1.51 0.76 2.62 l.21 3.6
S04-- 4980 5550 5280 5600 3410 3470 5690 5800 1 170 1260
5910 5830 3530 5980 1400
Lipids 248.8 255.6 102.8 111.1 324.8 339.9 58l.4 627.8 297.2 308.2
(FOG) 266.5 120.8 352.1 630.8 319.3
TSS 239.2 265.2 379.3 383 97.7 111.5 255.6 265.2 309.2 322.3
281.1 387.8 134.1 274.2 340.2
Alkalinity 487 520 465 480 1670 11. 720 616 630 742 766
542 492 1760 649 778
63
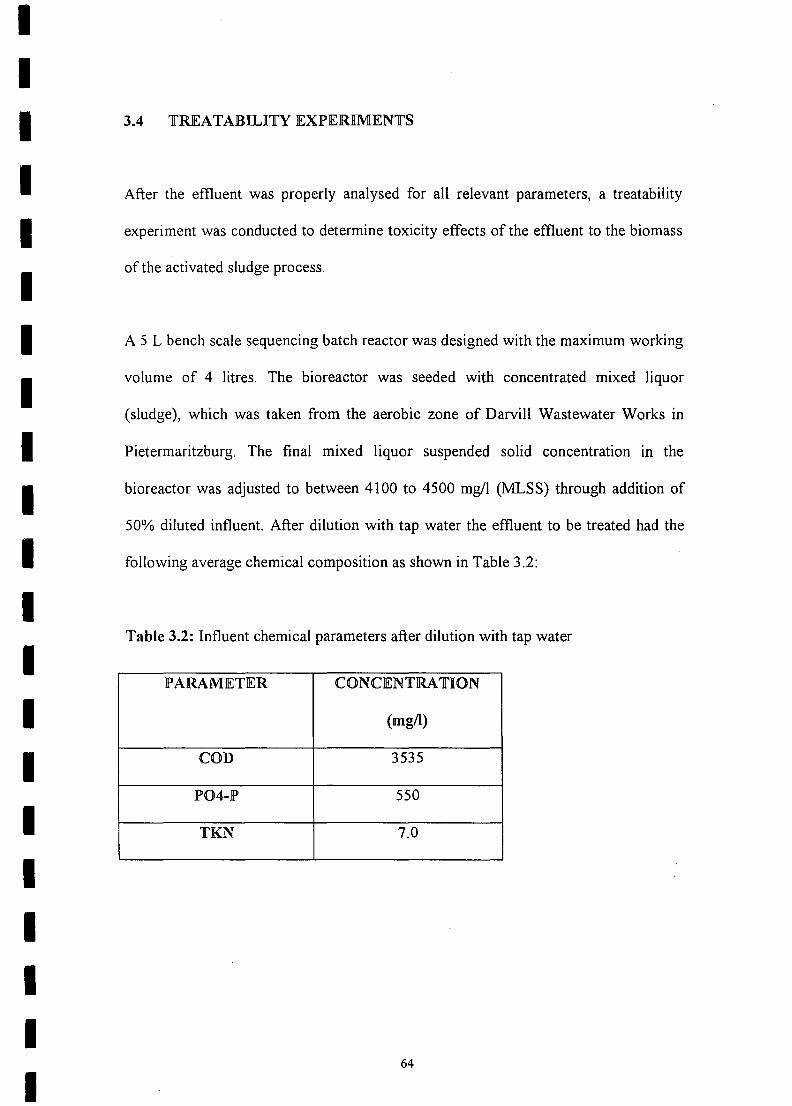
IIIIIIIIIIIIIIIIIIIII
3.4 TREA TAB][L][TY EXPER][MENTS
After the effluent was properly analysed for all relevant parameters, a treatability
experiment was conducted to determine toxicity effects of the effluent to the biomass
of the activated sludge process.
A 5 L bench scale sequencing batch reactor was designed with the maximum working
volume of 4 litres. The bioreactor was seeded with concentrated mixed liquor
(sludge), which was taken from the aerobic zone of Darvill Wastewater Works in
Pietermaritzburg. The final mixed liquor suspended solid concentration in the
bioreactor was adjusted to between 4100 to 4500 mg/l (MLSS) through addition of
50% diluted influent. After dilution with tap water the effluent to be treated had the
following average chemical composition as shown in Table 3.2:
Table 3.2: Influent chemical parameters after dilution with tap water
PARAMETER CONCENTRA T][ON
(mg/l)
COD 3535
P04-P 550
TKN 7.0
64

IIIIIIIIIIIIIIIIIIIII
The sequencing bioreactor was then operated with 24 hour cycles as follows: 2 hours
of anaerobiosis, 21. 5 hours of aerobiosis and 30 minutes of settling and decanting. An
aquarium air pump was connected to the air diffuser (air stone) through a small silicon
tube. The fine air bubbles from the air stone were responsible for the aeration and
mixing of mixed liquor of the treatment process during aerobiosis stage. The
dissolved oxygen (DO) was measured at random intervals using a portable laboratory
scale dissolved oxygen (DO) meter. During the aerobiosis period the DO was
maintained between 2.0 and 5.0 mg02/1 through increasing and decreasing the
aeration pumping rate of the aquarium air pump. The air pump was switched off
during anaerobiosis and the magnetic stirrers were used to maintain homogeneous
conditions in the mixed liquor. The DO of the mixed liquor dropped to below 1.0
mg02/1 after the air pump was switched off thus ensuring that the anaerobic
conditions prevailed in the system.
After the set up was completed the reactor was then operated for 7 days without any
effluent analysis being done, to allow for the biomass to acclimatise to the influent.
Acclimatisation was achieved a through gradual increase of the influent strength
every day until the desired influent strength (3535 mgCOD/I) was achieved. The
process was then operated for a further 7 days using a fill and draw method (Borja et
al., 1995). Two litres of effluent (filtered through 0.45 11mGlass-wool fibre filters)
was collected and analysed each day for total COD, whereas the FOG analysis was
performed three times a week.
65

IIIIIIIIIIII
3.4.1 Results of Treatability experiments
4000
3500.....:..:::::: 3000~-If) 2500s::0+:icu 2000 ~CODD'--s:: m CODxaJ(.)
1500s:: ~CODe0(.)
0 10000o500
01 2 3 4 5 6 7
Operational Time (d1)
Figure 3.1: Sequencing Batch Reactor performance in terms of COD removal over aperiod of 7 days.
IIIIIIIII
CODi = COD concentration (mg/l) of the filtered (0.45 J.Ul1) influent samples.CODx = COD concentration of the mixed liquor samples from the aerobic reactor after
filtration through 0.45 J.Ul1 filter to remove suspended solids.CODe = COD concentration in the final process effluent. This COD represent the
unbiodegradable but soluble portion of the soluble influent COD beforetreatment.
COD removal efficiency of the process over the 7 day period remained constant and
stable. On average 75 % if the influent COD was removed by the treatment process
from an average of3500 mgCOD/l to less then 300mgCOD/l.
66

IIIIIIIIIII
Q)::::(/) C'l1'1'1 EQ) -,_ (/)
C'lcoa 0(/) '';:;
- 1'1'1._ ,_o -~ c(/) Q)_ U
1'1'1 CLb 0
u
300
250
200
150
100
50
O-P"'=-1 4
Operation Tome(d)
7
1m Infl~ IEffi
Figure 3.2: Removal of FOG by the Sequencing Batch Reactor over a period of 7days
IIIIIIIIII
Infl = Concentration of fats, oils and grease (FOG) (mg/l) in the diluted influent samples.Effl = Concentrations of fats, oils and grease (FOG) (mg/l) in the effluent after biological
treatment through the Sequencing Batch Reactor (SBR).
On average the influent had FOG concentrations of 250 mg/l and the effiuent was
consistently below 25 mgFOG/I. This reduction represent more than 90 % FOG
removal from the influent samples.
67
IIIIIIIIIIIIIIIIIIIII
3.5 nnSCUJSSIiON
No previous effiuent monitoring data was present at the beginning of this study due to
lack of onsite effiuent monitoring by the Effiuent Plant at Sealake Industries. Hence
off site effiuent monitoring had to be conducted as the first step towards effluent
treatment technique development. Effiuent monitoring was conducted over a period of
five (5) months so as to characterise the edible oil effiuent. Characterisation of
effluent is necessary for an optimal design and operation of a biological treatment
process.
Wastewater characterisition studies of composite monthly effiuent samples revealed
that effluent characteristics vary widely throughout the month depending on the
refining method currently being employed, i.e. whether chemical or physical refining
method. The effiuent contained both high organic (BOD & COD) and inorganic loads.
In addition to the organic and inorganic loads, this effluent had high quantities of free
fats.
The organic load in the effiuent is due to the presence of large quantities of fats, oils
& grease (FOG) in the final effluent, and is also due to the chemical nature of the
vegetable oil. The hydrolysis products of the edible oil, which are the long chain fatty
acids; glycerol and glycerides; and the proteins, all add to the organic load of the
edible oil effiuent. Eroglu et al., 1990; Ozturk et al., (1990) estimated the organic load
of the edible oilwastewater to be in the range of 0.85 to 1.42 Kg BODs Iton edible oil
produced. In their investigations Ozturk et al., (1990) discovered that there was a
68
IIIIIIIIIIIIIIIIIIIII
strong correlation between BODs and TSS, BOD5 - COD, COD - FOG parameters.
The relationship between FOG and COD was proven earlier by Dart (1974) and later
by Grant (1980) who both reported that 60 % to 64 % of BOD5 was removed from
edible oil wastewater after the removal of 88 % to 91 % of FOG during their physico-
chemical studies.
The inorganic constituents of concern in the edible oil wastewater are phosphates
(Pol") and sulphates (SOl-). Phosphate in the effluent originates mainly from the use
of phosphoric acid during the degumming stage and to a minor extent from the
hydrolysis of phospholipids. Hui, (1996) reported that crude oil, particularly soybean
oil, contains significant quantities of organic phosphorus (P) in the form of
phosphatides, which are subsequently translocated from the oil phase to the water
phase during the crude edible oil refining process. After acidification of the refinery
wastewater, phosphatides get hydrolysed and the resulting phosphates are then
released to the water phase.
Sulphates constitute a measure part of the inorganic constituents in the edible oil
wastewater. They results from the use of strong concentrated sulphuric acid during
acid splitting of soap stock that results in the free fatty acids being separated from the
medium. Eroglu et al., (1990) and Hui, (1996) reported, from separate studies, that the
resulting effluent from acid splitting has an average pH of 1.7 and that it contains
sulphate concentrations of 4000 mg/1.
69
IIIIIIIIIIIIIIIIIIIII
During this study, the sulphate concentration of the edible oil effluent was found to
range from 1260 mg/l to 5800 mg/l SO/- with a mean average of 4340 mg/l SO/-
during the five-month characterisation period. These results are comparable with
other findings reported in the literature (Eroglu et al., 1990; Ozturk et al., 1990; Hui,
1996; Steffen et al., 1990).
The other inorganic problem that is associated with edible oil effluent is salinity.
Salinization of wastewater results from the use of divalent (M2+) and trivalent (M3+)
inorganic salts during physico-chemical treatment of wastewater to reduce waste
loads of the final effluent. Salinity is indicated by the increase in conductivity of
wastewater. Sealake Industries reported that conductivity was one of their major
effluent problems and that the municipality was demanding that the conductivity
levels in the final effluent be brought down to acceptable levels as a mater of urgency.
The conductivity problem can be solved through the optimisation of chemical effluent
treatment methods after the effluent has been subjected to a biological pre-treatment
procedure. Optimisation of dosing technique, pH level and flocculation period should
result in a decrease in excess ions being released to the final effluent hence resulting
in a decrease in both conductivity levels and waste loads in the final effluent that is
discharged to the sewerage system. During this study no attempt was made to
determine the conductivity of the final effluent, nor was any attempt made to break
down the fatty acid composition of the final effluent except the measuring of FOG
from the final effluent.
70

IIIIIIIIIIIIIIIIIIIII
The nitrogen content of the edible oil final wastewater both as total Kjeldahl nitrogen
(TKN) and ammonium nitrogen (NH4 +) was found to be below 10 mgN/1. This shows
that nitrogen is the limiting nutrient for the edible oil effluent. In an edible oil study
by Ozturk et aI., (1990) it was reported that the edible oil effluent BOD5: N: P ratios
were about 100: 4.4: 23, which indicated that nitrogen (N) was the critical factor and
could be a growth limiting nutrient. During the present study, the N/COD ratio was
found to be much smaller than that reported by Ozturk et al, (1990) from their study
(see Table 3.1 for final edible oil effluent samples analysis in terms of N/COD ratios
and Table 3.2 for diluted effluent samples prior to use as influent feed for the
treatment process).
This effluent, due to its chemical composition, IS not suited to treatment usmg
traditional three stage or five-stage biological excess nutrient removal (BEPR)
processes. The effluent would therefore either require nitrogen supplementation or
treatment using a two-stage nutrient removal process incorporating carbon and
phosphorus (P) removal. Hui, (1996) reported that vegetable oil effluent could be
effectively treated in a full-scale wastewater treatment installation when diluted with
domestic wastewater. Characterisation results of the raw oil wastewater samples
during this stage are presented in Table 3.1.
Before the design of a laboratory scale wastewater treatment plant was initiated, a
laboratory scale treatability study was conducted to determine the toxicity or the
suitability of the edible oil wastewater to activated sludge treatment. More
information is available in literature about the phytotoxicity of olive oil wastewater to
71

IIIIIIIII'IIIIIIIIIIII
activated sludge due to the presence of phenolic and polyphenolic compounds in the
final effluent (Beccari et al., 1998; Borja et al., 1995; Tunay et al., 1998). Inhibition
of methane production or methanogenesis in the anaerobic reactors was reported to be
due to saturation of unsaturated long-chain fatty acids (LCF As) in the olive oil mill
effluent. There is no study that was found during literature review that reported the
toxicity of edible oil effluent to biomass and hence an investigation was conducted to
this effect due to some similarities existing between the two types of effluent
substrates.
Treatability studies showed no toxicity effect of edible oil effluent to the activated
sludge biomass during the experimental period over which the study was conducted
(Figure 3.2). This was confirmed by the observed consistent removal of COD and
FOG without any observable deterioration to the system biomass characteristics
(Figure 3.2 and Figure 3.3, respectively). During the treatability studies, the system
results showed an average reduction in COD level of 75 % and more than 90 %
removal of FOG from an average of 253mgFOGIL to below 25mgFOG/L. These
results confirms the treatability of edible oil wastewater using the activated sludge
method as reported by Eroglu et al., (1990) and Ozturk et aI., (1990).
72

IIIIIIIIIIIIIIIIIIIII
CHAPTER 4
ILAJBOlRA TORY SCAILE JBITOREACTOR lDESITGN ANlD
OPERA THON
4.1 INTRODUCTION
In the design of an activated sludge process, both for nutrient and non-nutrient
removal, the characteristics of wastewater to be treated is of prime importance.
Wastewater characteristics govern both the selection of process and the removal
efficiencies of COD, nitrogen and phosphorus attainable in a process (Ekama et al.,
1984; Metcalf and Eddy, 1991). With proper analysis and optimal control of
environmental conditions, almost all wastewater can be treated biologically.
Biological processes such as the activated sludge treatment systems are used to
convert finely divided and dissolved organic matter in wastewater into flocculent
settleable biological and inorganic solids that can be removed in the sedimentation
tanks through excess sludge wasting.
In many cases, these processes which are also known as secondary treatment
processes, are employed in conjunction with other physical and chemical processes
that are used for preliminary or primary treatment of wastewater. For domestic
73
IIIIIIIIIIIIIIIIIIIII
wastewater, the major objectives are to reduce organic load (BODs and COD) and to
remove inorganic compound such as P04-P, NH3 N03- (Metcalf and Eddy, 1991).
To achieve biological nutrient removal (BNR) of nitrogen and phosphorus, the
process must incorporate an anaerobic zone, anoxic zone and aerobic zone in series
(Ekama et al., 1984; Bdjanovic et aI., 1997; Starkenburg et al., 1993, Wentzel et aI.,
1990). For biological phosphorus removal only, as in the case of this presented study,
the anoxic zone is not necessary since it is specifically used for the denitrification or
nitrogen removal from influent wastewater. But the anaerobic zone is of major
importance for the achievement of biological phosphorus removal in a system. This
zone is of fundamental importance since it allows for competitive selection of
microorganisms (bacteria) that are principally responsible for excess biological
phosphorus removal process and enables the polyphosphate accumulating organisms
(poly-P bacteria) to proliferate in the system (Kuba et al., 1993).
The objective of this part of the study was to design and operate a laboratory scale
biological treatment process, and to determine optimum conditions required for the
treatment of edible oil effluent, by manipulating various process operation parameters.
This part of the study was divided into 3 principal phases, with each phase having a
unique set of operating parameters. The purpose of the three phases was to determine
a combination (set) of operating conditions required to optimise the process treatment
operation towards final edible oil effluent remediation.
74

IIIIIIIIII
4.2 MA 1'ERIALS AND ME1'HODS
4.2.1 PHASE 1: 17 OC1'OBER 19981'0 20 NOVEMBER 1998
Based on the results from wastewater characterisation studies, a two-stage activated
IIIIIIIII
4.2.1.1 Unit set-up
sludge process was selected for edible oil effluent treatment. The laboratory scale
bioreactor was designed and modelled upon the modified 3-stage Phoredox process
for biological phosphorus removal (Figure 4.1).
ANAEROBICREACTOR
ANOXICREACTOR
AEROBICREACTOR
SETTLER
II
RECYCLE WASTE FLOW
INFLUENT
SLUDGE RECYCLE SEFFLUENT
Figure 4.1: Schematic diagram of a modified 3 stage Phoredox Process for biologicalnitrogen (N) and phosphorus (P) removal
75

IIIIIIIIIIIIIIIIIIIII
This modified 3-stage Phoredox process was altered to biological phosphorus removal
system only by omitting the anoxic zone and the A-recycle from the original design
(Figure 4.2).
ANAEROBICREACTOR
AEROBICREACTOR
WASTEFLOW
SETTLER
INFLUENT
EFFLUENT
SLUDGE RECYCLE S
Figure 4.2: Schematic representation of a 2-stage Modified Phoredox process forbiological phosphorus (P) removal.
A 5 litre calibrated plastic beaker was converted into an aerobic reactor by drilling
two parallel holes underneath. The two holes were fitted with Perspex glass nozzles to
which silicon tubing was connected. The anaerobic reactor was designed using a 1
litre calibrated conical shaped plastic aspirator bottle with a lid. The anaerobic reactor
had one outlet and two inlets, one on top through the lid for influent inflow, and one
underneath for return activated sludge (S-recycle) inflow. The mixed liquor from the
anaerobic reactor flowed directly to the aerobic reactor through an outlet that was
located underneath the anaerobic reactor, parallel to the return activated sludge (S-
recycle) inlet.
76

IIIIIIIIIIIIIIIIIIIII
The silicon tubing joining the anaerobic reactor and the aerobic reactor was connected
by a Y-connector. Thus, the volume of the anaerobic reactor could be varied
independently of the aerobic reactor volume by raising and lowering the position of
the Y-connector on the retort stand.
The secondary settling tank was designed and placed immediately after the aerobic
reactor. This reactor was designed using the 2 litre funnel shaped plastic bottle with
the mouth facing downwards. The base of the plastic bottle was cut open to allow
airflow and to prevent anaerobic conditions from developing in the secondary settling
tank (settler). The mixed liquor inlet from the aerobic reactor to the secondary settling
tank was located at the bottom of the reactor about O.S litres above the S-recyde
sludge outlet point. The effiuent overflow outlet was located opposite the mixed
liquor inlet at about 1.3 litres above it. The aerobic reactor and the secondary settling
tank were connected with each other through the l.S-meter long IS-mm diameter
silicon tubing. Settled sludge was pumped from the secondary settling tank through
the variable speed peristaltic pump into the anaerobic reactor via a 2.S-meter long
silicon tube (20mm diameter).
The flow though the system was maintained by two peristaltic pumps, one pumping
the influent to the system and the other one pumping the settled sludge back to the
anaerobic reactor. The internal flow rate was maintained through speed adjustment of
the S-recycle line peristaltic pump, where as the effiuent overflow rate depended on
the speed of the influent flow line peristaltic pump. The bioreactors and the peristaltic
77

IIIIIIIIIIIIIIIIIIIII
pumps that were used during these experiments were supplied and manufactured by
the Instrumentation Centre at Technikon Natal, Durban.
4.2.1.2 Bioreactor Operation
During this phase of the study, the reactor was operated semi-continuously for a
period of 20 days at a hydraulic retention time (RR T) of 24 hours and at a sludge age
(Ss) of 30 days. Concentrated settled activated sludge from the secondary settling tank
was recycled through the return activated sludge recycle (S-recycle) to the anaerobic
reactor at the rate three times the influent flow (3Qi) The organic loading rate or food
to microorganism ratio (F/M) of the system was maintained at 1.0 kg COD/kg
MLSS/d.
The reactor was seeded with the mixed liquor from the aerobic zone of Darvill
Wastewater Works in Pietermaritzburg. Darvill sludge was chosen because the plant
is designed for biological nutrient removal processes, and is based on the modified
Johannesburg process for treatment of industrial/domestic effluents (see figure 2.3b).
Mixed liquor in the aerobic reactor was adjusted to 4300 mg MLSS/l. This value was
maintained throughout the experiment by wasting a predetermined quantity of mixed
liquor (0.133 litres) daily from the aerobic reactor.
78
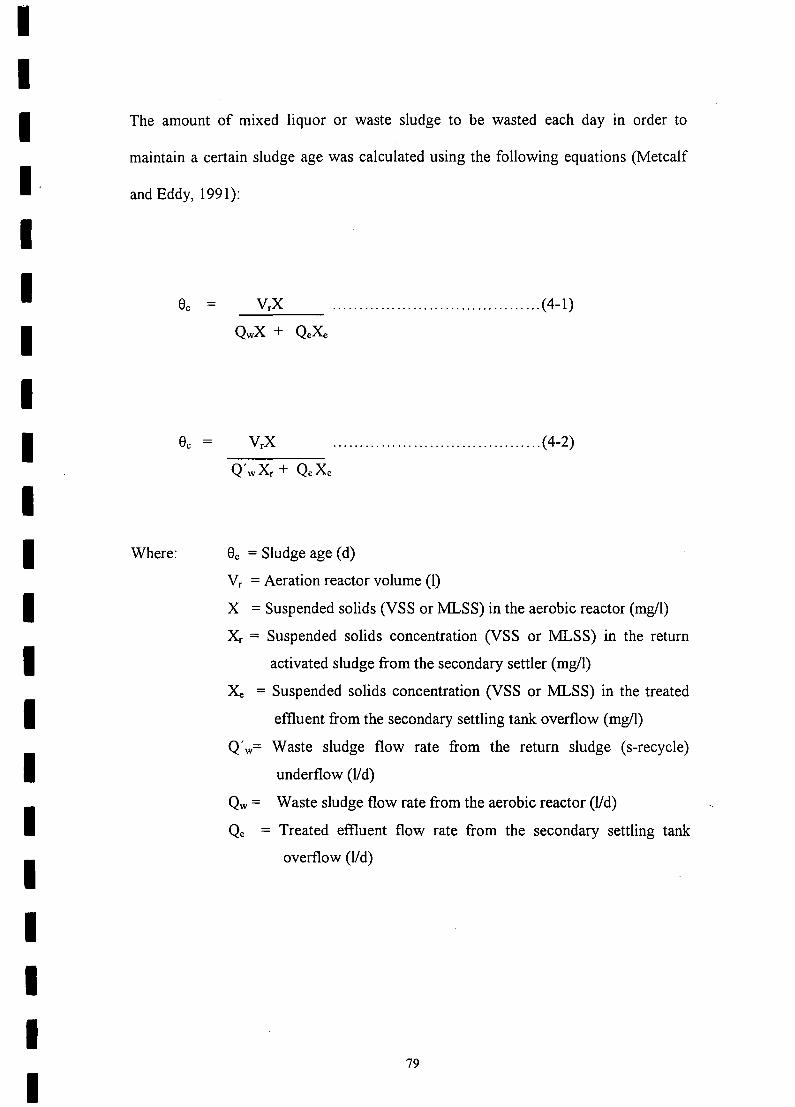
IIII·IIIIIIIIIIIIIIIII
The amount of mixed liquor or waste sludge to be wasted each day in order to
maintain a certain sludge age was calculated using the following equations (Metcalf
and Eddy, 1991):
Where:
....................................... (4-1)
....................................... (4-2)
Be = Sludge age (d)
Vr = Aeration reactor volume (1)
X = Suspended solids (VSS or :rv1LSS)in the aerobic reactor (mg/l)
X, = Suspended solids concentration (VSS or :rv1LSS) in the return
activated sludge from the secondary settler (mg/l)
Xe = Suspended solids concentration (VSS or :rv1LSS)in the treated
effluent from the secondary settling tank overflow (mg/l)
Q'w= Waste sludge flow rate from the return sludge (s-recycle)
underflow (lid)
Qw = Waste sludge flow rate from the aerobic reactor (lid)
Q, = Treated effluent flow rate from the secondary settling tank
overflow (lid)
79
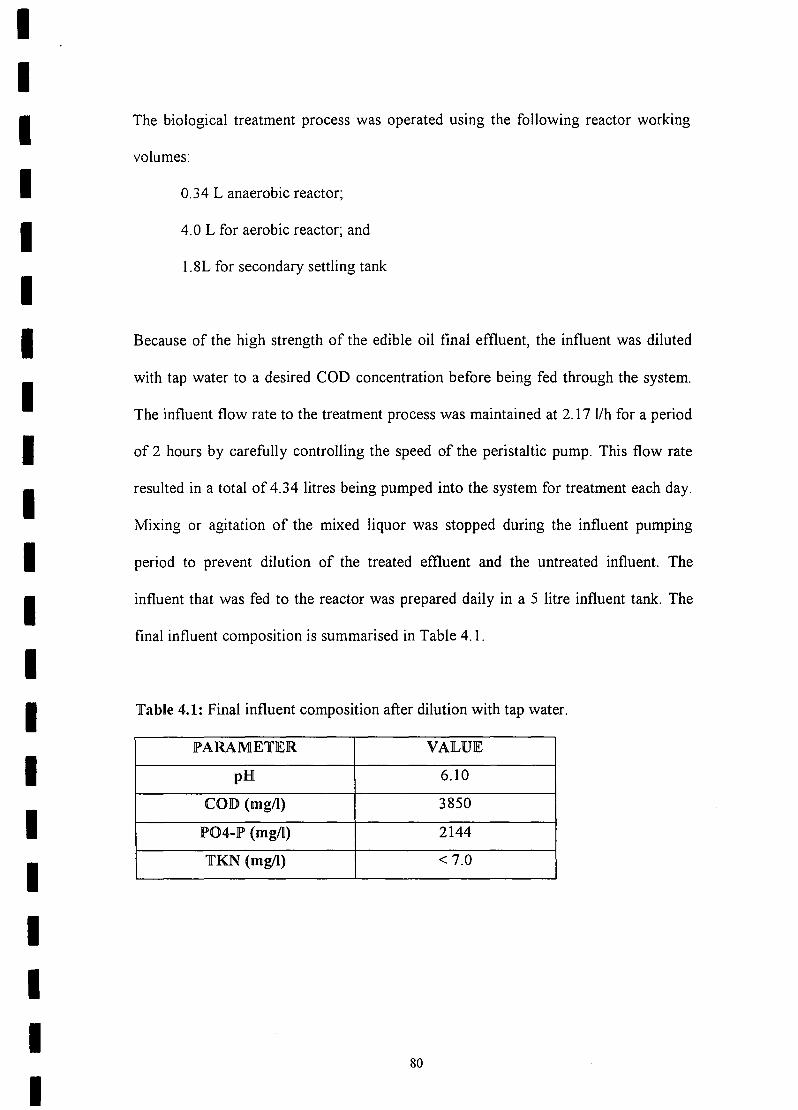
IIIIIIIIIIIIIIIIIIIII
The biological treatment process was operated using the following reactor working
volumes:
0.34 L anaerobic reactor;
4.0 L for aerobic reactor; and
1.8L for secondary settling tank
Because of the high strength of the edible oil final effluent, the influent was diluted
with tap water to a desired COD concentration before being fed through the system.
The influent flow rate to the treatment process was maintained at 2.17 lIh for a period
of 2 hours by carefully controlling the speed of the peristaltic pump. This flow rate
resulted in a total of 4.34 litres being pumped into the system for treatment each day.
Mixing or agitation of the mixed liquor was stopped during the influent pumping
period to prevent dilution of the treated effluent and the untreated influent. The
influent that was fed to the reactor was prepared daily in a 5 litre influent tank. The
final influent composition is summarised in Table 4.1.
Table 4.1: Final influent composition after dilution with tap water.
lPARAMETER VALUE
pH 6.10
COD (mg/ll) 3850
lP04-lP (mg/ll) 2144
TKN (mg/l) < 7.0
80
IIIIIIIIIIIIIIIIIIIII
Aerobic conditions in the aerobic reactor were achieved by pumping in diffused air
though aquarium air pump with two nozzles. Bubbling of air in the aerobic zone was
sufficient to keep the mixed liquor well mixed and hence no mixing devices or stirrers
were used for mixing. The dissolved oxygen (DO) was measured at random intervals
using a portable laboratory scale DO meter. The DO was maintained between 2.0 and
5.0 mg02/1 to ensure that the aerobic conditions were achieved throughout in the
aerobic reactor. The anaerobic reactor mixed liquor was mixed using a magnetic
stirrer that was rotating at 50 revolutions per minute (rpm). The mixed liquor was kept
rotating through the system (recycled) for 24 hours by the peristaltic pump that was
connected to the S-recycle line. After 24 hours of treatment the effiuent was collected
and analysed for COD (daily), soluble P (daily), and FOG (at 3 day intervals). The
results of treatment process operation during phase 1 are shown in Figures 4.3a, 4.3b
and 4.3c.
81

IIII
4.2.1.3 Results
I
IIIIII
5000
4500
4000
3500
0,3000,§,2500
8200001500
1000
500
a
»:...~ ."...A 'la.. "" ~/ '7v ""IV"
'7 ~
~CODof--
-CODem.
IiIr "m-.... _ ....~ J!IIL _......... - - ...- ... -- -
I I I I I
1 2 3 4 5 6 7 8 9 10 11 12 13 14 15 16 17 18 19 20
Operational Tme (days)
Figure 4.3a: Influent and Effluent total COD profiles for a semi-continuouslyoperated biological treatment process at an FIM ratio of 1,0 (Phase 1)
IIIIIIII
CODi = COD concentration (mg/l) of the filtered (0.45 urn) influent sample after dilution with tapwater
CODe = COD concentration (mgll) of filtered (0.45 urn) effluent samples after biological treatment.
There was an observed gradual increase in COD removal efficiency from day 1 to day
7. After day 7, the process showed stabilisation with constant COD removal
efficiency. The treated effluent COD was consistent to about 1000 mgCOD/I from an
average of3800 mgCOD/l.
82

IIIIIIIIIIIIIIIIIIIII
3000
2500
- 2000::::C)
E-CI)
1500-ra.c -=<>-Infl-Pc..1/1 =Iil- Effl-P0 1000.c
D..
500
1 2 3 4 5 6 7 8 9 10 11 12 13 14 15 16 17 18 19 20
Operation time (d1)
Figure 4.3b: Influent and Effluent soluble P profiles for a semi-continuously operatedbiological treatment process at FIM ratio of 1.0 (Phase 1)
Infl-P = Phosphate concentration (mg/l) of filtered (0.45 J.Ul1) influent samples after dilution with tapwater.
Effl-P = Phosphate concentration (mg/l) of filtered effluent samples after biological treatment
From day 1 to day 6, phosphate removal of about 330 mgP/I was observed, with the
highest and lowest P removal of 580 mgP/I and 43 mgP/I, respectively.
After day 6 until day 18, phosphate release instead of removal was observed. The
highest P release over the 12 day period was 279 mgP/I, with the lowest P release
recorded at 10 mgP/1.
83
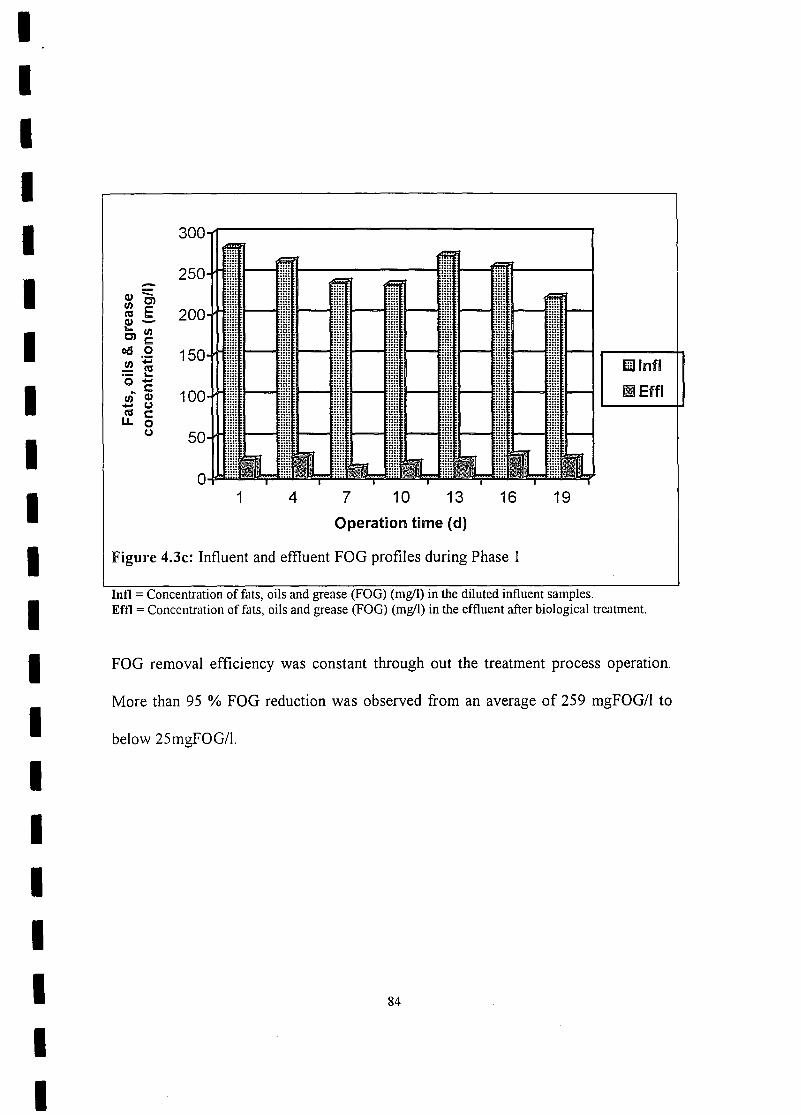
IIIIIIIIIIIIIIIIIIIII
1 7 19
IIillnflIIlEffi
10 13 164Operation tome (d)
Figure 41.3c:Influent and effluent FOG profiles during Phase 1
Inn = Concentration of fats, oils and grease (FOG) (rng/l) in the diluted influent samples.Eftl = Concentration of fats, oils and grease (FOG) (rng/l) in the effluent after biological treatment.
FOG removal efficiency was constant through out the treatment process operation.
More than 95 % FOG reduction was observed from an average of 259 mgFOG/I to
below 25mgFOG/1.
84

IIIIIIIIIIIIIIIIIIIII
4.2.2 !PHASE 2: 22 November 1998 to 31 December 1998
4.2.2.1 Unit Set-UlJP
At the end of phase one prior to the beginning of phase two the reactor was stopped
and the experiment was started afresh using new design parameters. All the mixed
liquor from the previous experiment, reactors and tubes were cleaned to prepare for
the next phase of the study. The 1.8 litres (working volume) secondary settling tank
was removed and was replaced with a 0.45 litres (working volume) secondary settling
tank. The new settling tank resulted in 75 % reduction of the settler volume, which
resulted in improved overall performance. The mixed liquor inlet from the aerobic
reactor into the secondary settling tank was moved closer to the sludge recycle (S-
recycle) outlet. The new arrangement resulted in an improved and rapid settling rate
of the sludge in the secondary settling tank.
The volume of the anaerobic reactor was also increased from 0.34litres to 1.0 litre by
raising the position of the Y-connector on the retort stand. The increase in the
anaerobic reactor working volume was equivalent to 20 % increase of the anaerobic
sludge mass fraction. Mixing of the sludge was maintained using the magnetic stirrer
operating at 50 rpm. The volume and operation of the aerobic reactor remained
unchanged at 4.0 litres. Aeration and agitation of the mixed liquor was maintained by
using diffused air into the system. A portable dissolved oxygen (DO) meter was used
to monitor dissolved oxygen in the system at irregular intervals from time to time.
The desired dissolved oxygen content of the aerobic reactor was kept within the range
85

IIIIIIIIIIIIIIIIIIIII
of 2 - 5 mg 0/1 through switching the aquarium air pumps on and off as deemed
necessary.
Fresh seed sludge was collected from Darvill Wastewater Works to be used as an
inoculum to the reactor. New batches of final edible oil effluent were collected from
Sealake Industries in 25 litre containers for this part of the study. The effluent was
analysed for polluting parameters as previously described. After the effluent analysis
the rest of the effluent was stored in the cold room at between 0 °C and 4 °C to
prevent or reduce microbial activity. This batch of effluent was kept in the cold room
for the duration of this phase of study.
41.2.2.2Unit Process Operation
During phase 2 of the study the reactor operation mode was changed from semi-
continuous mode to a continuous mode. Hydraulic retention time (HRT) of the system
was maintained at 24 hours through constant pumping of the diluted influent at a flow
rate (Qi) of 5.0 lid. The concentrated settled activated sludge from the secondary
clarifier was recycled back to the anaerobic reactor trough the peristaltic pump
connected along the S-recycle at a rate of 2Qi. The organic loading rate or food to
microorganism (FIM) ratio was increased from 1.0 to 1.50 kg COD/kg l\.1LSS/d by
increasing the diluted influent strength from 3850 to 5500 mg CODIL. The fresh
batch of effluent had a relatively low concentration load of phosphorus, which ranged
from 430 to 450 mg P04-P/l after effluent dilution with tap water. Mixed liquor
(l\.1LSS) concentration was kept between 3500 and 4000 mg l\.1LSS/l while the sludge
86

IIIIIIIIIIIIIIIIIIIII
age (8s) was reduced from 30 days to 15 days. A predetermined amount of mixed
liquor was wasted daily from the aerobic reactor to achieve the desired sludge age
(equation 4-1). The treatment process was operated at ambient laboratory
temperatures, which ranged from 24°C to 29 °C (Durban summer season). The pH of
the aerobic reactor was monitored at irregular time interval using Backman portable
pH meter fitted with a glass electrode. The pH in the aerobic reactor was maintained
at around pH 7.0 through manual dosing of 1M hydrochloric acid (1M HCI) at
irregular intervals, as needed.
A new influent preparation and storage tank with 25-litre capacity was used to replace
the previous 5.0 L influent tank. Because of the new bigger influent tank, the influent
was no longer prepared on daily basis but was prepared once in 5 days. The reactor
was operated for 8 days using step feeding to allow for the biomass to acclimatise to
the influent prior to the beginning of actual analysis period. The treatment process
operating parameters during phase 2 are shown in Table 4.2. Parameters monitored
were: influent and effluent COD (daily), soluble influent and effluent ortho-phosphate
(daily), and FOG (was determined at 3 days intervals). The results of treatment
process operation during phase 2 are shown in Figures 4.4a, 4.4b and 4.4c.
87

IIIIIIIIIIIIIIIIIIIII
Table 4.2: Operational parameters for the treatment process during phase 2.
PARAMETER VALUE
CODinlluent (mg/l) 5500
P04-Pinlluent (mg/I) 430 - 450
TlKNinllucnt (mg/l) < 7.0
MLSS (mg/l) 3500 - 4000
FIM (kgCOD/kgMLSS.d) l.5
e (hrs) 24
Sc(d) 15
Temp (OC) Room
pH 6.5-7.5
v.rn 5
o, (I/d) 5
88
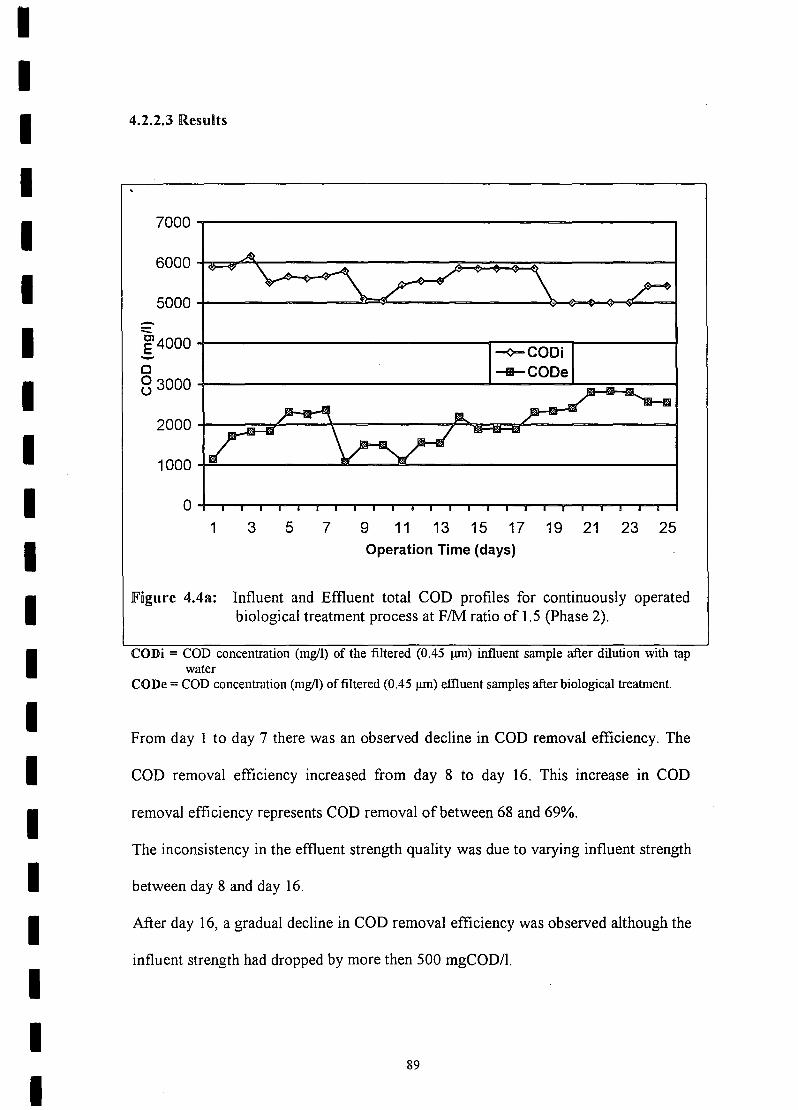
IIIIIIIIIIIIIIIIIIIII
4.2.2.3 Flesults
7000
6000
5000-=::::e4000-c83000
2000
1000
01
-¢-CODi"""_CODe
53 7 9 11 13 15 17 19 21 23 25Operation Time (days)
Figure 4.4a: Influent and Effluent total COD profiles for continuously operatedbiological treatment process at FIM ratio of 1.5 (Phase 2).
CODi = COD concentration (mg/l) of the filtered (0.45 urn) influent sample after dilution with tapwater
CODe = COD concentration (mg/l) of filtered (0.45 urn) effluent samples after biological treatment.
From day 1 to day 7 there was an observed decline in COD removal efficiency. The
COD removal efficiency increased from day 8 to day 16. This increase in COD
removal efficiency represents COD removal of between 68 and 69%.
The inconsistency in the effluent strength quality was due to varying influent strength
between day 8 and day 16.
After day 16, a gradual decline in COD removal efficiency was observed although the
influent strength had dropped by more then 500 mgCOD/l.
89

IIIIIIIIIIIIIIIIIIIII
500
450
400
.350.....:..::::0)300E
~ 250I'tSoJ::a.III 2000
oJ::
a. 150
100
50
01
~Infl-P-Effl-P
7 9 11 13 15 17Operational time (days)
3 5 19 21 23 25
Figure 4.4b: Influent and Effluent soluble P profiles for a continuously operatedbiological treatment process at FIM ratio of 1.5 (Phase 2)
Intl-P = Phosphate concentration (mg/l) of filtered (0.45 urn) influent samples after dilution with tapwater.
Effl-P = Phosphate concentration (mg/l) of filtered effluent samples after biological treatment
From day 1 to day 8 an average phosphate removal of 84 mgPIL was observed, with
the highest P removal of 170mgP/I in day 1 and the lowest at 50 mgP/I during day 3, 4
and day 5.
From day 9 to day 17, there was an appreciable decrease in P removal efficiency from
an average of84 mgPIl to an average of25 mgP/l. Between day 18 and day 19 there
were no P removal observed. From day 21 to day 25, P release at an average of 12
mgP/I was observed.
90
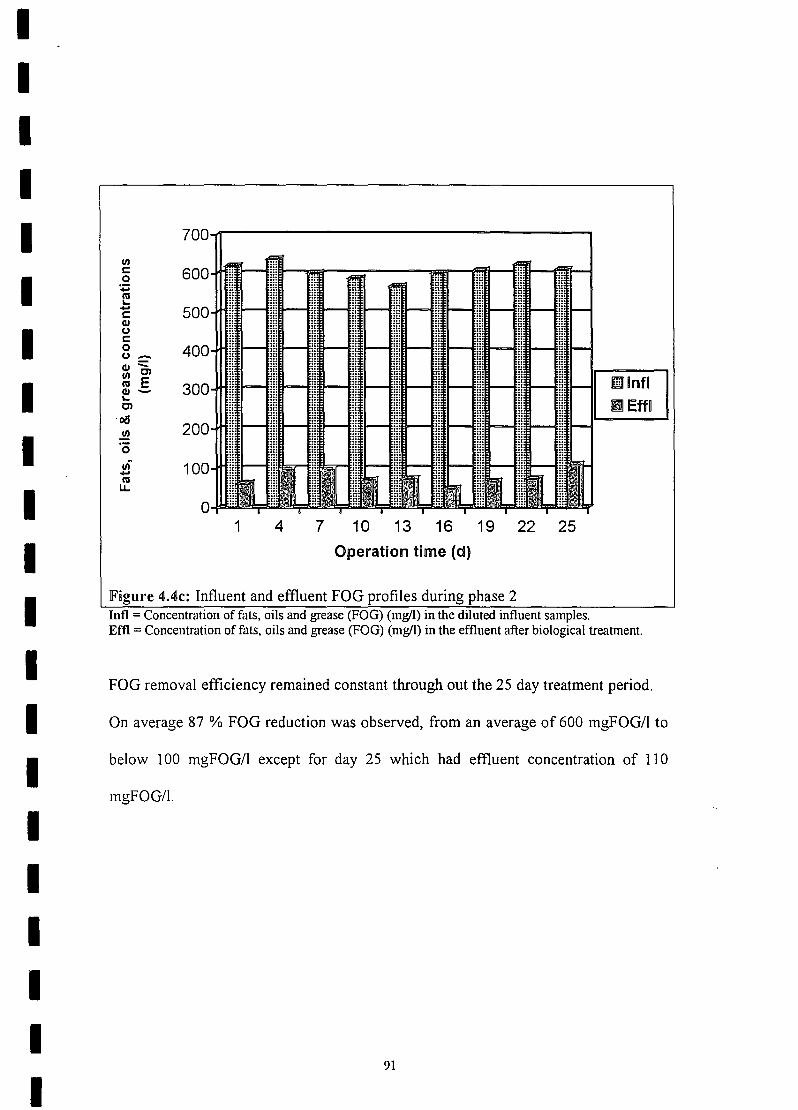
IIIIIIIIIIIIIIIIIIIII
7ent: 6000
+::C'I:II..- 500t:alUt:0 400u _al ::::en C)
C'I:I E 300al-I..C)
·06200en
'0en~ 100-C'I:ILL
01 4 7 10 13 16 19 22 25
Operation time (d)
Figure 4IAc: Influent and effluent FOG profiles during phase 2
mllnflIlij]Effl
Inn = Concentration of fats, oils and grease (FOG) (mgll) in the diluted influent samples.Eftl = Concentration of fats, oils and grease (FOG) (mgll) in the effluent after biological treatment.
FOG removal efficiency remained constant through out the 25 day treatment period.
On average 87 % FOG reduction was observed, from an average of 600 mgFOG/1 to
below 100 mgFOG/1 except for day 25 which had effluent concentration of 110
mgFOG/1.
91
IIIIIIIIIIIIIIIIIIIII
4.2.3 PHASE 3: 15 JANUARY 1999 TO 02 MARCH 1999
4.2.3.1 Bioreactor set-up and operation
The reactor design and set-up it remained the same as it was during phase 2. The
anaerobic reactor, the aerobic reactor, and the secondary settling tank volumes
remained unchanged at 1.0 litre, 4.0 litres, and 0.45 litres, respectively. Only the
operating parameters were altered during this phase of the study. The study was
started up using fresh seed sludge from Darvill Wastewater Works. Mixed liquor was
maintained between 4100 and 4200 mg MLSS/I but the organic loading rate (FIM
ratio) was decreased from 1.5 to 0.5 kg COD/kg MLSS/d. The sludge age (8s) was
maintained at 15 days through wastage of predetermined quantities of mixed liquor
from the aerobic reactor every day (see equation 4-1). Hydraulic retention time (HRT)
was kept at 24 hours by constantly pumping the diluted influent at a rate (Qi) of 5.0
lid into the anaerobic reactor. Feed supplementation with O.OIM sodium acetate was
initiated in order to determine the effects of artificially increasing the VF A load on
biological phosphorus removal in the edible oil effluent.
4.2.3.2 Feed Preparation and Process operation
The same batch of edible oil final effluent that was used during phase 2 was also used
during phase 3 of the study. Raw undiluted effluent stocks were kept in the cold room
until required. The influent feed was prepared once every four days by diluting the
predetermined volume of edible oil final effluent with tap water to make up a final
92
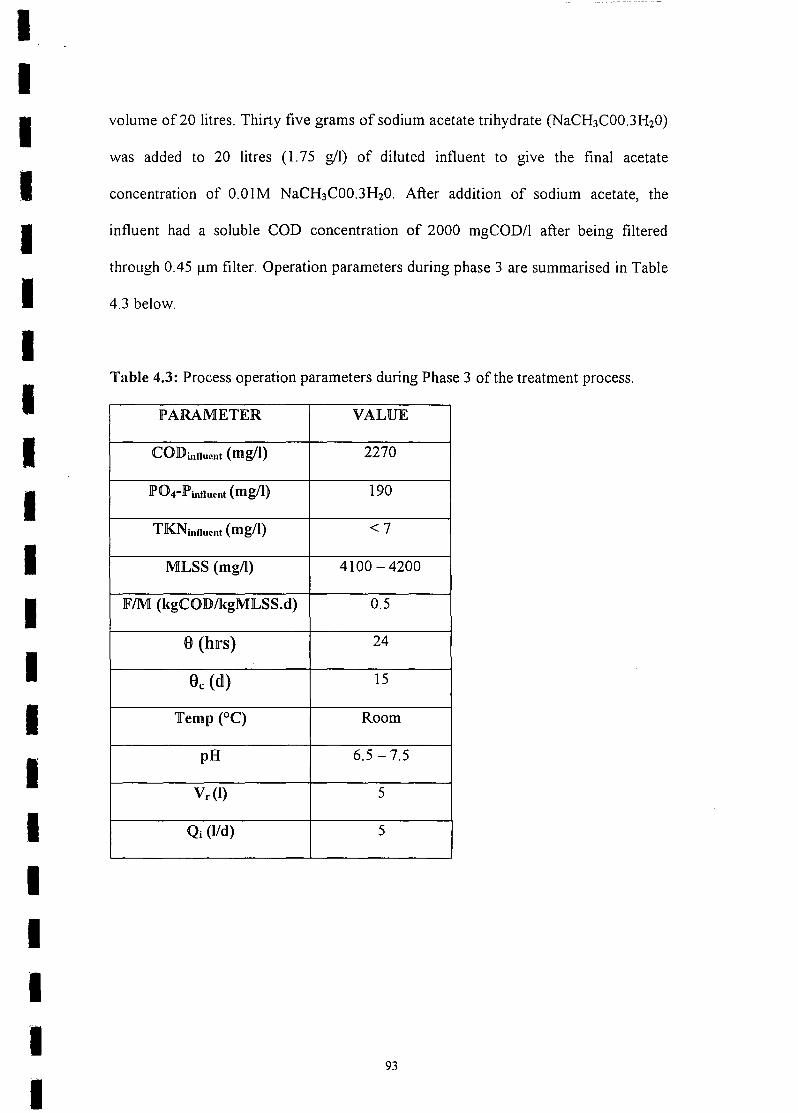
IIIIIIIIIIIIIIIIIIIII
volume of 20 litres. Thirty five grams of sodium acetate trihydrate (NaCH3COO.3H20)
was added to 20 litres (l.75 gil) of diluted influent to give the final acetate
concentration of O.OIM NaCH3COO.3H20. After addition of sodium acetate, the
influent had a soluble COD concentration of 2000 mgCODIl after being filtered
through 0.45 11mfilter. Operation parameters during phase 3 are summarised in Table
4.3 below.
Table 4.3: Process operation parameters during Phase 3 of the treatment process.
PARAMETER VAlLUE
CODinllucllt (mg/l) 2270
P04-Jl\nllucllt (mg/l) 190
TKNilllluellt (mg/l) <7
MlLSS (mg/l) 4100 - 4200
lFlM (kgCOD/kgMlLSS.d) 0.5
6 (Ius) 24
9c(d) 15
Temp (OC) Room
pH 6.5 -7.5
v.o: 5
Qi (lId) 5
93

IIIIIIIIIIIIIIIIIIIII
4.2.3.3 Results
3000~------------------------------------=-----~
2000+---------------------------~~~------~-::::C)
E;1500+------------=--------+---=-=---~~~--~--~oo
1 3 5 7 9 11 13 15 17 19 21 23 25 27 29Operational Time (days)
Figure 4.5a: Influent and Effluent total COD profiles for a continuously operatedbiological treatment process at FIM ratio of 0.5 (Phase 3)
CODi = COD concentration (mg/l) of the filtered (0.45 urn) influent sample after dilution with tapwater
CODe = COD concentration (mgll) of filtered (0.45 urn) effluent samples after biological treatment.
From day 5 to day 21, gradual decline in COD removal efficiency was observed.
Stabilization of COD removal efficiency started after day 21 until day 30.
94

IIIIIIIIIIIIIIIIIIIII
250~----------=----=-------------=----------~
'""'~ 200+---------~~~~~~~~------=-----=-----~E-eo~~ 150~--~--------------------=---~~~-+~~----------~-eQ)oc8 100~----~----~----r_--------_r==========~----~~I/)::JI-o.c:a.I/)o.c:a.
--<>-Infl-P
-Effl-P50+-------------------------._=---=---~----~
11 13 15 17 19 21 23 25 27 29Time (d)
Figure 41.5b: Soluble influent and effluent orthophosphate profile for continuouslyoperated biological treatment process at FIM ratio ofO.5 (Phase 3)
3 5 7 91
Intl-P = Phosphate concentration (mg/l) of filtered (0.45 urn) influent samples after dilution with tapwater.
Effl-P = Phosphate concentration (mg/l) of filtered effluent samples after biological treatment
From day 1 to day 5 there was a fluctuating increase in P removal efficiency. On
average 76 mgP/I was removed by the treatment process.
From day 16 to day 20, there was an observed decline in P removal efficiency from an
average of76 mgP/I to an average 53 mgP/l.
After day 20, P removal increased again to an average of76 mgP/l.
No P release was observed throughout this phase.
95

IIIIIIIIIIIIIIIIIIIII
::::Cl
.§.c:o~~-eQ)(J
c:o(J
Q)enC'CIeCl
oa!:!2oen-C'CIU.
1 7 10 13 16 19 22 25 28
mlntl
I!I Eftl
4Operation time
Figure 4.5c: Influent and effiuent FOG profiles during phase 3Inn = Concentration of fats, oils and grease (FOG) (mg/l) in the diluted influent samples.Em = Concentration of fats, oils and grease (FOG) (mg/l) in the effluent after biological treatment.
FOG removal efficiency remained consistent throughout the 30 day treatment period.
On average 93 % of FOG was removed from the influent average of 727 mgFOG/l to
below 71 mgFOG/l.
96
IIIIIIIIIIIIIIIIIIIII
4.3 GENERAL DiSCUSSiON
Phase 1
During phase 1, the system had shown improved capability to remove COD and P
(Figure 4.3a and 4.3b, respectively) as compared to the preliminary investigation
phase. No signs of overloading were initially observed from the treatment process
although the influent organic load was higher than the normal organic loads generally
applied in domestic/industrial wastewater treatment processes, which are around 0.2-
OJ kgCOD/ kgMLSS/d as compared to 1.0 kgCOD/kgMLSS/d (Ekama et al., 1984).
The system showed an average COD (Sti) removal of70 % [(CODinfluent- CODetlluent)
X 100/CODiniluent]but a negligible removal of P of about 4.4 % was observed (see
4.3a and 4.3b, respectively). During the first six days of the system operation
following the acclimatisation period of 15 days, an average P removal of around 330
mgP/1 was observed, with the highest removal of 580 mgP/l and the lowest at
43mgP/1. This P removal was not consistent and varied considerably. After day six, a
sudden change in the P removal pattern was observed. Phosphorus release instead of
the expected P uptake and removal was observed from day 7 to day 18 after which the
process was stopped and this phase abandoned. During the 12 days of the observed P
release, an inconsistent P release pattern similar to that which was observed for P
removal, was also observed. The highest P release was recorded at 270 mgP/1 and the
lowest at 10 mgP/1. On average the process showed a P release of about 93 mgP/l as
compared to P removal of331mgP/1.
97
IIIIIIIIIIIIIIIIIIIII
Although it may appear as if the percentage of phosphate removal was minimal (ca
4.4 percent), in real terms the system was actually removing about 238 mgP04-P/l, a
result which may have possibly been amplified due to phosphate analytical method
error caused by the high dilution rates required for detection to be within the
instrument's analytical range.
The reduced P uptake and removal capability of the system was partly attributed to
the insufficient anaerobic sludge mass fraction of 0.08 or 8 % of the total system
volume. It is likely that synthesis of short chain fatty acids (SCF As) or volatile fatty
acids (VF As) from the fermentation of influent readily biodegradable COD fraction
(RBCOD) was incomplete and the full acetate complement (Ekama et ai., 1984) was
not produced.
The reduced P removal could also be attributed to the influence of the secondary
settling tank size. The observed P released after day 6 coincided with the observed
activated sludge blackening that was occurring in the anaerobic reactor. The sludge
blackening in the anaerobic reactor was followed by the appearance of black sulphur
deposits on the sides of the secondary settling tank due to the prevailing anaerobic
conditions. The prevailing anaerobic conditions in the secondary settling tank resulted
in the reduction of sulphate ions to sulphur which was further reduced to sulphide
ions. The onset of anaerobiosis in the secondary settling tank was confirmed by the
strong smell of hydrogen sulphide (H2S), which has a characteristic smell, coming
from the secondary settling tank.
98

IIIIIIIIIIIIIIIIIIIII
The anaerobic conditions in the secondary settling tank have been reported by
Simpkins (1979) to trigger the secondary phosphorus release in the biological nutrient
removal (BNR) systems. Although the anaerobic conditions were observed in the
secondary settling tank, no verification was attempted to verify it was responsible for
the observed P release in the process after day six. The influence of the secondary
settling tank on the P release of the system could be verified by taking mixed liquor
from the outlet of the aerobic reactor towards the secondary settling tank inlet. The
collected mixed liquor should be filtered through a 0.45 urn filter paper and the
filtrate analysed immediately for P. The results of this analysis should be compared
with the results of sample analysis of the final effluent samples taken from secondary
settling tank overflow outlet. For the current study, this comparison was not
conducted due to time and chemical constraints.
Phase 2
Changing the operation parameters such as sludge age, anaerobic sludge mass fraction
and secondary settling tank volume, resulted in an improved consistency of phosphate
(P) removal by the treatment process. The average P removal was observed to be 8 %
of the total influent P of about 430-450 mgP04-P/l (see Figure 4.4b).
The improvement in P removal during phase 2 was thought to be due to the increased
anaerobic sludge mass fraction and the reduced sludge age. Increasing the size of the
anaerobic sludge mass fraction to 20 % of the total reactor volume (Vr) has been
reported to increase the fermentation ofRBCOD to VFAs in the anaerobic zone of the
99

IIIIIIIIIIIIIIIIIIIII
domestic wastewater treatment plants (Rustrian et al., 1999; Ekama et al., 1984;
Wentzel et al., 1990). The decrease in sludge age is known to have an improved effect
on phosphorus removal efficiencies in BNR of domestic wastewater treatment
systems (Wentzel et al., 1990). This is due to the increased removal frequency
biomass including the PAO from the system. The increased removal frequency of
PAO together with waste activated sludge is thought to result in more cells that
contain accumulated P being removed from the system and thus stimulating the rapid
reproduction of new biomass (PAO) that has enhanced P uptake capabilities. The P
and COD removal efficiencies were calculated using the following methods:
P removal efficiency (%) = (Pinfluent- Peffiuent)X 100
Pintluent
COD removal efficiency (%) = (CODintluent- CODetlluent)X 100
COD influent
During phase 2, a gradual decline in COD removal efficiency was observed (see
Figure 4.4a). This decline in COD removal started after day 16 when the COD
removal efficiency suddenly dropped from an average of 69 %-68 % COD removal to
an average of 50 %, which remained there for the duration of the experimental phase.
The observed decline in COD removal efficiency coincided with the observed decline
in P removal efficiency of the treatment process. At about the same time when the
COD removal efficiency dropped, a phosphorus (P) release in the system was
100
IIIIIIIIIIIIIIIIIIIII
observed instead of the expected P uptake and removal. The decline in COD removal
efficiency of the treatment process was partly attributed to the increased operational
F:M ratio (food to microorganism ratio) that was maintained at 1.5
kgCOD/kgMLSS/d. Increasing the F:M ratio of the system is reported to have an
overloading effect to the biomass which results in the overall poor system substrate
metabolism performance (Wentzel and Ekama, 1997; Casey et al., 1995).
The overall decline in the process COD and P removal efficiency after day 16 (Figure
4.4a and 4.4b, respectively) may also be attributed to the high sulphate (SOl)
concentration of the original edible oil effluent. Although sulphates were not
monitored in this study, their contribution to the process failure was evident from the
observed sludge darkening in the anaerobic reactor and in the secondary settling tank,
although its size had been reduced in order to reduce residence time in the secondary
settling tank. Increased production of H2S gas was observed after day 16 which was
accompanied by an increased oxygen demand of the activated sludge in the aeration
reactor. This effect was similar to the process failure that was observed during phase 1
of the treatment process operation.
101
The increase in sulphate concentration of the influent may be directly responsible for
the decrease in P removal efficiency of the system. Because of the oxidising nature of
the sulphur in the sulphate ion (S6+ in SOl), other heterotrophic microorganisms
(heterotrophs) such as sulphur reducing bacteria may have utilized the sulphate ions in
the influent as a terminal electron acceptor in the anaerobic reactor. The presence of
sulphate ion as a terminal electron acceptor for some heterotrophs in the anaerobic

IIIIIIIIIIIIIIIIIIIII
zone is thought to have resulted in the utilization of RBCOD by these heterotrophs,
thus giving them a competitive advantage with regard to substrate utilization, a
similar situation to that which occurs when oxygen or nitrates/nitrites (NOx) are
present or introduced into the anaerobic reactor of the BNR system.
The idea of existence of sulphate ions as terminal electron acceptor in the anaerobic
reactor is supported by the observed production of the H2S gas by the system after day
16 of treatment process operation. The reduction of sulphate ion to hydrogen sulphide
is known to take place under anaerobic conditions in the presence of sulphur reducing
bacteria such as Desulfotomaculum according to the equation shown below (Pelczar et
al., 1993; Metcalf and Eddy, 1991):
In the presence of ferric ions in the mixed liquor (solution), the reduction of sulphate
ions result in the formation of both ferric sulphide (Fe2S) precipitate, which is black,
and hydrogen sulphide (H2S) gas, which is colourless, according to the following
equation (Metcalf and Eddy, 1991):
34H+ + 2Fe3\aqua) + 4 SO/(aqua) + 32 e'
Phase 3
During this phase of the study the only process treatment parameters that were
changed were the organic loading rate, which was reduced from 1.5 kg COD/kg
102
IIIIIIIIIIIIIIIIIIIII
MLSS/d in phase 2 to 0.5 kg COD/kg MLSS/d through influent dilution with tap
water and the RBCOD of the diluted influent which was increased through feed
supplementation with sodium acetate. The P/COD ratio remained constant between
phases 2 and 3 since the same batch of edible oil effluent that was used previously as
the treatment process feed influent (during phase 2) was also used during phase 3,
thus resulting in no change in P/COD ratio after feed influent dilution with tap water.
The results after changing the process parameters in phase 3 showed an improvement
in terms of P removal efficiency, which was almost constant through out the
experimental phase (Fig. 4.5b). However, improved P removal efficiency was coupled
with the observed gradual decline in COD removal efficiency, which had a similar
pattern as was observed during phase 2 of this study. The improvement in P removal
efficiency may be partly attributed to the sulphate ion concentration being lower in
the influent due to dilution, thus resulting in a general decrease in concentration of
sulphate ions as terminal electron acceptor.
The supplementation of influent with sodium acetate is strongly believed to have
contributed to the increase in P removal efficiency of the treatment process during this
phase. This could be attributed to the dominance ofPAOs over non-PAO heterotrophs
in the activated sludge biota. The increase in VF As in the anaerobic reactor is thought
to have resulted in the increased dominance and proliferation of PAOs in the whole
system, thus giving them a competitive advantage over the sulphur reducing bacteria
with regard to substrate utilisation in the anaerobic reactor.
103
IIIIIIIIIIIIIIIIIIIII
The sulphur reducing bacteria are slow growers that exhibit a slow growth rate (K)
(Metcalf and Eddy, 1991). The slow growth rate of sulphate reducing bacteria is
evident from the previous two experimental phases (phases 1 & 2) that was shown by
the delayed onset of their effect in the treatment process efficiency. No evidence of
the presence of the sulphate reducing bacteria was observed during the third phase of
the treatment process study. The symptoms of sludge blackening, increased DO
demand and the production ofH2S gas were not observed during this phase.
The gradual reduction in COD removal efficiency is hypothesised to be due to the
dominance of PAO over non-P AOs in the entire activated sludge biota. Non-PAOs
metabolise both readily and slowly biodegradable substrate (COD) in the presence of
a terminal electron acceptor (e.g. O2, N03 - and S042-), where as the PAOs take up and
store readily biodegradable in the anaerobic zone (RBCOD from acetate
supplementation of the influent). The uptake of readily biodegradable substrate in the
anaerobic reactor by the PAOs is thought to have resulted in poor removal of slowly
biodegradable COD in the subsequent aerobic reactor.
After the three effiuent treatment experimental phases (Phases 1-3) it is thus
hypothesised that PAOs were unable to effectively and efficiently utilise the initial
biodegradable COD factions in the influent wastewater. It is further hypothesised that
high sulphate concentrations in the influent had had a negative impact on the
wastewater treatment process efficiency in general (for both COD and P removal).
104
IIIIIIIIIIIIIIIIIIIII
The removal of fats, oils & grease (FOG) was observed to be consistent throughout
the treatment experimental phases, which was above 95% FOG removal. The removal
of fats from the influent wastewater by the treatment process may be due to
adsorption of fats onto the activated biomass, rather then through biochemical
metabolism of fats into simpler organic molecules that could be utilised by
microorganisms to increase their biomass.
105

IIIIIIIIIIIIIIIIIIIII
CHAPTERS
TRlEA TMlENT PROClESS OJPTliMli§A TliON (JPIHIASlE~)
5.1 INTRODUCTION
A number of operating parameters have a profound influence on the degree of
biological excess phosphorus removal (BEPR) from a wastewater treatment process.
Manipulation of design and process operation can be used to optimise the BEPR
process performance.
In determining the effect of different operation parameters on the magnitude of
BEPR, Wentzel et al.(1990) used a steady state model to predict phosphorus (P)
removal for various changes in parameters, such as sludge age, influent COD
concentration, HRT, etc. Parameters that were noted in the preceding experiments to
be important for biological excess phosphorus removal (BEPR) from the vegetable oil
effluents are: the size of the anaerobic zone/reactor; number of anaerobic reactors;
sludge age; and influent characteristics (C:N:P ratio and RBCOD concentration).
106
IIIIIIIIIIIIIIIIIIIII
5.1.1 Size of Anaerobic reactor
The anaerobic reactor is sized using the' anaerobic mass fraction (fxa), which can be
represented by the following formula:
fxa = mass of sludge in the anaerobic reactor
mass of sludge in the system
For selected sludge ages, Wentzel et al., (1990) demonstrated that an increase in the
anaerobic sludge mass fraction (fxa) resulted directly to an increase in P removal in
biological nutrient removal (BNR) processes. The increase in P removal was
attributed to the increased conversion rate of RBCOD to VFAs in larger anaerobic
sludge mass fractions. Should nitrification and denitrification be included in the
treatment process, care should be taken when increasing the anaerobic sludge mass
fraction. Unilateral increase of the anaerobic sludge mass fraction results in the
decrease in the mass fraction of the aerobic and anoxic zones. This could lead to poor
overall system performance. Casey et al., (1994) reported that an increase in the size
of the anaerated mass fraction ((,,1), i.e. anaerobic (fxa) and anoxic (fxn) mass fractions,
above 50 % was not favourable since it would result in low FiM filamentous bulking
in biological nutrient removal (BNR) activated sludge systems.
107

IIIIIIIIIIIIIIIIIIIII
5.1.2 Number of Anaerobic reactors
Biological phosphorus removal is reported to increase with the increase in the number
of anaerobic reactors from 1 to 2 reactors in series (Wentzel et al., 1990). Increasing
the number of anaerobic reactors above 2 was reported to result in only slight
improvement in P removal (Wentzel et al., 1990). The improvement in P removal
with the increasing number of anaerobic reactors from 1 to 2 was said to be due to the
increased RBCOD conversion rate to VFAs. The RBCOD conversion to VFAs was
reported to take first order kinetic conversion rate. This view was supported by the
observations made in full-scale BNR systems, that plug flow operation of the
anaerobic reactor gave better P removal than that found in an anaerobic reactor
operated as a single completely mixed reactor (Wentzel et al., 1990).
5.1.3 Sludge Age
The effects of sludge age (8s) on biological P removal are complex. Phosphorus
removal in BNR systems was reported to increase with the increase in sludge age
from 8s = 1 day to 8s = 3 days, which was then followed by a decrease in P removal
with each increase in 8s above 3 days. The decrease in bio-P removal with increase in
8s above 3 days was reported by Wentzel et al., (1990) to be due to the decrease in the
active biomass and its associated P content that was wasted per day. This would tend
to indicate that BNR systems should be operated at shorter sludge ages. But the
sludge age can not be changed or reduced in an ad hoc fashion, since there is a
minimum sludge age that is necessary to obtain compete nitrification with selected
108

IIIIIIIIIIIIIIIIIIIII
unaerated sludge mass fractions (f,,"t)(Ekama et al., 1984). The requirements ofN, P,
and COD (Sti) removal should be balanced. (Wentzel et al., 1990).
5.1.4 Influent con (Sti) characteristics
Wentzel et al., (1990) reported (from pilot plant experiments) that an increase in the
influent COD of domestic wastewater resulted in an increase in phosphorus (P)
removal (P removed/Sa) efficiency. The observations of pilot plant experiments were
confirmed by the observations that were made in full-scale Biological Nutrient
Removal (BNR) processes. Wentzel et al., (1990) associated the increase in P
removal efficiency to an increase in RBCOD of the influent which resulted from a
general increase of influent total COD (Sti).
This part of the study (Phase 4) was aimed at optimising the process operation for
both COD and P removals based on the operation parameters examined in the
previous 3 phases.
109

IIIIIIIIIIIIIIIIIIIII
5.2 MATERJIALS AND METHODS
5.2.1 IBIOREACTOR. LAY-OUT AND OPERATION
The general reactor configuration of a two-stage modified Phoredox process was
maintained throughout the experimentation period. Only the anaerobic configuration
was altered to allow for more increase in the anaerobic mass fraction (fxa). The
anaerobic sludge mass fraction was calculated as follows:
Anaerobic sludge mass fraction (fxa) (%) = ( Vanaerobic ) X 100Vanaerobic+ Vaerobic
Where: Vanaerobic= Volume of sludge in the anaerobic reactor (1)
Vaerobic= Volume of sludge in the aerobic reactor (1)
Vanaeroboic+ Vaerobic= Vtotal= Total volume of sludge In the aerobic andanaerobic reactor
The l-Iitre conical flask shaped anaerobic reactor was removed and replaced by a 5-
litre rectangular polyethylene anaerobic reactor. The influent and mixed liquor flow
pattern remained unchanged, ie. the influent flow entered through the top of the
reactor whilst the returned sludge (S-recycle) and out-going mixed liquor flowed
through the bottom inlet and outlet, respectively.
110
IIIIIIIIIIIIIIIIIIIII
The reactor was seeded with 50 % mixed liquor from the aerobic zone and 50 % from
the anaerobic zone of Darvill Wastewater Works. The anaerobic sludge mass fraction
(fxa)was increased from 1 litre (during phase 3) to 3 litres (total volume of the system
increased from 5 litres to 7 litres), which represented the increase in the anaerobic
sludge mass fraction of23%, from 20% to 43 % of the total sludge in the process (3 I
Van17 I VtotaJ).
A new batch of effluent was collected in 25 litre containers from Sealake Industries
prior to commencement of this fourth phase of the study. The effluent samples were
stored in the cold room at between 0 °C and 4 °C after the necessary analyses were
completed to prevent deterioration due microbial and chemical activity.
The influent was prepared in a large influent container (25 litre) once every 4 days
through dilution of the industrial effluent with tap water to give the desired final COD
concentration. The influent supplementation was maintained at 1.75 gil through the
addition of sodium acetate trihydrate (CH3COONa.3H20). The hydraulic retention
time (HR T) remained unchanged at 24 hours by maintaining the influent flow rate
(Qi) at 7 lid. The sludge age was also kept at 15 days through daily wastage of
predetermined quantities of mixed liquor from the aerobic reactor. Aeration and
agitation of mixed liquor in the aerobic reactor was achieved by an aquarium air pump
pumping air through two diffusing nozzles. A potable laboratory scale dissolved
oxygen (DO) meter was used to measure the dissolved oxygen (DO) in the aerobic
reactor. The DO concentration in the aerobic reactor was maintained between 2.0 -
5.0 mg021l through on and off switching of the aquarium pump when necessary.
III

IIIIIIIIIIIIIIIIIIIII
The anaerobic reactor contents were maintained in a well mixed condition through the
operation of the magnetic stirrer unit at lowest speed (ca. 50 rpm) so as to simulate a
plug flow pattern. The treatment process was operated for 15 days without any
analyses being done to allow for acclimatisation of the biomass to the influent
substrate (ie. achieve steady state). After the acclimatisation period was completed the
system was then operated continuously for 82 days with sampling and analyses
conducted daily as was done during phase 3 of the study. Table 5.1 shows the
summary of the operation parameters of the treatment process during phase 4 of the
study.
Table 5.1: Summary of the process operating parameters during phase 4
PARAMETER VAlLUE
CODiJlllucllt (mg/I) 2650
P04-PiJlllucllt (mg/l) 600
TKNiJllluellt (mg/l) < 7.0
MlLSS (mgll) 4100 - 4200
FIM (kgCOD/kgMlLSS.d) 0.5
e (hrs) 24
8c(d) 15
Temp (OC) Room
pH 6.5 -7.5
v, (I) 7
o. (I/d) 7
112

IIIIIIIIIIIIIIIIIIIII
5.3 RESULTS
3000~--------------------=---------------------~
_2500~~~~~~~--~~--------------=-------~:::::::C)
E-§ 2000-f-----------------------~
:.;::;ns'--eQ)
g 1500+-----------------------r========~~o ~CODi(,)
8 --CODeU 1000+--------------------------------L------~~~ns-oI-
1 5 9 13172125 29 3337 4145 49 5357616569 7377 8Time (d)
Figure 5.1: Total influent and Effluent COD profiles for continuously operatedbiological treatment process at 0.5 FIM ratio (Phase 4)
CODi = COD concentration (rng/l) of filtered (0.45 urn) influent samples after dilution with tap water.
CODe = COD concentration (rng/l) of filtered (0.45 urn) effluent samples after biological treatment.
From day 1 to day 29, variation of influent COD strength was observed. Influent COD
strength varied between 2800 mgCOD/I and 2400 mgCOD/L
The COD removal efficiency remained stable despite the fluctuating influent COD
strength.
On average the COD removal efficiency remained 76 % throughout the process
operation.
113
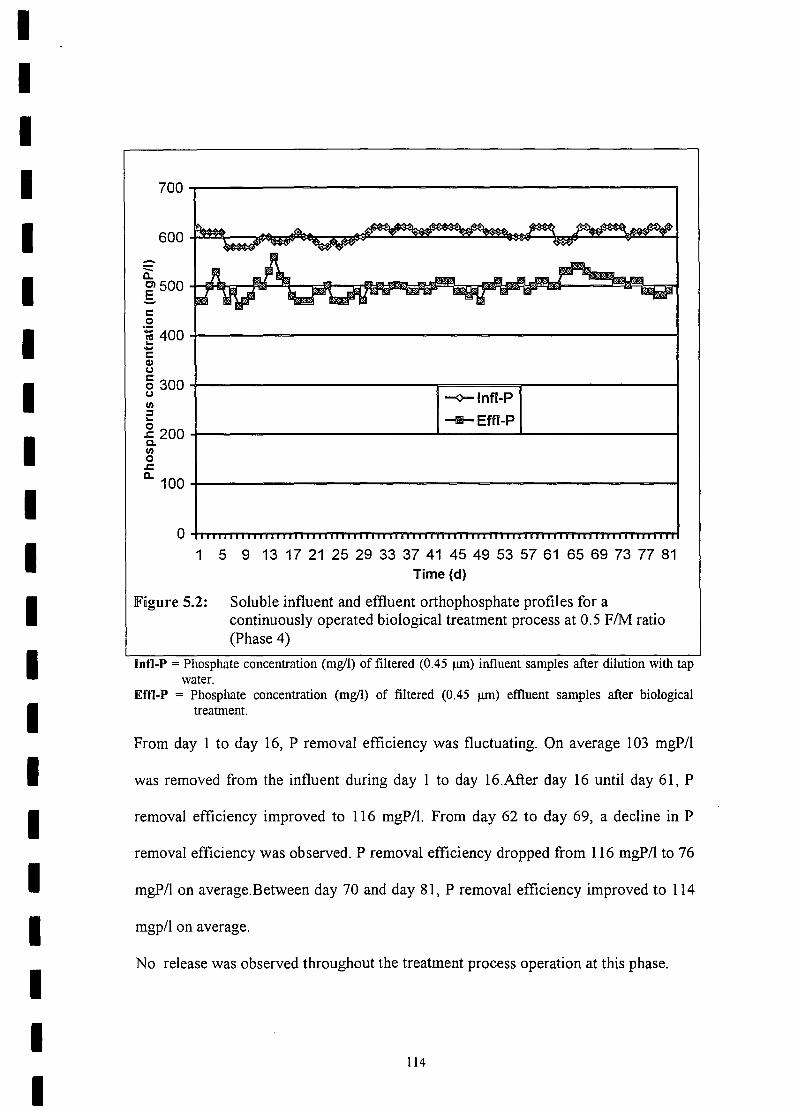
IIIIIIIIIIIIIIIIIIIII
700~---------=----------------------------------~
-:::::a..~500~~mr~~~~R-~~~~~~~~~~~~~---§.c:o~400+---------=------------=----------------------------~-c:Qjug300+--------------------------,=========r--------------~u -o-Infl-PII)
2 -Effl-P_g 200+- --L~~==...L- __I
c..II)
o.ca.. 100+--------------------------=--~------------------~
1 5 9 13 17 21 25 29 33 37 41 45 49 53 57 61 65 69 73 77 81Time (d)
Figure 5.2: Soluble influent and effluent orthophosphate profiles for acontinuously operated biological treatment process at 0.5 FIM ratio(Phase 4)
Intl-P = Phosphate concentration (mg/l) of filtered (0.45 JlIIl) influent samples after dilution with tapwater.
Eftl-P = Phosphate concentration (mg/l) of filtered (0.45 JlIIl) effluent samples after biologicaltreatment.
From day 1 to day 16, P removal efficiency was fluctuating. On average 103 mgP/I
was removed from the influent during day 1 to day 16.After day 16 until day 61, P
removal efficiency improved to 116 mgP/l. From day 62 to day 69, a decline in P
removal efficiency was observed. P removal efficiency dropped from 116 mgP/l to 76
mgP/I on average.Between day 70 and day 81, P removal efficiency improved to 114
mgpll on average.
No release was observed throughout the treatment process operation at this phase.
114
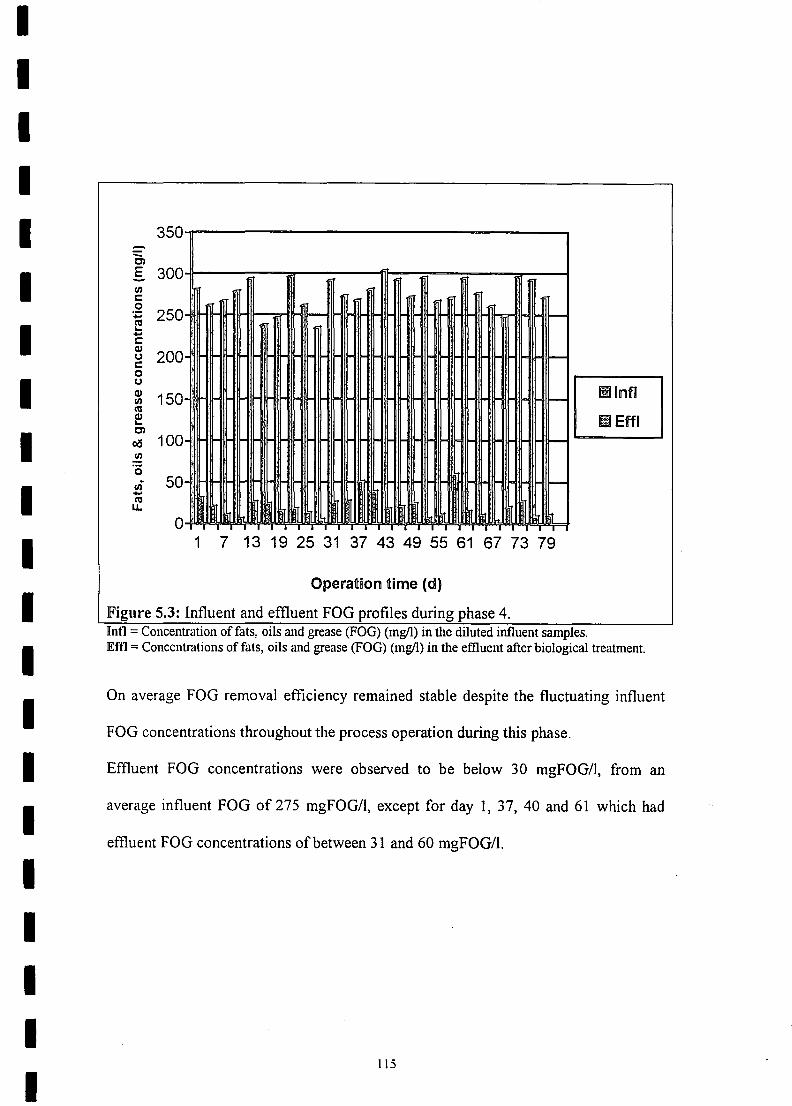
IIIIIIIIIIIIIIIIIIIII
350::::ClE 300-I/)c:0
250+=CIS...-ccu
200oe0(.)
cu 150I/)CIScu...Cl
oa 100..!!!0I/) 50-CISLL
o
~ r-
-IiII00fl
mEffl
_W wi t- l-
Ii! III M lit I I ru_I I I I
1 7 13 19 25 31 37 43 49 55 61 67 73 79
Operation time (d)
Figure 5.3: Influent and effluent FOG profiles during phase 4.Inn = Concentration of fats, oils and grease (FOG) (mgll) in the diluted influent samples.Effl = Concentrations of fats, oils and grease (FOG) (mgll) in the effluent after biological treatment.
On average FOG removal efficiency remained stable despite the fluctuating influent
FOG concentrations throughout the process operation during this phase.
Effluent FOG concentrations were observed to be below 30 mgFOG/I, from an
average influent FOG of 275 mgFOG/I, except for day 1, 37, 40 and 61 which had
effluent FOG concentrations of between 31 and 60 mgFOG/l.
115

IIIIIIIIIIIIIIIIIIIII
5.4 ][HSCUSSION
Increasing the anaerobic sludge mass fraction from 20 % to 43 % while maintaining a
0.5 kg COD/kg MLSS/d organic loading rate to the treatment process resulted in the
general improvement in the treatment process performance in terms of both COD
(Fig. 5.1) and P removal (Fig. 5.2).
The treatment process showed a consistent P removal efficiency which remained at a
total average of 17 %. This P removal is equivalent to the P uptake and removal of
104 mgPIl from the influent wastewater. The increase in P removal efficiency was
attributed to the increase in the anaerobic sludge mass fraction, which resulted in the
increased contact time of the influent substrate with the systems biomass.
The increased contact time between the substrate and the biomass is postulated to
have increased the fermentation rate of RBCOD to VFAs, which were subsequently
sequestrated by poly -P organisms. This increased contact time in the anaerobic
reactor is thought to have allowed more time for anaerobic, non-fermentative bacteria
to metabolise the slowly biodegradable COD content of the influent substrate into
readily biodegradable COD. The increased production of RBCOD made more
substrate to be available to the anaerobic-fermentative bacteria for conversion into
VFAs. Influent supplementation with 0.01 M sodium acetate may also have enhanced
the dominance of PAOs in the anaerobic reactor over the non-PAO heterotrophic
bacteria, as was postulated during phase 3 of this study.
116

IIIIIIIIIIIIIIIIIIIII
The improved P removal performance (Figure 5.2) was coupled to the observed
improvement in the total soluble COD removal performance (Figure 5.1) of the
treatment process. The COD removal improved from a total average of 64 % to a total
average of 76 %. There was no observed decline in the treatment process performance
over time, as was observed during the preceding experimental phases (Phases 2 and
3).
The improved overall treatment process performance may also be attributed to the
influent substrate chemical composition. The new effluent batch that was used during
phase 4 of this study had different chemical characteristics to the effluent batch that
was used during phases 2 a.nd 3 of this study. This effluent batch had an increased
PICOD ratio due to high concentrations of final effluent P and relatively low
concentrations of COD (combined or final edible oil effluent samples collected from
Sea Lake Industries). There was a noticeable decrease in sulphate concentrations of
the edible oil effluent (industrial effluent sample) batch that was used during this
experimental phase. Although the sulphate concentrations of the influent and effluent
were not monitored as part of this study, the previously observed conditions of
sulphate interference with the treatment process performance were not observed
during this experimental phase.
The lack of observed sulphate presence in the influent during the preceding
experimental phases, may confirm the postulated role of the sulphate reducing
bacteria towards the previously observed poor performance of the treatment process.
The mixed liquor of the treatment process remained dark brown (chocolate brown)
117

IIIIIIIIIIIIIIIIIIIII
throughout this experimental operational phase, a condition that is usually observed in
properly operated wastewater activated sludge treatment systems treating domestic
effluent (Lilley et al., 1997; Ekama et al., 1984)
The improved reduction of COD with the increased anaerobic sludge mass fraction
that was observed during this experimental phase, as opposed to the decreased COD
removal efficiency that was observed during phase 3, is thought to be due to the
increased activity of the anaerobic non-fermentative organisms and the fermentative
microorganisms in the increased anaerobic reactor volume.
The increased activity of the non-fermentative bacteria in the anaerobic reactor is
thought to have increased the rate of metabolism of slowly biodegradable COD to
RBCOD, which otherwise could have escaped from the anaerobic reactor to the
aerobic reactor and thus subsequently ending up in the final treatment process
effluent. This could explain the dominance ofpoly-P organisms over the heterotrophic
non-poly-P organisms with the increase in the anaerobic sludge mass fraction, as was
reported for phase 3 of this study, did not have an effect on the systems performance
in terms of COD removal.
The observed consistency of COD removal by the treatment process at a reduced
organic load rate of 0.5 kgCOD/kgMLSS/d is comparable to the observation that was
made by Eroglu et al., (1990) and Ozturk et al., (1990) from their edible oil effluent
treatment study using conventional activated .sludge treatment techniques. A
consistent BOD removal of 85 % was reported by Eroglu et al., (1990) and Ozturk et
118
IIIIIIIIIIIIIIIIIIIII
al., (1990) from their activated sludge system that was treating vegetable oil effluent
and was operated at an organic loading rate of 0.45 kgBOD/kgMLSS/d. The decrease
in sludge age from 30 days to 15 days is thought to have a minimal contribution in the
treatment process performance in terms of COD removal, since the COD removal
performance in 15 days and 30 days (8s) operated systems showed no significant
difference from each other (+1- 15% difference in performance efficiency).
The sludge age reduction from 30 days to 15 days is thought to have contributed to
the system performance improvement in terms of P removal efficiency. This
improvement in P removal efficiency with the decrease in sludge age (8s) is consistent
with the findings of Wentzel et al., (1990) who reported an increase in P removal
efficiency of the treatment process treating domestic wastewater. The reported
increase in P removal efficiency was said to decrease with the increase in sludge age
above 3 days (Wentzel et al., 1990). The difference in the observed performance
between the two processes (Wentzel et al., 1990 and that of this study) may be due to
the different nature of the influent substrate that was treated and the difference in
process design configurations.
Throughout the treatment process operation, the removal of fats, oils & grease (FOG)
was observed to be constant and consistent. Figure 5.3 shows that the removal
efficiency of FOG was always above 95 %. The reason for the consistent removal of
FOG is thought to be due to fatty material being adsorbed rather then absorbed by the
bacterial biomass.
119
IIIIIIIIIIIIIIIIIIIII
The operating conditions in the fourth phase seems to be the optimal and ideal
conditions required for successful treatment of edible oil effluent for both COD and P
reduction from the final effluent (combined edible oil effluent streams at the final
discharge point to the municipal sewerage system) using biological techniques.
120

IIIIIIIIIIIIIIIIIIIII
CHAPTER 6
GENERAJL CONCJLUSITONS AN]!))RECOMMEN]!))A TITONS
From the above experiments and other experiments reported from the literature, it is
clear that edible oil effluents can be successfully treated using biological methods as a
form of pre-treatment. Although the total effluent COD (Sti) values were considerably
reduced during the present study, the effluent would require further polishing
treatment to ensure that the regulatory discharge standards or municipal by-laws are
successfully adhered to. The edible oil effluent requires dilution with domestic
wastewater prior to its subjection to activated sludge treatment. Dilution of the edible
oil effluent with domestic wastewater will ensure that the final effluent characteristics
are favourable for biological remediation techniques through the balancing of the
TKN/COD ratio, P/COD ratio and RBCODI s, ratios.
Effluent parameters are strongly dependent on the quality and type of crude oil and on
the refining method (physical or chemical/caustic refining) being currently employed
for that particular batch of crude oil being refined. Additional P removal from the
final effluent using chemical precipitation methods may be required after the final
effluent has been subjected to on site biological treatment, prior to its discharge to the
municipal sewer system. This would reduce the shock loading to the municipal
treatment works.
121
IIIIIIIIIIIIIIIIIIIII
It is recommended that industrial establishments with additional space available
should have an anaerobic pre-treatment process installed upstream of the activated
sludge treatment process, prior to the final edible oil effluent mixing with the
domestic sewage. Installation of an anaerobic treatment process upstream of the
activated sludge treatment process will result in the reduction of sulphate
concentrations and COD load entering the activated sludge process. The proposed set-
up will reduce the concentration of slowly biodegradable COD, which will be later
replaced by more RBCOD from the domestic sewage after mixing. This will result in
the increased RBCODIP ratio of the influent, thus resulting in improved overall
treatment process performance in terms of removal efficiency.
It is further proposed that the contribution and effects of sulphates and FOG
concentrations in the final edible oil effluent be investigated in the laboratory systems.
These investigations should be accompanied by a detailed microbiological study of
the biomass characteristics so as to determine the principal organisms that are
responsible for treatment of edible oil effluent.
The presence of high loads of phosphates in the effluent could be addressed by
changing the use of phosphoric acid during the degumming phase of crude oil
refining. Phosphoric acid could be replaced with acetic acid, which more readily
biodegradable that the former. There is further information in the literature on the use
of acetic acids as an alternative degumming agent to phosphoric acid. The reduction
in the phosphate content of the edible oil effluent would result in less complex
treatment methods being required for the treatment of edible oil effluent.
122
IIIIIIIIIIIIIIIIIIIII
Optimisation of the OAF unit operating parameters needs to be further investigated
which will result in increased removal of solids, FOG and COD from the effluent
stream prior to its onsite treatment.
123
IIIIIIIIIIIIIIIIIIIII
References
Abou-Elela, S. I. And Zaher, F. (I998). Pollution prevention in the oil and soap
industry: A case study. Water Science and Technology 38 (4-5), 139 - 144.
Aitken, M. D., Heck, P. E., Alvarez-Cohen, L., Grimberg, S. 1. and Stringfellow, W.
1. (1994) Activated sludge and other aerobic suspended culture processes. Water
Environment Research 66 (4) 325 - 336.
Atkinson, B. A. (1999). Identification of polyphosphate accumulating bacteria from
pilot and full scale nutrient removal activated sludges. M Tech. Dissertation
submitted to the Faculty of Engineering and Applied Sciences, Technikon Natal,
Durban.
Bactens, D., Vanrolleghem, P. A., van Loosdrecht, M. C. M. and Hosten, H. (1999)
Temperature effects in bio-P removal. Water Science and Technology 39 (1), 215 -
225.
Banister, S. S. and Pretorius, W. A. (1998). Optimisation of pnmary sludge
acidogenic fermentation for biological nutrient removal. Water Sa, 241,35 - 41.
Beccari, M., Majone, M. and Torris, L. (1998) Two - reactor systems with partial
phase separation for anaerobic treatment of olive oil mill effluents. 19th IA WQ
Biennial International Conference, Vancouver - Canada 29 - 56.
Bdjanovic, D., van Loosdrecht, M. C. M., Hooijmans, C. M., Mino, T., Alaerts, G. 1.
and Heijnen, 1. 1. (1997). Bioassay for glycogen determination in biological
phosphorus removal systems. In: Proceedings of the 2nd International Conference on
Microorganisms in Activated Sludge and Biofilm Processes, July 21 - 23, Berkeley,
California, USA, 335 - 342.
124

IIIIIIIIIIIIIIIIIIIII
Bitton, G. (1994). Wastewater Microbiology. John Wiley & Sons, Inc., Publication,
USA.
Bolitho, V. N. (1976). Controlling the access of nutrient removal from point and
defused sources with special reference to PWV region. Water SA, 2(4), 145 - 149.
Bond, P., Hugenholtz, P., Keller, 1. and Blackall, L. (I995) Bacterial community
structures of phosphate removing and non phosphate removing activated sludge from
sequencing batch reactor. Applied Environmental Microbiology 61, 1910 - 1916.
Borja, R., Martin, A, Alonso, V. Garcia, I. And Bank, C. (1995) Influence of deferent
aerobic pre-treatment on the kinetics of anaerobic digestion of olive oil mill
wastewater. Water Research 29 (2) 489 - 495.
Buchan, L. (I 983). The possible biological mechanism of phosphorus removal. Water
Science and Technology. 15 (3 - 4), 87 - 103.
Buchan, L. (1980). The location and nature of accumulated phosphorus in activated
sludge. Doctor of Science Thesis, University of Pretoria, South Africa.
Case, T. 1. (1996). Unit Treatment Process in Water and Wastewater Engineering.
John Wiley & Sons, England.
Casey, T. G., Wentzel, M. c., Ekama, G.A, Loewenthal, R. E. and Marais, G. v R.
(1994) An hypothesis for the cause and control of anoxic - aerobic (AA) filament
bulking in nutrient removal activated sludge systems. Water Science and Technology
29 (7) 203 - 212.
Casey, T. G., Ekama, G. A., Wentzel, M. C. and Marias G. v. R. (I995). Filamentous
organism bulking in nutrient removal activated sludge systems. Paper 1: A historical
overview of cause and control. Water SA, 21 (3), 231 - 238.
125

IIIIIIIIIIIIIIIIIIIII
Chuang, S. H., Ouyang, C. F., Yuang, H. C. and You, S. 1. (1998) Evaluation of
phosphorus removal in anaerobic - anoxic - aerobic systems - via Polyhydroxy
alkonoates measurement. Water science and Technology 38 (1), 107 - 114.
Chutter, F. M. (1990). Evaluation of the impact of 1 mg/l phosphate standard on the
water quality and the trophic status of Hartbeespoort Dam. Water and Sewage
Effluents, 10 ( 1),29 - 33.
Comeau, Y., Oldham, W. K. and Hall, K. 1. (1987) Dynamics of carbon reserves in
biological dephosphatation of wastewater. In "Biological phosphate removal from
wastewaters", Advances in Water Pollution Control 4, R. Ramadori (Eds). Pergamon
Press, Oxford, 39 - 55.
Dalzell, 1. M. (1994) Food industry and the environment. Practical Issues and Cost
Implications. Blackie Academic and Professional. London, U. K.
Danesh, S. and Oleszkiewics, 1. A. (1997) Volatile fatty acid production and uptake in
biological nutrient removal systems with process separation. Water Environment
Research. 69 (6), 1106 - 1111.
Dart, C. (1974). Wastewaters from the manufacture of edible oils and margarine.
Proceedings of Symposium on Treatment of Wastes from Food and Drink Industry.
Newcastle upon Tyne, United Kingdom.
Department of Water Affairs and Forestry. (1997). White paper on water policy.
Internet URL http:/ ..www.policy.org.za/govtlwhite-paper.s:/water.htm.
Dillon, P. 1. and Molot, L. A. (1996). Long term phosphorus budget and examination
of steady state mass balance model for central Ontario Lakes. Water Research, 20
(10) 2273 - 2280.
126
IIIIIIIIIIIIIIIIIIIII
Dold, L. P., Wentzel., M. C., Billing, A E., Ekama, G. A and Marais G. v R. (1991).
Activated sludge simulation programs. Published by: Water Research Commission, P.
O. Pox 824, Pretoria, 0001, South Africa.
Droste, R. L. (1997) Theory and practice of water and wastewater Treatment. John
Wiley & Sons, Inc. 545 - 621.
Eckenfelder, W. W. and Musterman, 1. L. (1995). Activated sludge treatment of
industrial wastewater. Technomic Publishing Co. Inc.: Lancaster.
Ekama, G. A, Marais G. v R., Siebritz I. P., Pitman, A R., Keay, G. F. P., Buchan, L.
Gerber, A and Smollen, M. (1984) Theory, design and operation of nutrient removal
activated sludge process. Water Research Commision Report No. 9411066, Pretoria,
South Africa.
Ekama G. A, Dold, P. L. and Marais G. v R. (1986) Procedures for determining
influent COD fractions and the maximum specific growth rate of heterotrophs in
activated sludge systems. Water Science and Technology. 81, 91 - 114.
Ekama, G. A and Wentzel, M. C. (1999). Difficulties and developments in biological
nutrient removal technology and modelling. Water Science and Technology 39 (6), I-
ll.
Eroglu, v., Oztuk, I., San, H. A. and Demir, I. (1990) Comparative evaluation of
treatment alternatives for wastewater from edible oil refining industry. Water Science
and Technology. 22 (9), 225 - 234.
Erten, M.U. (1993) An industrial toxicity reduction evaluation for an oily wastewater
treatment plant. Proceedings of the 4ih Industrial Waste Conference. Purdue
University, West Lafayette.
127

IIIIIIIIIIIIIIIIIIIII
Fuhs, G. W. and Chen, M. (1975). Microbiology basis of phosphate removal in the
activated sludge process for the treatment of wastewater. Microbial Ecology, 2, 119-
138.
Grant, P. E. (1980). Treatment of fatty effluents. In: Food Industry Wastes: Disposal
and Recovery. A. Herzka and R. G. Booth (Eds). Applide Science Publishers. London
and New Jersey.
Gray, N. F. (1989) Biology of wastewater treatment. Oxford University Press.
Hanaki K., Matsuo, T. and Nangase, M. (1981) Mechanism of inhibition caused by
long chain fatty acids in anaerobic digestion process. Biotechnology and
Bioengineering 23 1591 - 1610.
Horan, N. 1. (1991). Biological Waste Water Treatment Systems: Theory and
Operations. John Wiley & Sons Ltd., England.
Hui, H. Y. (1996). Edible oil and fat products: processing technology. In Bailey's
Industrial Oil and Fat Products. John Wiley, New York.
Joska, M. A. and Bolton, 1. (1994). Preliminary investigation into algal weeds in
inland waters. Water Research Commission Report No. 426/1/94, Pretoria, South
Africa.
Komatsu, T., Hanaki, K. and Matsuo, T. (1991) Prevention of lipid inhibition in
anaerobic processes by introducing two - phase system. Water Science and
Technology 23 1189 - 1200.
Kroger, D. A. (1981). Point and diffuse source of phosphorus loading of rivers and
impoundments in the Durban - Pietermartzburg region. MSc. Thesis submitted in the
Department of Geography, University of Natal, Durban, South Africa.
128

IIIIIIIIIIIIIIIIIIIII
Kuba, T., Smolder, G. van Loosdrecht M. C. M. and Heijnen, 1. 1. (1993) Biological
phosphorus removal from wastewater by anaerobic - anoxic sequencing batch reactor.
Water Science and Technology. 27 (5-6),241 - 252.
Kuba, T., Wachtmeister A, van Loosdrecht, M. C. M. and Heijnen, 1. 1. (1994) Effect
of nitrate on phosphorus release in biological phosphorus removal systems. Water
Science and Technology 30 (6) 263 - 269.
Lens, P. N. de Poorter, M. P., Cronenberg, C. C. and Verstaete, W. H. (1995) Sulfate
reducing and methane producing bacteria in aerobic wastewater treatment systems.
Water Research 29 (3) 871 - 880.
Lilley, I. D., Pybus, P. 1. and Power, S. P. B. (1997). Operating manual for biological
nutrient removal wastewater treatment works. Water Research Commission Report
No. TT 88/97, Pretoria, South Africa.
Lotter, L. H. and Murphy, M. (1985). The identification of heterotrophic bacteria in
activated sludge plant with particular reference to polyphosphate accumulation. Water
SA, H (4),179 -184.
Loots, P. A., Oellermann, R. A., Pearce, K. and Saayman, G. B. (1994). Pilot studies
on phosphate crystallization in biological wastewater treatment systems. Water
Research Commission Report No. 366/1/94.
McDermott, G. N. (1982) Environmental aspects of animal and vegetable oil
processing. In: Bailey'S Industrial Oils and Fat Products, Volume 2. Swern, D. (Ed.),
Wiley, New York. 527 - 586.
Metcalf and Eddy. (1991). Wastewater engineering: Treatment, disposal and reuse. 3rd
Ed. McGraw Hill, Inc: NY.
129
IIIIIIIIIIIIIIIIIIIII
Mino, T., van Loosdrecht, M. C. M. and Heijnen, 1. 1. (1998). Microbiology and
biochemistry of the enhanced biological phosphate removal process. Water Research,
32 (11), 3193 - 3207.
Murnleitner, E., Kuba, T., van Loosdrecht, M. C. M. and Heijnen, 1. 1. (1999) An
integrated metabolic model for the aerobic and denitrifying biological phosphorus
removal. Internet URL htqJ:.-:'mehers. cum. atlll1ur.'[JClper/paper.htm.
Novotny, G. (1998). Wastewater characterization for evaluation of biological
phosphorus removal wastewater fraction. Internet URL
http: !:\vww.dlll'.stafe. wi. US.'()fg'waler/I'1Jm/lvw,'biophosdfracl. hfm, 1 - 18.
Orhon, D. and Artan, N. (1994) Biological excess phosphorus removal. In: Modelling
oj Activated Sludge Systems. Technomic Publishing Company, Pennsylvania, USA.
471 - 535.
Orhon, D., Tasli, R. and Sozen, S. (1998). Experimental basis of activated sludge
treatment for industrial wastewaters. The state of the art. Fourth International
Symposium on waste management problems in Agro-industries, 23 - 25 September.
Istanbul - Turkey.
Orupol, K., Hellat, K. and Tenno, T. (1998) Estimation of treatability of different
industrial wastewater by activated sludge oxygen uptake measurements. lhInternational symposium on waste management problems in Agro-industries,
Istanbul-Turkey 69-74.
Ozturk, I., San, H. A. and Eroglu. (1990). Pilot and full scale treatability studies on
wastewater from an edible oil refining industry. 44th Purdue Industrial Waste
Conference Proceedings. Lewis Publishers, Inc., Chelsea, Michigan 48118, 769 -
776.
130

IIIIIIIIIIIIIIIIIIIII
Pelczar, M. 1., Chan, E. C. S. and Krieg, N. R. (1993)Microbiology - Concepts and
Applications. McGraw-Hill, Inc. United States of America.
Pitman, A. R., Trim, B.C. and van Dalsen, L. (1988). Operating experience with
biological nutrient removal at the Johannesburg Bushkoppie works. Water Science
and Technology, 20 (4 - 5), 51 - 62.
Pitman, A. R. (1991). Design considerations for nutrient removal plants. Water
Science and Technology, 23 (4 - 6), 781 - 790.
Punrattanasi, W. and Randall, W. (1998) The effect of the influent COD/TP ratio
upon the performance of biological nutrient removal processs. 19th IAWQ Bienial
International Conference, Vancouver - Canada, 292 - 298.
Rudd, R. P. (1979). The necessity for the promulgation of standards for the limitation
of nutrients in effiuent in sensitive areas in South Africa. In: Nutrient Removal from
Municipal Effluents: A Technology Transfer Seminar. 1ih May. Council of Scientific
and Industrial Research, Pretoria, South Africa, 2 - 7.
Rustrian, E., Delgenes, 1. P., Bernet, N. and Moletta, R. (1999). Acidogenic activity:
Process of carbon source generation for biological nutrient removal. Water Science
and Technology, 40 (8), 25 - 32.
Sedlak, I and Richard, 1. (Ed.). (1991) Phosphorus and nitrogen removal from
municipal wastewater. Principles and Practices. 2nd Ed. Lewis Publishers. USA.
Seng, W. C. (1980) Wastewater treatment for edible oil refineries. Journal of
American Oil Chemistry SOCiety. 57 (12), 926A - 928A.
Sidat, M., Bux, F. and Kasan, H. C. (1999). Polyphosphate accumulation by bacteria
isolated from activated sludge. Water SA, 25 (2), 175 - 179.
131

IIIIIIIIIIIIIIIIIIIII
Simpkins, M. 1. (1979). The present status of research on phosphorus removal in
South Africa, with particular reference to biological processes on nutrient removal
from Municipal effluents. Proceedings oj Seminar by the Council of SCientific and
Industrial Research, 17 May, Pretoria, South Africa, 50 - 59.
Standard Methods. (1989) Standard methods for examination of water and
wastewater, 1ih edition, American Public Health Associations, American Water
Works Association, Water Pollution Control federation, Washington D. C.
Steffen, Robertson and Kirsten Inc. (1989). Water and wastewater management in the
edible oil industry. Water Research Commission Project No. 145/TT 40/89.
Starkenburg, W., van Rensink, 1. H. and Rijs, G. B. 1. (1993). Biological P-removal:
State of the art in Netherlands. Water Science and Technology, 27 (5 - 6),317 - 323.
Sokolovic, S., Secrov-Sokolovic, R. and Sevic, S. (1992). Two-stage coalescer for
oil/water separation. Water Science and Technology, 26 (9 - 11), 2073 - 2076.
Sotoh, H., Barney, W. D., Koch, F. A., Oldham, W. K., Mino, T. and Matsuo, T.
(1996). Anaerobic substrate uptake by the enhanced biological phosphorus removal
activated sludge treating real sewage. Water Science and Technology, 34 (1 - 2), 9 -
16.
Sutton P. M., Mishra, P. N. and Crawford, P. N. (1994) Combining biological and
physical processes for treatment of oily wastewaters. International Biodeterioration
and Biodegradation. 33, 2 - 21.
Tano-Debrah, K., Fukuyama, S., Otonari, N., Taniguchi, F. and Ogura, M. (1999). An
inoculum for the aerobic treatment of wastewaters with high concentrations of fats
and oils. Bioresource Technology, 69, 133 - 139.
132

IIIIIIIIIIIIIIIIIIIII
Tunay, 0., Samsunlu,A., Ozturk, Z. and Alp, K. (1998). Characterization and control
of olive oil production wastewaters. 4th International Symposium on Waste
Management Problems in Agro - industries. September 23 - 25, Istanbul - Turkey.
Ubisi, M. F., Jood, T.W., Wentzel, M. C. and Ekama, G. A. (1997) Activated sludge
mixed liquor heterotrophic active biomass. Water SA. 23 (3), 239 - 248.
Wang, 1. C. and Park 1. K. (1998). Effect of water composition on microbial
populations in biological phosphorus removal processes. Water Science and
Technology 38 (1) 159 - 166.
Wanner, 1. (1997). Microbial population dynamics in biological wastewater treatment
plants. In: Microbial Community Analysis: The Key to the Design of Biological
Wastewater Treatment systems. Cloete, T. E and Moyima, N. Y. O. (Ed.). Published
by International Association on Water Quality, United Kingdom.
Wentzel, M. C., Lotter, L. H., Ekama, G. A., Loewenthal, R. E. and Marais, G. v. R.
(1986). Metabolic behaviour of Acinetobactor spp. in enhanced biological phosphorus
removal- A biochemical model. Water SA, 12 (4),209 - 224.
Wenzel, M. c, Loewenthal, R. E., Ekama, G. A. and Marais, G. v. R. (1988).
Enhanced polyphosphate organism cultures in activated sludge systems - Part 1:
Enhanced culture development. Water SA, 14, 81 - 92.
Wentzel, M. c., Dold, P. L., Ekama. G. A. and Marais, G. v. R. (1990). Biological
excess phosphorus removal- Steady state process design. Water SA, 16 (1), 29 - 48.
Wentzel, M. C., Lotter, L. H., Ekama, G. A., Loewenthal, R. E. and Marais, G. v. R.
(1991). Evaluation of biological models for biological excess phosphorus removal.
Water Science and Technology, 23 (4 - 6), 567:- 576.
133

IIIIIIIIIIIIIIIIIIIII
Wentzel, M. c., Ekarna, G. A. and Marais, G. v. R. (1992). Process and modelling of
nitrification denitrification biological excess phosphorus removal systems. Water
Science and Technology, 25 (6), 59 - 82.
Wentzel, M. c., Mbewe, A. and Ekama, G. A. (1995) Batch test for measurement of
readily biodegradable COD and active organism concentrations in municipal
wastewaters. Water SA 21 (2), 117 - 124.
Wentzel, M. C. and Ekama, G. A. (1997). Principles in the design of single sludge
activated sludge systems for biological removal of carbon, nitrogen and phosphorus.
Water Environment research, 69 (7), In press.
Department of Water Affairs. (1986). Management of the Water Resources of the
Republic of South Africa. CTP Book Printers, Cape Town, South Africa.
134
IIIIIIIIIIIIIIIIIIIII
APPENDKCES
Appendix 1
Chemical Oxygen Demand (COD) determination.
Introd uction:
The estimation of the oxygen requirement of organic matter by determination of oxygen
consumed from boiling acidic potassium dichromate solution has advantages over
measurement of permanganate value. A much higher degree of oxidation of organic
matter is achieved which means that the scope for serious errors is reduced. It should be
noted that COD is not the measure of organic carbon, though the same chemical reactions
are invo lved.
Principle of the Method:
The sample is heated to boiling level with potassium dichromate and silver sulphate
catalyst in strong sulphuric acid. The absorbance of the resultant coloured solution is
measure using a photometer.
Method:
Spectroquant analysis method 14541 for 100 - 1500 mg/l COD and 14555 for 500 -
10000 mg/l COD using SQ 118 Merck photometer.
A
IIIIIIIIIIIIIIIIIIIII
Appendix 2.
Ortho-phosphate (lP04-l?) determination.
Introduction:
Phosphate in water and wastewater may be present in two main forms: the organically
bound phosphate, and the inorganic phosphate. The inorganic phosphate is further
divided into two main forms based on its reactivity and its availability for utilization as a
nutrient source by plants. The polyphosphate which is a polymeric form is inert in water
and is not available as a plant nutrient. Yet the orthophosphate form on the other hand, is
readily available in water and wastewater as a plant nutrient. This is the form of
phosphate that needs to be monitored and controlled to prevent eutrophication of water
resources.
Principle of the Method:
The sample is mixed with a reagent that reacts with the orthophosphate group in water,
which produces a distinct yellow solution the absorbance of which can be measured using
a spectrophotometer.
Method:
The samples were first diluted with deionised water to a desired concentration range.
Spectroquant analysis method 14842 for 1.0 - 30.0 mg/I P04-P using SQ 118 Merck
photometer.
B
IIIIIIIIIIIIIIIIIIIII
Appendix 3
Total Nitrogen (TKN) determination.
Introduction:
Nitrogen in wastewater appears both as oxidized nitrogen and reduced forms. Both the
ammonium (free and saline) and the organic forms are present in wastewater and
constitute the total nitrogen.
Principle of the Method.
The sample is mixed with reagent 1 in the presence of a catalyst. After heating in a
thermal block, the sample is mixed with the second reagent, which results in immediate
colour development. The resultant coloured solution is measure using a photometer.
Method:
Spectroquant analysis method 14537 for 0.5 - 15.0 mg/l N usmg SQ 118 Merck
photometer.
c

IIIIIIIIIIIIIIIIIIIII
Appendix 4
Free and Saline Ammonia (NH/)
Introduction:
The free and saline ammonium nitrogen is readily available in wastewater as a plant
nutrient that is responsible for eutrophicaction phenomenon. Free and saline ammonia
may result in wastewater from biodegradation of organic nitrogen. Hence it is important
to determine both the organic and ammonium nitrogen in wastewater in order to control
and prevent the mineralization of water resources.
Principle of the Method:
Ammonia is quantitatively separated from other forms of nitrogen in wastewater through
sample distillation under alkaline conditions. The ammonia is then determined
colorimetrically after addition of Nessler's reagent.
Method:
Spectroquant analysis method 14739 for 0.01 - 2.0 mg/l NH4-N using SQ 118 Merck
photometer.
D
IIIIIIIIIIIIIIIIIIIII
Appendix 5.
Nitrate (NOJ-) determination.
Introduction:
Nitrate is the oxidized form of nitrogen. It is not usually found in domestic wastewater
influents. But industrial wastewater may contain appreciable amount of nitrates that
results from the oxidation of the total nitrogen in wastewater due to chemical processes
and harsh environmental conditions that industrial water may be subjected to during
manufacturing and processing. As a result it is important to test for this form of nitrogen
from industrial effluents although it is not necessary to do the same for domestic
wastewater.
Principle of the Method:
The sample is reacted with a colour-forming reagent in the presence of a strong oxidizing
acid. The resultant coloured solution is measured against the blank using a photometer.
Method:
Spectroquant analysis method 14542 for 2.0 - 80.0 mg/I N03- using SQ 118 Merck
photometer.
E
IIIIIIIIIIIIIIIIIIIII
Appendix 6
Sulphate (SO/-) determination.
Introduction:
Sulphate is widely distributed In nature and may be present in natural water in
concentrations ranging from a few to several thousand milligrams per litre. Mine
drainage waste and some selected chemical industrial wastewaters may contribute large
amounts of point source sulphate deposition.
Principle of the Method.
The sample reacts with Barium chloride at low pH that results in the formation of Barium
sulphate. At high pH excess Barium reacts with Methylthymol blue to produce a chelate.
The uncomplexed Methylthymol blue is gray. The gray uncomplexed Methylthymol blue
indicates the concentration of sulphates.
Method:
The samples were first diluted with deionised water to a desired concentration ranges.
Spectroquant analysis method 14564 for 100 - 1000 mg/l SO/- using SQ 118 Merck
photometer.
F
IIIIIIIIIIIIIIIIIIIII
Appendix 7
Total suspended solids CTSS) determination.
Introduction:
Solids refer to matter suspended or dissolved in water or wastewater. Solids may affect
water or effluent quality adversely in a number of ways. Highly mineralised waters are
unsuitable for many industrial applications. Waters high in suspended solids may be
esthetically unsatisfactory for such purposes as bathing. Hence solids analyses are
important in the control of biological and physical wastewater treatment processes and
for assessing compliance with regulatory limits.
Principle of the Method:
A well-mixed sample is filtered through a weighed standard glassfiber filter and the
residue retained on the filter is dried to a constant weight at 103 to 105°C. The increase
in weight of the filter represent the total suspended solids.
Method:
The samples were analysed in duplicates.20 ml of sample was analysed according to
Standard Method 2540 D (Standard Methods, 1989) for total suspended solids dried at
103 - 105°C. All the calculations were according to the given method.
G
IIIIIIIIIIIIIIIIIIIII
Appendix 8
Fats, oils and grease (FOG) determination.
Introduction:
In determination of fats, oils and grease, an absolute quantity of a specific substance is
not measured. Rather, groups of substances with similar physical characteristics are
determined qualitatively on the basis of their common solubility ill
trichlorotrifluoroethane or in diethyl ether. FOG is any material recovered as a substance
soluble in trichlorotrifluoroethane or in diethyl ether. It includes other solvent extractable
material from acidified samples such as sulfur compounds, certain organic dyes, and
chlorophyll) and not volatilised during the test. This method of FOG analysis is suitable
for biological lipids and mineral hydrocarbons, and is also suitable for most industrial
wastewaters or treated effluents containing these material.
Principle of the Method:
Soluble metallic soaps are hydrolysed by acidification. Any oils and solids or viscous
grease present are separated from the liquid samples by filtration. After extraction in the
Soxhlet apparatus with trichlorotrifluoroethane or diethyl ether, the residue remaining
after solvent evaporation is weighed to determine the Fats, oils and grease content.
Compounds volatilised at or below 103 DCwill be lost when the filter is dried.
H

IIIIIIIIIIIIIIIIIIIII
Appendix 8 continue
Method:
Diethyl ether was used as a solvent instead of trichlorotrifluoroethane. The analysis was
done in duplicate. 100 ml effluent samples were analysed using Standard Method 5520 D
(Standard Methods, 1989). The calculations were done according to the given method.
IIIIIIIIIIIIIIIIIIIII
Appendix 9
Alkalinity as CaC03 determination
Introduction:
The methods for the determination of alkalinity in natural or treated waters are also used
for wastewaters. Although methods for the relative proportions of hydroxide, carbonate
and hydrogen carbonate alkalinity are given, they are rarely required in the case of
wastewaters. Colour and turbidity in the sample make the use of indicators difficult or
impossible, hence the simplest alternative is to use an electrometric method.
Principle of the Method:
The alkalinity of natural or treated waters is usually due to the presence of hydrogen
carbonate, carbonate and hydroxide compounds of calcium, magnesium, sodium and
potassium. The total alkalinity is determined by titration of the sample to the end-point of
a suitable indicator having a colour change at pH 4.5. titration to an end-product of ph 8.3
determines approximately the alkalinity contributed by hydroxide and half of carbonate
present (pH 8.3 is approximately that of a dilute hydrogen carbonate solution). The use of
these two titrations enables an approximate calculation to be made of the concentrations
of the three forms of alkalinity.
Method:
The samples were analysed in duplicate. 100 ml filtered samples were place in a conical
flask. The conical flask was placed over a white surface. 3 drops of phenolphthalein
J
IIIIIIIIIIIIIIIIIIIII
indicator were added to the solution. The pink sample was titrated with 0.1 N sulphuric
acid solution to colourless end-point. Few drops of methyl orange indicator were added to
the solution. The yellow coloured solution was titrated with the standard acid until the
first perceptible colour change towards orange was achieved.
Calculation of results:
Alkalinity for 100 ml sample as mg CaC03/l = Volume of 0.1 N sulphuric acid (ml) x 50
K

IIIIIIIIIIIIIIIIIIIII
Appendix 10
Effluent analysis results from June 1998 to October 1998. Sampling was done once amonth from Sealake Industries and the composite wastewater samples were collected in 1hour interval for three hours a day.PARAMETER JUN. JUl. AUG. SEPT. OCT.
pH1hr 5.89 10.6 5.71 7.10 8.262hr 5.81 8.76 6.80 7.79 7.613hr 4.95 10.04 6.99 8.05 9.93Average 5.55 9.80 6.50 7.70 8.60
COD (mg/I)1hr 7680 8710 1025 7240 117002hr 7590 8220 1270 7590 118103hr 7620 7550 1170 7370 11779Average 7630 8160 1155 7400 11763P04-P (mg/I)1hr 560 1010 1680 4510 21802hr 590 910 1640 4320 21303hr 500 1140 1660 4370 2110Average 550 1020 1660 4400 2140SO/' (mg/l)1hr 5760 5280 3410 5690 12102hr 4980 5690 3470 5730 11703hr 5910 5830 3530 5980 1400Average 5550 5600 3470 5980 1210TKN (mg/l)1hr 6.08 3.21 6.73 8.67 4.362hr 6.75 4.87 6.54 7.30 5.813hr 7.96 6.26 7.19 6.98 4.77Average 6.93 4.78 6.82 7.65 4.98NH4-N1hr 0.98 0.63 1.99 1.21 2.092hr 1.26 0.41 1.39 1.15 3.603hr 1.51 0.76 2.62 1.09 2.38Average 1.25 0.60 2.00 1.15 2.69TSS (mg/l)1hr 281.1 379.3 102.7 265.8 340.22hr 275.3 381.9 134.1 274.2 317.53hr 239.2 387.8 97.7 255.6 309.2Average 265.2 383.0 111.5 265.2 322.3FOG (mg/l)1hr 248.8 109.7 324.8 630.8 308.12hr 251.5 102.8 352.1 617.2 329.23hr 266.5 120.8 342.8 581.4 319.3Average 255.6 111.1 339.9 627.8 308.2Alkalinity asCaCO;J11hr 531 492 1730 649 7782hr 542 483 1670 625 7423hr 487 465 1760 616 778Average 520 480 1720 630 766
L
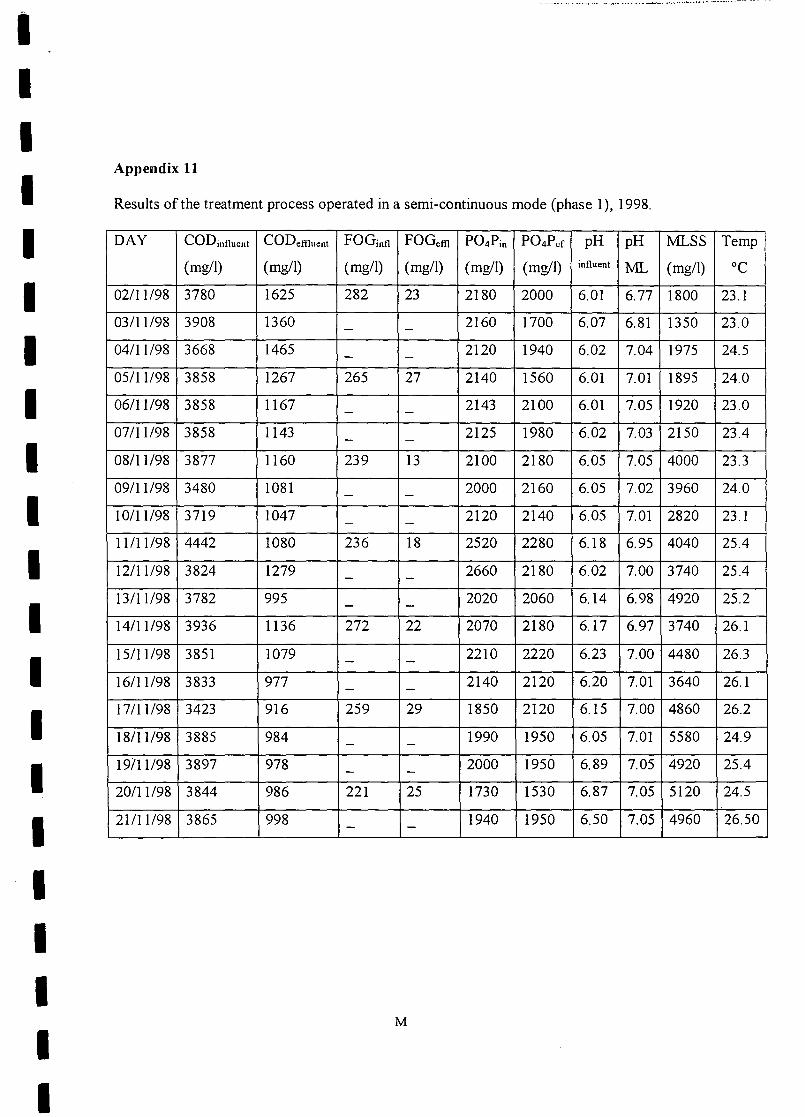
IIIIIIIIIIIIIIIIIIIII
__ ~ __ • - • _ ••• ,_ - ...._ - ~ - • ~_ ...... ""...... ~_ ._.'YO"_
Appendix 11
Results of the treatment process operated in a semi-continuous mode (phase 1),1998.
DAY COD influent cODeffiuent roo.; FOGeffi P04Pin P04Pef pH pH l\1LSS Temp I(mg/l) (mg/l) (mg/l) (mg/l) (mg/l) (mg/l) influent l\1L (mg/l) °c I
02/11/98 3780 1625 282 23 2180 2000 6.01 6.77 1800 23.1
03111198 3908 1360 2160 1700 6.07 6.81 1350 23.0- -04/11198 3668 1465 - 2120 1940 6.02 7.04 1975 24.5-05/11/98 3858 1267 265 27 2140 1560 6.01 7.01 1895 24.0
06/11/98 3858 1167 - 2143 2100 6.01 7.05 1920 23.0-07/11198 3858 1143 - 2125 1980 6.02 7.03 2150 23.4-08/11198 3877 1160 239 13 2100 2180 6.05 7.05 4000 23.3
09/11198 3480 1081 2000 2160 6.05 7.02 3960 24.0- -10111198 3719 1047 - 2120 2140 6.05 7.01 2820 23.1-11111198 4442 1080 236 18 2520 2280 6.18 6.95 4040 25.4
12/11198 3824 1279 2660 2180 6.02 7.00 3740 25.4- -13/11198 3782 995 2020 2060 6.14 6.98 4920 25.2- -14/11198 3936 1136 272 22 2070 2180 6.17 6.97 3740 26.1
15111/98 3851 1079 2210 2220 6.23 7.00 4480 26.3- -16/11/98 3833 977 2140 2120 6.20 7.01 3640 26.1- -17/11/98 3423 916 259 29 1850 2120 6.15 7.00 4860 26.2
18/11/98 3885 984 1990 1950 6.05 7.01 5580 24.9- -19111198 3897 978 2000 1950 6.89 7.05 4920 25.4- -20111198 3844 986 221 25 1730 1530 6.87 7.05 5120 24.5
21111198 3865 998 1940 1950 6.50 7.05 4960 26.50- -
M
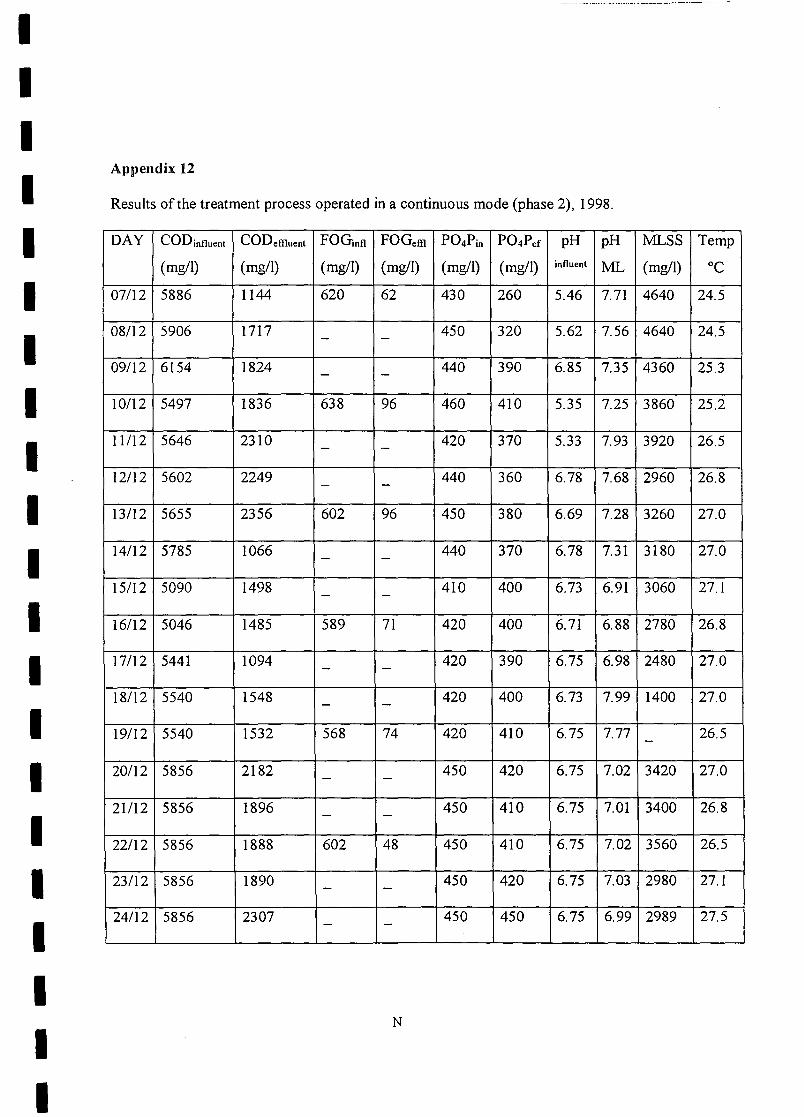
IIIIIIIIIIIIIIIIIIIII
Appendix 12
Results of the treatment process operated in a continuous mode (phase 2), 1998.
DAY CODinflu~nt CODeffiuent FOG.nfl FOGeffi P04Pin P04Pef pH pH MLSS Temp
(rng/l) (rng/l) (rng/l) (mg/I) (rng/l) (rng/l) influent ML (rng/l) °C
07/12 5886 1144 620 62 430 260 5.46 7.71 4640 24.5
08/12 5906 1717 450 320 5.62 7.56 4640 24.5- -
09/12 6154 1824 440 390 6.85 7.35 4360 25.3- -
10112 5497 1836 638 96 460 410 5.35 7.25 3860 25.2
11112 5646 2310 420 370 5.33 7.93 3920 26.5- -
12112 5602 2249 440 360 6.78 7.68 2960 26.8- -
13112 5655 2356 602 96 450 380 6.69 7.28 3260 27.0
14/12 5785 1066 440 370 6.78 7.31 3180 27.0- -
15/12 5090 1498 410 400 6.73 6.91 3060 27.1- -
16112 5046 1485 589 71 420 400 6.71 6.88 2780 26.8
17/12 5441 1094 420 390 6.75 6.98 2480 27.0- -
18/12 5540 1548 420 400 6.73 7.99 1400 27.0- -
19/12 5540 1532 568 74 420 410 6.75 7.77 26.5-
20/12 5856 2182 450 420 6.75 7.02 3420 27.0- -
21/12 5856 1896 450 410 6.75 7.01 3400 26.8- -
22112 5856 1888 602 48 450 410 6.75 7.02 3560 26.5
23/12 5856 1890 450 420 6.75 7.03 2980 27.1- -
24112 5856 2307 450 450 6.75 6.99 2989 27.5- -
N
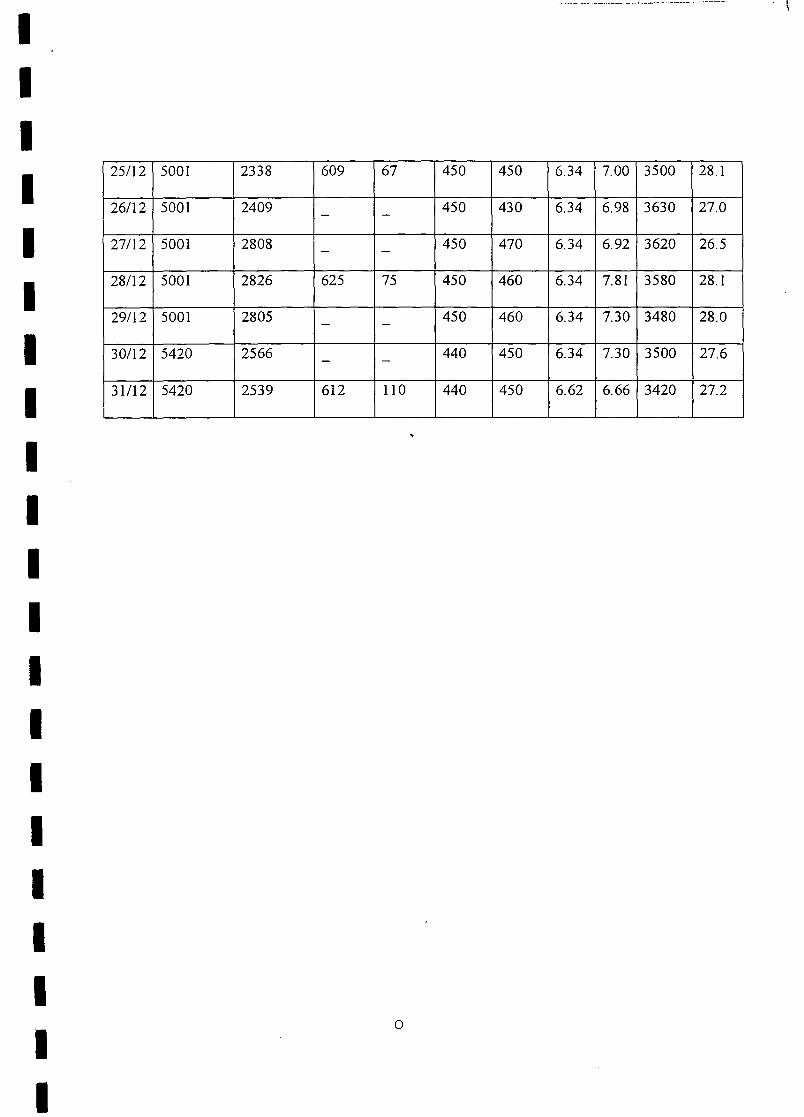
IIIIIIIIIIIIIIIIIIIII
25112 5001 2338 609 67 450 450 6.34 7.00 3500 28.1
26/12 5001 2409 450 430 6.34 6.98 3630 27.0- -
27/12 5001 2808 450 470 6.34 6.92 3620 26.5- -
28/12 5001 2826 625 75 450 460 6.34 7.81 3580 28.1
29/12 5001 2805 450 460 6.34 7.30 3480 28.0- -
30/12 5420 2566 440 450 6.34 7.30 3500 27.6- -
31112 5420 2539 612 110 440 450 6.62 6.66 3420 27.2
o

IIIIIIIIIIIIIIIIIIIII
Appendix 13
Resultsofthetreatmentprocessoperatedina continuousmode (phase3),1999.
DAY CODinfluent CODeffiuent FOGinfl FOGeffi P04Pin P04Pef MLSS Temp
(mg/l) (mg/l) (mg/l) (mg/l) (mg/l) (mg/l) (mg/l) °C
02/02 2256 798 710 71 180 160 4680 23.2
03/02 2255 1096 - 180 160 4600 23.6-
04/02 2256 1163 180 150 4620 26.5- -
05/02 2134 572 762 46 180 100 4550 26.7
06/02 2132 354 180 110 4500 25.3- -
07/02 2130 563 180 130 4380 26.9- -
08/02 2131 665 709 57 180 120 4250 28.2
09/02 2345 808 200 110 4730 27.3- -
10/02 2343 891 200 70 5630 26.9- -
11/02 2345 998 716 36 200 80 3720 25.8
12/02 2341 1246 200 90 3910 29.l- -
13/02 2340 1396 200 120 3950 28.6- -
14/02 2437 1326 721 43 205 110 4170 26.4
15/02 2437 1316 205 120 3160 24.3- -
16/02 2435 1404 205 110 4420 22.3- -
17/02 2433 1807 732 44 205 140 3690 22.6
18102 2328 1764 190 130 2250 26.5- -
19/02 2323 1570 - 190 130 3940 24.3-
p
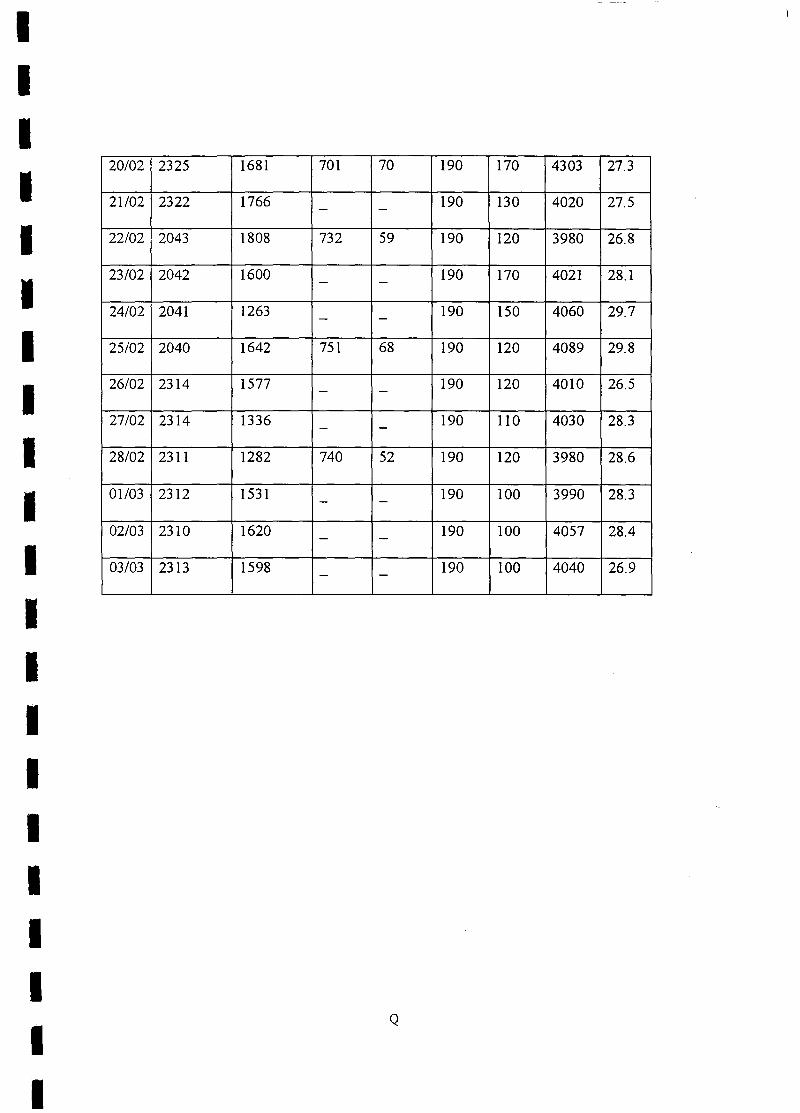
IIIIIIIIIIIIIIIIIIIII
20102 2325 1681 701 70 190 170 4303 27.3
21/02 2322 1766 190 130 4020 27.5- -
22/02 2043 1808 732 59 190 120 3980 26.8
23/02 2042 1600 - 190 170 4021 28.l-
24/02 2041 1263 190 150 4060 29.7- -
25/02 2040 1642 751 68 190 120 4089 29.8
26/02 2314 1577 - 190 120 4010 26.5-
27/02 2314 1336 190 110 4030 28.3- -
28/02 2311 1282 740 52 190 120 3980 28.6
01/03 2312 1531 190 100 3990 28.3- -
02/03 2310 1620 190 100 4057 28.4- -
03/03 2313 1598 190 100 4040 26.9- -
Q
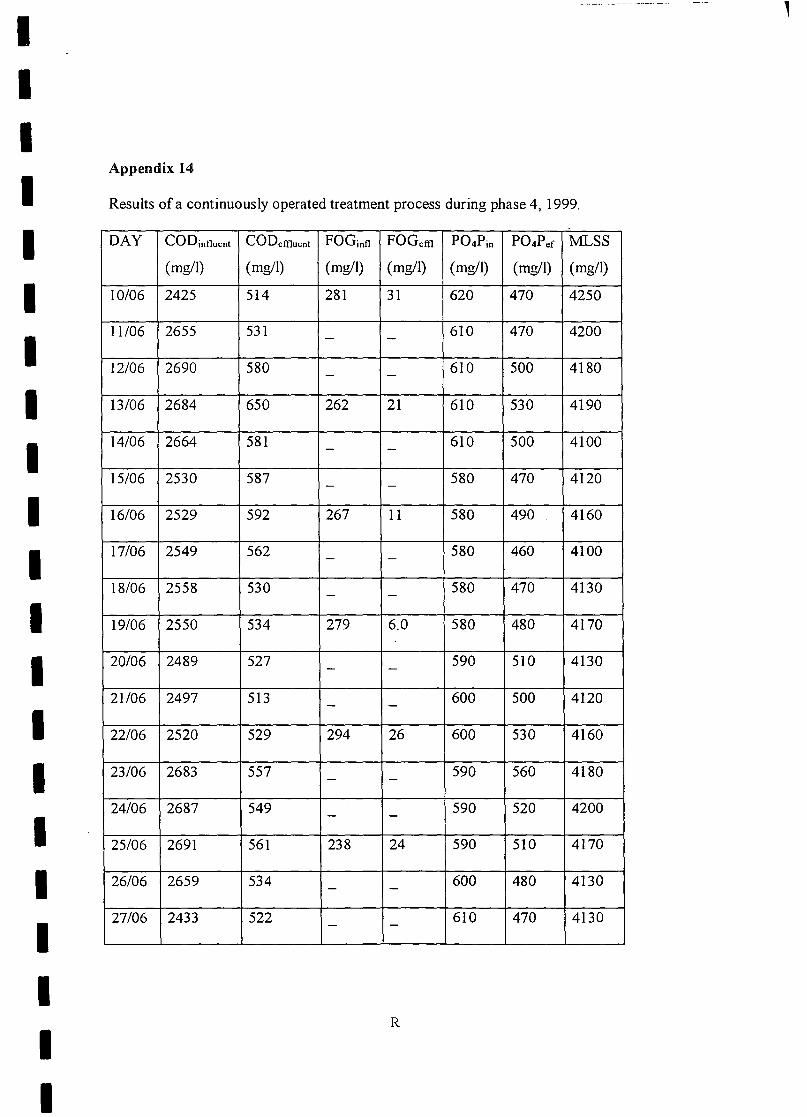
IIIIIIIIIIIIIIIIIIIII
Appendix 14
Resultsofa continuouslyoperatedtreatmentprocessduringphase4, 1999.
DAY CODinnu~nt CODemuent roo., FOGem P04Pin P04Pef MLSS
(mg/I) (mg/I) (mg/I) (mg/I) (mg/I) (mg/I) (mg/I)
10/06 2425 514 281 31 620 470 4250
11/06 2655 531 - 610 470 4200-
12/06 2690 580 610 500 4180- -
13/06 2684 650 262 21 610 530 4190
14/06 2664 581 610 500 4100- -
15/06 2530 587 580 470 4120- -
16/06 2529 592 267 11 580 490 4160
17/06 2549 562 580 460 4100- -
18/06 2558 530 580 470 4130- -
19/06 2550 534 279 6.0 580 480 4170
20/06 2489 527 590 510 4130- -
21/06 2497 513 600 500 4120- -
22/06 2520 529 294 26 600 530 4160
23/06 2683 557 590 560 4180- -
24/06 2687 549 590 520 4200- -
25/06 2691 561 238 24 590 510 4170
26/06 2659 534 600 480 4130- -
27/06 2433 522 610 470 4130- -
R

IIIIIIIIIIIIIIIIIIIII
28/06 2441 524 247 15 600 470 4120
29/06 2419 529 - - 600 470 4150
30106 2397 531 590 490 4140- -
01/07 2405 525 297 18 580 490 4120
02/07 2403 520 580 500 4160- -
03/07 2410 526 590 470 4130- -
04/07 2408 522 262 13 580 470 4180
09/07 2801 608 235 5.0 590 470 4200
10107 2795 609 590 480 4190- -
11107 2799 607 600 490 4180- -
12/07 2788 602 292 26 600 470 4190
13/07 2539 579 610 500 4190- -
14/07 2543 552 620 490 4190- -
15/07 2550 531 273 27 620 500 4190
16/07 2547 540 620 490 4200- -
17/07 2675 626 610 500 4190- -
18/07 2663 617 268 51 620 500 4190
19/07 2660 641 - - 620 500 4180
20107 2668 643 620 490 4190- -
21107 2660 619 281 39 610 490 4200
22/07 2671 614 - 610 500 4190-
23/07 2663 598 - 610 490 4190-
s

IIIIIIIIIIIIIIIIIIIII
24/07 2665 592 304 18 620 500 4190
25/07 2778 595 620 510 4180- -
26/07 2765 599 620 510 4180- -
27/07 2770 602 293 21 620 510 4190
28/07 2773 610 620 490 4200- -
29/07 2693 607 610 490 4200- -
30/07 2644 610 272 24 610 480 4190
31107 2696 601 620 490 4180- -
01108 2687 603 620 470 4190- -
02/08 2706 593 296 6.0 610 500 4190
03/08 2715 589 610 500 4180- -
04/08 2708 591 610 510 4190- -
05/08 2713 580 281 11 610 490 4190
06/08 2684 588 600 500 4190- -
07/08 2694 597 600 500 4190- -
08/08 2690 601 267 11 600 510 4200
09108 2681 602 - 600 490 4200-
10/08 2640 606 620 500 4180- -
11108 2639 601 271 60 620 510 4180
12/08 2647 602 620 510 4190- -
13/08 2634 598 620 500 4190- -
14/08 2754 596 295 15 590 500 4200
T
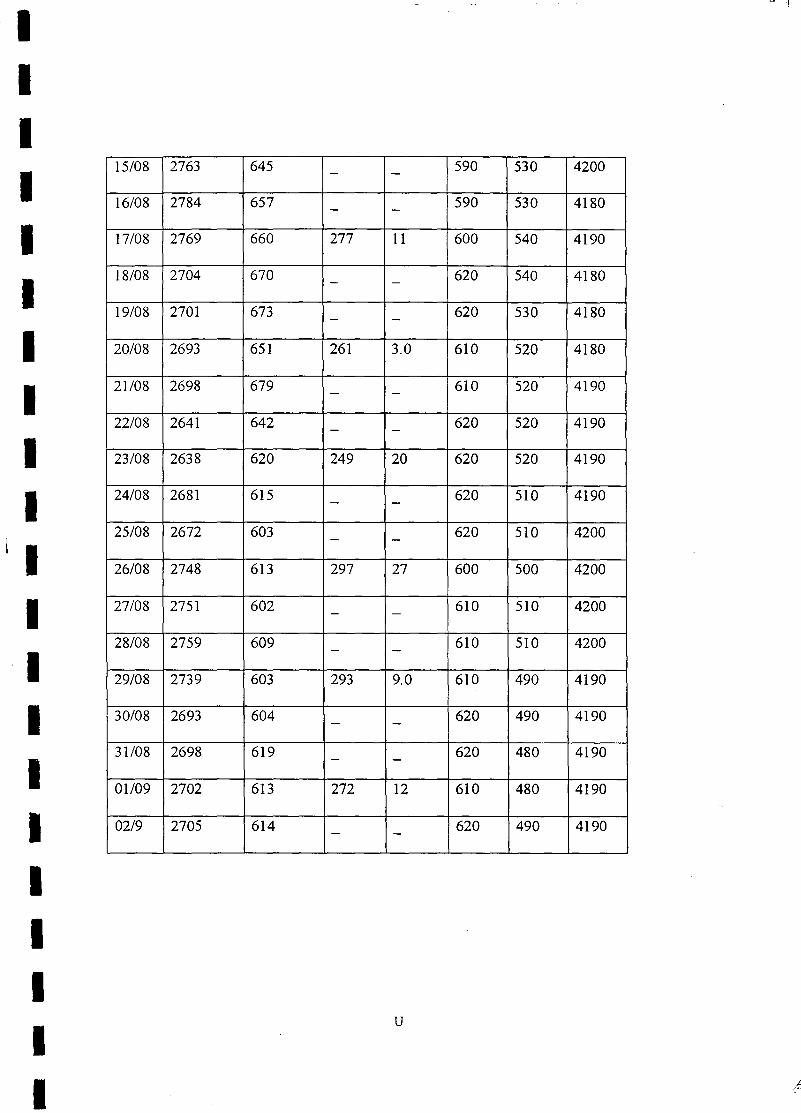
IIIIIIIIIIIIIIIIIIIII
- -1
15/08 2763 645 - 590 530 4200-
16/08 2784 657 590 530 4180- -
17/08 2769 660 277 11 600 540 4190
18/08 2704 670 620 540 4180- -
19/08 2701 673 620 530 4180- -
20108 2693 651 261 3.0 610 520 4180
21108 2698 679 610 520 4190- -
22/08 2641 642 620 520 4190- -
23/08 2638 620 249 20 620 520 4190
24/08 2681 615 620 510 4190- -
25/08 2672 603 620 510 4200- -
26/08 2748 613 297 27 600 500 4200
27/08 2751 602 610 510 4200- -
28/08 2759 609 610 510 4200- -
29/08 2739 603 293 9.0 610 490 4190
30108 2693 604 620 490 4190- -
31108 2698 619 620 480 4190- -
01109 2702 613 272 12 610 480 4190
02/9 2705 614 620 490 4190- -
u