Assessment Between Laboratory and Experiments the …€™RKAi, 098TAJnJAiO>6 AXBttA&T AUG19iaB2...
60
AlllQS mo'137 I NBS ( PUBLICATIONS NBSIR 82-2508 An Assessment of Correlations Between Laboratory and Full-Scale Experiments for the FAA Aircraft Fire Safety Program, Part 1 : Smoke U S. DEPARTMENT OF COMMERCE National Bureau of Standards National Engineering Laboratory Center for Fire Research Washington, DC 20234 July 1982 lOU .U56 Sponsored by: Department of Transportation Jeral Aviation Administration chnical Center lantic City Airport, NJ 08405 <^ 2-2503 1932 C.2
Transcript of Assessment Between Laboratory and Experiments the …€™RKAi, 098TAJnJAiO>6 AXBttA&T AUG19iaB2...

AlllQS mo'137I
NBS
(PUBLICATIONS
NBSIR 82-2508
An Assessment of CorrelationsBetween Laboratory andFull-Scale Experiments for theFAA Aircraft Fire Safety Program,Part 1 : Smoke
U S. DEPARTMENT OF COMMERCENational Bureau of Standards
National Engineering Laboratory
Center for Fire Research
Washington, DC 20234
July 1982
lOU
.U56
Sponsored by:
Department of TransportationJeral Aviation Administration
chnical Centerlantic City Airport, NJ 08405
<^2-2503
1932
C.2

'''ii
&
i

nt’RKAi,09 8TAJnJAiO>6
AXBttA&T
AUG 1 9 iaB2NBSIR 82-2508
AN ASSESSMENT OF CORRELATIONSBETWEEN LABORATORY AND -
FULL-SCALE EXPERIMENTS FOR THE
FAA AIRCRAFT FIRE SAFETY PROGRAM,PARTI: SMOKE
James G. Quintiere
U.S. DEPARTMENT OF COMMERCENational Bureau of Standards
National Engineering Laboratory
Center for Fire Research
Washington, DC 20234
July 1982
Sponsored by:
U.S. Department of Transportation
Federal Aviation Administration
Technical Center
Atlantic City Airport, NJ 08405
U.S. DEPARTMENT OF COMMERCE, Malcolm Baldrige, Secretary
NATIONAL BUREAU OF STANDARDS, Ernest Ambler, Director

saer e .1 auA
'f>«»'•;
'c<
' aW A S|3#v' ^ f3t;
:i!-sT nc-8 ^W3Mifia‘!X3l,:Aa«--ii«%,,'
,“1 YT33Ai3, 5f«« T^^^StOftlA AA^*i'
,; 3>i0M3 TaAS WKX^k—\si : .
. - ' — BHH^^EEhSCA^,' 9>
'Vi 1!'4'
r<®a'4"l.,;!,:' ,.i
j) s^«i^
;-»y^
. 'Wo:j ;fS•:r, .lo.-»^* f|lfloi5' i<»
. ..•.-. .s -i-rf
m»Kav'is
r?
MiTjs.f:OS,
^' fi.y>^Qj tvt . . ..
,
'
'
'
"‘S :,:» ^::'™r_. : vi^
rrV'
'0>-
± '^'J''' lil
i'>r,{?^-,
. > ’-vX'*'
i/j
r m,)^mimii irt-imieM .39R3KWar>',»^W3.ft»Tf^a^^^ .#.i*
,X»d«.A|^'»<:-iS ,eOf<AAlAS|i1^A^^ -:., <m:v
'Sf

M ASSESSMENT OF CORRELATIONS BETWEEN LABORATORYAND FULL-SCALE EXPERIMENTS FOR THE FAA AIRCRAFT
FIRE SAFETY PROGRAM, PART 1: SMOKE
by
James G. Quintiere
Abstract
An extensive review Is presented demonstrating the nature of comparisonbetween full-scale fire smoke data and test method results for materialsThese correlations are presented In terms of consistent parametersestablished through a development of the governing equations for smokeconcentration and light attenuation. Visibility data limited to
light transmission through smoke are also presented. The complexdependence of smoke production on many parameters acting In fire growthlimits the success of simple correlation methods. Recommendations aremade for further research to establish a sound basis for correlations,and the prediction of smoke obscuration due to fire.
Key words: Correlation, full-scale, review, smoke, test methods

a> f •... ^5
^,
i'
k^'
A,
•' /<• .vj'-i:' ’u
,'iSi
,'
I
’ '
M'
' AV ': \y%»
'iO A'tDJftn. S%l
amm *^'3 ^ Jfc
oj' ba:J i«iU fej.^-'
., Xdl^09 aftt ^ h44
‘^'1 ^ ui$il5|baiq’n '&.-
S’,:
^bO'd.latnr ,.b, fi>,^'|6#ll''w%._
''•* L\ uJlinH
i ^^. J»:
Fi^'w-. *L<: '. jIuLU
..-iilF»?v,. '• :-\;<r
'%:':fl
E
",
'
'
,;.' ;";,; ,
. v
,.-V- U'<'‘
" X"'
A,,; ,Ui
,><^'x4rl'A
' V> -siW JJ!
' - .‘, ',*i:).'fc
<f^
’'iX *'
. "S, ,<4.;'- a(T\i ".
Ufi-
Ml!:

TABLE OF CONTENTS
Page
INTRODUCTION 1
Purpose 1
Background 1
DISCUSSION 2
Visibility in Smoke 2
Macroscopic Equations for Smoke and Optical Density 3
Factors Affecting Smoke Properties 8
COMPARISON BETWEEN TEST (METHOD) DATA AND LARGE SCALE FIRE EXPERIMENTS 11
Comparisons for Closed Systems 12
Comparisons with Fullscale Room Fire Growth Data 12
Comparison Between Test Methods 15
CONCLUSIONS 16
REFERENCES 19
APPENDIX
1

\
'
’ f V-;
'
1
LIST OF TABLES
Table Page
A-1 Data from Heselden A-3
A-
2
Data from Watts A-4
A-
3
Data from Parker A-
5
A-
4
Data from Babrauskas A-
6
A-
5
Data from Woolley, Raftery, Ames, Murrell A-
7
A-
6
Data from Evans A-8
k-1 Data from Tustin A-9

LIST OF ILLUSTRATIONS
Figure Page
1 Visibility Results Derived from Rasbash [29], Jin [5], andLopez [IJ. 22
2 Conservation of Mass for Smoke in a Control Volume (regionEnclosed by dashed lines) . 23
3 Mass Optical Density as a Function of Heat Flux Derived fromBrown [23]. 24
4 D Rankings at two Flixx Levels from Brown [23] for PilotedlUmon. 25
5 D Compared for the Smoke Density Chamber and Largecfdse^ Rooms from Lopez [1], Shores [32] and Robertson [33] . 26
6 Comparison Between Full-Scale and Test Method Results in
Terms of Maximum Specific Optical Density (D ) and MassOptical Density (ay).
s,max
1 Smoke Production for Plywood as a Function of Temperature (a)
ana Ventilation Factor (b) from Saito [24]. 28
8 Full-Scale Smoke Compared to D from the OSU CombustibilityApparatus at Several Heat Flux Levels [21]. 29
9 Results from Room Lining Fires Compared to the Smoke DensityChamber from Christian and Waterman [42]. 30
10 Smoke in Corridor Fire Spread Compared to Results Derived from
the Steiner Tunnel Test from Christian and Waterman [42]. 31
11 Lining Fires in Rooms and Smoke Data from the Smoke DensityChamber and the ASTME-84 Tunnel Classification for Smoke from
Fang [43]. 32
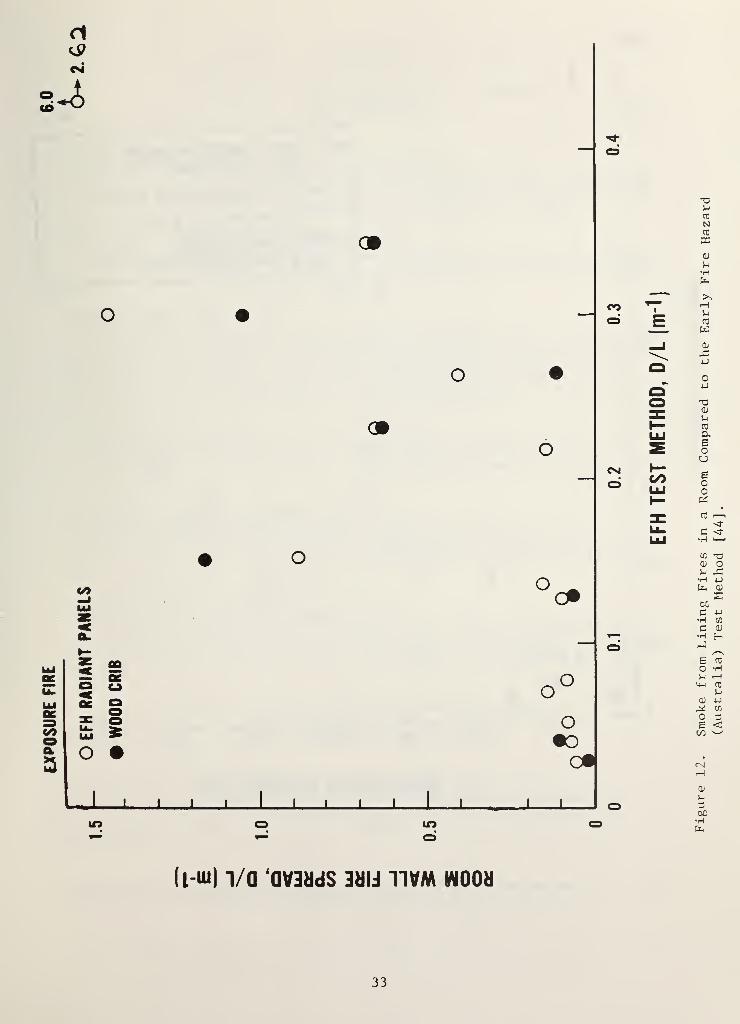
12 Smoke from Lining Fires in a Room Compared to the Early Fire
Hazard (Australia) Test Method [44]. 33
13 Comparison of Smoke Density Chamber, OSU Combustibility Appar-atus, and British Smoke Test Data [21, 33]. 34
A-1 Full-Scale Test Configurations and Test Method Apparatus Used
in Correlation. Symbols Denote Measurement Locations: D-LlghtTransmission, T-Temperature , V-Velocity, m-Mass Loss. A-2
Iv
NOMENCLATURE
A
Ao
Cs
D
Ds
E
Ho
I
ka,k k
s V
L
LV
m
n
5
t
V
V
V
X
V
a
6
A
a
X
fuel surface area
area of room opening
mass of smoke particulate per unit gas volume
optical density, Eq. (3)
specific optical density, Eqs. (15, 16)
rate of energy release
height of room opening
light intensity
parameters
path length of light beam
visibility, Eq. (6)
mass or mass loss
unit outward normal vector
surface area of control volume
time
velocity vector
volume
volume flow rate
general abscissa variable
general ordinate variable
particle optical density Eq. (12)
sample thickness
change in (initial to final)
extinction coefficient
fraction of particulate mass to fuel mass loss
V

SUBSCRIPTS.
a - absorption
f - f inal
o - initial
s - scattering, smoke particulate
V - visibility
SUPERSCRIPTS.
(*) - per unit time
()" - per unit area

ACKNOWLEDGEMENT
This study was sponsored by the Fire Safety Branch of The Federal AviationAdministration Technical Center at Atlantic City, New Jersey. The authorgratefully appreciates the advice of Mr. R. Hill, the technical monitor,and also the assistance of Mr. C. Sarkos of the FAA.
vli


INTRODUCTION
PURPOSE.
The purpose of this review is to present and to interpret experimentalsmoke measurements. Comparisons will be made of data from laboratoryfire tests for smoke with those of full-scale fire experiments. A posi-tive correlation of these results could be interpreted as a basis for therelevance and credibility of the laboratory test method to measure theproduction of smoke in fire. Alternatively, a positive correlation couldbe interpreted as fortuitous since conditions in an uncontrolled firevary while laboratory test conditions are fixed. Hence some underlyingfactors controlling the production of smoke must be identified to fullyappreciate, and perhaps understand, the degree to which such correlationcomparisons are sound.
An analytical review of the fire smoke literature was made primarily seekingstudies related to comparisons between full-scale fires and test methods.It may not be totally comprehensive, but the results are believed to berepresentative of the state-of-the-art. Where possible, results fromvarious studies were unified using the governing equations for smokeproduction and light attenuation. Studies related to the factors onwhich smoke production and obscuration depend were also reviewed. It is
intended that the results of this study demonstrate the extent to whicha laboratory test for smoke can predict smoke in an actual fife, and the
factors which influence the results of a prediction or correlation. Thisreview will not include analysis of complete fire growth computer-basedmodels to predict smoke production (e.g. [3]).
BACKGROUND
.
Smoke generation is one of the characteristics of uncontrolled fires whichrepresents a threat to life safety. In general, smoke can be considered as
the mixture of gaseous and particulate products of combustion flowing fromthe fire. This "smoke” could affect life safety by reducing visibilitydue to obscuration and by causing physiological dysfunction and othertoxic effects. The two effects are related when the smoke impairs visiondue to sensory irritant species produced by the fire. In fact, it hasbeen reported that a sensory Irritant effect on visibility occurred at a
lower smoke concentration (optical density) than that affecting visibilityfor protected eyes [1]. Although a methodology has been proposed for
assessing the sensory irritant effect of combustion products using ananimal model [2], a clear approach to this sensory smoke hazard does notexist. In contrast, the light transmission characteristics of smoke havebeen studied extensively, and several methods exist for determining the
"smoke contribution" of a material. It is these studies of light trans-mission through smoke that will be reviewed. No further discussion of
the irritant and toxicological effects of smoke on vision and humanfunction in general will be presented.
1

DISCUSSION
VISIBILITY IN SMOKE.
The attenuation of light by smoke is examined in order to relate it tovisibility and its impact on escape from a fire. Visibility is a measureof the electromagnetic radiation in the spectral range to which thehuman eye is sensitive and the ability to perceive images based on theiremitted, reflected and transmitted light. For the most part, smoke testmethods only measure the attenuation of a parallel beam of light; theydo not consider the irritant effect of smoke on vision.
Bouguer’s law [4] applies to the attenuated intensity of radiationI^(L) received over a path length L from a source of intensity 1^(0).
I^(L) = I^ (0) exp ( 1 )
where is the monochromatic extinction coefficient. In measurements onsmoke, is usually assumed to be uniform over the path length and inde-pendent of wavelength over the narrow band for visible radiation (or takenat a fixed wavelength if a laser light source is used). Hence
( 2 )
aL is called the optical thickness or opacity, but in measurements of
fire smoke the term optical density (D) has more commonly been used.Specifically
• = ... («S)or
D = aL/2.303 (4)
A measure of D, or more precisely a, is not necessarily complete in orderto define visibility. Here "visibility" will be more narrowly defined as
L , the maximum distance which allows a visual discrimination of an
object. A measure of visual discrimination has normally been based on
an observer's ability to see an object or read a sign. It could morequantitatively be evaluated in terms of contrast levels and other opticalparameters. As described so well by Jin [5], the visibility depends on
the light intensity of the object, the intensity of the background andilluminating light, plus the scattering (a ) and absorption (a ) coeffi-cients of the smoke. The total extinction" coefficient O is the sum
a aa+ o (5)
2

and thus O alone does not provide sufficient information to predictvisibility through smoke. Nevertheless, it has been shown by Jin [5]
that for a back-lighted or illuminated sign, OL is approximately a con-stant which depends on the intensity of the lig^t leaving the sign andthe ratio of scattering to extinction coefficient for the smoke. Experi-mental results by Jin and others [1, 29] are given in Figure 1 (the databars represent the spread of results due to different smokes) . Thesedata were based on observations of different objects by subjects whoseeyes were protected from direct contact with the smoke; consequently,irritant effects have been eliminated. The scatter in the data representthe variations of light intensity from the viewed object and of the smokeoptical properties. For fire safety design purposes the relationship oLor (D/L) L = constant could be used by selection of an appropriate"design constant" (k ) from Figure 1. By measuring optical density perpath length (D/L) for smoke generated by a particular material, the
maximum distance for vision is determined by
k
L = —
—
V (D/L)( 6 )
MACROSCOPIC EQUATIONS FOR SMOKE AND OPTICAL DENSITY.
The optical density of smoke depends on the mass of suspended particlesand on the optical properties of the smoke aerosol, and any attempts at
correlating laboratory smoke tests of a material with its performance in
full-scale fire experiments must be couched in terms of the conservationof mass for smoke. This equation will be derived, expressed in terms of(D/L)
,and its various forms will be considered in applications to pre-
dicting or correlating smoke concentration or light transmission.
A macroscopic mass balance equation will be derived for a fixed finitecontrol volume in which smoke is produced. In principle, the controlvolume could be shrunk to a point, and thereby the corresponding spatialdifferential equation could be derived. Figure 2 shows an arbitrary con-trol volume bounded by walls with two openings, and within which is afire or decomposing .material of involved surface area, A.
The conservation eqvjatlon of smoke (specifically, its particulate massconservation for the fixed control volume) is given as
3“ III C dV + C v.n dS = mdt JJJ s Jj s s,net
Rate of accumulatioii Net rate of smoke Net rate of
of smoke (particulate4-
leaving the control smoke pro-mass) in the controlvolume, V
1
volume through surfaceS
duced
L -J
3

where is the mass of particulates per unit gas volume
V is the velocity of the aerosol (assumes the particles movewith the bulk gas velocity)
and n is the unit, positive outward, surface normal vector.
The net rate of smoke produced is
m = m - m ^s,net s s,lost ( 8 )
where the rate of smoke generated (m ) is expressed in terms of a fractionof particulate mass to total mass loss (smoke fraction), y, where
dm
X = (9a)
and m is total mass lost. For a fire fully involving a fixed area. A,
m = Y m” A.s ^ (9b)
This case will be considered for simplicity in the following development.
The rate of smoke lost, m depends on particulate settling, adhesionto the solid surfaces, an^ ’ v8fatliization of the particulates. Condensa-tion of species to form more liquid particulates is also possible. Theseprocesses will not be addressed in further detail, but bear on appraisingthe accuracy of smoke correlations. Since no accounting of these lossesis taken in any of the studies on fire smoke performed, a full quantitativeaccounting of its effect can not be presented. It is present in all
systems, but its effect has been ignored in analyses of smoke production.
Since light transmission is the convenient form of smoke measurement.Equation (7) is more appropriately expressed in terms of optical density.This is easily done since experimental results and electromagnetic theory
[6-9] give
and
a = k C /pa ass (10a)
where
a = k C /ps s s s
(10b)
p is the density of the smoke particulate and the parametersk and k^ depend on wavelength (A), particle size and shapeand index of refraction.
4

For smoke composed mainly of soot (an absorbing and scattering aerosol)
,
the scattering component is negligible in the visible range [7] and
a ^ a = k’ C /(p (11)a ass
"White" smoke or smoke generated from smoldering or non-flaming thermaldecomposition tends to be primarily a scattering medium in the visiblerange [10].
Seader and Ou [11] have found a very useful result for both flaming andnon-flaming radiative decomposition at 2.5 W/cm for a number of materialsand even for combinations of materials [12]. They show that at the
completion of the decomposition process
(D/L) = a C^, (12)
2 2where a = 1900 m /kg for non-flaming and a = 3300 m /kg for flamingdecomposition. The results are consistent with electromagnetic theorycalculations [11] and the data of others [13, 14]. But the dependenceof a on time, heat flux, and initial smoke concentration is not fullyresolved. Yet Equations (10) and (12) can provide extremely usefulresults in generalizing our understanding of smoke from fire.
The parameter a in Eq. (12) has been termed the "particle optical density"by Seader and co-workers. It could also be termed a specific extinctioncoefficient (per particulate volume fraction) as suggested by Eq. (10).
Equation (12) will be used to Introduce optical density into the massbalance equation for smoke. Hence from Eqs. (7), (9b) and (12):
dt a
D
LD
LV. n dS
s, lost(13)
This is the basic equation that must be used to predict or correlatelight transmission data for smoke.
Assuming no losses, the mass rate of smoke particulates produced can becalculated by the left-hand-side of Eq. (13); other than a, these param-eters are typically measured in fire tests. The total (net) mass ofparticulates produced over time t (assuming no losses) is
— v.n dS dtL
(14)
Without the a factor this has usually been called "total smoke" or some
similar term. A related term is the specific optical density, D , as
introduced by Gross e^ [15] ,but defined in a more general sense
here as _
Ds
D
Lv.n dS dt /A. (15)
5

The specific optical density is the optical density, D, per unitpathlength, L, resulting from the decomposition over a material's surfacearea, A, times the volume, V, of smoke produced in time t. For a closeduniform system, such as the smoke density chamber (SDC) [15, 47],
Ds
pvLA (16)
Alternatively, for a independent of time (and space) or taken as a
suitable mean value,
D = can /A (17a)s s
or
D = axm" (17b)s
if X is also assumed independent of time and where m" is the materialmass lost per unit area in time, t. The product ax has been refered to
as the "mass optical density" by Seader and others. It has been suggestedas a more fundamental index of smoke than T) , since D is dependent onmaterial density and thickness while ay is not [16]. This appears to
have some advantage in evaluating a homogeneous material of varyingthickness
.
Separately, the parameters a and y represent "smoke or fire properties"of a material. The a is related to fundamental parameters through elec-tromagnetic theory and hence depends on wavelength, index of refractionand particle size. Although not a fundamental property, it is a usefulengineering parameter in predicting light transmission in smoke. Themass fraction of smoke, y, is more complex and relates to the mechanismsinvolved in thermal decomposition and smoke (soot) formation in flames.
These parameters need to be examined more fully to be able to utilizeEq. (13) to predict or correlate smoke transmission. Their dependenceon time and environment for a material needs to be known in order to
generalize test results to arbitrary fire conditions. With these con-
siderations in mind, correlations or predictions can and have been made,
but they are undoubtedly based on Insufficient information. This willbe Illustrated in the correlation results to be presented.
Equations (15) and (17) provide the basis for scaling and correlation of
smoke measurements. It is assumed that imder the same cond'itions ofheating, environment oomposition, and veZooity , a given material decom-posing uniformly (or similarly) over a fixed area and orientation willhave an invariant D at a given time. This follows from Eq. (17a),
provided smoke losses per unit area A are negligible or (m^lost'^^^s^
invariant. This means that for any fire system described b^^ the controlvolume equation ((13) or (14)), D as evaluated by Eq . (15) should be
equal for two different systems (e.g. test method and full-scale) providedthe restrictions of the assumption are met. For a control volume whichalways encloses the smoke (even the smoke flowing out of the test chamber)
,
i.e. a closed system, it can be shown that for g and y independent of
t ime
:
6

_1axm"
1 (18a)
dl)<•
dt
tn
closedsystem
s,lost
Xm”A
or Integrated over time,
D^(t) . axm", - (18b)
Hence, the mass opticdl density of two systems will be equal if theirvalues are equal. Again, losses must be negligible or similar and the
area involved must be well defined. The application to a spreading fire
under varying heating and environmental conditions presents difficulty!
Within the limits noted above, two special cases will conveniently serveas a basis in our discussion and development of correlations.
CLOSED SYSTEM . The first is a closed system uniformly mixed with no smoke
losses
:
dD= axm' (19a)
or
where
= axm"
s LA
(19b)
V being the volume of the system.
STEADY OPEN SYSTEM . The second case is the steady flow open system with airentering and smoke leaving, with no losses:
ax = V
m"A(20a)
where V is the volume flow rate of smoke leaving the system, or
D^^ = uxm" = Vdt/A (20b)
From light transmission measurements in the smoke and flow measurements,it is then possible to determine ax or D for these systems. If the
decomposed area is well-defined then D is the appropriate correlatingparameter; if mass loss is measured then ay is the appropriate parameter.The use of either involves the assumption of time independence for a and
X, and also that negligible or similar smoke losses occur.
7

FACTORS AFFECTING SMOKE PROPERTIES: D , a, X-c)
The parameters a and x can be considered "bulk" material properties,although D cannot; it is a dimensionless optical density. In analogyto the healing of a solid, D is to dimensionless temperature as ay is tothe thermal parameter kpc. fet a and y not to be taken as fundamentalproperties, such as the density of a pure substance; they are more likebulk density of an aggregate. In addition a and y must depend on bothsolid and gas phase phenomena, l.e. decomposition, the flame dynamics,and its chemistry. Based on the results of many investigators, factorsaffecting ay as well as D can be identified. Reported values for Dwere related to the product ay through Eq
. (17b) but no attempt was madeto assess a and y Independently. Thus a full characterization of the smokeproperties of a material has not been done, but a sense of the dependentvariables can be inferred from the results reported for D and ay. Anexcellent review on fire smokes and a discussion of factors affecting D
and ay was reported by Seader and Elnhorn (17) . The qualitative effectof these factors will be discussed.
TIME. The quantity D will increase with time as the material decomposes,reach a maximum, and then tend to slowly decrease as smoke losses dominatesmoke production [15] (e.g. see Eq . (18b)). The mass optical density,ay, as derived from Eq. (17b) is also found to have a similar behaviorin time. However, lack of data acquisition synchronization betweenmeasurements of sample mass loss and optical density (or light transmis-sion) as well as the effects of non-uniform smoke concentration couldhave affected the time response for ay [18]. Moreover a has only beenmeasured at the end of decomposition (not over time) , and only at a fixedradiant heating level, 2.5 W/cm [11-13]. It is significant to note thatthe calculation of ay by Eq . (17b) assumes a and y are independent of time,
yet experimental results demonstrate otherwise; hence, a "time-averaged"value for ay is presented. Until a and y are measured individually overtime, a clear understanding of their time behavior during decompositionis not possible.
EXTERNAL RADIANT HEAT FLUX. Many investigators have demonstrated the
dependence of D and ay on external radiant heat flux for both flaming and
non-flaming [1, 14, 18-23]. The non-flaming mode is arrived at by not
using a pilot flame; however, at high heat fluxes auto-ignition may occurand therefore a strictly non-flaming or "smoldering" decomposition may not
be possible (except in an inert atmosphere) . Thus at high flux levelsa non-piloted result does not necessarily mean non-flaming. Lack of clarityor completeness of such results found in the literature leaves the data
ambiguous. Usually there appears to be an Increase of D with flux
but this is not true for all materials. The results o^ §fo^ [23] showa dramatic increase in D between 2.5 and 5.7 W/cm for non-pilotedignition. Wliile this coul9 §e due to auto-ignltlon, it is not explicitly
stated. For these materials the non-piloted irradiances produced higher
values for Ds .max
than their piloted counterpart. In these studies a vertical
8

sample orientation was used so that melting of materials would affectthe result, and a poorly defined decomposition area affects the calculationof D . Since mass loss is also dependent on heat flux it is not clearfrom D data alone how ax depends of flux. Since ax generally is a moreuseful result, an example of the dependence of ay on flux is shown inFigure 3. These results were derived for the piloted data presented byBrown [23]. The ax was calculated using Eq. (19b) at the peak value of
or where the final data on mass loss were available. These resultsclearly show that the dependence of flux on ay is significant, but evena qualitative trend cannot be drawn. More importantly the ranking ofmaterials from lo^ to high D values changes significantly betweenthe low (2.5 W/cm ) and high^(Tf^3 W/cm^) flux levels in the piloted andnon-piloted data of Brown [23] as seen for the piloted data in Figure 4.
TEMPERATURE
.
Temperature of the environment could be viewed as a surrogatefor radiant heat flux. This is especially so if the heated gas is confinedin a room or test oven. Hence a similar effect would be expected.Indeed, studies by Saito [24, 25] and Tsuchiya and Suml [26] and morerecently by Bankston, aT
. [27] show a distinct but not generallysimilar relationship for all materials. For example, Saito [24, 25]
finds that ay both can increase or decrease linearly with temperatureunder either non-flaming or flaming conditions; similar to the resultsfor flux in Figure 3.
OXYGEN CONCENTRATION. The effect of environmental composition has notbeen studied extensively, but limited results by Gross, et al. [15]
(non-flaming) and King [13] (flaming) tend to show a decrease in
as oxygen concentration is decreased. In contrast, Saito [24] finds
that in compartment fires ay decreases rapidly as the compartment ventilationparameter (A /h ) is increased, then tends to level off for "large"A /H . The "large" A /H behavior Salto finds is consistent with his temperaturedependence for ay pre9ic?ed from his test data. For compartment firesit can be Inferred that at low A /H values the decomposition is occuringin a low oxygen concentration environment. Thus Salto’s compartmentfire data imply that ay increases as oxygen concentration is decreased,i.e. ayf as A /H 1 and as A /h 1. This result for ventilationcontrolled compartment fires could be consistent with the observationthat D decreases as oxygen decreases [13, 15] since D = aym", Eq.
(17b). ^ Then as A/H^1 and m"'l' (for ventilation controlled fires),
as ayf provided the decrease in m" is weak. Hence, here is anotherexample where the need to separate effects on a, y, and m" is apparent.
SCALE
.
Not much work has been done to Investigate the effect of scaleon smoke production. In particular the sample size has not been variedwithout varying the scale of the entire system. Two experiments usingthe smoke density chamber and a large closed compartment yield inconclusiveresults: the data of Lopez [1] suggest a tendency for Bg^jjj^gg to decrease as the
sample area is Increased (s x s vertical sample where s = 0.02, 0.09,
0.18, 9.27), but the results of Shores [32] show no distinct trend. It
9

is expected since D depends on mass loss per unit area, m”, that thereis bound to be an effect of scale of D . The dependence of m" on scalewill vary as flow conditions vary from laminar to turbulent and as flameheat transfer changes with flame size and shape. However understandingthe effects of scale on the components of D : a, x» m" would be morerevealing.
ORIENTATION. Some factors that relate to scale also apply to orientationnamely, the fluid and heat transfer effects caused by the flame andother heat sources. In addition, the melting and structural erosion of
a material due to its orientation can have a significant effect on thesmoke measurement. For example, Breden and Meisters [28] found thatD is much greater for a horizontal melting sample than a verticallymounted sample in the smoke density chamber. Yet similar values forD were measured in both orientations for nonmelting speciments, but
up to D was greater for the horizontal case. These resultssuggest that melting results in an unspecified heated area, and differ-ences in flame configuration affect the rate of smoke production morethan the total smoke produced.
MODE OF DECOMPOSITION. It is apparent that the intensity and manner of
thermal decomposition affects the amount and nature of the smoke particulatesgenerated. Foster [10] finds the smoke produced from non-flaming thermaldecomposition of wood saw-dust consists of spherical droplets of nearlypure scattering character, while King [13] finds, under flaming decomposition,that smoke can be composed of chainlike elements of both solid and
liquid particles. Jin [5] reports similar findings with non-flamingthermal decomposition giving particles of less than 1 ym in diameter(white smoke); but for flaming, (black smoke) particle size ranges up to
20 ym.
Another effect of scale, not considered earlier, relates to the destruc-tion of smoke particles by their evaporation and oxidation as theytraverse the flame and plume. The nature of the particulates — liquid
drops, carbon soot, "chains" — at their origin would surely affect this
process. Hence "big" flames may not be similar to "small" flames in
their net production of smoke particulates which emerge from the flamezone
.
THICKNESS AND DENSITY. It has been reported by several investigators
[17] that D depends nearly linearly on sample thickness up to some
thickness affer^which it approaches a constant. A similar behavior is
claimed for initial sample density [17]. This effect is mainly due to
mass lost (m") in correspondence to D since that mass is dependenton density and thickness. In contrasf’™it is found that ay is much less
dependent on sample thickness and density [16].
10

CONCLUDING REMARKS. Although other parameters may be relevant variablesfor smoke production, the above set appear to be the most significant.Despite the identification of these parameters it is not clear what themost fundamental set of variables describing smoke are or what othervariables they depend on. Both D and the mass optical density (oty) arecomposed of several parameters, each of which depend on other variables.Heat flux is a dominant and convenient independent variable for representingsmoke "properties" but it does not constitute a fundamental variable.Heat flux promotes decomposition which produces smoke, (but it is theultimate temperature of the material and its time varying state on whichthe rate of decomposition depends) . Also smoke fraction, x> representsthe result of a series of processes: solid degradation, nucleation of
particulates, growth and decay in the flame, coagulation, and vaporization.Nevertheless, it is useful to represent y as a function of heat flux fora given material for engineering calculations. Further research needsto establish valid limitations to such functional relationships for thisapproach to be sound.
Additional information on factors controllng smoke production can befound in an extensive review by Seader and Einhorn [17]. Also thepapers by Rasbash, et al
.
[29, 30] are Interesting general articles onsmoke
.
COMPARISONS BETWEEN TEST (METHOD) DATA AND LARGESCALE FIRE EXPERIMENTS
The ground work has been laid for establishing a basis for correlatingresults of test data and fire measurements. Also the factors affectingthese results have been discussed. A well defined test method environ-ment (e.g. heat flux) helps to yield a specific smoke property; yet,
this result may be insufficient for application to a large scale fire.
The environment of a large-scale fire is complex, not sufficientlypredictable, and not completely measurable. For example, the heat fluxfrom the flame of a burning object, and additional convective andradiative heating from a hot enclosure will not necessarily be equal to
the prescribed radiative heat flux in the test method. Moreover, testmethods subjectively intended to simulate conditions in a realistic fire
generally have no scientific basis nor have they universal application.This dilemma has been further elaborated on by Robertson [31]
.
With these considerations realized, available and derived results willbe presented for comparison. An attempt was made to provide homogeneityin the comparisons; meaning, results were presented in terms of D or ayas established from the governing equations. ^.Ihen insufficient informationdid not allow this format, appropriate "related" parameters were compared.
11

COMPARISONS FOR CLOSED SYSTEMS.
Several investigators [1, 32, 33] have examined results from the smokedensity chamber* (a closed system) with scaled-up versions of irradiatedsamples burning or decomposing (non-flaming) in a large chamber. Lopez [1]varied both the flux and sample size. Shores [32] varied the sample sizemaintaining the prescribed test flux of 2.5 W/cm^, and Robertson [33] reportsresults for the NBS chamber sample producing smoke in an 18 m^ room. Theresults of the full-scale data are compared with the standard smoke densitychamber findings in terms of D (Figure 5) . Shores [32] also displayscomparisons continuously over llme^of comparable agreement as those discretedata shown in Figure 5. If the smoke losses are similar or negligible inboth systems, and sample scale effects (vertical orientation) are small, thenthe D results should be identical. The variations from that ideal areshown in Figure 5.
COMPARISONS WITH FULL-SCALE ROOM FIRE GROWTH DATA.
A variety of materials and fuel configurations were burned in rooms in whichthe optical density of the smoke leaving the system was measured. Correspondingly,small-scale laboratory test data were taken for the materials, and comparisoncould then be made with the full-scale results. In some cases these comparisonswere explicitly reported in the literature, in other cases they were derivedfrom reported data. The first set of data compared are in terms of homogeneousparameters: Dg or ay* The sources [34-41] of these data, their full-scale test configurations, the test method used for the material, and a
tabulation of the results are given in the Appendix. Six sets of comparisonsare plotted in Figure 6. The range of configurations includes random arrays
[34], wall linings [35, 41], mattresses (horizontal and vertical) [36-39],and small tables [40]. The materials include plastics, wood, cotton, rubber,painted surfaces, and others (See Appendix). The methods for calculating the
mav or av values for the fullscale experiments are based on Equations (19)
and (20). The specific form of the equation used is indicated in Appendix B.
As it might be expected, a direct correlation does not result. Nevertheless,there is a general trend in the proper direction implying, except for a few
out-lying data points, that uncontrolled influencing variables do not have a
very strong effect. The effect of material configuration is very strong as
indicated by the data (Appendix) given for polystrene, e.g. its coordinatesrange as follows:
ay - (700, 180), (1000, 785), (820, 790);
Ds ,max
(3.8, 43), (63, 32).
Brief descriptions of test methods or laboratory based procedures listed
in the Appendix.
12

since no assessment of accuracy could be made in these experiments,these differences must be regarded as solely due to fuel arrangementand material configuration. Whether ay or D is selected as the
correlating variable has no apparent advantl^e^^n these comparisons.The underlying complexities present in these processes can be illustratedfrom a study by Saito [24]. He presents ax as a function of compartmenttemperature and ventilation factor (A /H /A) in Figure 7. His laboratorytest data, derived from using a furnance to decompose materials at a
fixed temperature, correlate well with small and large scale compartmentroom lining fires except below compartment temperatures of 700°. Thislow temperature range corresponds to small compartment openings (small
A /H ) in which reduced oxygen concentration tends to Increase ay.
Since the effect of oxygen is not measured in the test data, its influenceon the compartment data is not accounted for.
Another illustration of the limits of simple correlation procedures is
given from the work of Tustin [21]. The OSU combustibility apparatuswas used to determine D at 1.5, 2.5, 3.5 and 5.0 IJ/cm irradiances.
S 2Full-scale results were derived from burning 2.1 m of material for two
simulation conditions under varied external radiation of up to 8.9W/cm in a ventilated Boeing 707 aircraft section. The results shown
in Figure 8 leaves to question the selection of an unambiguous testheat flux.
Now a series of comparisons will be presented in which "noiihomogeneous"smoke parameters were used. In most cases the parameters are relatedto ay or D , in other cases the relationship must be regarded as empirical.Christian and Waterman [42] conducted a series of full-scale room andcorridor fires in which lining materials were ignited by gas burnerexposure fires. The full-scale results were expressed as
(D/L) - (D/L)burner fire
dt
(in which the exposure fire smoke was considered). Y is proportional to
a D since their gases were exhausted at a constant volume flow rate.They compared these results to a variety of test apparatus measurementsincluding the ASTM E84 Steiner tunnel test method, but with its smokeresults given as
/*t
X - (D/L) dt
j o
instead of its standard classification form. They concluded that thesmoke density chamber test in a non-piloted mode gives best results for
fully Involved lining fires in a room as seen in Figure 9. However thetunnel test appeared best for spreading fires in a corridor as illustratedin Figure 10. These illustrations show only a portion of their available
13

data t‘^2], but were selected as Illustrations most consistent with theirconclusions. Fang's result [43] tend to support the tendency of thesmoke density chamber non-flaming data to correlate the results forlining fires in a room (Figure 11). The tunnel classification correlation,in which the (upper) abscissa
X (l-I/l )dt/o
(l-I/I )dt, red oako
appears to yield results of similar character. The tunnel correlationis entirely empirical, but the comparison with the smoke density chambercould have been in terms of D if the ordinate in Figure 11 was dividedby the area burned in each case. This information was not reported.
Although the results of Babrauskas [37-39] are shown in Figure 6, thesewere derived from his data not computed by him. He advocates [39] theuse of ax» but instead he presented a correlation which attempts to
incorporate a fire growth effect for the mattress fire scenario studied
[38]. In that study the full-scale parameter
Y = amax
is plotted against the laboratory test parameter X = (ax)E v/here E is
the rate of energy release averaged over three minutes as derived fromthe NBS II calorimeter or the OSU combustibility apparatus. Thisempirical correlation gives results generally similar to those plottedin Figure 6 for the same experiments.
Finally results were replotted from Moulen, ejt al
.
[44] on linearcoordinates rather than logarithmic coordinates as used by them. Theyburned lining materials in a room's corner subject to a wood crib fire
or by radiant exposure using the heat source provided in the laboratoryEarly Fire Hazard (EFH) test used in Australia. These variables comparedwere
Y JAt
i
t^+At
(D/L)dt
and
X _1_
At
t +AtP
(D/L)dt
tP
where At = 1 minute, t^ is the time flames touchedroom, and t is the time when D reached a maximum,shown in Figure 12.
the ceiling of the
These results are
14

Individual judgement is undoubtedly used in deciding the merits of
these various correlations. Although empirical results may seem to be
positive at times, it is nearly impossible to generalize these resultswith confidence. The overwhelming effect of these comparisons raisesmore questions than gives answers.
COMPARISONS BETOEEN TEST METHODS.
Since various test methods and modifications thereof have been used to
measure the smoke production of a material, it is useful to compareparameters measured in test methods. Under controlled conditions, a
smoke property for a material should be independent of the apparatusthat was used to measure it. It should only depend on the factorslisted previously (i.e. heat flux, scale, etc.)
It was reported by Gross, et al. [15] that the ASTM E-84 Tunnel classi-fication and the smoke density chamber (SDC) in a non-flaming mode did
tend to correlate, but the correlation was poor for the flaming mode.This unexplainable result is consistent with those data presented in
Figures 9 and 11. It might be speculated that the tunnel test fire is
like a fully-developed, ventilation-limited, fire which has an excessof unburned fuel and particulates as would be the case in non-flamingradiative decomposition. Only a thorough study of these phenomenacould unravel the mechanisms producing these results.
In Figure 13, results are compared from the OSU apparatus with the SDCat 2.5 and 5.0 W/cm in a flaming mode [21]. Also both flaming and^non-flaming SDC results are compared with smoke collected in a 18 mclosed room as a result of the British fire propagation test [33]. The
comparison between SDC and OSU should be Identical unless measurementuncertainties are present. The comparison with the British smoke test
agrees best for the non-flaming SDC data. Again, the British firepropagation test very likely is ventilation limited, and perhaps produces"unburned" smoke as in non-flaming decomposition. Finally, recentstudies by Hllado, et al. [45] compare data for wood and plastic materialsusing the SDC and the Arapahoe smoke test. The Arapahoe device exposesa small sample to a (propane) flame for 30 seconds collecting the
particulates on a filter over that 30s period and for an additional 30s
while the burner flame is off. Thus, the heat flux and local environmentare not clearly defined and flaming or non-flaming decomposition occursover some portion of the material. The SDC tests were conducted at the
standard conditions but they presented average results from tests usingtwo different pilot burners. A correlation is perceived by the authors
[45] but not explained and seems dubious at low "Arapahoe values". The
correlating parameters are D (SDC) and m /m (Arapahoe) where m^is the initial sample mass. ^l?^conditions were similar in the twotests, then for the same sample thickness and material it follows from
Eq. (17) that
D = a m /A = a(p6) (m /m )s,max s so
15

where p Is the initial sample density and 6 is its thickness. Thus if
a is a constant for all materials (which appears so in flaming or non-flaming decomposition)
, the D as determined by the SDC shouldcorrelate with (m /m ) but onf;^™i^ the same conditions of heat flux andSOpilot exposure prevail. This is not the case in the Arapahoe system,and hence the correlation is only justified in principle, but notnecessarily by ^heir [45] data. Ou and Seader [46], using a modifiedSDC at 2.5 W/cm with mass monitoring and an Arapahoe Chemical CompanySmoke Chamber with a modified downward burner flame exposure of 45 s,
did demonstrate a reasonable correlation. It was couched in terms of
^L^SDC Arapahoe ^V^SDC
which follows from Eq . (17b). Differences in heat flux conditions muststill be considered and must bear on these results as well.
CONCLUSIONS
This review has attempted to demonstrate how smoke measurements havebeen used to evaluate a material's contribution to fire. These measure-ments primarily pertain to the light transmission characteristic of
smoke and have a direct bearing on visibility. It was shown (Figure 1)
that visibility in smoke (L ) is directly related to the optical densityper unit path length (D/L) , but further depends on lighting conditionsand more specific smoke properties than are currently being measured.The design for visibility through smoke can be approximately carried out
using existing data from current test methods, but more attention needsto be given this problem.
The governing equation for smoke (Eq. (13)) clearly shows the need to
evaluate the parameters: a ("particle optical density") and y (smoke
particulate fraction) in order to predict the extinction (D/L) of lightin smoke or smoke concentration. Currently the parameters most oftenused to characterize smoke have been (maximum) specific optical densityD and so-called "mass optical density", ay- Although these two
pafameters may be convenient and fitting for most practical applicationsthey are not necessarily sufficient or consistent with the requirementsfor calculating smoke concentration and extinction. D is an extensiveparameter representing the accumulation of smoke over time, not its
instantaneous production. The "lumped-parameter" ay is determined by
operations which presume a or y or both are time averaged values. Sincesignificant changes occur over time, suitable time-averaged resultsconsistent with the process of decomposition should be established. ^orexample, smoke produced in the fully-developed fire state must be
discriminated from smoke produced in the fire decay or charring state.
16

D or ax may still be useful representations for smoke, but their basismust be examined more closely relative to the decomposition process and
the imposed environment. Research is required to develop apparatus and
Instrumentation to directly measure a and x along with sample mass lossover the duration of decomposition. Provision should be made to examinethe effect of environmental heat flux and oxygen concentration sincethese appear to have the greatest influence on smoke production. A"steady" flow-through device would be better than a closed systemapparatus for measuring these smoke properties. This would allow walllosses to be minimized and smoke properties to be measured at the flamesource. It could be argued, however, that "aged" smoke might be moreappropriate to measure for fire considerations. The development of anaccurate coagulation and wall loss model to predict the nature andconcentration of smoke as it collects and flows away from a fire wouldeliminate this argument. Ideally both "early" and "long-time" smokemeasurements should be pursued.
An important variable on which smoke production depends is the heatflux received by the material. In a test method this is usually onlycharacterized by the applied external flux. In fact, it is composed of
the flame heat flux and the external flux. In full-scale fires, the
scale and orientation of the material establishes the flame heat flux,
and the structural aspects of the environment control the additional"feedback" heat flux. Predictive techniques have not yet been developedto determine these various heat fluxes from basic principles, particularlywhen radiative components are present. Until the predictions arepossible, well conceived full-scale experiments designed to measurethese heat fluxes could be conducted. The availability of materialdata for smoke in terms of parameters like a, x» ™ their dependenceon applied (or total) incident heat flux would establish a basis for a
prediction. A demonstration of this correlation procedure, more generalthan the "scaling" results of Figure 5, is needed as a step in establishingthe credibility or deflciences of this process. The alternatives areto rely on short-cut correlations, such as D at 2.5 W/cm versus
^ S rn PiyD derived in full-scale; or to use empirical procedures and test
methods, such as the Steiner tunnel which looks like a "big" fire andrates materials relative to red oak.
Although practical applications may have to be simply executed, theycan not be soundly arrived at through incomplete information. Testapparatuses should not be regarded as unique sources of information; it
is the smoke property measured for the material that should be establishedas unique. As can be seen by the data presented in this review, correlationsbetween test methods and full-scale fire data depart as the full-scalefire becomes more complex. Fire spread and ventilation limited con-ditions, usually found after full- involvement of the fuel in an enclosure,have a direct bearing on the smoke production. The conclusion from
17

these data reflects the futility of seeking correlations without a fullunderstanding of the processes. The ability to make fine discrimina-tions for material decomposition and exposure conditions in real firesdoes not exist. But the best use of available test methods could beutilized for the present. To be more relevant they may have to betailored to more accurately match the fire scenario being considered.For example, in the post crash aircraft fire scenario in which thethreat is a large fuel spill fire and safe egress is only viable beforecabin flashover, the pre-flashover exposure heat flux and environmentalconditions could be used to establish test method levels. These heatfluxes are high and both non-flaming (nonpiloted) and flaming smokemeasurements need to be considered. Also fire spread and gas movementwould have to be known or predicted for a complete analysis. Similarapproaches have been already attempted and limited success has beenachieved [21, 22]. More general modeling techniques are also possiblebut their ability to correctly predict fire spread is essential (e.g.
[3]). If the test method data is available in a complete and consistentform for mathematical analysis it could be utilized in relationship to
well-developed fire scenario test measurements and/or predictive modelsfor that scenario. Then relevant correlations or predictions could be
achieved.
18

REFERENCES
1. Lopez, E.L. : J. Fire Flammability, 6, 405 (1975).
2. Alarie, Y. , Kane, L. and Barrow, C. : Sensory Irritation: The Useof an Animal Model to Establish Acceptable Exposure to AirborneChemical Irritants in Toxicology: Principles and Practice , 1 , ed
.
A.L. Reeves, John Wiley (1980).
3. MacArthur, C.D. and Meyers, J.F.: Dayton Aircraft Cabin Fire Model ,
Fed. Aviation Admin. Report, FAA-RD-76-120, I, II, and III (1978).
4. Howell, J.R. and Siegel, R. : Thermal Radiation , III, Nat. Aero,and Space Admin., NASA SP-164, 13 (1969).
5. Jin, T; Visibility through Fire Smoke (Part 2) , Report of the
Fire Research Institute of Japan, No. 33, 31 (1971).
6. Hottel, H.C. and Sarofim, A.F. : Radiative Heat Transfer , McGraw -
Hill, N.Y. (1967).
7. Howell and Siegel, op. cit.,
III, 333-8.
8. Kerker, M. : The Scattering of Light and Other ElectromagneticRadiation , Academic Press, N.Y., (1969).
9. Bromberg, K. and Quintiere, J.G. : Radiative Heat Transfer fromProducts of Combustion in Building Corridor Fires , Nat. Bur. Stand.,NBSIR 74-596, (1975).
10. Foster, W.W. : British J. Appl. Phys., 10, 416 (1959).
11. Seader, J.D. and Ou, S.S.: Fire Research, 1, 3, (1977).
12. Ou, S.S. and Seader, J.D.: J. Fire Flammability, 9, 30 (1978).
13. King, T.Y. : Smoke and Carbon Monoxide Formation from Materials Testedin the Smoke Density Chamber , Nat. Bur. Stand. NBSIR 75-901, (1975).
14. Chien, VJ.P. and Seader, J.D. : Fire Technol., 10, 187, (1974).
15. Gross, D. , Loftus, J.J. and Robertson, A.F.: Methods of MeasuringSmoke from Burning Materials
,Amer. Soc. Testing and Materials, ASTM
STP 422, 166 (1967).
16. Seader, J.D. and Chien, W.P. : J. Fire Flammability, 3, 131, (1974).
17. Seader, J.D. and Einhorn, I.N.: Some Physical, Chemical, Toxicological ,
and Physiological Aspects of Fire Smokes , 16th Symp. (Int.) on Combustion,The Combustion Institute, 1423, (1977).
19

18. Seader, J.D. and Chlen, W.P.: Factors Affecting Smoke Developmentand Measurement
, Unlv. of Utah Report, FRC/UU 17a, UTEC-MSE 74-031(Mar. 1974).
19. Gaskill, J.R., Taylor, R.D. , Ford Jr., H.W. and Miller, H.H.
:
J. Fire Flammability, 8, 160, (1977).
20. Bankston, C.P., Cassanova, R.A. , Powell, E.A. and Zinn, B.T. : J.
Fire Flammability, 7, 165, (1976).
21. Tustin, E.A. : Development of Fire Test Methods for Airplane InteriorMaterials , Boeing Commercial Airplane Co. , NASA Contract No. NAS9-15168Final Rept. NASA CR-14568, (1978).
22. Spieth, H.H., Camrae, J.C. Luoto, R. E. and Klinck, D.M. : InvestigateA Combined Hazard Index Methodology for Ranking an Aircraft CabinInterior Material for Combustion Hazards, Part 1 - Final Rept. Draft,McDonnell Douglas Corp. , DOT, Fed. Aviation Admin. (1981).
23. Brown, Jr. L.J.: Smoke Emissions from Aircraft Interior Materialsat Elevated Heat Flux Levels using Modified NBS Smoke Chamber , Fed.Aviation Admin. Rept. No. FAA-RD-79-26
, (1979).
24. Saito, F. : Smoke Generation from Building Materials , 15th Symp.(Int.) on Combustion, The Combustion Institute, 269, (1974).
25. Saito, F. : Smoke Generation from Organic Materials , Main Reports onProduction Movement and Control of Smoke in Buildings, OccasionalReport of Japanese Assoc. Fire Science and Engineering No. 1, (1974).
26. Tsuchiya, Y. and Sumi, K. : J. Fire Flammability, 5, 64 (1974).
27. Powell, E.A. , Bankson, C.P., Cassanova, R.A. : Fire and Materials, 15
(1979).
28. Breden, L.H. and Meisters, M. : J. Fire Flammability, (1976).
29. Rasbash, D.J.: Trans. J. Plastics Inst., 55 (Jan. 1967).
30. Rasbash, D.J. and Pratt, B.T.: Fire Safety J. 2, 23, (1979/80).
31. Robertson, A.F.: Standardization News, 3, 18 (1975).
32. Shores, N.H.: Some Predictive Aspects of NBS Smoke Chamber Examinationof Combustible Materials
,Armstrong Cork Co. Tech. Res. Rept., (Dec. 1975).
33. Robertson, A.F.: Fire Technol. 10, 282, (1974).
34. Heselden, A.J.M. : Fire Problems of Pedestrian Precincts Part 1 :
The Smoke Production of Various Materials,Fire Research Station, U.K.
,
Fire Res. Note No. 856, (1971).
35. Watts, P.R.: The Assessment of Smoke Production by Building Materialsin Fires, Part 4. Large Scale Tests with Wall Lining Materials ,
FireResearch Station, U.K. ,
Fire Res. Note No. 1013, (1976).
20

36. Parker, W.J. : Comparison of the Fire Performance of Neoprene and
Flame Retardant Polyurethane Mattresses , Nat. Bur. Stand., NBSIR 73-177,
(1973).
37. Babrauskas, V.: Combustion of Mattresses Exposed to Flaming IgnitionSources Part I. ; Full-Scale Tests and Hazard Analysis ,
Nat. Bur. Stand.,
NBSIR 77-1290, (1977).
38. Babrauskas, V.: Combustion of Mattresses Exposed to Flaming IgnitionSources Part II. Bench-Scale Tests and Recommended Standard Test ,
Nat. Bur. Stand., NBSIR 80-2186, (1980).
39. Babrauskas, V.: J. Fire Flammability, 12, 51, (1981).
40. Evans, D.D.: Analysis of Data from Room Fire Test of Parsons Tablesand Comparison with Laboratory Test Methods for Ignition, Flame Spread ,
and Smoke Generation , Nat. Bur. Stand., NBSIR (in review).
41. Woolley, W.D.,Raffery, M.M. , Ames, S.A. and Murrell, J.V. : Fire Safety
J. , 2, 61 (1979/80).
42. Christian, W.J. and Waterman, T.E.: Fire Technology, 8, 332 (1971).
43. Fang, J.B.: Fire Buildings in A Room and the Role of Interior FinishMaterials , Nat. Bur. Stand., NBS Tech. Note 879, (1975).
44. Moulen, A. VI., Grublts, S.J. Martin, K.C. and Dowling, V.P.: Fire and
Materials, 4, 165, (1980).
45. Hilado, C. J. , Machado, A.M. and Murphy R.M. : J. Fire Flammability, 9, 459,
(1978).
46. Ou, S.S. and Seader, J.D. : Fire Research, 1, 135; (1977/78).
4 7 . Standard Test Method for Specific Optical Density of Smoke Generatedby Solid Material , American Society of Testing and Materials, ASTME-662-79, Standards 1980.
48. Proposed Test Method for Heat and Visible Smoke Release Rates for
Materials, American Society for Testing and Materials, Book of
Standards 1980, pp. 1382-1400.
4 9 . Standard Test Method for Surface Burning Characteristics of BuildingMaterials , American Society for Testing and Materials, ASTM E 84-80,Book of Standards 1980.
50. Kracklauer, J.J., Sparkes, C.J. and Legg, R.E.: Plastics Technology,22, 46 (1976).
51. Fire Propagation Test for Material s, British Standard BS 476 part
6 (1968).
52. Methods for Fire Tests and Building Materials and Structures (AS 1530),Part 3, Test for Early Fire Hazard Properties of Materials , StandardsAssociation of Australia, Sydney (1976).
21

lO
CN
CMo>
Pi
•H
•H
>I
D5-1
300'H
|IU) AiniSISIA
D/L,
OPTICAL
DENSITY
PER
PATH
LENGTH
OF
SMOKE
(m
')

\
23
Figure
2.
Conservation
of
Mass
for
Smoke
in
a
Control
Volume
(region
enclosed
by
dashed
lines).

800
700
600
500
400
300
200
100
0
Mas
PILOTED IGNITION
O PANEL No. 233
• VINYL FLOORING No. 230
POLYSULFONE SHEET No. 220
V POLYURETHANE FOAM No. 215
A FABRIC No. 204
10 12
EXTERNAL RADIANT FLUX (W/cm^
)
Optical Density as a Function of Heat Flux Derived from Brown [23].
24

RANKING
AT
11.3W/cm
Os,max RANKING AT 2.5W/cm2
Figure 4. D Rankings at two Flux Levels from Brown [23] for Piloted Ignition.
25

900
800
700
600
500
400
300
200
100
0
5 -
T
LOPEZ
A SHORES
V ROBERTSON
OPEN SYMBOL-FLAMING ^CLOSED CHAMBER
SOLID SYMBOL-NONFLAMING
o>
t^HEAT£ Foo •
JtFLUX
A i
AA
A
A V
AV
^A A V
V
J E.
EH-
100 200 300 400 500 600 700 800
Dj TEST METHOD
D Compared for the Smoke Density Chamber and Large Closed Rooms
from Lopez [1], Shores [32] and Robertson [33]
.
26

(/)
bfl
<N|
E
^3
00
uo (Sji/zUi) x» 3iv3s-iinj
27
Figure
6
Comparison
Between
Full-Scale
and
Test
Method
Results
in
Terms
of
Maximum
Specific
Optical
Density
(D
)and
Mass
Optical
Density
(ay).
s,max

Figure 7
O SMALL-SCALE COMPARTMENT DATA
TEMPERATURE (°C)
- Smoke Production for Plywood as a Function of Temperature (a) and
Ventilation Factor (b) from Saito [24].

OSU
HEAT
FLUX
W/ctn’
3iv3s-nnj -
29
Figure
8.
Full-Scale
Smoke
Compared
to
P
from
the
OSU
Combustibility
Apparatus
at
Several
Heat
Flux
Levels
[21].
^

16
14
12
10
8
6
4
2
0
-2
2 9
o O
A A
A A
• O
A
1QL A
100 200
EXPOSURE
FIRE (kWj
SMOKE
CHAMDENSITY
3ER DATA
FLAMING NDNFLAMING
2900 O •
2200 A A
300 400 SOO 600 700
Ds.max - SMOKE DENSITY CHAMBER
Results from Room Lining Fires Compared to the Smoke DensityChamber from Christian and Waterman [42].
30

o
m
r83Ndna
<
<
o oo <
CO C«J
o
(l/a|-(l/a)] QV38dS 3UIJ 80QI8800UIUIQI
»-<
(U
c'H0)
U
0I
Bo
T)(U
>•H
0)
Ow
iH3W •
0) r—
1
Pi CN
o U_l4J
cT3 nJdJ BV-i 5-1
m OJ
a 4-J
B CO
ou
T3T3 0cO cO
01
Ca CO
CO •H4-1
(U cn
^-1 •H•H 5j
Pn -Cu
o eT3 o•H 5-1
5-1 4-1
5-1
O 4-1
U tfi
QJ
C H•H
t“l
05 QJ
0o 0B 0CO H
o
QJ
D
•Hti-i
31

TUNNEL TEST CLASSIFICATION A
700
600
500
400
300
200
100
0
gure
0 100 200 300
1
A
—1
O •-
_ o
_ o A •
—
O A •
~ o'VaAO* ^
1 L
•
1
O FLAMING
• NONFLAMING
1 1
0 100 200 300 400 500 600
D$ max DENSITY CHAMBER
11 Lining Fires in Rooms and Smoke Data from the Smoke Density Chambe
and the ASTM E-84 Tunnel Classification for Smoke from Fang f43].
Ii-ui| 1/Q ‘anads 3)iiJ iivm woou
33
Figure
12.
Smoke
from
Lining
Fires
in
a
Room
Compared
to
the
Early
Fire
Hazard
(Australia)
Test
Method
[44].

900
800
700
600
500
400
300
200
100
0
o• o
A• O BRITISH FIRE PROPAGATION
TEST IN 18m3 ROOM
OSU APPARATUS @ 2.5 W/cm^
A OSU AND NBS (g) 5.0 W/cm2
OPEN SYMBOL-FLAMING
SOLID SYMBOL-NONFLAMING [SDC]
A
O
O
2A
c9^ A
O
100 200 300 400 500 600
Dg- SMOKE DENSITY CHAMBER (SDC)
700
13 - Comparison of Smoke Density Chamber, OSU Combustibility Apparatus
and British Smoke Test Data 121, 33].
34

APPENDIX
BRIEF DESCRIPTION OF LABORATORY TEST METHODSFOR SMOKE DATA
SMOKE DENSITY CHAMBER . [47]2
A vertical sample is decomposed under 2.5 W/cm irradiance with or
without an igniting pilot flame in a closed chamber. The opticaldensity is measured over a vertical path length in the chamber.
OHIO STATE COMBUSTIBILITY APPARATUS . [48]
A steady-flow system is used in which the optical density is measuredin the exhaust system. Typically a vertical sample is decomposedunder a prescribed irradiance level.
STEINER TUNNEL TEST . [49]A relatively large sample is mounted on the ceiling of a rectangularhorizontal duct in which a diffusion flame initiates flame spread andburning of the material. The light transmission is recorded for theexhaust gases, and the integral of [1-I(L)/I(0) ] over time is normalizedwith that found for red oak as a classification index.
ARAPAHOE SMOKE . [50]A small sample inclined at 10° is subjected to a propane butner flame for
for 30 s and smoke is collected in the effluent stream by a filter for a
total of 60 s.
BRITISH FIRE PROPAGATION /SMOKE TEST . [51]A vertical sample forming a wall of a small vented box is subjected to
an Impinging flame for 20 minutes and additional radiant heat 2.75minutes. The smoke from the box is circulated in a room 18 m ) andthe optical density is measured.
AUSTRALIAN EARLY FIRE HAZARD TEST . [52]The sample is exposed to a 800° radiant panel at decreasing distancesuntil ignition occurs after which the maximum optical density is measuredover a one minute period by light path through the stack over the apparatus.
SUMMARY OF D AND aY DATA FROM LARGE SCALEs , max
AND TEST METHOD-BASED EXPERIMENTS
Tables A-1 through A-6 list the computed values for D or ay. Thecorresponding test apparatuses and full-scale fire test configurationsare displayed in Figure Al. The formulae used in these computations arelisted and are consistent with Eqns. (15) and (17) and the configurationsin Figure A-1.
A-1

REFERENCE FULL-SCALE TEST METHOD
HESELOEN [34]
WAHS [3S]
PARKER [38]
BABRAUSKAS [37.38,39]
( n
Cy
EVANS [40]
. ®®®®®®
ini ®®®
WOOLLEVETAL[41] 2 4m
MOOIFCD SMOKE DENSIH CHAMBER
(SAME AS ABOVEI
SMOKE DENSITY CHAMBER
SAITO [24]
®®®
~r
TEST APPARATUS
BOEING 707 TEST SECTION
igure A-1 - Full-Scale Test Configurations and Test Method Apparatus Used in
Correlation. Symbols Denote Measurement Locations: D-LightTransmission, T-Temperature ,
V-Velocity, m-Mass Loss.
A-2

TABLE A-1. DATA FROM HESELDEN [34]
TestNumber
1
2
3
Material Full-Scale Test Method
ax
Wood
Polyurethane Foam
Polystyrene
(D/L)Vdt
Am,
mkg
100^
2100
600-800^
ax(Dmax
/L)v
mo
2mkg
50
190
180
wood crib
I
cushions
pieces in a pile
A-
3

Table A-2. DATA FROM WATTS [35J
TestNumber Material Full-Scale
t
Test Method
Ds
\ (D/L)Vdt
*^o
^(burned)
(D /L)Vmax
D =-r
^ (burned)
1 Expanded Polystyrene 3.8 43
2 Plasterborad , painted 1.0 63
3 Decorative laminate 4.8 68
4 Wood fibre board, painted 34 101 270
5 Glass reinforcedpolyester(a) polyester based
intumescent coating 220
(1975 (1972' data) data
775
6 (b) water basedintumescent coating 415 960
7 (c) no coating 620 920
A-4

TABLE A-
3
DATA FROM PARKER [36]
Test Number Material Full-Scale Test Method
(D /L)VAtmax
2m
D As,max i
- A« kg mo
S2* Polyurethane no. 2 257 47
U3 Polyurethane no. 1 129 490
T3 Neoprene 319 337
S3 Polyurethane no. 2 63 311
U4 Polyurethane no. 1 337 444
T4 Neoprene 186 535
S4 Polyurethane no. 2 60 394
* 2, 3, A denote different tickings2 - horizontal 3,4 - vertical

TABLE A-4. DATA FROM BABRAUSKAS [37-39]
TestNximber Material Full-Scale Test Method
ax^out (D/L)
(PooTco/Tg) 1^1
m^/kg m^/kg
2-12 Fiberglass with Bedding 82. -
2-3 MOl - Polyurethane 221. 328.
2-2 M02 - Polyurethane 145. 362.
2-1 M03 - Cotton 115. 166.
2-14 M04 - Latex 436. 653.
2-13 M05 - Polyurethane 87. 76.
2-11 M06 - Cotton, nylon, polyester 157. 132.
2-10 MO 7 - Cotton 0. 17.
2-8 M08 - Neoprene 203. 401.
2-6 M09 - Polyurethane 284. 338.
2-5 MIO - Neoprene 215. 467.
* evaluated at time when m is maximum, also ax from control test (bedding) is
subtracted for each material

Table A-5. DATA FROM WOOLLEY, RAFTERY, AMES, MURRELL [41]
TestNumber Material Full-Scale
Ds
•f D * *
Test Method
Ds ,max
Angled HorizontalJets Jets
1 Chipboard 365 390 334
2 Fire Insulation Board 33 77 58
3 Polystyrene 63 222 32
4 Plasterboard 'VO.
88 52
5 Glass reinforced polyester 183 651 616
6 Hardboard 86 79 77
*wood crib smoke subtracted

TABLE A-6. DATA FROM EVANS [4]
Full-Scale Test Method
TestNumber Material Full-Scale Test Method
ax =
^f -S(out)
\ \(D/L)v
Jo JodSdt
2m (I’/Dv _
Am^ kg
7 Polystyrene 1000. 785.
8 Polystyrene 800. 785.
11 Polypropylene 670. 400.
16 Polystyrene foam 820. 790.
17 Polystyrene foam 800. 790.
18 ABS 540. 520.
* questionable, may be too high

Test
Number
Material
Full-Scale
NBS
Smoke
Chamber
OSU
Combustibility
Apparatus
>c<
II
0)
Q
Bo
:s
LO
CO
CMBo
mCM
CM
•K
woII
co
CO
I—
I
3E•Ha:
wCO
u
wop-
d CN CN d CD o d drH 00 vD cr« ?—
4
a^ in o^ro cn
rH
d 00 o CD m un o00 c^ 00 CN p^
CN CN orH
CN CT^ 00 m o vO dtH m cn !—
1
r-- P^ NPCN CN in
• • • • CN CO oO o CN vO rHo CN rH
d in o in CD d d dIT) o 1—
1
1-H m rH nP nPcn rH CN cn .“H 'X) rH
CN CNe Bo o
• • • • . • • •
o m o cn o O m oo r*^ 00 P^ rH rH CNcn <T cn rH • •
00
o O4H 4-4
XdrH 1—
1
4-4 C4-I
„
;5 15
O O00 <ys cn P^ VD CN rH rH
t « • • • • • • 4H C4-i
r>- CO r—i ON in un cnm cn CN vO CN cn U Pi
•H •Hn3 CO
C C•H •H
Oi Eoo bCcnII
4-1 00rH •
oC inO • •
*H c4J o • •
•H c1-H U o3 CO •H
rH 40•r< d CO
CO E T—
1
•r^ 3cu c/2 Eu •H•iH COCIh CO
CO 4.J
!-im m cn r>. X cn cn cn U ooo o rH 00 o o rH rH •iH
IZ <r <r NT •H 'Z, <r NP NP 4.1 rHrH — cn 4-1
CN CN CN vD H-l CN CN CN o cO o rH rH C O O rH rH C-, MNr NT M 3 NT NP NP -X +
A-
9

NBS-114A (REV. 2-80
U.s. DEPT. OF COMM.
BIBLIOGRAPHIC DATASHEET (See instruction s)
4. TITLE AND SUBTITLE
1. PUBLICATION ORREPORT NO.
NBSIR 82-2508
2. Performing Organ. Report No. 3.
DOT/FAA/CT-82/100
Publication Date
July 82
An Assessment of Correlations Between Laboratory and Full-ScaleExperiments for the FAA Aircraft Fire Safety Program, Part 1: Smoke
5. AUTHOR(S)
James G. Qulntiere
6. PERFORMING ORGANIZATION (If joint or other than NBS. see in struction s) 7. Contract/Grant No.
national bureau of STANDARDSDEPARTMENT OF COMMERCE 8. Type of Report & Period Covered
WASHINGTON, D.C. 20234
9. SPONSORING ORGANIZATION NAME AND COMPLETE ADDRESS (Street. City, State. ZIP)
Federal Aviation AdministrationTechnical Center
Atlantic City, N.J. 08405
10. SUPPLEMENTARY NOTES
Document describes a computer program; SF-185, FIPS Software Summary, is attached.
11. ABSTRACT (A 200-word or less factual summary of most significant information. I f document includes a significantbibliography or literature survey, mention it here) extensive review Is presented demonstrating the
nature of comparison between full-scale fire smoke data and test method results for
materials. These correlations are presented in terms of consistent parameters
established through a development of the^governing equations for smoke concentration
and light attenuation. Visibility data pertaining to light transmission through
smoke is presented but no general results exist on the sensory irritant effect of
smoke on vision. Analysis shows the complex dependence of smoke production on many
parameters acting in fire growth and shows the futility and nature of simple corre-
lation attempts. Recommendations are made for further research to establish a
sounder basis for correlations, and a practicle strategy is suggested for proceeding
in the present.
12. KEY WORDS (Six to twelve entries; alphabetical order; capitalize only proper names; and separate key words by semicolon s)
Correlation; full-scale; fire tests; smoke; smoke density chamber; optical density;
test methods; visibility.
13. AVAILABILITY 14. NO. OFPRINTED PAGES
Unl i mi ted
I 1
For Official Distribution. Do Not Release to NTIS 53
1 1
Order From Superintendent of Documents, U.S. Government Printing Office, Washington, D.C.20402. 15. Price
Order From National Technical Information Service (NTIS), Springfield, VA, 22161 $9.00
USCOMM-DC 6043-P80


\
I