Assessment and Evaluation of Objectives and … · Assessment and Evaluation of Objectives and...
13
Assessment and Evaluation of Objectives and Outcomes for Continuous Improvement of an Industrial Engineering Program* K. JO MIN, JOHN JACKMAN and DOUG GEMMILL Department of Industrial and Manufacturing Systems Engineering, 3004 Black, Iowa State University, Ames, IA 50011, USA. E-mail: [email protected] In recent years, ABET accreditation has placed a heavy emphasis not only on the assessment of objectives and outcomes, but also on the evaluation of them and subsequent efforts for continuous improvement based on such an evaluation. Currently, a plethora of assessment tools and conceptual frameworks notwithstanding, there exists a relative paucity of documented efforts on the actual evaluation and subsequent continuous improvement. In this paper, we first concretely (1) show how such assessment and evaluation can be deliberately and systematically conducted in the context of an Industrial Engineering program. We then (2) show how the results of the objectives evaluation lead to the efforts towards continuous improvement through the student outcomes. Through (1) and (2), we enable others to specifically identify and prepare for the critical stages necessary to advance beyond a display of assessment tools and conceptual frameworks and to actually close the loop for a continuous improvement cycle. Keywords: assessment; evaluation; objectives; outcomes; continuous improvement 1. Introduction In engineering programs throughout the USA as well as increasingly in non-US programs, ABET accreditation has often become a mandatory mini- mum standard that must be maintained [1]. At the same time, ABET accreditation has focused not only on the assessment of objectives and outcomes of engineering programs, but also on the evaluation of them and the subsequent efforts towards contin- uous improvement based on such evaluations [2]. In practice, however, there exists a plethora of assessment tools and conceptual frameworks (see e.g., [3], [4] ) and a relative paucity of documented efforts on the actual evaluation and subsequent continuous improvement (see e.g., [5] ). In particular, under these circumstances, it is highly desirable to document step by step how the ABET expectations can be met so that various accreditation stakeholders may be able to specifi- cally identify and prepare for the critical stages necessary to advance beyond assessment tools and conceptual frameworks and to close the loop for a continuous improvement cycle. ABET specifically asks stakeholders to [6]: 1. document your processes for regularly asses- sing and evaluating the extent to which the program’s educational objectives and student outcomes are being attained; 2. document the extent to which the program’s educational objectives and student outcomes are being attained; and 3. describe how the results of these processes are being used to effect continuous improvement in the program. In this paper, in view of these expectations, we aim to contribute by actually demonstrating how each of these expectations can be met step by step in the context of an Industrial Engineering program (see e.g., [7] in the context of environmental sustain- ability education and [8] in the context of interna- tional supply chain education). In so doing, we hope to bridge the gap between the plethora of abstract frameworks and the paucity of documented practices—a little bit at a time. By documenting this practice, we also hope to stimulate discussion in this important area of the outcome and objective assessments and evaluations, as well as the subsequent continuous efforts for improvement. Ultimately, we hope all such activities will positively contribute toward better learning experiences by students in engineering programs. Methodology-wise, our responses to these expec- tations heavily depend on a series of gap analyses (see e.g., [9] ) and exploit triangulations for robust- ness of our findings (see e.g., [10] ). In so doing, for example, it will be clear that the identification of the areas for improvement will be systematic and delib- erate. It will also be clear that the pieces of evidence supporting our findings will come from different assessment methods and from different stake- holders. Hence, it is also hoped that others will be able to understand and rely on such gap analyses and * Accepted 14 September 2012. 520 International Journal of Engineering Education Vol. 29, No. 2, pp. 520–532, 2013 0949-149X/91 $3.00+0.00 Printed in Great Britain # 2013 TEMPUS Publications.
Transcript of Assessment and Evaluation of Objectives and … · Assessment and Evaluation of Objectives and...
Assessment and Evaluation of Objectives and Outcomes for
Continuous Improvement of an Industrial Engineering
Program*
K. JO MIN, JOHN JACKMAN and DOUG GEMMILLDepartment of Industrial and Manufacturing Systems Engineering, 3004 Black, Iowa State University, Ames, IA 50011, USA.
E-mail: [email protected]
In recent years, ABET accreditation has placed a heavy emphasis not only on the assessment of objectives and outcomes,
but also on the evaluation of them and subsequent efforts for continuous improvement based on such an evaluation.
Currently, a plethora of assessment tools and conceptual frameworks notwithstanding, there exists a relative paucity of
documented efforts on the actual evaluation and subsequent continuous improvement. In this paper, we first concretely (1)
show how such assessment and evaluation can be deliberately and systematically conducted in the context of an Industrial
Engineering program.We then (2) show how the results of the objectives evaluation lead to the efforts towards continuous
improvement through the student outcomes. Through (1) and (2), we enable others to specifically identify and prepare for
the critical stages necessary to advance beyond a display of assessment tools and conceptual frameworks and to actually
close the loop for a continuous improvement cycle.
Keywords: assessment; evaluation; objectives; outcomes; continuous improvement
1. Introduction
In engineering programs throughout the USA as
well as increasingly in non-US programs, ABET
accreditation has often become a mandatory mini-
mum standard that must be maintained [1]. At thesame time, ABET accreditation has focused not
only on the assessment of objectives and outcomes
of engineering programs, but also on the evaluation
of them and the subsequent efforts towards contin-
uous improvement based on such evaluations [2].
In practice, however, there exists a plethora of
assessment tools and conceptual frameworks (see
e.g., [3], [4] ) and a relative paucity of documentedefforts on the actual evaluation and subsequent
continuous improvement (see e.g., [5] ).
In particular, under these circumstances, it is
highly desirable to document step by step how the
ABET expectations can be met so that various
accreditation stakeholders may be able to specifi-
cally identify and prepare for the critical stages
necessary to advance beyond assessment tools andconceptual frameworks and to close the loop for a
continuous improvement cycle.
ABET specifically asks stakeholders to [6]:
1. document your processes for regularly asses-
sing and evaluating the extent to which the
program’s educational objectives and studentoutcomes are being attained;
2. document the extent to which the program’s
educational objectives and student outcomes
are being attained; and
3. describe how the results of these processes are
being used to effect continuous improvement in
the program.
In this paper, in view of these expectations, we aimto contribute by actually demonstrating how each
of these expectations can be met step by step in the
context of an Industrial Engineering program (see
e.g., [7] in the context of environmental sustain-
ability education and [8] in the context of interna-
tional supply chain education).
In so doing, we hope to bridge the gap between
the plethora of abstract frameworks and the paucityof documented practices—a little bit at a time. By
documenting this practice, we also hope to stimulate
discussion in this important area of the outcome and
objective assessments and evaluations, as well as the
subsequent continuous efforts for improvement.
Ultimately, we hope all such activities will positively
contribute toward better learning experiences by
students in engineering programs.Methodology-wise, our responses to these expec-
tations heavily depend on a series of gap analyses
(see e.g., [9] ) and exploit triangulations for robust-
ness of our findings (see e.g., [10] ). In so doing, for
example, it will be clear that the identification of the
areas for improvement will be systematic and delib-
erate. It will also be clear that the pieces of evidence
supporting our findings will come from differentassessment methods and from different stake-
holders.
Hence, it is also hoped that others will be able to
understand and rely on such gap analyses and
* Accepted 14 September 2012.520
International Journal of Engineering Education Vol. 29, No. 2, pp. 520–532, 2013 0949-149X/91 $3.00+0.00Printed in Great Britain # 2013 TEMPUS Publications.

triangulations for results that are not haphazardly
obtained/attained, and further facilitate discussion
and exchange of ideas on the methodology side.
The rest of the paper is organized as follows. In
Section 2,wepresent the IE (Industrial Engineering)
program background, program’s educationalobjectives (PEOs), and student outcomes, and
show how they are related. Next, in Section 3, we
present how the assessment and evaluation of the
objectives can be systematically conducted. In Sec-
tion 4, for student outcomes, we show how the
assessment and evaluation are conducted. This is
followed by Section 5, presenting how the results of
the PEO’s evaluation lead to the improvementefforts through the student outcomes. In Section 6,
we further comment on our experiences thus far and
discuss future endeavors. Finally, in Section 7, we
give our conclusions.
2. Program’s educational objectives andstudent outcomes
Iowa State University (ISU) is a land-grant institu-
tion with obligations to teach practical classes that
will provide students with the knowledge to make a
difference in the world. This ISUmission presents a
clear vision for an educational philosophy that
matches closely the goals of the undergraduate
college of engineering: to provide students withthe kind of training that will allow them to make a
difference in our state, nation and around theworld.
To achieve this mission, the Industrial Engineering
(IE) program for the Bachelor of Science (BS)
degree must be responsive to the needs of relevant
industries, such as manufacturing and services.
Hence, the feedback from the relevant industries,
alumni, and current students who often have co-opand internship experiences provide information
that should be used to improve our programs
through efforts towards continuous improvement.
As one can subsequently observe, this ISU mis-
sion-based philosophy greatly influences the assess-
ment and evaluation processes of the IE educational
program objectives (PEOs) and student outcomes,
as well as the IE program continuous improvementprocess. In what follows, we describe the PEOs,
student outcomes, and their relationships.
2.1 Program’s educational objectives
The IE Program educates its future graduates to
accomplish its educational objectives in their early
careers. Specifically, the IE curriculum prepares its
majors so that, within a few years of graduation, thegraduate has
1. made industrial engineering decisions that
result in well-reasoned, value-added solutions;
2. had communicationswith stakeholders that are
informative, persuasive and constructive;
3. made contributions to team goals through
effective team interactions and leadership; and
4. attained new skills and knowledge that advance
their professional practice and enable careeradvancement.
These objectives deliberately and systematically
support the ISUmission as they not only emphasizethe technical achievements, but also professional
practice-related achievements in communications,
teamwork, and continual learning by our alumni.
The primary constituencies of the program and
how they relate to it are: 1. Faculty, 2. Students, 3.
Alumni and 4. Industries. We do note that there are
other stakeholders (but not the primary constitu-
encies), such as university administrators, as well asprofessional societies and other relevant organiza-
tions such as the Institute of Industrial Engineers
(IIE) and ABET.
2.2 Student outcomes
The IE Program has the following student out-
comes.
(a) An ability to apply knowledge of mathematics,
science and engineering
(b) An ability to design and conduct experiments,
as well as to analyze and interpret data
(c) An ability to design a system, component, or
process to meet desired needs within realistic
constraints, such as economic, environmental,social, political, ethical, health and safety,man-
ufacturability and sustainability
(d) An ability to function on multidisciplinary
teams
(e) An ability to identify, formulate and solve
engineering problems
(f) An understanding of professional and ethical
responsibility(g) An ability to communicate effectively
(h) The broad education necessary to understand
the impact of engineering solutions in a global,
economic, environmental and societal context
(i) A recognition of the need for, and an ability to,
engage in life-long learning
(j) A knowledge of contemporary issues
(k) An ability to use the techniques, skills andmodern engineering tools necessary for engi-
neering practice
(l) An ability to design, develop, implement, and
improve integrated systems that include people,
materials, information, equipment and energy
(m) An ability to provide leadership in multi-func-
tional teams.
Outcomes (a) through (k) are the ABET specified
Assessment of Objectives and Outcomes for Improvement of Engineering Program 521
outcomes. We also note that there are two addi-
tional outcomes articulated by our program: Out-
come (l) and Outcome (m). Both of these are
determined by the department faculty, butOutcome
(l) is in part inspired by the Industrial Engineering
Program Criteria, while Outcome (m) is in part
inspired by the IE Industry Advisory Council
(IAC).
2.3 Relationship of student outcomes to program’s
educational objectives
Wefirst show how the student outcomes specifically
prepare graduates to attain the program’s educa-tional objectives, and summarize their relationships
in Table 1 as follows.
2.3.1 Objective 1: Industrial engineering decisions
that result in well-reasoned, value-added solutions.
In order to prepare our graduates to attain this
objective, it is necessary that our students obtain
the technical skills and knowledge specified in Out-
comes (a), (b), (c), (e), (k) and (l). Also, obtaining
Outcomes (h) and (j) will facilitate reaching well-
reasoned, valued-added solutions. The remaining
outcomes not mentioned here will also contribute
positively toward this objective, but with less directrelationships and perhaps less impact. This note is
applicable equally to all other objectives.
2.3.2 Objective 2: Communications with
stakeholders that are informative, persuasive, and
constructive
In order to prepare our graduates to attain this
objective, it is necessary that our students obtain
the skills and knowledge specified in Outcome (g).
Also, Outcomes (d) and (m) provide some of the
best preparations for achieving this objective—
context and industry practice-wise.We believe Out-
come (h) will strongly support the achievement ofthis objective.
2.3.3 Objective 3: Contributions to team goals
through effective team interactions and leadership
In order to prepare our graduates to attain thisobjective, it is necessary that our students obtain
the abilities specified inOutcomes (d) and (m). Also,
Outcome (g) provides some of the best preparation
to achieve this objective—skill and knowledge-wise.
Furthermore, we believe Outcome (f) is essential for
the sustainable attainment of this objective.
2.3.4 Objective 4: New skills and knowledge that
advance professional practice and enable career
advancement
In order to prepare our graduates to attain this
objective, it is necessary that our students obtainthe recognition and ability specified in Outcome (i).
Also, Outcome (j) will facilitate the achievement of
this objective by supplying appropriate and relevant
information on contemporary (not stale or obso-
lete) issues. Furthermore,webelieve that, in the long
run, Outcome (f) is essential for the advancement of
professional practices as well as careers.
2.3.5 Mapping of objectives to outcomes
Table 1 summarizes the mapping of the four pro-
gram educational objectives to the 13 student out-
comes.
So far, we have presented the IE program back-
ground, PEOs, and student outcomes, and showed
how they are related. Next, we show how the
evaluation of the objectives is systematically con-ducted.
3. Assessment and evaluation of program’seducational objectives
The assessment and evaluation process is as follows.With the primary constituencies of the faculty,
alumni, and industries in mind, we first design a
survey that asks, for each program’s educational
objective,
� To what extent have BSIE graduates attained the
following program educational objectives?
� How necessary are the following program educa-tional objectives for the BSIE graduates?
� Howwell has the BSIE Program at ISU prepared
its graduates to attain the program’s educational
objectives within a few years of graduation?
The constituents are asked to provide a numerical
score for each objective between 1 (not at all) to 5(very much/well).
With the primary constituency of the students, on
the other hand, we designed a similar survey that
excludes the first type of question on attainments, as
these attainments are years away.
K. Jo Min et al.522
Table 1.Mapping of objectives to outcomes
Objective/Outcome a b c d e f g h i j k l m
1 6 6 6 6 6 6 6 62 6 6 6 63 6 6 6 64 6 6 6

For the faculty, each faculty member is given the
survey form.At the same time, Year 1 alumni (those
who graduated last year) and Year 3 alumni (those
who graduated 3 fiscal years ago), representing the
alumni, are given the survey forms. Also, each
member of the industry advisory council, represent-ing the industries, is given the survey form. As for
the students, each member of the student focus
group is given the survey form. The student focus
group consists of moremature students with leader-
ship experiences such as peer mentors, student
ambassadors for recruiting, and learning commu-
nity assistants for retention. We do recognize that
the students’ input should be a valuable componentin the objective assessment and evaluation process.
At the same time, some students (e.g., often 18 years
old) may not be in a best position to answer
questions regarding the program graduates’
achievements 3 to 5 years after graduation. Hence,
we are attempting to strike a balance here by
treating the student focus group as a proxy for the
students.The surveys are conducted almost simultaneously
to enhance the validity of the cross-checking across
the primary constituencies later (cf. one constitu-
encywas asked 2 years ago, while anotherwas asked
this year). We further note that there are additional
entry points for input and feedback, namely faculty
meetings as well as industrial advisory council meet-
ings where bi-directional questions and answers arepossible. We also note that we are mindful of the
students’ input revealed in various feedback
mechanisms ranging from written comments in
graduating senior surveys to oral comments
during student focus group meetings.
We note that the current evaluation process, as
conducted in Spring 2011, starts every three years
with the revised program’s educational objectives (ifa revision is needed) within six months or so. Also,
we note that the old evaluation process, as con-
ducted during Fall 2008–Spring 2009, started every
four years with the revised program’s educational
objectives within twelve months or so (hence, the
preceding evaluation was conducted during Fall
2004–Spring 2005, which was before the last generalreview). With these changes, we aim to coincide
betterwith the university-wide changes in its catalog
(e.g., from 2-year catalogs to 1-year catalogs, with
submission deadlines less in advance, towards the
elimination of paper copies, etc.).
In the following two subsections we will discuss
our expectation and results.
3.1 The expected level of attainment of the
program’s educational objectives
Even though we do not have a single number from a
single constituency thatwill assure the attainment ofeach program’s educational objective, we expect
that, for each program’s educational objective, a
satisfactory level of attainment is achieved if the
average numerical scores from the faculty, alumni,
and industries are all higher than 3 (5 best/1 worst)
concurrently. By cross-checking the independent
returns of the three primary constituencies of the
faculty, alumni and industries, we believe that ourconclusion is robust and entirely plausible as the
possibility of all three constituencies coincidently
being wrong is remote. The actual (cf. expected)
levels of attainment will be discussed in the next
subsection.
3.2 Results of program’s educational objectives
assessment and evaluation
The results from the returned survey forms are
summarized in Table 2.
The categories A, B and C represent attainment,
necessity and preparation, respectively. We also
note that there are four aforementioned objectives
Assessment of Objectives and Outcomes for Improvement of Engineering Program 523
Table 2. Average scores of each objective for each constituency
AlumniAverage score Industry Student5 = Best Faculty Year 1 Year 3 (Advisory Council) (Focus Group)
AttainmentA.1 4.31 4.09 4.28 4.20 NAA.2 3.54 3.82 4.56 3.80 NAA.3 4.15 4.45 4.67 4.40 NAA.4 4.15 4.18 4.22 3.60 NA
NecessityB.1 5.00 4.82 4.28 4.57 4.36B.2 4.69 4.82 4.67 4.86 4.30B.3 4.69 4.91 4.78 4.57 4.73B.4 4.85 4.91 4.44 4.29 4.73
PreparationC.1 4.46 3.91 4.50 4.20 3.91C.2 3.46 3.82 4.17 3.60 3.60C.3 3.69 4.09 4.50 4.40 4.36C.4 4.15 4.00 4.17 3.80 4.18

for each category of questions. We further note that
the number of respondents for the faculty, Year 1
alumni, Year 3 alumni, industry advisory council
and student focus group are 13, 11, 18, 7 and 11,
respectively. Finally, the standard deviations range
from 0 (the necessity of Objective 1 according to thefaculty) to 1.22 (the preparation for Objective 1
according to the Year 1 alumni).
From Table 2, we easily observe that the average
numerical scores from the faculty, alumni and
industries are all higher than 3 concurrently. In
fact, the absolute majority of the average numerical
scores are 4 or even higher. Hence, we conclude that
each objective is satisfactorily attained at this pointin time. Furthermore, collectively, the rows of A.1,
A.2, A.3 and A.4 indicate the actual extent of the
attainment for the program’s educational objectives
1, 2, 3 and 4, respectively.
As we have concurrently conducted the survey
across the four primary constituencies, a gap ana-
lysis is visually conducted as follows. Figure 1 plots
the average numerical scores from the faculty, Year1 alumni, Year 3 alumni and the industry advisory
council for each objective (the objective number
follows the constituency symbol) vs. attainment,
necessity and preparation.
For example, if there were a point for an objective
near the origin, then there may an objective that is
unnecessary, unprepared for in our program, and
unattained in the careers of our graduates. Since we
can visually verify that all the average numerical
scores are far from the origin, alongwith the numer-
ical values in Table 2, we conclude that our objec-
tivesarenecessary, prepared for inourprogram,andattained in the careers of our graduates. We also
note that the written comments in the survey forms,
our interaction in the faculty and industrial advisory
meetings, andother input and feedback by and large
confirm the results of our analyses.
Furthermore, we note that similar analyses have
been conducted according to the identical process
for the objective evaluation during Fall 2008–Spring 2009. Finally, we note that we will use the
gap analysis further in our continuous improvement
process, which will be elaborated in Section 5. We
now proceed to Section 4, and present how the
assessment and evaluation are conducted for stu-
dent outcomes, which are the drivers of our efforts
towards continuous improvement in Section 5.
4. Student outcomes assessment andevaluation
In this section, we explain the assessment and
evaluation processes for the student outcomes as
well as the results of such processes in details. For
K. Jo Min et al.524
Fig. 1. Plot of the average numerical scores vs. Attainment, Necessity and Preparation

the assessment of the student outcomes, we employ
a combination of direct and indirect approaches
consisting of instructor-driven rubrics and student-
and alumni-driven surveys.
4.1 Direct assessment by the instructors-driven
rubrics
Let us first explain the instructor-driven rubrics
approach as follows (see e.g., Table 4 for Outcome
(a) ). Even though the student outcomes can be
achieved by IE majors via diverse optional educa-
tional experiences at Iowa State University, which
may include internships and student organizationactivities, the primary way of achieving such out-
comes is through the courses specified in the IE
curriculum course requirements.
These requirements consist of IE and non-IE
courses, some of which are required, while others
are from various lists of electives.We believe that all
these courses contribute significantly towards the
achievement of the outcomes by our students. Toensure that the achievement of all the outcomes is
fostered and facilitated for all IE majors within a
standard IE curriculum, however, the IE program
places great emphasis on 12 courses (consisting of
fundamental manufacturing, human factors, and
operations research courses) that are mandatory
for IE majors. This is consistent with the guidelines
provided by the ABET Program Evaluator (PEV)Refresher Training Program in Module 4 [11],
which specifies that the evidence of the student
outcomes ‘‘should be the product of faculty review-
ing and/or observing student work related to the
program requirements.’’
In particular, these required IE courses serve as a
primary vehicle through which the student out-
comes can be assessed. The mapping of the 12required IE courses to the 13 outcomes, which
specifically shows how these courses are related to
the outcomes, is shown in Table 3.
Table 3 shows the relevance and appropriateness
of each course to various outcomes (marked by6),
which can be assessed as needed. This table does not
necessarily show all the possible or remotely related
outcomes that can be assessed for each course.
When an outcome is assessed in a required IE
course, the instructor is asked to use the pre-
specified rubric for the outcome. The rubric forthe outcome, in turn, consists of three rows of
subcriteria that collectively explain the outcome
and three columns of the degree of achievement
for each subcriterion. For example, the rubric for
outcome item (a) is as shown in Table 4. As one can
observe, the maximum score for a rubric is 18, while
the minimum is 3.
In the early part of each semester, the director ofundergraduate studies, often based on the practice
of past years, invites all the instructors of the
required courses in the semester to assess a few
relevant and appropriate outcomes, shown in
Table 3. In a typical course, the number of outcomes
to be assessed is one or two, but an exception can be
made. For example, due to the summative nature
and value of the outcome assessment conducted inthe capstone design course, more than two out-
comes are directly measured in IE 441. On the
other hand, to strike a balance and to cross-check
the validity, many outcomes are directly measured
across the curriculum outside the capstone design
course. The goal of this assignment is that all 13
outcomes are assessed via the rubrics at least once in
an academic year. Empirically, this goal has alwaysbeen met or exceeded.
In implementing the direct measurement of out-
comes via the rubrics, we closely follow the guide-
lines provided by the ABET Program Evaluator
(PEV) Refresher Training Program in Module 4
[11]. For example, ‘‘appropriate sampling methods
may be used as part of an assessment process.’’
In view of such guidelines, our approach issubstantially different from an approach to assess
each student with respect to each outcome in each
course in every semester (i.e., a significantly inordi-
nate faculty load).
Assessment of Objectives and Outcomes for Improvement of Engineering Program 525
Table 3.Mapping of the required IE courses to the student outcomes
Requiredcourses
Outcomeitems a b c d e f g h i j k l m
IE 101 6 6IE 148 6 6 6 6IE 248 6 6 6 6 6IE 271 6 6 6 6IE 305 6 6 6 6 6 6 6IE 312 6 6 6 6 6IE 341 6 6 6 6 6 6IE 348 6 6 6 6 6IE 361 6 6 6 6 6IE 413 6 6 6IE 441 6 6 6 6 6 6 6 6 6 6 6 6IE 448 6 6 6 6

Once the assignments are made, the instructors
complete and report the direct measurement of the
outcomes before the beginning of the next semester.
Some instructors, for example, use some specific
parts in a course project report, an exam, a home-
work set, etc. When there are more than 20 datapoints for the direct measurement, the instructors
have the option of randomly sampling 20 data
points for the direct measurement. This policy was
instituted in order to avoid any inordinate faculty
program assessment load for the instructors, who
have an enrollment level of perhaps 70 to 80 IE
majors.
Thus far, we have explained the direct assessmentby the instructors-driven rubrics. Let us now pro-
ceed to explain the indirect assessment by the
students and alumni-driven surveys.
4.2 Indirect assessment by the students and alumni-
driven surveys
In addition to the direct measurement via the
rubrics, we also gather the relevant and appropriate
indirectmeasurements via surveys as follows. At the
end of both Fall and Spring semesters, graduating
seniors are asked about each student outcome in the
form of:
Indicate your personal satisfactionwith howyour
undergraduate education in industrial engineer-
ing helped you to: (1 = not satisfied at all; 5 = very
satisfied)
Also, around the midpoint of each academic year,
Year 1 alumni are asked about each student out-
come in the form of :
How well did your education in IE at ISU help
your ability to: (1 = not at all; 5 = extremely well)
We note that perhaps the seniors are the most
appropriate students for the survey as their opinions
by the time of their graduation is summative. We
also note that the Year 1 alumni (who graduated in
the previous calendar year) should provide a differ-
ent, yet valid perspective on their very recent educa-tional experience.
We now explain the assessment and evaluation
processes for the student outcomes as well as our
expectation and results in the following three sub-
sections.
4.3 Assessment and evaluation processes for
student outcomes
For the direct and indirect measurement data of the
previous semester, at the beginning of each seme-ster, the director of the undergraduate studies, with
the help of the chair, curriculum committee, aca-
demic advisor, staff, a graduate assistant, and the
relevant faculty, collect, compile and organize the
data. In addition to the aforementioned three prin-
cipal instruments of outcomemeasurement, wemay
use additional information (qualitative, anecdotal
and/or quantitative) from Faculty and IndustryAdvisory Council meetings, student focus group
meetings, OPAL (Online Performance and Learn-
ing; observation frequency based assessment of co-
op/internship students; co-op/internship is encour-
aged, but not required), inputs from internal and
external administrative units, etc.
The organized data are primarily in the form of
numerical values. Hence, they can be easily evalu-ated quantitatively and objectively by the director
of the undergraduate studies. Depending on the
major findings of this evaluation, in conjunction
with any other relevant input, further evaluation
K. Jo Min et al.526
Table 4. Rubric for outcome (a)
(a) An ability to apply knowledge of mathematics, science and engineering
Performance CriteriaItem Exemplary 5-6 Acceptable 3-4 Poor 1-2 Score
Ability to apply generalmathematical principles
Correct mathematicalprinciples are chosen andapplied without error
In general correctmathematical principles arechosen with minor errors intheir application
Incorrect principles arechosen for the givenengineering problem and/orthere are major errors intheir application
Ability to apply generalscientific knowledge
Demonstrates good generalknowledge of scientificprinciples and the ability tocorrectly apply them toengineering problems
Basic scientific knowledge isdemonstrated with onlyminor errors in applicationto engineering problems
A general lack of scientificknowledge is demonstratedand/or the inability to applythis knowledge toengineering problems
Ability to apply generalengineering knowledge
Demonstrates good generalknowledge of engineeringprinciples and theirapplication to engineeringproblems
Basic engineeringknowledgeis demonstrated with onlyminor errors in applicationto basic engineeringproblems
A general lack of generalengineering knowledge isdemonstrated and/or theinability to apply thisknowledge to basic problems
Total

processes may be necessary; they are elaborated in
the subsection 4.6, ‘‘Further information on out-
come evaluation processes.’’
The current assessment processes for the instruc-
tor-driven rubrics and the graduating student-
driven surveys are for both Fall and Spring seme-sters of each year. TheYear 1 alumni-driven surveys
are for an approximatelymidpoint of each academic
year. To be more precise, since the program’s
educational objectives alumni survey of Spring
2011, the alumni survey has been moved to early
Spring (cf. before Spring 2011, the alumni survey
was conducted late Fall).
4.4 The expected level of attainment for each of the
student outcomes
Wedonot have a single number froma single source
(e.g., instructors, graduating seniors, or Year 1
alumni) that will assure the attainment of eachstudent outcome. However, by the design of the
survey questions (a numerical score of 1 to 5), an
average score of an outcome that is greater than 3 in
a survey can be viewed as evidence illustrating that
the level of the student outcome achievement is
satisfactory. Furthermore, by the design of the
rubrics (a numerical score of 3 to 18), an average
score of an outcome that is greater than 9 (whenaveraged over all corresponding courses and
instructors during an academic year) can be
viewed as evidence illustrating that the level of
achievement is satisfactory.
In general, if andwhen all threemetric values that
are obtained independently of each other support
the fact that the level of the student outcome
achievement is satisfactory (triangulation), then aconvincing case is made that the level of achieve-
ment is indeed satisfactory. In our case, we expect
that, for each student outcome in an academic year
(basically Fall and Spring semesters), the average
numerical scores from the graduating senior and
Year 1 alumni surveys are all above 3 AND the
average rubric score(s) from the primary rubric-
based data set is (are all) above 9 if a satisfactory
level of attainment is achieved. The numerical score
ranges from1 (worst) to 5 (best) in a surveywhile the
rubric score ranges from 3 (worst) to 18 (best).
Concurrently, for the primary rubric-based data
set, we institute the percentage of students with the
rubric score of 9 or higher as an additional perfor-mance indicator. We expect that, for each student
outcome in an academic year (basically Fall and
Spring semesters), this indicator is above 70% if a
satisfactory level of attainment is achieved. Com-
bining this performance indicator with the afore-
mentioned scores, for each student outcome, we
expect that a satisfactory level of attainment is
achieved if the average survey scores are all above3, the average rubric score(s) is (are all) above 9,
AND the performance indicator percentage is
above 70%.
By cross-checking the results from the three
independent sources of the graduating students,
Year 1 alumni, and rubrics, we believe that our
conclusion is robust and entirely plausible as the
possibility of all results from these sources coinci-dently being wrong is remote. The actual (cf.
expected) levels of attainment will be detailed in
the next subsection.
4.5 Results of student outcomes assessment and
evaluation
The primary rubric-based data sets for the last five
semesters are as shown in Table 5 where, within a
class in a semester, the first number is the average
rubric score (18 being the best and 3 being theworst)
and the number in parenthesis is the aforemen-
tioned performance indicator percentage. For the
sake of brevity and compactness, we will presentonlyOutcomes (a), (g) and (i) here, andwenote that,
in an IMSE Working Paper, there is a complete
table for all the outcomes, (a)–(m).
As one can easily observe, the actual attainment
levels typically far exceed the expected attainment
levels.We note that the number of students within a
class (or a section in a class) in a semester varies as
the numbers of IE majors assessed/enrolled in it
Assessment of Objectives and Outcomes for Improvement of Engineering Program 527
Table 5. Rubric-based data sets
ABET Criterion 3 outcomesFall2009
Spring2010
Fall2010
Spring2011
Fall2011
a. An ability to apply knowledge ofmathematics, science, and engineering
IE305A16.07(100%)
IE305B11.00(50%)
IE305A14.89(94.4%)
g. An ability to communicate effectively IE44115.24(100%)
IE44113.55(87.10%)
IE44114.97(100%)
IE44114.22(100%)
IE44114.38(100%)
i. A recognition of the need for, and an ability toengage in life-long learning
IE44115.14(100%)
IE34812.70(100%)
IE44115.13(100%)
IE34814.76(100%)
IE44116.31(100%)

vary. Even in caseswhere the actual attainment does
not appear to far exceed the expectation at a first
glance, a little further investigation confirms that it
actually is the case. For example, for Outcome (a),
the academic year performance indicator percen-tage for Fall 2009–Spring 2010 is actually 94.12%.
We also note that the older data sets of the prior
years exhibit similar characteristics.
As for the graduating students in the same period,
the survey results are as in Table 6 where, within a
semester, the average score for each outcome is
shown (5 being the best and 1 being the worst). As
in Table 5, we will present only Outcomes (a), (g)and (i) here.
As one can easily observe, the actual attainment
levels far exceed the expected attainment levels for
each outcome. We also note that the older data sets
of the prior years exhibit the similar characteristics.
As for the Year 1 alumni in the same period, the
survey results are as in Table 7 where, within a year,
the average score for each outcome is shown (5being the best and 1 being the worst). As in Tables
5 and 6, we will present only Outcomes (a), (g) and
(i) here.
As one can easily observe, the actual attainment
levels far exceed the expected attainment levels for
each outcome. We also note that the older data sets
of the prior years exhibit the similar characteristics.
We also note that the written comments in thesurvey and rubric forms, our interaction in the
faculty and industrial advisory meetings, and
other input and feedback by and large confirm the
results of our analyses. Furthermore, we note that,
all the data in the prior years since the last general
review exhibits the similar characteristics.
All in all, one can observe that all three average
values as well as the performance indicator percen-tage far exceed the expected levels of the satisfactory
attainments. Hence, we conclude that the attain-
ment of these outcomes by the IEmajors by the time
of their graduation has been convincingly demon-
strated (average-wise as well as percentage-wise).
We do note that the summary of the outcomes inand of itself does not seem to radically change in
recent years as the numerical data indicate a high
level of attainment that is consistent and stable. We
also note that we will use these data further in our
continuous improvement process, which will be
elaborated in Section 5.
Finally, as mentioned earlier (Subsection 4.3), for
someoutlying cases, itmay be necessary to employ amore elaborate evaluation process. This is described
in the following subsection.
4.6 Further information on outcome evaluation
processes
As we mentioned in the subsection of 4.3 (Assess-
ment and Evaluation Processes for Student Out-
comes), at the beginning of each semester, a
straightforward and quantitative review of the
numerical values of the available data by the direc-
tor of undergraduate studies is often sufficient toconclude that the student outcomes are achieved at
a satisfactory level. This is consistent with the
Evaluator (PEV) Refresher Training Program in
Module 4 [11], which states that a program does
not have to assess every outcome every year to know
how well it is doing toward attaining student out-
comes (outcomes not assessed every year necessarily
imply that they are not evaluated every year).In any case of unusual deviations from the high
level of attainment that has been consistent and
stable in recent years, or for the outcome items of
special interests such as being a part of efforts
towards continuous improvement for the program’s
educational objectives (see the subsection of 5.1
K. Jo Min et al.528
Table 6. Graduating students’ survey results
ABET Criterion 3 outcomes Fall 2009 Spring 2010 Fall 2010 Spring 2011 Fall 2011
No. of respondents 21 30 31 23 16
a. An ability to apply knowledge ofmathematics, science, and engineering
4.43 4.38 4.55 4.57 4.25
g. An ability to communicate effectively 4.57 4.18 4.65 4.48 4.56
i. A recognition of the need for, and an ability toengage in life-long learning
4.71 4.37 4.74 4.57 4.69
Table 7. Year 1 alumni survey results
ABET Criterion 3outcomes
Year09–10
Year10–11
Year11–12
No. of respondents 14 13 8
a. An ability to apply knowledge of mathematics, science, and engineering 4.36 4.54 4.75
g. An ability to communicate effectively 4.29 4.62 4.13
i. A recognition of the need for, and an ability to engage in life-long learning 4.07 4.58 4.00
Usage of Evaluation Results for Continuous
Improvement of the Program), the director of
undergraduate studiesmay call for amore elaborate
evaluation process as follows:
We note that all steps are on an as-necessary
basis.
1. Around early Fall semester, in the meetings of
the curriculum committee/the faculty, based on
the available data, formal evaluation and
improvement decisions on outcomes are made.
2. During Fall semester, improvement efforts aremade.
3. Around early Spring semester, in the meetings
of the curriculum committee/the faculty, based
on the available data, formal evaluation and
improvement decisions on outcomes are made.
4. During Spring semester, improvement efforts
are made.
5. During the Industrial Advisory Council meet-ing, the council’s input on outcomes are soli-
cited.
Finally, we note that what has been described in this
subsection and the previous subsection of 4.3 is to
effect outcome improvement efforts based on theevaluation of PEOs. We now formally present
our efforts towards continuous improvement as
follows.
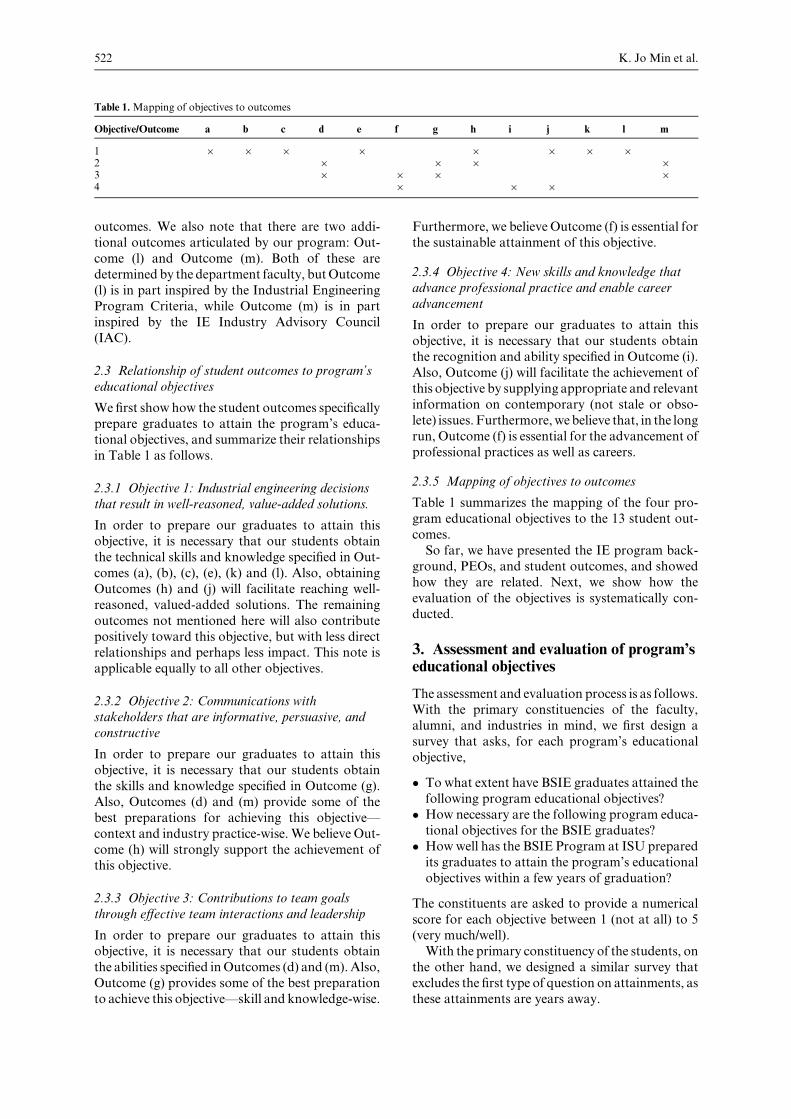
5. Continuous improvement
The continuous improvement process for the objec-
tives and outcomes is depicted in Fig. 2 as follows.The left-hand side cycle is for every 3 years, while
the right-hand cycle is for every semester. By follow-
ing the direction of the primary influence, one can
observe how the outcomes support the later attain-
ment of the objectives and how the objectives can
effect changes in outcomes if and when necessary.
In what follows, we first describe how the pro-
gram’s educational objective evaluations have led to
the efforts towards continuous improvement in thestudent outcomes.
5.1 Usage of evaluation results for continuous
improvement of the program
As one can recall from Section 3, the program’s
educational objective evaluation led to the conclu-
sion that the current objectives are necessary, pre-
pared for in our program, andattained in the careers
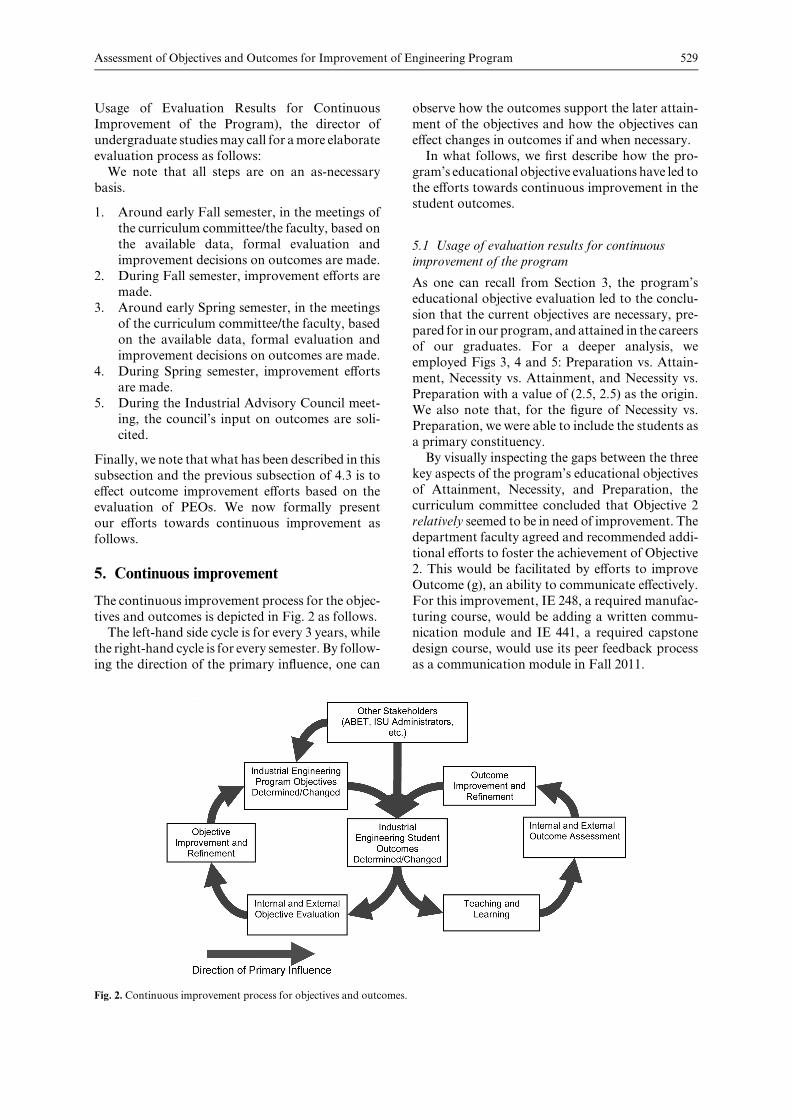
of our graduates. For a deeper analysis, we
employed Figs 3, 4 and 5: Preparation vs. Attain-ment, Necessity vs. Attainment, and Necessity vs.
Preparation with a value of (2.5, 2.5) as the origin.
We also note that, for the figure of Necessity vs.
Preparation, we were able to include the students as
a primary constituency.
By visually inspecting the gaps between the three
key aspects of the program’s educational objectives
of Attainment, Necessity, and Preparation, thecurriculum committee concluded that Objective 2
relatively seemed to be in need of improvement. The
department faculty agreed and recommended addi-
tional efforts to foster the achievement of Objective
2. This would be facilitated by efforts to improve
Outcome (g), an ability to communicate effectively.
For this improvement, IE 248, a required manufac-
turing course, would be adding a written commu-nication module and IE 441, a required capstone
design course, would use its peer feedback process
as a communication module in Fall 2011.
Assessment of Objectives and Outcomes for Improvement of Engineering Program 529
Fig. 2. Continuous improvement process for objectives and outcomes.

K. Jo Min et al.530
Fig. 3. Preparation vs. Attainment.
Fig. 4. Necessity vs. Attainment.
As of now, we do have the following baseline onOutcome (g):
� Fall 2011:
IE 441: 14.38 (100%)Graduating students: 4.56
� Year 11–12:
Year 1 alumni: 4.13
As we track more Outcome (g) data over the next
three years or so (the program objectives evaluation
cycle length is 3 years), we will be able to learn more
about the effectiveness of these improvement initia-
tives and, if necessary, make further efforts.
Through a similar analysis during the Fall 2008–
Spring 2009 program’s educational objective eva-luation, even though the objectives then were
achieved at a satisfactory level, Objective 6 rela-
tively seemed tobe inneed of improvement.Wenote
thatObjective 6was ‘‘new skills and training for life-
long learning and professional development.’’ This
objective has been re-worded to ‘‘new skills and
knowledge that advance professional practice and
enable career advancement’’ in our current Objec-tive 4 to better reflect the recent ABET emphasis on
‘‘broader’’ PEOs.
In response, at that time, the department faculty
recommended additional efforts to foster the
achievement of Objective 6. This was facilitated by
efforts to improve Outcome (i), a recognition of theneed for, and an ability to engage in life-long
learning. For this improvement, IE 348, a required
manufacturing course, added how to utilize profes-
sional magazines in the class and IE 441, a required
capstone design course, added how to learn from
peer feedback in the class.
The outcome data that are most relevant to this
previous initiative are:
� Fall 2009: IE 441: 15.14 (100%)
Graduating students: 4.71Year 1 alumni (prior to the initiative): 4.07
� Spring 2010: IE 348: 12.70 (100%)
Graduating students: 4.37
� Fall 2010: IE 441: 15.13 (100%)
Graduating students: 4.74
Year 1 alumni (after the initiative): 4.58
We observe that the rubrics and graduating senior
survey results seem strong and robust, and the
improvement in the Year 1 alumni survey seems
encouraging.
6. Discussion
Based on our experience, there exist several critical
challenges on the assessment, evaluation, and con-
tinuous improvement. For example, how does one
strike a balance between the ideal conceptual frame-
Assessment of Objectives and Outcomes for Improvement of Engineering Program 531
Fig. 5. Necessity vs. Preparation.
work and current practice with substantial resource
constraints? Such efforts require personnel time as
well asmoney, and in a period of decreasing budget,
it is currently unclear which activities should be
adjusted accordingly.
We also note that our systematic way of contin-uous improvement does not necessarily prevent any
individual instructor from initiating one’s own
improvement endeavors (see e.g., [12] for improve-
ment in leadership, teamwork, and contemporary
issues). Rather, we view the systematic way of
improvement as a required expectation and the
individually initiated endeavors as an elective expec-
tation. Ultimately, they both should be able tosignificantly contribute to better learning experi-
ences by the students in an accredited engineering
program.
From a methodology perspective, as [13] cor-
rectly points out, tracing and attributing any
actual improvement to a particular set of efforts
towards continuous improvement have never been
exact in practice. Therefore, more accurate measur-ing of the degree of such contributions would be
highly desirable.
7. Conclusion
In this paper, we have shown how the assessment
and evaluation of the PEOs and outcomes can be
systematically conducted. We have also shown how
the results of the PEO’s evaluation, which heavily
utilizes gap analysis as well as triangulation, lead to
the efforts towards improvement through the stu-
dent outcomes.
In so doing, we have documented step by stephow the ABET expectations can be met so that
various accreditation stakeholder might be able to
prepare specifically for the critical stages and move
forward to close the loop for a continuous improve-
ment cycle.
References
1. ABETAnnual Report 2008, http://www.abet.org/uploaded-Files/Publications/Annual_Report/abet-2008-annual-report.pdf , accessed May 2012.
2. ABETCriteria forAccreditingEngineeringPrograms, 2012–2013, http://abet.org/engineering-criteria-2012-2013/ ,accessed May 2012.
3. K. Edwards, E. Fernandez, T. Milionis and D. Williamson,EAST: developing an electronic assessment and storage tool,Assessment and Evaluation in Higher Education, 27, 2002,pp. 95-104.
4. R. Miller and B. Olds, An assessment matrix for evaluatingengineering programs, Journal of Engineering Education, 87,1998, pp. 172–179.
5. N. Soundarajan, Programassessment andprogram improve-ment: closing the loop, Assessment and Evaluation in HigherEducation, 29, 2004, pp. 597–610.
6. ABET Self-Study Questionnaire (Engineering), http://abe-t.org/download-self-study-templates/, accessed May 2012.
7. D. Hokanson, L. Phillips and J. Mihelcic, Educating engi-neers in the sustainable futures model with a global perspec-tive: Education, research and diversity initiatives,International Journal of Engineering Education, 23, 2007,pp. 254–265.
8. P. Ball, H.Grierson,K. J.Min, J. Jackman and P. Patterson,Working on an assignment with people you’ll never meet!Case study on learning operations management in interna-tional teams, International Journal of Engineering Education,23, 2007, pp. 368–377.
9. S. Ludi and J. Collofello, An analysis of the gap between theknowledge and skills learned in academic software engineer-ing course projects and those required in real projects,Proceedings of Frontiers in Education Conference, Reno,NV, October 2001.
10. M. Oliver-Hoyo and D. Allen, The use of triangulationmethods in qualitative educational research, Journal ofCollege Science Teaching, 35, 2006, pp. 42–47.
11. ABET Program Evaluator (PEV) Refresher Training Pro-gram in Module 4 at http://www.abet.org/pev-refresher-training-module4/ , accessed May 2012.
12. K. J. Min and W. Shi, Learning improvement in leadership,teamwork, and contemporary issues through a global supplychain project, Proceedings of the ASEE Annual Conference,Vancouver, Canada, June 2011.
13. J. Lohmann, Voice of experience, ASEE Prism, 7, 1998,p. 124.
K. Jo Min is an Associate Professor and Director of Undergraduate Studies in the Department of Industrial and
Manufacturing Systems Engineering at Iowa State University. He teaches courses in sustainable production systems and
market-based allocationmechanisms.His education research interests include continuous improvement for objectives and
outcomes, teaching and learning of global enterprise perspectives, and international student team management and
effectiveness. His research publications have appeared in International Journal of Engineering Education, The Engineering
Economist, IEEE Transactions on Engineering Management, and others. He is a member of IIE and INFORMS.
John Jackman is anAssociate Professor in theDepartment of Industrial andManufacturing Systems Engineering at Iowa
State University. His research interests include enterprise computing, information engineering, and manufacturing
systems engineering.Hehas had extensive experience in the aerospace, defense, pharmaceutical, and software development
industries. His research has appeared in technical papers published in journals by the Institute of Industrial Engineers,
Institute of Electrical and Electronics Engineering, and the American Society of Mechanical Engineers, as well as others.
Douglas D. Gemmill is an Associate Professor of Industrial Engineering and Chair of the Systems Engineering graduate
program at Iowa State University. He teaches undergraduate courses in simulation and stochastic processes and graduate
courses in systems engineering.His professional interests include systems engineering, applied operations research and the
modeling, design, and performance analysis of manufacturing systems. He is a member INCOSE, ASEE, and a senior
member of IIE.
K. Jo Min et al.532