Assessme nt of t he Ba lanced Scorecard app at a ...
118
Mini-di Mas Superv Octobe Asse app issertation sters in Bu P visor: Prof er 2012 essme roach n submitte usiness A otchefstro f Anet Smi nt of t at a p Na Studen ed in parti Administrat oom Camp t he Ba photog by atasha Woo nt no: 2250 al fulfilme tion at the pus of the lanced graphic odall 04923 ent of the r e Potchefs North-We d Scor c com requireme stroom Bu est Univers recard pany ents for the siness Sc sity i d e degree chool,
Transcript of Assessme nt of t he Ba lanced Scorecard app at a ...
Mini-di
Mas
Superv
Octobe
Asse
app
issertation
sters in Bu
P
visor: Prof
er 2012
essme
roach
n submitte
usiness A
otchefstro
f Anet Smi
nt of t
at a p
Na
Studen
ed in parti
Administrat
oom Camp
t
he Ba
photog
by
atasha Woo
nt no: 2250
al fulfilme
tion at the
pus of the
lanced
graphic
odall
04923
ent of the r
e Potchefs
North-We
d Scor
c com
requireme
stroom Bu
est Univers
recard
pany
ents for the
siness Sc
sity
i
d
e degree
chool,

ii
ABSTRACT
The Balanced Scorecard has become vital for companies in order to ensure a
competitive advantage in our ever changing global environment. The Balanced
Scorecard, if applied effectively, will assess whether the company’s vision, mission,
strategy and values are achieved.
The Balanced Scorecard system is a management tool that can be used to transform
strategy into action. The Balanced Scorecard used at Picture Perfect Photography has
been identified as problematic. This study includes a literature study on the Balanced
Scorecard system and an empirical study regarding the application of the Balanced
Scorecard in a specific Photography company.
The literature study set out to evaluate the efficiency of the Balanced Scorecard as it is
applied at Picture Perfect Photography. The secondary objectives defined the Balanced
Scorecard, reviewed the evolution and the need for a Balanced Scorecard. The
literature study further explored the advantages and disadvantages of the Balanced
Scorecard and continued exploring personal development with linking it to
compensation.
The Balanced Scorecard should be used to align the company’s vision and strategy in
order to improve long-term performance. The research indicates that communication
and constant feedback play an important role in the successful implementation of a
Balanced Scorecard approach. The Balanced Scorecard could be a very useful
instrument when implemented and applied effectively.
An empirical study was done including Picture Perfect Photography’s employees, at
different job levels, work sections and years of service. The aim of the empirical study
was to determine how the Balanced Scorecard was used in the alignment with the
company’s strategy, vision, mission and values. Furthermore, the aim was to determine
the problems with the existing Balanced Scorecard and if it helps to focus on quality, re-
iii
engineering and customer services’ initiatives. The study indicated more or less the
same average responses on specific Balanced Scorecard related issues. The majority
of employees responded that feedback and communication of the Balanced Scorecard
were not transparent enough nor was it applied effectively.
Conclusions and recommendations were made in order to identify and improve the
advancement of an effectively applied Balanced Scorecard used at Picture Perfect
Photography for the future.
Key words: Balanced Scorecard, photographic, strategy, development, compensation,
communication.
iv
ACKNOWLEDGEMENTS
My sincerest appreciation goes out to:
God my creator, who is always there for me.
My family, for their patience and support throughout the MBA journey.
Prof Anet Smit, my study leader, whose enthusiasm and advice was invaluable.
Wilma Breytenbach, of North-West University Statistical Consultation Services,
for her assistance with the statistical analysis.
Management and employees at Picture Perfect Photography for the valuable
time and input they afforded me during the study.
To Marie Steenhuisen, my best friend, for her support and help during the past
three years.
The Potchefstroom Business School of the North-West University, for extending
my thinking during the MBA.

v
TABLE OF CONTENTS
ABSTRACT .................................................................................................................... II
ACKNOWLEDGEMENTS .............................................................................................. IV
LIST OF FIGURES ....................................................................................................... VII
LIST OF TABLES ........................................................................................................ VIII
LIST OF ABBREVIATIONS ........................................................................................... IX
CHAPTER 1 NATURE AND SCOPE OF THE STUDY.................................................. 1
1.1. INTRODUCTION ......................................................................................................................... 1
1.2. PROBLEM STATEMENT ............................................................................................................ 2
1.3. OBJECTIVES OF THE STUDY .................................................................................................. 4
1.4. SCOPE OF THE STUDY ............................................................................................................. 5
1.5. RESEARCH METHODS OF THE STUDY .................................................................................. 5
1.6. LIMITATIONS OF THE STUDY .................................................................................................. 7
1.7. CHAPTER SUMMARY ................................................................................................................ 8
1.8. CHAPTER DIVISION ................................................................................................................... 8
CHAPTER 2 LITERATURE REVIEW ............................................................................ 9
2.1. INTRODUCTION ......................................................................................................................... 9
2.2. DEFINITION OF THE BALANCED SCORECARD................................................................... 13
2.3 ALIGNMENT OF THE BALANCED SCORECARD OF THE COMPANY STRATEGY ........... 27
2.4 ADVANTAGES AND DISADVANTAGES OF THE BALANCED SCORECARD .................... 33
2.5 USING THE BALANCED SCORECARD FOR PERSONAL DEVELOPMENT AND LINKING
IT TO COMPENSATION AND OGANISATIONAL LEARNING ........................................................ 45
2.6 FORMULATION AND IMPLEMENTATION OF AN EFFECTIVE BALANCED SCORECARD53
2.7 SUMMARY ................................................................................................................................ 60
CHAPTER 3 EMPIRICAL RESEARCH ........................................................................ 63
3.1 INTRODUCTION ....................................................................................................................... 63
3.2 METHODOLOGY REVIEW ....................................................................................................... 65
3.3 RELIABILITY AND VALIDITY .................................................................................................. 68
3.4 RESULTS OF THE MEASUREMENTS IN THE STUDY .......................................................... 68
3.5 ARITHMETIC MEAN, STANDARD DEVIATION, MINIMUM AND MAXIMUM ........................ 71

vi
3.6 COMPARISON OF OBSERVED AND EXPECTED BEHAVIOURS ........................................ 82
3.7 CHAPTER SUMMARY .............................................................................................................. 87
CHAPTER 4 CONCLUSIONS AND RECOMMENDATIONS ....................................... 89
4.1 INTRODUCTION ....................................................................................................................... 89
4.2 CONCLUSION ........................................................................................................................... 89
4.3 RECOMMENDATIONS ............................................................................................................. 91
4.4 SUMMARY ................................................................................................................................ 93
REFERENCES .............................................................................................................. 95
ANNEXURE A – QUESTIONNAIRE ........................................................................... 105

vii
LIST OF FIGURES
Figure 2.1: Traditional Input-Output Model ............................................. 12
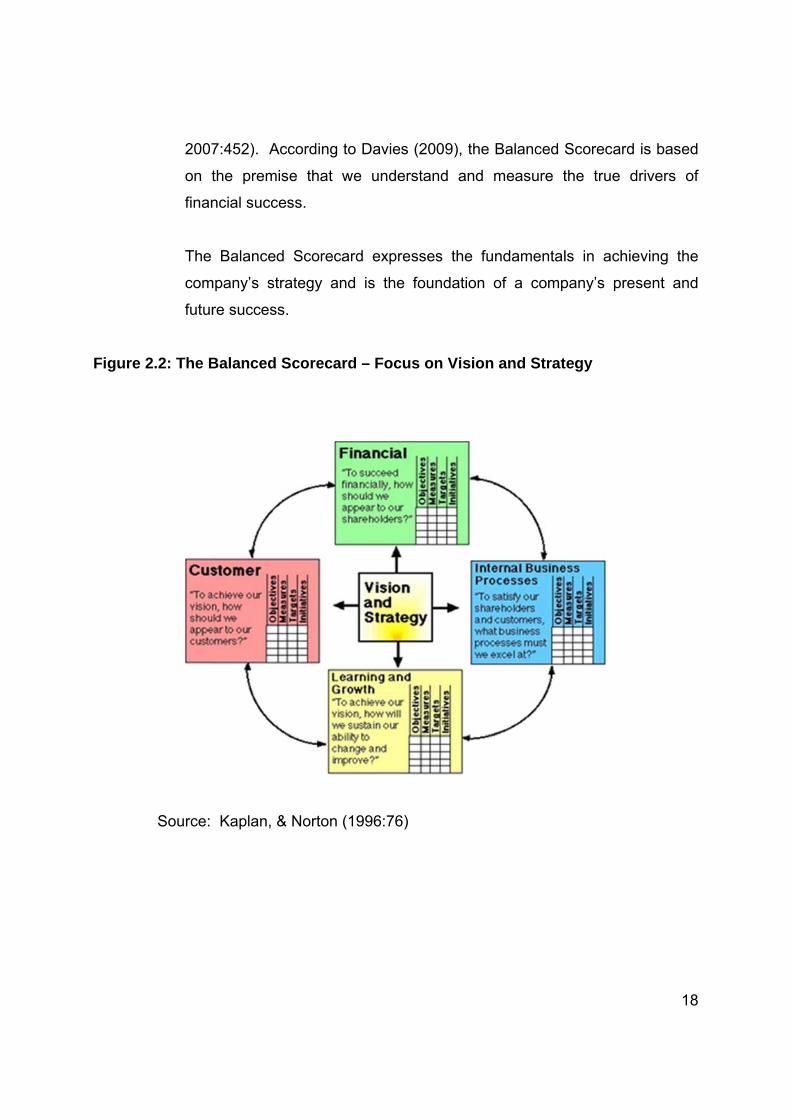
Figure 2.2: The Balanced Scorecard – Focus on Vision and Strategy .. 18
Figure 2.3: The Components of the Balanced Scorecard ....................... 28
Figure 2.4: Federal Procurement Scorecard ........................................... 46
Figure 3.1: Response Rate and Demographics ...................................... 69
Figure 3.2: Response rate average mean values .................................... 78
Figure 3.3: Part C – Response to open ended question ......................... 79

viii
LIST OF TABLES
Table 3.1: Measurement of responses to Part B ........................................... 72
Table 3.2: Question 10 - Job level comparison ............................................. 84
Table 3.3: Question 35 - Job level comparison ............................................. 84
Table 3.4: Question 18 - Age group comparison ........................................... 85
Table 3.5: Question 36 - Age group comparison ........................................... 86
Table 3.6: Question 40 - Age group comparison ........................................... 86
ix
LIST OF ABBREVIATIONS
TQM Total Quality Management
KPI Key Performance Indicator
SMART Specific, Measurable, Attainable and Time-bound
ROE Return on Equity
ROA Return on Assets
ROI Return on Investment
EVA Economic value added
PPP Picture Perfect Photography

1
CHAPTER 1
NATURE AND SCOPE OF THE STUDY
1.1. INTRODUCTION
Companies in today’s day and age need to change constantly to be able to
survive and grow, and in order to meet tomorrow’s challenges, companies need
to be both strategically and operationally excellent.
The Balanced Scorecard (Kaplan & Norton, 1992:71) is a valuable strategic tool
to measure the financial performance, customer focus, internal processes as well
as the learning and growth of a company. Additional to the above-mentioned in
order to create sustainable competitive advantage a company needs to have a
performance measurement system in order to focus on the concepts of value
creation as well as value management. The Balanced Scorecard assists
management to transform the company’s vision and strategy into actions whilst
empowering employees to become innovative in carrying out their daily tasks and
at the same time achieve the vision and strategy.
The Balanced Scorecard, which was introduced by Kaplan and Norton (1992:71),
has become one of the tools widely preferred to improve corporate performance
measurement during the last few decades.
The Balanced Scorecard was developed not only to ensure that companies
moved away from the constricted focal point of traditional financial accounting
measurement of performance, but also to integrate the vision and strategy with
the operations of the company in such a way that in the words of Kaplan and

2
Norton (1992:79) it “keeps companies looking – and moving – forward instead of
backward”.
Picture Perfect Photography is a photography company situated in
Vanderbijlpark. Its niche market focuses on weddings predominantly, but also
include fashion photography, maternity photographs, fine art photography,
birthdays and special occasions. Picture Perfect Photography is a family owned
business with three generations of family. The empirical study aims to evaluate
all employees, the 15 field photographers and their assistants, the 10 Studio
photographers and their assistants, and the three administrative office staff.
The Balanced Scorecard which is currently being used at Picture Perfect
Photography was chosen for this study to be assessed on its application, how
effective it is being applied, and to identify how this system could be improved to
ensure employees have a positive attitude towards the Balanced Scorecard
system by ensuring that the full benefits are used to encourage personal
performance improvements, by employees. In order to apply the Balanced
Scorecard system accurately employees need to know what they will be
measured against to ensure they sustain a competitive advantage.
1.2. PROBLEM STATEMENT
Currently employees at Picture Perfect Photography are very negative about the
Balanced Scorecard. They feel that it does not measure their performance
accurately and remunerations are not based on individual performance.
It could be that the performance indicators on the Balanced Scorecard are not
aligned or very clearly communicated to the stakeholders which could lead to
possible misinterpretations.
3
It often happens that top management compiles the scorecard using figures and
jargon not understood by all levels in the company, making the exercise of the
Balanced Scorecard and setting goals a useless exercise.
If this is not well communicated it could happen that the employees at Picture
Perfect Photography get the opinion that the Balanced Scorecard is a waste of
time and they are being measured on performance indicators which they do not
have any control over. This could lead to employees becoming de-motivated and
having no goals to work towards.
Some of the problems with the interpretation of the Balanced Scorecard could be:
That the Balanced Scorecard is not used correctly in aligning the
company strategy, vision, mission and values.
Staff might not identify with the performance indicators of the current
Balanced Scorecard.
The Balanced Scorecard’s personal content could be inadequately
designed.
It could be that there is a lack of communication between management
and employees.
To ensure that a more adequate Performance Management system is put in
place, the weak points of the existing system needs to be identified, and by doing
so a more effective performance evaluation tool can be put in place.

4
1.3. OBJECTIVES OF THE STUDY
1.3.1. The main objective
The main objective of this study is to evaluate the efficiency of the
Balanced Scorecard approach as it is used at Picture Perfect Photography
and to make recommendations on how to improve the efficiency of the
Balanced Scorecard process so that the employees can gain from it.
1.3.2. Sub objectives
The following sub objectives based on the theoretical research to be done,
are as follows:
To define the Balanced Scorecard.
To analyse the evolution of the Balanced Scorecard
To research the acceptability of the Balanced Scorecard as a performance
management tool.
To research the need for a Balanced Scorecard.
To identify the advantages and disadvantages of the Balanced Scorecard.
To research linking the Balanced Scorecard to personal development and
linking it to compensation.
To explore the problems to implement the Balanced Scorecard.
The following sub objectives are based on the empirical research still to be done:
To determine if the Balanced Scorecard is used in the alignment of the
company’s strategy, vision, mission, and values.
To determine the problems with the existing Balanced Scorecard.
5
To determine if the Balanced Scorecard helps to focus on quality, re-
engineering and customer services initiatives.
To determine if the results of the current Balanced Scorecard is used in
linking the employees’ compensation.
Finally, to make conclusions on the findings in both literature and empirical
studies and make recommendations for improvements.
.
1.4. SCOPE OF THE STUDY
This study will focus on the Balanced Scorecard and the effectiveness of it as a
measurement tool, for all employees as a goal setter within Picture Perfect
photography situated in Vanderbijlpark, Gauteng, South Africa. The study aims
to show how the Balanced Scorecard can be used to improve sustainable
competitive advantage and to ensure sustainable growth and wealth creation
within the company, by guiding employees to reach their personal and company
objectives.
.
1.5. RESEARCH METHODS OF THE STUDY
1.5.1 Literature study
The Balanced Scorecard is viewed and discussed in full to understand
the advantages and disadvantages. This is done by reviewing books
written by Kaplan and Norton, the founders of the Balanced Scorecard.
Research on other authors’ opinions concerning the Balanced Scorecard
is also conducted. Scientific journal articles on the Balanced Scorecard
are also researched. The internet is used to do further research for the
necessary information required to expand the knowledge on the subject.
6
Further to this, research is conducted on other performance
measurement tools used in the business to make comparisons. This will
be done through using the internet and scientific journal articles.
1.5.2 Empirical study
The empirical study can be described in the way Collins (2004:83)
describes it, as being derived from or relating to, experiment and
observation, rather than theory.
A research design ensures that the correct questions are asked, to
ensure that the best possible information is collected concerning the
current Balanced Scorecard system. Employee involvement with the
development of the Balanced Scorecard is of the utmost importance in
any business. The ground work enables us to examine the theories and
practical experience of this discipline. The empirical research was done
through questionnaires given to all employees. The questionnaire was
designed to include demographic information concerning the employee,
for example, Gender, Race, Work Section, Job Level, Years of Service
and Age group.
The information gathered was used to explain in more detail what the
exact situation is at Picture Perfect Photography. Questionnaires were
sent via e-mail to all 15 field photographers and their assistants, 10
studio photographers and their assistants, and 3 administrative office
staff members. The field staffs are demographically spread across
South Africa, they have been assigned areas to work in, and therefore
using the e-mail to communicate with employees was the best option.
All employees have access to e-mail; therefore, there were no problems
for employees to return completed questionnaires, the only problem
was to have these questionnaires returned on time.
7
The research is defined as descriptive and explorative. Exploratory
research is done in an area that has not been studied, whereby the
researcher aims to gather information and ideas, so as to be able to be
focused on a more specific research problem. According to Levine
(2008:3) descriptive research aims in describing something of the data
collected, for example, age group, and job levels and years of service,
by attempting to provide a complete and accurate description of the
situation. The questionnaire had questions which measured the items
by means of a ‘Likert’ scale. The questions were measured on a scale
that varies from (1) strongly disagree, (2) disagree, (3) neutral, (4) agree
and (5) strongly agree. Part of the questionnaire covered open ended
questions to allow employees to express in their own words what their
perceptions are of the Balanced Scorecard. Statistical data was
extracted from the information gathered and analysed in the following
ways:
Descriptive statistics.
General tables to compare mean values.
General graphs.
1.6. LIMITATIONS OF THE STUDY
According to Berg (2007:9), “Researchers are to choose procedures keeping in
mind the problems that may arise in specific research settings, among certain
research groups, and in unique research circumstances”.
Due to the fact that most of the photographers are working in a widespread
area, collection of completed questionnaires returned on time, could be a
problem, therefore careful planning needs to be done. The researcher had to
depend on the participants completing the questionnaires truthfully, and

8
objectively. Due to the fact that the study was done on only one photography
business, the study will be limited to the observations of only one company and
not a general perspective of all photography businesses.
.
1.7. CHAPTER SUMMARY
The aim of Chapter one was to provide a background and holistic overview of the
proposed research. Some of the factors that gave rise to the problem statement
regarding the Balanced Scorecard as it is currently used at Picture Perfect
Photography were discussed. The research objectives, framework, methodology
and layout of the study were outlined. Theoretical and empirical aims to address
the research problem statement were formulated. The empirical study design is a
quantitative study which uses the survey method to collect data, and the
methodology was discussed. Finally the layout of the study was described.
In the following chapter; the results and findings of the literature study are
discussed.
1.8. CHAPTER DIVISION
The chapters will be presented as follows:
Chapter 1: Nature and scope of the study
Chapter 2: Literature review
Chapter3: Empirical study
Chapter4: Conclusions and recommendations

9
CHAPTER 2
LITERATURE REVIEW
2.1. INTRODUCTION
Armstrong and Baron (2005:2), define performance management as a process
which contributes to the effective management of individuals and teams in order
to achieve high levels of organisational performance. As such, it establishes
shared understanding about what is to be achieved and an approach to leading
and developing people which will ensure that it is achieved.
Performance management can also be described as a systematic process by
which a company involves its employees as individuals and members of a group,
in improving company effectiveness in the accomplishment of the company’s
mission and goals. Employee performance management includes:
Planning work and setting goals and expectations.
Continually monitoring performance and giving feedback to the individual.
Developing the capacity to perform (learning and growth).
Periodically rating performance in a summary fashion.
Rewarding good performance.
In effective companies, managers and employees practice good performance
management naturally all their lives, executing each of the above-mentioned key
components in the process well. Goals are set and work is planned routinely
while progress toward these goals is measured and employees get regular
feedback.
10
Organisations use different performance management tools; some of the most
popular tools are discussed in this chapter.
Six Sigma is a management framework and methodology that focuses on leading
the organisation through a continuous improvement process (Rodriguez, 2008:5)
by defining, measuring, analysing and controlling the quality of a company’s
products, processes and transactions (Primus, 2002). The ultimate purpose of
Six Sigma is the elimination of defects and errors.
The Six Sigma method is one of the popular performance management tools
used in organisations. Several academics and researchers have analysed the
Six Sigma framework and implementation process more closely. They came to
the conclusion that the methodology resembles in many ways the Balanced
Scorecard concept (Primus, 2002). Gupta (2005:30) identified several similarities
between Balanced Scorecard and Six Sigma in regards to the finance, customer,
internal processes, learning and growth perspectives, but also in terms of the
vision and measuring system.
Total Quality Management (TQM) has had a significant impact on the approach
to management since its conceptualisation and promotion in the 1980s
(Andersen et al., 2004:364). Total Quality Management as defined by Hoque
(2000:553) is a set of management concepts and tools that aims to involve both
managers and ordinary employees to yield continuous performance
improvements. Anderson et al. (2004:634) refer to Total Quality Management
tools as means to improve growth, profitability and customer satisfaction.
One of the major biases identified as a possible cause for the poor Total Quality
Management, is companies results with poor linkage between quality and
strategic control methods. It is suggested that the successful application of the
Total Quality Management system to the organisational context through one of its
associated tools can be significantly strengthened when combined with a
11
strategic performance management framework, such as the Balanced Scorecard
(Andersen et al., 2004:364).
Hoque (2000:553) reinforces the linkage between Total Quality Management and
the Balanced Scorecard, acknowledging that by using a Balanced Scorecard
approach, organisations that failed in the Total Quality Management initiatives
can get back on track by borrowing insights from the Balance Scorecard
approach.
According to Steyn (2007:35), management by objectives replaces the process in
which the manager sets objectives to be achieved by a participative process. In
this process, the manager and the workers agree on the objectives to be
achieved and how it will be monitored. A specific time is set in which the
objective should be achieved and regular feedback on progress towards the
objective puts the worker in a position to continuously evaluate and rectify his
activities if necessary. Managers use objectives to motivate workers instead of
controlling them. Subsequently, staff knows exactly what is expected from them
and according to which criteria their performance will be measured. Participation
in determining objectives increases acceptance of these objectives.
Anthony and Govindarajan (2001:72) describe the Balanced Scorecard as a
performance measurement system, which “fosters a balance among different
strategic measures in an effort to achieve goal congruence, thus encouraging
employees to act in the company’s “best interest”.
Olve et al., (2003:7) state that, “The Balanced Scorecard concept is based on
three dimensions in time: yesterday, today and tomorrow. This implies that what
we do today for tomorrow may have no noticeable financial impact until the day
after tomorrow." The focus is thus broadened and it is more relevant to keep a
continuous watch on non-financial key ratios. Figure 2.1 below indicates a
traditional input-output model before the introduction of the Balanced Scorecard

c
c
Figure
concept to
chain, from
2.1: Tradi
Source: O
Olve et al
and effec
profit, a b
concluded
future op
subseque
According
Scorecard
of perform
current cu
term fina
measurem
illustrate h
m resource
itional: Inp
Olve et al.
l (2004:8) b
ct, or some
better repu
d that sev
perations a
ent period.
g to Spitze
d to make
mance ma
ustomer, in
ancial suc
ment matte
how goals
input to th
put – Outp
(1999:48).
believes th
e kind of
utation, or
veral of the
and becom
er (2007:9
the compa
anagement
nternal proc
ccess. A
ers, if you c
and meas
e effects o
put Mode
.
hat what is
identified p
a diminis
ese effects
me a kind
91), Kaplan
any strateg
. Measure
cess, emp
According
can’t meas
Results
ures may
obtained.
actually m
priority, for
hed enviro
s will, in tu
d of inpu
n and Nor
gy more im
ements in
loyee, and
to Kapla
ure it, you
s
be placed
meant is the
r example,
onmental i
urn, influen
t for the
rton develo
mplementab
the Balan
d system pe
an and N
can’t mana
along a co
e reflection
, a higher
impact. It
nce the co
operations
oped the B
ble through
ced Score
erformance
Norton (19
age it.
12
onnecting
of cause
reported
could be
ompany's
s of the
Balanced
h the use
ecard link
e to long-
996a:21),
13
Performance measurements should normally allow companies to measure how
well they are performing in reaching their strategic goals and objectives and
what needs to be done to improve the future of the company and to ensure
sustainable competitive advantage.
The objectives of a Balanced Scorecard are to align all members of a company
around the common goals, strategies, vision, mission, values and key success
factors to link initiatives to the strategy, making prioritising easier, providing
feedback to the people on key issues which they can have an impact on, and it
is an essential decision-making tool for everyone in the company (Niven,
2008:315).
This is all undertaken to ensure that the company continues with sustainable
competitive advantage. It is estimated that about 40% of all Fortune 1000
companies have implemented a Balanced Scorecard system (Niven, 2008:315)
2.2. DEFINITION OF THE BALANCED SCORECARD
“The Balanced Scorecard is a system of financial and non-financial measures
that reflect a balance between leading and lagging indicators of performance and
between outcome measures and measures that drive performance” (DeBrusk &
Crabtree, 2006:44).
The features of the Balanced Scorecard is the appearance of a mixture of
financial and non-financial measures as mentioned above, each compared to a
“target” value within a single summarising report. The report is not meant to be a
substitution for traditional financial or operational reports but a, to the point
summary that captures the information most applicable to those using it.
The Balanced Scorecard is effective as it communicates the links between
leading inputs, like human and physical processes, and lagging outcomes, it

14
focuses on the importance of managing these components to achieve the
company’s strategies.
The creative thinking of the Balanced Scorecard was for it to focus on information
describing the implementation of a strategy, and perhaps over time there has
been a vague impression of the limits between usual strategic planning and
control performance; due to this, a need was created to design the Balanced
Scorecard.
The Balanced Scorecard addresses the basic aim of financial profit, the
cornerstone of every business, by revealing the driver stone creating long-term
financial and competitive performance through investment in areas such as
employees, customers, partners and technology, amongst others (McCann,
2000:36). It also aims to close the gap between the business’s strategic vision
and its day-to-day operations and decision-making (Towle, 2000:12).
The four steps in the Balanced Scorecard’s goal is to translate the vision into
operational goals, it communicates the vision and links individual performance. It
continuously gives feedback and learning whilst adjusting the strategy
accordingly.
Managers recognise the impact that measures have on performance in today’s
global competitive environment. Companies need to have a measuring system
which drives actions that will ultimately lead to creating value for its shareholders,
while also encouraging employees to be innovative and grow through the
process of learning and experiencing.

15
The four perspectives as identified by Kaplan and Norton (1992:71) are:
The Financial measurements are important and valuable in summarising the
economic consequences of action already taken (Kaplan & Norton, 1996a:
25). Typical financial indicators include: operating income, revenue growth,
return on equity (ROE), return on assets (ROA), return on investment (ROI),
economic value added (EVA), sales growth and cash flow (DeBrusk &
Crabtree, 2006:45). These measures analyse how the business’s strategy is
affecting the bottom-line. Therefore traditional measures such as growth,
profitability and shareholder value are monitored. A number of goals are
derived from this area of the Balanced Scorecard.
According to Kaplan and Norton (1996a:62), every measure selected for a
Balanced Scorecard, should be part of a link of cause-and-effect relationship,
ending in financial objectives. The financial goals are to survive, succeed
and prosper. Survival is measured by cash flow, success by growth in sales,
operating income and prosperity by an increased market share, return on
equity and capital employed.
The Customer measurements, relates to, “How do existing and new
customers view and value us?” (Kaplan & Norton, 1992:71). The answer to
this question requires customer involvement, as they need to identify their
expectations of the firm and how they measure the firm’s ability to achieve
their goals. Newing (1995:22) emphasised, that for most companies the
price factor only represents 30% of their customers’ total cost of acquiring
material or services. Therefore, businesses need to pay particular attention
to identifying and understanding their customers’ requirements. Another
question that should be considered is: how are you affecting your customers’
results?

16
It is important that managers translate their mission and strategy statements
into specific market and or customer-based objectives. This is the strategy
for creating value and differentiation from the measurement of the customer.
To be able to formulate this measure, managers should know their targeted
customer and market segment. Core outcome measurements in these
measures are: share of market, retention, acquisition, partnerships, loyalty,
satisfaction and profitability. To develop leading indicators, Kaplan and
Norton (1996a:85) suggest that companies strive to select objectives and
measures from the following three classes of attributes.
Product or service attributes of services functionality
Customer relationships.
Image and reputation.
The Balanced Scorecard demands that management must translate their
general mission statement on customer service into specific measure that
reflects the factors that really matter to the customers. Customers are
normally concerned with lead-time, quality of products and services, the
company’s performance with regard to service and the cost-effectiveness
of the product or services.
The Internal business measures, focuses on specific strategies to meet
shareholders’ and targeted customer expectations through the processes,
skills, competencies and technology of the business by typically including
operating efficiency and effectiveness such as labour productivity, process
cycle time, quality and on-time delivery (DeBrusk & Crabtree 2006:45).
The company must decide on what processes and competencies they
must excel at and specifically measure each of them. Innovation
highlights the importance of identifying the characteristics of the market
segment a company wants to satisfy with new products and then also how
to design and develop these products. The Balanced Scorecard must thus
17
allow for considerable weight and measure to encourage research, design
and development work.
Kaplan and Norton (1996:96) suggest that a company’s internal-business-
process measurement can be developed by following a generic value-
chain model which encompasses the following three principal business
processes.
Innovations (research the emerging or latent needs of customers
and create products or services that will meet the requirements or
needs of the customers).
Operations (producing and delivery of existing products and
services to customers); and
Post-sale service (service to customer after the original sale or
delivery of the product or service).
The Learning and growth measures describes the company’s intangible
assets and its role in strategy (Kaplan & Norton, 2004:49). These
measures are the drivers for achieving excellent outcomes in the business
process, the customer and the financial measures. This is the strategy for
continuous improvement and creating value. Learning and growth is
measured in terms of employee skill levels, training hours and employee
turnover (DeBrusk & Crabtree, 2006:45). It focuses on the business’s
ability to change, improve and adapt their products and processes, as well
as the ability to develop and introduce new improved products and
services (Kaplan & Norton, 1992:71). The business must set targets that
respond to continuous change in customer needs (Newing, 1995:22).
In the Balanced Scorecard approach, the focus must always be on
continuous improvement. Companies that do not improve continuously
will eventually lose out to their competitors that do (Garrison et al.,
Figure
2007
on t
finan
The
com
futur
2.2: The B
Source:
7:452). Ac
the premis
ncial succe
Balanced
mpany’s str
re success
Balanced S
Kaplan, &
ccording to
se that w
ess.
d Scorecar
rategy and
s.
Scorecard
& Norton (1
o Davies (2
e understa
rd express
d is the fo
d – Focus
996:76)
2009), the
and and m
ses the fu
oundation o
on Vision
Balanced S
measure t
ndamental
of a comp
and Strat
Scorecard
the true d
ls in achie
pany’s pre
tegy
18
is based
drivers of
eving the
sent and
19
2.2.1 Evaluation of the Balanced Scorecard
The motivation for the study came from the belief that existing methods of
evaluating business performance usually based on accounting and
financial indicators were interfering with the ability of companies to create
economic value for the future. Representatives from dozens of companies
from a variety of economic sectors met every two months during 1990 to
develop a new model of measuring performance. By following the path of
the Balanced Scorecard evolution we follow the path of publications by
Kaplan and Norton.
The earliest Balanced Scorecards comprised simple tables broken into
four sections; these “perspectives” were labelled “Financial”, “Customer”,
“Internal Business processes”, and “Learning and Growth”.
The design required selecting five or six good measures for each
“perspective”. In the 1990s, an improved design method was created; in
this the measures are selected based on a set of strategic objectives or
strategic maps. In the late 1990s, the design approach had been changed
again.
The new Balanced Scorecard’s thinking has developed considerably since
the initial ideas that were proposed in the late 1980s and early 1990s and
the 20th Century performance management tools including Balanced
Scorecard are significantly improved being more flexible and more
effective.

20
1992 - Performance measurement tool
Kaplan and Norton introduced the Balanced Scorecard to the wider public
in 1992. The concept was presented at that time as a performance
measurement tool, used to capture besides the financial measures, the
value-creating activities from a company’s intangible assets (Kaplan &
Norton, 1992:71). A year later, in a new article, they made the first
references about the connection between performance metrics and
strategy (Kaplan & Norton, 1993:167).
1996 - Performance management system
By 1996, the Balanced Scorecard was labelled as a strategic performance
management system, which formed the basis of a rallying framework for
strategic processes, resource allocation, budgeting and planning, goal
setting and employee teaching (Kaplan & Norton, 1996a). Same year they
published the first book on the topic, entitled “The Balanced Scorecard:
Translating Strategy in Action”, which included instructions on how the
concept should be implemented (Kaplan & Norton, 1996b).
2000 - Strategic management and control system
The shift towards a more strategic use of the Balanced Scorecard was
confirmed in a new article published in 2000 (Kaplan & Norton, 2000:167).
The following year, their second book (Kaplan & Norton, 2001a) shined
more light on the move to use the Balanced Scorecard as an all-
encompassing strategic management and control system.

21
2004/5 – Strategy Maps and Office of Strategic Management
The transition from the management accounting school to the strategy
management school is confirmed by the focus on two components of the
Balanced Scorecard framework that supports its strategic role: the
Strategy Map and the Office of Strategic Management (Kaplan & Norton,
2004, 2005a). The strategy map describes the process for transforming
intangible assets into tangible customer and financial outcomes (Kaplan &
Norton, 2000).
2008 – Integration between strategy and operations
A new phase in the evolution of the Balanced Scorecard concept is the
emphasis on its integration role, aligning strategy with operations (Kaplan
& Norton, 2008:62). The Balanced Scorecard is presented as a key
company enabler of strategy execution, which in itself is presented as a
company capability.
2010 – Closer link with risk management and leadership as company
capabilities
As the Balanced Scorecard Forum 2011 illustrated, the emphasis is now
on an even closer integration with other company systems and
capabilities, such as Enterprise Risk Management.
Many authors have predicted the success of the Balanced Scorecard
system, leading us to believe that it will soon become an accepted
managerial practice worldwide.

22
2.2.2 The need for the Balanced Scorecard
Companies continue to struggle with the difficult challenges of our
changing environment, which is brought by market demands, new
technology, and especially in South Africa, with the pressures being
placed on company performance due to a transforming workforce
(Rampersad, 2006:147).
Kaplan and Norton (1993:135) further add three implicit reasons why
companies need the Balanced Scorecard beyond the benefits mentioned
previously. These are as follows:
i. No single measure or set of measures can adequately guide and
motivate the current actions that drive future performance.
ii. Financial results report past performance but are not adequate
predictors or drivers of future performance. Even current financial
performance may be distorted by omitting the effects of current actions
that have created or destroyed future value. Companies need to
balance short term financial performance with long-term growth
opportunities.
iii. Companies must link their strategic objectives to a set of financial and
operational measures in order to clarify and communicate the
objectives and use them for evaluating performance.
In 1996, Kaplan and Norton argued that the Balanced Scorecard acts as a
new strategic management system. The system is expected to link a
company’s long-term strategy with its short-term actions (Kaplan & Norton,
1996a). The Balanced Scorecard is discussed with respect to four critical
management processes, namely clarify and translate vision and strategy,

23
communicate and link strategic objectives and measures, plan, set targets,
and aligns strategic initiatives, and enhances strategic feedback and
learning. Mooraj et al. (1999:481) agree with Kaplan and Norton
(1996a:75) that the Balanced Scorecard may serve as a strategic
management system in a company, and advocate further that the
Balanced Scorecard in practice is a system, which primarily encourages
managers at all levels to make strategic decisions based on the
companies’ common strategies. In developing the Balanced Scorecard
concept further, Kaplan and Norton (1996a:75), present out the benefits
from using the Balanced Scorecard in companies. They argue that the
Balanced Scorecard can be used to:
- Clarify and gain consensus about strategy;
- Communicate strategy throughout the company;
- Align departmental and personal goals to the strategy;
- Link strategic objectives to long-term targets and annual budgets;
- Identify and align strategic initiatives;
- Perform periodic and systematic strategic reviews;
- Obtain feedback to learn about and improve strategy.
Anthony and Govindarajan’s (2007:72) definition of management control
may be related to these statements. They describe management control
as the process by which managers influence other members of the
company to implement the company’s strategies. They place
management control in between strategy formulation and task control.
While strategy formulation focuses on long-term planning, task control
includes short-term activities with a focus on current accurate data.
According to Anthony and Govindarajan (2001:72), the Balanced
Scorecard is a performance measurement system, which aims at
24
implementing strategies. The Balanced Scorecard introduced by Kaplan
and Norton primarily aims at supporting management control.
Thus, the definition has broadened to include both the nature of the end
product and the activity of management control. However, one may reflect
upon the long-term and short-term control of the Balanced Scorecard.
Although Kaplan and Norton do not describe how to put forth vision and
long-term strategies, they argue that the company should work with vision
and strategies. One interpretation from their writing may be that a
company that wants to adopt the Balanced Scorecard must have reached
a certain degree of maturity before it can be fully implemented. There must
be a clear vision and explicit strategies before the Balanced Scorecard can
be adopted (Speckbacher et al., 2003:361).
Widely defused, literature about the Balanced Scorecard has evolved over
the last two decades divided into three dimensions of analysis, namely the
design, the implementation, and the use dimension.
The design dimension of the Balanced Scorecard deals with the content of
the Balanced Scorecard. Kaplan and Norton (1992) suggest that the
Balanced Scorecard framework should include four perspectives, which
encompasses financial and non-financial measures and targets. The
measures should be aligned to the company’s vision and strategy (Kaplan
& Norton, 1993). In practice, the content of the Balanced Scorecard is
being adopted to the specific company. For instance, in Swedish
companies it is popular to include a fifth perspective – employee
perspective – as a complement to the model presented by Kaplan and
Norton (1992).
The implementation dimension of the Balanced Scorecard deals with the
building and introduction of the Balanced Scorecard. Kaplan and Norton
25
(1993) propose an eight-step model for implementing the Balanced
Scorecard although they argue that each company is unique and should
follow its own path for building a Balanced Scorecard. However, empirical
findings show that there are several difficulties in implementing a Balanced
Scorecard, which are not highlighted by its advocates (Radnor & Lovell,
2003:99).
The use dimension of the Balanced Scorecard deals with the outcome of
implementing the concept in terms of company effectiveness. Kanji
(1998:633, 2003:715) and Kanji and Sá (2001:898, 2002:13) argue that
the Balanced Scorecard is primarily used in two ways, namely as a new
information system that helps managers to focus and as a strategic
management system based on the criteria presented by Kaplan and
Norton (1996a).
Kald and Nilsson (2000:113) show that performance measurement
systems are primarily used in decision-making at top management level.
Kennerley and Neely (2002:1222) present a framework of factors affecting
the evolution of performance measurement systems. All these studies deal
with the period after the implementation when the Balanced Scorecard
becomes an integrated part in the company’s day to day work. The relation
between these dimensions can be understood by using a framework for
understanding strategic change by Pettigrew and Whipp (1991:264). Their
model is based on the basic assumption that strategic change should be
considered as a continuous process, which is contextually dependent. The
authors argue that there are three interrelated dimensions that need to be
considered in order to understand strategic change.
Firstly, the content of the strategy including goals, markets and products
constitute the area in which the change takes place. Secondly, the process

26
dimension deals with the change process and it’s concerned with how the
change was implemented.
In this dimension, the content is being realised and formed (Pforsich,
2005:31). Thirdly, the context dimension deals with the surroundings in
which the change takes place. These three dimensions are related in the
sense that the context needs to be considered in order to understand the
content and process dimensions and vice versa. The model can be used
in studying changes other than only strategic changes, since the model
highlights the complexity in general change initiatives.
By using this model on the analytical dimensions of the Balanced
Scorecard, it shows that the content corresponds to the design dimension
since it deals with the elements included in the Balanced Scorecard.
The process corresponds to the implementation dimension. In the
implementation phase the Balanced Scorecard design is formed and
integrated in the company (Pineno & Cristine, 2003:28).
The context dimension is primarily considered in the use dimension. This
dimension deals with how the Balanced Scorecard design is being applied
in work practice with respect to the existing structures, systems and
processes in the company. The use of the Balanced Scorecard depends
very much on the implementation dimension, since the use reflects the
outcome of the implementation of the Balanced Scorecard (Papalexandris
et al., 2004:351, 2005:214).
27
2.3 ALIGNMENT OF THE BALANCED SCORECARD OF THE
COMPANY STRATEGY
According to Coetsee (2003:27), aligned commitment means that all members
of a division or company are committed passionately to achieve the same goal.
In Balanced Scorecard language, the vision, mission and strategy are broken
up into different “perspectives”, as seen through the eyes of business owners,
customers, other shareholders, managers and employees (Venter, 2004:42).
The effectiveness of a company’s strategic orientation requires knowledge to
determine the alignment among different elements (Cummings & Worley,
2005:694). Kaplan and Norton (2004:299) state, that alignment is the necessary
condition before empowering and then the individual will empower the whole
team. Senge stresses (as quoted by Kaplan & Norton, 2004:299) that broad
based company change requires alignment when all team members do not
have a commonality of purpose, a shared vision and an understanding of how
personal roles support the overall strategy.
According to Niven (2005:129), through alignment, one would be harnessing the
greatest resources known to humankind: the minds and hearts of employees.
Cascading the company scorecard through the company is one way of getting
alignment amongst people in order to ensure the company strategy is achieved.
Cascading is the process of developing Balanced Scorecards at all levels of the
company. The scorecards measure lower level business units, departments
and groups to track its progress, in contributing to the overall goals of the
company (Niven, 2005:130).
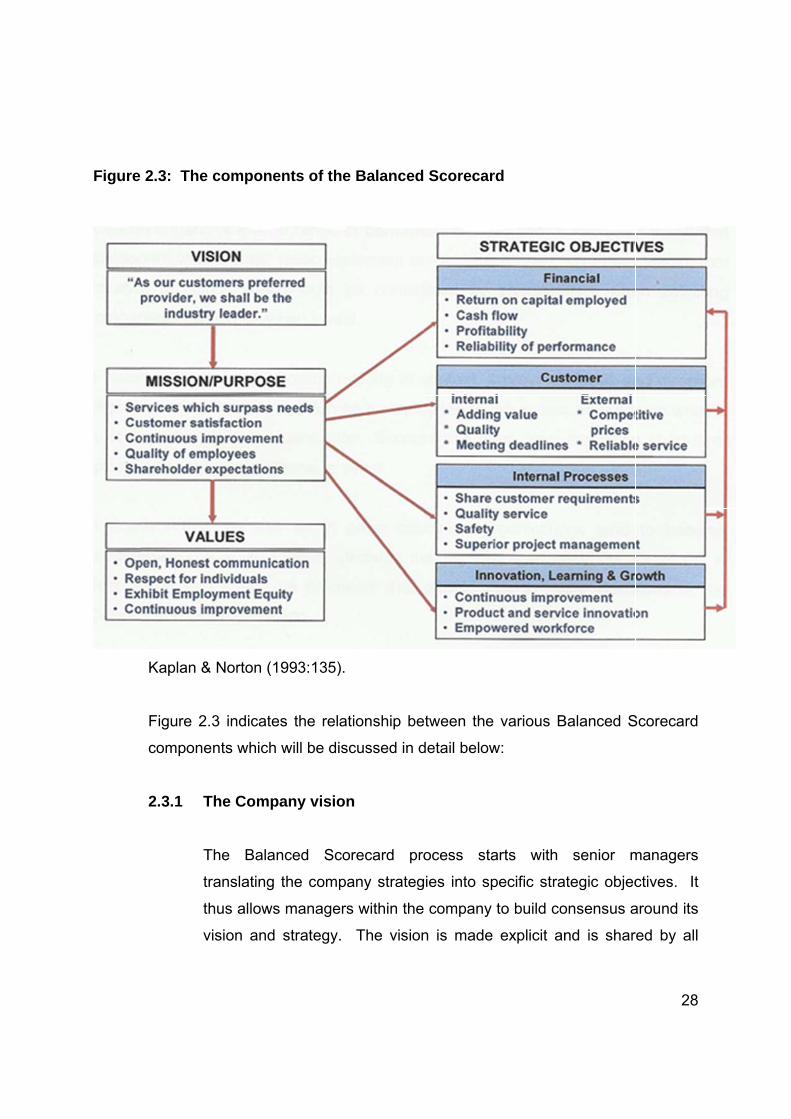
Figure
2.3: The
Kaplan &
Figure 2.
compone
2.3.1 T
T
tr
th
v
componen
Norton (19
3 indicates
nts which w
The Compa
The Balan
ranslating t
hus allows
ision and
nts of the
993:135).
s the relati
will be disc
any vision
nced Scor
the compa
managers
strategy.
Balanced
ionship be
cussed in d
n
recard pro
any strateg
s within the
The vision
Scorecar
etween the
detail below
ocess sta
gies into sp
company
n is made
rd
various B
w:
arts with
pecific stra
to build co
explicit an
Balanced S
senior m
ategic objec
onsensus a
nd is shar
28
Scorecard
managers
ctives. It
around its
red by all

29
employees. It is communicated in terms of goals and incentives (Olve
et al., 1999:17).
Amaratunga et al. (2000:66) reiterated the importance of gaining
clarification and consensus about the vision. Its purpose is to guide and
control an entire company towards attaining a shared conception of the
future.
According to Smit and Cronje (2011:95), for top management to lead
the company to success in the future it needs a strong vision. Smit and
Cronje (2011:96) indicate that a clear vision is important to a company
for the following reasons:
i. A vision promotes change, it serves as a road map for
companies as they move through accelerated change, and thus it
is a vehicle for driving change.
ii. A vision provides the basis for a strategic plan.
iii. A vision enhances a wide range of performance measures. It
has been found that companies with a clear vision statement
outperform those companies that do not possess a vision.
iv. A vision helps to keep decision-making in context, it provides
focus and direction. Companies with a clear vision help
employees to focus their attention on what is most important to
the company, discouraging them from exploiting short-term
opportunities they may otherwise take hold of.
v. In South Africa, as well as in other countries, companies tend to
become managerially leaner and flatter; decision-making
becomes more decentralised. A clear vision can affect the
30
premises that people use to make decisions in the absence of
direct supervision.
vi. A vision motivates individuals and facilitates the recruitment of
talent. A vision should enable employees to see how their effort
contributes to the company’s success. The vision should also
indicate the attributes valued by company, for example,
innovation and knowledge.
vii. A clear vision has positive consequences. When top
management effectively communicates the vision, there is a
significantly higher level of job satisfaction, commitment, loyalty,
pride, and clarity about the company’s values, productivity and
encouragement.
Kaplan and Norton (1996:10) agree that a shared ultimate goal or
strategy that has gained consensus and translates the direction the
company wishes to head in, is the starting point from where a Balanced
Scorecard can be formed.
2.3.2 The Company mission
According to Pearce and Robinson (2005:11), the mission can be
defined as the fundamental, unique purpose that sets the company
apart from other companies of its type and recognise the scope of its
operations in (i) product, (ii) market and (iii) technological terms.
A mission statement, therefore, provides answers to the questions:
a. What is our client, in other words, the product?
b. Who is our client, in other words, what is your market?
31
c. How will we provide this product or service, in other words, what
technology will be used?
Pearce and Robinson (2005:11) go on to say the answers to these
three questions should clearly set the company apart from similar
companies. A mission statement should ensure unanimity of purpose
within the company, and serve as the basis for resource allocation. The
mission statement also sets the parameters within which all decisions
should be made.
2.3.3 The Company values
The value statement of a company is fundamental to how a company
achieves its vision. According to Smit and Cronje (2011:247), it also
plays an integral role in forming company culture in other words how
managers, employees and customers interact and behave towards one
another.
A company should state the following in their value statement or
incorporate it in the mission statement. This is often referred to as the
philosophy of the company (Pearce & Robinson, 2005:11):
The company’s intention to secure its survival through sustained
growth and profitability.
The company’s culture.
The company’s public image.
The self-concept of the company (company strengths).
32
2.3.4 The Company strategy
According to Ehlers and Lazenby (2007:2), they define strategy as the
process whereby all the company function and resources are integrated
and coordinated to implement formulated strategies which are aligned
with the environment, in order to achieve the long-term objectives of the
company and therefore gain a competitive advantage through adding
value for the stakeholders. Competitive advantage is the edge that a
company has over other companies. A strategy can therefore be
defined as an effort or deliberate action that a company implements to
outperform its rivals.
Strategy is about creating a sense of urgency through the setting of an
overarching, ambitious goal that stretches the company and focuses on
winning in the long run.
A vision statement focuses on the future, something better, whereas the
mission statement focuses on the present of the reality. As a
management tool or concept strategy contains elements of both the
vision and the mission. On the one hand it focuses on a future goal or
dream, and also loses its power once achieved. On the other hand it
focuses, in the same way as the mission, on the purpose and strategy
of the company. A company’s vision and mission statement can
articulate or include the company’s strategy.
33
2.4 ADVANTAGES AND DISADVANTAGES OF THE BALANCED
SCORECARD
2.4.1 Advantages
Research done by numerous authors and Kaplan and Norton (2004:92-94)
have indicated that the Balanced Scorecard has many benefits for
companies if applied effectively. According to Coetsee (2003:42),
effectiveness is not only doing the rights things right, but it is to want to do
the right things right.
According to Schneiderman (1996:6), nearly every surviving company has
made dramatic improvements to the obvious areas. Now, the vital few
areas for improvement are much less visible. The Balanced Scorecard
helps to focus the entire company to identify those key areas for
improvement through realistic real-time measurement across multiple
business measurement (Kaplan & Norton, 1993:136). Thus the Balanced
Scorecard needs to be a balance of plenty participation to make it
meaningful yet effortless enough to maintain precision and workability.
The Balanced Scorecard can act as an integrating device, in other words,
an umbrella, for a variety of diverse, often disconnected corporate
programs, such as quality, re-engineering, process redesign and customer
service (Kaplan & Norton, 1993:135).
Company-level measures can be broken down to lower levels in the
company so that local managers, operators and employees can see what
they must do well in order to improve company effectiveness (Kaplan &
Norton, 1993:136).

34
It maintains a balance between building long-range competitive abilities and
recognising investors’ attention to financial reports. Thus financial
measures are viewed in the larger context of the company’s long range
competitive strategies for creating future value through investment in
customers, suppliers, employees, processes, technology, and innovation
(Chow, Haddad & Williamson, 1997:22). It provides a comprehensive view
that overturns the traditional idea of the company as a collection of isolated,
independent functions and departments (Kaplan & Norton, 1993:136). The
Balanced Scorecard helps make strategy operational by translating strategy
into performance and measurement targets (Kaplan & Norton, 1993:135).
Kaplan and Norton (1993:135) further add these implicit reasons why
companies need the Balanced Scorecard beyond the benefits mentioned
previously. These are as follows:
1. No single measure or set of measures can adequately guide and
motivate the current actions that drive future performance.
2. Financial results report past performance but are not adequate
predictors or drivers of future performance. Even current financial
performance may be distorted by omitting the effects of current actions
that have created or destroyed future value. Companies need to
balance short- term financial performance with long-term growth
opportunities.
3. Companies must link their strategic objectives to a set of financial and
operational measures in order to clarify and communicate the
objectives and use them for evaluating performance.
4. The Balanced Scorecard enables a company to integrate its strategic
planning with its annual budgeting process.
5. The Balanced Scorecard measures what matters in order to achieve
breakthrough competitive performance. It helps the entire company to
focus on what must be done to create breakthrough performance.

35
6. It encourages employees to develop initiatives to support the
company’s strategic direction.
7. It breaks down corporate level measures for managers, operators and
employees to see what they must do well, in order to improve the
effectiveness of the company.
8. It forces people to use valid and meaningful data related to key
measures.
9. It helps to meet shareholders’ expectations.
10. It creates a set of measures for benchmarking, forcing management to
consider all operational measures together and focusing on growth
opportunities rather than on individual short-term gains.
11. It sets strategic priorities for process enhancements.
In order for companies to achieve some of the benefits listed, it is important
that the Balanced Scorecard must be implemented and formulated
effectively. An effective Balanced Scorecard will also ensure continuous
improvement. The Balanced Scorecard should be the core management
system, not only the measurement system. A Balanced Scorecard makes
sense primarily for business units and divisions with a well-defined strategy
(Kaplan & Norton, 2005c:11)
2.4.2 Disadvantages
No single system can work for all companies. The Balanced Scorecard has
been analysed by many, one of the assessments of the Balanced
Scorecard is Norreklit (2000:65) that questions some parts of the Balanced
Scorecard. One of the areas that Norreklit analyses is the cause and effect
chain, this is seen as the central part of the Balanced Scorecard. One of the
problems with this as it is presented by Kaplan and Norton (1996a) is that
there is no time dimension presented, therefore it seems like there is no
36
time lag between the stages in the connecting chain. Additional to this
Norreklit questions the fact that Kaplan and Norton takes for granted that
there is a relation between different measures.
This is evident from the arguing that increased customer satisfaction leads
to increased customer loyalty which automatically leads to improved
financial performance (Kaplan & Norton, 1996a). When examining the
sources, that these argument are based on, it is obvious that it is not as
easy as just saying increased customer loyalty will lead to increased
financial performance, partly since the main source used to back-up this
statement is Radnor and Lovell (2003:99) who has a definition of customer
loyalty which means that loyal customers are the ones that “involve low
costs and give high prices” (Norreklit, 2000:73).
Should it happen that Kaplan and Norton’s (1996a) arguments are wrong,
concerning the connecting chain, and it does not work, as presented in
theory, it could result in businesses working with measurements that will not
improve their financial performance and hence create adjusted company
performance (Norreklit, 2000:65).
For companies considering using the Balanced Scorecard, they need to
take into consideration some of the threats of the Balanced Scorecard, so
as to ensure that it does not provide future problems for companies
implementing the Balanced Scorecard:
Decline in worker participation. If staff are not prepared or informed
about the process of change, resistance will develop.
The dominating financial measure is another threat. It is dangerous
to focus too much on financial factors; this can restrict focus which
is linked to planning discussions, and short-term financial

37
considerations can create a gap between strategy development and
implementation.
Taking on too many measures is another threat. Clarity can be lost.
This is crucial as over excess of measures in the scorecard will lead
to follow-ups becoming too complicated. Due to this, the clarity in
reaching the goals can be lost.
Keeping the scorecard alive is also very important. It is essential
that the Balanced Scorecard is maintained, worked on and
improved continuously. The risks of failure increase dramatically if
the measures of the scorecard are considered fixed, or are not
constantly reviewed (Kaplan & Norton, 1996b).
Timing is very important. Change takes time – even if the creation
of the Balanced Scorecard might just take a few months to create,
but it takes years before the whole process is working smoothly
throughout the company.
Due to the above, management needs to be patient; they need to continue
working hard on the implementation (Venkatraman & Gering, 2004:1;
Sioncke, 2005:1023).
Since strategy implementations often fail, Kaplan and Norton have identified
four possible reasons for the shortfall. They argue that the main causes of
poor strategy implementation are (Kaplan & Norton, 1996a, 2001b):
- Visions and strategies are not actionable;
- Strategies that are not linked to departmental, team and individual
goals;
- Strategies that are not linked to long and short-term resource
allocation;
- Feedback that is tactical and not strategic.

38
Kaplan and Norton (1996a, 2006) claim that the first barrier occurs when
the company cannot translate its vision and strategy into terms that can be
understood and acted upon. Where fundamental disagreement exists about
how to translate the vision and mission statement into action, the
consequence is suboptimal use of efforts. With lack of consensus and
clarity, different groups will work after different agendas according to their
own interpretation of the vision and strategy. Their efforts are neither
integrated, nor cumulative, since they are not linked coherently to an overall
strategy.
Ceelman (1998:128) presents a similar barrier. This is named “lack of
understanding of the strategies in the company”. He means that those that
shall execute the strategies may not understand them because they are
uneasy to transform into operative goals.
Furthermore, Thompson and Strickland (2003:41) claim that one cannot
adopt and implement a leader’s vision if one does not know it. If the vision
and strategies are not known to us, one cannot act upon them. They
present ten commandants needed to be in place for change with a strategic
fundament.
They promote that the company’s’ corporate strategies are the starting point
for the change process and the allocation of resources must follow the
strategy. Beer and Eisenstat (2000:29) claim that unclear strategies and
prioritising; may conflict with poor horizontal co-ordination. This may occur
when having different strategies and stakeholders fighting for the same
resources. This also indicates that the understanding of the overall strategy
and action plan is important. The 22 middle managers can’t be expected to
cooperate effectively when top management strategies drive them in
competing directions (Malina &Selto, 2001:47).

39
The second of Kaplan and Norton’s (1996a, 2005b) barriers, arise when the
long-term requirements of the business units and strategy are not translated
into goals for departments, teams and individuals. Instead, departmental
performance remains focused on meeting the financial budgets, established
as a part of the traditional management control process. Likewise, teams
and individuals within departments have their goals linked to achieving
departmental short-term and tactical goals and not on building capabilities
that will enable achievement of longer term strategic goals.
Ceelman (1998:128) is in line with Kaplan and Norton (1996a, 2005b), and
presents a barrier where individual goals and competence development is
not linked to the implementation of strategy. The author also mentions that
the management system often is designed for operational and not strategic
control, and that focus remains on the traditional management control
processes.
On this point, Ceelman (1998:128) argues that managerial information is
connected to budgets and accounts rather than strategy. As the budget is
the key instrument to prioritize, it is also the most powerful tool in
establishing linkage and relationships between departmental and individual
goals and the strategy. Thompson and Strickland’s (2003:108) success
factors point out that a company’s training and education program must be
adjusted and harmonized with the company’s core values. This is one way
to secure that enough resources are used in these areas. Furthermore,
personal acknowledgement and incentive systems are important. They
argue that employees must feel that their works are appreciated to support
the company and what it stands for.
When doing so, the authors claim that the workers are more likely to remain
active and enthusiastic, supporting the objectives of the company. This can
be seen as a support to the Kaplan and Norton’s second barrier.
40
The third barrier of strategy implementation is the failure to link action
programs and resource allocation to long-term strategic priorities. Many
companies have separate processes for long-term strategic planning and
short-term (annual) budgeting. The consequences may be that funding and
capital allocations are unrelated to strategic 23 priorities. Major initiatives
may be undertaken with an inadequate sense of priority with regard to
strategic impact. Monthly and quarterly reviews focus on explaining
deviations between actual and budgeted operations, and not on whether
progress is made towards strategic objectives. Ceelman (1998:128) argue
that management information is tied to budget and accounts, instead of
strategy. Thompson and Strickland (2003:357) argue that successful
implementation of strategy requires that the resource allocation must follow
the company’s strategy.
They claim that the financial focus must emphasise both support of core
activities with sufficient resources and reduce the support towards less
important ones. By doing this, a link is created between the strategies and
the resource allocation.
The final barrier is the lack of feedback on how the strategy is being
implemented and whether it is working. The authors argue that most
management systems of today provide feedback only on short-term
operational performance. They say that the bulk of this feedback is on
financial measures, usually comparing actual results to monthly and
quarterly budgets. Little or no time is spent on examining indicators of
strategy implementation and success. The consequence is that the
companies have no way of getting feedback on their strategy, and without
feedback they have no way to test and learn about their strategy. This is
also pinpointed by Ceelman (1998:128). It concerns whether the company
has out-dated systems and only report on budget and accounting figures.
41
The problem is that they do not report other central parameters for
development of strategy drivers. Thompson and Strickland (2003:410)
support this by arguing that an incentive system must be connected to the
strategy, where it is important to support values that sustain the company’s
strategies. This is a critical success factor in order for succeeding in
implementing strategy changes. One difference between Kaplan and
Norton’s Balanced Scorecard (1996a, 2005a, and 2005b), barriers and the
other theorists is that Kaplan and Norton do not mention leadership style.
This is one barrier addressed by Beer and Eisenstat (2000:29) that
influences the implementation of a strategy. Furthermore, Thompson and
Strickland (2003:359) argue that leaders’ involvement is important. The
leadership style influences the culture, power, and politics, at the same time
as they are responsible for the process.
The Balanced Scorecard does not address leadership 24 motivations and
trust. However, Kaplan and Norton (2001a) state that the most important
driver of success in strategy implementation is the top management
leadership style, and not the tool itself. The authors argue that the
leadership style has a larger effect than the analytical and structural
strength of the tool. They motivate this by referring to experiences of
leaders that have managed a successful Balanced Scorecard
implementation emphasising communication as the largest challenge.
These top managers understood that they could not get the strategy
implemented without an extensive involvement from middle managers and
other employees. Furthermore, the top manager did not know all steps that
had to be enforced for a successful implementation. However, they held a
clear opinion of how the success should be and the goals that had to be
achieved. The top managers depend on the employees to take part in
making the vision operational and institutionalized (Kaplan & Norton,
2001a). Top managers’ influence and trust will therefore be a critical
42
assumption for the Balanced Scorecard to work as a strategy
implementation tool.
Finally, both Beer and Eisenstat (2000:29) and Thompson and Strickland
(2003:420) address how companies’ cultures affect the strategy
implementation. Bayer et al. (1997:3) direct focus on how the
implementation is made has consequences for the result of the strategy
implementation. As pointed out, Kaplan and Norton (1996a, 2005a, and
2005b) do not have one particular implementation model.
According to Kaplan and Norton (as quoted by Bhatia, 2008:137), the basic
problem of the Balanced Scorecard is that it sometimes states too many
goals. These goals are often difficult to achieve, especially in a company,
where there are chances of clashes arising among business units.
Many managers have stated that the Balanced Scorecard is not as
straightforward as it appears. Kaplan and Norton (1996:284) suggest that
these failures can be categorised in two main categories:
Structural defects (choice of measures), and
Company defects (process of developing and implementing the
Balanced Scorecard).
Structural defects come about when managers attempt to supplement
already existing financial measures with non-financial measures like market
share and customer satisfaction. These non-financial measures, however,
already contain defects of traditional financial measures – they are generic,
lagging and report on how well the company’s strategy has worked in the
past. Managers need to balance leading indicators with the lagging
indicators to achieve excellent long-run financial performance (Kaplan &
Norton, 1996:285).
43
Company defects come about due to not enough development and
implementation of the Balanced Scorecard. The Balanced Scorecard
development should be led by senior executives and should not be based
on general measures used by other industrial leading companies, but be
derived for breakthrough performance. The Balanced Scorecard is a
dynamic process and should be reviewed continuously – rather start the
process and keep on learning how to manage with a balanced set of
performance drivers and outcome measures (Kaplan & Norton, 1996:286).
Schneiderman (1996:6) identifies six main reasons for failures of the
Balanced Scorecard:
a. The non-financial variables are incorrectly identified as primary
drivers of future stakeholder satisfaction.
b. The metrics are poorly defined.
c. Improvement goals are negotiated. These goals should be built on
stakeholder requirements, fundamental process limits, and
improvement process capabilities.
d. There is no deployment system that breaks down high-level goals to
the level where actual improvement activities reside (loss of line of
sight).
e. No state-of-the-art improvement system.
f. There is no quantitative linkage between the non-financial and
anticipated financial results.
Problems can also occur if the performance measures used by managers in
the Balanced Scorecard are not consistent with or follow the company’s
strategy. Problems can also occur to a significant extent if the performance
measures are not understandable and controllable by those being
evaluated. This will lead to de-motivated employees. Further problems that
could occur if the Balanced Scorecard has too many performance
44
measures could be a lack of focus and confusion (Garrison et al.,
2007:452).
Spitzer (2007:92) said that Balanced Scorecards are viewed as “panacea”
and are often used as a quick fix. The Balanced Scorecard system will not
work in companies where the strategic differences are not resolved
adequately.
Niven (2002:317) state that companies need to be on the look-out not to fall
prey to at least one of the following Balanced Scorecard implementation
issues:
Premature links to management processes
Lack of cascading
Terminology use
No new measures
Consistent management practices
Timing
No objectives for the scorecard
No strategy
Lack of training and education, and
No executive sponsorship.

45
2.5 USING THE BALANCED SCORECARD FOR PERSONAL
DEVELOPMENT AND LINKING IT TO COMPENSATION AND
OGANISATIONAL LEARNING
The Balanced Scorecard allows for a merging of factors to be included to
measure company and individual performance. These include strategic, well-
defined values, strategy aligned structure, sound processes, courageous
leadership, skilled people and importantly, a high performance and learning
culture. The learning and growth measure of a Balanced Scorecard is the most
important factor, as it holds it all together and makes a distinction between the
company and its competitors (Rampersad, 2006:148).
The Balanced Scorecard shows the importance of investing in the future. The
investments include people, systems and procedures. According to Kaplan and
Norton (1996:127), the following three principal categories for the learning and
growth measure apply:
Employee capabilities
Information system capabilities; and
Motivation, empowerment and alignment.

Figure
I
i
m
S
2.4: Fede
Kaplan &
It is impor
individual.
managers
Scorecard
ral Procur
Norton (19
rtant that t
Dr Hube
can gre
.
rement Sc
996a:75).
his measu
ert Ramspe
atly bene
corecard
ure is used
ersad (200
efit from
d as a sel
06:15) not
a well-str
f-developm
ted that bo
ructured p
ment proce
oth individ
personal B
46
ess of an
uals and
Balanced

47
These benefits include the following:
For the individual
Better understanding of one’s self and increased self-esteem.
Self-actualisation.
Greater satisfaction and inner involvement in the work (happiness is
enhanced at the work by reducing the gap between company life and
private life).
Working smarter instead of harder (we become more creative as we grow;
we become good time-managers).
Greater usage of individuals’ mental capacity and productivity; and
Increased personal responsibility (the more competent people become the
more confident they become to take on more complex work).
For the manager
Higher employee commitment.
Greater customer satisfaction (employees deliver quality work on time).
Improved employee performance.
Essentially motivated employees.
Less absenteeism and grievances for the company (stress and burnout
are reduced).
Individual and team empowerment (individuals start to trust fellow workers
and share personal ambition and knowledge).
Increased innovation.
Effective talent management (taking up challenges and developing of
related skills).
Effective diversity management; and
Sustainable company effectiveness.

48
The pay component of the equation keeps everyone committed to do whatever it
takes to achieve the scorecard targets (Niven, 2005:148). Niven (2002:244) says
that linking the Balanced Scorecard to compensation will result in even greater
individual differences. He further states, that the base salary of people is
normally not affected by the Balanced Scorecard. The Balanced Scorecard is
used more in variable or incentive compensation.
In order to ensure the right link to compensation it is very important to do proper
planning by focusing on the following:
Purpose. What is the overall purpose of the linkages of compensation to
the Balanced Scorecard? What specific behaviours are you attempting to
encourage or discourage? How will the new pay plan affect the culture?
Communication. Compensation is always an issue; thus it is in a
company’s best interest to communicate the specifics to the entire
employee audience as soon as the Balanced Scorecard plan is
developed. It must be ensured that the plan is fair while, equitable and the
benefits must also be highlighted.
Development. It is important that a variety of participants are involved to
ensure the different measures and functions are represented.
System review. It must be made clear that the payment program will be
reviewed continuously, normally twelve months after the initial launch.
This will also indicate a signal of commitment by management and it will
ensure that it is possible to make modifications if necessary.
Niven (2005:150) later also states, that the following key principles must be
considered when forging or designing the critical pay-for-performance link:
Communicate the incentive compensation plan. It is imperative
that before launching any compensation plan, the detail of
management’s intentions needs to be communicated widely. This

49
information must be shared with the employees in order to ensure
the plan is understood, as well as how it advances the company’s
strategic plan.
Who participated in the plan? It is important to determine exactly
who will participate in the compensation plan. The level or group
of people linked to the compensation plan varies between different
companies.
Are rewards based on individual or group efforts? Most work in
companies has a cross-functional component and therefore,
rewards should represent this reality. An approach that can be
followed is to use both group and individual incentives by using an
incentive programmes. This will ensure rewards for outstanding
individuals and it will also prevent some less motivated employees
from earning rewards only on the backs of fellow workers.
Measurements to be included in the compensation plan.
Incentives should be spread across all four measures. This will
inspire the team to grasp the greater significance of individual
performance metrics as it works together to spell success.
Different weights can be linked to each measure in order to ensure
focused employee attention on critical drivers for performance in
his or her specific area.
Measured to be used. It is very important to use the right
measures on a Balanced Scorecard to ensure the strategic goals
are achieved. Selecting the wrong measure can send results
spiralling in the wrong direction as people will be compensated on
performance while company goals are not achieved.
Lead and lag indicators. A healthy and appropriate mix of lead
and lag indicators ensures that people are focused both on results
today and the determinants of sustaining that success.
Thresholds and targets. It is important that companies must set a
threshold that must be met before any rewards are distributed. All
50
measures forming part of the compensation plan must have
targets or multiple target bands that will affect the level of rewards.
Different types of rewards. Companies can apply monetary
awards or recognition in various forms. What is important is to
ensure those individuals’ desires and preferences must be met.
Frequent reporting of results. Continuously updated performance
information is needed to ensure that people know where they
stand and what needs to be done to earn the promised rewards.
Linking incentives to metrics that are calculated once a year, will
hardly galvanise employee actions because the results are too far
in the future.
Personal development form a very important part of the Balanced Scorecard
and this learning and growth measure forms the base to successfully
manage the other three measures.
According to Garrison et al. (2007:454), managers must be confident that
the performance measures are reliable, sensible and understood and not
easily manipulated by those who are being evaluated. According to Kaplan
and Norton (as quoted by Garrison et al., 2007:454), compensation is such a
powerful lever that you should be confident that the right measures and
good data for measures are available before making the link of tying
compensation to the Balanced Scorecard.
Lawler (2003:402) states that performance systems are more effective when
there is a connection between the results of the performance management
system and the reward system of the company. It is also strongly
emphasised that companies should not separate performance from
determining pay changes and conclude by saying that it is good practice to
tie the results of performance reviews to the financial rewards individuals
receive.

51
Davies (2009) also states, that it is very important that the Balanced
Scorecard measurements must be used as part of what determines
compensation of employees. If this is not done, the credibility of the process
will be undermined.
According to Kaplan and Norton (1996:217), the big question faced by all
companies, is where and how to link the compensation system to the
Balanced Scorecard measurements. It is important that, for the Balanced
Scorecard to create a cultural change, incentive compensation must be
connected to achievement of the Balanced Scorecard objectives. Based on
this, the issue is not whether, but when and how the connection should be
made to compensation.
According to Kaplan and Norton (2007:155), most companies believe that
tying financial compensation to performance is a powerful lever, for which a
linkage needs to be established. It also states what has been said by the
CEO of Pioneer, that linking compensation to the Balanced Scorecard has
helped to align the company with its strategy.
It must, however, be kept in mind that as attractive and as powerful as the
linkage is, it nonetheless carries risks. Examples of these risks can be
identified by asking the following questions:
- Does the company have the right measures on the scorecard?
- Does it have valid and reliable data for the selected measures?
- Could unintended or unexpected consequences arise from the way
the targets for the measures are achieved?
Many companies believe that performance measures are more motivational
if linked to rewards. The performance measures used in a Balanced

52
Scorecard are very important for the success of the Balanced Scorecard
system. To generalise, according to Correia et al. (2008:672), the following
factors should be common to all scorecard approaches in order to reduce
the likelihood of dysfunctional behaviour:
- The measures should support the objectives and strategy of the
business;
- These should cascade down through the various levels of the
company;
- The chosen measures should include both short-term and long-term
measures as well as financial and non-financial measures.
DeBrusk and Crabtree (2006:47) also say, that providing incentive
compensation based on Balanced Scorecards is easier said than done. It is
difficult to link Balanced Scorecard measures to compensation and it carries
some risk because incentive pay based on a few variables will focus
attention only on those variables that can increase compensation.
The remaining variables will be ignored even though also linked to the
company strategy. A pay plan that focuses only on a few variables will also
tend to focus on financial measures, which are focused on short-term results
that can be manipulated easily.
A survey done on members of the Institute of Management Accountants
indicates that 65% of the respondents, who did not see an increase in
operating performance, did not use the Balanced Scorecard to determine
management compensation (DeBrusk & Crabree, 2006:48).
The following methods can be used to link the Balanced Scorecard to
compensation (Niven, 2002:249):
53
Basing rewards on overall results. Under this method a certain
percentage of incentive compensation is available should the
company achieve some or all of its goals. Weights are assigned to
each of the four measures to the sum of 100%.
Driving the link to all levels or the company. This is where the
cascading technique is used to align rewards with results that hit
closer to home for employees. With this method, outstanding
performance is rewarded differently on individual levels.
Competency-based pay. Incentive compensation is directed towards
the acquisition of competencies. This method was used the least up
to date.
Gain sharing. This is an improvement system that relies on employee
actions to enhance company results. Savings generated from the
improved results are shared with employees through incentive
bonuses.
Money may or may not make the world go round, but it certainly can grease the
wheel of your Balanced Scorecard (Niven, 2005:155).
2.6 FORMULATION AND IMPLEMENTATION OF AN EFFECTIVE
BALANCED SCORECARD
Kaplan and Norton (1993) further suggest how the Balanced Scorecard should
be built and implemented in companies. Although each company is unique and
follows its own process in developing a Balanced Scorecard, they present a
general development plan in building a balanced measurement system.
Compared to Kaplan and Norton (2001a), these authors highlight the need of
creating a dialogue of the future statement instead of a “top-down”

54
communication in which employees have a minor role in the discussions. Olve
et al. (2003) further support the need of assigning responsibility in a Balanced
Scorecard project. The design of the Balanced Scorecard technology, training
and promoting are some areas that need to be assigned to different people in
the company. The authors argue that the company then should deal with how
the different scorecards should be related.
Incentives for making the scorecard work and ensuring that measures are
competitive need to be considered. The authors discard the idea that incentives
or rewards are generic success factors in a Balanced Scorecard project and
point out that incentives, and mainly financial incentives, need to be
implemented with great care. Although the authors do not support incentives as
a way to stimulate “Balanced Scorecard behaviour” among employees, they
argue that incentives should be linked to the Balanced Scorecard since it will
demonstrate management’s belief in the Balanced Scorecard. Finally, the
authors present the issue of implementing an Information Technology support
for the Balanced Scorecard. They claim that most companies benefit from
having a Balanced Scorecard on the intranet since measures become easily
accessible to the company.
Determined measurement is about being effectual, which means the right things
need to be done (Spitzer, 2007:91). For a Balanced Scorecard system to be
effectual, companies need to ensure that the correct objectives are measured in
the correct way so as to ensure lasting successful performance.
The Balanced Scorecard does not eliminate the role of financial management in
a management system, which embeds financial measure mention a more
Balance management system that links short-term operational performance with
longer term strategic objectives (Kaplan & Norton, 1996). The first few steps in
the implementation prove of the Balanced Scorecard the following:

55
- The company’s strategy and vision needs to be clarified;
- The corporate strategy needs to be communicated;
- Cross-business strategic initiatives need to be launched; and
- Each department must develop its own strategy that is consistent with
that of the company.
Bloomquist and Yeager (2008:24) state, that a key to successfully designing
and implementing a Balanced Scorecard system, is alignment with the strategic
plan. If a Balanced Scorecard is used effectively, it serves as a component of a
measurement-based strategic management and learning system that furthers
the company’s ability to achieve its strategic objectives. The Balanced
Scorecard can be seen as the compass along the journey to achieving the
strategic plan. It all sounds very easy but achieving the ultimate Balanced
Scorecard, does not happen overnight. Some of the lessons learned to ensure
a smooth process, include the following:
- Be flexible. Developing and implementing a Balanced Scorecard is an
evolutionary process. Not every measure will be correct the first time.
- Be consistent. Good documentation needs to be created for each
measure.
- Be clear. Leadership buy-in and understanding need to be obtained.
- Be open. Frequent communication is needed.
- Be thorough. The existing infrastructure must be used, not something
new.
- Be efficient. Ensure the individual goal setting is not too burdensome.
- Be inclusive. Involve multiple departments at any stage.
- Be systematic. It is important to improve the process continuously.
According to Correia et al. (2008:685), the following recommendations can be
used for the implementation and formulation of an effective Balanced
Scorecard:
56
- Senior leadership involvement must always be obtained. The Balanced
Scorecard development process must not be delegated to middle
management;
- The firm’s business vision and strategy to results need to be identified;
- Performance categories that link vision and strategy to results need to be
identified;
- The scorecard must be cascaded to team, division and functional levels;
- Effective measures and meaningful standards need to be developed.
Measures must be chosen to optimise the whole;
- The Balanced Scorecard must be viewed as a continuous process,
requiring maintenance and re-assessment and updating. Balanced
Scorecard’s are dynamic and should be continually reviewed to reflect
new competitive, technological and market conditions;
- Appropriate budgeting, Information Technology (IT), communication and
reward systems need to be deployed;
- It should recognise controllability. When people are responsible for
achieving certain performance measures, these measures should relate
to activities and processes that are under their control;
- It must emphasise the positive. Performance measures should be
expressed in positive rather than negative terms to motivate
improvements. It gives immediate feedback and allows that timely
corrective actions can be taken;
- It must be timely to ensure that the performance measures are reported
as close as possible to the period which they relate to;
- It should include benchmarking. Performance measures must be
benchmarked to high external standards in order to lift performance;
- It should embrace participation and empowerment. To encourage
managers and employees to accept performance measures as fair, they
must be involved in their formulation and operation. Employees may be
empowered to identify their own performance measures linked to

57
business strategies and to take actions to improve performance. It is very
important to have buy-in from all the essential players;
- One must believe in the Balanced Scorecard as a facilitator of company
and culture players;
- The key to the success of the Balanced Scorecard is its simplicity. One
must see a company from four measures, one driving the other. Only a
few performance measures need to be included; and
- Linking Balanced Scorecard performance goals to compensation might
add additional complexity, but it is a valuable tool in implementing the
Balanced Scorecard successfully. Performance measures are more
motivational if they are linked to rewards.
Kaplan and Norton (1996:224) found the following four steps in the mid-nineties
needed to use the Balanced Scorecard in an integrated long-range strategic
planning and operational budgeting process:
- Set stretch targets;
- Strategic initiatives need to be identified and rationalised;
- Critical cross-business initiatives need to be identified; and
- Annual resource allocation and budgets need to be linked.
Strategic feedback and learning constitute a very important process of the
Balanced Scorecard as it affects the morale of employees. A case study done
on Echo Engineering, as stated by Kaplan and Norton (1996a:256), indicates
that improved employee morale will lead to the following:
- Increased customer satisfaction;
- Lower accounts receivable; and
- Higher return-on-capital-employed.
58
According to Niven (2002:317), many companies will fall prey to at least one of
the top ten Balanced Scorecard implementation issues listed:
- Premature links to management processes;
- Lack of cascading;
- Terminology use;
- No new measures;
- Consistent management practices;
- Timing;
- No objectives for the scorecard;
- No strategy;
- Lack of training and education; and
- No executive sponsorship.
For the effective implementation of a Balanced Scorecard, it is very important to
make sure the above listed points are addressed to ensure good performance
measures of the improvement performance of individuals and that of the
company. Gering and Rosmarin (2002:18) state, that if correctly implemented,
the Balanced Scorecard is a tool for decentralisation and it will empower the line
manager. On the other hand, a badly implemented Balanced Scorecard has
the potential to become a centralist trap. Once the Balanced Scorecard
becomes viewed as a central planning tool, it rapidly becomes part of corporate
politics.
According to the research by Lawler (2003:396), it shows the performance
management effectiveness increases when there is on-going feedback,
behaviour-based measures are used and present goals and trained evaluators
are employed. Many companies are using a forced distribution approach but
this represents an unrealistic mandate and it may force managers to make
judgements they cannot support with data.
59
A study that was done on 55 Fortune 500 companies confirms that performance
management systems are rated as more effective when a forced distribution
approach is not used. It is also better not to use a forced distribution approach
when the results of an appraisal will be used for terminations (Lawler,
2003:401). Lawler (2003:398) also states, that when performance appraisals
have a great or very great influence on salary increases, they are more
effective.
Niven (2005:59) states that the rate at which the Balanced Scorecard is
developed, depends on several variables, including company readiness, the
sense of urgency within an company, commitment of senior management to the
tool, the scope of the work and the availability of resources.
Key performance measures focus on a company’s strategic objectives.
Managers are expected to define goals and select a limited number of key
indicators within each of the measures (Manoochehri, 1999:22). According to
Amaratunga et al. (2000:66), a measure is “a performance metric that will reflect
progress against an objective. A measure must be quantifiable”.
Every measure selected should form part of a chain of cause-and-effect
relationship that communicates the meaning of the company strategy (Kaplan &
Norton, 1996b:149).
If a Balanced Scorecard is constructed correctly, the performance measures
should be linked together on a cause-and-effect basis. Each link can then be
read as a typical hypothesis; if one improves this performance measure, then
the other performance measure should also improve (Garrison et al., 2007:453).
In order for a company to ensure continuous improvement and to remain
competitive, it is important that relevant performance measures are selected,
the measures are defined and redefined and performance targets must be

60
made more challenging as measured in Balanced Scorecards (Correia et al.,
2008:685). The results of the Balanced Scorecard must be analysed on an on-
going basis and it must be used to learn about the effectiveness of strategy
execution (Niven, 2005:20).
A scorecard should have a balanced mix of outcomes and performance driver
measures. Whereas outcome measures are lagging indicators that display
whether efforts have led to acceptable outcomes, performance driver measures
are leading indicators. They display what should be done to create future value
for a company.
Outcome measures without performance drivers do not always inform how
outcomes are to be achieved. Performance drivers without outcome measures
may deliver no short or long-term value (Kaplan & Norton, 1996b:150).
2.7 SUMMARY
The Balanced Scorecard has been researched in this chapter, as a
performance management tool which can be combined with other performance
management tools to improve the accomplishments of the company objectives.
Further to this the literature study was done to analyse the background on the
Balanced Scorecard, and to research different perspectives of the Balanced
Scorecard.
The Balanced Scorecard is used to measure how well the company is doing.
The research further indicates that the Balanced Scorecard’s objective is to
align everyone in the company around common goals, strategies, vision,
mission, values and key success factors. The Balanced Scorecard is a way in
which management and employees give each other continuous feedback on

61
progress, allowing for strategic action planning and in-turn the Balanced
Scorecard becomes a decision-making tool to everyone in the company.
This chapter discussed in detail the four perspectives in the Balanced
Scorecard, showing that not only is the financial aspects of a company
important but also the non-financial aspects, like customer focus, internal
business processes and learning and growth.
We see in this chapter how the Balanced Scorecard has evolved since it was
first introduced, showing that the Balanced Scorecard is flexible and can easily
be adapted to our ever changing business world. The need for the Balanced
Scorecard in companies has been explored and a clear indication of the
importance for companies to implement and use a Balanced Scorecard,
especially in South Africa. It has also been shown that aligned commitment is
important in all companies, the Balanced Scorecard helps improve aligned
commitment, allowing the vision, mission, values and strategy, be clearly
communicated to all members in the company, in addition giving a clear
understanding of each person’s role in the company and part they play in
ensuring the future of the company and work towards sustaining competitive
advantage. Researchers have shown that effective Balanced Scorecards have
helped surviving companies, have made dramatic improvements, and have
been able to focus on key areas for improvement, and ensures continuous
improvement.
The disadvantages were also explored, it was indicated that the cause-and-
effect chain, has no time lag visible between stages in the connecting chain.
Further to this it would seem that companies tend to implement too many or
difficult goals which at the end cannot be reached by employees, having a
negative and demotivating effect. It was also pointed out that, failing Balanced
Scorecards are due to not enough development, implementation, and
performance measures are not understandable and controllable. One of the

62
important failures is when the organisations do not use the Balanced Scorecard
appropriately.
The literature study further investigates the Balanced Scorecard as a personal
development tool. The learning and growth perspective is considered important
in the Balanced Scorecard, forming the base to successfully managing the other
three perspectives. Personal development and growth of employees will have a
big influence on an effective Balanced Scorecard as a whole, and an ineffective
Balanced Scorecard could lead to a significant level of negativity in a company.
The information gathered during the literature study was used to compile a
questionnaire which was used for the empirical study. The results of the
empirical study are discussed in Chapter 3. The results were used to validate if
the primary and secondary objectives were met. The empirical study reflects if
the Balanced Scorecard, currently being used by Picture Perfect Photography is
being effectively implemented and if it is working as a performance
measurement tool, and a personal development tool.
63
CHAPTER 3
EMPIRICAL RESEARCH
3.1 INTRODUCTION
In this chapter the empirical study is discussed and conclusions are made on
the findings of the study. Picture Perfect Photography has been using the
Balanced Scorecard system for the past 10 years now. In general the
employees at Picture Perfect Photography have been reasonably negative
when the topic of the Balanced Scorecard was discussed, due to this reaction
the decision was made to do this study.
For the Balanced Scorecard system to be effective, employees need to
understand the use of the Balanced Scorecard and the benefits it will deliver for
all stakeholders involved.
The questionnaire used in this study, was developed together with the
transference of the literature study with the aim to be able to achieve the
primary and secondary objectives as set out in chapter one.
The main objective of the study was to evaluate the efficiency of the Balanced
Scorecard as it is used at Picture Perfect Photography. The secondary
objectives were to research the effectiveness of the Balanced Scorecard as a
performance measurement tool, as well as the need for the implementation of a
Balanced Scorecard. Further to this, research had to be done on personal
development and linking it to compensation. The sub objectives of the study
were to determine if the Balanced Scorecard was aligned with the company’s
strategy, vision, mission and values and to explore the existing problems. Also
64
to determine if the Balanced Scorecard helped to focus on quality, re-
engineering and customer services initiatives.
The empirical study was done at Picture Perfect Photography, by distributing a
questionnaire to all employees working at Picture Perfect Photography. This
questionnaire was used as the measuring instrument; employees were required
to complete the questionnaire electronically and return them via e-mail to
ensure that they felt comfortable in knowing that management will not have
access to their individual responses.
The completed questionnaires were analysed by the Statistical Consultation
Services of the North-West University (Potchefstroom campus).
The empirical study was structured to collect the overall general knowledge
regarding employees’ perception of the need for an effective Balanced
Scorecard. Also to identify whether the Balanced Scorecard was aligned with
the company’s strategy, vision, mission and values.
Further to this, what the perception of the advantages and disadvantages of the
Balanced Scorecard was, more questions were asked to compile the opinion of
the participants concerning their personal development and how they feel about
the compensation being linked to the Balanced Scorecard.
Questions were asked to cover the formulation and implementation of the
Balanced Scorecard. Finally the open ended question was asked to cover the
employee’s perception about the effectiveness of the current Balanced
Scorecard.
The questionnaire consisted of three parts, part A consisted of information
regarding the respondents’ Gender, Race, Work Section, Job Level, Years of
service, and Age group, followed by general questions, part B consisted of
65
specific Balanced Scorecard related questions; part C ended with an open
ended question to give respondents an opportunity to elaborate or express their
opinions.
3.2 METHODOLOGY REVIEW
3.2.1 Target population
In this study, the geographical demarcation was restricted to the
borders of South Africa, as was discussed in Chapter one. The target
population is made up of all the employees at Picture Perfect
Photography, giving a total of 53 staff members, excluding
management.
3.2.2 Instrument selection
This selection of the appropriate instrument for the survey was
determined by comparing three different types of questionnaire study
methods, as well as considering the issuing and collection method of
the completed questionnaires.
The issuing and collection method for the questionnaire was a very
important decision, for the following reasons:
The confidentiality of the respondent should be ensured.
The method should be done in the least of time, at the same
time it would be very cost-effective and the easiest way to reach
the targeted population group.
The method should encourage respondents to complete the
questionnaire.
66
The method of returning the completed questionnaires would be
the most effective and convenient for the participants.
3.2.3 Instrument design
The questionnaire was designed with a cover page, followed by pages
containing the questions. The cover page included the following:
The title of the research.
Short paragraph to ensure employees of confidentiality and
instructions as to where the completed questionnaire should be
sent.
Demographic information required for the study (Gender, Race,
Work Section, Job Level, Years of service and Age groups.
A five point Likert-type Scale was used to measure the responses. The
Likert-type Scale used, consisted of the following choices: 1 = Strongly
Disagree, 2 = Disagree, 3 = Neutral, 4 = Agree and 5 = Strongly Agree.
The questionnaire also made allowance for additional comments.
3.2.4 Data collection
The questionnaire was sent out to the target population via e-mail and
they were urged to complete and return the questionnaire, with the
assurance that the questionnaire will be kept anonymous. It was
emphasised that the questionnaire be completed in full and honestly.
The e-mail was chosen as the easiest and most effective way of getting
the best feedback as all the people in the target group had access to e-
mail.

67
A log was kept of all completed questionnaires and follow-up
communication via e-mails and telephone calls were made to urge
prospective participants to complete and return their questionnaires.
The total number of questionnaires received back for analysis was 48,
resulting in a response rate of 90.6%. The target population consisted
of 53 employees in total. As a result the study population was the
respondents who completed the questionnaires.
3.2.5 Basic analysis
Descriptive statistics and frequency distributions were used and calculated
on the SAS System.
All the responses were captured on a Microsoft Excel spread sheet and
coded as follows:
Gender – Male = 1 and Female = 2
Race – Black = 1, Coloured = 2, White = 3 and Indian = 4
Yes = 1, No = 2
Strongly Disagree = 1, Disagree = 2, Neutral = 3, Agree = 4 and
Strongly Disagree = 5.
One open ended question was asked to get feedback on people’s insights
whether the Balanced Scorecard system is applied effectively or not; they
were also encouraged to motivate their answers. Refer to Appendix A for an
example of the questionnaire used.
68
3.3 RELIABILITY AND VALIDITY
Once the results have been received from the completed questionnaires, it is
vital to test the reliability and validity of the newly developed questionnaire.
According to Field (2009:673), a questionnaire that is reliable is expected to
provide results that are both accurate and consistent. Ravid (2011:192)
explains that the reliability refers to the degree of consistency of a questionnaire
and the extent to which the same results are obtained when employing the
instrument repeatedly to the same groups or individuals. Further to this Ravid
(2011:204) explains that the validity of a test refers to the degree to which the
instrument actually measures what it is designed to measure.
3.4 RESULTS OF THE MEASUREMENTS IN THE STUDY
As a result that no random sampling was done, interpretation of comparisons
between group means was done according to Cohen’s effect sizes, d (Cohen,
1988:145). Effective sizes indicate practical significance – that is the extent to
which a difference is large enough to have an effect in practice (Steyn, 2009).
Thus no inferential statistics were interpreted, although p-values are reported as
if random sampling was assumed.
All the respondents confirmed that they did have a Balanced Scorecard; this
indicated that everyone knows there is a Balanced Scorecard and that it is
being applied in Picture Perfect Photography.
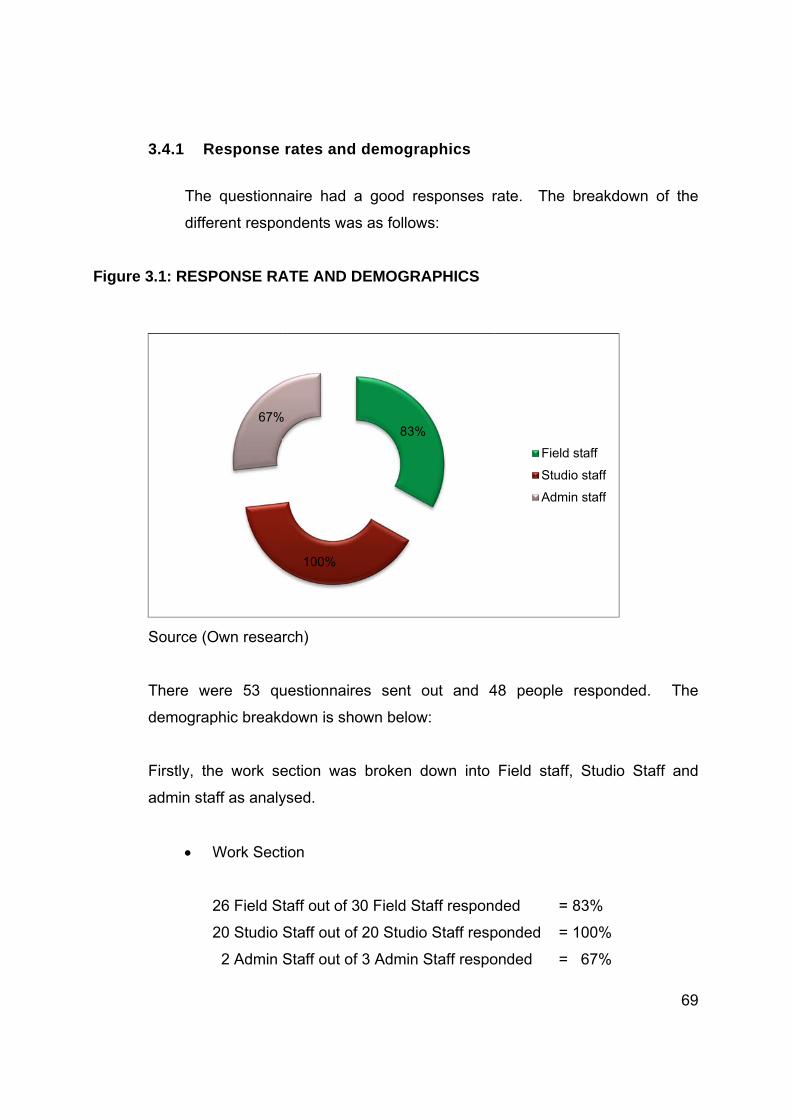
Figure
3.4.1 R
The
diffe
3.1: RESP
Source (O
There we
demograp
Firstly, th
admin sta
Response
questionn
erent respo
PONSE RA
Own resea
ere 53 qu
phic breakd
he work se
aff as analy
Work Sect
26 Field St
20 Studio
2 Admin
67%
rates and
naire had
ondents wa
ATE AND D
rch)
uestionnair
down is sh
ection was
ysed.
tion
taff out of 3
Staff out o
Staff out of
100%
%
d demogra
a good re
as as follow
DEMOGRA
res sent o
hown below
s broken d
30 Field St
f 20 Studio
f 3 Admin S
83%
aphics
esponses r
ws:
APHICS
out and 4
w:
down into
taff respon
o Staff resp
Staff respo
%
rate. The
48 people
Field staff
ded =
ponded =
onded =
Field
Stud
Adm
breakdow
responde
f, Studio S
= 83%
= 100%
= 67%
d staff
dio staff
min staff
69
wn of the
ed. The
Staff and

70
Secondly, the years of service were analysed, three categories of years of
service was drawn up, employees working 5 years and less, 5 to 10 years
and lastly 11 to 15 years of service.
Years of Service
13 out of 48 have less than 5 years’ service.
18 out of 48 have between 5 and 10 years’ service
18 out of 48 have 11 to 15 years of service; most of these respondents
have been working for the company since it started.
Lastly, gender responses were analysed.
Male and Female
From the data of 48 respondents, 22 were male, totalling 46% of the total
and 26 were female totalling 58%.
3.4.2 Responses of Part A of the questionnaire
Response to Question 1
All the respondents confirmed that they do have a Balanced Scorecard.
This indicates that a Balanced Scorecard is applied and known by all
employees, although this does not mean that it is applied effectively.
Response to Question 2
A total of 90% of the respondents felt that management did not have
detailed discussions with employees regarding the Balanced Scorecard for
2012.
71
Response to Question 3
94% of the respondents indicated that their direct managers did not have
feedback discussions with employees regarding their Balanced Scorecard
performance for 2011.
Response to Question 4
In this question 98% of the respondents agreed that they were not given
the opportunity to give inputs towards their new Balanced Scorecard. This
would not have been the case had the Balanced Scorecard been
implemented and applied effectively.
Descriptive statistics were used to identify or highlight the respondent’s
perception and attitudes of the Balanced Scorecard system as applied at
Picture Perfect Photography.
3.5 ARITHMETIC MEAN, STANDARD DEVIATION, MINIMUM AND
MAXIMUM
Levine et al. (2008:97) state, that the arithmetic mean (also referred to as the
mean) is the most common measure of central tendency, and also the only
common measure in which all values play an equal role. Levine et al.
(2008:108) also state that the standard deviation assists you in knowing how a
set of data clusters around its mean. Normally the majority of observed values
will lie within an interval of plus and minus one standard deviation above and
below its mean.
The obtained results were interpreted qualitatively and quantitative to verify the
effects of the Balanced Scorecard system. The criteria for effectiveness was
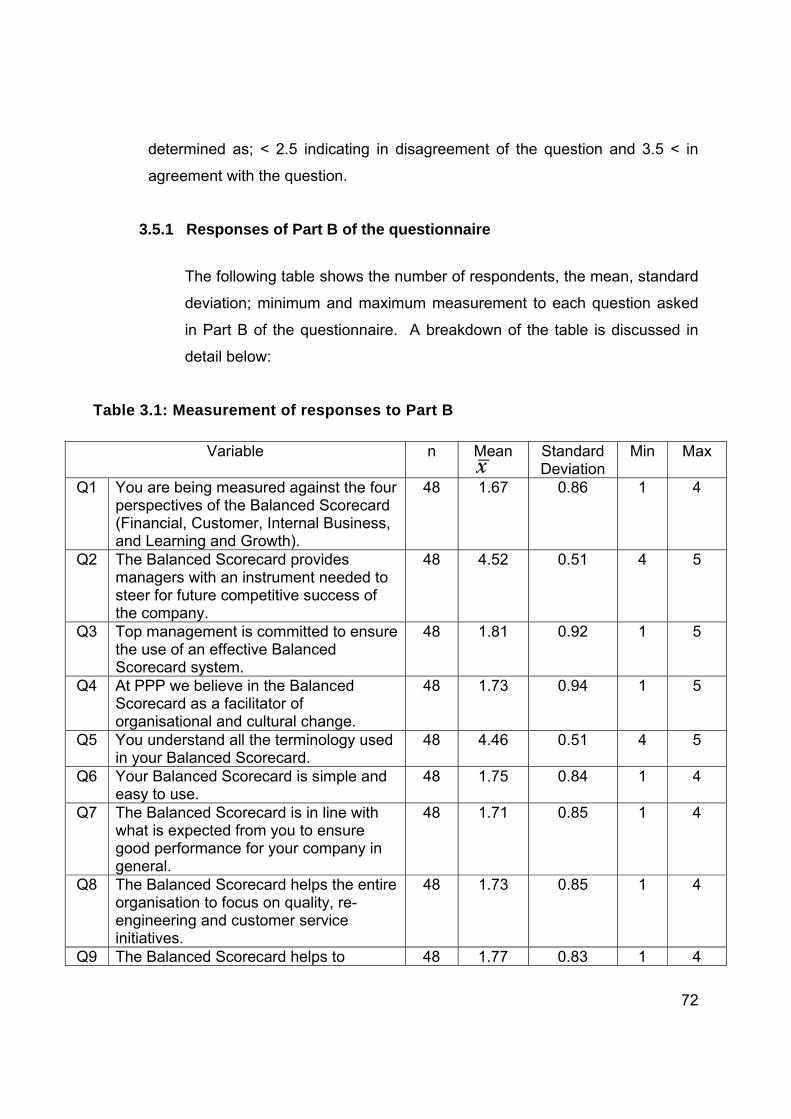
72
determined as; < 2.5 indicating in disagreement of the question and 3.5 < in
agreement with the question.
3.5.1 Responses of Part B of the questionnaire
The following table shows the number of respondents, the mean, standard
deviation; minimum and maximum measurement to each question asked
in Part B of the questionnaire. A breakdown of the table is discussed in
detail below:
Table 3.1: Measurement of responses to Part B
Variable n Mean Standard Deviation
Min Max
Q1 You are being measured against the four perspectives of the Balanced Scorecard (Financial, Customer, Internal Business, and Learning and Growth).
48 1.67 0.86 1 4
Q2 The Balanced Scorecard provides managers with an instrument needed to steer for future competitive success of the company.
48 4.52 0.51 4 5
Q3 Top management is committed to ensure the use of an effective Balanced Scorecard system.
48 1.81 0.92 1 5
Q4 At PPP we believe in the Balanced Scorecard as a facilitator of organisational and cultural change.
48 1.73 0.94 1 5
Q5 You understand all the terminology used in your Balanced Scorecard.
48 4.46 0.51 4 5
Q6 Your Balanced Scorecard is simple and easy to use.
48 1.75 0.84 1 4
Q7 The Balanced Scorecard is in line with what is expected from you to ensure good performance for your company in general.
48 1.71 0.85 1 4
Q8 The Balanced Scorecard helps the entire organisation to focus on quality, re-engineering and customer service initiatives.
48 1.73 0.85 1 4
Q9 The Balanced Scorecard helps to 48 1.77 0.83 1 4
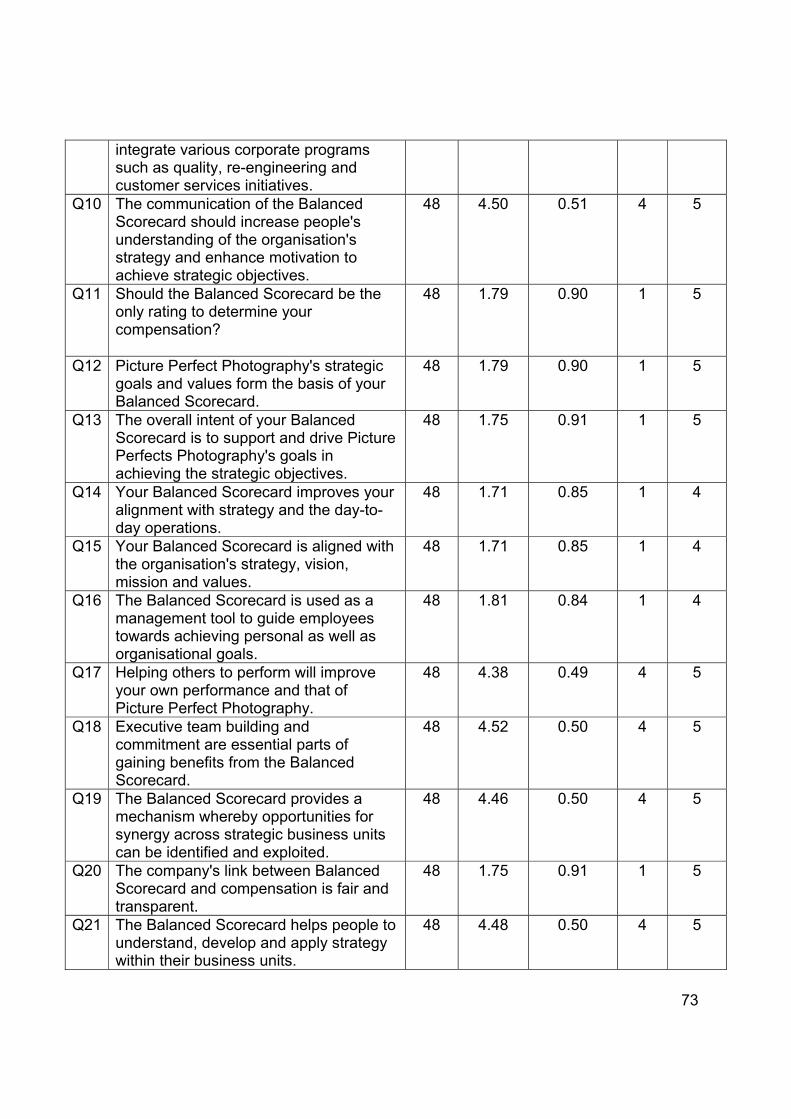
73
integrate various corporate programs such as quality, re-engineering and customer services initiatives.
Q10 The communication of the Balanced Scorecard should increase people's understanding of the organisation's strategy and enhance motivation to achieve strategic objectives.
48 4.50 0.51 4 5
Q11 Should the Balanced Scorecard be the only rating to determine your compensation?
48 1.79 0.90 1 5
Q12 Picture Perfect Photography's strategic goals and values form the basis of your Balanced Scorecard.
48 1.79 0.90 1 5
Q13 The overall intent of your Balanced Scorecard is to support and drive Picture Perfects Photography's goals in achieving the strategic objectives.
48 1.75 0.91 1 5
Q14 Your Balanced Scorecard improves your alignment with strategy and the day-to-day operations.
48 1.71 0.85 1 4
Q15 Your Balanced Scorecard is aligned with the organisation's strategy, vision, mission and values.
48 1.71 0.85 1 4
Q16 The Balanced Scorecard is used as a management tool to guide employees towards achieving personal as well as organisational goals.
48 1.81 0.84 1 4
Q17 Helping others to perform will improve your own performance and that of Picture Perfect Photography.
48 4.38 0.49 4 5
Q18 Executive team building and commitment are essential parts of gaining benefits from the Balanced Scorecard.
48 4.52 0.50 4 5
Q19 The Balanced Scorecard provides a mechanism whereby opportunities for synergy across strategic business units can be identified and exploited.
48 4.46 0.50 4 5
Q20 The company's link between Balanced Scorecard and compensation is fair and transparent.
48 1.75 0.91 1 5
Q21 The Balanced Scorecard helps people to understand, develop and apply strategy within their business units.
48 4.48 0.50 4 5

74
Q22 The Balanced Scorecard increases the visibility of the organisation for senior management and improves communication.
48 1.71 0.85 1 4
Q23 If the Balanced Scorecard is updated regularly: it can give early warnings of problems ahead, or signal opportunities.
48 4.42 0.50 4 5
Q24 Senior management supports the Balanced Scorecard system.
48 1.81 0.87 1 4
Q25 Communication of the Balanced Scorecard objectives and measures is a first step in gaining individual commitment to the company's strategy.
48 4.46 0.50 4 5
Q26 For the Balanced Scorecard to create the cultural change, incentive compensation must be connected to the achievement of the scorecard objectives.
48 4.56 0.50 4 5
Q27 The Balanced Scorecard must be viewed as a continuous process, requiring maintenance and re-assessment and updating.
48 4.56 0.50 4 5
Q28 The Balanced Scorecard breaks down strategic measures to lower levels so that all people can see what is required at their level to achieve excellent overall performance.
48 4.48 0.50 4 5
Q29 Your performance measures in your Balanced Scorecard are SMART (Specific, Measurable, Attainable, Realistic and Time-bound).
48 1.75 0.91 1 5
Q30 You have focused feedback and continuous communication sessions regarding your Balanced Scorecard.
48 1.69 0.93 1 5
Q31 You have clear monthly visibility of the progress on the key performance indicators (KPIs) you are measured against.
48 1.73 0.92 1 5
Q32 You have an influence on all the KPIs listed in your Balanced Scorecard.
48 1.71 0.92 1 5
Q33 Challenging but obtainable performance goals motivate you to perform better.
48 4.48 0.50 4 5
Q34 Your Balanced Scorecard rating is a reflection of your compensation.
48 1.75 0.84 1 4
Q35 Your Balanced Scorecard is a simple and transparent process.
48 1.77 0.83 1 4
Q36 When human, informational and 48 4.42 0.50 4 5

75
organisational capitals are aligned with the organisation's strategy, the organisation will have the ability to mobilise and sustain the process of change required to execute its strategy.
Q37 With a clear understanding of the role and function of the Balanced Scorecard, one can take the business to higher levels of service.
48 4.54 0.50 4 5
Q38 The real power of the Balanced Scorecard occurs when it is transformed from a measurement system to a management system.
48 4.48 0.50 4 5
Q39 Effective measures and meaningful standards are used to determine your Balanced Scorecard ratings.
48 1.83 0.83 1 4
Q40 The Balanced Scorecard develops a clear understanding of how strategy is operationalised.
48 4.44 0.58 3 5
Firstly, questions 1 to 40 were analysed, the results shown in table 3.1 give an
indication that respondents did not agree:
Question 1, mean = 1.67, indicating that the respondents felt that they are not
being measured against the four perspectives of the Balanced Scorecard. The
low Standard deviation (∞ = 0.86) indicates (as shown in Table3.1) that
respondents understood the importance of being measured against the four
perspectives.
Question 3, mean = 1.81 interprets that respondents did not agree that top
management was committed to ensure the use of an effective Balanced
Scorecard system. The low Standard Deviation (∞ = 0.92) indicates that
respondents understood the importance of top management’s commitment
towards ensuring an effective Balanced Scorecard.
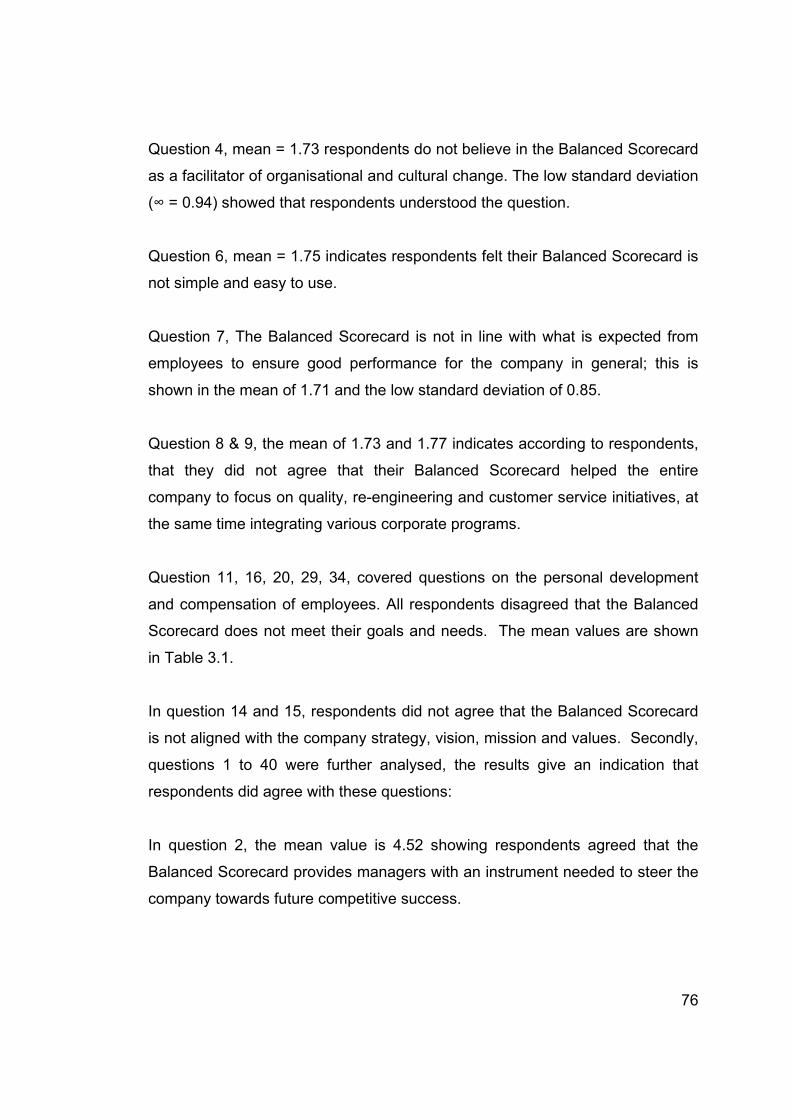
76
Question 4, mean = 1.73 respondents do not believe in the Balanced Scorecard
as a facilitator of organisational and cultural change. The low standard deviation
(∞ = 0.94) showed that respondents understood the question.
Question 6, mean = 1.75 indicates respondents felt their Balanced Scorecard is
not simple and easy to use.
Question 7, The Balanced Scorecard is not in line with what is expected from
employees to ensure good performance for the company in general; this is
shown in the mean of 1.71 and the low standard deviation of 0.85.
Question 8 & 9, the mean of 1.73 and 1.77 indicates according to respondents,
that they did not agree that their Balanced Scorecard helped the entire
company to focus on quality, re-engineering and customer service initiatives, at
the same time integrating various corporate programs.
Question 11, 16, 20, 29, 34, covered questions on the personal development
and compensation of employees. All respondents disagreed that the Balanced
Scorecard does not meet their goals and needs. The mean values are shown
in Table 3.1.
In question 14 and 15, respondents did not agree that the Balanced Scorecard
is not aligned with the company strategy, vision, mission and values. Secondly,
questions 1 to 40 were further analysed, the results give an indication that
respondents did agree with these questions:
In question 2, the mean value is 4.52 showing respondents agreed that the
Balanced Scorecard provides managers with an instrument needed to steer the
company towards future competitive success.
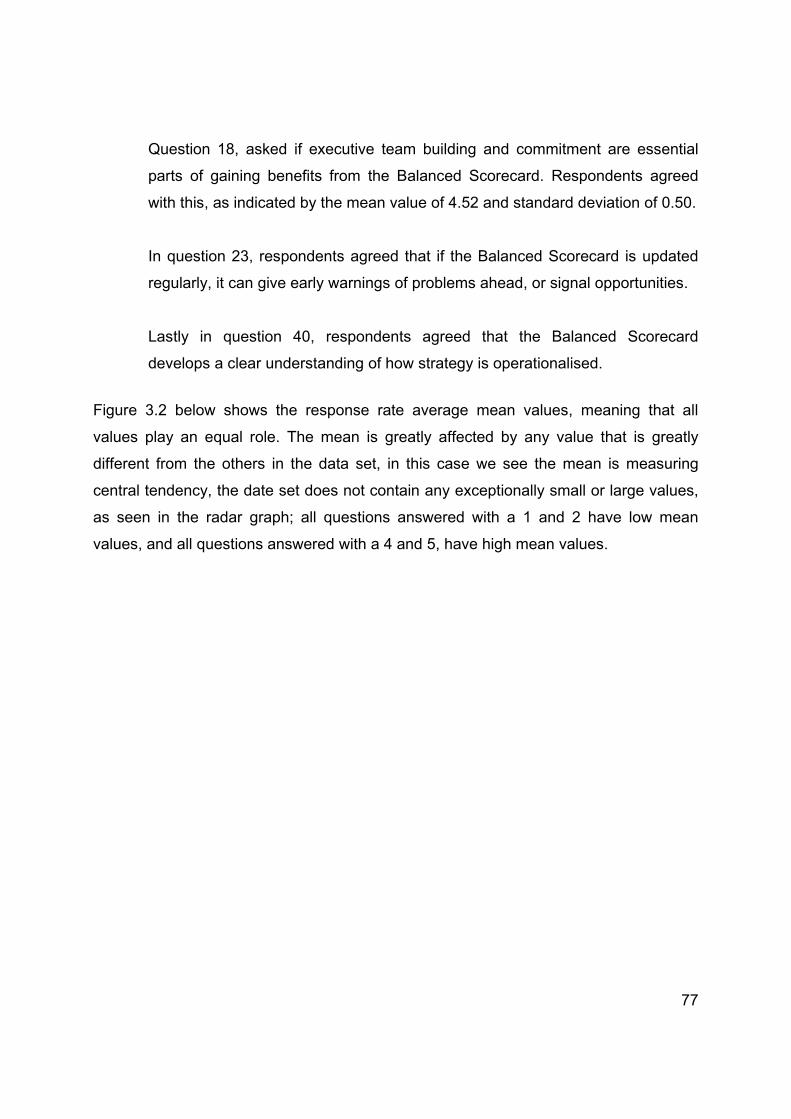
77
Question 18, asked if executive team building and commitment are essential
parts of gaining benefits from the Balanced Scorecard. Respondents agreed
with this, as indicated by the mean value of 4.52 and standard deviation of 0.50.
In question 23, respondents agreed that if the Balanced Scorecard is updated
regularly, it can give early warnings of problems ahead, or signal opportunities.
Lastly in question 40, respondents agreed that the Balanced Scorecard
develops a clear understanding of how strategy is operationalised.
Figure 3.2 below shows the response rate average mean values, meaning that all
values play an equal role. The mean is greatly affected by any value that is greatly
different from the others in the data set, in this case we see the mean is measuring
central tendency, the date set does not contain any exceptionally small or large values,
as seen in the radar graph; all questions answered with a 1 and 2 have low mean
values, and all questions answered with a 4 and 5, have high mean values.
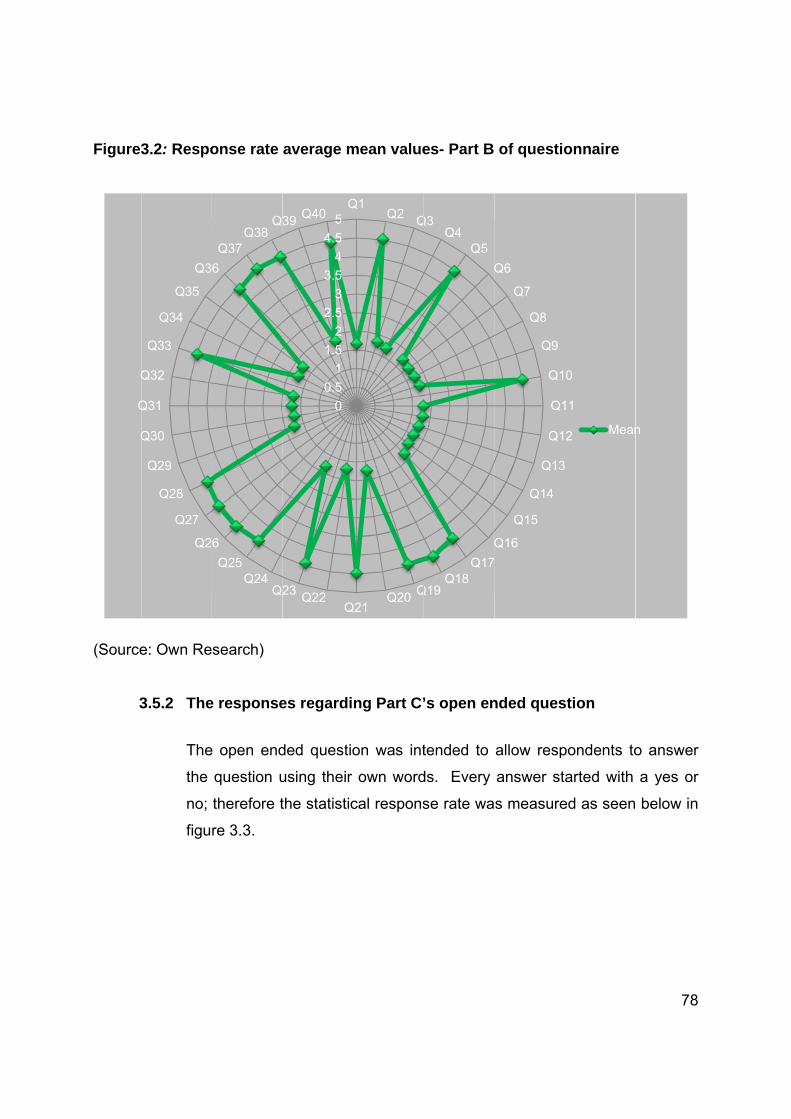
Figure3
(Source
3
Q
Q
Q
3.2: Respo
e: Own Re
3.5.2 The
The
the
no;
figu
Q2
Q27
Q28
Q29
Q30
Q31
Q32
Q33
Q34
Q35
Q3
onse rate
search)
e response
e open end
question u
therefore t
re 3.3.
Q2Q24
Q25
6
6
Q37Q38
Q
average m
es regardi
ded questio
using their
the statistic
0
0.5
1
1.5
2
2.5
3
3.5
4
4.5
5Q
QQ2223
39 Q40
mean value
ng Part C’
on was int
own word
cal respons
Q1Q2 Q
QQ20Q21
es- Part B
’s open en
tended to
ds. Every
se rate wa
Q3Q4
Q5
Q
Q
Q17Q18
Q19
of questio
nded ques
allow resp
answer st
s measure
Q6
Q7
Q8
Q9
Q1
Q1
Q1
Q13
Q14
Q15
Q16
onnaire
stion
pondents to
arted with
ed as seen
0
11
2 Mean
78
o answer
a yes or
below in
n

Figure
(Source
3.3: Part
e: Own res
In t
wit
ap
Mo
usi
abo
res
me
Th
tow
C – Respo
search)
the open e
th No, indic
plied.
ost of the
ing the qu
out their
sponses fr
easuremen
ese answ
wards the B
onse to op
ended ques
cating that
responden
uestions in
Balanced
rom identi
nts set out i
ers were
Balanced S
pen ended
stion, 90%
they felt th
nts answer
n the ques
Scorecard
fying a co
in the Bala
categorise
Scorecard.
d question
of the resp
he Balance
ed the ope
stionnaire t
d. The
ommunica
anced Scor
ed in posit
n
pondents s
ed Scoreca
en ended
to express
responden
tion proble
recard.
tive and n
started the
ard is not e
question,
s the way
nts varied
em to no
negative re
Respo
Respo
79
ir answer
effectively
generally
they felt
in their
realistic
esponses
ondents Yes
ondents No
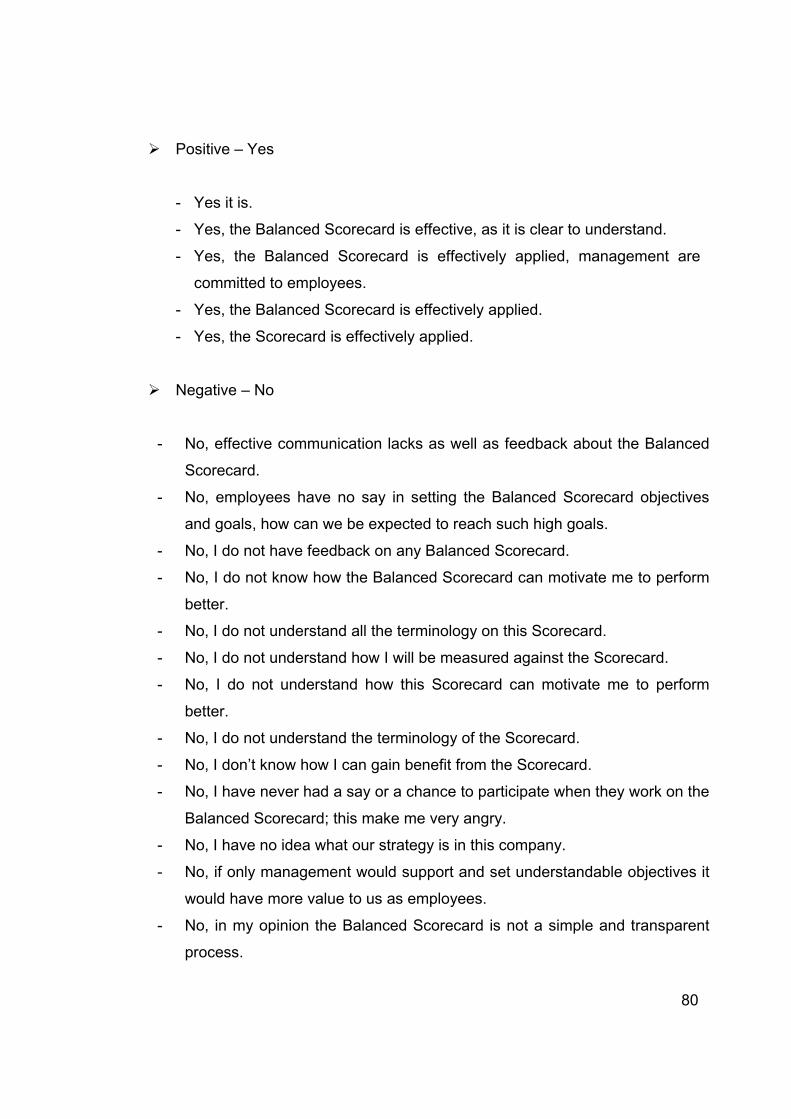
80
Positive – Yes
- Yes it is.
- Yes, the Balanced Scorecard is effective, as it is clear to understand.
- Yes, the Balanced Scorecard is effectively applied, management are
committed to employees.
- Yes, the Balanced Scorecard is effectively applied.
- Yes, the Scorecard is effectively applied.
Negative – No
- No, effective communication lacks as well as feedback about the Balanced
Scorecard.
- No, employees have no say in setting the Balanced Scorecard objectives
and goals, how can we be expected to reach such high goals.
- No, I do not have feedback on any Balanced Scorecard.
- No, I do not know how the Balanced Scorecard can motivate me to perform
better.
- No, I do not understand all the terminology on this Scorecard.
- No, I do not understand how I will be measured against the Scorecard.
- No, I do not understand how this Scorecard can motivate me to perform
better.
- No, I do not understand the terminology of the Scorecard.
- No, I don’t know how I can gain benefit from the Scorecard.
- No, I have never had a say or a chance to participate when they work on the
Balanced Scorecard; this make me very angry.
- No, I have no idea what our strategy is in this company.
- No, if only management would support and set understandable objectives it
would have more value to us as employees.
- No, in my opinion the Balanced Scorecard is not a simple and transparent
process.
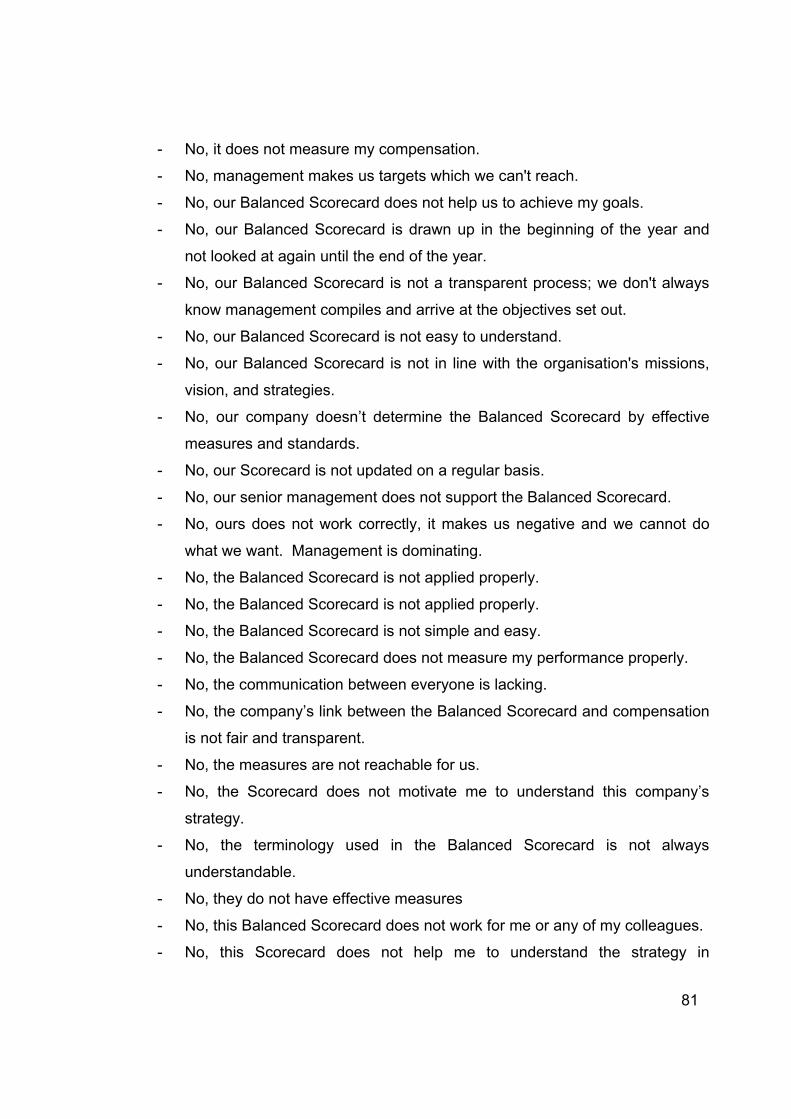
81
- No, it does not measure my compensation.
- No, management makes us targets which we can't reach.
- No, our Balanced Scorecard does not help us to achieve my goals.
- No, our Balanced Scorecard is drawn up in the beginning of the year and
not looked at again until the end of the year.
- No, our Balanced Scorecard is not a transparent process; we don't always
know management compiles and arrive at the objectives set out.
- No, our Balanced Scorecard is not easy to understand.
- No, our Balanced Scorecard is not in line with the organisation's missions,
vision, and strategies.
- No, our company doesn’t determine the Balanced Scorecard by effective
measures and standards.
- No, our Scorecard is not updated on a regular basis.
- No, our senior management does not support the Balanced Scorecard.
- No, ours does not work correctly, it makes us negative and we cannot do
what we want. Management is dominating.
- No, the Balanced Scorecard is not applied properly.
- No, the Balanced Scorecard is not applied properly.
- No, the Balanced Scorecard is not simple and easy.
- No, the Balanced Scorecard does not measure my performance properly.
- No, the communication between everyone is lacking.
- No, the company’s link between the Balanced Scorecard and compensation
is not fair and transparent.
- No, the measures are not reachable for us.
- No, the Scorecard does not motivate me to understand this company’s
strategy.
- No, the terminology used in the Balanced Scorecard is not always
understandable.
- No, they do not have effective measures
- No, this Balanced Scorecard does not work for me or any of my colleagues.
- No, this Scorecard does not help me to understand the strategy in

82
operations.
- No, I do not understand KPI they don’t explain it to me.
- No, it does not explain to me how the Scorecard can ensure good
performance.
- No, it does not have a proper management system.
- No, our Scorecard shows the four perspectives but that is that.
- No, to ensure good performances how do I use the scorecard for this?
- No. our Balance Scorecard does not have meaningful standards to measure
our ratings.
- No. the Balanced Scorecard being used is clear and understandable.
3.6 COMPARISON OF OBSERVED AND EXPECTED BEHAVIOURS
According to Steyn (2002:10), it is almost never practical to deal with an entire
population when conducting research; random samples are drawn from the
population and tested for statistical significance allowing conclusions to be
reached about the population from which the sample was drawn. Researchers
calculate the p-value as a criterion to determine if the results obtained are
statistically significant. The p-value gives the probability that the obtained result
could be achieved applying the assumption that the null hypothesis is true, that
there is no difference between the populations means (Ellis & Steyn, 2003:51).
It is pointed out by Ellis and Steyn (2003:51) that while a small p-value indicated
statistical significance, practically the result may not be important.
A non-probability purposive sampling was used for this study; the p-value is
reported as if probability sampling was done. As highlighted by Ellis and Steyn
(2003:51) data which is obtained via convenience sampling is often analysed
erroneously as if it were obtained via probability sampling. They therefore
suggest that in such cases data should be considered as small populations for
which statistical inference and p-values is not relevant.

S
Many me
one of the
(Field, 20
the samp
Calculatio
Where:
Source: St
Cohen (1
effect size
d
d
d
im
Job level
compare
easures of
e most com
009:57). Co
le means u
on of Cohe
= mean
= mean
S =
S1 = stan
S2 = stan
teyn (2000
988:40) pr
e given the
= 0.2 sma
= 0.5 med
= 0.8 lar
mportance)
and Age g
responden
effect size
mmonly us
ohen’s d fo
using the fo
en’s d
n of sample
n of sample
(estim
dard devia
dard devia
:2)
rovides the
e value of d
all effect
dium effect
rge effect
)
groups we
nts’ answer
e have bee
sed for the
r samples
ollowing:
e 1 (Observ
e 2 (Expect
ate of pool
ation of sam
ation of sam
e following
d.
(noticeabl
(practically
ere statistic
rs to the 40
en propose
effect size
from popu
ved datase
ted datase
led standa
mple 1
mple 2
g guideline
e with the
y significa
cally compa
0 questions
ed in the l
es of differ
lations can
et in this stu
t in this stu
rd deviatio
s for the i
naked eye
nt and the
ared with C
s asked in
iterature. H
ences is C
n be estima
udy)
udy)
n)
nterpretatio
e)
erefore of
Cohen’s d
Part B.
83
However,
Cohen’s d
ated from
on of the
practical
value, to
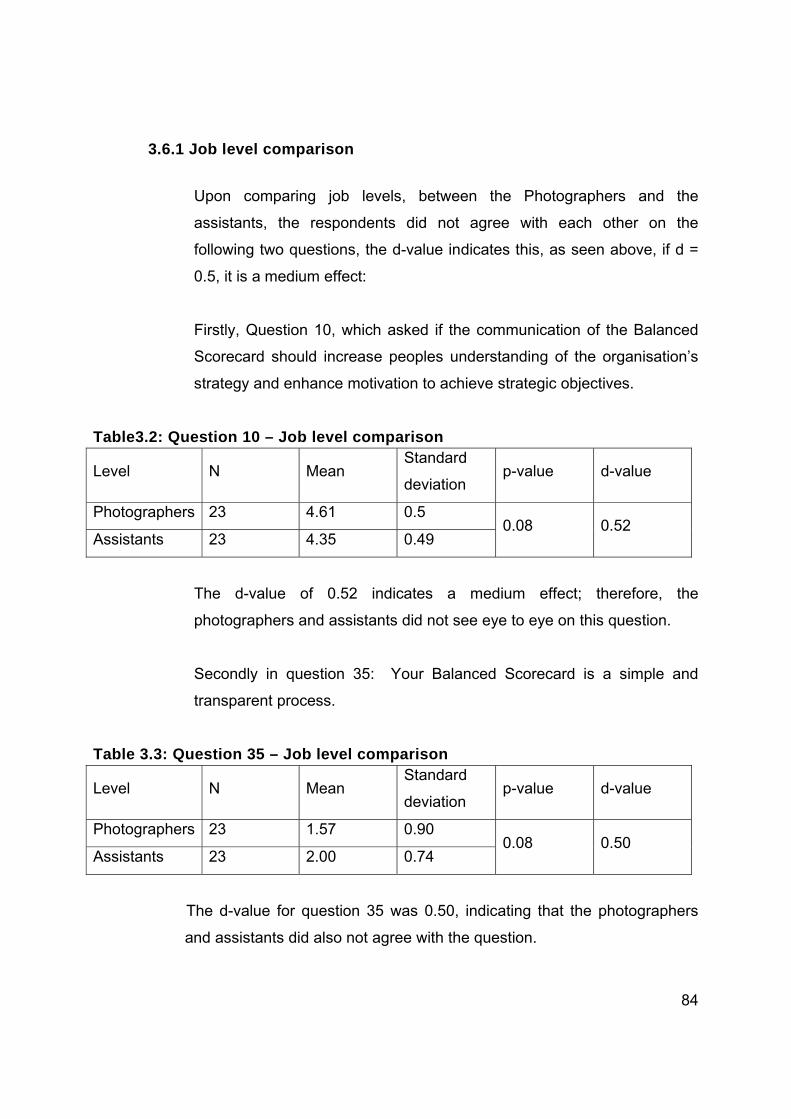
84
3.6.1 Job level comparison
Upon comparing job levels, between the Photographers and the
assistants, the respondents did not agree with each other on the
following two questions, the d-value indicates this, as seen above, if d =
0.5, it is a medium effect:
Firstly, Question 10, which asked if the communication of the Balanced
Scorecard should increase peoples understanding of the organisation’s
strategy and enhance motivation to achieve strategic objectives.
Table3.2: Question 10 – Job level comparison
Level N Mean Standard
deviation p-value d-value
Photographers 23 4.61 0.5 0.08 0.52
Assistants 23 4.35 0.49
The d-value of 0.52 indicates a medium effect; therefore, the
photographers and assistants did not see eye to eye on this question.
Secondly in question 35: Your Balanced Scorecard is a simple and
transparent process.
Table 3.3: Question 35 – Job level comparison
Level N Mean Standard
deviation p-value d-value
Photographers 23 1.57 0.90 0.08 0.50
Assistants 23 2.00 0.74
The d-value for question 35 was 0.50, indicating that the photographers
and assistants did also not agree with the question.

85
The results show that the photographers and their assistants agreed on 38
out of 40 of the questions except for questions 10 and 35. This result
indicates that photographers and assistants jointly know about the
Balanced Scorecard and see the present problems with the Balanced
Scorecard at Picture Perfect Photography.
3.6.2 Age group comparison
Upon comparing age groups, between 20-35 years and 36 and older, the
following three questions had respondents in disagreement with each
other.
Firstly in question 18 the question “executive team building and
commitment are essential parts of gaining benefits from the Balanced
Scorecard”
Table 3.4: Question 18 – Age group comparison
Age Group N Mean Standard
deviation p-value d-value
20 – 35 years 26 4.38 0.496 0.07 0.53
36 and older 20 4.65 0.489
The responses between 20-35 years and 36 and older did not agree that
executive team building and commitment are essential parts of gaining
benefits from the Balanced Scorecard.
Secondly, question 36: “When human, informational and organisational
capitals are aligned with the organisation’s strategy, the organisation will
have the ability to mobilise and sustain the process of change required to
execute its strategy”.

86
Table 3.5: Question 36 – Age group comparison
Age Group N Mean Standard
deviation p-value d-value
20 – 35 years 26 4.31 0.47 0.05 0.58
36 and older 20 4.60 0.50
The d-value for question 36 is 0.58 indicating once again that the two age
groups did not agree with this question.
Lastly, in question 40:“The Balanced Scorecard develops a clear
understanding of how strategy is operationalised”.
Table 3.6 Question 40 – Age group comparison
Age Group N Mean Standard
deviation p-value d-value
20 – 35 years 26 4.31 0.62 0.042 0.55
36 and older 20 4.65 0.49
The d-value of 0.55 indicates that the two different age groups did not
agree with the above question.
By comparing age groups, 20-35 years and 36 and older, the respondents
agreed on 37 out of 40 of the questions asked. The results indicate that no
matter what the age of staff, the respondents appear to know what the
Balanced Scorecard entails.

87
3.7 CHAPTER SUMMARY
An empirical study was done by distributing questionnaires to all employees
working at Picture Perfect Photography, except management. The
questionnaire was divided into three parts, part A covering the general
questions, part B exploring the respondents’ experience with the Balanced
Scorecard, finally finishing off with part C, an open ended question, and
allowing respondents to elaborate on their views.
From the 53 questionnaires sent out, 48 were returned and analysed. The
study showed that 46% of the respondents were male and 54% were female.
The analysis showed 26 Field staff, 20 studio staff and 2 admin staff completed
the questionnaire.
The data analysis in part A, showed that all the respondents knew that there is
a Balanced Scorecard at Picture Perfect Photography, further to this 90% felt
that management did not discuss the new Balanced Scorecard with them. The
next question asked if management have had feedback discussions with
employees regarding the performance of 2011; 94% of the respondents said no.
Respondents were asked if they had the opportunity to give inputs towards the
new Balanced Scorecard; 98% said No.
The analysis on the primary objective of evaluating the efficiency of the
Balanced Scorecard at Picture Perfect Photography showed that 90% of the
respondents did not think that the Balanced Scorecard is being applied
effectively.
The empirical research further showed that the respondents felt that the
Balanced Scorecard is not being used correctly in the alignment with the
company’s strategy, vision, mission and values.
88
Further to the above, the empirical study showed through various questions that
there are existing problems with the Balanced Scorecard being used at Picture
Perfect Photography.
It is evident in the empirical study that respondents do not believe that the
Balanced Scorecard presently helps the entire organisation to focus on quality,
re-engineering and customer service initiatives, as seen by the answers given in
question 8 and 9. The results from the descriptive statistics showed that 92%
respondents answered with a 1 (Strongly disagree) or 2 (Disagree).
The empirical study further determined that the Balanced Scorecard is not
linked to compensation. The analysis done on question 20, asking respondents
if the company’s link between the Balanced Scorecard and compensation is fair
and transparent, 92% either strongly disagreed or strongly disagreed. It is
evident from question 33, that respondents agree that if challenging but
obtainable performance goals are set, it will motivate them to perform better.
In general, looking at how the distribution of the questions in Part B, which
showed a left-skewed distribution, indicates that the Balanced Scorecard is not
applied effectively enough.
In conclusion, the overall response point out that the Balanced Scorecard need
more work to be done to be able to apply it effectively. The major concerns
which need to be addressed would be communication and feedback,
implementing goals and challenges which employees can reach and work
towards. Finally, the link between the Balanced Scorecard and compensation
needs to be transparent.
The next chapter gives final conclusions of the findings from Chapter 3 and
recommendations will be made for possible improvements of using the
Balanced Scorecard more effectively, to encourage employees.
89
CHAPTER 4
CONCLUSIONS AND RECOMMENDATIONS
4.1 INTRODUCTION
While the previous chapter discussed the meaningful results gathered from the
structured questionnaires distributed to employees at Picture Perfect
Photography this chapter concludes the outcomes of all the information
gathered from the literature review in chapter 2 and the empirical study in
chapter 3. This information gathered relate to the research objectives as set out
in chapter 1 on the effectiveness of the implemented Balanced Scorecard
presently used at Picture Perfect Photography
Following on from the conclusions, recommendations are made for further
research actions related to the topic of an effective Balanced Scorecard.
4.2 CONCLUSION
The study has provided a picture of the current Balanced Scorecard being used
at Picture Perfect Photography. The following conclusions were made on the
Balanced Scorecard in general as used at Picture Perfect Photography:
The Balanced Scorecard offers ample benefits if applied effectively.
The Balanced Scorecard is not being applied effectively at Picture
Perfect Photography, as there is poor communication between
management and employees.

90
A lack of employee involvement with regard to giving inputs of the
Balanced Scorecard yearly.
No feedback is given to employees during the year concerning the
outcomes or progress of the individual’s performance on the Balanced
Scorecard.
The utilisation of the Balanced Scorecard is seen as unfair and not
transparent by employees.
In order to continue the benefits of the Balanced Scorecard, there must
be a direct link between the Balanced Scorecard and employee
compensation.
A large number of, respondents indicated that they do not have an
influence on the KPIs listed on their Balanced Scorecard.
More time and effort need to be put in structuring the individuals
Balanced Scorecard to ensure the correct objectives and measures are
in place to drive the overall strategy. The initial implementation takes
hard work, but once it is in place, sustaining it will be easier, improving
employees’ performance and they will feel part of the process.
In general, the majority of the people are negative about the Balanced
Scorecard at Picture Perfect Photography; they see it as meaningless.
This was evident in the empirical study outcomes.
Further to this, the job level comparison showed respondents having a noticeable
difference in opinion, concerning two of the questions, the first one being about
the communication of the Balanced Scorecard, in that it should increase people’s
understanding of the company’s strategy and enhance motivation to achieve
strategic objectives. In the second question, the respondents did not all feel that
the Balanced Scorecard was a simple and transparent process.
91
The Balanced Scorecard process develops a clear direction as to how strategy
should be operationalised
In line with the theory in chapter two and the findings in chapter three, concerning
the job level comparison, respondents had the same response to 38 out of the 40
questions asked in Part B indicating that the employees feel there is a problem.
In the age group analysis, it was found that respondents generally had the same
response to 37 out of the 40 questions asked in Part B.
4.3 RECOMMENDATIONS
The objective of the study was to evaluate the Balanced Scorecard process as
applied at Picture Perfect Photography and make recommendations to improve
the effectiveness of the Balanced Scorecard. Some of the factors contributing
towards the Balanced Scorecard to being applied effectively at Picture Perfect
Photography have been identified are poor communication, poor feedback, no
linkage between the Balanced Scorecard and compensation resulting in poor
employee commitment.
With the key findings it would be recommended that more research needs to be
done to simplify the Balanced Scorecard process used in this company. This
should include training modules for all levels in the company. The training
modules should concentrate on the advantages of the Balanced Scorecard; this
can be accomplished by relating a full outline of the objectives consistent with the
company’s strategy.
To ensure that a smooth performance management process is developed,
management needs to be flexible for adjustments and changes, they need to be
consistent, management needs to be open through regular communication and
92
ensure that goals set are reachable. It is important that the terminology used in
the Balanced Scorecard is kept simple and understandable to everyone.
The linkage between compensation and the Balanced Scorecard should be
explored in order to apply easy to understand systems. The study reflected that
employees are given goals and challenges beyond their reach; these are creating
huge problems in companies. By giving employee goals and challenges more
realistically reachable, it will have significant practical implications not only for the
employees but also for the decision-makers, it will encourage employees to take
the Balanced Scorecard more seriously and be more committed, in turn creating
a more positive working environment. Innovation should be encouraged, as this
gives employees the opportunity for improvement. When linking compensation to
the Balanced Scorecard, management needs to do proper planning. Focus
should be placed on the overall purpose by linking the Balanced Scorecard to
compensation, if the compensation will be part of the salary or an additional
payment in the form of a bonus or percentage annual increase. Management
should involve a variety of people in the development of the compensation
package to ensure that it is fair, and will be seen a motivator.
During the development of the plan, management should decide if the
compensation will be based on individual performance or group performance.
Ensure that the correct compensation plan is chosen to reach the strategic goals.
Once the plan has been drawn-up, management should communicate this plan to
all, and ensure that everyone understands. With this said, it should be made
clear that this compensation plan will be reviewed annually. Continuous
feedback and communication on the updated results of performance need to be
done, to ensure that people know where they stand and what needs to be done
to earn the promised compensation.
93
The study showed that employees have a good understanding of the principles
and the need for a Balanced Scorecard. Managers should take the time to
support the employees to be able to develop their plans, have regular
discussions to work through the difficulties, and provide support.
Ensure that the measures and targets support the objectives and strategy of the
company. These measures should cascade down through the various levels of
the company. The chosen measures should include the short-term and long-
term measures and the financial and non-financial measures. The Balanced
Scorecard should become part of the overall day-to-day operations of the
company. Just keep in mind that if you can’t measure it, you can’t manage it.
Management should always show their support and commitment with regards to
the proper application of the Balanced Scorecard.
4.4 SUMMARY
This chapter covered the conclusions and recommendations made from the
study on the Balanced Scorecard, by referring to the primary and secondary
objectives as set out in chapter 1. It shows that the research done in both
chapter 2, the literature review, and in chapter 3, the empirical study, have
confirmed that the set of objectives were achieved.
This chapter concluded that the Balanced Scorecard process was not used
effective in the company under scrutiny due to poor communication and no
feedback; furthermore, there were no links between the Balanced Scorecard and
employee compensation. The study also showed no real statistical significant
differences between responses from people in different job levels, as well as in
the different age groups.
The recommendations made to encourage further research are done to simplify
the Balanced Scorecard process. It was also recommended that the linkage
94
between the Balanced Scorecard and compensation be explored, and to set
reachable goals, objectives, measures and targets to encourage employees to
become more serious and committed. Aligned commitment, a shared vision and
a clear understanding of how each person’s role supports the overall strategy,
will allow management to reap the benefits.
Employees will benefit from an effective Balanced Scorecard, through a better
understanding of themselves and it will increase their self-esteem. Furthermore,
it will enable them to work smarter and not harder, and it will increase their
personal responsibility.
The managers will benefit, as employee’s commitment will increase, essentially
employees become more motivated, employee innovation will increase, and
through this customer satisfaction will increase.
An effective Balanced Scorecard will create value for the company as well as
bring continuous change and improvements which in turn will give the company
the sustainable competitive advantage needed for the future.
To ensure future growth and sustainable competitive advantage the research
shows a need for management to implement an effectively applied process when
using the Balanced Scorecard as a measurement tool.
95
REFERENCES
Anthony, R. & Govindarajan, V. 2007. Management control systems. (12th ed.).
Boston, MA: McGraw-Hill.
Amaratunga, D., Baldry, D. & Sarshar, M. 2000. Assessment of facilities
management performance – what next? MCB Facilities, 18(½):66-75.
Andersen, H., Lawrie, G. & Savic, N. 2004. Effective quality management
through third-generation Balanced Scorecard. International Journal of
Productivity and Performance Management, 53(7):634-645.
Armstrong, M. & Baron, A. 2005. Managing performance - performance
management in action. London, CIPD.
Bayer, J., Ashmos, D. & Osborn, R. 1997. Contrasts in enacting TQM
mechanistic vs. organic ideology and implementation. Journal of Quality
Management, 2(1):3-39.
Beer, M. & Eisenstat, R. 2000. The silent killer of strategy implementation and
learning. Sloan Management Review, 4(4):29-40, Summer.
Berg, B.L. 2007. Qualitative research methods for social sciences. (6thed.).
Boston, MA: Allyn & Bacon.
Bhatia, R. 2008. Alignment: using Balance Scorecard to create synergies. IIMB
Management Review, 20(1):137-138, March.

96
Bloomquist, P. & Yeager, J. 2008. Using Balance Scorecards to align
organisational strategies. Healthcare Executive, 23(1):24-27, March/April.
Ceelman, J. 1998. Building and implementing a Balanced Scorecard.
Hampshire: Graphic Direct.
Chow, C.W. Haddad, K.M. & Williamson, J.E. 1997. Appling the Balanced
Scorecard to small companies. Management Accounting, 79(79):21-27.
Coetsee, L.D. 2003. Peak performance and productivity: a practical guide for
the creation of a motivating climate. (2nd ed.). Potchefstroom: Ons Drukkers.
Cohen, J. 1988. Statistical power analysis for the behavioural sciences. (2nd
ed.). Hillsdale, NJ: Lawrence Erlbaum Associates.
Collins, H. 2004. Collins dictionary. (2nd ed.). Glasgow: Harper Collins.
Correia, C., Langfield_Smith, K., Thorne, H. & Hilton, R.W. 2008. Management
accounting: Information for managing and creating value. Johannesburg:
McGraw-Hill.
Cummings, T.G. & Worley, C.G. 2005. Organisational development & change.
8th ed. Mason, OH: South-Western.
Davies, R. 2009. Balance Scorecard: success without the pitfalls.
http://www.drrdavies.com/balancedscorecardsuccessproblems.php. Date of
access: 23 Mar. 2012.

97
DeBrusk, G.K. & Crabtree, A.D. 2006. Does the Balance Scorecard improve
performance? Management Accounting Quarterly, 8(1):44-48, Fall.
Ehlers, T. & Lazenby, K. 2007. Strategic management: South African concepts
and cases. Pretoria. Van Schaik.
Ellis, S.M & Steyn, H.S. 2003. Practical significance (effect sizes) versus or in
combination with statistical significance (p-values). Management Dynamics,
12(4):51:53.
Field, A. 2009. Discovering statistics using SPSS. (3rd ed.). London: Sage.
Garrison, R.H., Noreen, E.W. & Brewer, P.C. 2007. Managerial accounting. (11th
ed.). Singapore: McGraw-Hill.
Gering, M. & Rosmarin, K. 2002. The do’s and the don’ts of the Balanced
Scorecard. Accountancy SA, 18-19. Available from:
dspace.nwu.ac.za/bitstream/handle/10394/3971/transd_v4_n2_a7.pdf
Gupta, P. 2005. The Six Sigma Performance Handbook. New York, NY:
McGraw-Hill.
Hoque, Z. 2000. Total quality management and the Balanced Scorecard
approach: a critical analysis of their potential relationships and directions for
research. Critical Perspectives on Accounting, 14:553-566.
98
Kald, M. & Nilsson, F. 2000. Performance measurement at Nordic Companies.
European Management Journal, 18:113-127.
Kanji, G. 1998. Measurement of business excellence. Total Quality
management. 9(7):633-643, October.
Kanji, G. 2003. Performance measurement system. Total Quality Management.
13(5):715-728, August.
Kanji, G. & Sá, P. 2001. Kanji’s business scorecard. Total Quality Management,
12(7):898-905, December.
Kanji, G. & Sá, P. 2002. Kanji’s business scorecard. Total Quality Management,
13(1):13-27, January.
Kaplan, R.S. & Norton, D.P. 1992. The Balance Scorecard – measures that
drive performance. Harvard Business review, 70(1):71-9, Jan-Feb.
Kaplan, R.S. & Norton, D.P. 1993. Putting the Balanced Scorecard to work.
Harvard Business Review, 71(5):134-137.
Kaplan, R.S. & Norton, D.P. 1996a. Using the Balanced Scorecard. Harvard
Business Review, 74(1): 75-85.
Kaplan, R.S. & Norton, D.P. 1996b. The Balanced Scorecard: translating
strategy into action. Boston, MA: Harvard Business School.
99
Kaplan, R.S. & Norton, D.P. 2000. Having trouble with your strategy? Then map
it. Harvard Business Review, 78(5):167-176.
Kaplan, R.S. & Norton, D.P. 2001a. The strategy-focused organisation. how
balanced scorecard companies thrive in the new business environment. Boston,
MA: Harvard Business School.
Kaplan, R.S. & Norton, D.P. 2001b. Transforming the balanced scorecard from
performance measurement to strategic management: Part II. Accounting
Horizons, 15(2):147-160, June.
Kaplan, R.S. & Norton, D.P. 2004. Strategy Maps – Converting intangible
assets into tangible outcomes. Boston, MA: Harvard Business School.
Kaplan, R.S. & Norton, D.P. 2005a. The Balanced Scorecard: measures that
drive performance. Harvard Business Review, 83(7/8):172-180, July/August.
Kaplan, R.S. & Norton, D.P. 2005b. The office of strategy management. Harvard
Business Review, 83(10):72-80, October.
Kaplan, R.S. & Norton, D.P. 2005c. Putting the Balanced Scorecard to work.
Harvard Business Review. Available from:
www.puttingtheBalancedscorecardtowork-HBR_org.htm. Date access: 5 Apr.
2012.
Kaplan, R.S. & Norton, D.P. 2006. Building a strategy-focused organisation.
Ivey Business Journal, 65(5):12-20, May/June.

100
Kaplan, R.S. & Norton, D.P. 2007. Using the Balanced Scorecard as a strategic
management system. Harvard Business Review, July-August: 150-161.
Kaplan, R.S. & Norton, D.P. 2008. Mastering the management system. Harvard
Business Review, 86(1):62-77 & 136, January.
Kennerley, M. & Neely, A. 2002. A framework of the factors affecting the
evolution of performance measurement systems. International Journal of
Operations and Production Management, 22(11):1222-1245.
Lawler, E.E. 2003. Reward practices and performance management system
effectiveness. Organisational Dynamics, 32(4):396-404.
Leer, J. 2008. Financial Management versus management accounting.
www.helium.com Date of access: 29 Dec. 2011.
Levine, D.M, Stephan, D.F., Krehbiel, T.C. & Vereson, M.L. 2008. Statistics for
managers using Microsoft Excel. Upper Saddle River, NJ: Pearson Prentice Hall.
Malina, M. & Selto, F. 2001. Communicating and controlling strategy: an
empirical study of the effectiveness of the balanced scorecard. Management
Accounting Research, 13:47-90.
Manoochehri, G. 1999. Overcoming obstacles to developing effective
performance measures. Work Study, 48(6):223-229.

101
McCann, M. 2000. Turning vision into reality. Journal of Management
Accounting, 78(1):36-37.
Mooraj, S., Oyon, D. & Hostettler, D. 1999. The Balanced Scorecard: a
necessary good or an unnecessary evil? European Management Journal,
17(5):481-491.
Newing, R. 1995. Wake up to the Balanced Scorecard. Management
Accounting, 73(3):22-23.
Niven, P.R. 2002. Balanced Scorecard step-by-step: maximizing performance
and maintaining results. New York, NY: Wiley.
Niven, P.R. 2005. Balanced Scorecard diagnostics: maintaining maximum
performance. New York, NY: Wiley
Niven, P.R. 2008. Balanced Scorecard step-by-step for government and non-
profit agencies. Upper Saddle River, NJ: Wiley.
Norreklit, H. 2000. The balance on the Balanced Scorecard – a critical analysis
of some of its assumptions. Management Accounting Research, 11(1):65-88,
March.
Olve, N., Petri, C. & Roy, J. & Roy, S. 2003. Making scorecards actionable.
London: Wiley.
102
Olve, N., Petri, C. & Roy, J. & Roy, S. 2004. Twelve years later: Understanding
and realising the value of balanced scorecards. Ivey Business Journal, 65(5):1-7,
May/June.
Olve, N., Roy, J. & Wetter, M. 1999. Performance drivers: A practical guide to
using the Balanced Scorecard. London: Wiley.
Papalexandris, A., Ioannou, G. & Prastacos, G. 2004. Implementing the
balanced scorecard in Greece: a software firm’s experience. Long Range
Planning, 37(4):351-366, August.
Papalexandris, A., Ioannou, G., Prastacos, G. & Soderquist, K. 2005. An
integrated methodology for putting the Balanced Scorecard into action. European
Management Journal, 23(2):214-227, April.
Pearce, J.A. & Robinson, R.B. 2005. Formulation, implementation and control of
competitive strategy. (11th ed.). Homewood, III: Irwin.
Pettigrew, A. & Whipp, R. 1991. Managing change for competitive success.
Cambridge: Blackwell.
Pforsich, H. 2005. Does your scorecard need a workshop? Strategic Finance,
86(8):31-35, February.
Pineno, C. & Cristine, C. 2003. The Balanced Scorecard: a vision report card.
Management Accounting Quarterly. 4(4):28-40, Summer

103
Primus. 2002. Six Sigma: The pursuit of perfection. White Paper. Washington,
DC: Primus.
Radnor, Z. & Lovell, B. 2003. Success factors for implementation of the
Balanced Scorecard in a NHS multi-agency setting. International Journal of
Health Care Quality Assurance, 16(2):99-108.
Rampersad, H.K. 2006. Personal balanced scorecards. London: Knowres.
Ravid, R. 2011. Practical statistics for educators. (4th ed.). Plymouth: Rowman
and Littlefield.
Rodriguez, A.B. 2008. A framework for align strategy, improvement
performance and customer satisfaction using an integration of Six Sigma and
Balanced Scorecard. (PhD Thesis). College of Engineering and Computer
Science, University of Central Florida, Jacksonville, Fl.
Schneiderman, A.M. 1999. Why Balanced Scorecards Fail. Journal of strategic
Management Performance, 1-11, Jan
Sioncke, G. 2005. Implementation of a Balanced Scorecard in a care home for
the elderly: Useful or not? Total Quality Management, 16(8/9): 1023-1029,
October/November.
Smit, B.J. & DE J Cronje, G.I. 2011. Management principles a contemporary
edition for Africa. (5th ed.). Cape Town: Juta.
104
Speckbacher, G., Bischof, J. & Pfeiffer, E. 2003. A descriptive analysis on the
implementation of Balance Scorecards in German-speaking countries.
Management Accounting Research, 14(3):361-387, December.
Spitzer, D.R. 2007. Transforming performance management: rethinking the way
we measure and drive company success. New York, NY: Amacom.
Steyn, H.S. (Jr.). 2000. Practical significance of the difference in means. Journal
of Industrial Psychology, 26(3):1-3.
Steyn, T.F.J. 2007. Introduction to Business Management. Potchefstroom:
North-West University.
Thompson, A. & Strickland, A. 2003. Strategic management: Concepts and
cases. Boston, MA: McGraw-Hill.
Towle, G. 2000. The Balanced Scorecard: Not Just Another Fad. Executive
Journal, 40(1):12-15.
Venkatraman, G. & Gering, M. 2004. Twelve years later: Understanding and
realising the value of Balanced Scorecard. Ivey Business Journal, 68(5):1-7.
Venter, L. 2004. The Balance Scorecard: a strategic tool. The Dairy Mail,
11(7):42-45, July.

ANNNEXUREE A – QUUESTIONNAIRE
105
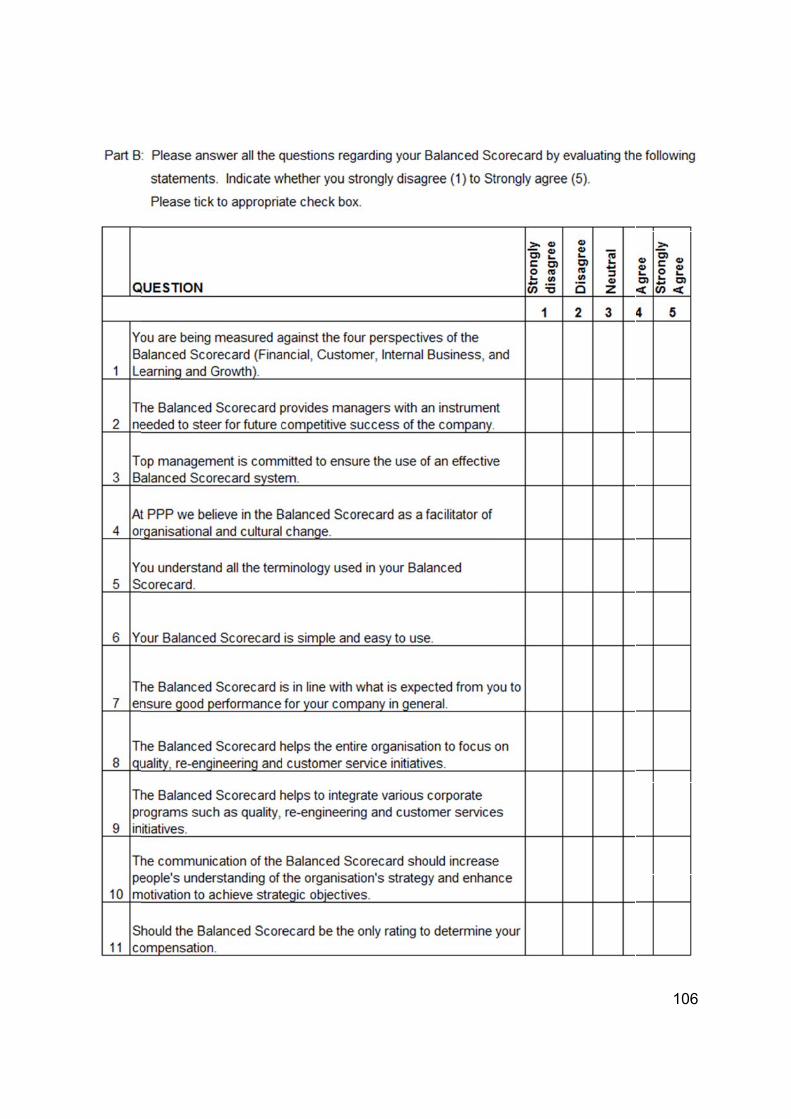
106
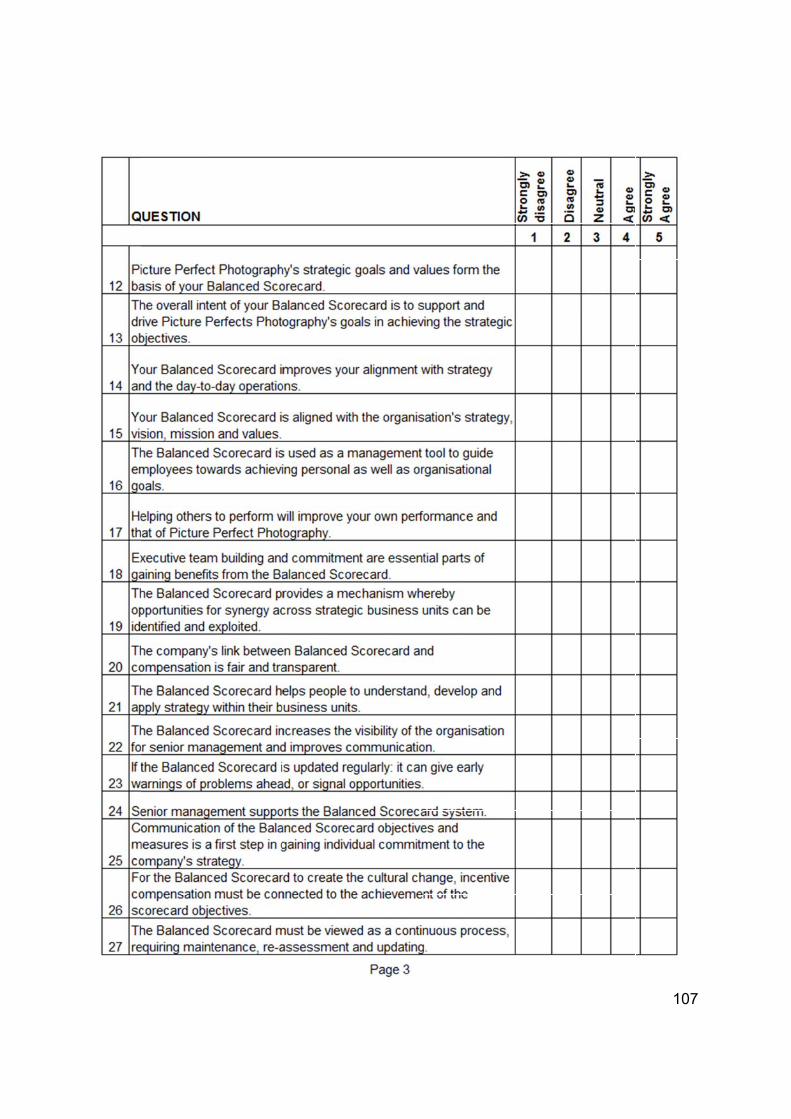
107

108
To whom it may concern
Re: Letter of confirmation of language editing
The MBA dissertation “Assessment of the Balanced Scorecard approach at a
photographic company” by Natasha Woodall (22504923) was language,
technically and typographically edited. The sources and referencing technique
applied was checked to comply with the specific Harvard technique as per North-
West University prescriptions. Final editing and printing remains the
responsibility of the student.
Antoinette Bisschoff
BA (Languages); MBA SA Translators' Institute (SATI)/SA Vertalersinstituut (SAVI) Membership: 1001891
Officially approved language editor of the NWU
Esselen str 71
Potchefstroom
2531
Tel: (018) 293-3046
CK 95.17794\73
15 November 2012